Submitted:
09 September 2025
Posted:
09 September 2025
You are already at the latest version
Abstract
Three TOP TIERTM gasoline detergent control additives of differing chemistries were tested for their impact on particulate matter emissions in terms of particulate mass (PM) and particulate number (PN) at operating conditions representative of road load, cold start and high load on a 2.0L, 4-cylinder gasoline direct injection (GDI) spark ignition (SI) engine. The PM-PN emissions were measured using an Exhaust Emissions Particle Sizer (EEPS).
Detergent control additives (DCAs) are gasoline additives used to prevent and clean combustion chamber and injector deposits in gasoline spark ignition (SI) engines. All three gasoline additives were tested at each operating condition at three different treatment rates. In addition, one of the additives was tested with a friction modifier (FM).
The results showed that of the treatment rates tested, the lowest allowable concentration (LAC) for all additives requires the least time for the emissions to settle. However, the impact of the gasoline additives on PM-PN emissions is not linear and changes with additive concentration depending on the additive chemistry and operating condition. The friction modifier resulted in a significant impact on both particulate mass and particulate number at the road load operating condition.
Keywords:
gasoline direct injection
; detergent control additives
; particulate matter
; particle number
; friction modifiers
; engine out emissions
1. Introduction
The exhaust emissions from internal combustion (IC) engines are regulated globally for pollutants for their adverse impact on health and the environment. Particulate matter emissions from an IC engine are linked to respiratory health and diseases related to the lungs [1,2]. With the shift in the majority of spark ignition (SI) engines from port fuel injection (PFI) to gasoline direct injection (GDI), particulate matter emissions have been a topic of focus for SI engines [3]. While GDI engines offer fuel conversion efficiency and power benefits over PFI engines [4], the particulate matter emissions from GDI engines are significantly higher than their PFI counterparts [5,6]. The higher particulate matter emission numbers in GDI engines occur primarily due to the impingement of the injected fuel on the piston and cylinder walls.
The majority of countries follow either the United States or European Union emission regulations for PM-PN emissions. The current US emissions standards only regulate particulate mass, while the EU emission standards include a limit for particulate mass and particle number [7]. There is a reasonably strong correlation between PM-PN values, with previous studies reporting numbers between 2x10¹² − 2.5x10¹² particles/mg [8,9,10,11]. The current EPA Tier 3 and Euro 6d standards are shown in Table 1.
The Euro 6d standards measure solid particles with diameters down to D50 (50% counting efficiency) of 23 nm. However, studies have shown that modern engine technologies generate particles diameters smaller than 23 nm [3,12,13,14], which can increase the PN value. The upcoming Euro 7 standards will lower the detection threshold to a D50 of 10 nm, thereby capturing a broader range of ultrafine particles in emissions evaluations.
Particular matter emissions from an SI engine are not only a function of the engine speed and load, but also of fuel composition and combustion chamber deposits (CCDs) [15,16]. Deposit control additives (DCAs) or detergents are gasoline additives that reduce buildup of combustion chamber deposits [16,17]. In gasoline direct injection (GDI) engines, DCAs also help prevent the formation of deposits on injector nozzles [18], which is critical for maintaining the proper spray pattern [3], fuel atomization and combustion efficiency.
While DCAs mitigate PM-PN emissions, there is an optimum concentration for each additive beyond which the benefits start to diminish. Munroe et al. [16] conducted tests with three TOP TIERTM (TT) additives and showed that depending on the DCA chemistry, the particulate mass emissions (in mg/km) are the lowest with either the lowest allowable concentration (LAC) or 1xTT concentration, and are the highest at 5xTT concentration. Chapman et al. [19] analyzed the impact of DCAs on stochastic preignition (SPI) in a turbocharged SI engine and concluded that irrespective of additive chemistry, the SPI rate increases significantly for additive concentration of 5xTT.
This research study looks at the impact of three TOP TIERTM additives1 on PM-PN emissions in a 2.0L, 4-cylinder, turbocharged GDI engine. One of the additives was also tested in combination with a friction modifier (FM) to evaluate its impact on the PM-PN emissions. The TSI Engine Exhaust Particle Sizer (EEPS) was used for emissions measurement. The EEPS system detects particles down to a diameter of 6.04 nm. Each additive was evaluated at three different concentrations—LAC, 1xTT and 3xTT—across three distinct speed-load conditions. A 5xTT concentration was excluded from the test matrix because it is not representative of real-world usage and has been shown to significantly increase SPI [19]. The PM-PN data for all additives was compared to baseline results with unadditized gasoline to determine how the DCAs impact the particle number and particulate mass at each operating condition. The tests were devised to determine on how long it took the emissions to settle at the road load condition. Additionally, the observed PM-to-PN ratios were compared to values reported in prior studies.
2. Goals and Motivation
The motivation for this project was to understand the impact of DCA concentrations on particulate mass and particulate number emissions in the face of increasingly stringent global emission regulations. The study also aimed at exploring whether fuel based friction modifiers (FMs)—which are known to reduce friction and engine wear [20,21]—can have an impact on the PM-PN emissions while measuring particles down to a size of 6.04 nm.
Project Goals:
- Develop testing procedures ensuring stability and repeatability of PM-PN emissions using the TSI EEPS system.
- Evaluate the time required for emissions to stabilize at road load.
- Determine the impact of deposit control additives and concentrations on PM-PN emissions.
- Determine the effect fuel based friction modifiers have on PM-PN emissions.
- Calculate the PN-to-PM ratio at multiple operating conditions with the inclusion of ultrafine particles (particle diameter less than 23 nm).
3. Experimental Setup
3.1. Test Engine
A 2.0L, 4-cylinder General Motors LTG engine was used for this study. The GM LTG is turbocharged engine with gasoline direct injection (GDI), representative of the modern day SI engines commonly found in mid-sized vehicles. The instrumented engine in the test cell is shown in Figure 1, and the engine specifications are shown in Table 2.
3.2. Instrumentation and Controls
The testing for this project was conducted at Michigan Technological University’s (MTU) Advanced Power Systems Research Center (APSRC). The light duty test cell at the APSRC is equipped with an 8000 RPM-810 Nm General Electric AC dynamometer, which is shown in Figure 1. The brake mean effective pressure (BMEP) was measured using an inline torque meter. The engine was operated at stoichiometric conditions (λ=1). Lambda (λ) measurement was made using a Bosch LSU4.9 wide range O2 sensor.
A MoTeC Electronic Control Unit (ECU) and software were used to control engine boundary conditions. Low speed data was monitored and recorded using National Instruments (NI) Veristand and combustion data was monitored using A&D Phoenix.
3.3. Exhaust Particle Emissions Analyzer (EEPS)
The Engine Exhaust Particle Sizer (EEPS) was used to measure particulate mass and particle number for this project. The EEPS schematic is shown in Figure 2. The EEPS analyzes the size and number of particles in engine exhaust in real time. The exhaust sample is first diluted in two stages, with the first stage occurring at approximately 190°C to prevent condensation and thermophoretic losses. After conditioning, the aerosol is passed through a charging region, where particles are given a charge proportional to their size using a unipolar corona charger.
Charged particles enter an annular sizing chamber with a high-voltage central electrode. Under an electrostatic field, particles migrate toward the outer wall and contact segmented electrometers based on their size and charge. Smaller particles are deflected and deposited earlier, while larger particles travel further. Each contact produces a signal, from which particle number and size are derived.
Mass estimation requires assumptions about particle density, which can vary due to morphology. Final particle metrics are computed by adjusting for the known dilution ratio (DR).
Figure 3 shows the schematic for the EEPS dilution system. The dilution system was developed according to the SAE J3160 standard [22]. Inconsistencies or deviations in the dilutions system can significantly impact the PM-PN emissions measurement. The prominent issues include:
- Coagulation
- Thermophoretic losses
- Nucleation
- Impaction losses
- Diffusion losses
- Sample line condensation
All issues mentioned above lead to either an overestimation or underestimation of PM-PN emissions measurement. Additional details on EEPS sense checks and how improvements in the EEPS dilutions system rectified the PM-PN measurements by eliminating nucleation and impaction losses are provided in the Appendix.
4. Methodology
4.1. Operating Conditions
Three operating conditions were run as a part of the study for the baseline as well as each additive tested. The speed-load conditions selected were indicative of Road Load, Cold Start and High Load conditions for a 2-liter turbocharged gasoline SI engine.
- Road Load: 2200 RPM-4.75 bar BMEP
- Cold Start: 1400 RPM-2.25 bar BMEP
- High Load: 3000 RPM-16 bar BMEP
Additional details regarding all three operating conditions are shown in Table 3.
All parameters except spark timing shown in Table 3 for each operating condition were as per the base calibration of the engine. A split injection strategy was deployed for the cold start condition, where 60% of the fuel was injected in the first injection event and 40% in the second injection event. The spark timing for the cold start was retarded until COV of IMEP was between 8-10%.
4.2. Test Procedure
A procedure was developed to ensure uniformity in testing all additives for PM-PN emissions. The test procedure, which spanned over three days for each test run, can be divided into two parts, the first of which is shown in Figure 4 and the second in Figure 5.
Figure 4 details the first day of testing with a new additive. The combustion chamber was cleaned of any deposits by running port water injection on unadditized Tier 3 premium certification fuel with a 0.4 water-fuel ratio. This was followed by borescope images of the pistons and cleaning of the injectors using an ultrasonic cleaner to eliminate any deposit remnants from the previous test. Two oil changes along with a filter change were done to prevent cross-test contamination. The piston cleaning and fuel flushing points were run at 3000 RPM-10 bar BMEP. A reference point was run at the road load condition to check the repeatability of the EEPS before switching to the additized fuel.
The engine was run at the road load condition until the PM-PN emissions ‘settled’. Details regarding the settling time criteria have been included in the next section. Once the emissions were settled, each test condition was run for two hours. PM-PN data was collected continuously over the settling time and test points, and was discretized in 15-minute blocks. For example, if data was collected for 120 minutes, it was converted to eight data sets averaged over 15-minute intervals. The first test day was run with the LAC treat rate for the additive in question.
The test procedure for the second and third test days, which involved running the additive at the 1xTT and 3xTT concentration respectively, is shown in Figure 5. The major difference in this procedure is that it does not involve the piston cleaning and fuel flushing phase. Every subsequent test day involved running at a higher treat rate of the same additive for which cleaning using water injection and oil changes were not required as there was chance of additive cross contamination. The remainder of the procedure for running 1xTT and 3xTT was the same as running LAC.
4.3. Settling Period
At the start of each test day, the engine was operated at road load conditions until particulate mass (PM) and particle number (PN) emissions stabilized — a phase referred to as the ‘settling period’. Since the combustion chamber was cleaned using water injection and the injectors were ultrasonically cleaned prior to each additive test, the system began with minimal combustion chamber deposits (CCDs). This led to significant variability in initial emissions when introducing a new additive or a higher additive treat rate concentration.
The purpose of the settling period was to allow CCDs to re-establish and for PM-PN emissions to reach a steady-state representative of real-world deposit accumulation. Data was recorded continuously during this phase and averaged over 15-minute intervals.
To define when emissions were considered ‘settled’, a threshold of ±10% variation was applied. Specifically, the PM and PN values in the most recent 15-minute interval had to remain within 10% of the values from each of the preceding six 15-minute intervals (i.e., 90 minutes of stable emissions). This approach is illustrated in Figure 6, which plots the percent difference in the final data point against earlier intervals. When this variation stayed within the 10% range for both PM and PN metrics, the emissions were deemed stable and steady-state conditions were confirmed. Additional details regarding the settling period are provided in the Appendix.
The threshold for the settling period was 6 hours. In the case of a particular test, if the additive did not meet the settling criteria within 6 hours, the engine running was transitioned to the cold start operating condition without the settling criteria being met. This approach was adopted to maintain uniformity in the testing by completing each test on the same day. Additionally, it was recognized that for certain additive concentrations, PM-PN emissions may not settle at all. This could be due to fuel-additive interactions, which can lead to an ongoing cycle of deposit buildup and cleanup. Figure 7 shows the variation in particle number and Figure 8 in particulate mass emissions for an Additive 2 for the LAC treat rate. The settling time for this test was 195 minutes. Each data point represents the time at which the data block stopped recording. For example, the data point at 15 minutes represents the average data from 0 to 15 minutes.
For all tests, the rate of change of average particulate mass (dPM/dt) and of average particulate number (dPN/dt) emissions was observed to be the highest at the start of the test, as Figure 7 and Figure 8 indicate. The rates decreased as the test proceeded, indicating a transition towards steady state behavior.
4.4. Test Fluids
Environmental Protection Agency (EPA) Certification Tier III Premium fuel (unadditized) was used as the base fuel for the project. The Tier III fuel is a fuel with a relatively high particulate matter index (PMI), which promotes deposit buildup, and was chosen for this project as a high PMI fuel was expected to better distinguish the effect of DACs.
The piston cleaning, fuel flush points and baseline tests were run using unadditized EPA Certification Tier III fuel. The additized tests were run with the Tier III fuel mixed with the DCAs at the appropriate concentration. The additives were measured on a precision weighing scale with a resolution of 0.1 grams and mixed with the fuel using a pump for 30 minutes to ensure thorough mixing. For the smallest amount of additive measured (Additive 3 at LAC concentration), the accuracy of the mixture for a measurement error of 0.1 g is over 99%.
Dexos1GEN3 oil (reference # 23-22981 RN006850AAC) was used for all tests for this study.
All fuel and oil used for the project were from the same batch, to ensure that batch-to-batch variation did not impact results.
4.5. Test Matrix
The test matrix for the project is shown in Figure 9. A baseline was run with the unadditized fuel at the start and end of the test matrix. Each additive was run with three different concentrations in the same order-
- LAC
- 1xTT
- 3xTT
A reference check at the road load operating condition was done using the cleaning fuel before the start of a new additive to ensure that the EEPS output was consistent.
4.6. Density Correction for Particulate mass Calculation
The EEPS estimates the particulate mass based on the particle number, as previously mentioned. The lower diameter particles have the same density as carbon. When these small spherical particles aggregate together, the resulting shape is not necessarily a sphere, as shown in Figure 10. Park et al. [23] demonstrated this by examining particulate matter through a transmission electron microscope. The EEPS, however, assigns the particle diameter based on the mobility diameter. This leads to an overestimation of the mass contribution of higher diameter particles and an underestimation of the mass contribution of lower diameter particles.
Considerable research hours have been invested in rectifying the particulate mass contribution of diameters by comparing the EEPS particulate mass output to the reference gravimetric method used in the Federal Test Procedure (FTP) [24,25,26]. This study used an effective density vector based on the fit equation provided by Xue et al. [26] for GDI engines to fit data from Maricq and Xu [24].
5. Results
5.1. EEPS Reference Checks
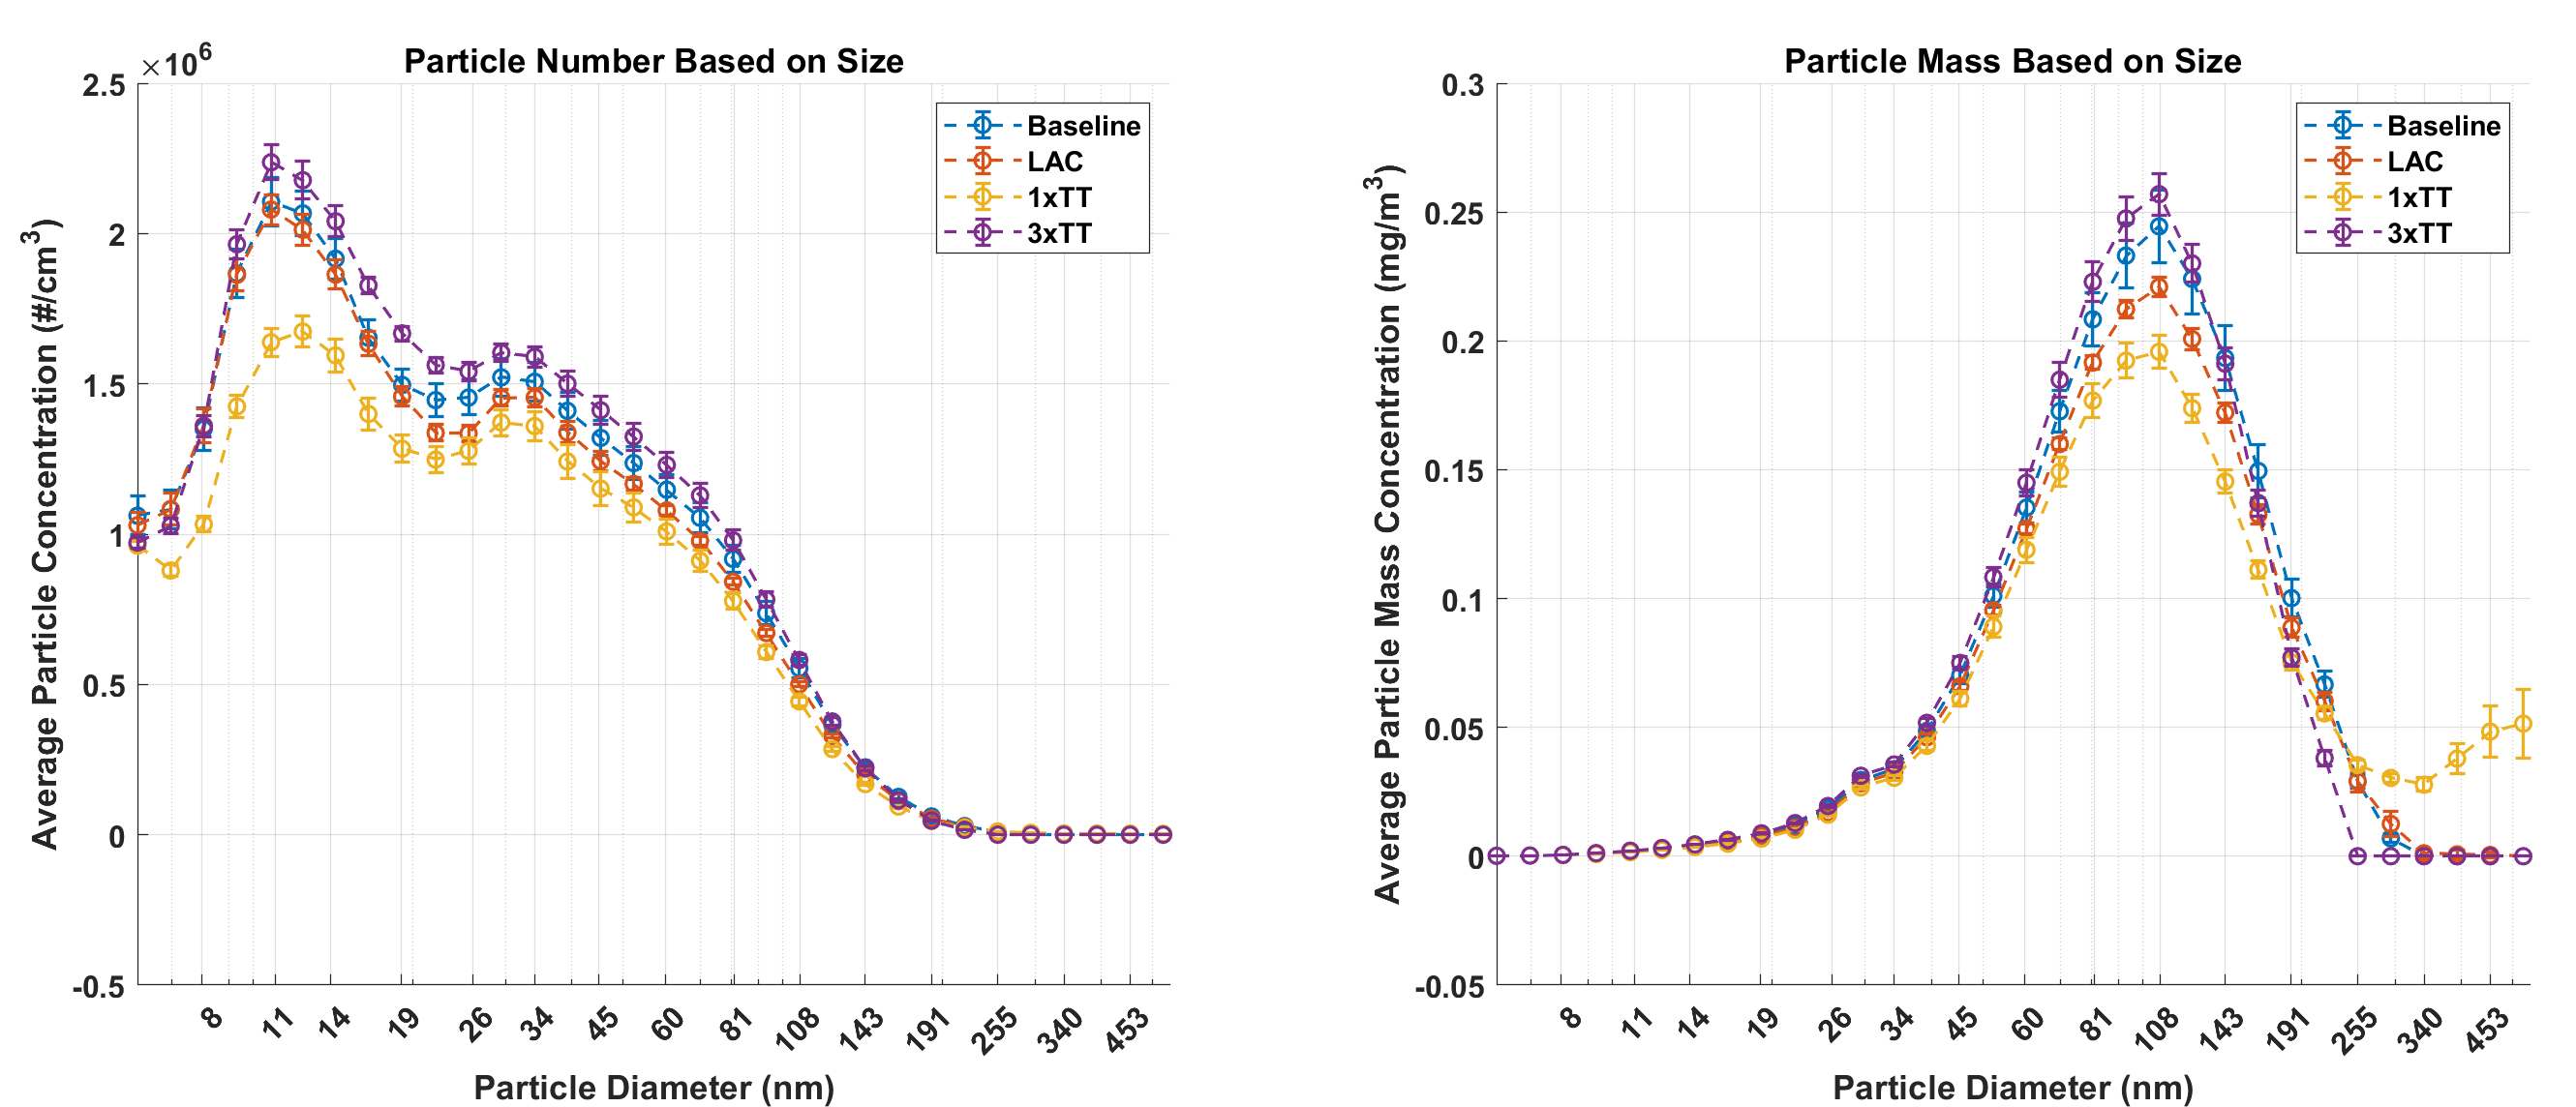
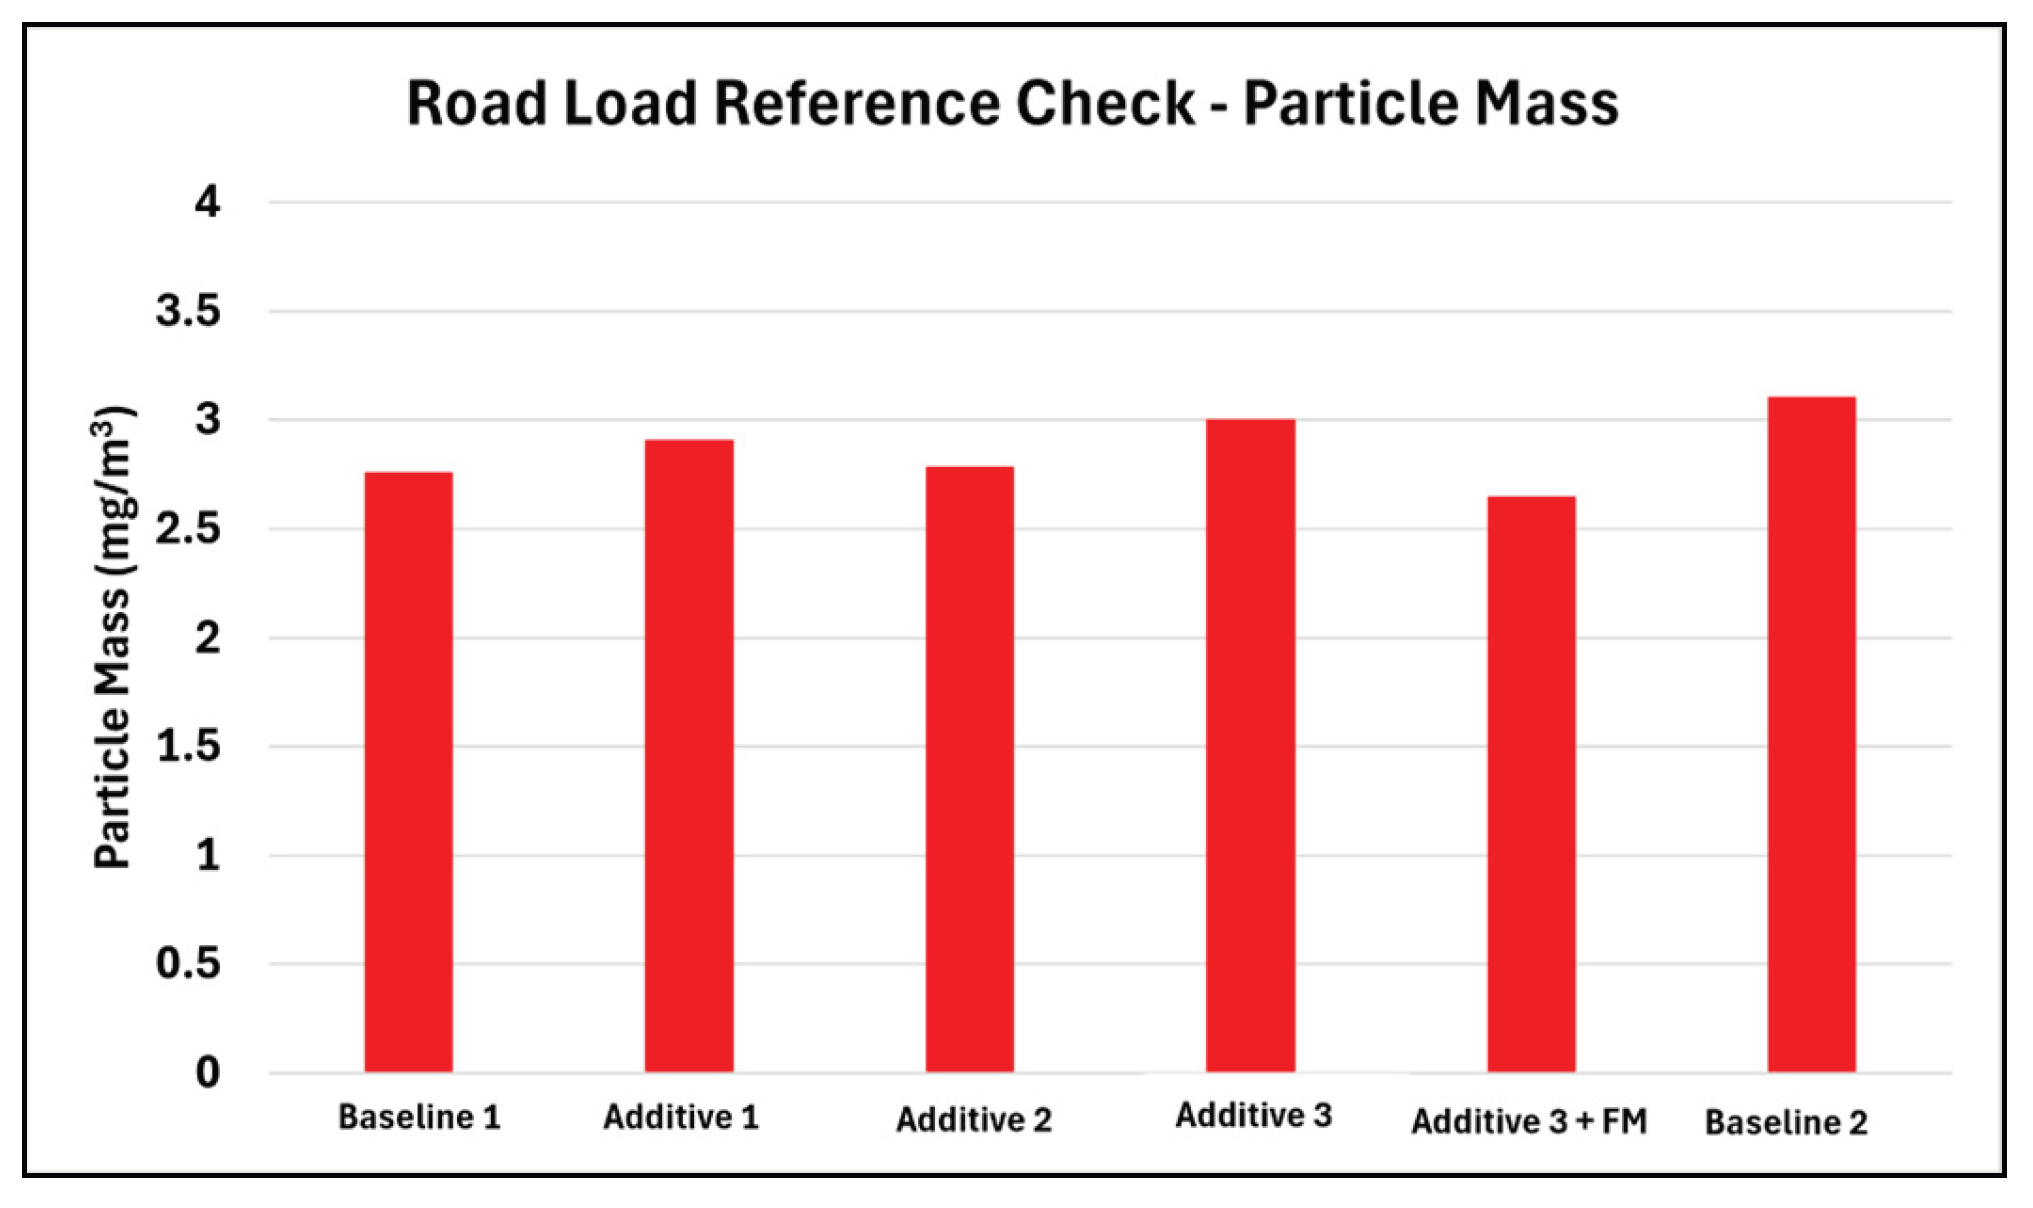
The EEPS was checked for repeatability by running the road load condition for 5 minutes using unadditized fuel before the start of every baseline or additized run. This was done after the piston cleaning with water injection, which ensured the uniformity of conditions during the reference checks. The total PM-PN emissions for the EEPS reference checks are shown in Figure 11. The same data as a function of diameter is shown in Figure 12.
The data from the EEPS reference checks shows good repeatability for PM-PN emissions. The coefficient of variation (COV) of PN measurements was 5.7% while the COV of PM measurements was slightly higher at 11.5% due to the high particulate mass value before Additive 2 testing. Figure 12 sheds light on the reason for high particulate mass value, which is an increase in higher diameter particles.
The authors believe this is possibly due to the accumulation of large diameter particles at the exhaust location for the EEPS sampling line. During the piston cleaning procedure using water injection, the sampling line was closed to prevent water entering the EEPS system. When the line was opened after the piston cleaning and subsequent oil flush, the accumulated high diameter particles entered the EEPS, increasing the PM count.
Notably, the particle number was not significantly affected, as the number of particles was not large enough to register prominently in the PN plot. However, the increased particle diameter significantly influenced the PM measurement.
To eliminate the effect of infrequent high mass particles, a positively skewed non-negative Weibull distribution was used to predict the mass of particles over a particle diameter of 191.1 nm for all six data sets. This brought the COV of PM measurements down to 5.9%, which is very close to the COV of PN measurements. Additional details have been included in the Appendix.
5.2. Settling Time
As mentioned in the ‘Methodology’ section, each test day started with a settling period until the PM-PN emissions reached steady state according to the PM-PN criteria. Figure 13 shows the settling times for all tests. The baseline is the average of the two baselines. The threshold for settling was 6 hours, so any test with a 360 minute or 6 hour settling time did not reach steady state at the road load operating condition.
The results show a trend of settling with additive concentration. For all four additives, the LAC treat rate had the lowest settling time. For Additive 1 and Additive 2, the settling time increased with increasing additive concentration. The PM-PN emissions did not ‘settle’ or reach steady state for 1xTT and 3xTT treat rates for the (Additive 3 + Friction Modifier) combination as well as for Additive 1 for a 3xTT treat rate.
It should be noted that a lower settling time does not necessarily translate to lower PM-PN emissions. A test that reached steady state earlier could have higher PM-PN emissions than a test that took more time to settle, as will be evident in the next section.
5.3. PM-PN Emissions
Data was collected throughout the duration of testing, and averaged over 15-minute intervals. For the results shown in this section, the PM-PN numbers for road load are shown as average of 90 minutes (1.5 hours) of running, while the numbers for cold start and high load are for the first 15 minutes of running after the engine reached thermal equilibrium (stable intake air temperature, coolant temperature and oil temperature), which is explained through Figure 14. This was to reflect real world scenarios, where vehicles run at the road load condition for long periods, while cold start and high load conditions are run only for short periods.
6. Road Load Condition
The variation in particle number and particulate mass as a function of additive type and additive concentration is shown in Figure 15. The two baselines are shown at the beginning followed by each additive going from the lowest (LAC) to the highest (3xTT) treat rate. All values reflect the average emissions over a 90-minute period, measured after PM-PN emissions stabilized and the engine reached steady-state conditions.
The results indicate that all three deposit control additives (excluding the friction modifier) reduced the particulate mass (PM) as compared to the baseline. Except for Additive 1 at the 3xTT concentration, the particle number (PN) for the DCA runs were also lower than the baseline. The interesting thing to note is that the reduction is not linear, and each of the three DCAs have an optimum treatment rate at which the PM-PN emissions were minimized.
- Additive 2 showed the highest PM-PN emissions at the 1xTT treat rate.
- Conversely, Additive 1 and Additive 3 showed the lowest emissions at the 1xTT treat rate.
These results are in agreement with Monroe et al. [16], who showed that optimum treat is dependent on additive chemistry. The underlying mechanisms for the impact of specific additive chemistries was beyond the scope of this study.
The major takeaway from these results is the pronounced impact of the friction modifier on PM-PN emissions. For all three concentrations of Additive 3 plus the FM, the PM-PN emissions were significantly higher than those of the baseline runs and of Additive 3 without the FM. As illustrated in Figure 13, this was the only additive combination for which emissions did not settle within the 6-hour limit at the 1xTT concentration, indicating prolonged emission instability. Comparing the PM-PN numbers for Additive 3 alone with the Additive 3 plus FM combination, the friction modifier appears to be the factor that spikes the PM-PN emissions.
To ensure the spike in emissions were not erroneous and there was no issue with the EEPS output, the LAC test for the Additive 3 plus FM was run twice. After the first run, when the numbers appeared much higher than the rest of the additives, the EEPS was serviced to eliminate the possibility of an instrument related error. The repeat test resulted in similarly high numbers, reinforcing the initial findings. This step combined with the EEPS reference checks before each test and the lower Baseline 2 results at the end of the test matrix bolstered the observations from the Additive 3 plus FM run.
7. Cold Start Condition
The cold start emission numbers are the average of the first 15-minute block after the engine reached thermal stability. Based on empirical data, the time required to reach thermal stability for the cold start and the high load conditions was typically 30 minutes. So the data shown for the cold start and high load conditions is the average from 30 minutes to 45 minutes after transitioning from the road load to the cold start operating condition.
The cold start emissions as a function of additive type and additive concentration are shown in Figure 16. The differences between the baseline runs and the DCA runs are not stark, even for the Additive 3 plus FM combination.
Compared to the average of the baseline tests, most DCA tests show a slight reduction in the PM-PN emissions. Figure 17 better illustrates this point with the baseline runs combined and represented by their average and standard deviation. The particulate mass (PM) for the baseline runs does not include standard deviation lines as the difference between the two values was within one percent. Unexpectedly, the lowest PM-PN emissions are shown by the Additive 3 plus FM at the LAC treat rate.
8. High Load Condition
The PM-PN emissions for all additive types and additive concentrations are shown in Figure 18. The high load emissions show no particular trend. The common theme is that the 3xTT treat rate reduces the PM-PN emissions as compared to the baseline runs irrespective of additive chemistry. All treat rates with the friction modifier increase PM-PN emissions with respect to the baseline.
9. Particle Number—Particulate Mass Ratio
As stated in the introduction, a multitude of studies have reported correlations between particle number and particulate mass. The numbers are in the range of 2-3.8 x 10¹² particles/mg. The numbers observed in this study are shown in Table 12 as an average of the Baseline 1 and Baseline 2. The PN to PM ratio is 4 to 5 times higher at all speed load conditions as compared to what has been reported in previous studies. While Table 4 only shows the average ratio for the two baseline runs, the numbers did not change substantially for the additized tests.
The high PN/PM ratio observed in this study could be attributed to the inclusion of ultrafine particles (<23 nm), made possible by the use of an EEPS without a volatile particle remover (VPR), as used by Yamada et al. [11]. Table 5 shows the PN/PM ratio with particles lower than 23 nm excluded in the calculation. With the exclusion of ultrafine particles, the PN/PM ratio is closer to what has been reported in previous studies, although it is still 2 to 3 times higher.
Particles with diameters less than 23 nm are excluded from regulated PN measurements for emissions standards like the Euro 6d, based on the Particle Measurement Program (PMP) protocols that include a VPR to remove semi-volatile particles [22]. These particles contribute significantly to real-world particle number and could have a relevance when it comes to respiratory health. The PN-PM correlations will possibly change once new standards are implemented that count particles down to 10 nm. Additional work is required to determine the impact of a VPR on the PN/PM ratio.
10. Conclusions
A 2.0L, 4-cylinder GDI SI engine was run at road load, cold start and high load conditions to determine the impact of detergent (fuel additive) type and concentration on the PM-PN emissions. The following conclusions can be drawn based on the results:
- EEPS repeatability: The Exhaust Emissions Particle Analyzer (EEPS) showed good repeatability throughout the duration of the project with a COV of less than 6% for the PM-PN emissions.
- Settling time: The majority of tests achieved emissions stabilization within 6 hours of running at road load. The settling time increased with additive concentration. The additive with the friction modifier was the only one for which the PM-PN emissions did not settle for a 1xTT treat rate.
- Road Load: At the road load condition, the three deposit control additives (DCAs) without friction modifiers reduced particulate mass (PM) and particle number (PN) emissions compared to the baseline, but the effect varied nonlinearly with concentration and additive chemistry. The inclusion of the friction modifier caused a substantial increase in the PM-PN emissions for all treat rates.
- Cold Start: The majority of additive and treat rate combinations displayed a reduction in PM-PN emissions.
- High Load: No specific trend was observed at the high load condition. For all additives without the FM, the 3xTT treatment rate had lower emissions as compared to the baseline.
- PN-to-PM ratios: The measured PN-to-PM ratios were 4–5 times higher than previous literature values (approximately 2.5×10¹² #/mg), primarily due to the inclusion of particles below 23 nm in the EEPS measurements without a volatile particle remover (VPR). The discrepancy is reduced with the exclusion of ultrafine particles in the PN value, although the PN/PM ratios observed in this study are still 2–3 times higher.
Abbreviations and Definitions
| APSRC | Advanced Power Systems Research Center |
| BMEP | Brake Mean Effective Pressure |
| bTDC | Before Top Dead Center |
| CCD | Combustion Chamber Deposit |
| COV | Coefficient of Variation |
| DCA | Deposit Control Additive |
| DOHC | Dual Overhead Camshaft |
| ECL | Exhaust Cam Centerline |
| ECU | Electronic Control Unit |
| EEPS | Exhaust Emissions Particle Analyzer |
| EOI | End of Injection |
| EPA | Environmental Protection Agency |
| FATG | Fuel Additives Task Group |
| FM | Friction Modifier |
| FTP | Federal Test Procedure |
| GM | General Motors |
| GDI | Gasoline Direct Injection |
| ICL | Intake Cam Centerline |
| LAC | Least Allowable Concentration |
| LP | Locked Piston |
| MBT | Maximum Brake Torque |
| MTU | Michigan Technological University |
| NI | National Instruments |
| PM | Particulate mass |
| PMP | Particle Measurement Program |
| PN | Particle Number |
| SI | Spark Ignition |
| SOI | Start of Injection |
| TT | TOP TIERTM |
| VPR | Volatile Particle Remover |
Appendix A
The plots shown in the next two sections show the impact of SOI and dilution system updates on PM-PN emissions at 2200 RPM-4.55 bar BMEP.
EEPS Sense Checks
Before beginning the tests shown in the test matrix, sense checks were conducted on the EEPS to ensure that the output trended as expected. The sense checks make for some interesting plots, one of which is shown in Figure 18. The first sense check observed the impact of injection timing on PM-PN emissions by advancing SOI from 290°bTDC to 310°bTDC in increments of 5°CA for the same pulse width. The results are shown in Figure 18. The initial change in SOI does not have a significant impact on the PM-PN emissions numbers, but beyond a point, the emissions increase due to increased piston impingement, as is reported in multiple studies [3,8,15].
EEPS Nucleation and Impaction Losses
The section on the operation of the EEPS mentions the potential sources of error on the PM-PN numbers. The initial EEPS dilution system did not have a heated sampling line. Additionally, the sampling line had multiple bends. If the sampling line is not heated as per the SAEJ3160 standards [22], it leads to the nucleation of semi-volatile particles at low temperatures, increasing the number of low diameter particles. Bends, expansions or contractions in the sampling line leads to losses in the high mass particles due to their high inertia, known as impaction losses. PM-PN data before and after changes were made to the dilution system is shown in Figure 19. With a heated sampling line, the number of low diameter particles reduced due to mitigation of nucleation. Elimination of bends reduced impaction losses, which increased the high diameter particles.
Figure 19.
Impact of dilution system updates on PM-PN emissions (2200 RPM-4.55 bar BMEP)Settling Time.
Figure 19.
Impact of dilution system updates on PM-PN emissions (2200 RPM-4.55 bar BMEP)Settling Time.
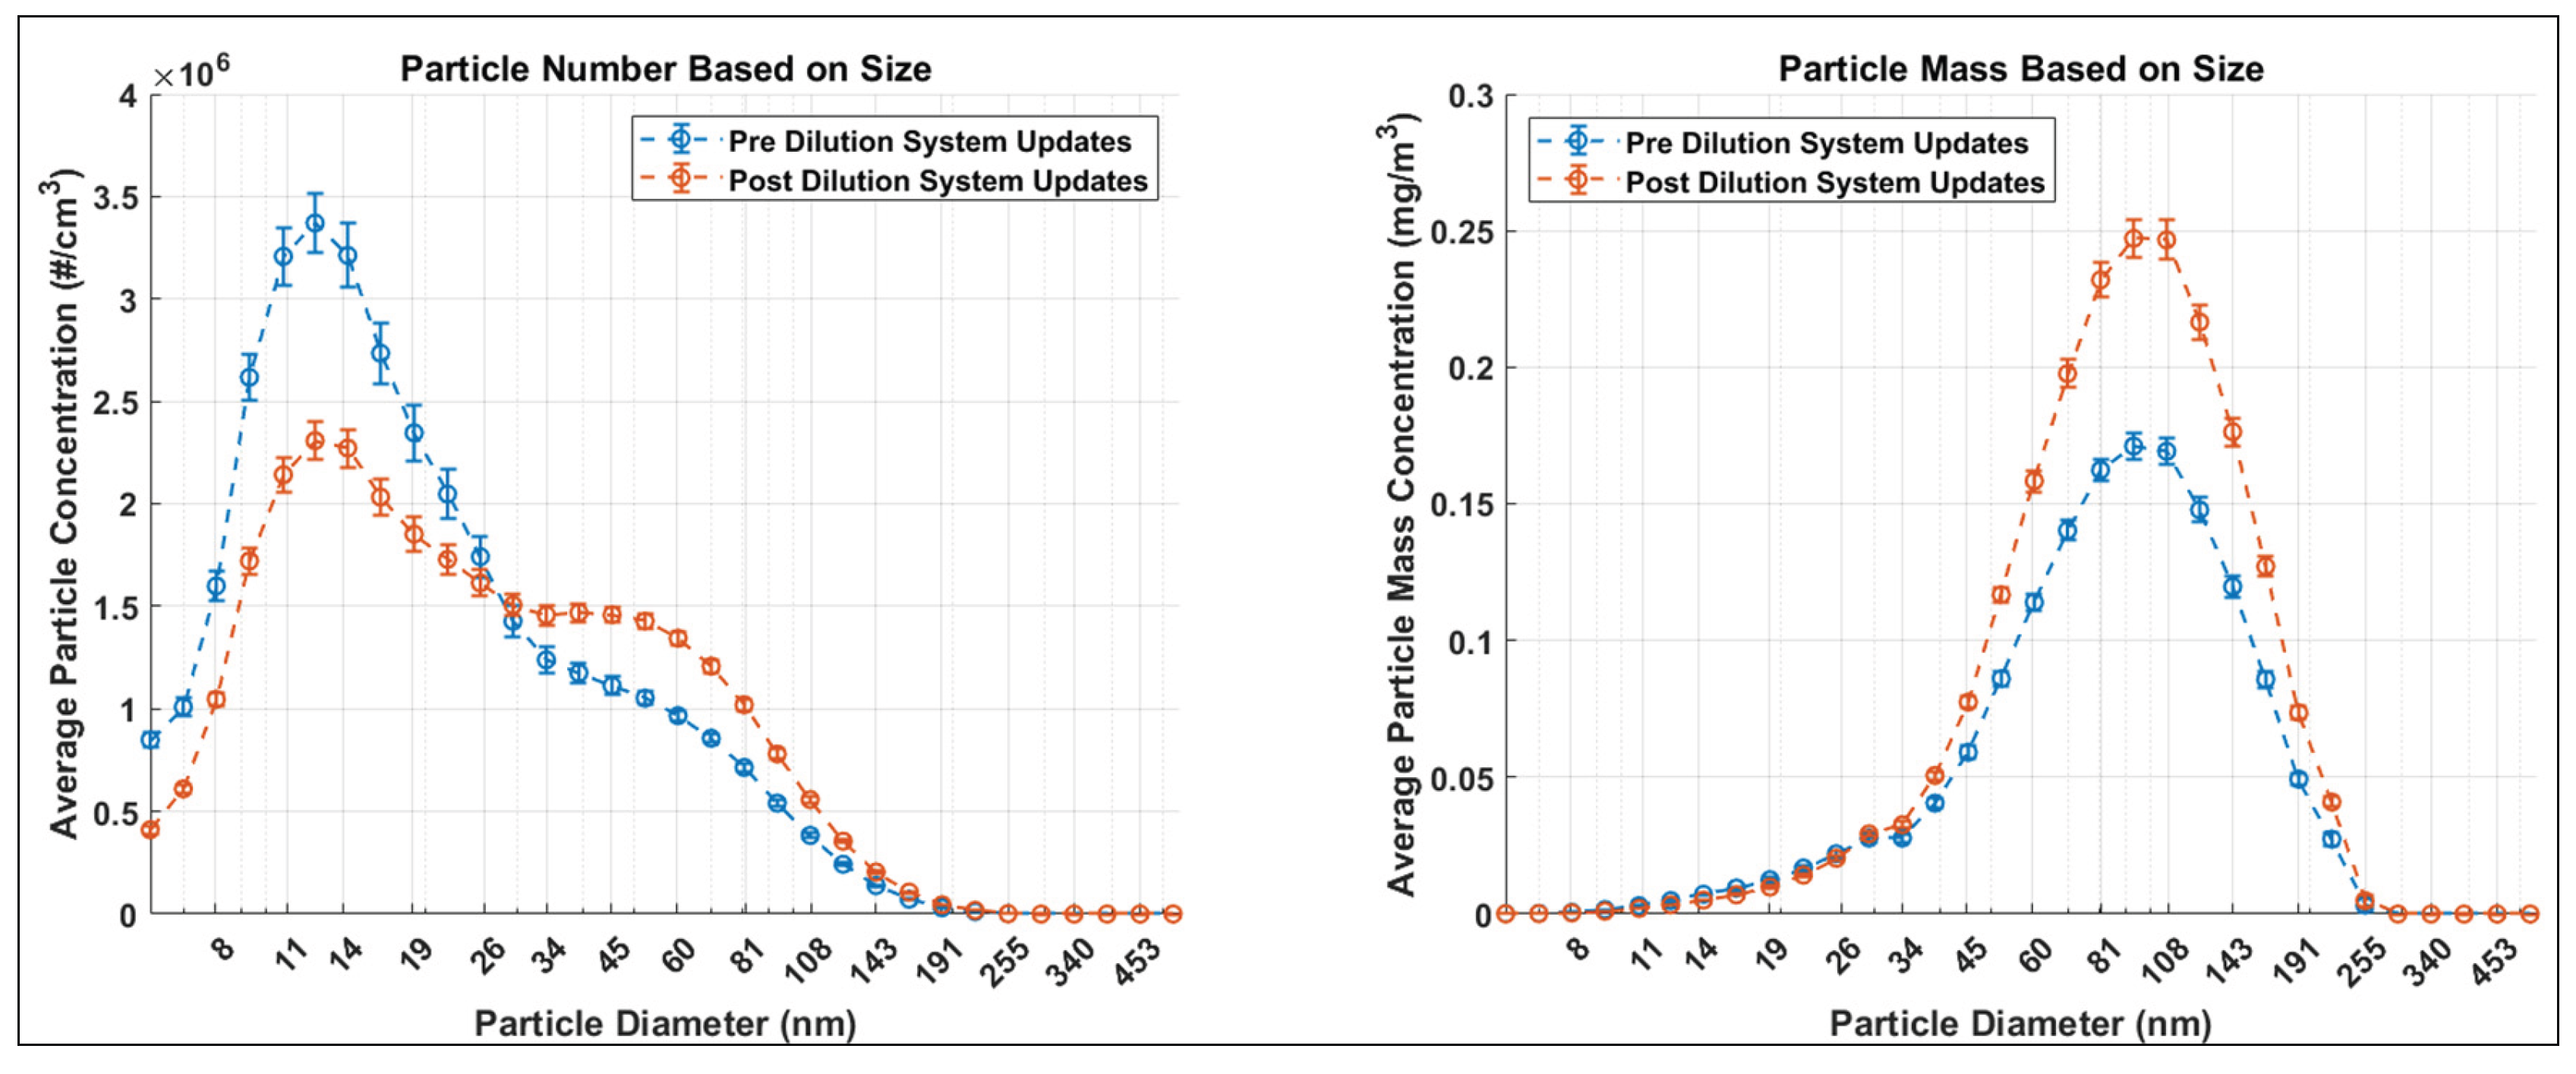
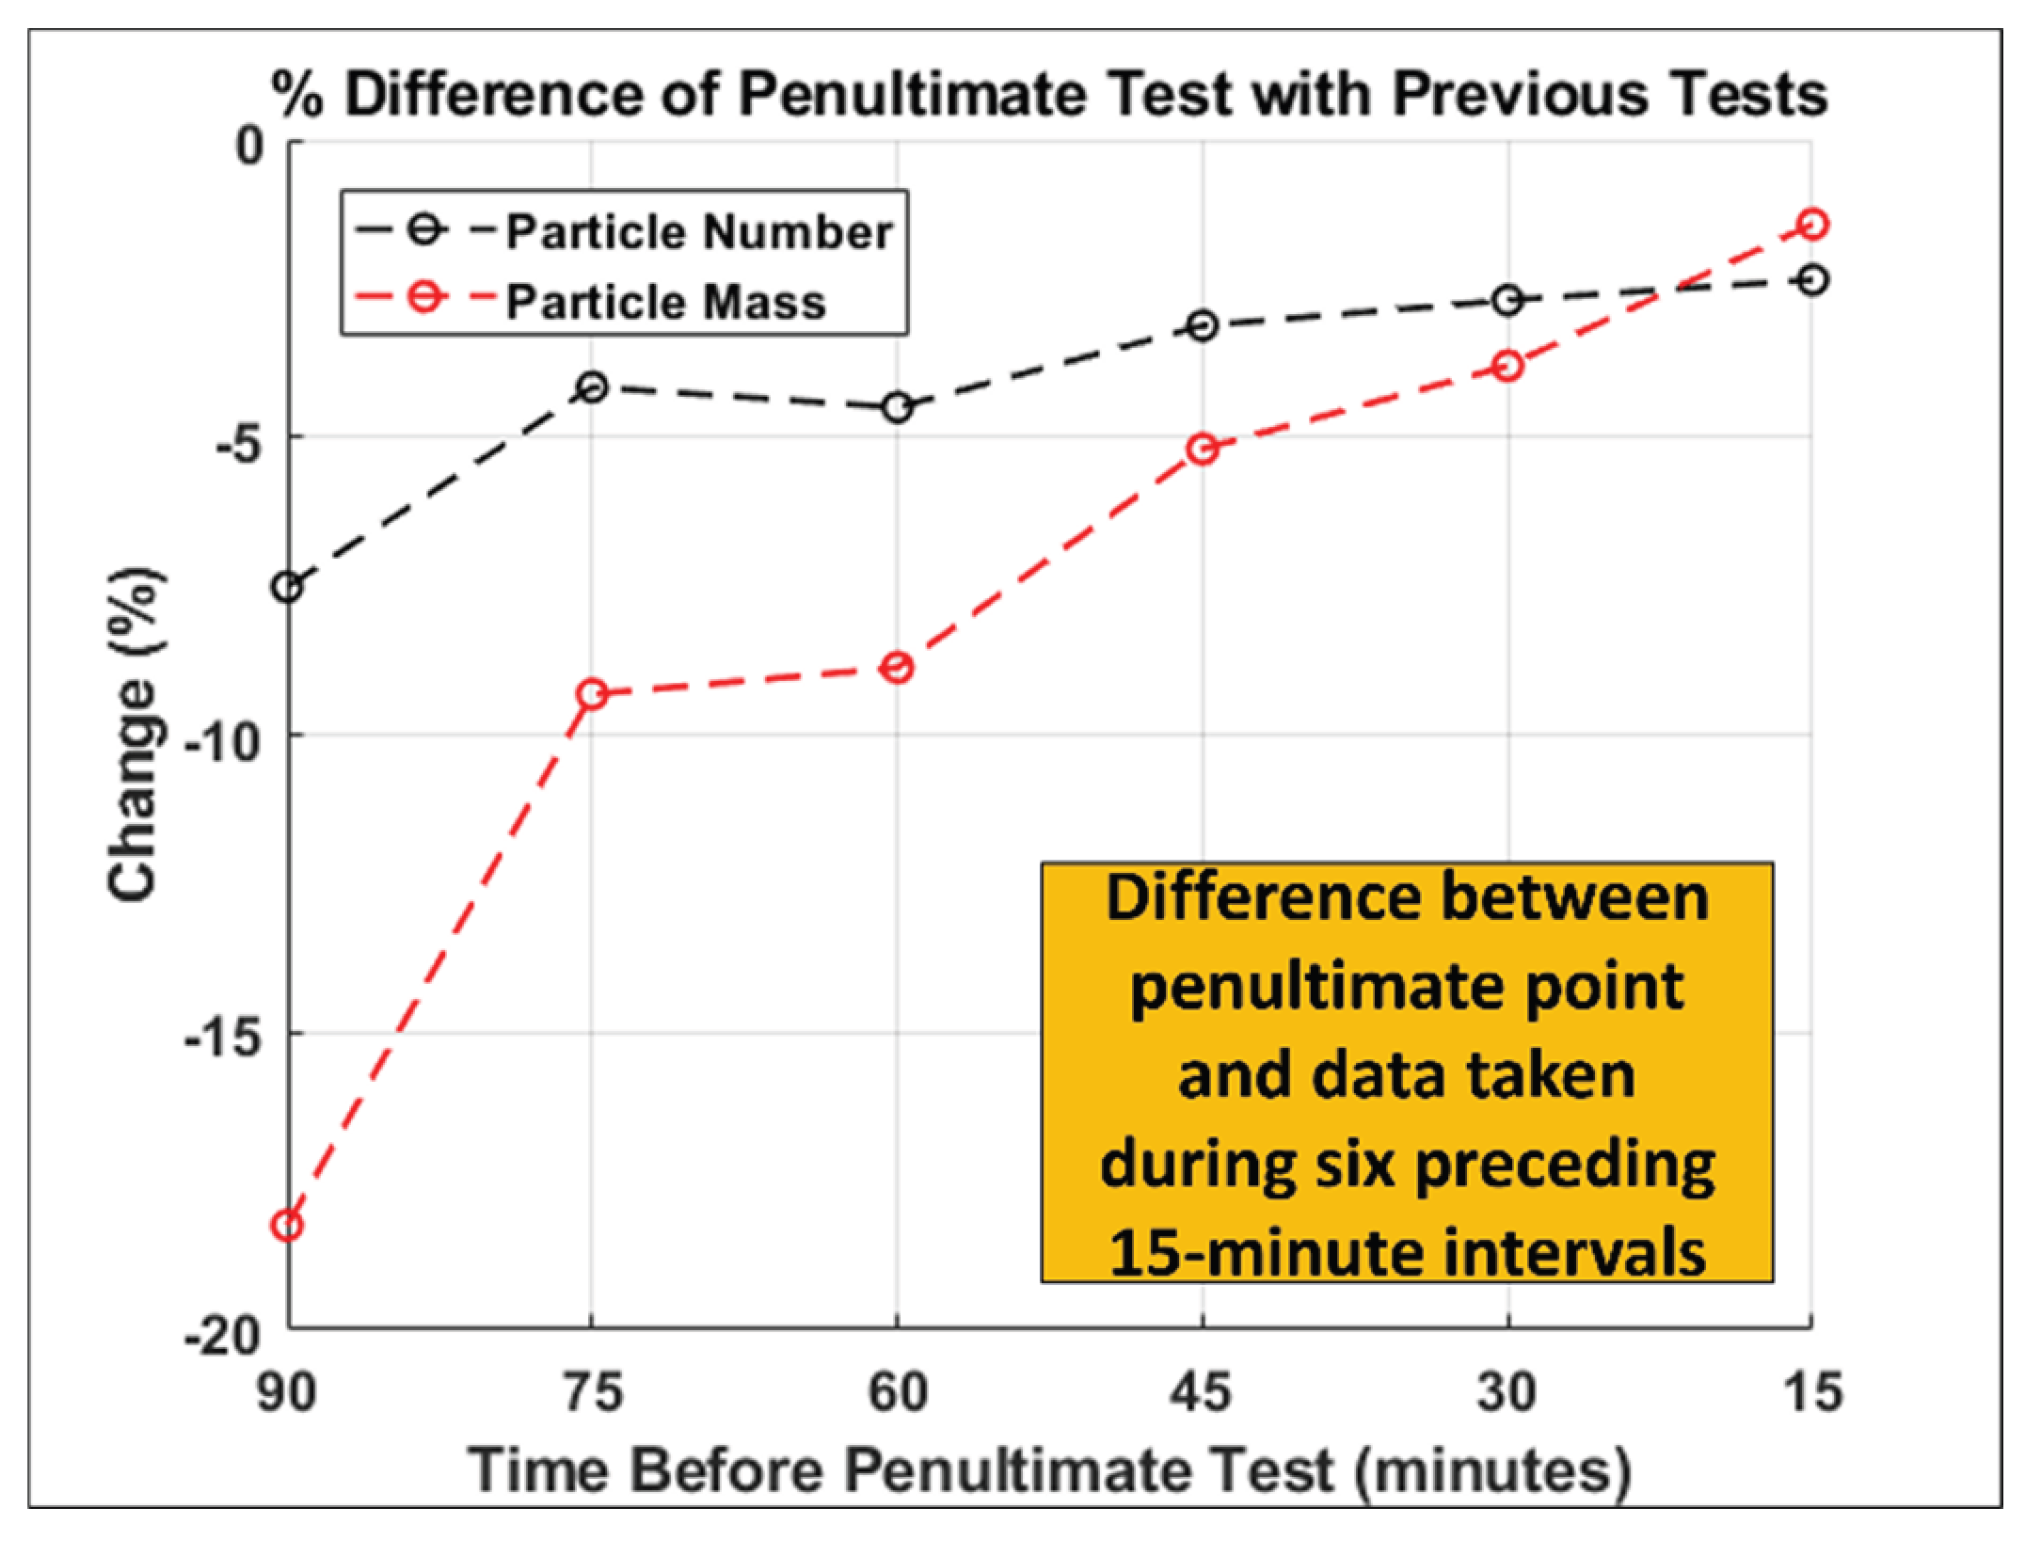
Figure 6 shows the settling time criteria with the PM-PN emissions in the final 15-minute block compared with 90 minutes of data taken before. Figure 20 sheds more light on the settling time criteria with a similar plot for the penultimate test (one test before the final test) for the dataset. For the penultimate test, the particulate mass 90 minutes before has a difference of more than 10%, which is why the emissions cannot be deemed as ‘settled’ or at steady state at this point. This is the reason the engine had to be run for an additional 15 minutes.
Figure 19.
Difference in PM-PN emissions of penultimate point and data taken 90 minutes before.
EEPS Reference Checks
Figure 11 shows the high PM value for the EEPS reference check preceding Additive 2. This was an outlier, most likely caused by the accumulation of particulate matter at the entrance to the EEPS sample line. To eliminate the effect of the infrequent high diameter particles, the PM data for particle diameters over 191.1 nm for all EEPS reference checks was predicted using a non-negative Weibull distribution, and the total particulate mass was recalculated, which is shown in Figure 20. This reduced the COV of the data from 11.5% to 5.9%. It should be noted that for this exercise, the original data measured by the EEPS for the high diameter particles was ignored, as this was only done as a sense check to estimate the COV of PM emissions without the infrequent high diameter particles.
Figure 20.
Particulate Mass for EEPS reference checks (mass of particles with diameters over 191.1 nm predicted using a non-negative Weibull distribution).
Figure 20.
Particulate Mass for EEPS reference checks (mass of particles with diameters over 191.1 nm predicted using a non-negative Weibull distribution).
References
- Ristovski, Z.D., et al., Respiratory health effects of diesel particulate matter. Respirology, 2012. 17(2): p. 201-212.
- Satsangi, D.P. and A.K. Agarwal, Particulate matter and its impact on human health in urban settings, in Methanol and the Alternate Fuel Economy. 2018, Springer. p. 213-231.
- Maricq, M.M., Engine, aftertreatment, fuel quality and non-tailpipe achievements to lower gasoline vehicle PM emissions: Literature review and future prospects. Science of The Total Environment, 2023. 866: p. 161225.
- Heywood, J., Internal combustion engine fundamentals. 2018.
- Tiegang, F., W. Libing, and W. Zhi, Particulate matter emissions from gasoline direct injection engines: Research review. Journal of Automotive Safety and Energy, 2017. 8(03): p. 226.
- Saliba, G., et al., Comparison of gasoline direct-injection (GDI) and port fuel injection (PFI) vehicle emissions: emission certification standards, cold-start, secondary organic aerosol formation potential, and potential climate impacts. Environmental science & technology, 2017. 51(11): p. 6542-6552.
- Leach, F., et al., A review and perspective on particulate matter indices linking fuel composition to particulate emissions from gasoline engines. SAE International Journal of Fuels and Lubricants, 2022. 15(1): p. 3-28.
- Joshi, A. and T.V. Johnson, Gasoline particulate filters—A review. Emission Control Science and Technology, 2018. 4(4): p. 219-239.
- Khalek, I.A., T. Bougher, and J.J. Jetter, Particle emissions from a 2009 gasoline direct injection engine using different commercially available fuels. SAE International Journal of Fuels and Lubricants, 2010. 3(2): p. 623-637.
- Maricq, M.M., et al., Motor vehicle PM emissions measurement at LEV III levels. SAE International Journal of Engines, 2011. 4(1): p. 597-609.
- Yamada, H., S. Inomata, and H. Tanimoto, Particle and VOC emissions from stoichiometric gasoline direct injection vehicles and correlation between particle number and mass emissions. Emission control science and technology, 2017. 3: p. 135-141.
- Giechaskiel, B., U. Manfredi, and G. Martini, Engine exhaust solid sub-23 nm particles: I. literature survey. SAE International Journal of Fuels and Lubricants, 2014. 7(3): p. 950-964.
- Alanen, J., et al., The formation and physical properties of the particle emissions from a natural gas engine. Fuel, 2015. 162: p. 155-161.
- Leach, F., et al., Sub-23 nm particulate emissions from a highly boosted GDI engine. 2019, SAE Technical Paper.
- Leach, F., et al. A review of the requirements for injection systems and the effects of fuel quality on particulate emissions from GDI engines. in SAE International Powertrains, Fuels & Lubricants Meeting 2018. 2018. Society of Automotive Engineers.
- Monroe, R., et al., Engine particulate emissions as a function of gasoline deposit control additive. SAE International Journal of Fuels and Lubricants, 2021. 14(1): p. 3-12.
- Kuo, C.-H., et al., Aftermarket fuel additives and their effects on GDI injector performance and particulate emissions. 2022, SAE Technical Paper.
- Zhang, W., et al., Impact of Fuel Properties on GDI Injector Deposit Formation and Particulate Matter Emissions. 2020, SAE Technical Paper.
- Chapman, E., et al., Impact of fuel detergent type and concentration on the rate and severity of stochastic preignition in a turbocharged spark ignition direct injection gasoline engine. 2021, SAE Technical Paper.
- Tang, Z. and S. Li, A review of recent developments of friction modifiers for liquid lubricants (2007–present). Current opinion in solid state and materials science, 2014. 18(3): p. 119-139.
- Guegan, J., M. Southby, and H. Spikes, Friction modifier additives, synergies and antagonisms. Tribology Letters, 2019. 67: p. 1-12.
- International, S., J3160: Recommended Practice for Improving Measurement Quality of Particle Number Counting Devices. Warrendale, PA: SAE International, 2020. 2020.
- Park, K., et al., Relationship between particle mass and mobility for diesel exhaust particles. Environmental science & technology, 2003. 37(3): p. 577-583.
- Maricq, M.M. and N. Xu, The effective density and fractal dimension of soot particles from premixed flames and motor vehicle exhaust. Journal of Aerosol Science, 2004. 35(10): p. 1251-1274.
- Quiros, D.C., et al., Particle effective density and mass during steady-state operation of GDI, PFI, and diesel passenger cars. Journal of Aerosol Science, 2015. 83: p. 39-54.
- Xue, J., et al., Using a new inversion matrix for a fast-sizing spectrometer and a photo-acoustic instrument to determine suspended particulate mass over a transient cycle for light-duty vehicles. Aerosol Science and Technology, 2016. 50(11): p. 1227-1238.
| 1 | The detergents or fuel additives were secured from prominent fuel additive companies and included a mix of PEA, PIBA and Mannich chemistries. The additive names and chemistries are anonymized as requirements from the Fuels Additives Task Group (FATG), who supplied the additives. |
| 2 | ‘Particle Mass’ in plots refers to regulated ‘Particulate Mass’ as measured by EEPS. |
Figure 1.
Instrumented test cell with the test engnie.

Figure 2.
EEPS schematic.
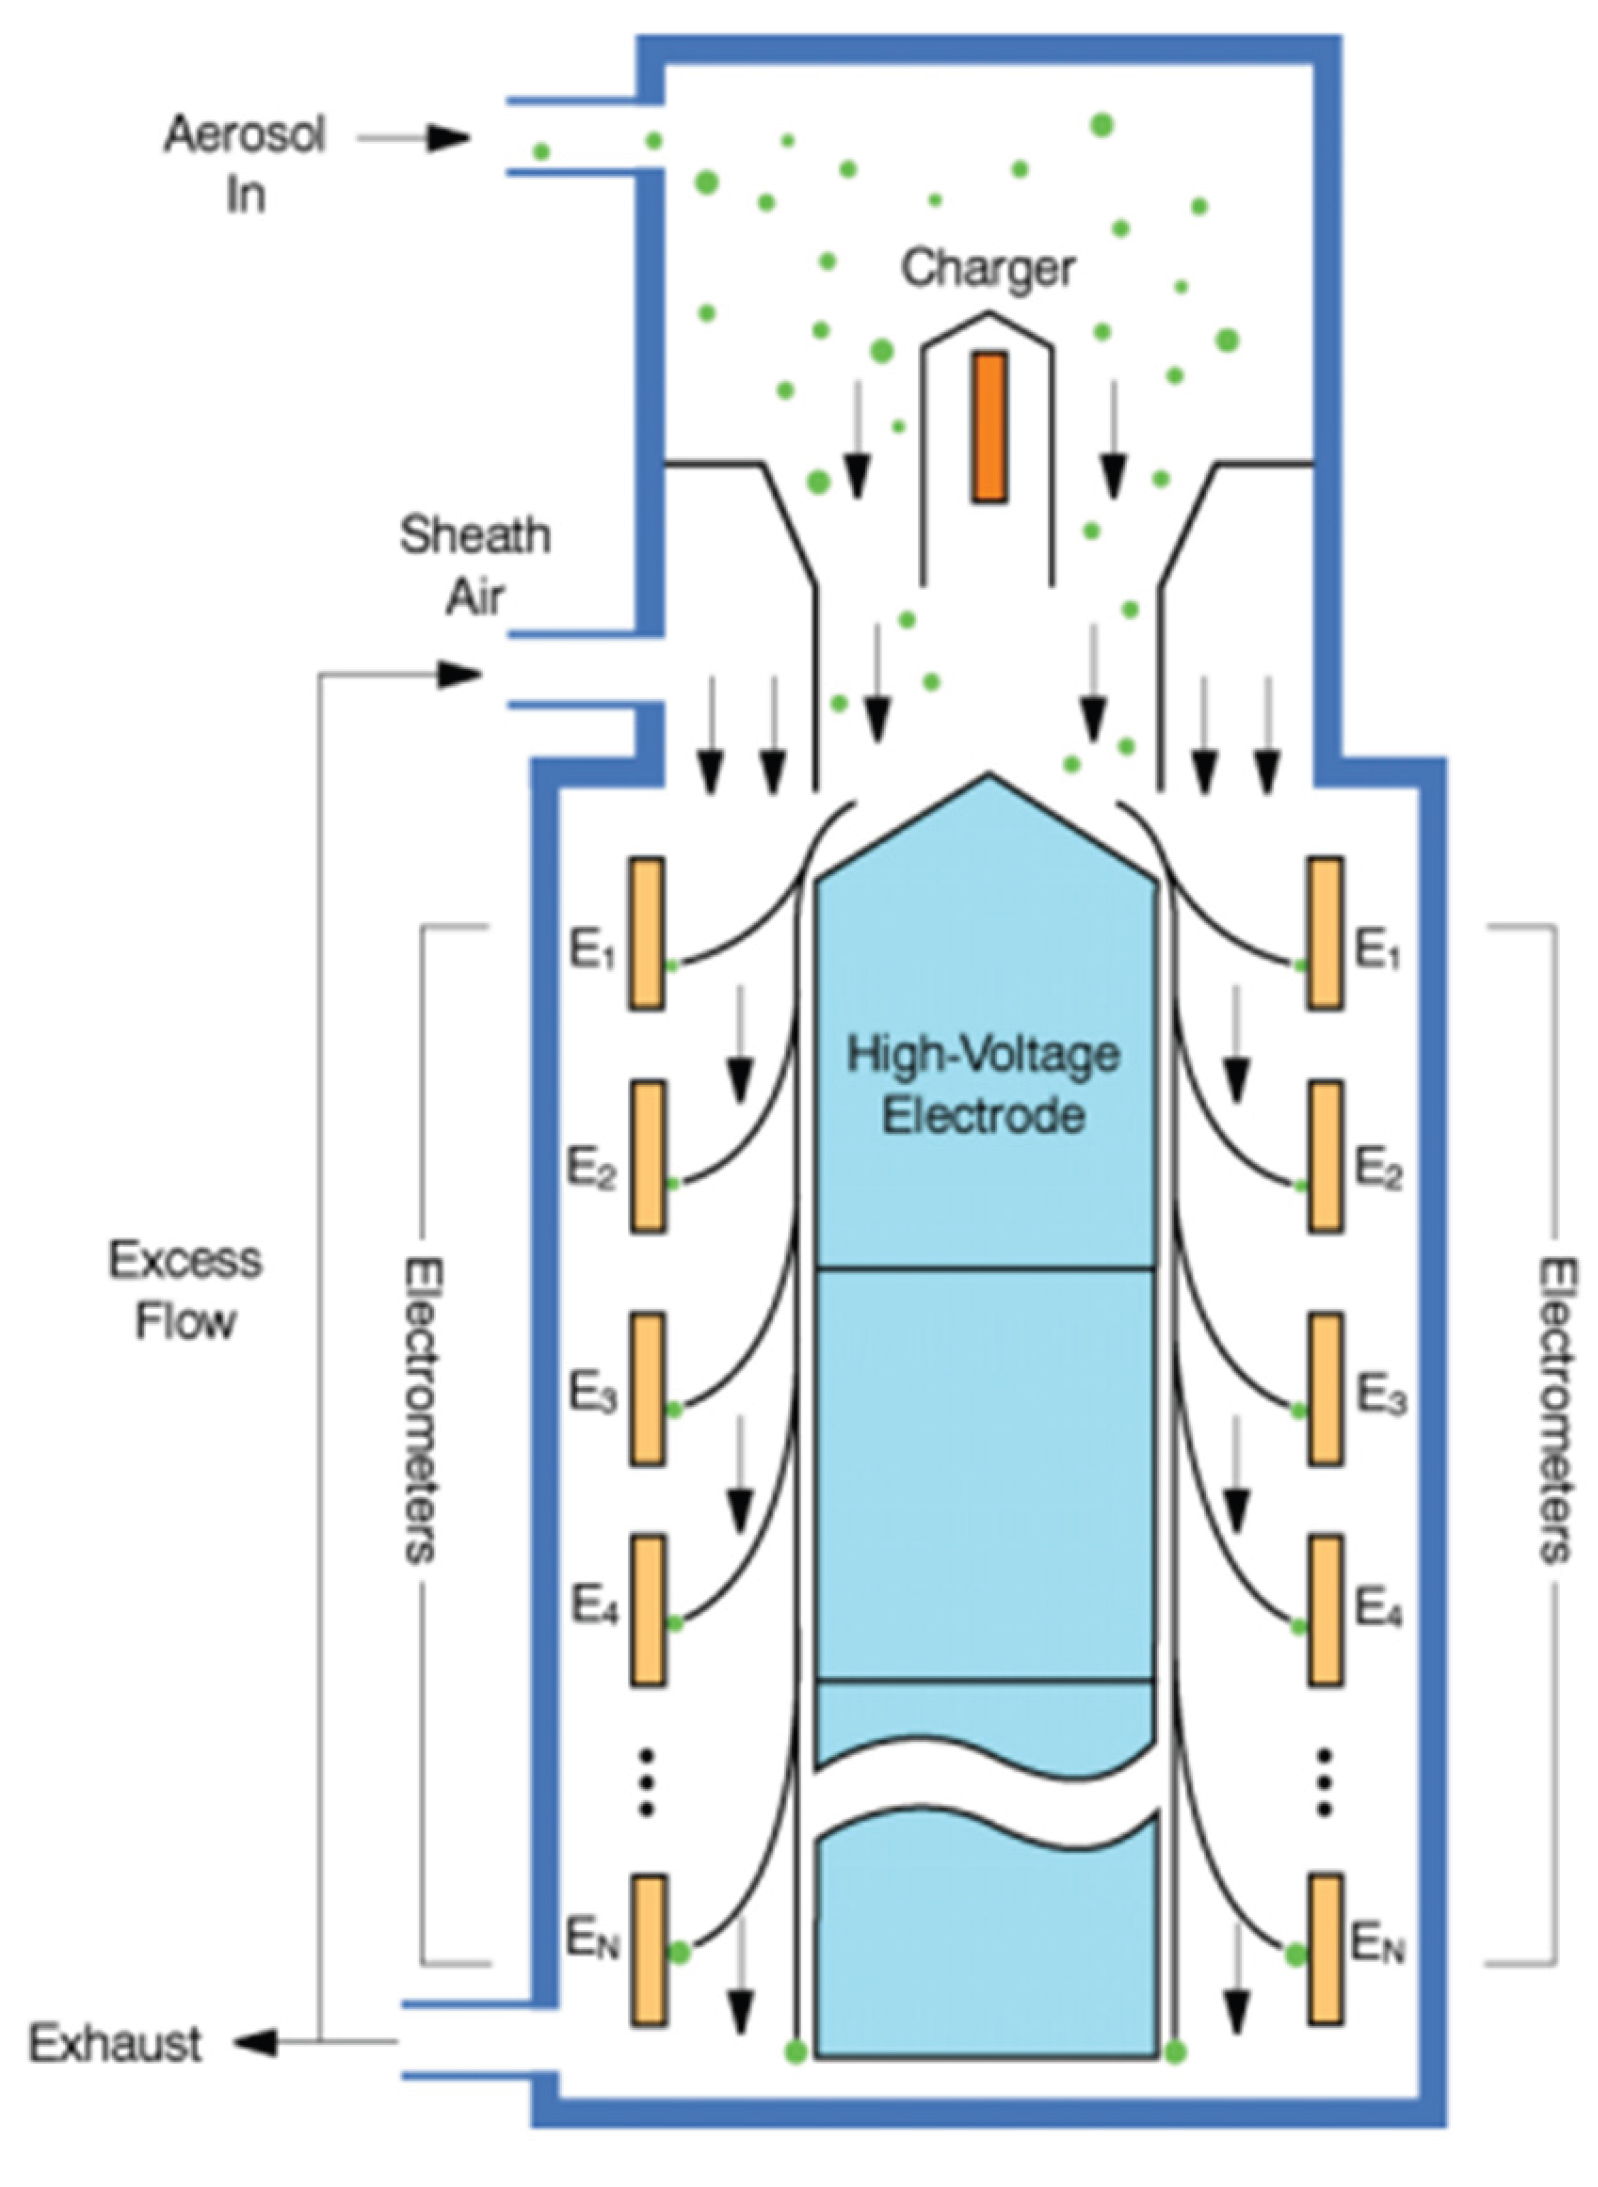
Figure 3.
EEPS dilution system schematic.
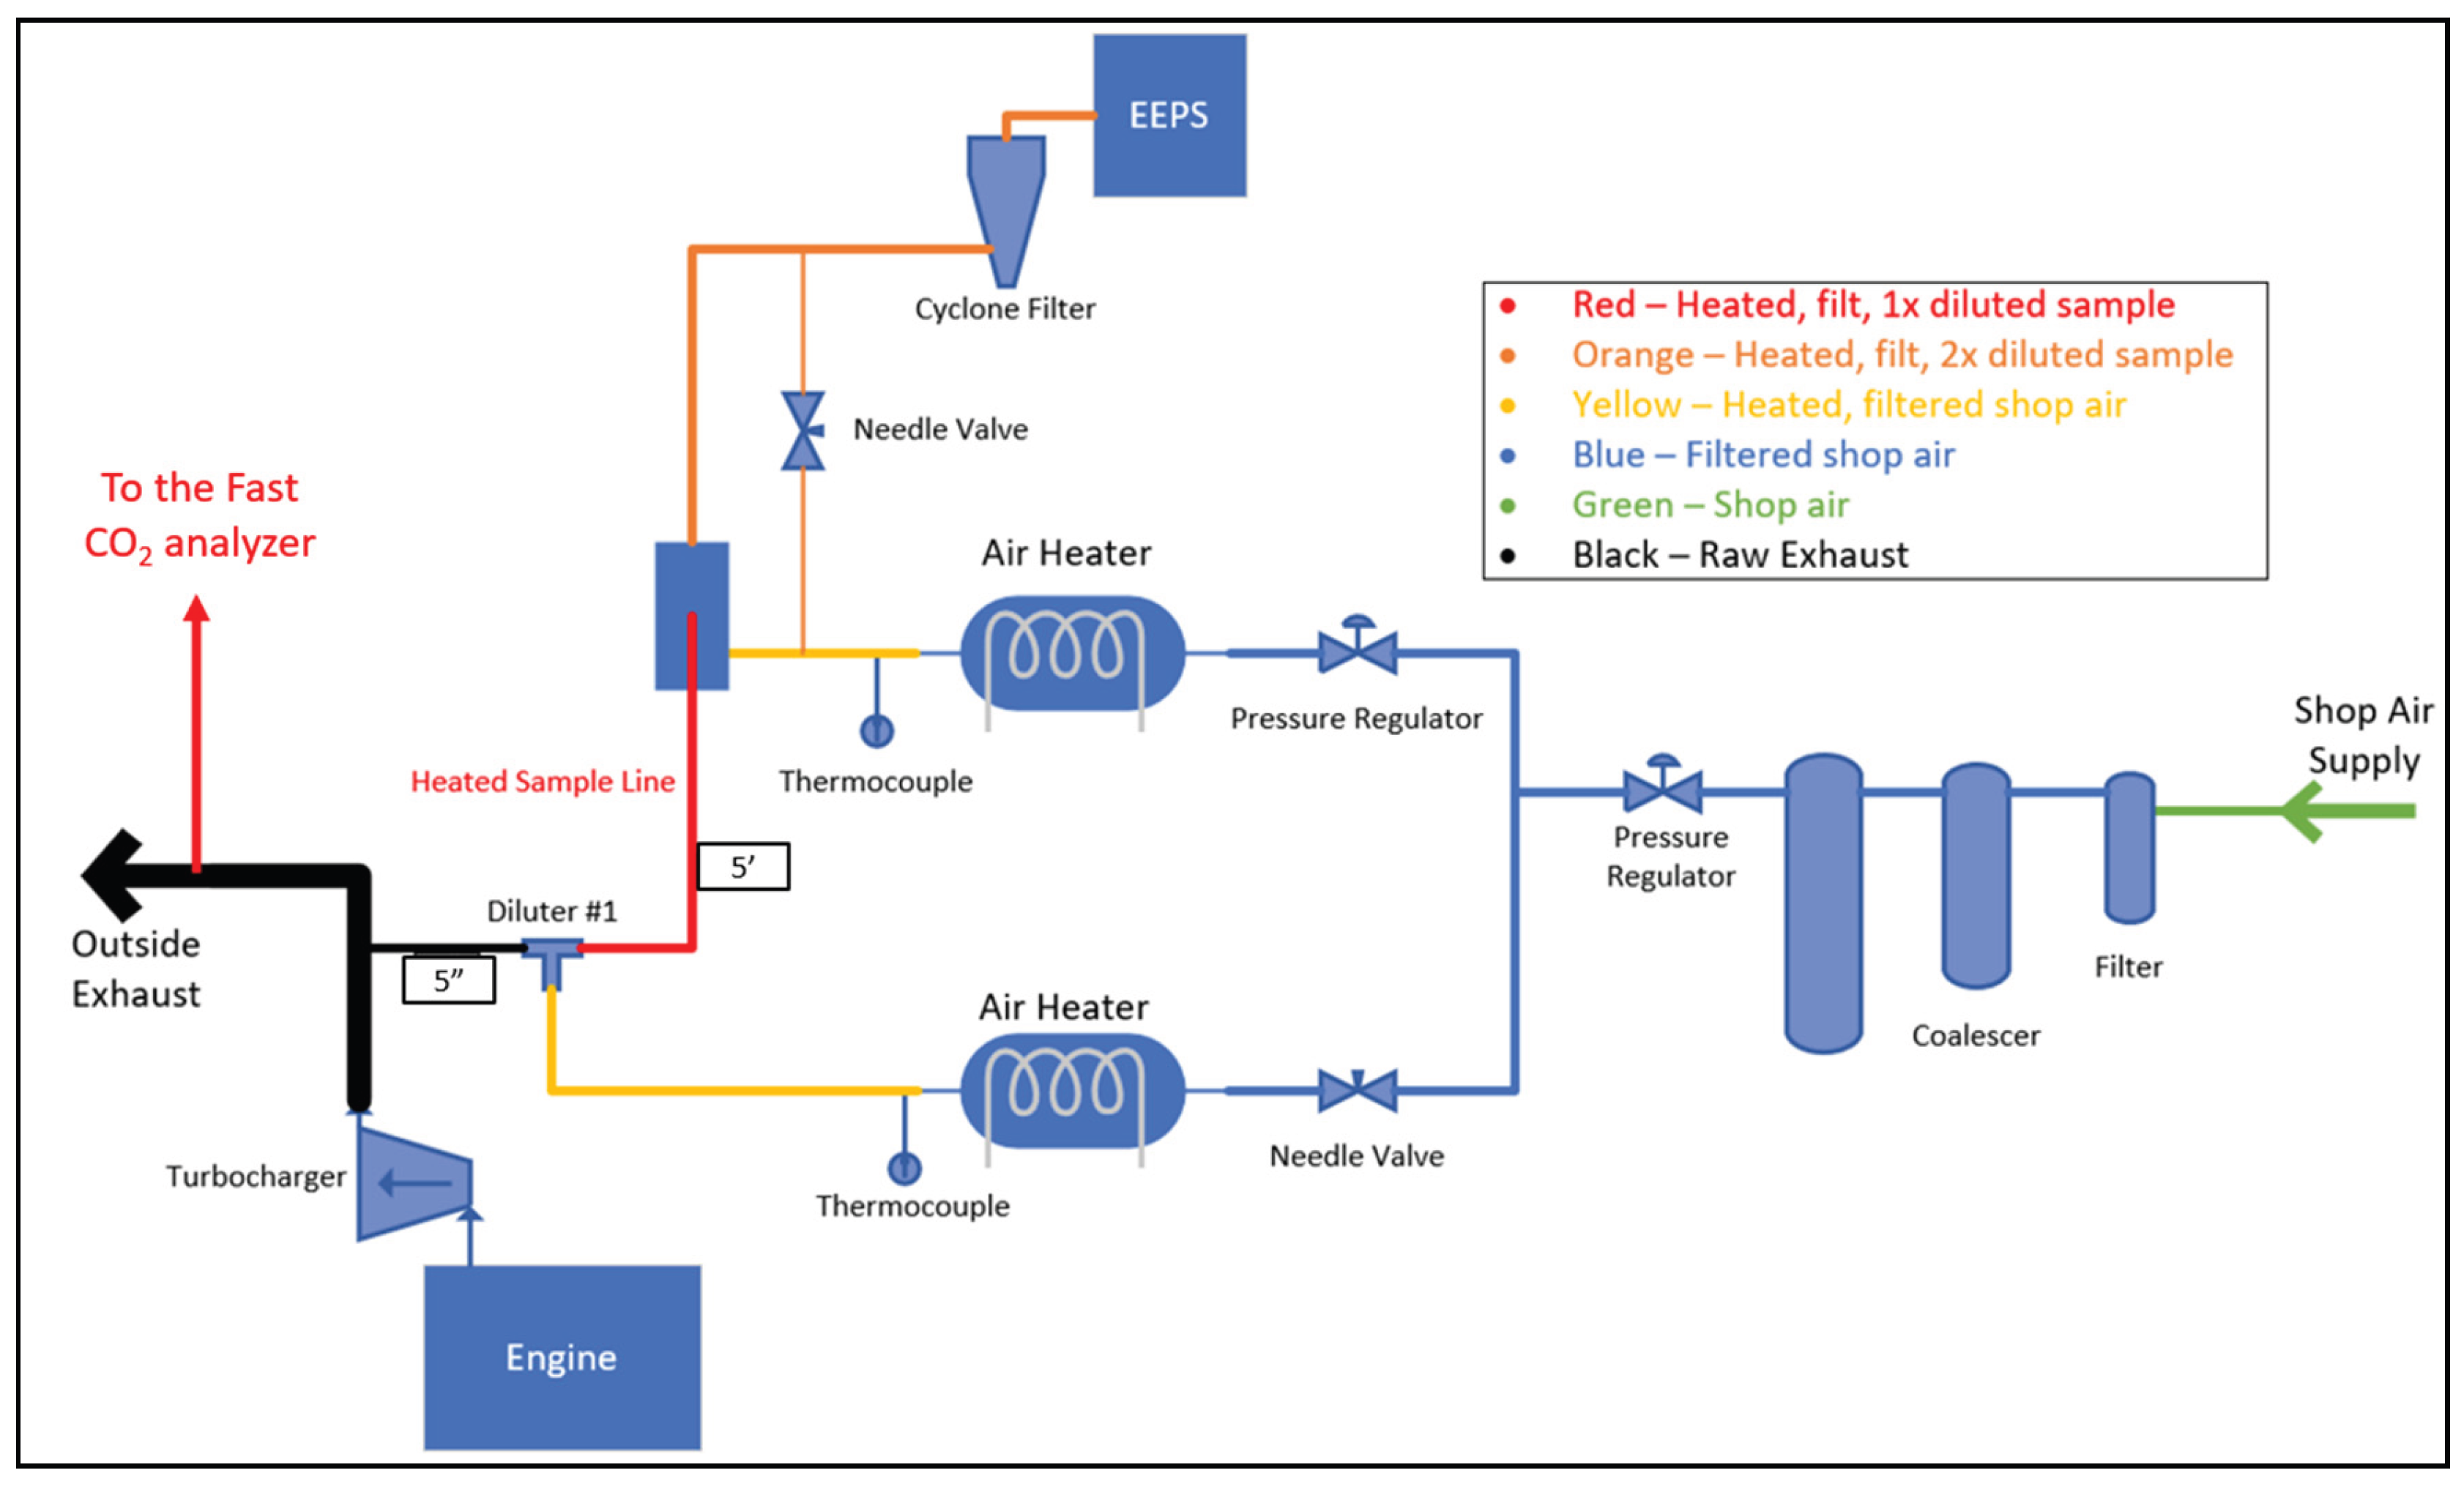
Figure 4.
Test procedure for LAC treat rate.
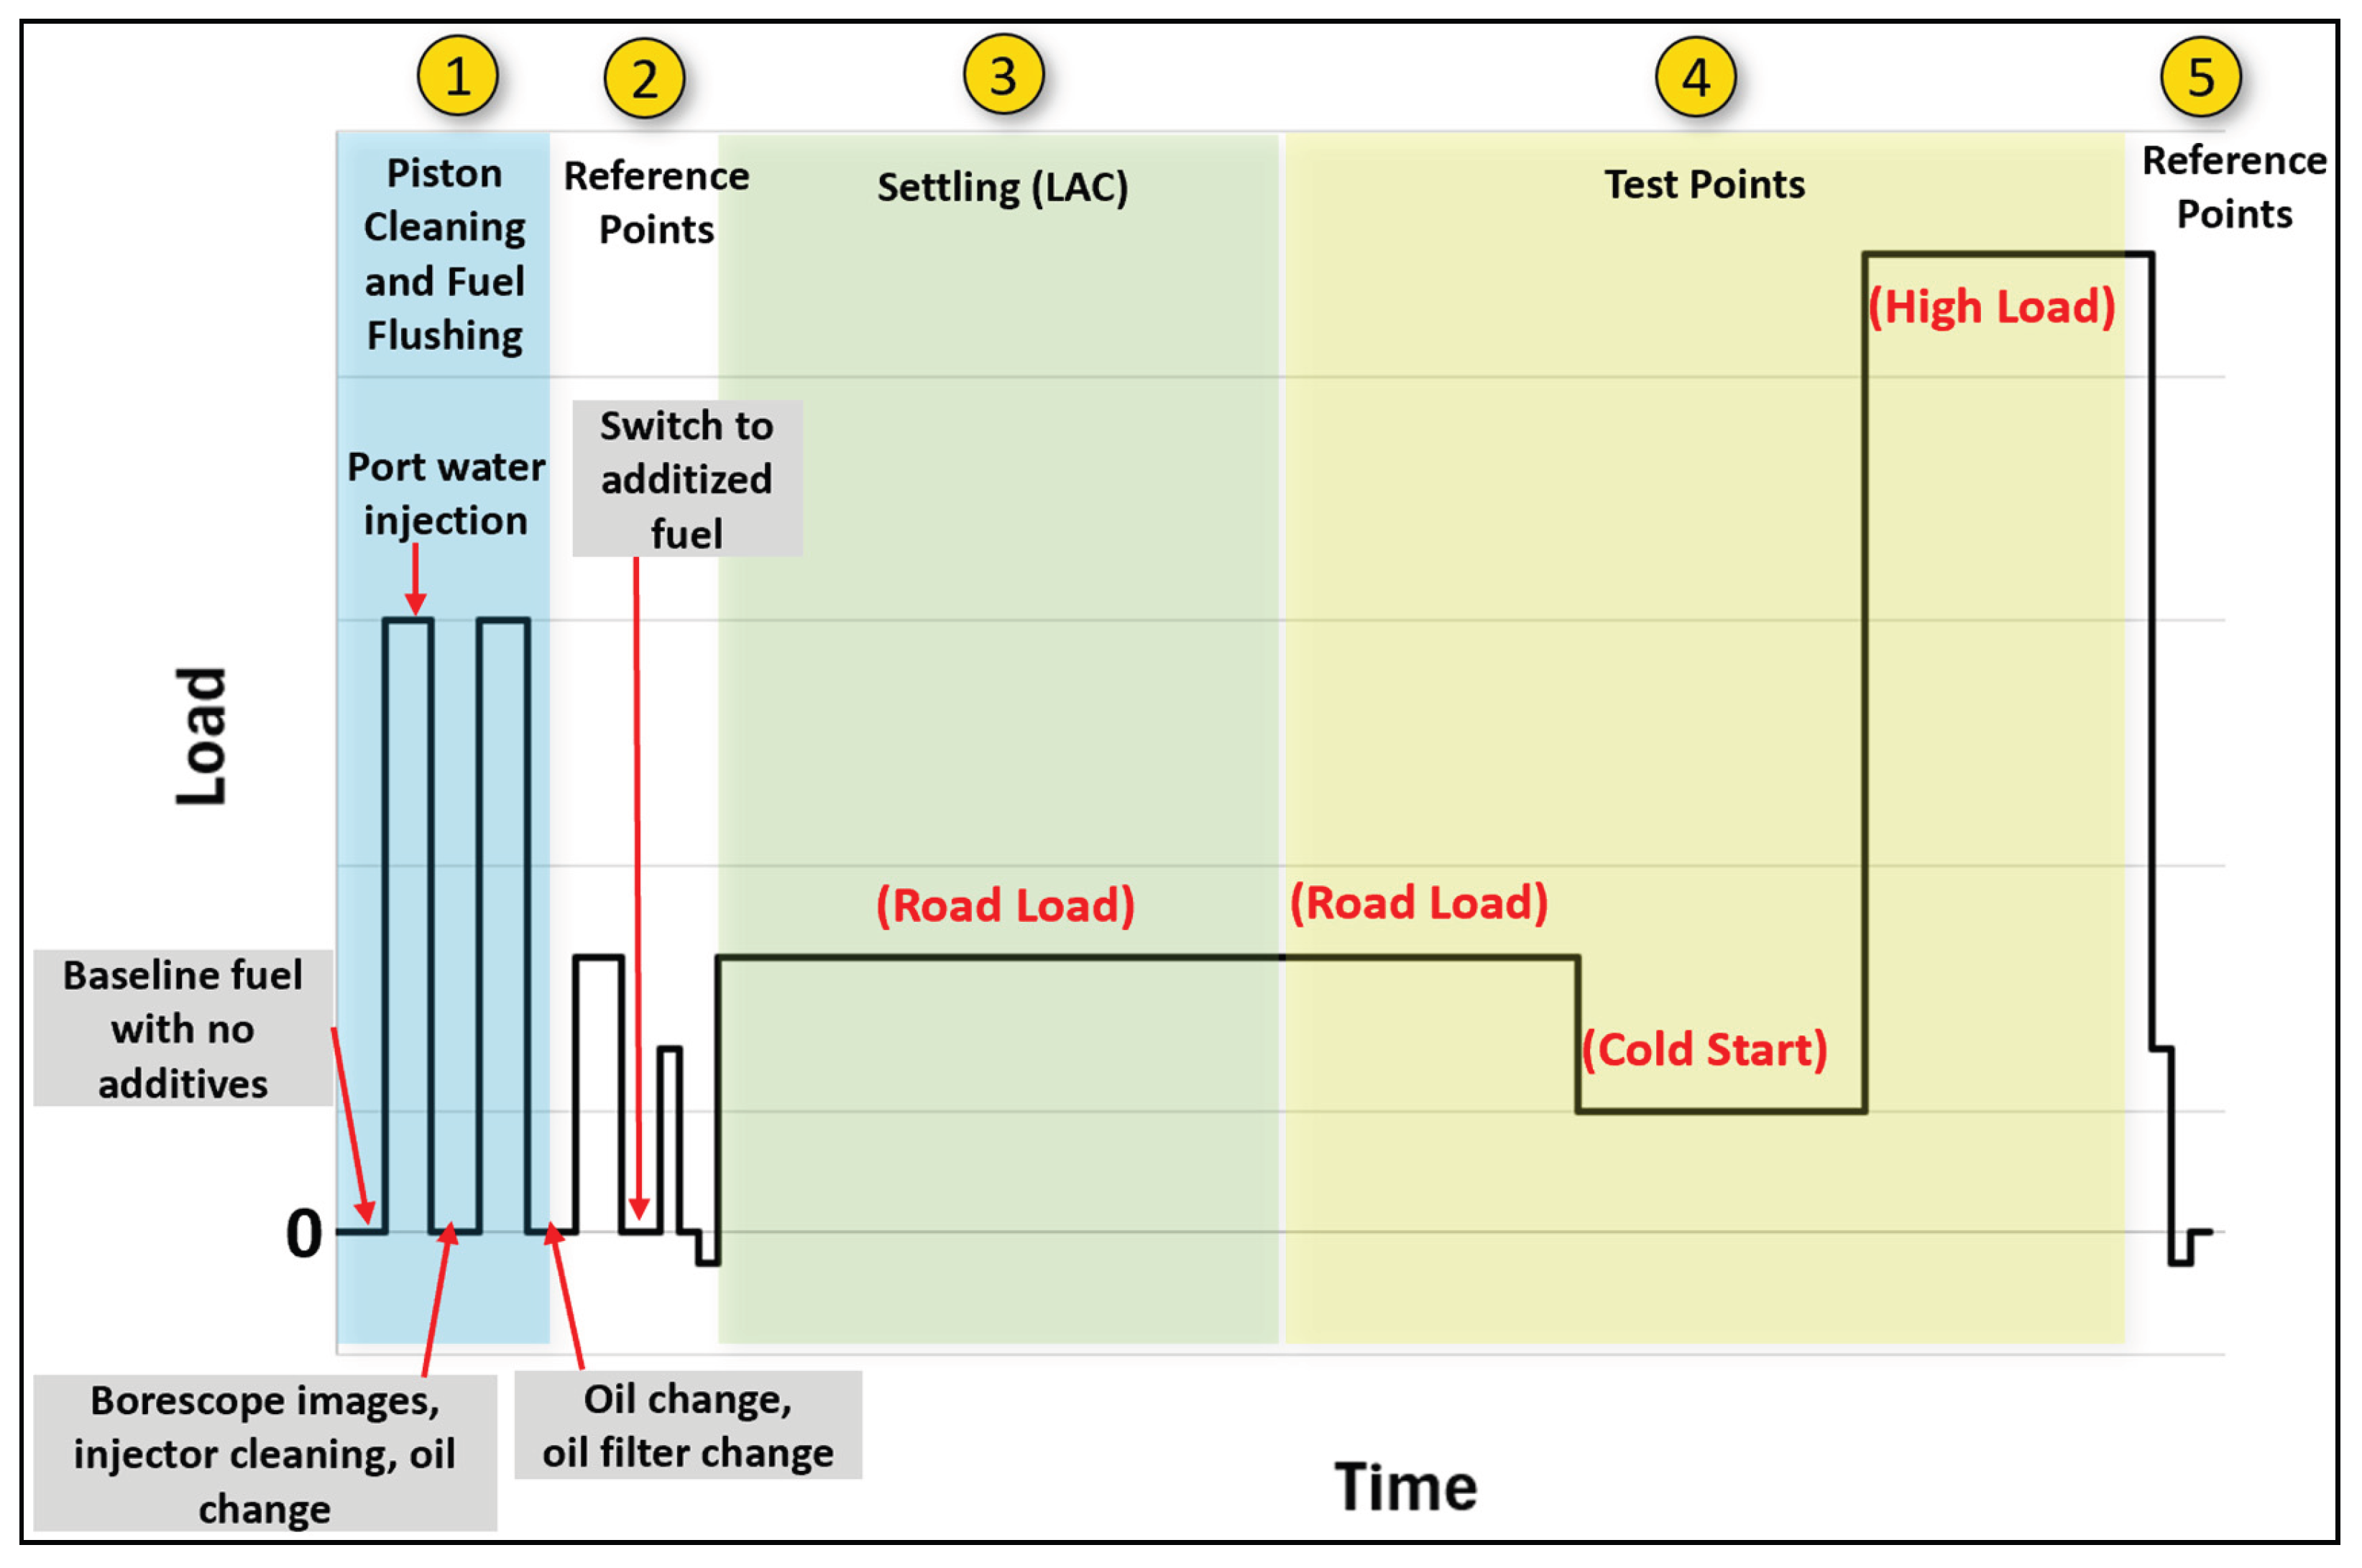
Figure 5.
Test procedure for 1xTT and 3xTT treat rates.
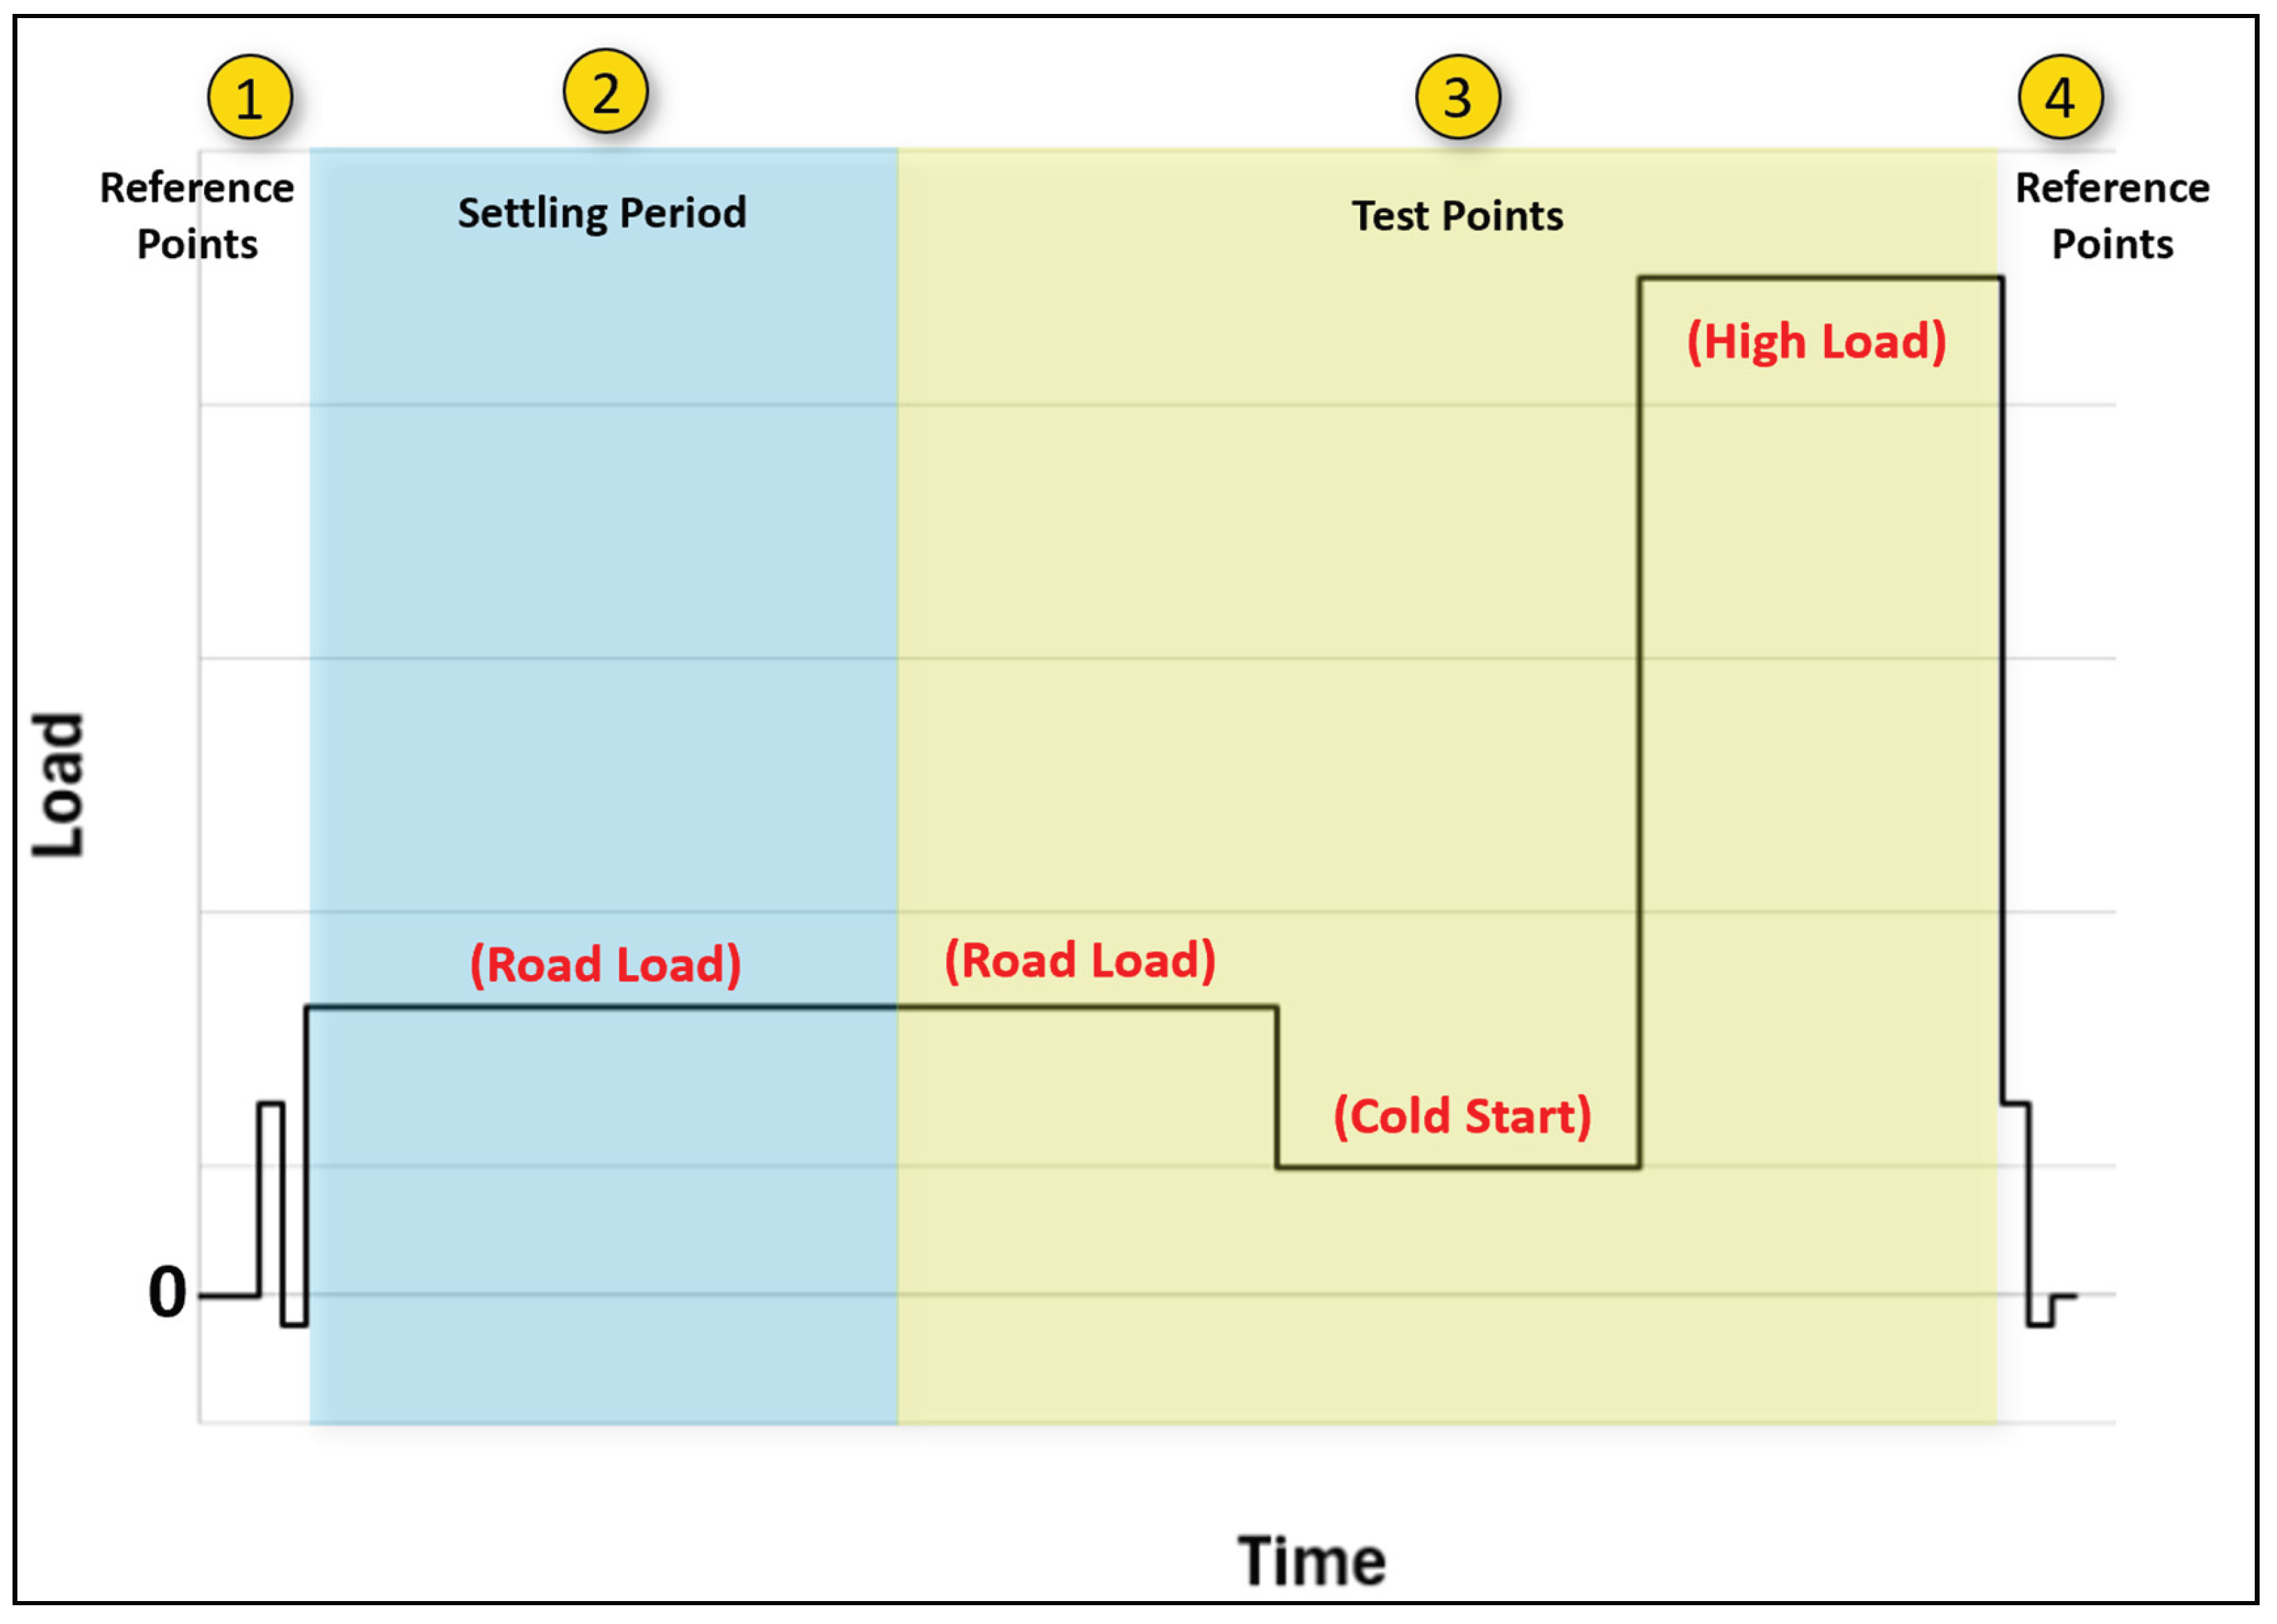
Figure 6.
Settling critertia for PM-PN emissions testing2.
Figure 6.
Settling critertia for PM-PN emissions testing2.
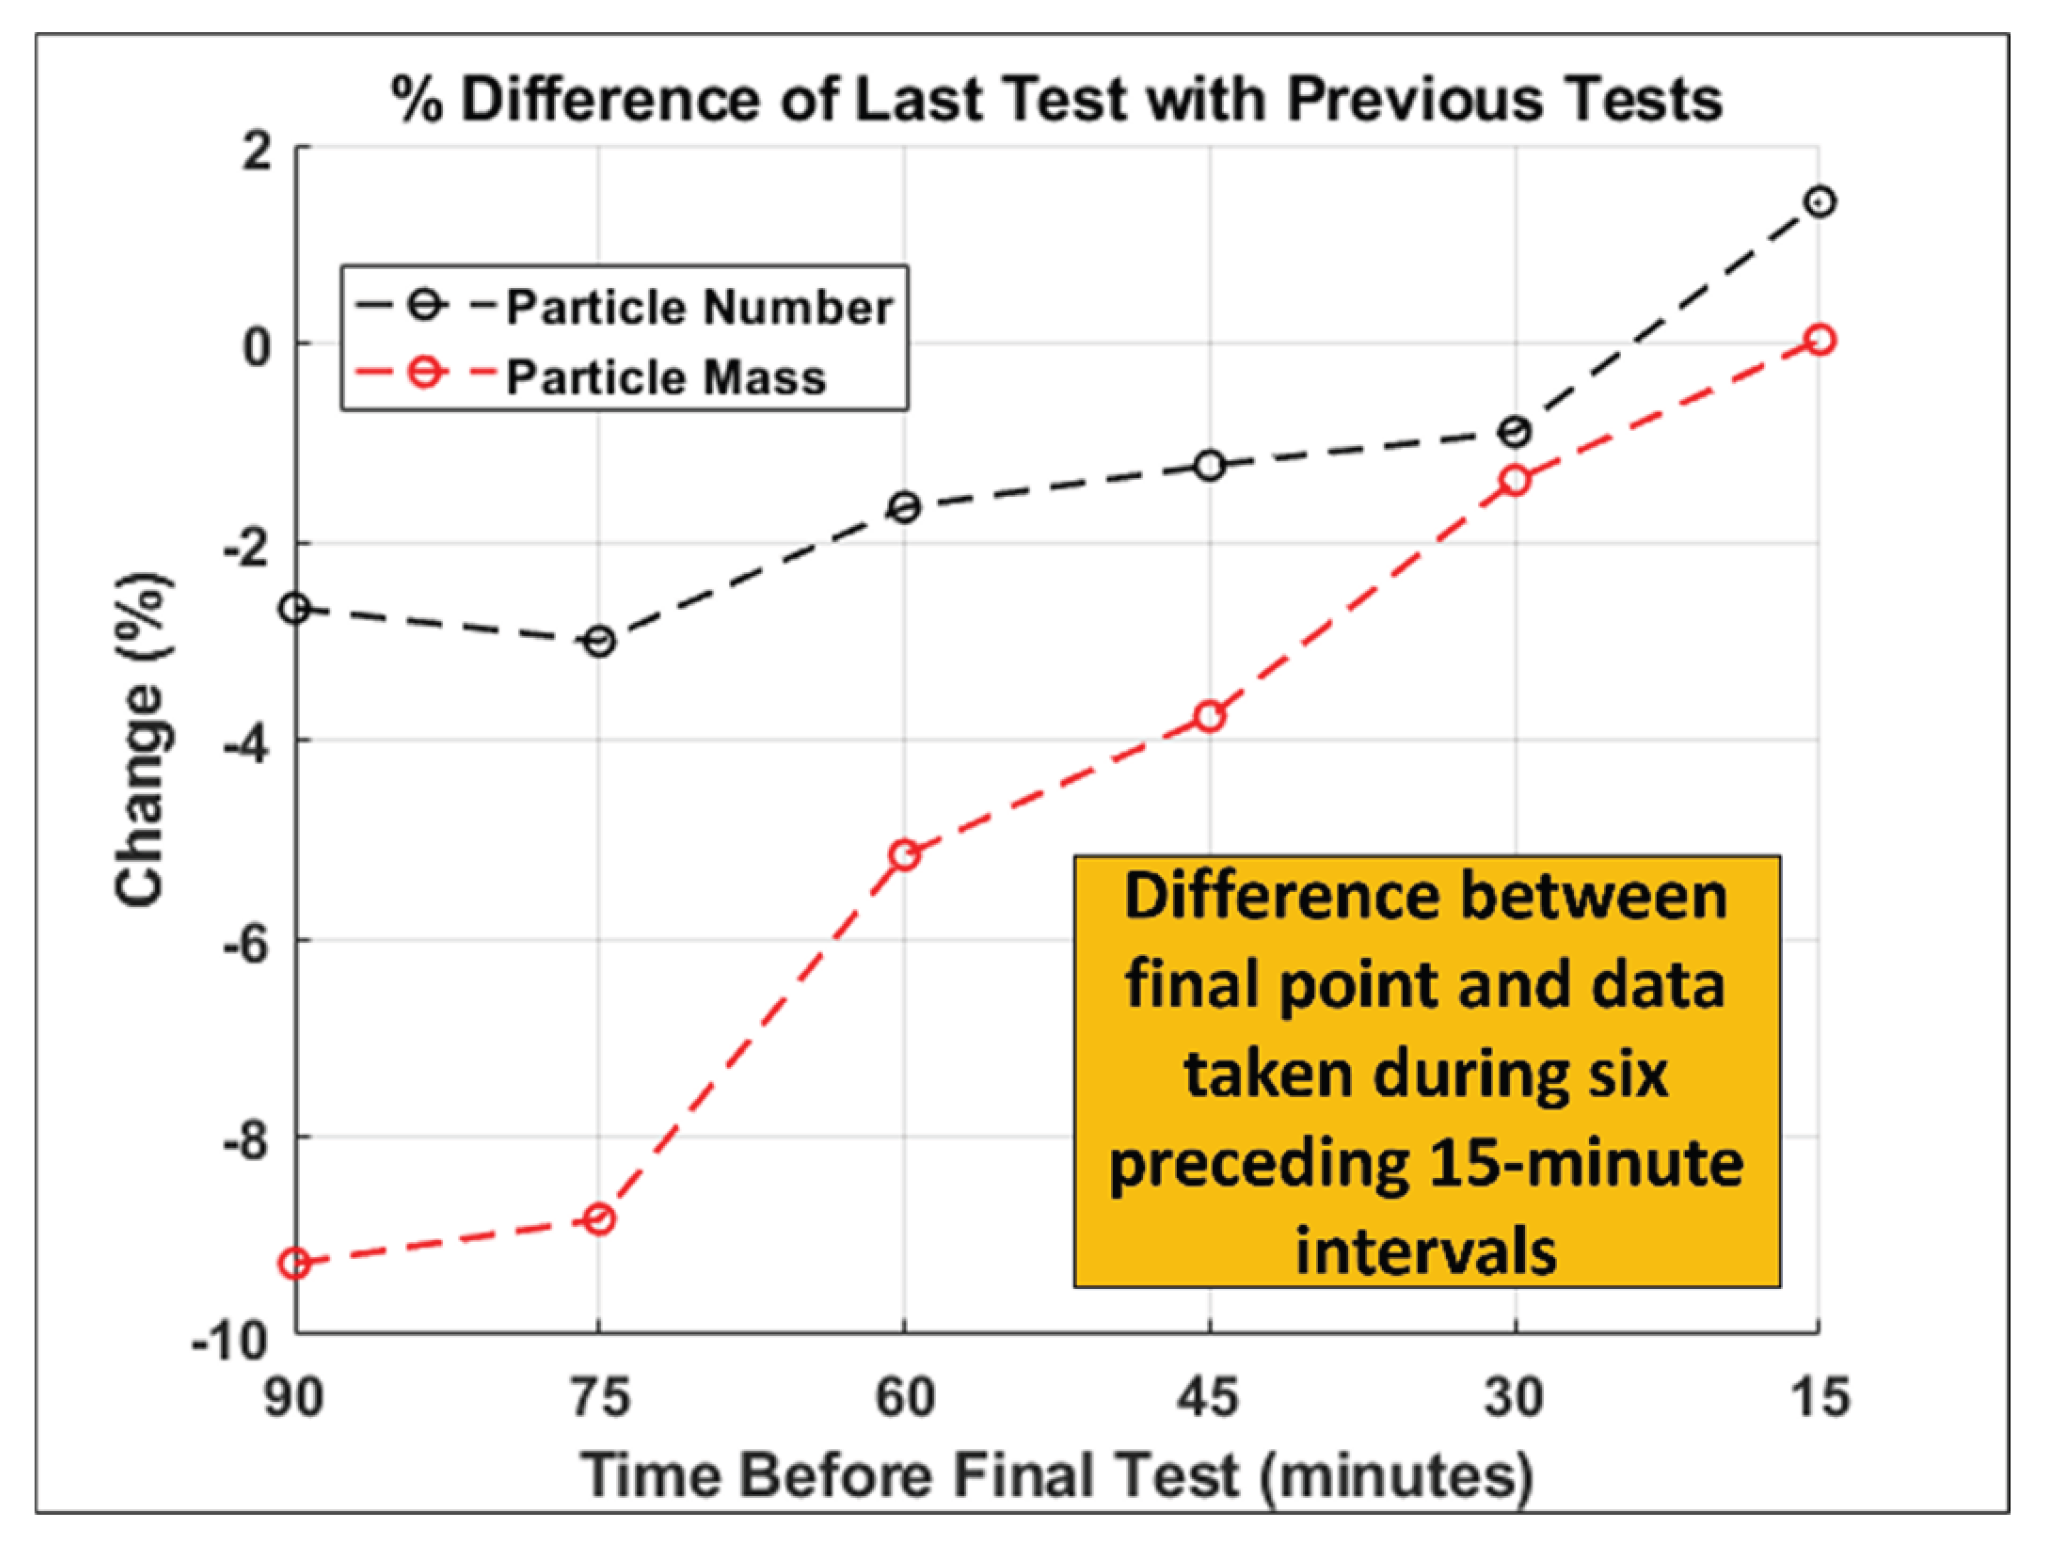
Figure 7.
Particle number as a function of run time at road load (Additive 2-LAC treat rate).
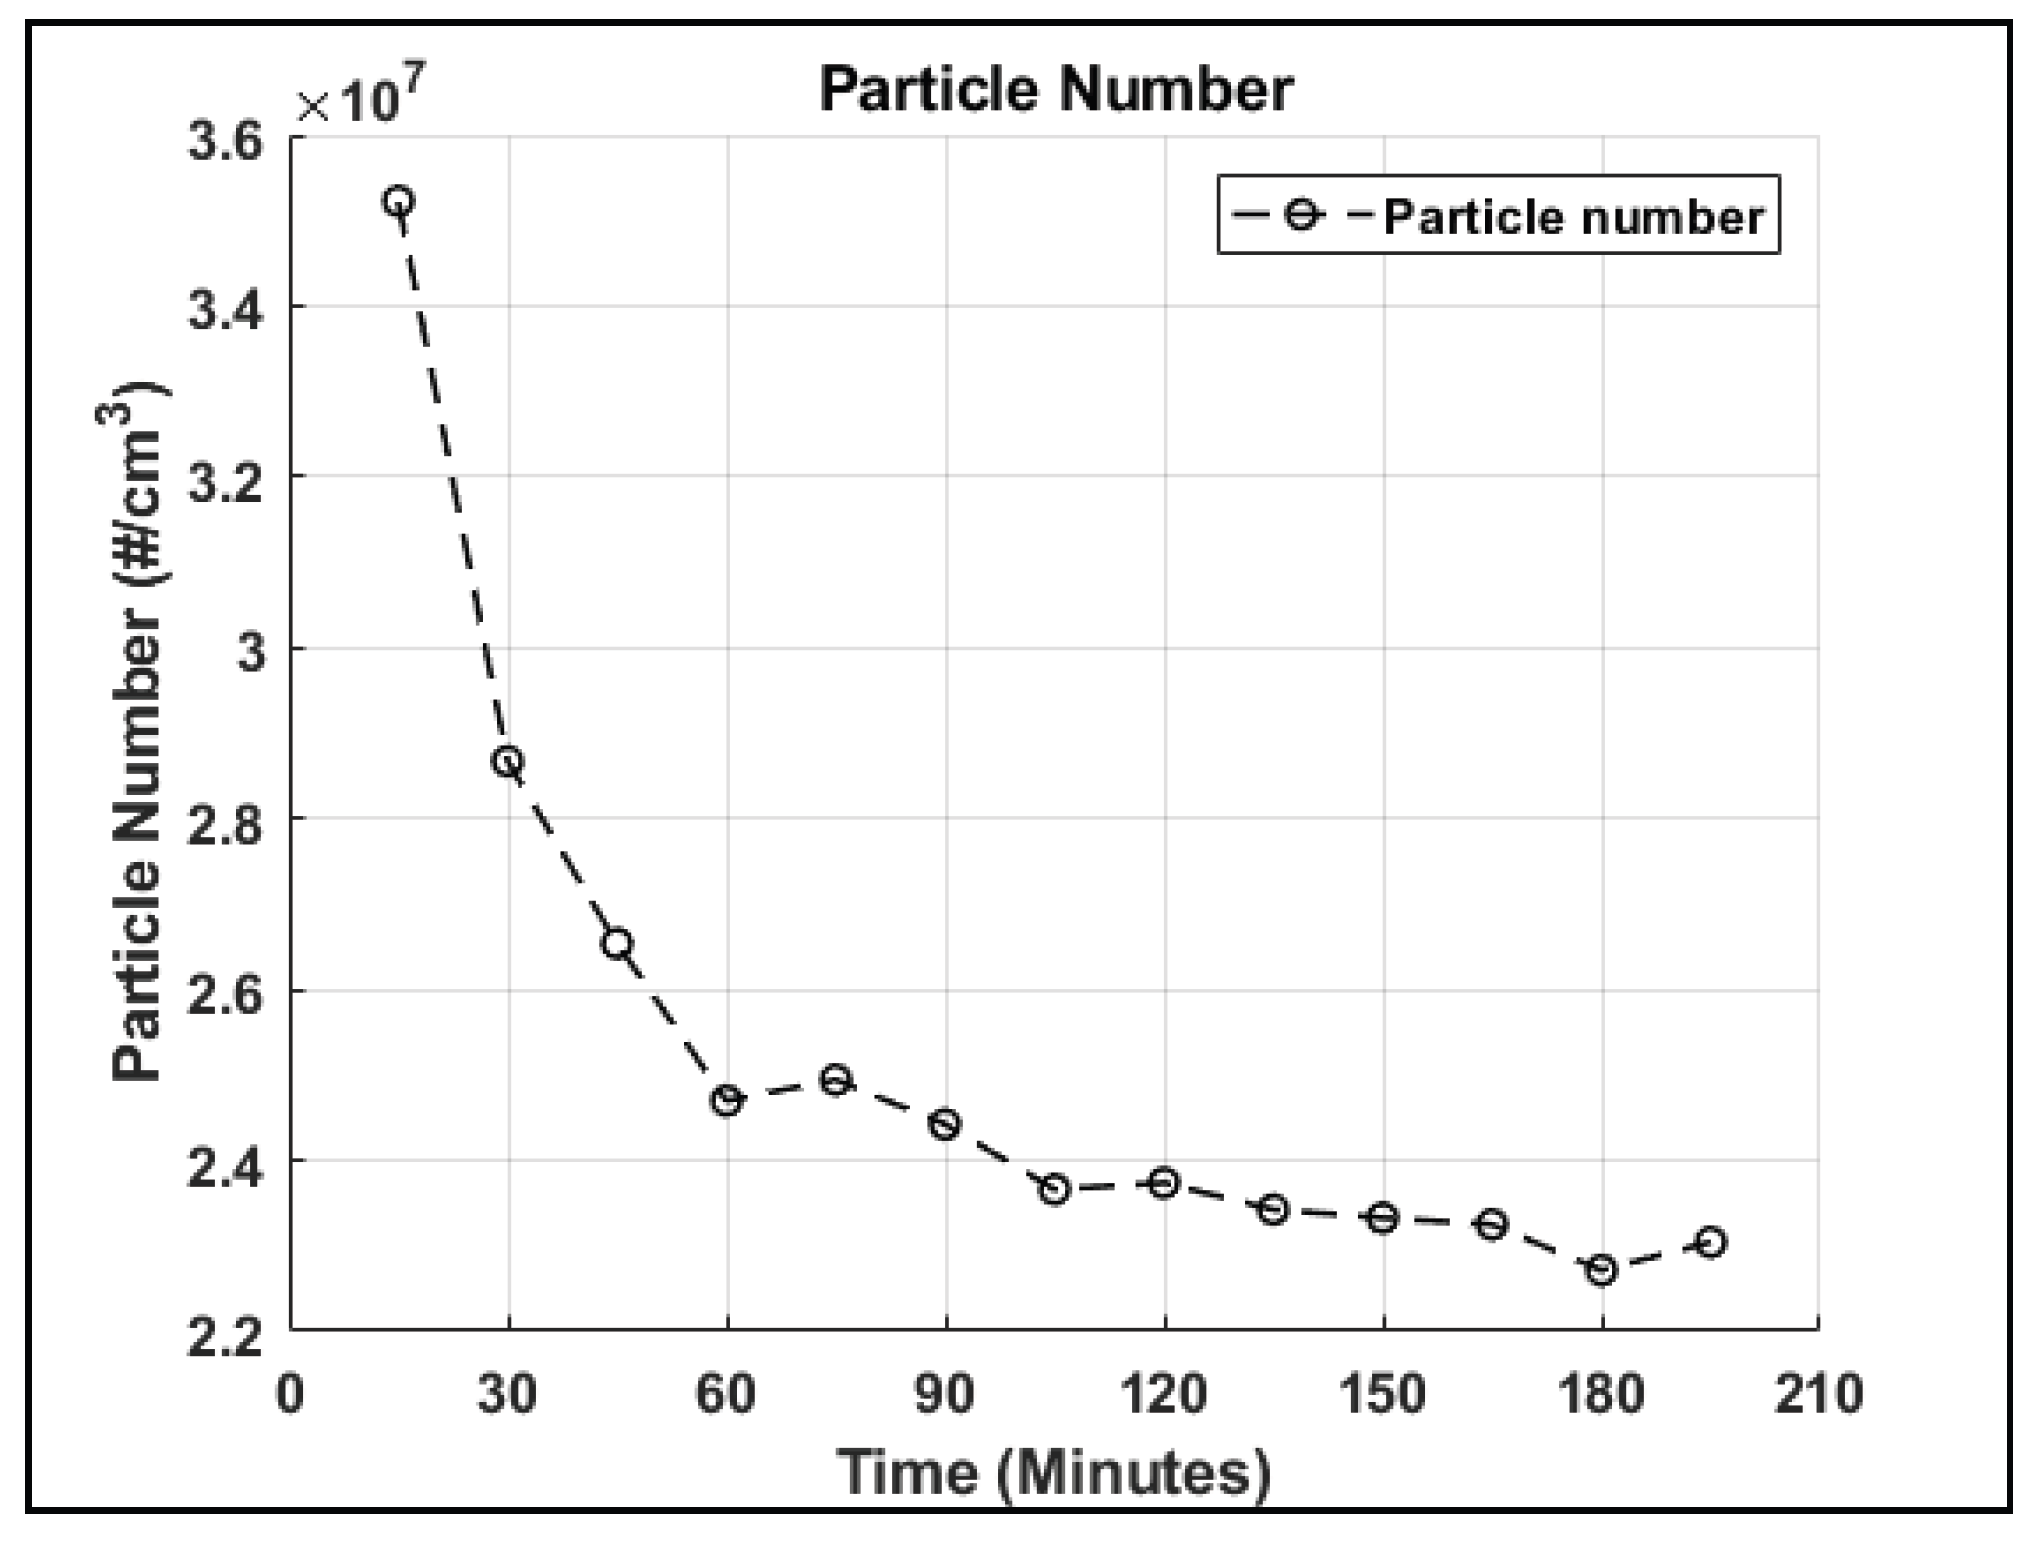
Figure 8.
Particulate mass as a function of run time at road load (Additive 2-LAC treat rate).
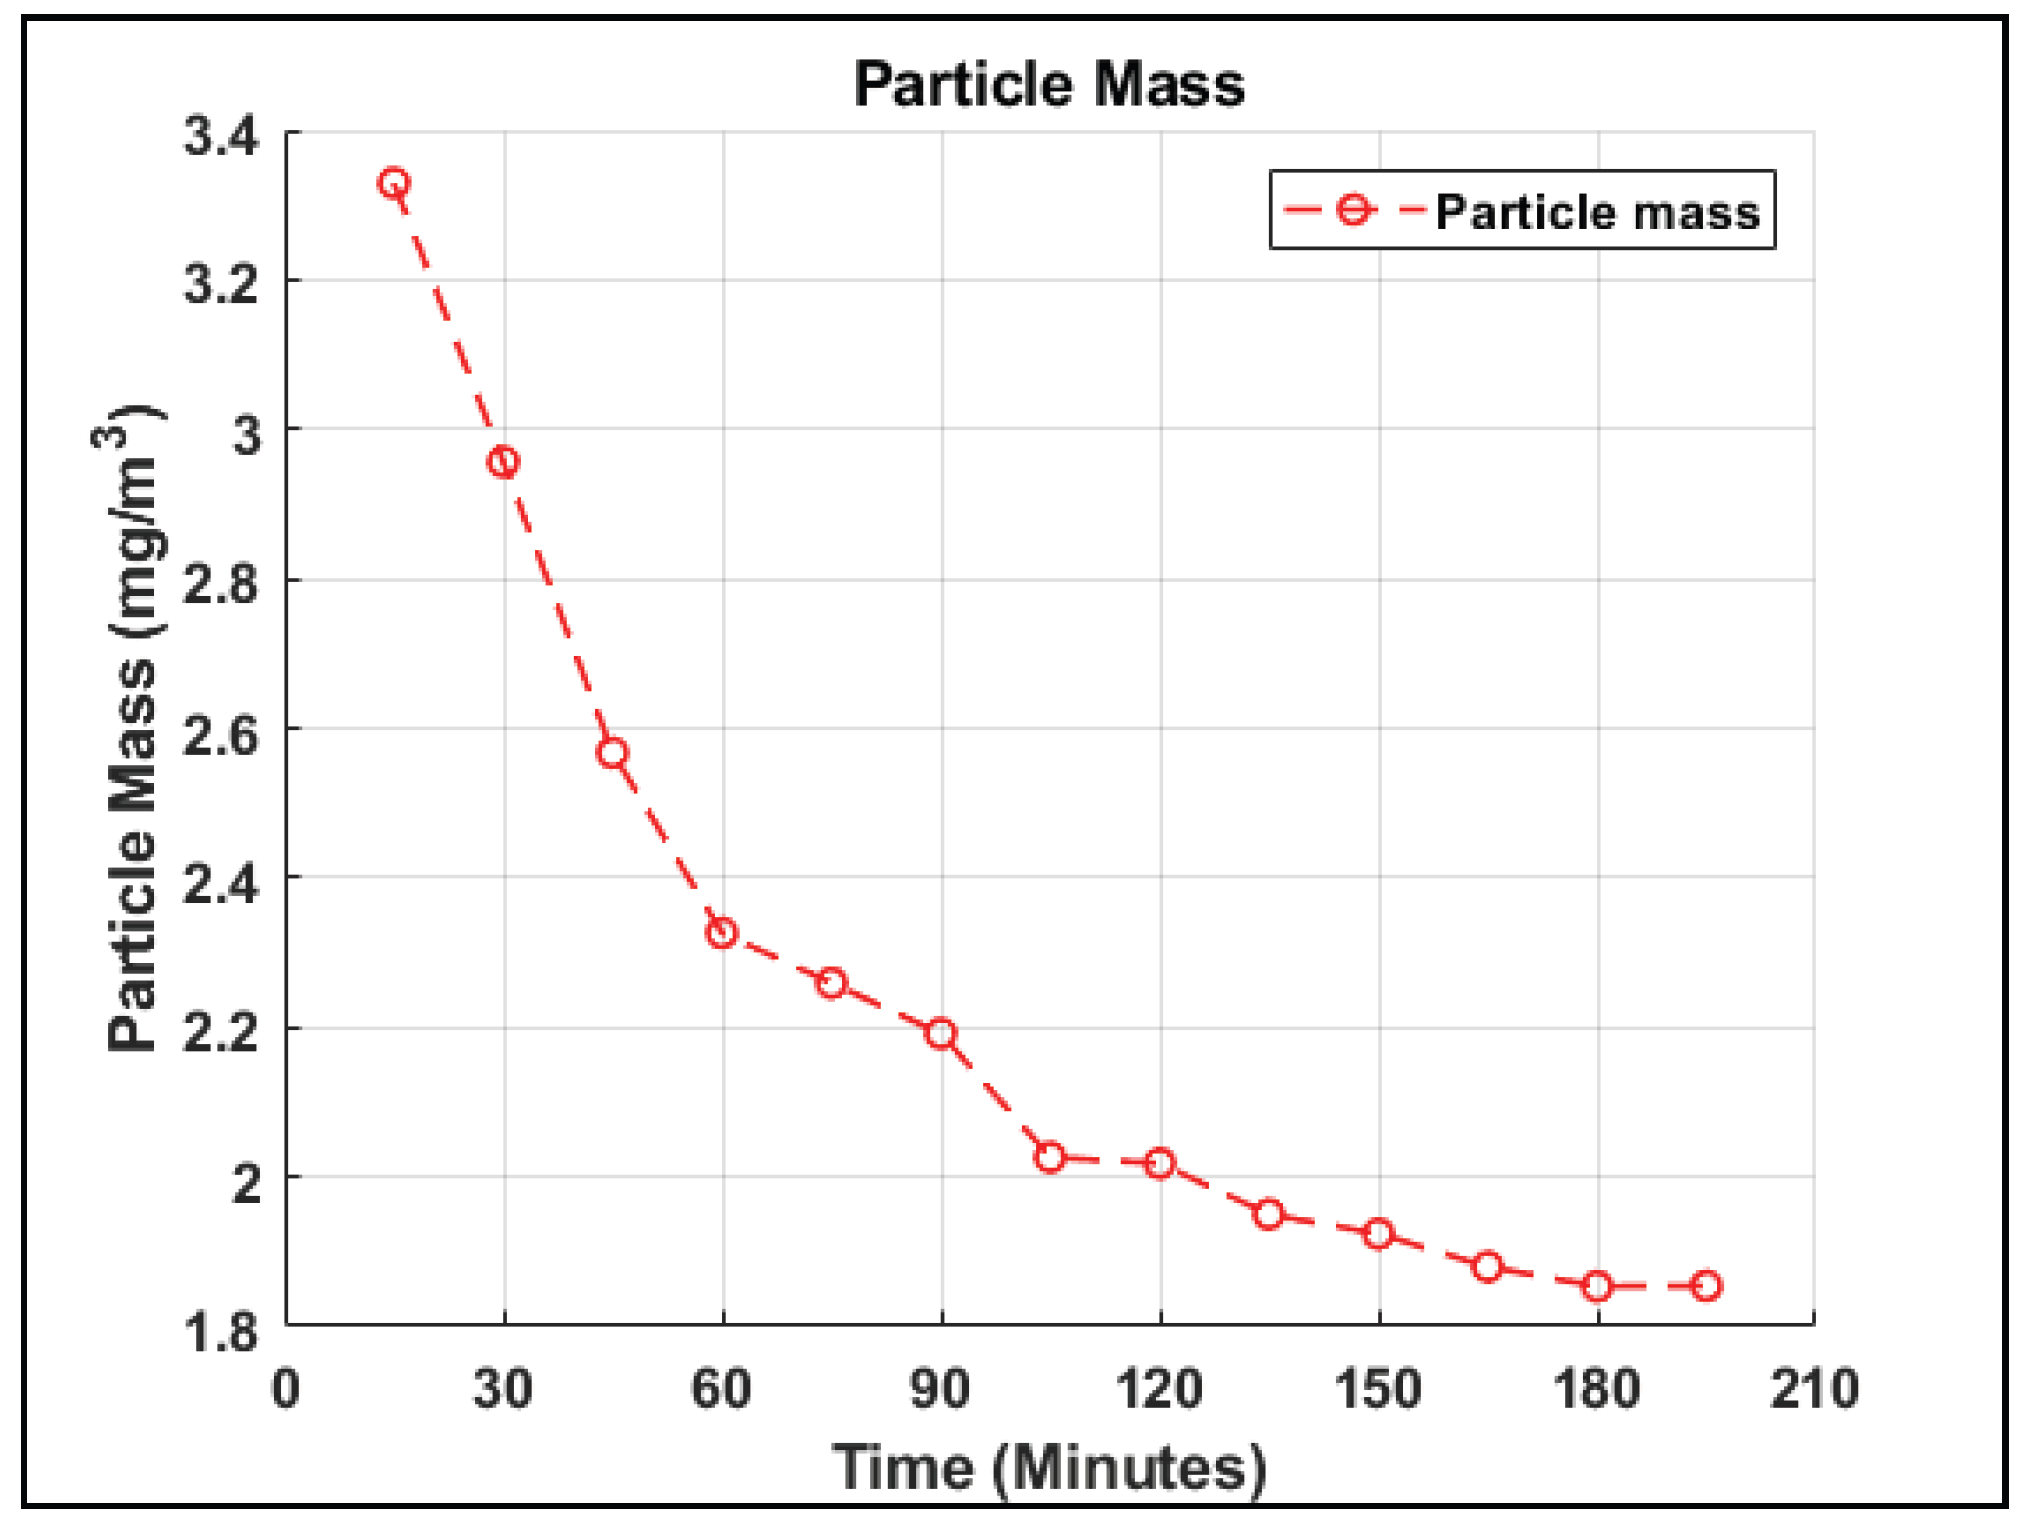
Figure 9.
Test matrix.
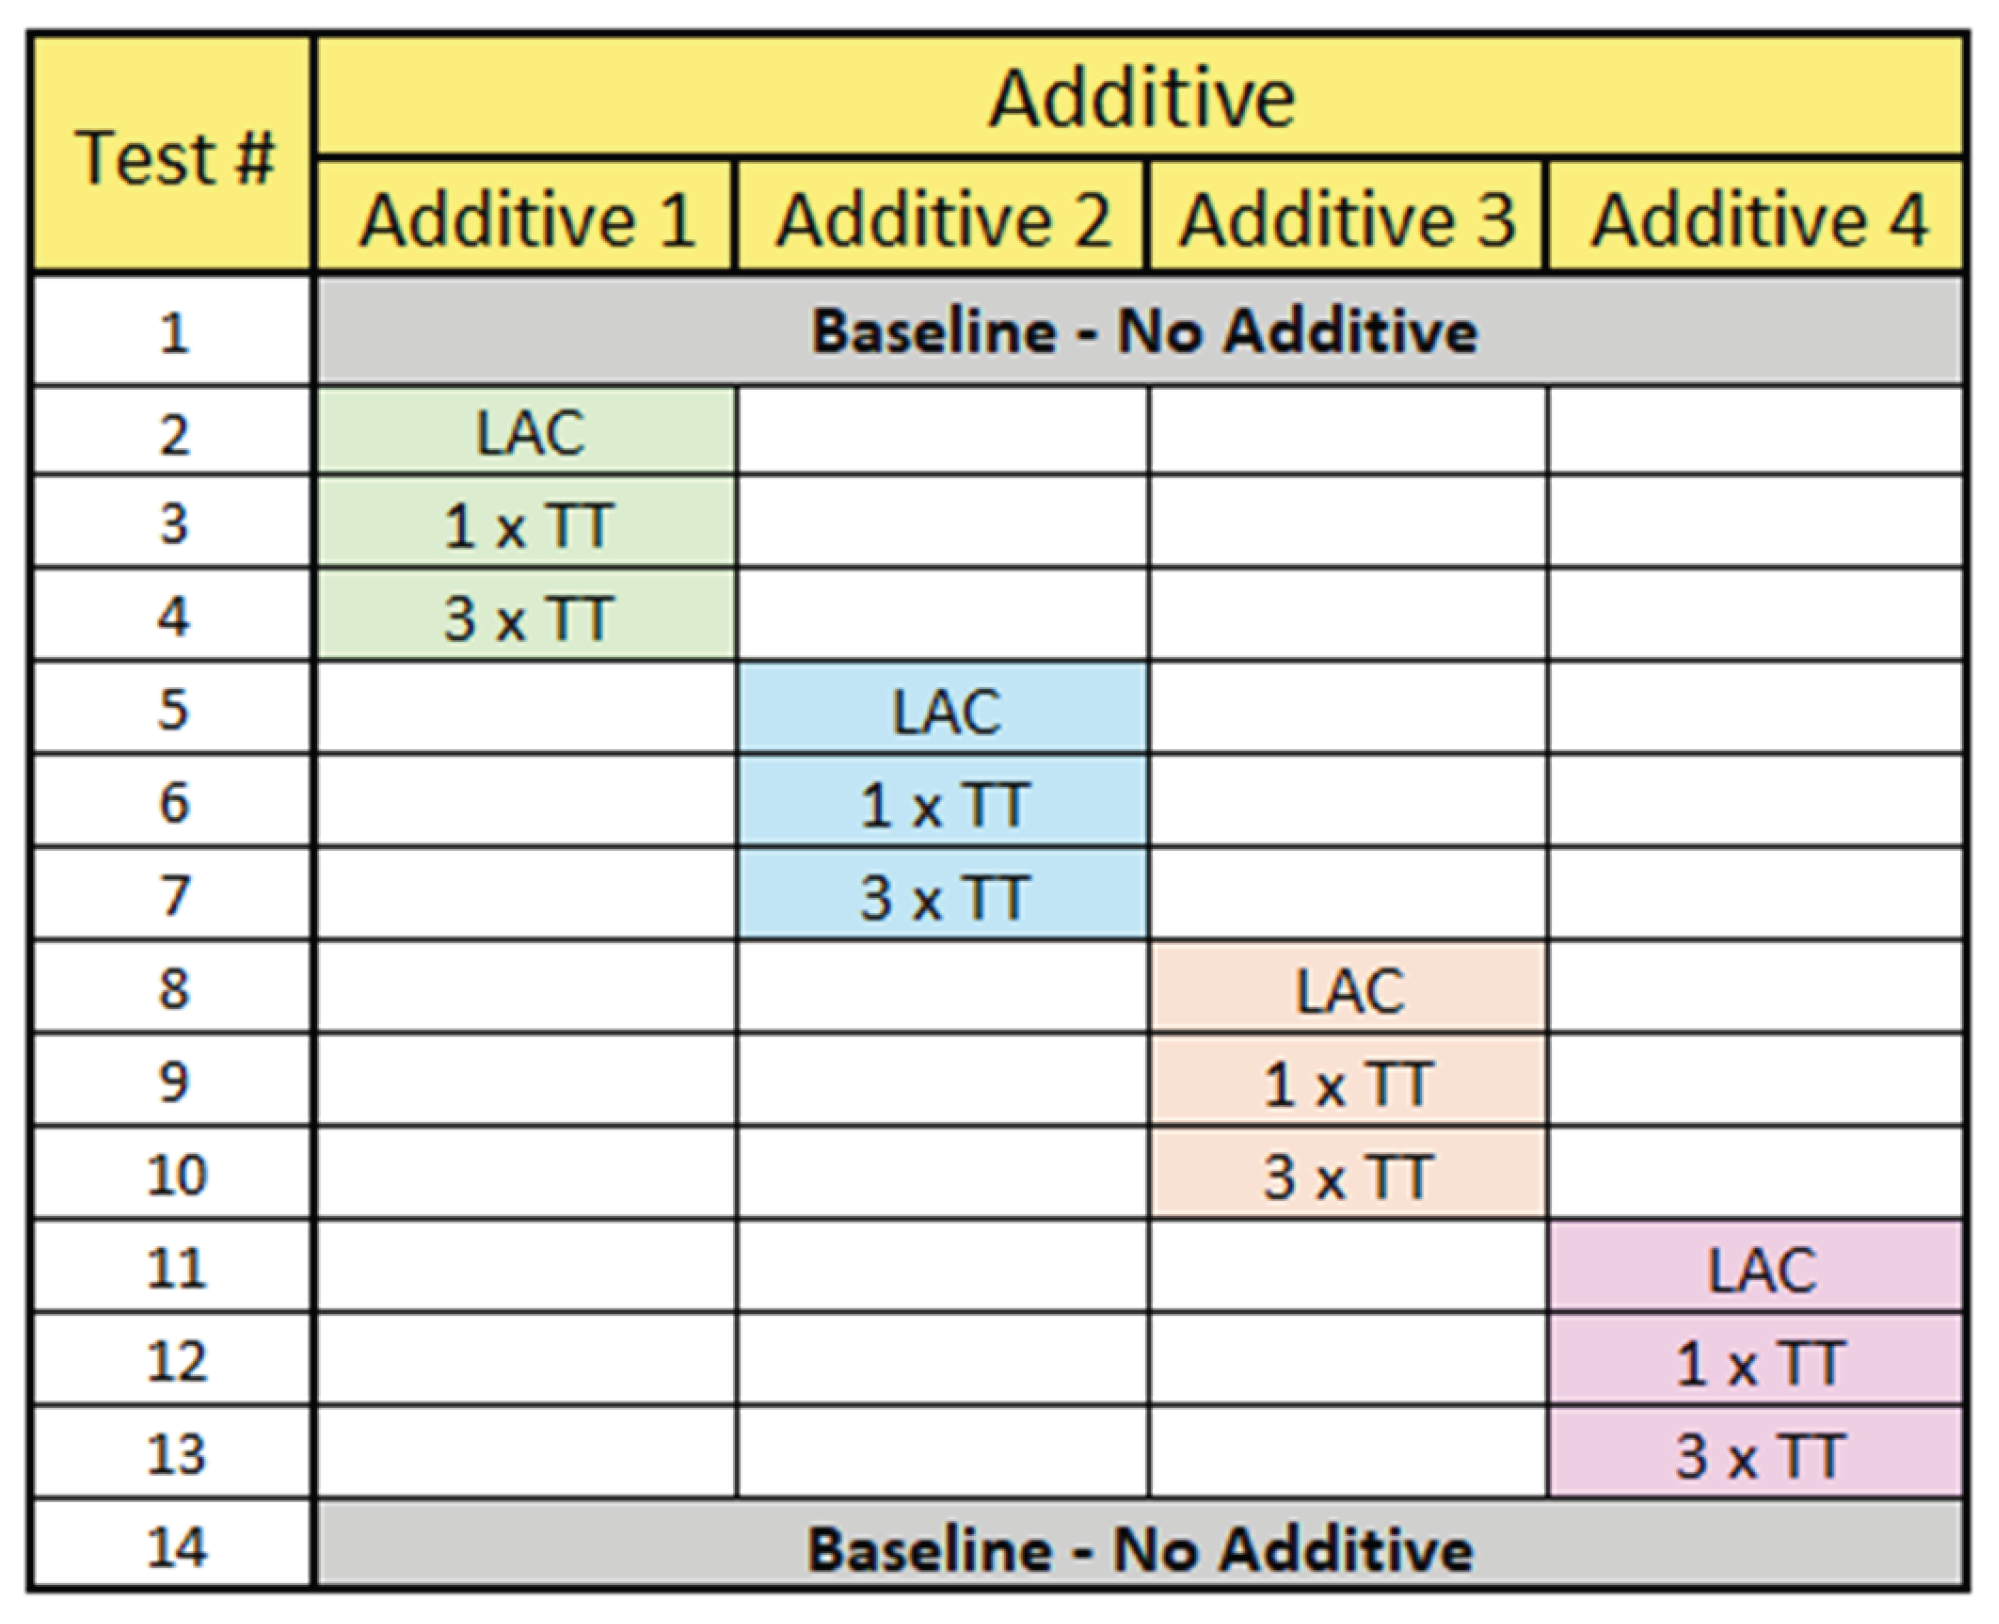
Figure 10.
Primary particle diameter and mobility diameter assigned by EEPS.
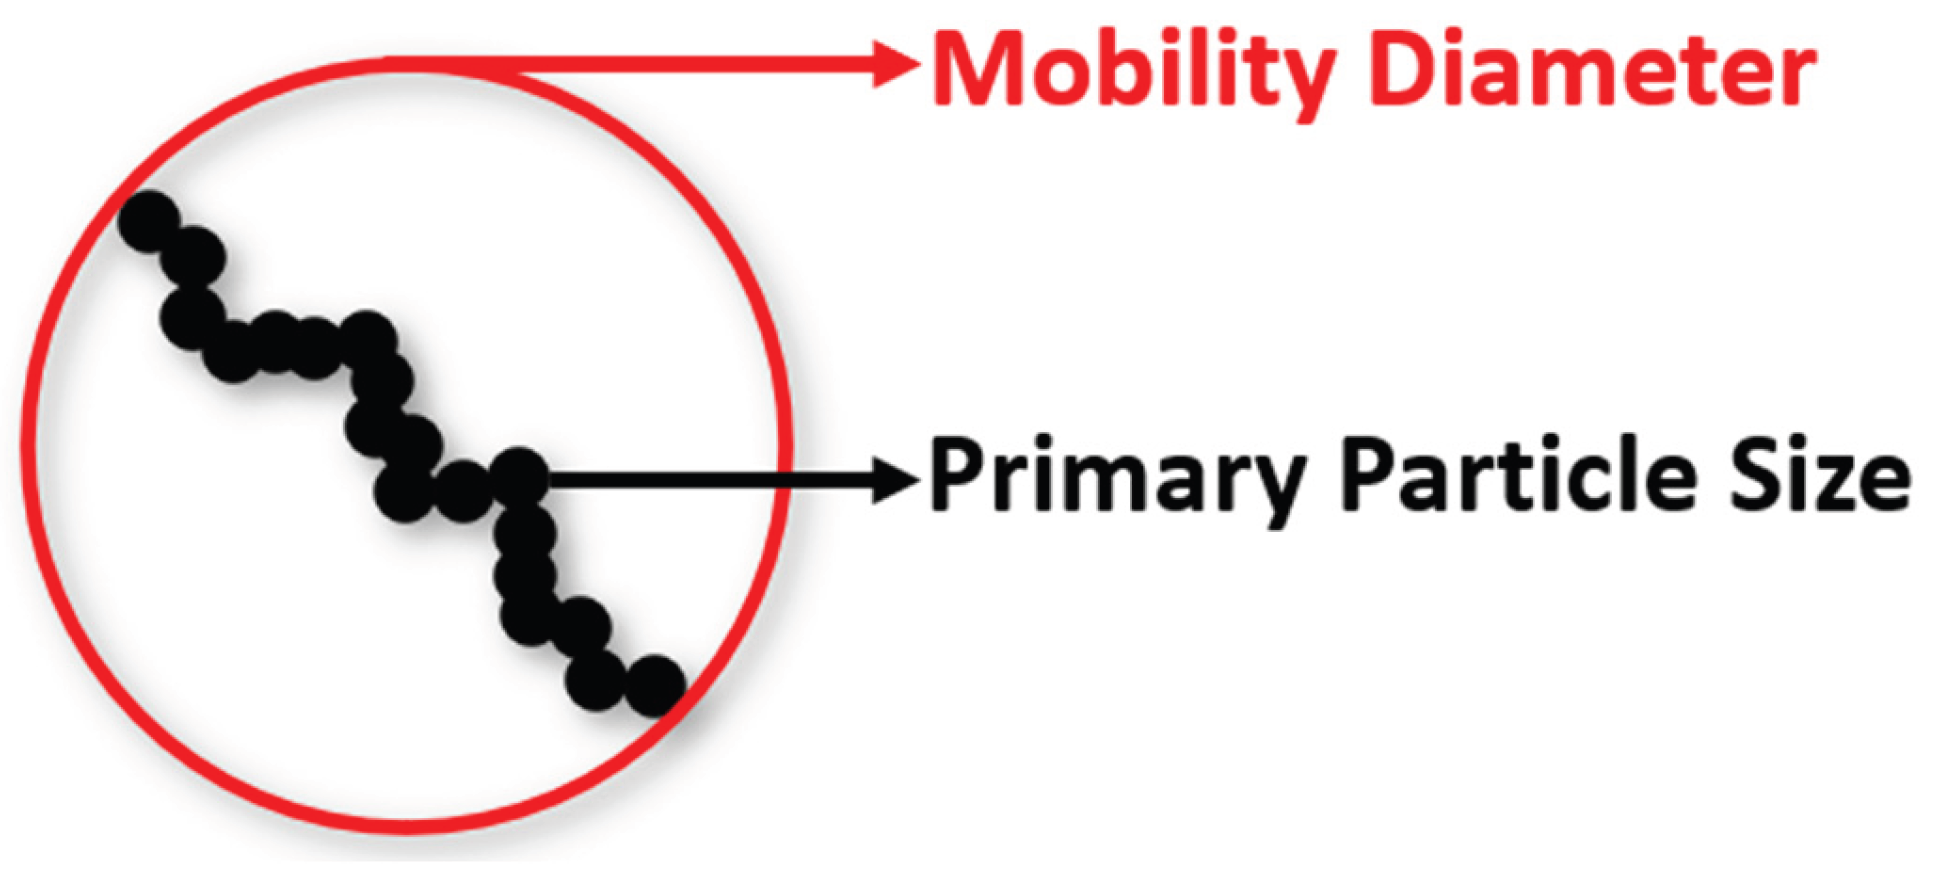
Figure 11.
Total particle number and particulate mass values for the EEPS reference check.
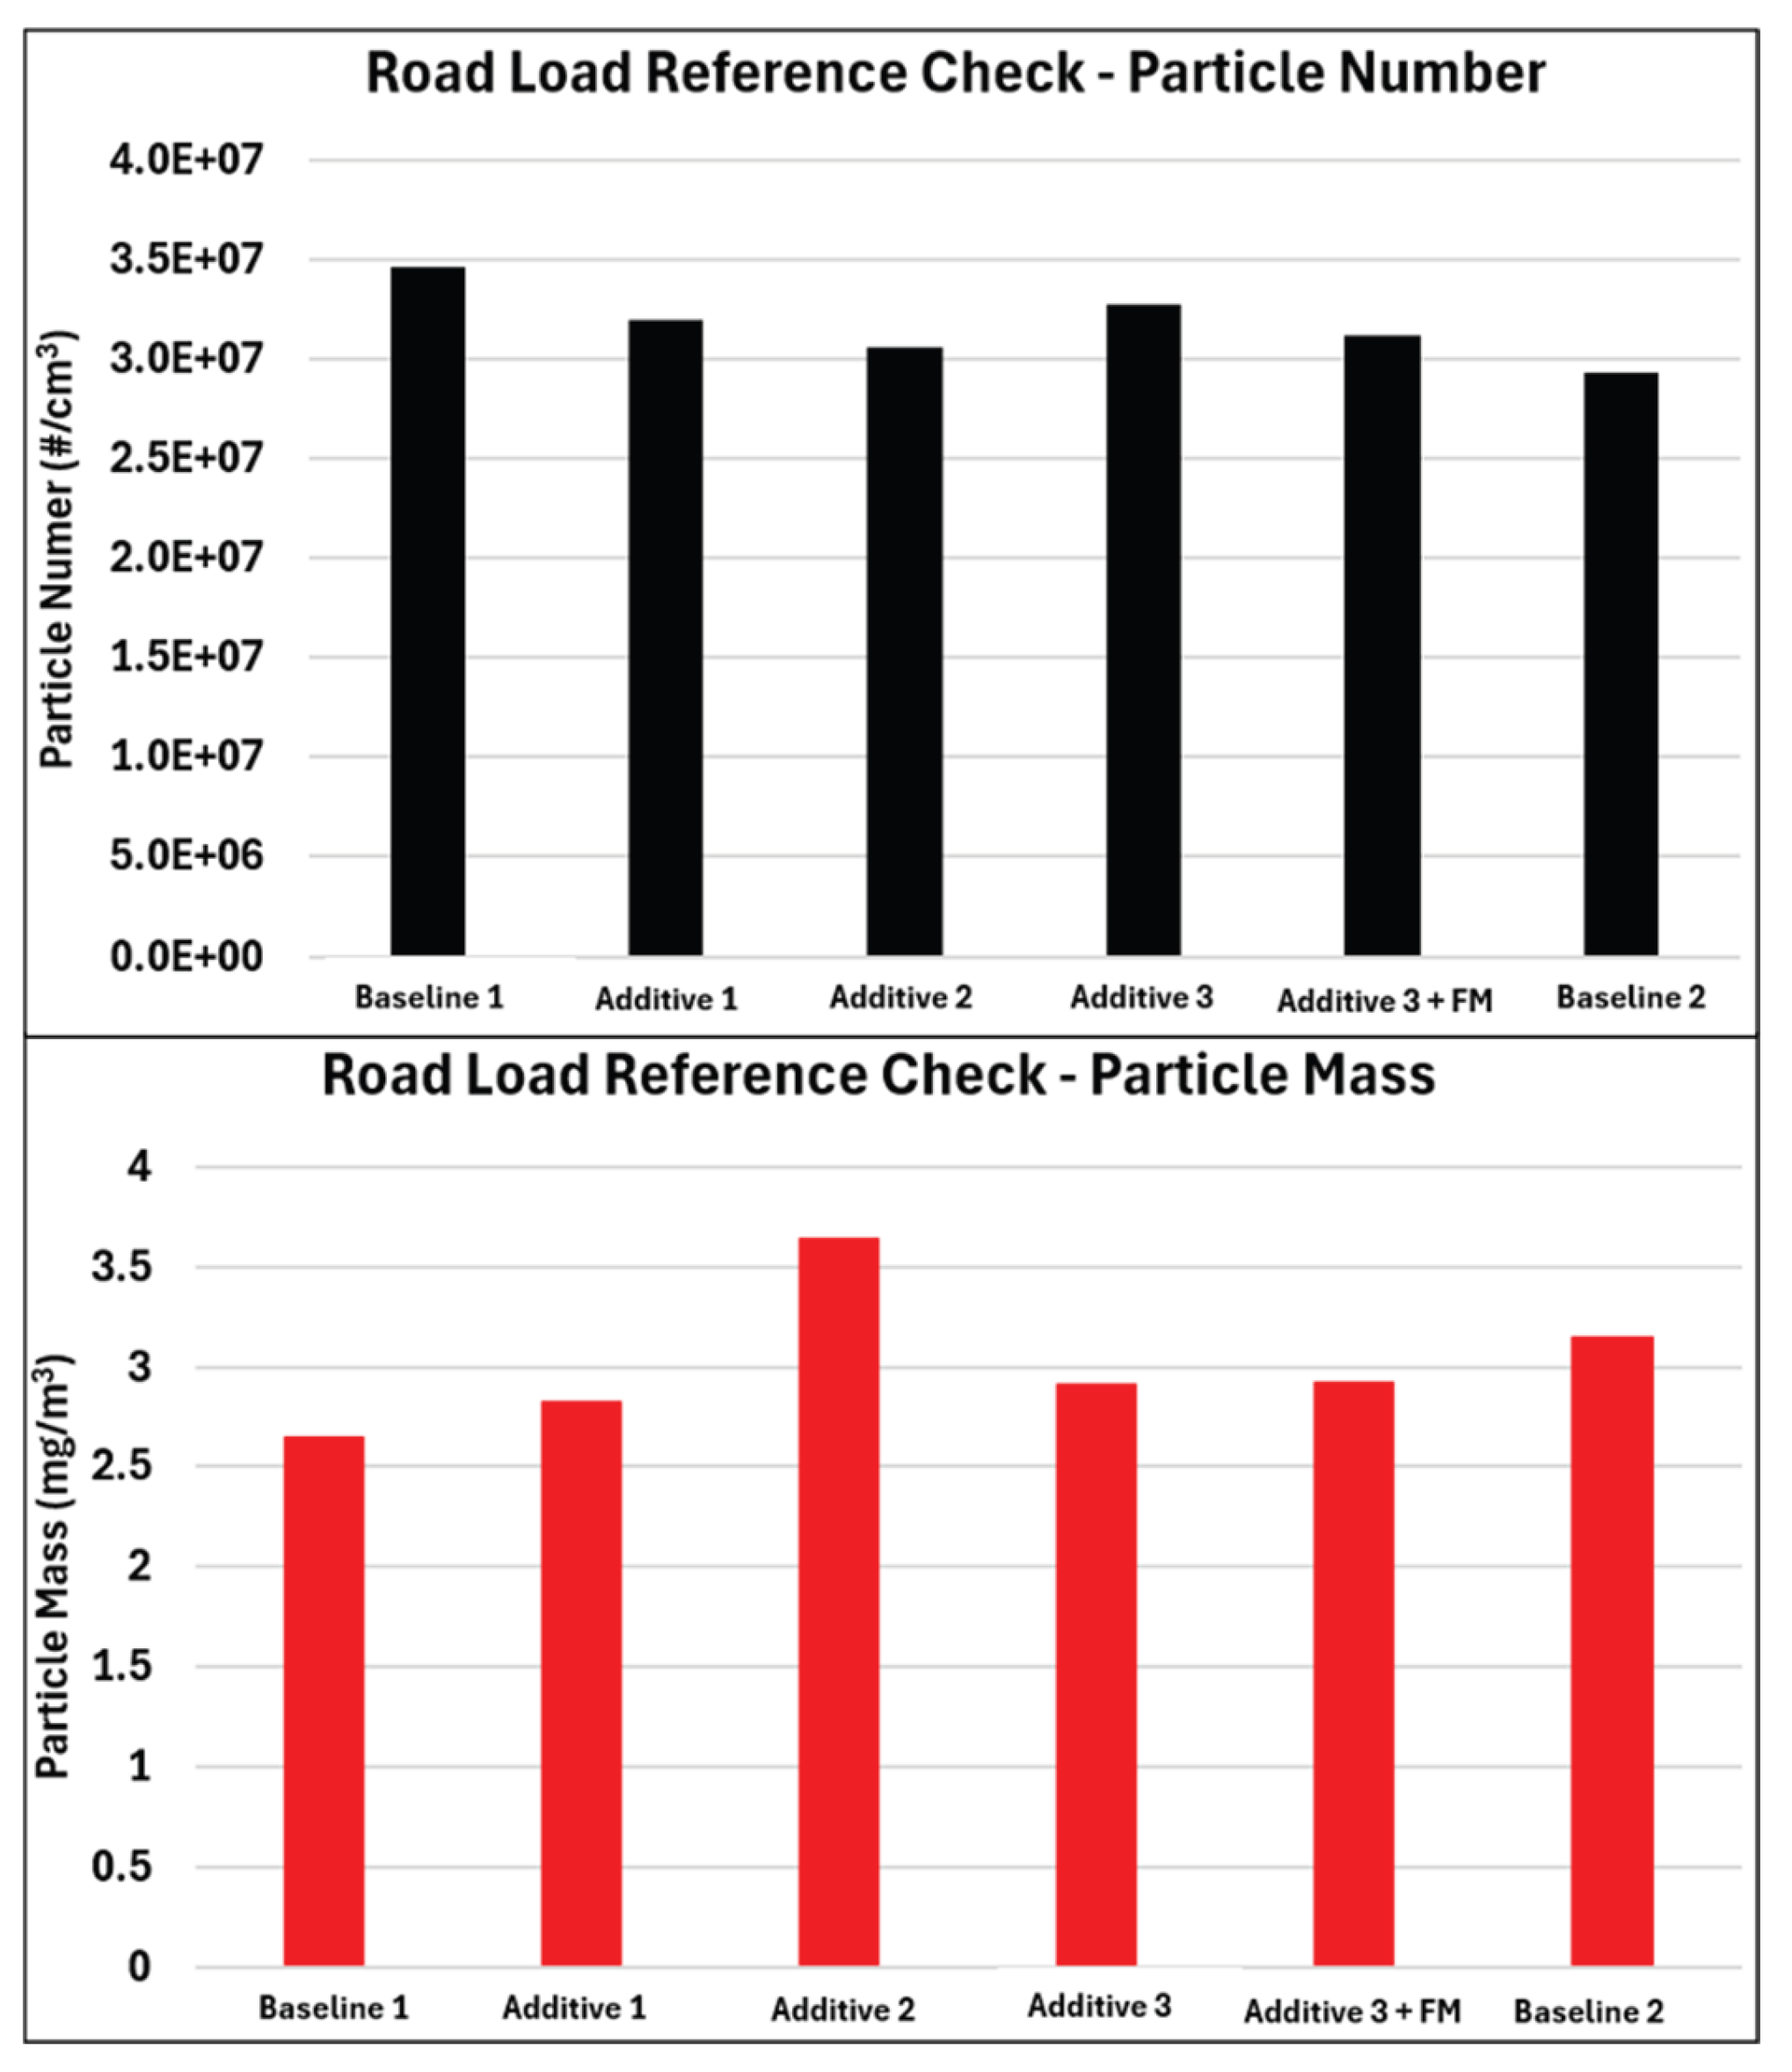
Figure 12.
Particle number and particulate mass based on particle diameter for the EEPS reference check.
Figure 12.
Particle number and particulate mass based on particle diameter for the EEPS reference check.
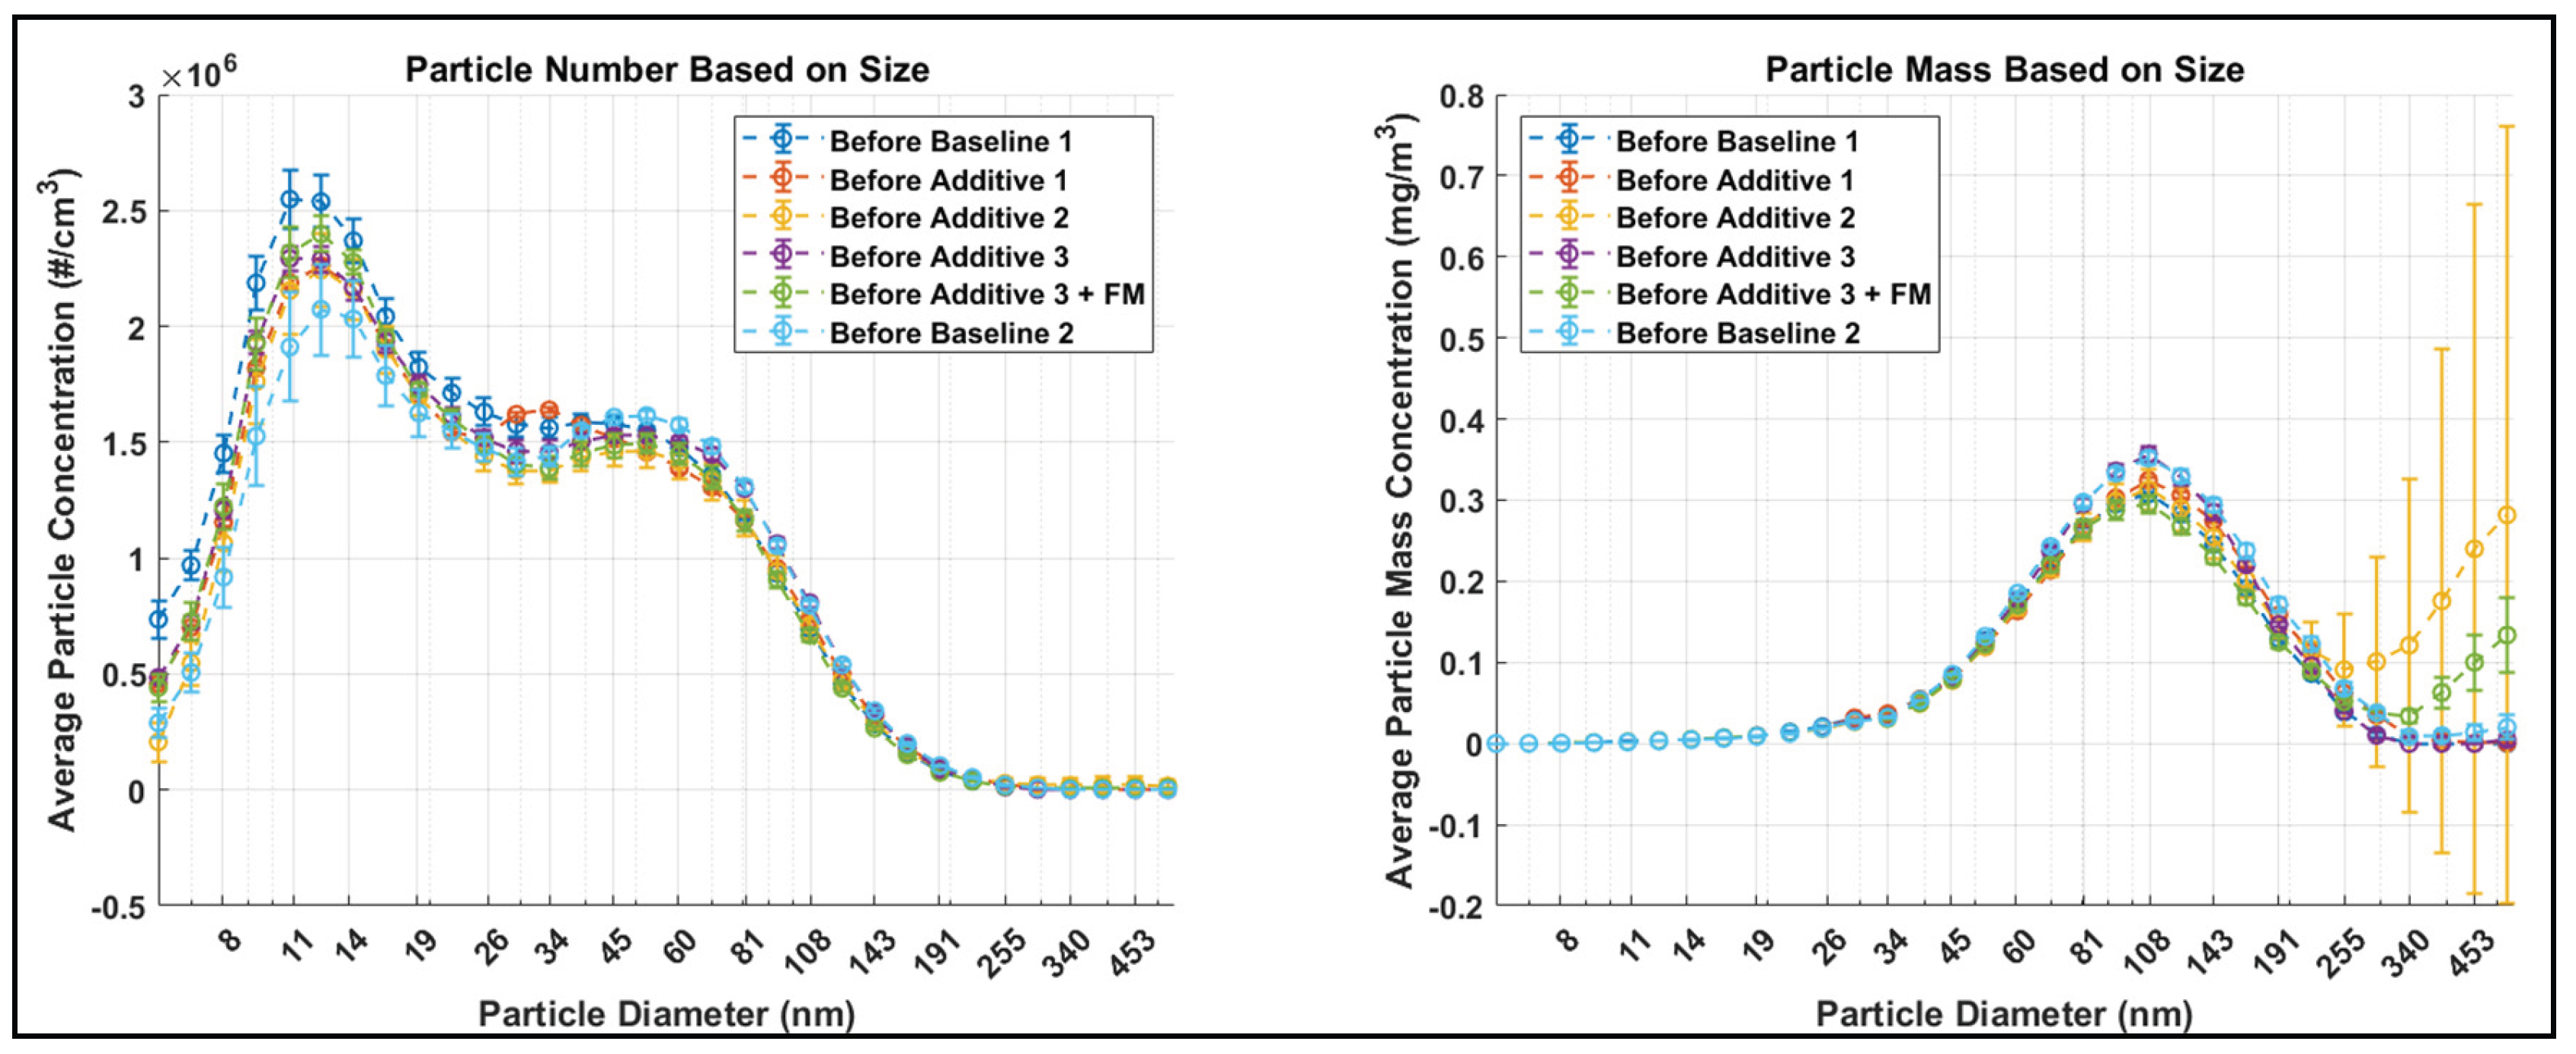
Figure 13.
Settling times for all additive and treat rate combinations.
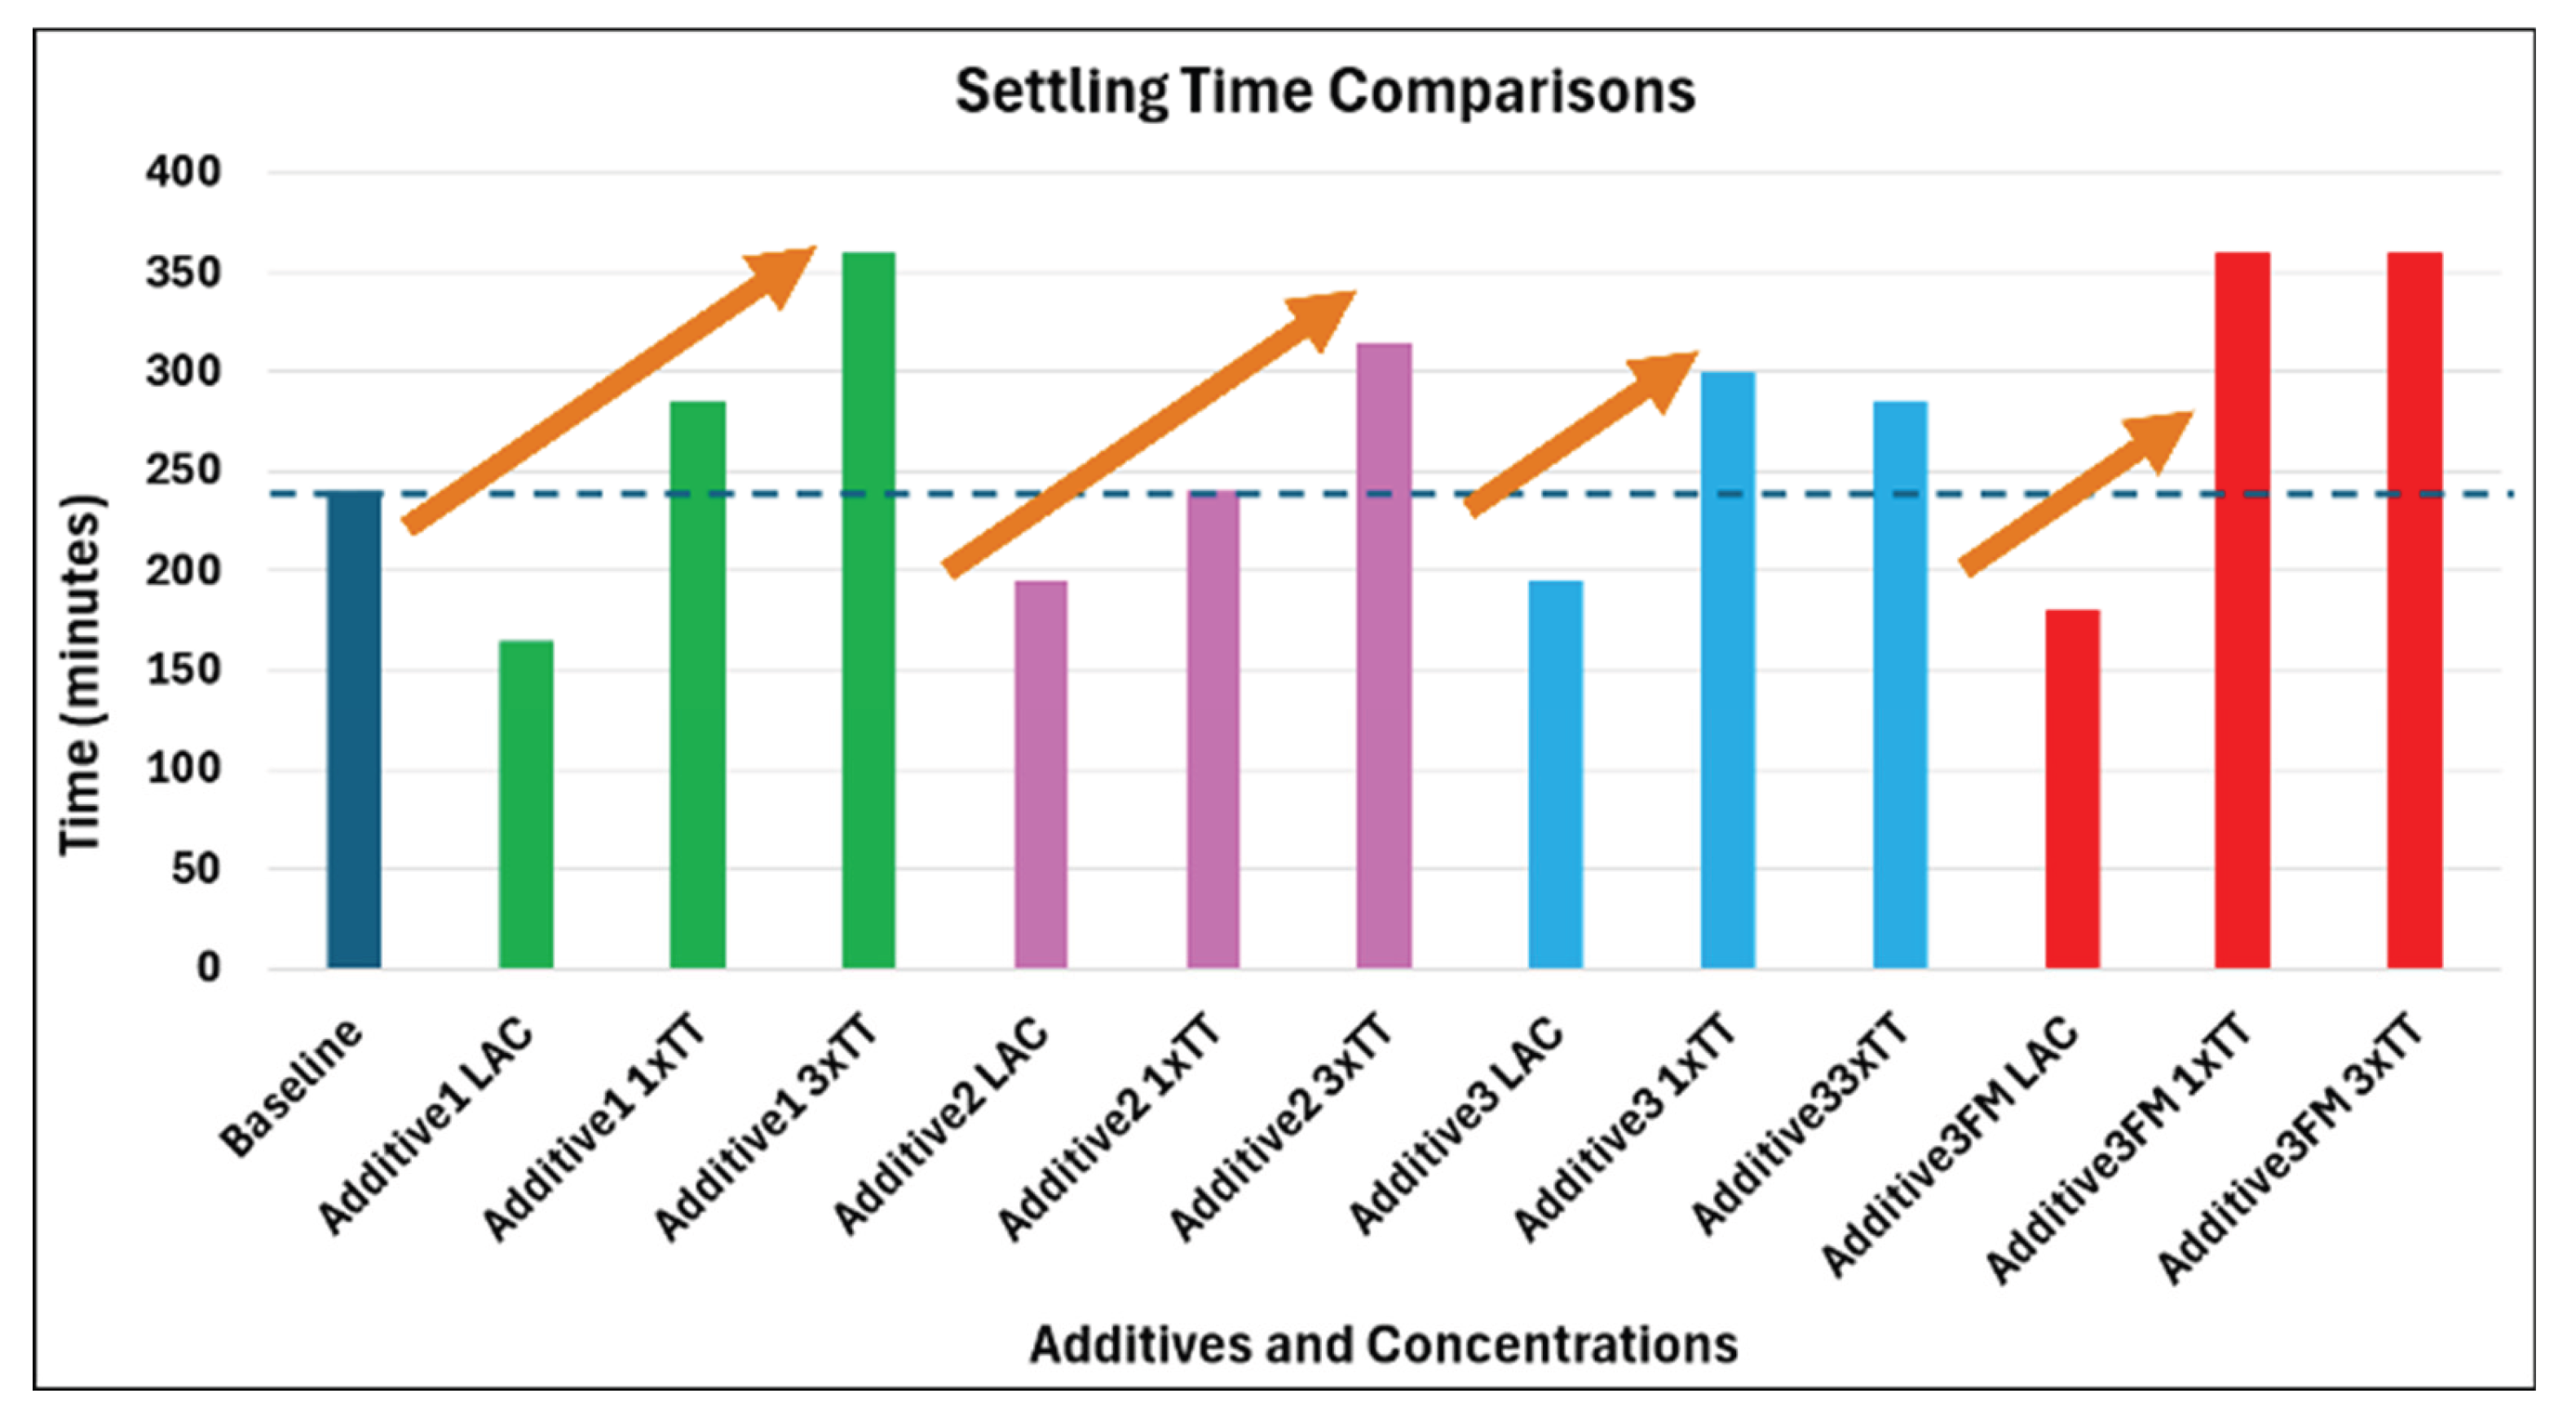
Figure 14.
Data collection in 15-minute blocks.
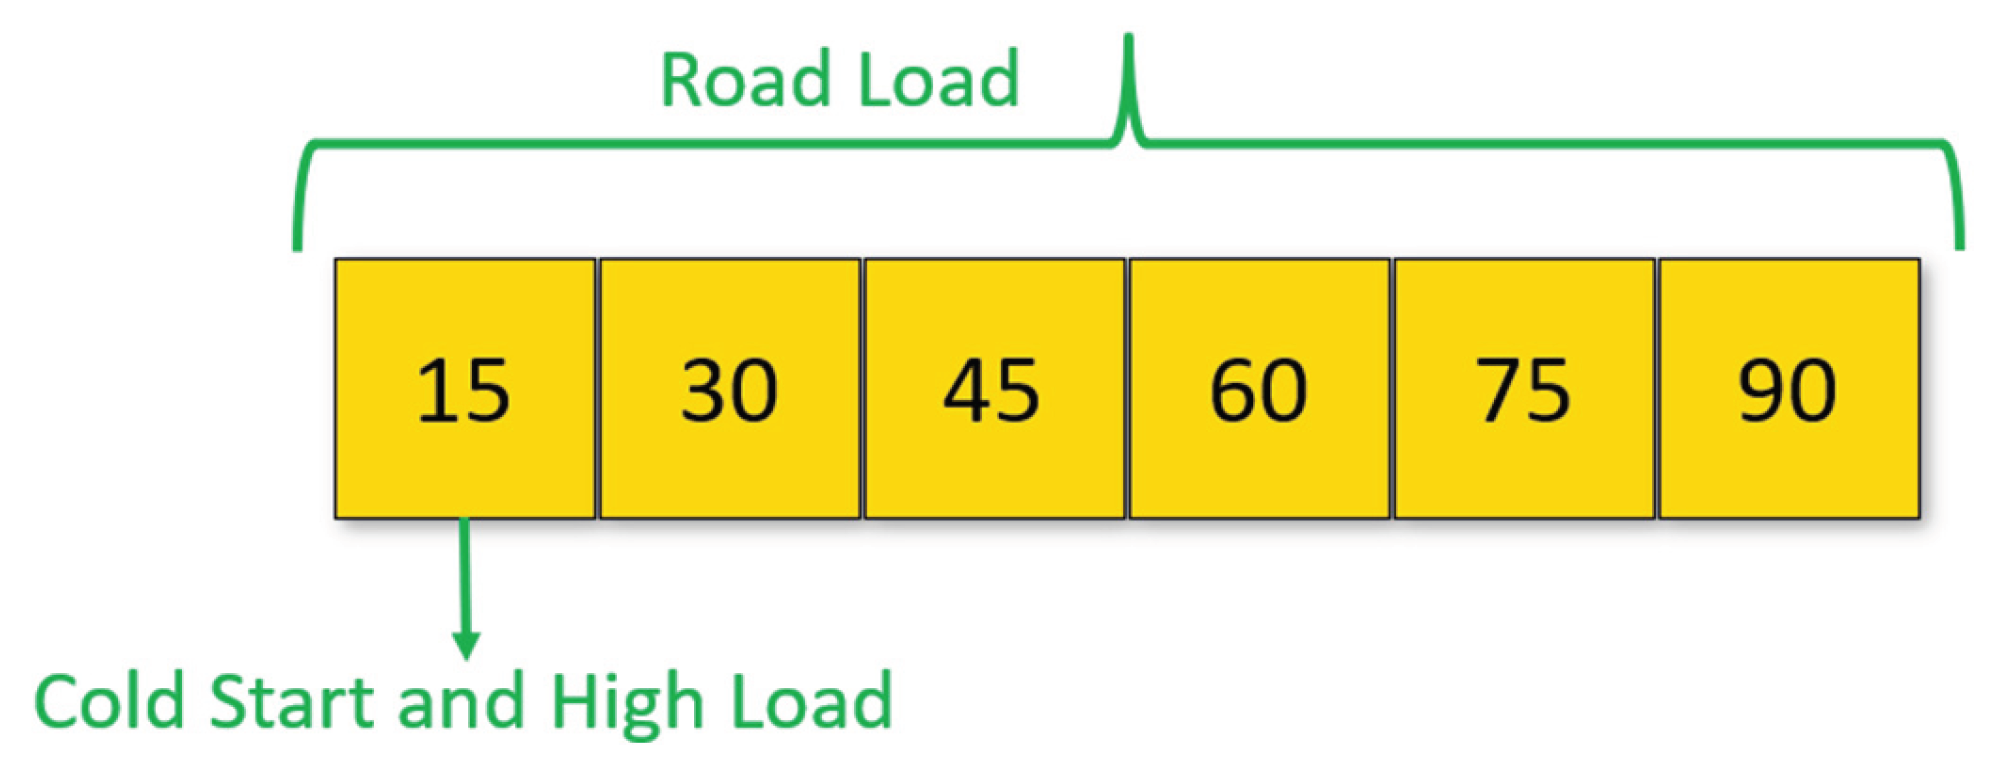
Figure 15.
PM-PN emissions at the Road Load condition.

Figure 16.
PM-PN emissions at the Cold Start condition.
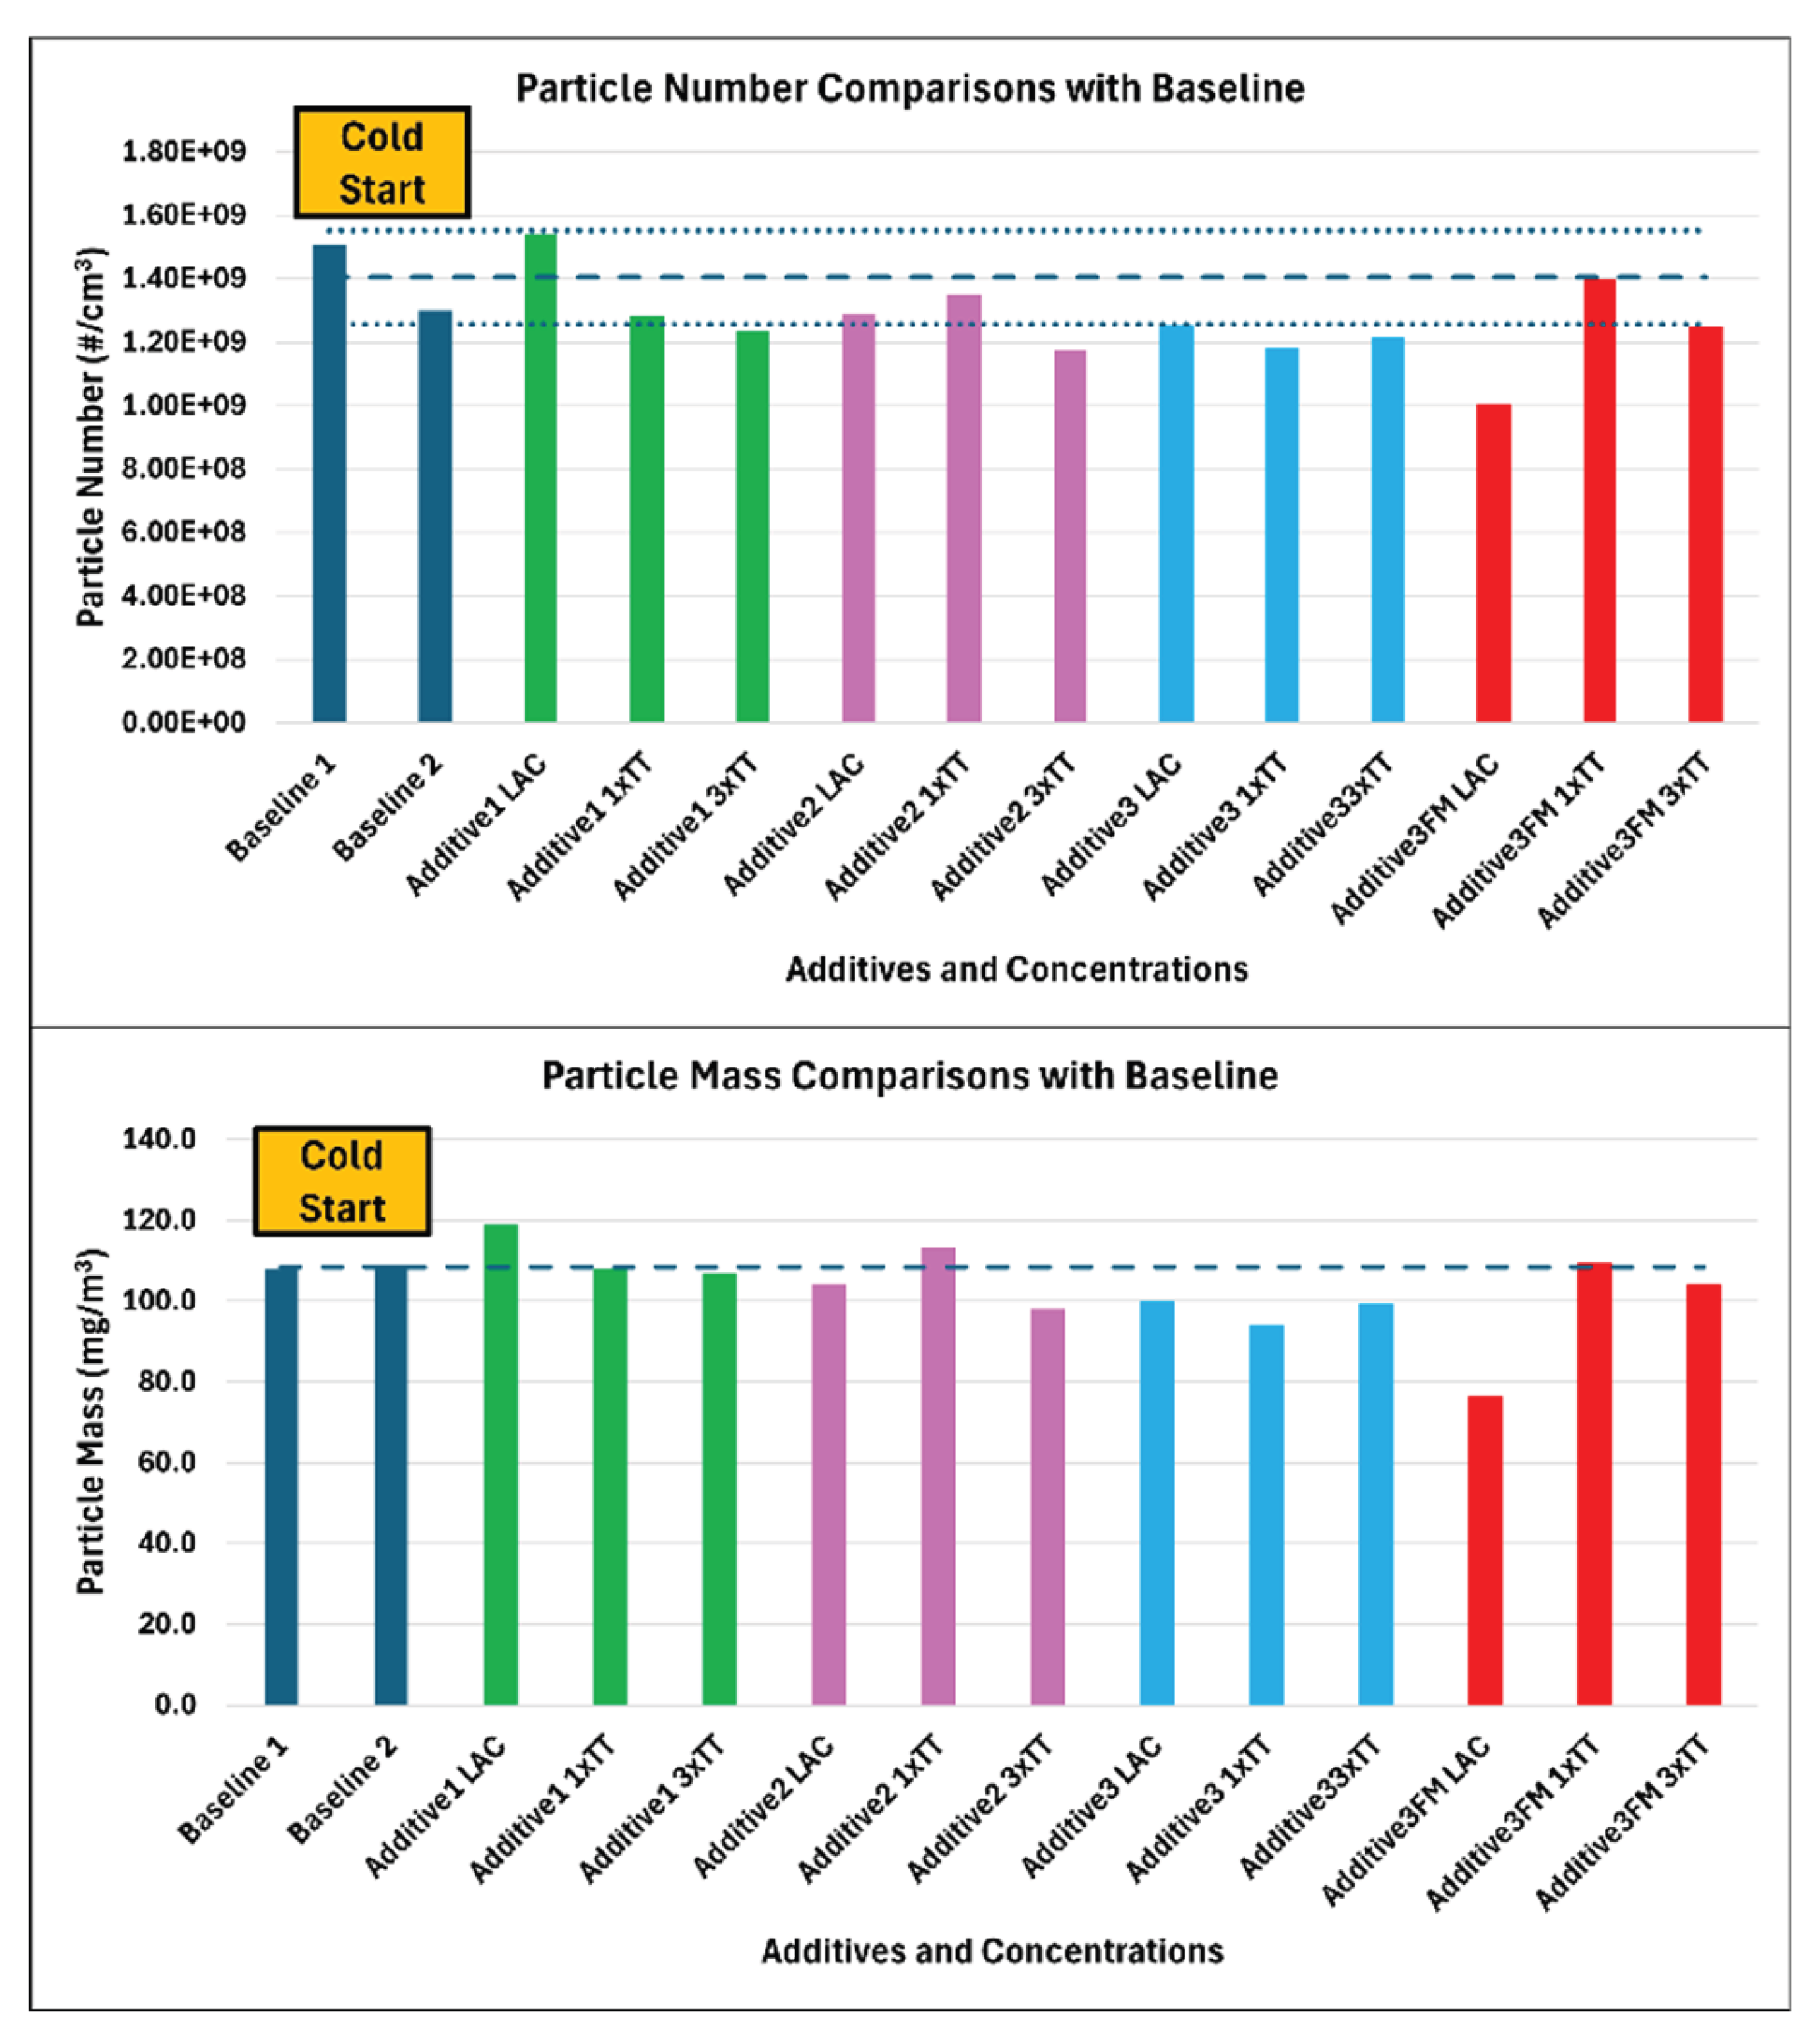
Figure 17.
PM-PN emissions at the High Load condition.
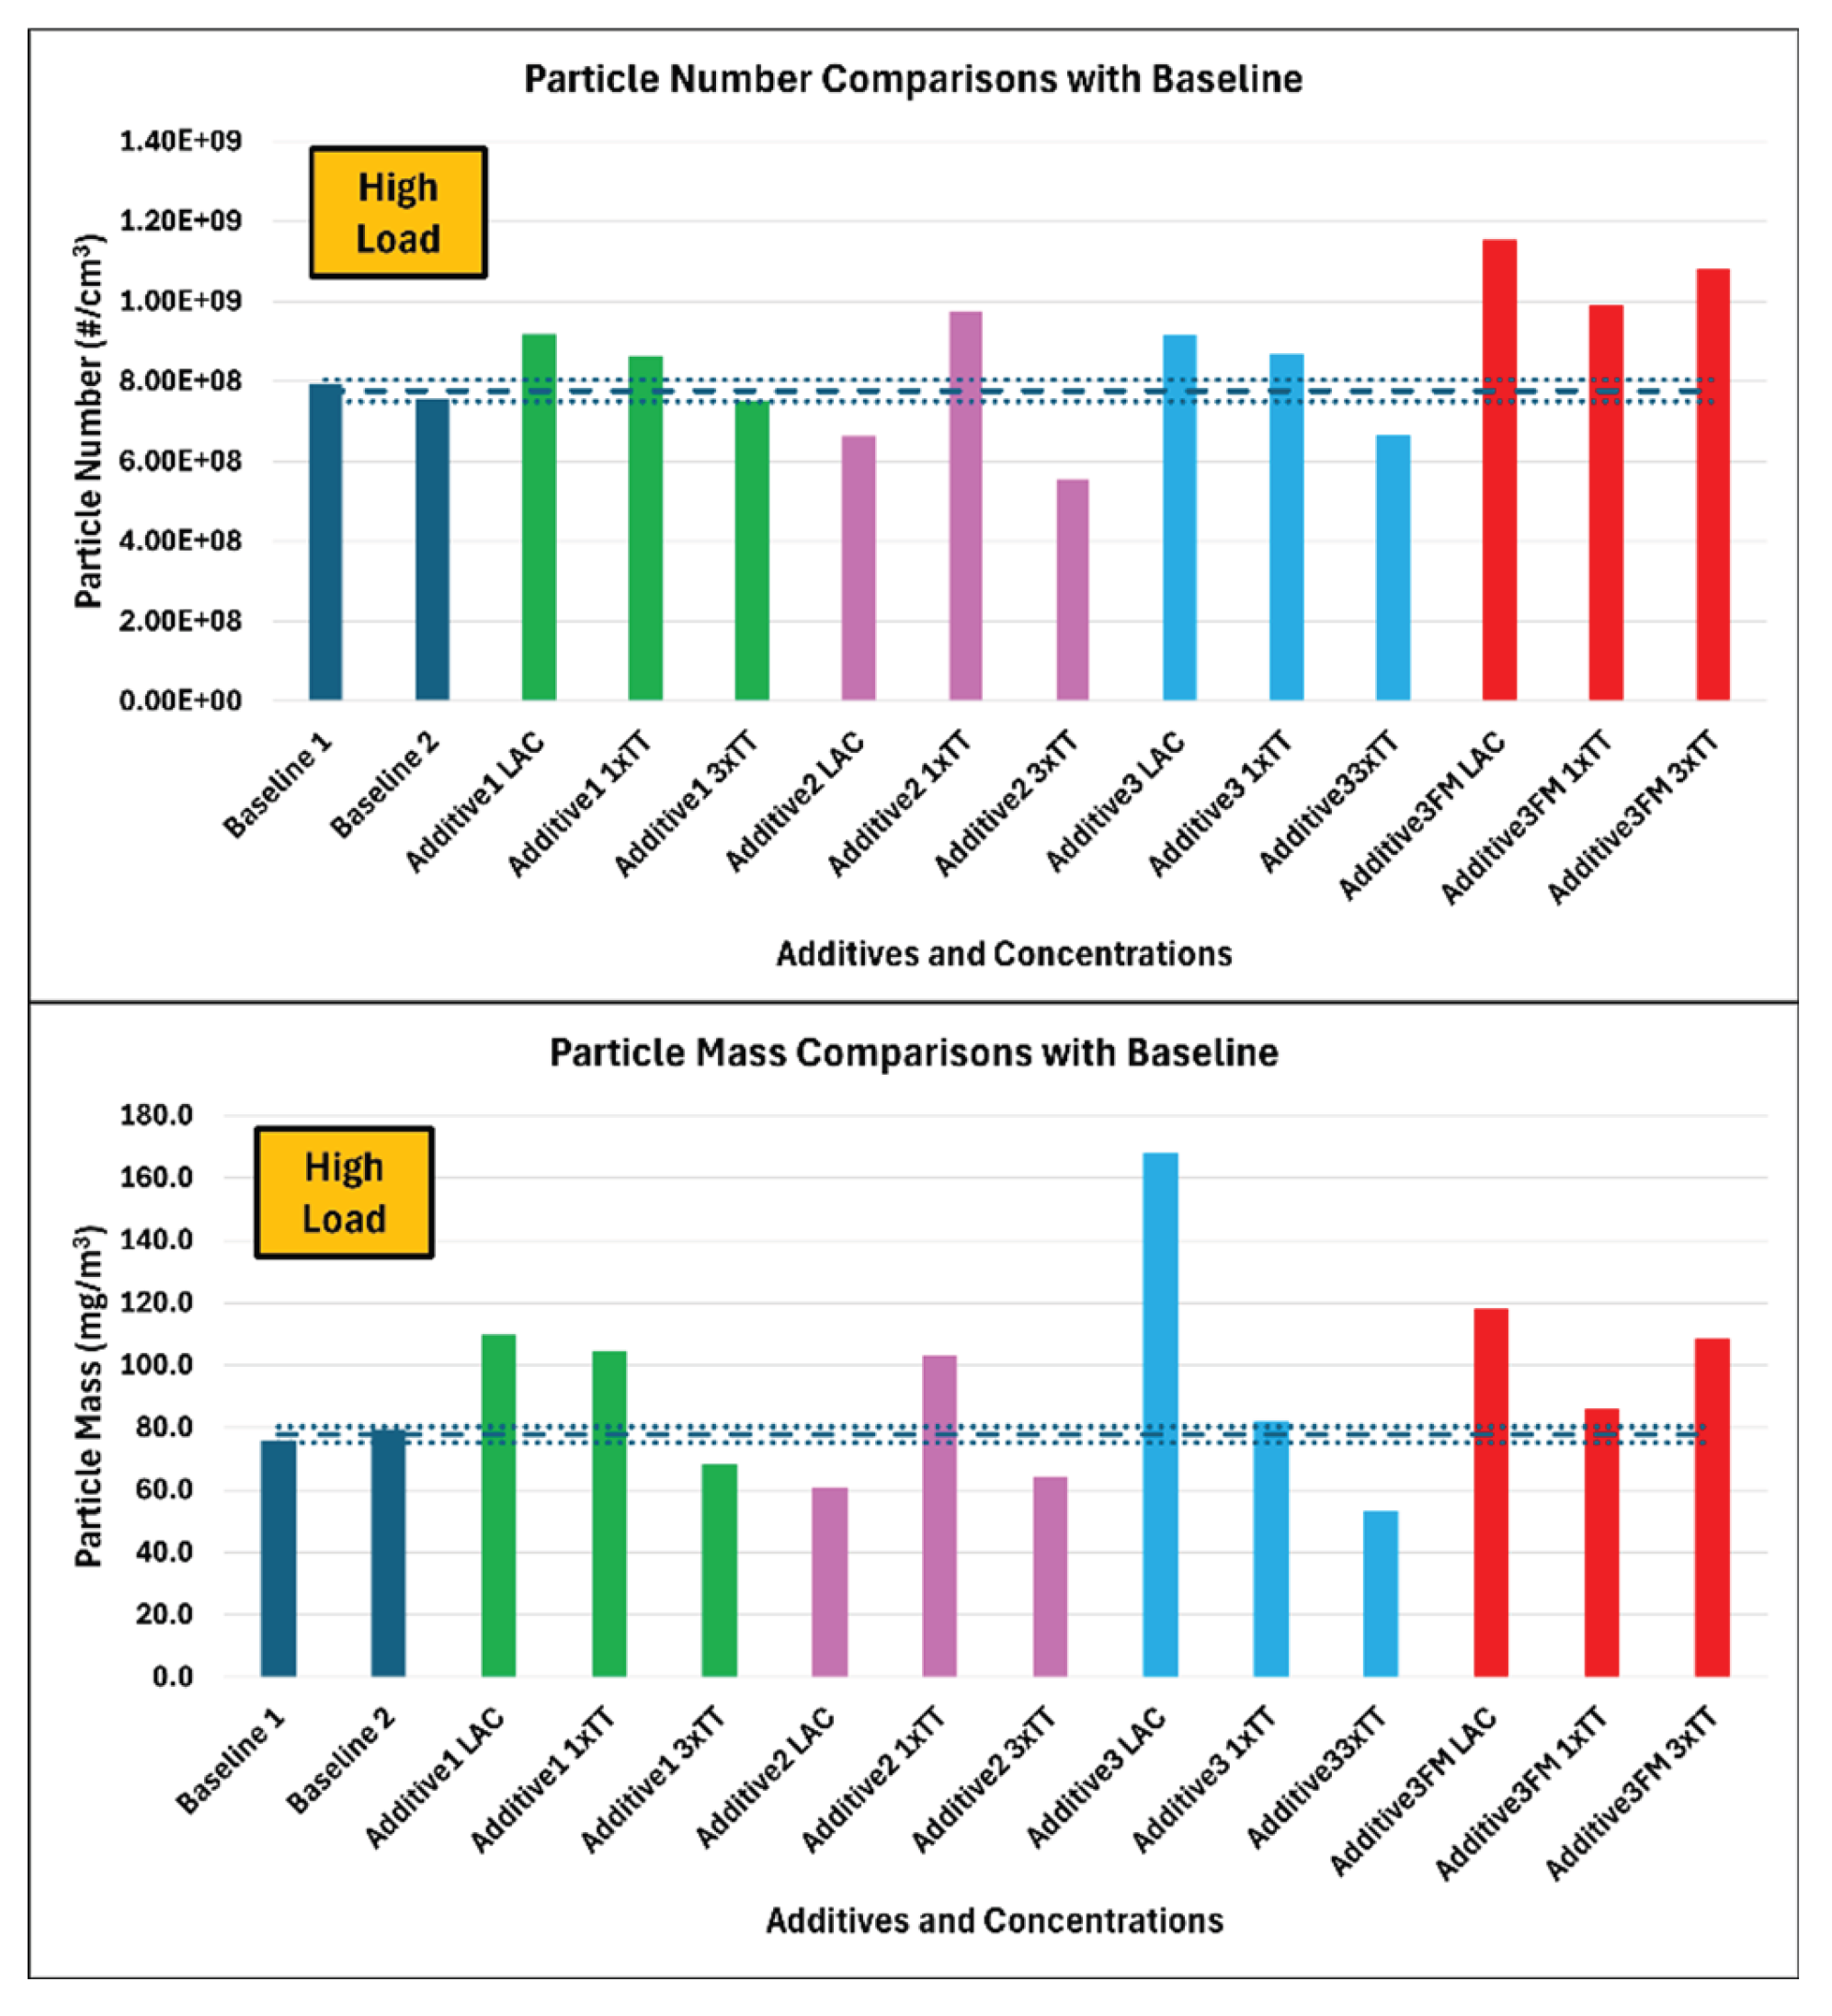
Figure 18.
Impact of SOI on PM-PN emissions (2200 RPM-4.55 bar BMEP).
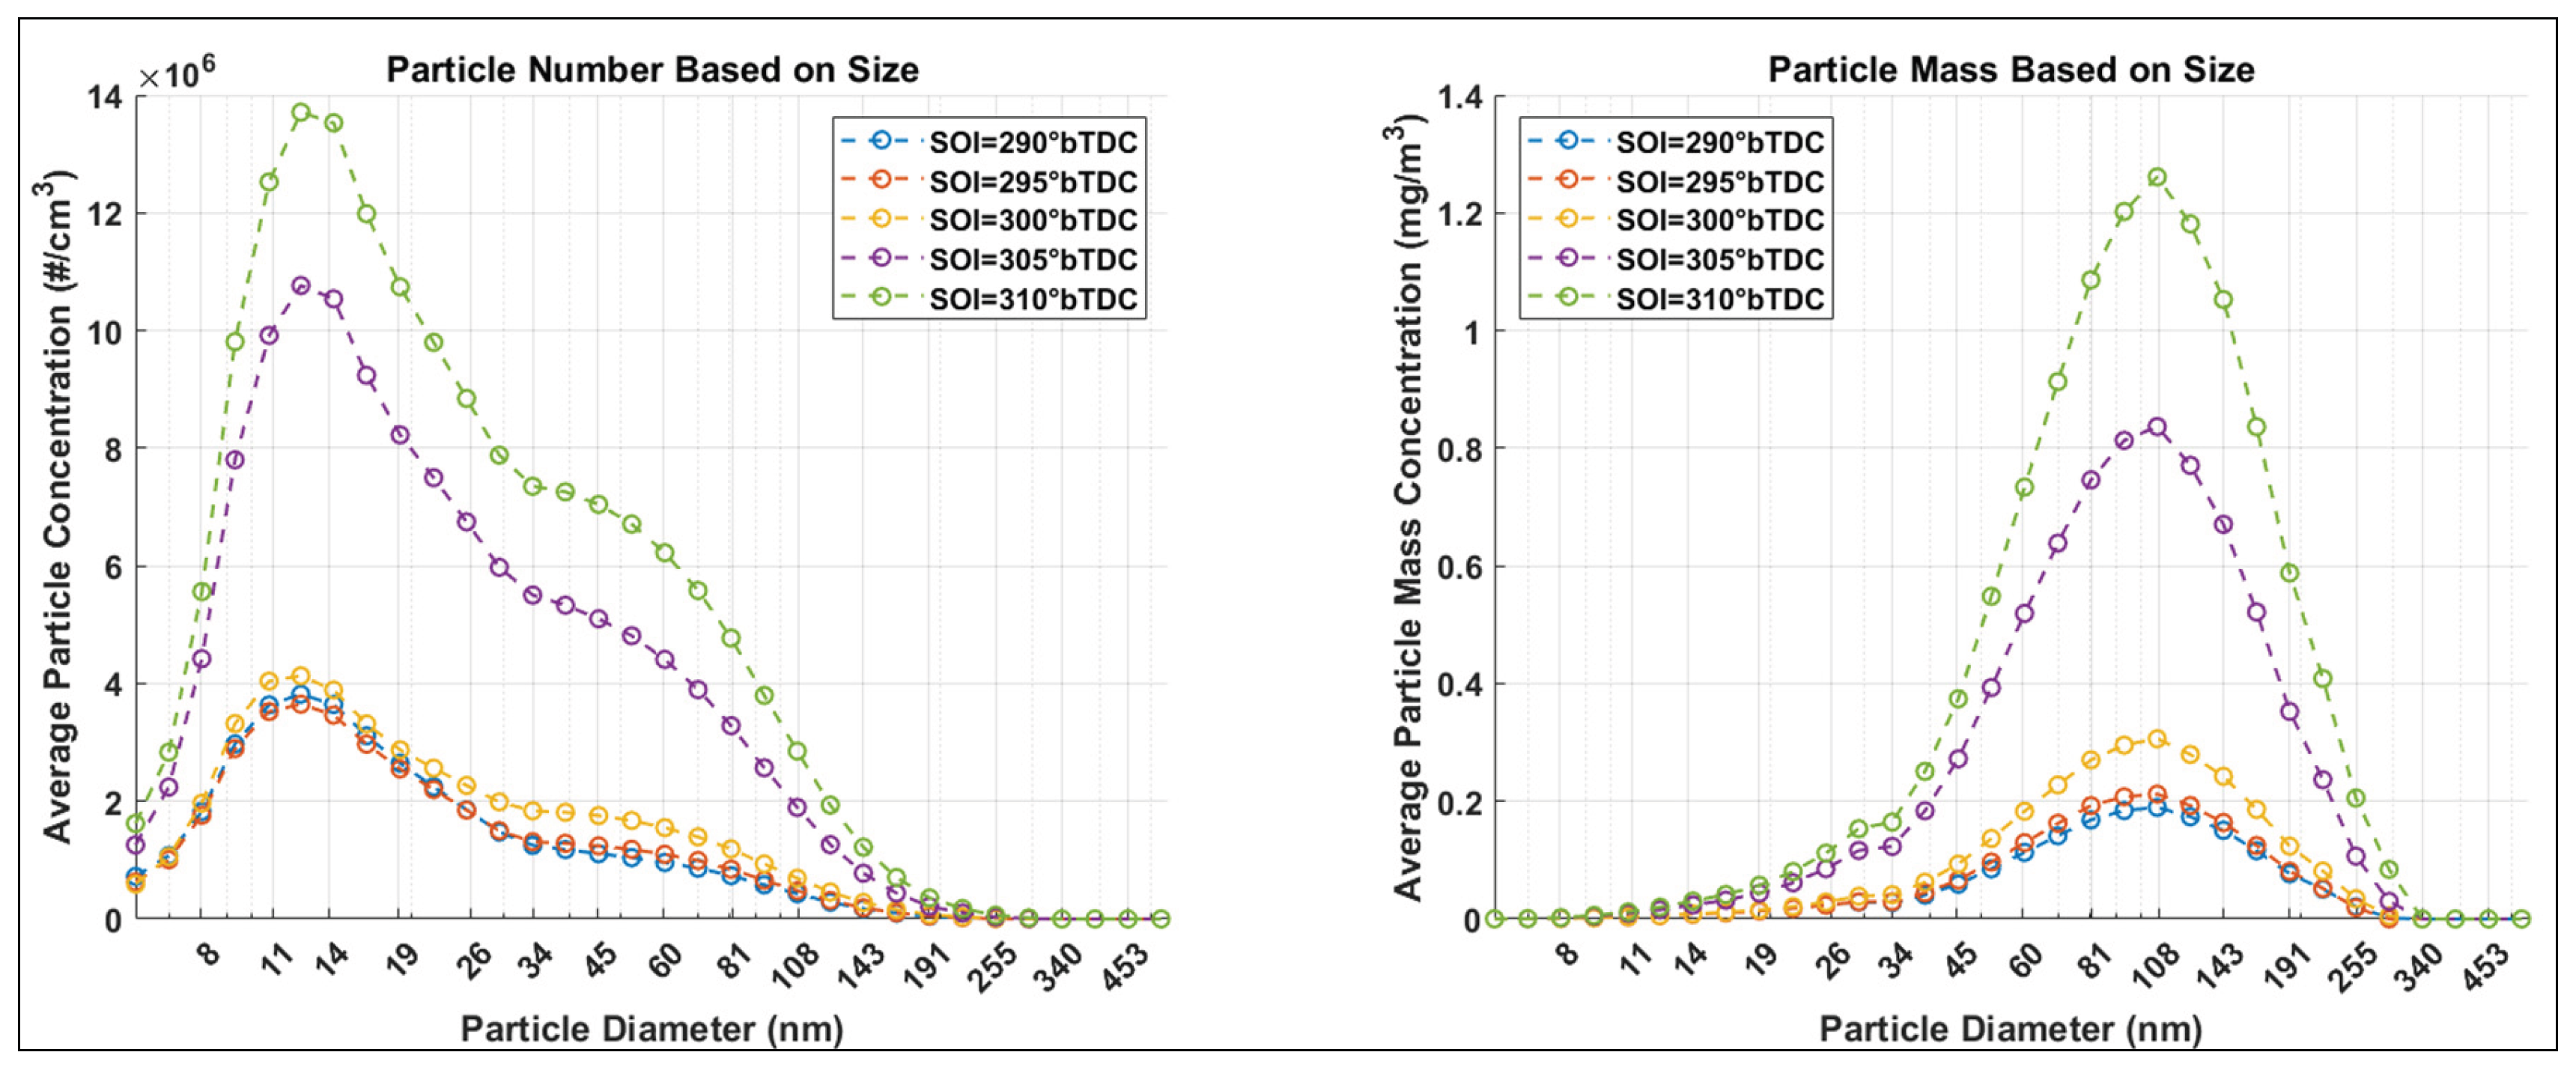

Table 1.
Particulate matter regulation standards.
| Regulation Type | EPA Tier 3 (United States) | Euro 6d (European Union) |
| Particulate Mass | 3 mg/mile (approx. 1.86 mg/km) | 4.5 mg/km |
| Particulate Number | No Limit | 6x10¹¹ particles/km |
Table 2.
Test engine specifications.
| Parameter | Description |
| Model | GM LTG |
| Bore (mm) | 86 |
| Stroke (mm) | 86 |
| Connecting Rod Length (mm) | 152.5 |
| Wrist Pin Offset (mm) | 0.6 |
| Compression Ratio (-) | 9.5 |
| Total Displacement Volume (L) | 2 |
| Valve train specification | DOHC |
| Camshaft Phasing Ranges | 31° Intake/Exhaust Cam Angle |
| Intake Charge Delivery | Turbocharged and Intercooled |
| Fuel Delivery | Direct Injection (Side Mounted Injector) |
| Engine Control System | MoTeC M142 |
| Ignition System | Coil-On-Plug |
| Oil Cooling | Block Mounted Cooler |
| Coolant | DexCool @ 50/50 mix with Reverse Osmosis Water |
Table 3.
Operating Condition Details.
| Operating Condition | ICL | ECL | Fuel Rail Pressure | SOI | EOI2 | Fuel Split Factor | Lambda | Spark | IAT | Coolant Temp. | Oil Temp. |
| Units | from LP | from LP | Bar | °bTDC | °bTDC | -- | -- | °bTDC | °C | °C | °C |
| Road Load | 20 | 13 | 184 | 277 | -- | -- | 1 | MBT | 30 | 90 | 90 |
| Cold Start | 10 | 16 | 90 | 240 | 56 | 0.6/0.4 | 1 | -12 | 30 | 40 | 40 |
| High Load | 11.4 | 5.2 | 200 | 288 | -- | -- | 1 | Knock Limit | 35 | 90 | 90 |
Table 4.
Average particle number to particulate mass ratio for the two baseline runs for all three operating conditions.
Table 4.
Average particle number to particulate mass ratio for the two baseline runs for all three operating conditions.
| Particle Number to Particulate mass Ratio (#/mg) | ||
|
Road Load (90-minute average) |
Cold Start (15 minute average) |
High Load (15-minute average) |
| 1.27 x 10¹³ | 1.3 x 10¹³ | 9.99 x 10¹² |
Table 5.
Average particle number to particulate mass ratio for the two baseline runs for all three operating conditions excluding ultrafine particles (<23 nm diameter).
Table 5.
Average particle number to particulate mass ratio for the two baseline runs for all three operating conditions excluding ultrafine particles (<23 nm diameter).
| Particle Number to Particle Mass Ratio (#/mg) | ||
|
Road Load (90-minute average) |
Cold Start (15 minute average) |
High Load (15-minute average) |
| 6.31 x 10¹² | 5.96 x 10¹² | 5.74 x 10¹² |
Disclaimer/Publisher’s Note: The statements, opinions and data contained in all publications are solely those of the individual author(s) and contributor(s) and not of MDPI and/or the editor(s). MDPI and/or the editor(s) disclaim responsibility for any injury to people or property resulting from any ideas, methods, instructions or products referred to in the content. |
© 2025 by the authors. Licensee MDPI, Basel, Switzerland. This article is an open access article distributed under the terms and conditions of the Creative Commons Attribution (CC BY) license (http://creativecommons.org/licenses/by/4.0/).
Copyright: This open access article is published under a Creative Commons CC BY 4.0 license, which permit the free download, distribution, and reuse, provided that the author and preprint are cited in any reuse.


