
Submitted:
08 September 2025
Posted:
09 September 2025
You are already at the latest version
Abstract
Background: Physical activity, sedentary behaviour, and sleep are interdependent components of the 24-hour movement profile that may influence appetite control. While acute exercise can alter appetite perceptions and food reward, less is known about how reallocating time between daily behaviours affects appetite outcomes under free-living conditions. Methods: We applied isotemporal-substitution modelling in a cross-sectional study of 130 young, healthy, active adults. Accelerometer-derived estimates of sedentary time, light physical activity (LPA), moderate-to-vigorous physical activity (MVPA), and sleep were analysed in relation to energy intake (food diaries, laboratory meals), subjective appetite perceptions, appetite-related hormones (acylated ghrelin, PYY, leptin), and psychological traits, including food reward (Leeds Food Preference Questionnaire, LFPQ), food cravings (Control of Eating Question-naire, CoEQ), and eating behaviour traits (Three-Factor Eating Questionnaire, TFEQ). Results: Reallocating 30 minutes/day of sedentary time to MVPA was associated with higher energy intake in free-living (+113 kcal/day, 95% CI:34–192) and laboratory settings (+120 kcal/day, 95% CI:55–185), along with greater postprandial hunger and prospective food consumption, reduced fullness, elevated fasting acylated ghrelin, and lower postprandial PYY. No associations were observed for reallocations to LPA or sleep. Furthermore, sedentary time reallocations were unrelated to leptin or psychological eating traits assessed by the LFPQ, CoEQ, or TFEQ. Conclusions: In this population, reallocating sedentary time to MVPA was linked to physiological and behavioural compensation consistent with elevated energy demands, whereas reallocating to LPA or sleep showed no associa-tions. Trait-level eating behaviours were unaffected, suggesting MVPA influences appetite primarily through acute physiological rather than enduring cognitive or hedonic pathways.
Keywords:
Appetite
; Energy balance
; Eating behavior
; Physical activity
; Sedentary time
; Food reward
1. Introduction
Appetite control remains a key focus of scientific enquiry given the persistent global burden of overweight and obesity [1]. Recent advances in the neurobiology of appetite have underpinned the development of new pharmacotherapies for obesity, many of which target central appetite-regulatory pathways [2]. The clinical success of these agents[3,4] underscores the pivotal role of appetite in eating behaviour and body weight regulation. However, pharmacological treatments alone cannot fully address the scale of the obesity crisis. Non-pharmacological strategies that modulate appetite remain essential, both as standalone approaches for individuals not using medication and as complementary tools alongside pharmacotherapy [5,6]. A deeper understanding of how such interventions influence appetite - across both its homeostatic and hedonic dimensions - is therefore a priority.
One promising avenue is the interaction between movement behaviours and appetite control. Sedentary behaviour has long been associated with dysregulated appetite and weight gain [7], a relationship confirmed with modern device-based assessment methods[8]. In contrast, regular physical activity appears to enhance appetite sensitivity, enabling more accurate compensation for prior energy intake[9,10]. This “fine-tuning” effect is characterised by greater fasting hunger coupled with stronger postprandial satiety [11], aligning intake more closely with energy demands. Mechanistic studies suggest that exercise-induced changes in appetite-related peptides (e.g., ghrelin, glucagon-like peptide-1 [GLP-1], peptide YY [PYY]) may contribute to this response [12,13], while behavioural evidence indicates that physical activity can also modulate hedonic aspects of eating - reducing the reward value of high-fat foods and improving control over food cravings [14]. Sleep also plays a critical role in appetite regulation, with insufficient or disrupted sleep linked to increased hunger, altered satiety signaling, and greater energy intake [15,16,17,18]. When considered alongside physical activity and sedentary behaviour, sleep represents an additional behaviour that may shape appetite regulation within the context of the full 24-hour day. Together, these findings position daily movement behaviours - including physical activity, sedentary time, and sleep - as potentially powerful non-pharmacological regulators of appetite.
Yet much of the existing evidence derives from tightly controlled laboratory studies or small-scale trials that may not capture the complexity of appetite regulation in free-living populations [19,20], often focusing on one behaviour alone. Addressing this gap requires methods that account for how daily movement behaviours interact within the constraints of a 24-hour day. Isotemporal substitution analysis offers one such approach [21]. By modelling the effects of reallocating time between sedentary behaviour, physical activity, and sleep, it provides ecologically valid estimates of how these behaviours influence health outcomes [22,23,24]. When applied to appetite regulation, isotemporal substitution allows for a more integrated understanding of how movement behaviours collectively shape both homeostatic and hedonic components of appetite.
Building on this rationale, the present study used a deeply-phenotyped adult cohort to examine how replacing device-measured sedentary time with different physical activity intensities and sleep influences energy intake and appetite control. Appetite and related hormonal responses were assessed dynamically during a mixed-meal tolerance test, complemented by validated measures of food craving and reward. These analyses provide novel evidence on the relationship between movement behaviours and appetite regulation in a real-world context, with implications for the design of non-pharmacological strategies to support weight management.
2. Materials and Methods
2.1. Ethical Approval and Participants
A cohort of 130 participants were recruited (including men and women) from the local community. Participants were aged 18–55 years with a BMI between 16.5–35.0 kg/m2. All participants were healthy, weight stable (<3 kg change in the 12 weeks prior), not dieting (or using medications that affect body weight), and had no history of metabolic or cardiovascular disorders. Female participants self-reported not being pregnant. Smokers were included (smoking status was included as a co-variate in statistical models) but we excluded people who vape or use e-cigarettes as the impact on study outcomes is less clear. Written informed consent was provided by all, and the study procedures adhered to the principles of the Declaration of Helsinki [25]. This study was approved by the Loughborough University Ethics Review Sub-Committee (project ID: 10980; 30/09/2022).
2.2. Study Design
This cross-sectional study involved two laboratory visits: one for familiarisation and a second for primary assessments. Visits were separated by at least one week, during which free-living physical activity, sedentary behavior, sleep, and free-living energy intake were monitored. Participants were instructed to fast overnight (12 h) and abstain from caffeine, alcohol, and structured exercise for 24 hours before each visit.
2.2.1. Visit 1: Eligibility and Familiarisation
Participants attended the laboratory to confirm eligibility and undergo familiarisation with all study procedures. Demographic information was collected and assessments for anthropometry and resting metabolic rate (RMR) were completed. Food cravings during the previous week were assessed using the Control of Eating Questionnaire (CoEQ) [26].
Height and body mass were measured using a wireless measuring station (Seca Ltd., Hamburg, Germany) to the nearest 0.1 cm and 0.1 kg, respectively, and body mass index (BMI; body mass/height2) was calculated.
RMR was measured using breath-by-breath indirect calorimetry (Cortex Metalyzer 3B, Leipzig, Germany), following standard protocols [27]. Participants rested in a quiet, supine position for 30 minutes, during which expired air was continuously sampled. RMR was calculated using the Weir equation from the final 20 minutes of data, excluding the initial 10 minutes to eliminate non-steady-state data [28].
2.2.2. 24-Hour Movement Behaviour Assessment
After Visit 1, participants wore a triaxial accelerometer (GENEActiv, ActivInsights Ltd., UK) on their non-dominant wrist for 24 h per day over seven days to monitor levels of physical activity, sedentary time and sleep. Participants followed their usual routines and logged sleep/wake times and any device removal. Data, recorded at 100 Hz, were downloaded and processed using the GGIR R-package (http://cran.r-project.or g)[29,30]. Dynamic acceleration (Euclidean Norm minus 1 g [ENMO]) was averaged over 5-second epochs and reported in milligravitational units (mg), alongside a sleep detection algorithm to estimate sleep duration [30,31]. ENMO reflects the average dynamic acceleration throughout the day (24 hr), calculated as the vector magnitude of the three acceleration axes with 1g subtracted and any negative values set to zero. This metric is automatically computed within the GGIR R-package [29,30] and provides an indicator of total physical activity over the 24-hour period [30,32]. Data were excluded if post-calibration error exceeded 0.01g (10 mg), valid wear time was less than three days (defined as ≥16 h per day), or if data were missing for any 15-minute interval across the 24-h cycle. Non-wear time was identified based on a 15-minute window showing a standard deviation below 13 mg or a range less than 50 mg on at least two of the three axes, as previously described [32]. Missing data were imputed using average ENMO values from corresponding time points on other days [31,33]. This ensured that outcome variables covered the entire 24-h cycle (1440 minutes) for each participant. Sleep windows and sleep duration within the window were determined using the HDCZA automated algorithm, with sleep defined from initial sleep onset to the final awakening of the night [31,34]. For each exposure variable, the mean across all valid days was calculated.
The following sleep characteristics were obtained: sleep duration (total accumulated sleep duration within the sleep window discounting any wake time) and wake after sleep onset (WASO, the total number of minutes that a person is awake after having initially fallen asleep). Activity levels were categorized as sedentary (<40 mg), light (LPA, 40–<100 mg), or moderate-to-vigorous physical activity (MVPA; ≥100 mg) [35,36].
2.2.3. Free-Living Energy Intake Assessment
Participants completed a three-day weighed food dairy - two weekdays and one weekend day - to assess habitual dietary intake. To minimise reporting errors, participants were given instructions, a food scale, and encouraged to record intake in real time. Records were reviewed and analysed by a trained researcher using Nutritics software (Nutritics Ltd., Dublin, Ireland) to estimate daily energy and macronutrient intake.
2.2.4. Visit 2: Appetite and Energy Intake Assessment
Participants arrived at the laboratory at 08:00 after a 12-hour overnight fast (Figure 1). On arrival, they completed the Leeds Food Preference Questionnaire (LFPQ). At ~08:15, participants began a mixed-meal tolerance test (MM-TT). Baseline appetite ratings (hunger, fullness, satisfaction, prospective food consumption) were recorded using visual analogue scales (VAS), and a fasting venous blood sample was taken before consumption of a standardised meal (08:15–08:30). VAS ratings were then completed every 30 minutes for 240 minutes, with additional venous blood samples collected at 30-, 60-, and 120-minutes post-meal. At 13:00 (30 min after the MM-TT) and 17:00, participants consumed ad libitum lunch and dinner meals and were then provided with an evening snack bag to consume as desired until the next morning. Food intake from the snack bag was recorded the following day.
2.2.5. Study Meals
In line with published guidance [38], the MM-TT meal (porridge, whole milk, honey) was calculated as 25% of estimated daily energy requirements (RMR x 1.4 x 0.25) and consisted of 55% carbohydrates, 15% protein, and 30% fat. Meal energy was determined by multiplying participants measured RMR by 1.4 (to reflect the sedentary study conditions) and subsequently by 0.25 (typical share of daily energy intake from breakfast in the UK) [41]. Ad libitum meals included a standardised pasta lunch (72% CHO, 12% protein, 16% fat) and a dinner of curry, naan, and basmati rice (71% CHO, 8% protein, 21% fat). Energy intake was calculated from food consumed, with initial weights recorded and manufacturer values used for energy estimation. The snack bag contained commercially available items (e.g., cookies, cereal bars, mini rolls).
2.2.6. Leeds Food Preference Questionnaire
The LFPQ is a validated computer-based tool for assessing food preference and reward [40,42]. It measures liking and wanting for 16 foods across four categories (high-/low-fat savory/sweet). Participants select their most wanted item from paired comparisons, and reaction times (adjusted for selection frequency) are used to compute implicit wanting. Explicit liking and wanting are rated using 100 mm VAS, with fat and sweet bias scores calculated from these responses.
2.2.7. Blood Sampling and Biochemical Analyses
Venous blood samples were collected into pre-chilled EDTA monovettes (Sarstedt, Leicester, UK) and centrifuged at 2,383 g for 10 mins (4 °C). The resulting plasma was aliquoted into 2 mL cryovials and stored at −80 °C. Acylated ghrelin samples were processed separately to preserve the acyl group [43]. Hormone concentrations (acylated ghrelin, total PYY, leptin) were measured using enzyme-linked immunosorbent assays (ELISA) kits from commercial suppliers (Bioquote Ltd., York, UK; Merck Millipore, Darmstadt, Germany; and Bio-Techne Ltd., Abingdon, UK, respectively) with within-batch CVs < 5.14%. Acylated ghrelin and total PYY were measured at fasting and postprandial time points (0, 30, 60, and 120 mins) while leptin was assessed at baseline only (fasted).
2.3. Statistical Analysis
All analyses were performed using SPSS version 28 (SPSS Inc., Chicago, IL). Data distribution was assessed using Kolmogorov–Smirnov tests and histograms. Results are presented as mean ± SD (normal), median (IQR) (non-normal), or n (%) (categorical) as appropriate. Total area under the curve (AUC) for postprandial responses was calculated using the trapezoid rule.
Isotemporal substitution analysis using generalized linear models were used to investigate the association of substituting sedentary time with LPA, MVPA, and sleep duration (minus WASO) on appetite-related outcomes. Isotemporal substitution analysis is a recommended tool in observational studies, utilising measures based on time [44]. To investigate the associations between the 24-hour behaviours, all of the movement behaviours except for the one being displaced (in this case sedentary time), are concurrently added into a regression model, as detailed below:
Appetite-related outcome (y) = β0 + (β1) sleep duration + (β2) WASO + (β3) sedentary time + (β4) LPA + (β5) MVPA + (β6) covariates - with sedentary time (β3) eliminated from the model.
Importantly, incorporating sleep duration and WASO, along with other behaviors, ensures that the time reallocation is modeled and standardized to a specific time frame (such as 24 hours or 1440 minutes). As a result, it is not necessary to include total duration as an additional covariate in the model. The regression coefficient for each behavior in this model indicates the change in association that would occur if a unit of time spent in sedentary time is replaced with that behavior.
We ran two regression models. Model 1 adjusted for age, sex, ethnicity, and smoking status (with postprandial AUC outcomes additionally adjusted for fasting values). Model 2 included the same covariates with the addition of BMI, given its potential role as an attenuator of associations between movement behaviours and appetite-related outcomes [45]. Although results from both models are reported, Model 2 is considered the primary model of interest because it accounts for adiposity as a key confounder. Data from Model 1 are reported in Supplementary Materials. Multicollinearity was checked using the variance inflation factor.
Missing data (3.4% for fasting bloods; 1.7% for appetite and field-based assessment of energy intake) were imputed across 20 datasets using regression models that included age, sex, ethnicity, BMI, and smoking status as predictors.
Given the exploratory nature of this study, formal power calculations were not conducted, and no adjustments were made for multiple comparisons. Consequently, the findings should be interpreted cautiously, recognizing the risk of type I error. Results are best considered in the context of broader patterns, using beta-coefficients (β), 95% confidence intervals (CIs), and exact P-values. These outcomes are intended to guide the planning of future hypothesis-driven experimental research.
3. Results
3.1. Participant Characteristics
Out of the total sample (n = 130), 11 individuals were excluded due to missing 24-hour movement behaviour data related to technical issues – leaving a final sample of 119 participants. Key characteristics of these individuals are described in Table 1. Participants’ appetite, appetite-related hormone, food reward and energy intake data are shown in Supplementary Table 1. Overall, men and women were fairly equally represented, with most participants identifying as White, Indian or Asian. Generally, the sample was young, physically active and exhibiting healthy body weight.
3.2. Energy Intake
Based on food diary records, reallocating 30 minutes of sedentary time to MVPA was associated with a 113 (34, 192) kcal·d-1 higher daily energy intake (P = 0.005) (Figure 2, Model 2). Reallocating time from sedentary time to LPA or sleep was unrelated to daily energy intake measured via food diaries. Based on laboratory measured energy intake, reallocating 30 minutes of sedentary time to MVPA was associated with a 120 (55, 185) kcal·d-1 higher daily energy intake (P <0.001) (Figure 2, Model 2). Reallocating time from sedentary time to LPA or sleep was not associated with energy intake measured in the laboratory.
3.3. Appetite-Related Hormones
Reallocating 30 minutes of sedentary time to MVPA was associated with a 639 (−1143, −135) pg·mL·2h−1 lower postprandial PYY AUC (P = 0.013) (Model 2, Table 2). Reallocating 30 minutes of sedentary time to MVPA was also assocatd with higher fasting acylated ghrelin concentrations (0.01 (0.00, 0.19) pg·mL−1)(P = 0.045)(Model 2, Figure 2). Reallocation of 30 minutes of sedentray time for LPA was associated with higher postpranidal PYY concentrations (550 (35, 1065) pg·mL·2h−1)(P = 0.036)(Model 2, Figure 2).
3.4. Perceived Ratings of appetite
Reallocating 30 minutes of sedentary time to MVPA was associated with higher postprandial PFC (4-h AUC: +545 mm; 95% CI: 93–996; P = 0.018; Model 2, Table 2). There was also a trend toward greater postprandial hunger (+481 mm; 95% CI: –49 to 1011; P = 0.075) and lower postprandial fullness (–454 mm; 95% CI: –937 to 30; P = 0.066) when reallocating sedentary time for MVPA. No other associations were observed for reallocations of sedentary time to physical activity (LPA or MVPA) or sleep, whether appetite perceptions measurments were fasted or postpranidal.
3.5. Food Reward, Cravings and Dietary Eating Traits
Reallocation of 30 minutes of sedentary time to LPA, MVPA and sleep was unrelated to all measured outcomes regarding food reward (LFPQ), food cravings (CoEQ) and dietary eating traits (TFEQ) (Table 3).

Table 2.
Adjusted change in appetite-related hormones, and perceived ratings of appetite associated with replacing 30 min of sedentary time with sleep or physical activity in Model 2 (adjusted for age, sex, ethnicity, smoking status, and BMI).
Table 2.
Adjusted change in appetite-related hormones, and perceived ratings of appetite associated with replacing 30 min of sedentary time with sleep or physical activity in Model 2 (adjusted for age, sex, ethnicity, smoking status, and BMI).
| LPA | MVPA | Sleep | ||||
| β-coefficient (95% CI) | P-value | β -coefficient (95% CI) | P-value | β -coefficient (95% CI) | P-value | |
| Appetite-related hormones | ||||||
| Fasting leptin (pg·mL−1)* | 0.03 (−0.1, 0.1) | 0.652 | −0.06 (−0.15, 0.03) | 0.111 | −0.06 (−0.12, 0.00) | 0.106 |
| Fasting PYY (pg·mL−1) | 4.6 (−1.8, 11.0) | 0.162 | −0.8 (−7.1, 5.6) | 0.815 | −0.2 (−4.6, 4.1) | 0.916 |
| PYY AUC (2 h, pg·mL−1) | 549.8 (34.8, 1064.9) | 0.036 | −639.3 (−1143.2, −135.3) | 0.013 | 52.7 (−294.5 to 399.8) | 0.766 |
| Fasting acylated ghrelin (pg·mL−1)* | 0.06 (−0.04, 0.14) | 0.234 | 0.10 (0.00, 0.19) | 0.045 | 0.00 (−0.04, 0.06) | 0.648 |
| Acylated ghrelin AUC (2 h, pg·mL−1)* | −0.03 (−0.06, 0.03) | 0.514 | 0.03 (−0.03, 0.09) | 0.566 | −0.03 (−0.06, 0.03) | 0.359 |
| Perceived ratings of appetite | ||||||
| Fasting fullness (mm) | −0.33 (−3.00, 2.33) | 0.809 | 1.00 (−1.65, 3.66) | 0.456 | 0.09 (−1.74, 1.93) | 0.927 |
| Fullness AUC (4 h, mm) | 6.5 (−482.5, 495.4) | 0.979 | −453.8 (−936.9, 29.5) | 0.066 | −286.7 (−618.8 to 45.5) | 0.091 |
| Fasting hunger (mm) | −0.2 (−3.4, 3.0) | 0.915 | 0.8 (−2.4, 4.0) | 0.635 | 0.0 (−2.2, 2.2) | 0.990 |
| Hunger AUC (4 h, mm) | −70.6 (−607.4, 466.3) | 0.797 | 480.8 (−49.1, 1010.7) | 0.075 | 299.3 (−65.5 to 662.0) | 0.108 |
| Fasting PFC (mm) | 0.30 (−1.86, 2.42) | 0.789 | 1.77 (−0.34, 3.85) | 0.101 | 0.53 (−0.93, 1.99) | 0.467 |
| PFC AUC (4 h, mm) | −168.9 (−621.5, 283.8) | 0.464 | 544.6 (93.4, 995.8) | 0.018 | 175.8 (−132.2 to 483.8) | 0.263 |
| Fasting satisfaction (mm) | 1.84 (−1.08, 4.71) | 0.217 | 0.39 (−2.46, 3.24) | 0.785 | 0.72 (−1.23, 2.70) | 0.465 |
| Satisfaction AUC (4 h, mm) | −138.7 (−624.9, 347.7) | 0.576 | −135.2 (−611.9, 341.5) | 0.578 | −192.5 (−521.6 to 136.5) | 0.251 |
Each coefficient reflects the predicted change in the specified appetite-related outcome associated with reallocating 30 minutes of sedentary time to the specified behaviour (LPA, MVPA, sleep), holding total time constant. Values are presented as adjusted means with 95% CI for n = 119. Data were analysed using generalised linear models with a normal distribution and identity link function or gamma distribution with a log link function indicated by *. Model 2 adjusted for age, sex, smoking status, ethnicity and BMI. AU, arbitrary units; CI, confidence interval; LPA, light physical activity; MVPA, moderate-to-vigorous physical activity. * Values represent coefficients on the log-scale for models with gamma distribution and log link function.
Table 3.
Adjusted change in food reward (LFPQ), food cravings (CoEQ) and eating traits (TFEQ) associated with replacing 30 min of sedentary time with sleep or physical activity in Model 2 (adjusted for age, sex, ethnicity, smoking status, and BMI).
Table 3.
Adjusted change in food reward (LFPQ), food cravings (CoEQ) and eating traits (TFEQ) associated with replacing 30 min of sedentary time with sleep or physical activity in Model 2 (adjusted for age, sex, ethnicity, smoking status, and BMI).
| LPA | MVPA | Sleep Duration | ||||
| β -coefficient (95% CI) | P-value | β -coefficient (95% CI) | P-value | β -coefficient (95% CI) | P-value | |
| TEFQ | ||||||
| Cognitive restraint (0-21) | 0.00 (−0.50, 0.51) | 0.957 | −0.03 (−0.50, 0.44) | 0.901 | −0.12 (−0.46, 0.25) | 0.521 |
| Disinhibition (0-16) | −0.15 (−0.45, 0.18) | 0.365 | 0.12 (−0.18, 0.45) | 0.418 | −0.10 (−0.30, 0.15) | 0.476 |
| Hunger (0-14) | 0.16 (−0.25, 0.55) | 0.482 | 0.30 (−0.06, 0.70) | 0.104 | 0.00 (−0.27, 0.25) | 0.967 |
| Total score | −0.03 (−0.72, 0.66) | 0.943 | 0.42 (−0.30, 1.15) | 0.247 | −0.21 (−0.66, 0.25) | 0.397 |
| CoEQ | ||||||
| Craving control (AU) | −3.93 (−12.00, 4.14) | 0.339 | 2.26 (−5.70, 10.22) | 0.577 | 3.27 (−2.22, 8.77) | 0.242 |
| Craving for Sweet (AU) | 2.03 (−7.90, 11.96) | 0.687 | −2.82 (−12.63, 6.98) | 0.575 | 6.18 (−0.60, 13.00) | 0.074 |
| Craving for Savoury (AU) | 2.3 (−7.2, 11.7) | 0.638 | 2.3 (−7.1, 11.6) | 0.630 | −3.4 (−10.0, 3.1) | 0.302 |
| Positive Mood (AU) | 6.3 (−13.5, 26.1) | 0.107 | −6.3 (−22.5, 0.9) | 0.102 | 3.4 (−1.8, 8.7) | 0.201 |
| LFPQ | ||||||
| Fasting fat explicit liking (mm) | −0.5 (−2.0, 1.0) | 0.527 | 0.1 (−1.5, 1.7) | 0.907 | −0.3 (−1.4, 0.8) | 0.618 |
| Fasting fat explicit wanting (mm) | −0.3 (−2.0, 1.4) | 0.754 | 0.6 (−1.2, 2.3) | 0.470 | 0.0 (−1.1, 1.1) | 0.992 |
| Fasting fat implicit wanting (AU) | −1.0 (−4.2, 2.2) | 0.536 | −0.1 (−3.3, 3.0) | 0.930 | −0.3 (−2.5, 1.9) | 0.789 |
| Fasting fat relative preference (AU) | −0.36 (−1.56, 0.84) | 0.538 | −0.18 (−1.42, 1.05) | 0.777 | 0.18 (−0.63, 0.89) | 0.658 |
| Fasting taste explicit liking (mm) | −0.96 (−3.21, 1.30) | 0.401 | −0.75 (−2.94, 1.44) | 0.504 | −0.03 (−1.53, 1.48) | 0.984 |
| Fasting taste explicit wanting (mm) | −1.05 (−3.24, 1.14) | 0.355 | −0.30 (−2.50, 1.89) | 0.777 | 0.45 (−1.02, 1.93) | 0.548 |
| Fasting taste implicit wanting (AU) | 0.57 (−4.09, 5.23) | 0.806 | −3.51 (−8.07, 1.05) | 0.134 | 1.05 (−2.03, 4.14) | 0.512 |
| Fasting taste relative preference (AU) | −0.004 (−6.10, 5.30) | 0.891 | −2.20 (−7.80, 3.40) | 0.442 | 0.60 (−3.20, 4.50) | 0.745 |
Each coefficient reflects the predicted change in the specified appetite-related outcome associated with reallocating 30 minutes of sedentary time to the specified behavior (LPA, MVPA, sleep), holding total time constant. Values are presented as adjusted means with 95% CI for n = 119. Data were analysed using generalised linear models with a normal distribution and identity link function. Model 2 adjusted for age, sex, smoking status, ethnicity, and BMI. AU, arbitrary units; CI, confidence interval; CoEQ, Control of Eating Questionnaire; ES, effect size; LFPQ, Leeds Food Preference Questionnaire; LPA, light physical activity; MVPA, moderate-to-vigorous physical activity; TFEQ, Three-Factor Eating Questionnaire. 4. Discussion.
The present study used isotemporal substitution modelling to examine the impact of reallocating sedentary time to sleep, LPA, or MVPA on multiple aspects of appetite control in a predominantly young, healthy, and active cohort. We investigated outcomes spanning energy intake, subjective appetite perceptions, appetite-related hormones, and psychological eating behaviour traits. Reallocation of sedentary time to MVPA was associated with higher total energy intake, greater postprandial hunger and prospective food consumption, lower fullness, and hormonal changes indicative of increased energy demands (higher fasting acylated ghrelin concentrations, lower circulating postprandial PYY). No associations were observed for reallocations of sedentary time to LPA or sleep, and there were no links with trait-level eating behaviours such as dietary restraint, disinhibition, food cravings, or food reward. Taken together, these findings suggest that in young, healthy, and active adults, reallocating time to MVPA under free-living conditions may elicit physiological and behavioral compensation for elevated energy expenditure. In contrast, LPA and sleep do not appear to meaningfully influence appetite regulation or energy intake in this population.
A key finding was that reallocating sedentary time to MVPA was associated with higher daily energy intake, with each 30-minute reallocation corresponding to an additional 113 kcal (free-living measured) to 120 kcal (laboratory measured) consumed. No such associations were detected for reallocations to LPA or sleep. This likely reflects the characteristics of our cohort, who were weight-stable, highly active, and therefore required greater energy intake to meet the increased demands of higher physical activity. Consistent with this, previous studies have shown that active individuals consume more energy and protein than their less active peers [46], report greater hunger and reduced satiety following meals [47], and demonstrate enhanced appetite sensitivity by downregulating intake after high-energy preloads [48]. These findings collectively suggest that active individuals may possess a more responsive appetite control system that helps align energy intake with expenditure.
This interpretation is supported by our subjective appetite data. Reallocating sedentary time to MVPA was associated with greater postprandial hunger and prospective food consumption, and with lower fullness during the MM-TT. No associations were observed for fasting appetite ratings, likely reflecting the variability and limited sensitivity of single time-point VAS measures, whereas repeated postprandial ratings more reliably capture satiety dynamics [38]. Similarly, the absence of associations for reallocations to sleep or LPA is plausibly explained by their relatively modest energetic contribution in this cohort, alongside the homogeneity and generally healthy sleep and LPA pattern of participants.
Further insight comes from the appetite-related hormone data. Few studies have explored the interaction between habitual physical activity and appetite peptides [49], though some evidence suggests that active individuals have higher fasting acylated ghrelin concentrations than inactive controls [50]. In line with this, reallocating sedentary time to MVPA in our cohort was associated with higher fasting acylated ghrelin concentrations, consistent with an adaptive signal to stimulate intake in response to elevated energy demands [51]. Acylated ghrelin responses to meals, however, did not differ, which may be expected given the marked postprandial decline observed across individuals (limiting variability in data). We also observed lower postprandial PYY concentrations with greater MVPA, a novel finding that fits the broader pattern of reduced satiety and higher intake [52]. In contrast, leptin, which primarily reflects longer-term energy reserves and adiposity [53], was not influenced by movement behaviour reallocations, likely because participants were weight stable.
The consistency of MVPA–energy intake associations across both dietary records and laboratory-based assessments strengthens confidence in these findings. While self-reported diaries are prone to underestimation [54], this bias is broadly systematic, whereas laboratory-based assessments provide greater precision but lower ecological validity. The convergence of both methods therefore provides robust evidence that reallocating sedentary time to MVPA is associated with higher energy intake in this population.
We also examined hedonic and cognitive influences on eating behaviour. Using the LFPQ [55], we assessed food reward (implicit and explicit liking and wanting), alongside the CoEQ (craving control and food cravings) [56] and the TFEQ (restraint, disinhibition, hunger) [57]. In contrast to our findings for energy intake and appetite physiology, reallocating sedentary time to MVPA, LPA, or sleep was unrelated to any of these outcomes. Prior research has suggested that habitual MVPA is associated with lower liking and wanting for high-fat foods [58,59] and attenuated neural reward responses to food cues [60,61], though such effects are most evident in less active or higher-adiposity populations, and the evidence from intervention studies is mixed [62]. The null findings in our study may therefore reflect the characteristics of our sample: young, active, and healthy adults with a well-regulated appetitive system and limited variability in eating behaviour traits. Furthermore, the questionnaires employed primarily capture trait-like or longer-term dispositions, which may be relatively insensitive to the subtle habitual reallocations in movement and sleep assessed here. This suggests that physical activity is more likely to influence appetite through acute physiological pathways as opposed to enduring cognitive or hedonic mechanisms in this population.
This study has several strengths, including the precise accelerometer-based assessment of 24-hour movement behaviours, the use of isotemporal substitution modelling to capture real-world behavioral trade-offs, and the integration of comprehensive outcome measures spanning energy intake, appetite perceptions, hormone responses, and psychological traits. To our knowledge, this is the first application of isotemporal substitution in this research area. Limitations should also be noted: the cross-sectional design prevents causal inference and raises the possibility of reverse causality, the homogeneous sample restricts generalisability to older, less active, or populations living with obesity, and the limited variability in sleep and LPA may have reduced power to detect associations. Finally, outcomes were measured on a single occasion, which may not fully capture longer-term patterns.
In conclusion, reallocating sedentary time to MVPA, but not LPA or sleep, was associated with higher energy intake, higher postprandial appetite, and hormonal changes consistent with compensatory responses to greater energy expenditure in young, healthy, and active adults. By contrast, trait-level eating behaviours were not associated with these reallocations, reinforcing the notion that physical activity may influence appetite primarily through acute physiological rather than cognitive mechanisms. These findings provide new insight into the interplay between daily movement behaviours and appetite regulation in free-living conditions and highlight the need for longitudinal and intervention-based research to establish causality and extend understanding to more diverse populations.
Supplementary Materials
Supplementary Figure S1. Adjusted change in energy intake (measured in the laboratory and field) associated with replacing 30 min of sedentary time with sleep or physical activity in Model 1 (adjusted for age, sex, ethnicity, and smoking status). Supplementary Table S1. Adjusted change in perceived ratings of appetite and appetite-related hormones associated with replacing 30 min of sedentary time with sleep or physical activity in Model 1 (adjusted for age, sex, ethnicity, and smoking status). Supplementary Table S2. Adjusted change in food reward (LFPQ), food cravings (CoEQ) and eating traits (TFEQ) associated with replacing 30 min of sedentary time with sleep or physical activity in Model 1 (adjusted for age, sex, ethnicity, and smoking status).
Author Contributions
Conceptualization, JAK, SAW, SM & AA; methodology, SAW, JPS, AR, JH.; software, AR, JH, SM, AA.; formal analysis, SM, AA, SAW, AET.; investigation, AA, SM, JAK, SAW; resources, DJS, DT, JAK.; data curation, AA, SM, SAW.; writing—original draft preparation, JAK, SM, AA.; writing—review and editing, SM, AA, JPS, AET, DJS, DT, JH, AR, SAW, JAK.; supervision, JAK, SAW, DJS; project administration, AA; funding acquisition, JAK, DJS. All authors have read and agreed to the published version of the manuscript.
Funding
The research was supported by the National Institute for Health and Care Research (NIHR) Leicester Biomedical Research Centre. The views expressed are those of the authors and not necessarily those of the NHS, the NIHR or the Department of Health and Social Care. Mrs Arwa Alruwaili received a PhD scholarship from King Saud bin Abdulaziz University for Health Sciences, Riyadh, Saudi Arabia.
Institutional Review Board Statement
The study was conducted according to the guidelines of the Declaration of Helsinki, and approved by Ethics Review Sub-Committee of Loughborough University (project ID: 10980; 30/09/2022)
Informed Consent Statement
Informed consent was obtained from all subjects involved in the study.
Data Availability Statement
The data presented in this study (anonymized) are available on request from the corresponding author.
Acknowledgments
We would like to thank all the participants that took part in this research study.
Conflicts of Interest
None of the authors have any conflicts of interest to declare.
Abbreviations
The following abbreviations are used in this manuscript:
| AU | Arbitrary units |
| AUC | Area under the curve |
| BMI | Body mass index |
| CI | Confidence interval |
| CoEQ | Control of Eating Questionnaire |
| ES | Effect size |
| LFPQ | Leeds Food Preference Questionnaire |
| PFC | Prospective food consumption |
| PYY | Peptide-YY |
| TFEQ | Three-Factor Eating Questionnaire |
| WASO | Wake after sleep onset |
References
- GBD 2021 Adult BMI Collaborators Global, Regional, and National Prevalence of Adult Overweight and Obesity, 1990-2021, with Forecasts to 2050: A Forecasting Study for the Global Burden of Disease Study 2021. Lancet 2025, 405, 813–838. [CrossRef]
- Johansen, V.B.I.; Petersen, J.; Lund, J.; Mathiesen, C.V.; Fenselau, H.; Clemmensen, C. Brain Control of Energy Homeostasis: Implications for Anti-Obesity Pharmacotherapy. Cell 2025, 188, 4178–4212.
- Jastreboff, A.M.; Aronne, L.J.; Ahmad, N.N.; Wharton, S.; Connery, L.; Alves, B.; Kiyosue, A.; Zhang, S.; Liu, B.; Bunck, M.C.; et al. Tirzepatide Once Weekly for the Treatment of Obesity. New England Journal of Medicine 2022, 1–12. [CrossRef]
- Wilding, J.P.H.; Batterham, R.L.; Calanna, S.; Davies, M.; Van Gaal, L.F.; Lingvay, I.; McGowan, B.M.; Rosenstock, J.; Tran, M.T.D.; Wadden, T.A.; et al. Once-Weekly Semaglutide in Adults with Overweight or Obesity. New England Journal of Medicine 2021, 384, 989–1002. [CrossRef]
- Wadden, T.A.; Chao, A.M.; Moore, M.; Tronieri, J.S.; Gilden, A.; Amaro, A.; Leonard, S.; Jakicic, J.M. The Role of Lifestyle Modification with Second-Generation Anti-Obesity Medications: Comparisons, Questions, and Clinical Opportunities. Curr Obes Rep 2023, 12, 453–473. [CrossRef]
- Pinkney, J.; Tarrant, M. Time for a New Agenda for Behavioural Treatment of Overweight and Obesity. Clin Obes 2024, 14, e12628. [CrossRef]
- MAYER, J.; ROY, P.; MITRA, K.P. Relation between Caloric Intake, Body Weight, and Physical Work. Am J Clin Nutr 1956, 4, 169–175. [CrossRef]
- Myers, A.; Gibbons, C.; Finlayson, G.; Blundell, J. Associations among Sedentary and Active Behaviours, Body Fat and Appetite Dysregulation: Investigating the Myth of Physical Inactivity and Obesity. Br J Sports Med 2017, 51, 1540–1544. [CrossRef]
- Beaulieu, K.; Hopkins, M.; Blundell, J.; Finlayson, G. Does Habitual Physical Activity Increase the Sensitivity of the Appetite Control System? A Systematic Review. Sports Medicine 2016, 46, 1897–1919. [CrossRef]
- Long, S.J.; Hart, K.; Morgan, L.M. The Ability of Habitual Exercise to Influence Appetite and Food Intake in Response to High- and Low-Energy Preloads in Man. British Journal of Nutrition 2002, 87, 517–523. [CrossRef]
- King, N.A.; Caudwell, P.P.; Hopkins, M.; Stubbs, J.R.; Naslund, E.; Blundell, J.E. Dual-Process Action of Exercise on Appetite Control: Increase in Orexigenic Drive but Improvement in Meal-Induced Satiety. Am J Clin Nutr 2009, 90, 921–927. [CrossRef]
- Rosenkilde, M.; Reichkendler, M.H.; Auerbach, P.; Toräng, S.; Gram, A.S.; Ploug, T.; Holst, J.J.; Sjödin, A.; Stallknecht, B. Appetite Regulation in Overweight, Sedentary Men after Different Amounts of Endurance Exercise: A Randomized Controlled Trial. J Appl Physiol 2013, 115, 1599–1609. [CrossRef]
- Martins, C.; Kulseng, B.; Rehfeld, J.F.; King, N.A.; Blundell, J.E. Effect of Chronic Exercise on Appetite Control in Overweight and Obese Individuals. Med Sci Sports Exerc 2013, 45, 805–812. [CrossRef]
- Dera, A.M.; Shen, T.; Thackray, A.E.; Hinton, E.C.; King, J.A.; James, L.; Morgan, P.S.; Rush, N.; Miyashita, M.; Batterham, R.L.; et al. The Influence of Physical Activity on Neural Responses to Visual Food Cues in Humans: A Systematic Review of Functional Magnetic Resonance Imaging Studies. Neurosci Biobehav Rev 2023, 152. [CrossRef]
- Al Khatib, H.K.; Harding, S. V.; Darzi, J.; Pot, G.K. The Effects of Partial Sleep Deprivation on Energy Balance: A Systematic Review and Meta-Analysis. Eur J Clin Nutr 2017, 71, 614–624; SUBJMETA=2814,284,459,499,692,700;KWRD=LIFESTYLE+MODIFICATION,NUTRITION,RISK+FACTORS. [CrossRef]
- Zhu, B.; Shi, C.; Park, C.G.; Zhao, X.; Reutrakul, S. Effects of Sleep Restriction on Metabolism-Related Parameters in Healthy Adults: A Comprehensive Review and Meta-Analysis of Randomized Controlled Trials. Sleep Med Rev 2019, 45, 18–30. [CrossRef]
- Chaput, J.P.; McHill, A.W.; Cox, R.C.; Broussard, J.L.; Dutil, C.; da Costa, B.G.G.; Sampasa-Kanyinga, H.; Wright, K.P. The Role of Insufficient Sleep and Circadian Misalignment in Obesity. Nature Reviews Endocrinology 2022 19:2 2022, 19, 82–97. [CrossRef]
- Spiegel, K.; Tasali, E.; Penev, P.; Van Cauter, E. Brief Communication: Sleep Curtailment in Healthy Young Men Is Associated with Decreased Leptin Levels, Elevated Ghrelin Levels, and Increased Hunger and Appetite. Ann Intern Med 2004, 141, 846–850. [CrossRef]
- Thackray, A.E.; Stensel, D.J. The Impact of Acute Exercise on Appetite Control: Current Insights and Future Perspectives. Appetite 2023, 186, 106557. [CrossRef]
- Blundell, J.E.; Beaulieu, K. The Complex Pattern of the Effects of Prolonged Frequent Exercise on Appetite Control, and Implications for Obesity. Appetite 2023, 183, 106482. [CrossRef]
- Biddle, G.J.H.; Henson, J.; Biddle, S.J.H.; Davies, M.J.; Khunti, K.; Rowlands, A. V.; Sutton, S.; Yates, T.; Edwardson, C.L. Modelling the Reallocation of Time Spent Sitting into Physical Activity: Isotemporal Substitution vs. Compositional Isotemporal Substitution. Int J Environ Res Public Health 2021, 18, 6210. [CrossRef]
- Covenant, A.; Yates, T.; Rowlands, A. V.; Dempsey, P.C.; Edwardson, C.L.; Hall, A.P.; Davies, M.J.; Henson, J. Replacing Sedentary Time with Sleep and Physical Activity: Associations with Physical Function and Wellbeing in Type 2 Diabetes. Diabetes Res Clin Pract 2024, 217. [CrossRef]
- Nagai, K.; Tamaki, K.; Kusunoki, H.; Wada, Y.; Tsuji, S.; Ito, M.; Sano, K.; Amano, M.; Shimomura, S.; Shinmura, K. Isotemporal Substitution of Sedentary Time with Physical Activity and Its Associations with Frailty Status. Clin Interv Aging 2018, 13, 1831–1836. [CrossRef]
- Park, J.; Nam, H.K.; Cho, S. Il Association between Accelerometer-Derived Physical Activity and Depression: A Cross-Sectional Study Using Isotemporal Substitution Analysis. BMJ Open 2024, 14, e078199. [CrossRef]
- Declaration of Helsinki World Medical Association Declaration of Helsinki: Ethical Principles for Medical Research Involving Human Participants. JAMA 2024, 333, 71–74. [CrossRef]
- Dalton, M.; Finlayson, G.; Hill, A.; Blundell, J. Preliminary Validation and Principal Components Analysis of the Control of Eating Questionnaire (CoEQ) for the Experience of Food Craving. Eur J Clin Nutr 2015, 69, 1313–1317. [CrossRef]
- Compher, C.; Frankenfield, D.; Keim, N.; Roth-Yousey, L. Best Practice Methods to Apply to Measurement of Resting Metabolic Rate in Adults: A Systematic Review. J Am Diet Assoc 2006, 106, 881–903. [CrossRef]
- Weir, J.B. de V. New Methods for Calculating Metabolic Rate with Special Reference to Protein Metabolism. J Physiol 1949, 109, 1–9. [CrossRef]
- van Hees, V.; Migueles, J.H. GGIR. 2025. [CrossRef]
- Migueles, J.H.; Rowlands, A. V.; Huber, F.; Sabia, S.; Van Hees, V.T. GGIR: A Research Community–Driven Open Source R Package for Generating Physical Activity and Sleep Outcomes From Multi-Day Raw Accelerometer Data. J Meas Phys Behav 2019, 2, 188–196. [CrossRef]
- Van Hees, V.T.; Sabia, S.; Anderson, K.N.; Denton, S.J.; Oliver, J.; Catt, M.; Abell, J.G.; Kivimäki, M.; Trenell, M.I.; Singh-Manoux, A. A Novel, Open Access Method to Assess Sleep Duration Using a Wrist-Worn Accelerometer. PLoS One 2015, 10, e0142533. [CrossRef]
- Covenant, A.; Yates, T.; Rowlands, A. V.; Dempsey, P.C.; Edwardson, C.L.; Hall, A.P.; Davies, M.J.; Henson, J. Replacing Sedentary Time with Sleep and Physical Activity: Associations with Physical Function and Wellbeing in Type 2 Diabetes. Diabetes Res Clin Pract 2024, 217. [CrossRef]
- Van Hees, V.T.; Fang, Z.; Langford, J.; Assah, F.; Mohammad, A.; Da Silva, I.C.M.; Trenell, M.I.; White, T.; Wareham, N.J.; Brage, S. Autocalibration of Accelerometer Data for Free-Living Physical Activity Assessment Using Local Gravity and Temperature: An Evaluation on Four Continents. J Appl Physiol 2014, 117, 738–744. [CrossRef]
- van Hees, V.T.; Sabia, S.; Jones, S.E.; Wood, A.R.; Anderson, K.N.; Kivimäki, M.; Frayling, T.M.; Pack, A.I.; Bucan, M.; Trenell, M.I.; et al. Estimating Sleep Parameters Using an Accelerometer without Sleep Diary. Sci Rep 2018, 8. [CrossRef]
- HILDEBRAND, M.; VAN HEES, V.T.; HANSEN, B.H.; EKELUND, U. Age Group Comparability of Raw Accelerometer Output from Wrist- and Hip-Worn Monitors. Med Sci Sports Exerc 2014, 46, 1816–1824. [CrossRef]
- Hildebrand, M.; Hansen, B.H.; van Hees, V.T.; Ekelund, U. Evaluation of Raw Acceleration Sedentary Thresholds in Children and Adults. Scand J Med Sci Sports 2017, 27, 1814–1823. [CrossRef]
- Alruwaili, A.; Nayeemullah, R.; Engin, B.; Malaikah, S.; James, L.; Sanders, J.P.; Thivel, D.; Thackray, A.E.; Stensel, D.J.; King, J.A.; et al. The Association of Cigarette Smoking with Appetite, Appetite-Related Hormones and Food Reward: A Matched-Pair Cohort Study. Appetite 2025, 214, 108194. [CrossRef]
- King, J.A.; Thackray, A.E.; Gibbons, C.; Martins, C.; Broom, D.R.; Stensel, D.J.; Papamargaritis, D.; Arsenyadis, F.; Finlayson, G.; Whelehan, G.; et al. The Mixed-Meal Tolerance Test as an Appetite Assay: Methodological and Practical Considerations. Int J Obes 2025, 1–16;SUBJMETA=163,2743,308,393,575,692;KWRD=OBESITY,TRANSLATIONAL+RESEARCH. [CrossRef]
- Flint, A.; Raben, A.; Blundell, J.E.; Astrup, A. Reproducibility, Power and Validity of Visual Analogue Scales in Assessment of Appetite Sensations in Single Test Meal Studies; 2000; Vol. 24;.
- Oustric, P.; Thivel, D.; Dalton, M.; Beaulieu, K.; Gibbons, C.; Hopkins, M.; Blundell, J.; Finlayson, G. Measuring Food Preference and Reward : Application and Cross-Cultural Adaptation of the Leeds Food Preference Questionnaire in Human Experimental Research. Food Qual Prefer 2020, 80, 103824. [CrossRef]
- Jetté, M.; Sidney, K.; Blümchen, G. Metabolic Equivalents (METS) in Exercise Testing, Exercise Prescription, and Evaluation of Functional Capacity. Clin Cardiol 1990, 13, 555–565. [CrossRef]
- Finlayson, G.; King, N.; Blundell, J. The Role of Implicit Wanting in Relation to Explicit Liking and Wanting for Food: Implications for Appetite Control. Appetite 2008, 50, 120–127. [CrossRef]
- Thackray, A.E.; Willis, S.A.; Clayton, D.J.; Broom, D.R.; Finlayson, G.; Goltz, F.R.; Sargeant, J.A.; Woods, R.M.; Stensel, D.J.; King, J.A. Influence of Short-Term Hyperenergetic, High-Fat Feeding on Appetite, Appetite-Related Hormones, and Food Reward in Healthy Men. Nutrients 2020, 12, 2635. [CrossRef]
- Biddle, G.J.H.; Henson, J.; Biddle, S.J.H.; Davies, M.J.; Khunti, K.; Rowlands, A. V.; Sutton, S.; Yates, T.; Edwardson, C.L. Modelling the Reallocation of Time Spent Sitting into Physical Activity: Isotemporal Substitution vs. Compositional Isotemporal Substitution. Int J Environ Res Public Health 2021, 18, 6210. [CrossRef]
- Stuart, E.A. Matching Methods for Causal Inference: A Review and a Look Forward. Stat Sci 2010, 25, 1. [CrossRef]
- Van Walleghen, E.L.; Orr, J.S.; Gentile, C.L.; Davy, K.P.; Davy, B.M. Habitual Physical Activity Differentially Affects Acute and Short-Term Energy Intake Regulation in Young and Older Adults. Int J Obes 2007, 31, 1277–1285. [CrossRef]
- Gregersen, N.T.; Møller, B.K.; Raben, A.; Kristensen, S.T.; Holm, L.; Flint, A.; Astrup, A. Determinants of Appetite Ratings: The Role of Age, Gender, BMI, Physical Activity, Smoking Habits, and Diet/Weight Concern. Food Nutr Res 2011, 55. [CrossRef]
- Beaulieu, K.; Hopkins, M.; Long, C.; Blundell, J.; Finlayson, G. High Habitual Physical Activity Improves Acute Energy Compensation in Nonobese Adults. Med Sci Sports Exerc 2017, 49, 2268–2275. [CrossRef]
- Dorling, J.; Broom, D.R.; Burns, S.F.; Clayton, D.J.; Deighton, K.; James, L.J.; King, J.A.; Miyashita, M.; Thackray, A.E.; Batterham, R.L.; et al. Acute and Chronic Effects of Exercise on Appetite, Energy Intake, and Appetite-Related Hormones: The Modulating Effect of Adiposity, Sex, and Habitual Physical Activity. Nutrients 2018, 10. [CrossRef]
- Lund, M.T.; Taudorf, L.; Hartmann, B.; Helge, J.W.; Holst, J.J.; Dela, F. Meal Induced Gut Hormone Secretion Is Altered in Aerobically Trained Compared to Sedentary Young Healthy Males. Eur J Appl Physiol 2013, 113, 2737–2747. [CrossRef]
- Lv, Y.; Liang, T.; Wang, G.; Li, Z. Ghrelin, A Gastrointestinal Hormone, Regulates Energy Balance and Lipid Metabolism. Biosci Rep 2018, 38. [CrossRef]
- Le Roux, C.W.; Batterham, R.L.; Aylwin, S.J.B.; Patterson, M.; Borg, C.M.; Wynne, K.J.; Kent, A.; Vincent, R.P.; Gardiner, J.; Ghatei, M.A.; et al. Attenuated Peptide YY Release in Obese Subjects Is Associated with Reduced Satiety. Endocrinology 2006, 147, 3–8. [CrossRef]
- Friedman, J.M. Leptin and the Endocrine Control of Energy Balance. Nat Metab 2019, 1, 754–764. [CrossRef]
- Livingstone, M.B.E.; Black, A.E. Markers of the Validity of Reported Energy Intake. Journal of Nutrition 2003, 133. [CrossRef]
- Finlayson, G.; King, N.; Blundell, J. The Role of Implicit Wanting in Relation to Explicit Liking and Wanting for Food: Implications for Appetite Control. Appetite 2008, 50, 120–127. [CrossRef]
- Dalton, M.; Finlayson, G.; Hill, A.; Blundell, J. Preliminary Validation and Principal Components Analysis of the Control of Eating Questionnaire (CoEQ) for the Experience of Food Craving. Eur J Clin Nutr 2015, 69, 1313–1317. [CrossRef]
- Stunkard, A.J.; Messick, S. The Three-Factor Eating Questionnaire to Measure Dietary Restraint, Disinhibition and Hunger. J Psychosom Res 1985, 29, 71–83. [CrossRef]
- Oustric, P.; Myers, A.; Gibbons, C.; Buckland, N.; Dalton, M.; Long, C.; Beaulieu, K.; Sophie Hollingworth, S.; Finlayson, G. Are Objectively Measured Free-Living Physical Activity and Sedentary Behaviour Associated with Control over Eating and Food Preferences in Women? Appetite 2018, 123, 465. [CrossRef]
- Horner, K.M.; Finlayson, G.; Byrne, N.M.; King, N.A. Food Reward in Active Compared to Inactive Men: Roles for Gastric Emptying and Body Fat. Physiol Behav 2016, 160, 43–49. [CrossRef]
- Killgore, W.D.S.; Kipman, M.; Schwab, Z.J.; Tkachenko, O.; Preer, L.; Gogel, H.; Bark, J.S.; Mundy, E.A.; Olson, E.A.; Weber, M. Physical Exercise and Brain Responses to Images of High-Calorie Food. Neuroreport 2013, 24, 962–967. [CrossRef]
- Luo, S.; O’Connor, S.G.; Belcher, B.R.; Page, K.A. Effects of Physical Activity and Sedentary Behavior on Brain Response to High-Calorie Food Cues in Young Adults. Obesity 2018, 26, 540–546. [CrossRef]
- Beaulieu, K.; Oustric, P.; Finlayson, G. The Impact of Physical Activity on Food Reward: Review and Conceptual Synthesis of Evidence from Observational, Acute, and Chronic Exercise Training Studies. Curr Obes Rep 2020, 9, 63–80. [CrossRef]
Figure 1.
Schematic illustration of study visit 2. LFPQ, Leeds Food Preference Questionnaire; MM-TT, mixed-meal tolerance test; VAS, visual analogue scale. (Reproduced from [37]).
Figure 1.
Schematic illustration of study visit 2. LFPQ, Leeds Food Preference Questionnaire; MM-TT, mixed-meal tolerance test; VAS, visual analogue scale. (Reproduced from [37]).
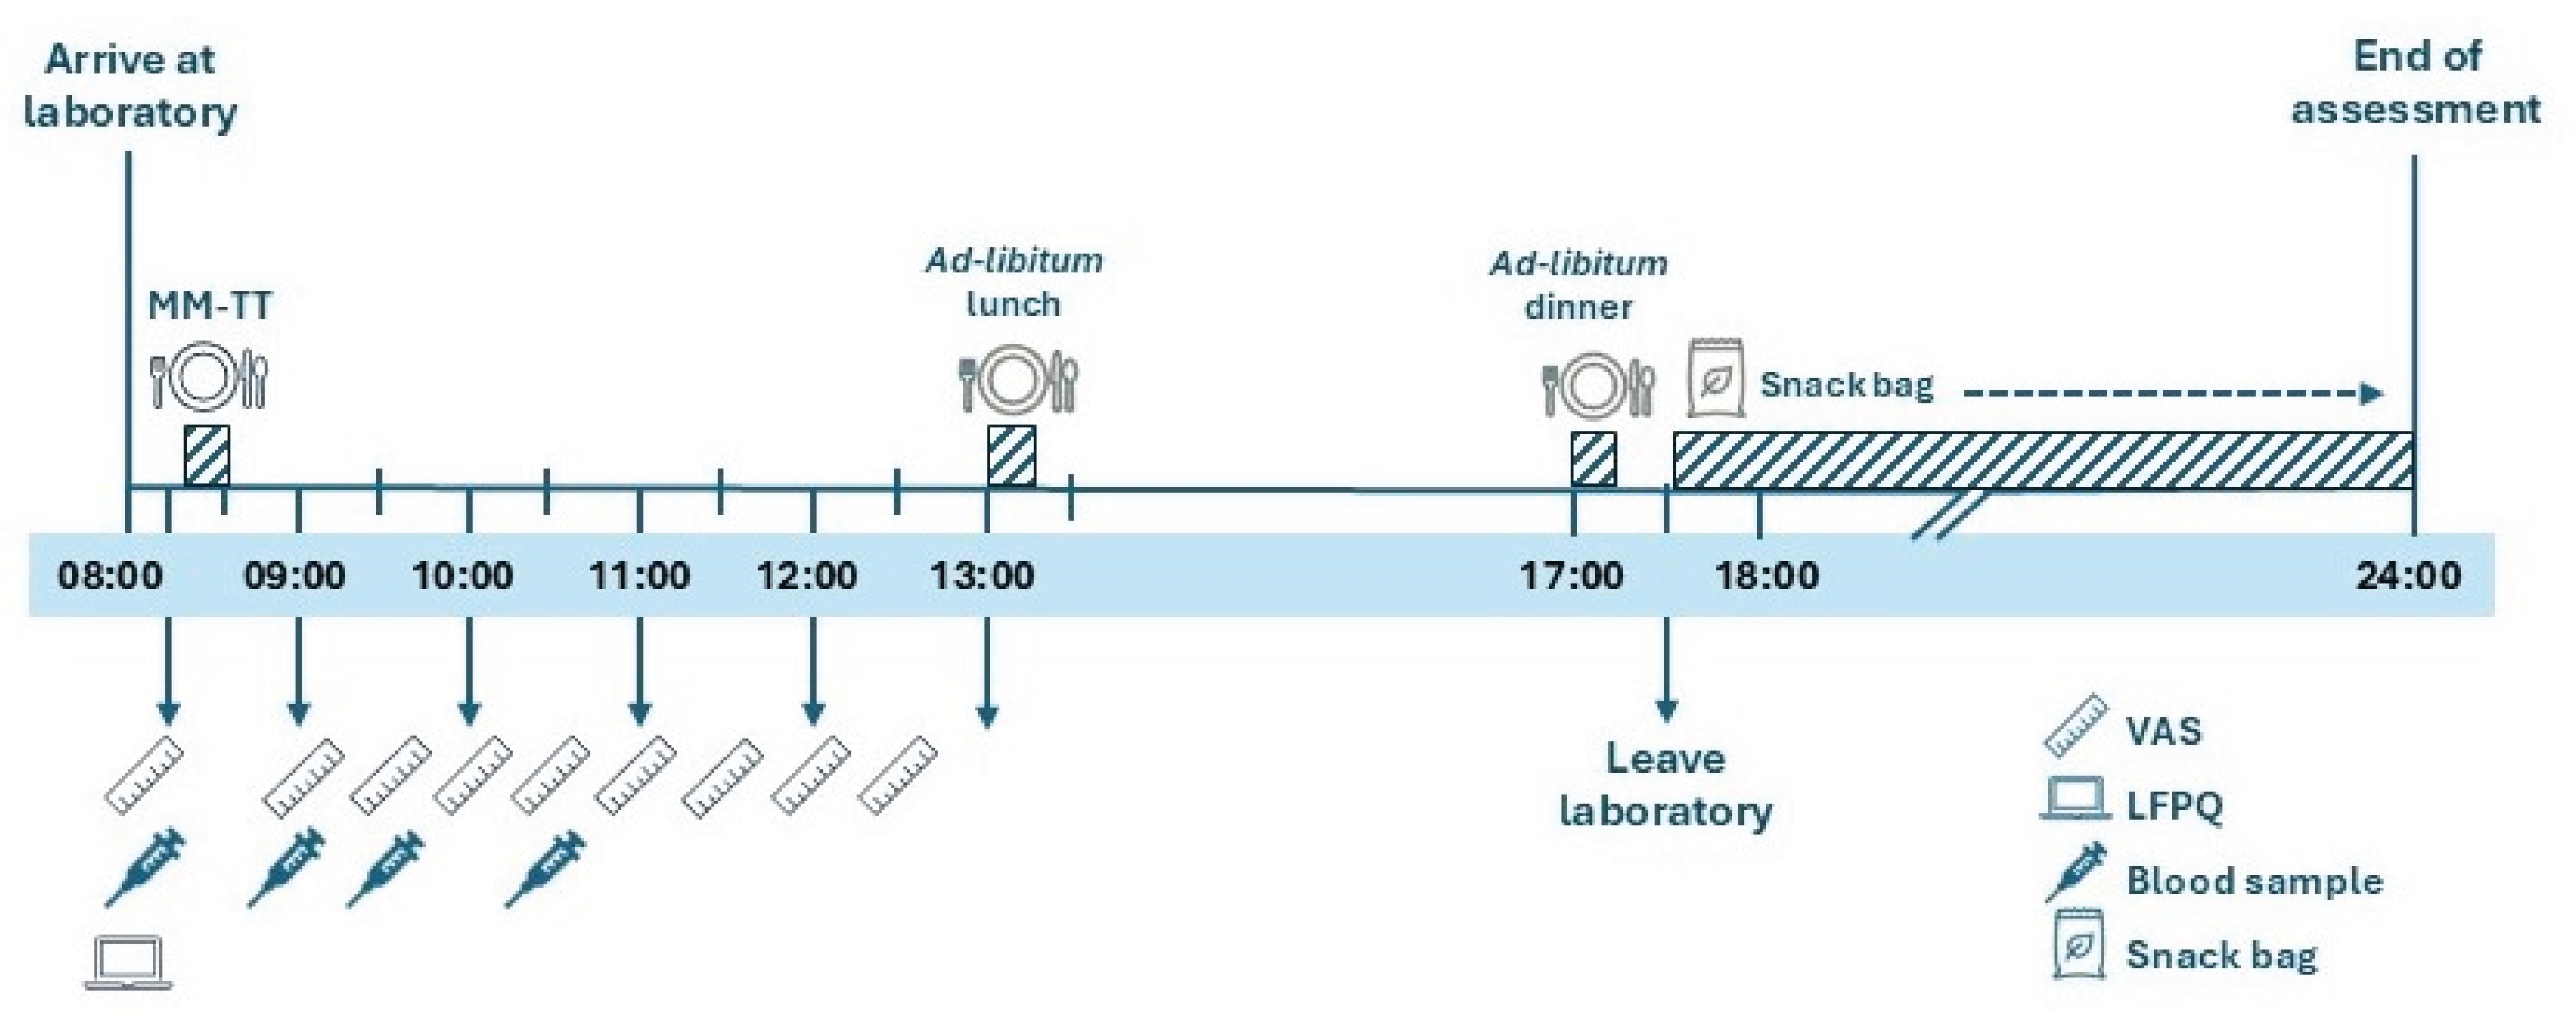
Figure 2.
Adjusted change in energy intake (measured in the laboratory and field) associated with replacing 30 min of sedentary time with sleep or physical activity in Model 2 (adjusted for age, sex, ethnicity, smoking status, and BMI).
Figure 2.
Adjusted change in energy intake (measured in the laboratory and field) associated with replacing 30 min of sedentary time with sleep or physical activity in Model 2 (adjusted for age, sex, ethnicity, smoking status, and BMI).
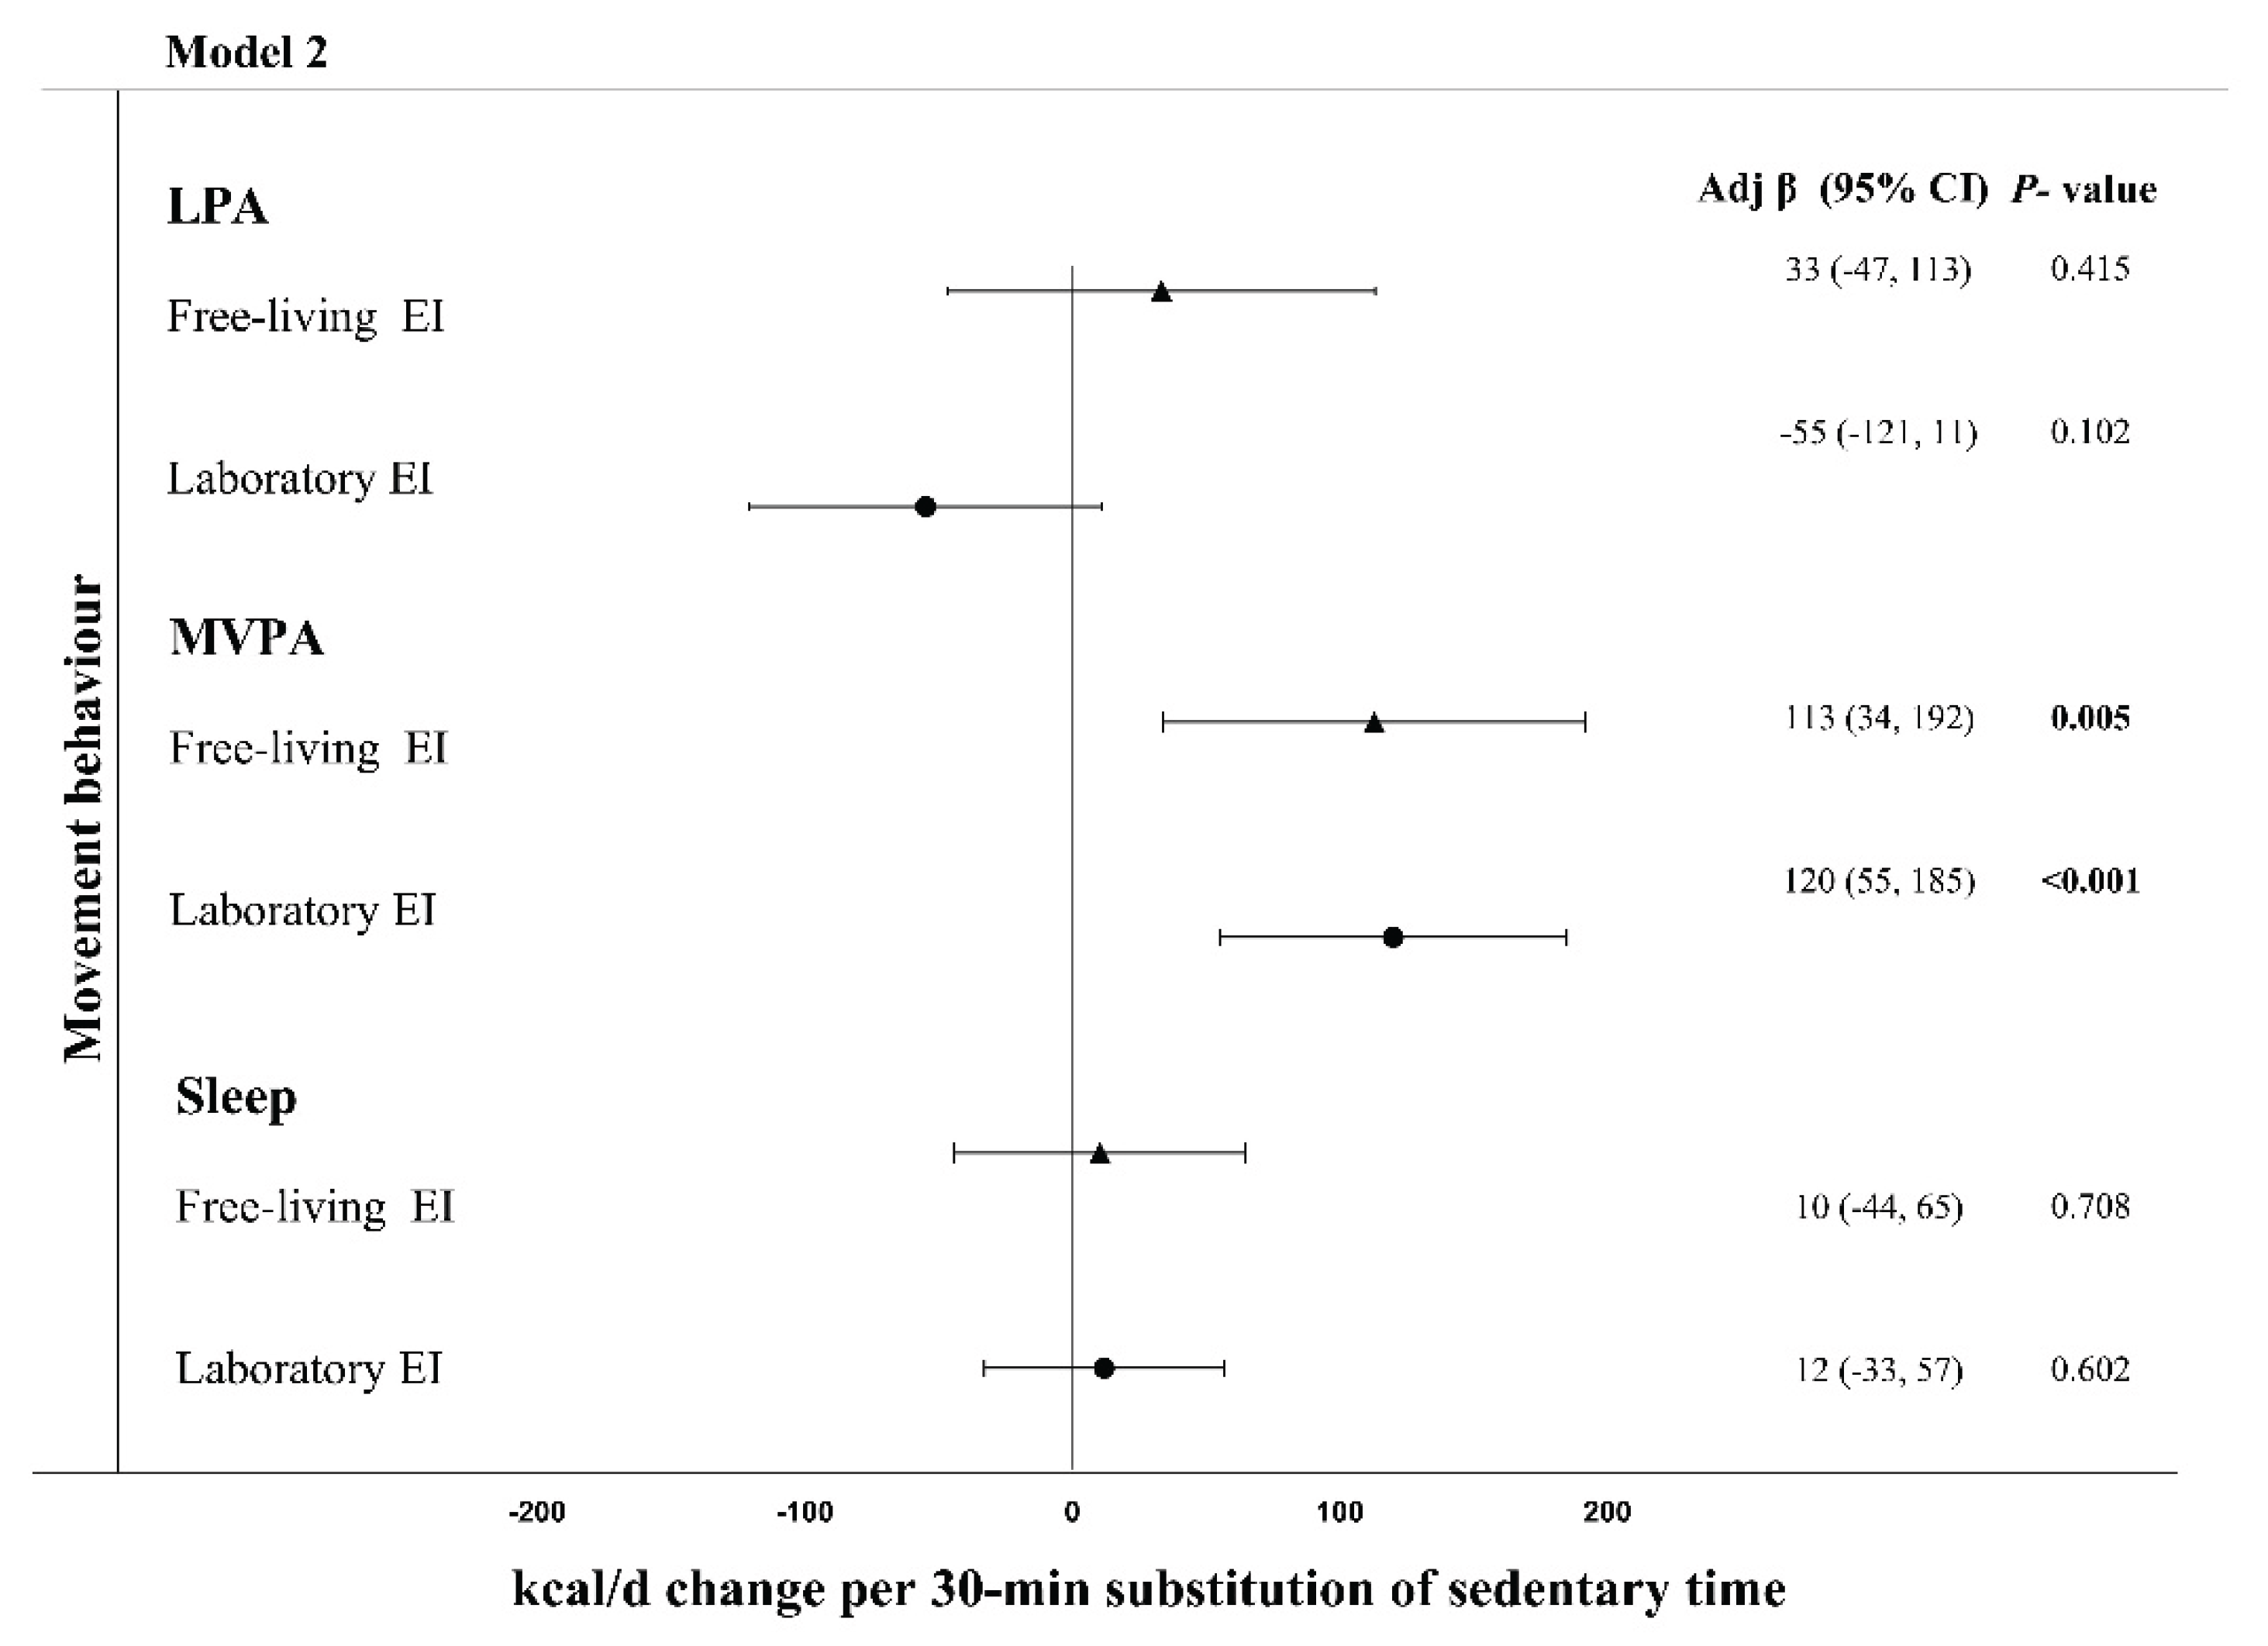
Table 1.
Participant characteristics (n = 119).
| Variable | |
| Sex (male) | 70 (58.8%) |
| Ethnicity | |
| White | 53 (44.5%) |
| Indian | 28 (23.5%) |
| Asian | 25 (21.0%) |
| Mixed | 6 (5.0%) |
| Black | 3 (2.5%) |
| Arab | 2 (1.7%) |
| Latino | 2 (1.7%) |
| Age (years) | 24 (9) |
| Body mass (kg) | 70.5 ± 12.8 |
| BMI (kg·m-2) | 23.6 (5.1) |
| Movement behaviours | |
| Sedentary time (min·d-1) | 704 ± 103 |
| LPA (min·d-1) | 194 ± 53 |
| MVPA (min·d-1) | 112 ± 50 |
| Sleep time during sleep period (min·d-1) | 336 ± 76 |
| WASO during sleep period (min·d-1) | 95 ± 49 |
| Total sleep period (min·d-1) | 430 ± 68 |
Data are presented for n = 119. Values are mean ± standard deviation (SD) for normally distributed variables, median and interquartile range (IQR) for non-normally distributed variables, and frequencies and percentages for categorical variables. LPA, light physical activity; MVPA, moderate-vigorous physical activity; WASO, wakefulness after sleep onset.
Disclaimer/Publisher’s Note: The statements, opinions and data contained in all publications are solely those of the individual author(s) and contributor(s) and not of MDPI and/or the editor(s). MDPI and/or the editor(s) disclaim responsibility for any injury to people or property resulting from any ideas, methods, instructions or products referred to in the content. |
© 2025 by the authors. Licensee MDPI, Basel, Switzerland. This article is an open access article distributed under the terms and conditions of the Creative Commons Attribution (CC BY) license (http://creativecommons.org/licenses/by/4.0/).
Copyright: This open access article is published under a Creative Commons CC BY 4.0 license, which permit the free download, distribution, and reuse, provided that the author and preprint are cited in any reuse.


