Submitted:
05 September 2025
Posted:
09 September 2025
You are already at the latest version
Abstract
Gene Regulatory Network (GRN) describes the regulatory interactions between transcription factors (TFs) and their target genes, playing a crucial role in understanding developmental biology, disease mechanisms, and drug target discovery. However, due to the complexity of gene regulation, inferring GRNs solely from gene expression data remains highly challenging. Additionally, deep learning models’ dependency high-quality annotation data further constrains their performance improvement. To address these challenges, this study proposes MultiGRNFormer, a Transformer-based model for multi-omics GRN inference. The key innovations of this model include: (1) Integration of transcriptomic and chromatin accessibility data—leveraging a Transformer encoder to effectively capture gene regulatory relationships and improve inference accuracy. (2) Incorporation of a positional encoding mechanism, enabling the model to be sensitive to the order of input features, and meanwhile the use of data augmentation strategies to generate diverse samples, thereby enhancing the utilization of training data. To evaluate the model’s performance, we conducted experiments on seven different single-cell multi-omics datasets and compared it with existing GRN inference methods. The results demonstrate that by combining multi-omics data integration with data augmentation strategies, superior performance in GRN inference tasks can be achieved. Our findings provide new insights for future deep learning-based GRN inference research.
Keywords:
network inference
; gene regulatory network
; deep learning
1. Introduction
Gene Regulatory Networks (GRNs) describe the interactions between transcription factors (TFs) and their target genes that control gene expression levels [1]. Understanding GRNs is crucial for deciphering developmental biology mechanisms, disease pathogenesis, and drug target discovery [2,3].
In recent years, deep learning techniques, based on their powerful nonlinear modeling capabilities, have demonstrated significant potential in the field of GRN inference [4,5]. However, existing deep learning-based approaches face a fundamental limitation: the extreme scarcity of high-quality labeled data [5,6,7]. Most datasets contain only hundreds to thousands of TF-gene regulatory pairs, significantly constraining the learning capacity of deep learning models. More critically, existing methods generally follow a “single-sample single-label” training paradigm, failing to fully exploit the latent information within limited datasets. Additionally, their insensitivity to input feature order makes it difficult to capture the dynamic and sequential associations in multi-omics data. For example, methods such as CNNC [8] and DGRNS[7] convert input data into image representations, which provide intuitive spatial relationships but lose positional information, which however is crucial for fully leveraging data and enhancing model performance.
Data augmentation plays a crucial role in deep learning, especially when the available data is limited. By applying random transformations to the original data—such as rotation, scaling, cropping, flipping, and adding noise—it effectively expands the dataset size, enhances the model’s generalization ability, and reduces the risk of overfitting [9]. Additionally, data augmentation helps models learn more robust features and improves their adaptability to complex scenarios. It has been widely applied in various fields, including computer vision, natural language processing, and bioinformatics, serving as a key technique for boosting the performance of deep learning models [10,11,12]. However, despite its extensive research and application in other domains, data augmentation remains underexplored in the field of GRN inference.
Furthermore, groundbreaking advances in single-cell multi-omics technologies now enable the simultaneous profiling of the transcriptome (scRNA-seq) and epigenome (scATAC-seq) within individual cells [13,14]. This provides a more comprehensive perspective for understanding gene transcription and regulation at the cellular level. Current research has demonstrated that integrating gene expression data with chromatin accessibility data for GRN inference can better distinguish direct from indirect regulatory relationships, reduce false positives and false negatives in inference results, and improve overall accuracy [15,16,17].
This study proposes MultiGRNFormer, a multi-omics inference framework based on the Transformer architecture [18]. This framework introduces two key innovations:
Multi-omics modeling of gene regulatory features: Unlike traditional single-omics inference models that rely only on transcriptomic data, MultiGRNFormer integrates both transcriptomic and chromatin accessibility data. By leveraging a Transformer encoder, our model simultaneously captures regulatory information from gene expression and chromatin accessibility to infer GRNs more accurately.
Data augmentation for GRN inference: We introduce positional encoding to make the model sensitive to input feature order. Additionally, we apply dynamic input reordering to generate multiple training samples from single-label data, effectively augmenting the dataset and improving learning efficiency.
To evaluate the performance of MultiGRNFormer, we conducted experiments on seven different datasets, comparing our approach with existing single-omics inference models. Experimental results across these datasets demonstrate that MultiGRNFormer achieves superior performance in GRN inference. Furthermore, our experiments confirm that the proposed data augmentation method significantly enhances model prediction performance. We also explored the feasibility of cross-dataset joint training. Cross-dataset experiments revealed that training across datasets yields significant advantages on most benchmarks, indicating that increased data diversity helps the model extract universal regulatory patterns across tissues. Finally, ablation studies confirm that integrating multi-omics data provides MultiGRNFormer with richer regulatory information, thereby improving inference accuracy.
2. Materials and Methods
2.1. Datasets
The study used seven publicly available datasets, which consist of scRNA-ATAC-seq data from different tissues of both human and mouse [19,20,21].
In the field of GRN, there has been a persistent lack of real-world networks for model evaluation. As a result, in the GRN inference literature, a common and expedient practice is to evaluate the accuracy of a resulting network by comparing its edges to an appropriate database of TFs and their targets. Therefore, We utilized the non-cell type-specific transcriptional regulatory network ChIP-seq data provided by BEELINE[22] and the functional interactions from the STRING[23] database as ground truth networks. Statistical data are shown in Table 1.
2.2. Data Preprocessing
We first preprocessed the raw count matrices for scRNA-seq and scATAC-seq of the dataset. For each count matrix, we denoted rows as features (genes or peak regions) and columns as cells throughout the paper below. Each data matrix was removed if a row or column contained less than 0.1% non-zero values. Data quality control was performed by Seurat V4, including but not limited to total read counts, mitochondrial gene ratios, and blacklist ratios [24]. After quality control, we selected the top 1,000 highly variable genes for subsequent analyzes based on gene variance, and the final gene expression matrix and chromatin accessibility matrix were obtained. The gene expression matrix was denoted as , with totally genes and cells. The chromatin accessibility matrix was denoted as , which has peak regions in cells.
To apply the chromatin accessibility data to GRNs inference, we used the method described in MAESTRO[25] to calculate the peak region in as the regulatory potential of the corresponding gene. Specifically, based on the distance between peak and gene in the genome, the regulatory potential weight of peak for gene is denoted as and calculated as follows:
where denotes the distance from the center of peak to the transcriptional starting site of gene , and is the half-decay of that distance (set to 10kb). The regulatory potential of peak for gene is usually calculated as . If , should be less than 0.0005, and in order to save computational time, we set it to 0. In MAESTRO, to better fit the gene expression model, if peak is located in the exon region of the gene, should be 1 according to the formula. But since reads tend to be located in longer exons than shorter exons, to normalize the likelihood of background reads, the total exon reads were normalized by the total exon length of each gene exon. The peak regulatory potential of gene in cell can then be calculated as:
Finally, the scATAC-seq matrix is transformed into the gene regulatory potential matrix by summing the regulatory potential scores of peaks regulating the same gene:
2.3. The MultiGRNFormer framework
MultiGRNFormer is inspired by the design concept of STGRNS[4], utilizing a Transformer architecture to capture intercellular gene expression variations. However, unlike STGRNS, which aggregates multiple cells into motifs, we designed a novel input structure to enhance the model’s sensitivity to intercellular gene expression changes. Additionally, our input design enables MultiGRNFormer to capture the regulatory state of genes within each cell by integrating multimodal data. Specifically, in addition to transcriptomic data traditionally used by existing models, we incorporate chromatin accessibility data to provide an alternative perspective on the gene regulatory process. MultiGRNFormer consists of four key components: an Input Constructor , a Positional Encoder, a Multiple Transformer Encoders, and a Regulation Predictor , as illustrated in Figure 1c.
Input Data: MultiGRNFormer takes two modalities of input data: the gene expression matrix and the gene regulatory potential matrix , where denotes the number of genes, and represents the number of cells.
Input Constructor: The format of data input plays a critical role in maximizing the model’s feature extraction capabilities. Thus, we carefully designed an Input Constructor to structure the input data effectively. For a given transcription factor (TF) and target gene , their gene expression values in the th cell are and , respectively, while their regulatory potential values are and . To ensure the model accurately captures the regulatory state of a gene within a single cell, we concatenate all relevant data from the same cell into a single feature vector: . We retain only the cells where both TF and gene are expressed to minimize the impact of missing values. Then, we randomly sample cells from this set (with replacement if the available number of cells is less than ). Finally, the model input is structured as: .
Positional Encoding: Since the Transformer encoder lacks an inherent understanding of positional information in the input data, we apply positional encoding to in order to obtain , computed as follows:
where is the positional encoding function. We adopt a sinusoidal positional encoding scheme, where sine functions are applied to odd-indexed elements and cosine functions are applied to even-indexed elements:
where denotes the position of a cell in , and represents the feature index, even indices corresponding to and odd indices to .
Multiple Transformer Encoders: We employ a multi-layer Transformer encoder [18] with residual connections to extract multi-omics features that define gene regulatory interactions. The self-attention mechanism in the Transformer encoder allows the model to focus more on cells that provide strong regulatory evidence. The hierarchical multi-layer structure enhances the model’s ability to capture higher-order interactions, while residual connections mitigate the issues of gradient vanishing and explosion commonly observed in deep networks.
Specifically, our encoder consists of multiple identical Transformer layers, each comprising two sublayers: multi-head self-attention and a position-wise feed-forward network, as illustrated in Figure 1b. The transformation between layers is formally defined as:
where denotes the feature representation at the th encoder layer. In our model, , since each sample includes two gene expression values and two regulatory potential values.
where are the query, key, and value projection matrices, respectively, with , in which is the number of attention heads. The scaled dot-product attention is computed as:
The outputs from all attention heads are concatenated and linearly projected to form the final representation:
The position-wise feed-forward network (FFN) consists of two linear transformations with a activation function:
where expands the dimension by a factor of 4, and projects it back to the original size.
Regulation Predictor: We employ a multi-layer perceptron (MLP) as the regulation predictor. First, the regulatory features obtained from the Transformer encoder, , are flattened into a one-dimensional vector:
Then, is passed through the MLP to predict the regulatory probability between TF and gene :
where denotes the activation function.
Parameter Optimization: To train the model, we minimize the Binary Cross Entropy (BCE) loss between the predicted regulatory interactions and ground truth labels, enabling the model to distinguish fine-grained regulatory relationships:
where denotes the th TF-gene pair and denotes the label of the th TF-gene pair.
2.4. Experimental Setting and Hyperparameter Optimization
For each real network, we use 4/5 of the set of positive labels as the training set and 1/5 of the positive labels as the test set. Due to the high imbalance of the dataset (as in Table 1), we randomly sampled negative individuals in the unobserved links. The training set was constructed with an equal number of positive and negative individuals. For the test set, we employed the following sampling strategy to simulate real-world sparse regulatory networks:
where represents the number of edges in the regulatory network of the dataset, and denote the number of transcription factors (TFs) and genes, respectively. and represent the number of positive and negative individuals in the test set. This widely adopted approach aims to evaluate model performance under biologically realistic conditions where interaction networks are extremely sparse.
The baseline methods included in this paper are:
- CNNC [8]: predicts GRNs using deep convolutional neural networks.
- STGRNS [4]: a supervised learning method based on Transformer architecture.
- GENIE3 [26]: an unsupervised learning method based on random forests that constructs GRNs using regression coefficient weights.
- GRNBoost2 [27]: an unsupervised learning method for GRN inference using random gradient boosting regression and early stopping regularization.
For a fair comparison of the models, all models were trained on the same training sets and model performance was compared on the same test sets. Due to the high imbalance of government nutrients in the test set, we use the AUPRC metric, in addition to the AUROC metric, to measure the ability of the models to identify positive individuals.
3. Results
3.1. Parameter analysis
MultiGRNFormer is influenced by several key parameters: the number of sampled cells , the number of encoder layers, and the hidden layer size of the MLP. To determine an optimal set of parameters, we conducted a parameter analysis on two datasets, Human-bone and Human-breast. We selected these datasets of different sizes and performed five-fold cross-validation on the training sets of each dataset using various parameter combinations. Specifically, the training set was equally divided into five subsets, with one subset iteratively held out as the validation subset while the others were used for training. Final performance metrics were averaged across all validation rounds.
The optimal parameter combinations differed significantly between the two datasets: for Human-bone, the optimal combination was that , encoder layers is 2, and MLP hidden size is 1024; while for Human-breast, it was that , encoder layers is 1, and MLP hidden size is 512. We hypothesize that this discrepancy is related to dataset size. To select an appropriate set of parameters, we averaged the results across different parameter settings, as shown in Figure 2. The results indicate that the model is not highly sensitive to the number of encoder layers and the hidden layer size of the MLP, as different values for these parameters had minimal impact on performance. However, the number of sampled cells had a significant impact. The optimal value for was 800 for Human-bone and 500 for Human-breast, likely due to the larger dataset benefiting from a higher . The number of encoder layers exhibited similar trends across both datasets, with one layer performing the worst and two to three layers yielding competing results. The hidden layer size of the MLP showed consistent performance across all tested values. Given the fact that most datasets are similar in size to or smaller than Human-breast, we adopted the parameter combination of , encoder layers is 2, and MLP hidden size is 128 for all experiments unless otherwise specified.
3.2. Performance of MultiGRNFormer in Gene Regulatory Network Inference
To evaluate the performance of our model, we conducted a comprehensive benchmark test against four established methods across seven datasets, with results shown in Figure 3. MultiGRNFormer achieved the best performance on most datasets, particularly excelling in the AUPRC metric, where it outperformed all other models across all datasets. However, on some datasets, the AUROC metric approached random comparison outcome. This phenomenon may be attributed to the highly imbalanced test sets, where the overwhelming presence of negative samples allows AUROC to be dominated by the true negative rate (TN). As a result, slight model performance improvements may not be reflected in the AUROC scores. In the TFS+1000 tests, MultiGRNFormer outperformed others on both AUROC and AUPRC. Specifically, our model achieved higher AUROC scores than in the TFS+500 setting, whereas AUPRC scores exhibited a slight decline. This suggests that an increase in training data improved model performance in AUROC, but the more imbalanced nature of the TFS+1000 test set counteracted the benefits by reducing recall.
3.3. Enhancing MultiGRNFormer Performance through Data Augmentation
A primary challenge in deep learning-based gene regulatory network inference is the limited availability of labeled data, which constrains the scale of deep learning models. Deep learning models are highly sensitive to training data size, with larger training sets generally leading to better performance. As shown in Figure 3, all deep learning models achieved the best results on the largest dataset (human bone). MultiGRNFormer incorporates a positional encoding module, enabling the model to be sensitive to input order. Leveraging this feature, we designed a novel data augmentation strategy: without altering the gene regulatory relationships, we generate multiple training samples by randomly shuffling the input order of a TF-gene label. This approach modifies the relative positions of cells in the input data while preserving the regulatory relationships between genes, thereby expanding the size of the training dataset.
We expanded the training sets from three datasets by different augmentation factors and evaluated performance using their respective test sets. Applying this approach in the TFS+1000 setting, as shown in Figure 4, we observed performance improvements as the augmentation factor increased. For the largest dataset, Human-bone, applying a fivefold data augmentation led to a 5.6% increase in AUROC and a 2.2% increase in AUPRC compared to no augmentation. For Human-breast, the respective improvements were 3.7% and 2%. On the smallest dataset, Human-jejunum, augmentation effects were negligible for factors of 2–4 but became significant at a factor of 5. We further applied fivefold data augmentation across all seven datasets (Figure 5) and found consistent performance improvements, suggesting that our model captures regulatory relationships by leveraging gene expression variations across different cells.
3.4. Cross-Dataset Learning to Improve MultiGRNFormer Performance
Based on the effectiveness of data augmentation, we investigated whether MultiGRNFormer could leverage features learned from other datasets to enhance performance on a target dataset. We designed an experiment where the model was pre-trained on multiple datasets (25 epochs) before being fine-tuned on the target dataset (10 epochs) and evaluated on the target test set. As shown in Figure 6a, this approach yielded limited improvements, with most datasets showing no significant advantage. We hypothesize that the current training data scale does not sufficiently mitigate batch effects across datasets. To address this, we repeated the experiment using fivefold data augmentation for all training datasets. The results in Figure 6b indicate that the combined approach (cross-dataset & Augmented 5) significantly improved model performance compared to augmentation alone. This suggests that integrating data augmentation and cross-dataset training not only mitigates batch effects but also enables the model to learn more generalizable gene regulatory relationships.
On most datasets, the cross-dataset & Augmented 5 approach substantially improved model performance, with AUROC increasing by an average of 4.7% and AUPRC by 2.7%. However, performance gains varied across species. In the five human datasets, AUROC improved by an average of 6.4% and AUPRC by 3.7%. In contrast, the two mouse datasets showed minimal improvement (AUROC +0.5%, AUPRC +0.1%), with a performance decline observed in the mouse-brain dataset. We attribute this to two factors: (1) the mouse datasets were significantly smaller than the human datasets, containing only a few hundred regulatory interactions, which remained insufficient even after augmentation, and (2) interspecies differences likely exceeded batch effects, which our model struggled to account for.
We conducted additional experiments to explore the feasibility of training a universal model capable of inferring gene regulatory networks across datasets. In these experiments, we trained models on the six remaining datasets (with fivefold data augmentation) and directly evaluated them on the target dataset’s test set, without fine-tuning on its training set. The resulting models performed only slightly better than random predictions. This suggests that training on the target dataset remains crucial for learning dataset-specific batch effects, indicating that our current model cannot fully eliminate these effects.
3.5. Leveraging Multi-Omics Data to Enhance MultiGRNFormer Performance
In all previous experiments, we utilized multi-omics datasets for model training. To assess whether our model benefits from multi-omics data, we conducted experiments using only transcriptomic data, with results shown in Figure 7. In most cases, multi-omics data outperformed transcriptomics alone, particularly in the data augmentation (Figure 7b) and cross-dataset training (Figure 7c) experiments, where AUROC increased by 1.4% and 2.5%, respectively, and AUPRC increased by 1.1% and 1.9%. However, in standard training (Figure 7a), multi-omics data did not provide a significant advantage. This suggests that without data augmentation or cross-dataset training, the traditional “single-sample, single-label” method is insufficient to capture dynamic correlations across omics layers. By contrast, data augmentation and cross-dataset training provided sufficient samples, allowing MultiGRNFormer to leverage multi-omics data more effectively, leading to superior performance in these experimental settings.
4. Discussion
This study systematically validates the superior performance of MultiGRNFormer newly proposed in gene regulatory network (GRN) inference driven by multi-omics data. Experimental results demonstrate that by integrating transcriptomic (scRNA-seq) and chromatin accessibility (scATAC-seq) data, a well-trained model can effectively capture dynamic changes in gene expression and the open states of regulatory elements, thereby reducingfalse positives in unimodal inference. In data augmentation and cross-dataset joint training scenarios, the multi-omics model achieved average AUPRC improvements of 1.1% and 1.9%, respectively, compared to using transcriptomic data alone. To address the challenge of limited labeled data, we propose an input sequence randomization-based augmentation strategy, which enhances data utilization efficiency by generating multiple perspectives from a single sample. This technique increases the effective use of limited labeled data by fivefold, leading to AUROC and AUPRC improvements of 5.6% and 2.2%, respectively, on the largest dataset (human bone). Meanwhile, for smaller datasets such as human-jejunum, the enhancement effect follows a nonlinear accumulation pattern, highlighting the role of data augmentation in improving the generalization ability of deep learning models in GRN inference.
Further investigation reveals that the synergy between cross-dataset training and data augmentation can overcome the limitations of single-dataset training. When combined with data augmentation, cross-dataset training improves AUROC by an average of 6.4% and AUPRC by 3.7% across five human datasets, indicating that the model can capture regulatory patterns across different tissues. However, cross-species training (e.g., human-to-mouse) does not perform well and may even lead to performance degradation, underscoring the challenge of improving model performance through cross-species training.
Although fully cross-dataset “zero-shot” inference has not yet been achieved, the combination of data augmentation and cross-dataset training has demonstrated superior performance over single-dataset training in most cases, suggesting that MultiGRNFormer has the potential to learn generalizable regulatory patterns. The model performs particularly well in multi-omics-driven scenarios. While the advantage of multi-omics is limited under conventional training, its performance surpasses unimodal approaches significantly when combined with data augmentation and cross-dataset training, confirming that leveraging complementary multimodal features requires sufficient training samples. These findings provide new insights for future GRN inference model development.
This study demonstrates the superior performance of MultiGRNFormer in multi-omics-driven gene regulatory network (GRN) inference; however, several promising research directions remain open for future exploration. Subsequent work may proceed along the following avenues: First, to construct a more comprehensive and accurate representation of the regulatory landscape, future versions of MultiGRNFormer could be extended to incorporate additional modalities—such as DNA methylation [28], histone modifications [29], and 3D chromatin conformation [30]. A major challenge will be to develop effective methods for aligning and integrating these heterogeneous data types within a unified deep learning framework. Second, future research could investigate more advanced attention mechanisms or graph neural network architectures to better capture the complex, non-linear interactions between transcriptomic and epigenomic data.
Author Contributions
Conceptualization, H.C. and D.L.; methodology, J.W. and Y.W.; software, D.L.; validation, H.C., J.W. and Y.W.; formal analysis, H.C.; investigation, Y.W.; resources, J.W. and Y.W.; data curation, D.L.; writing—original draft preparation, H.C. and D.L.; writing—review and editing, J.W. and Y.W.; visualization, H.C.; supervision, J.W. and Y.W.; project administration, J.W.; funding acquisition, Y.W. All authors have read and agreed to the published version of the manuscript.
Funding
This research was funded by the National Natural Science Foundation of China, Grant Number: 32302241; National Key Research and Development Program of China, grant number: 2024YFF1106705.
Data Availability Statement
The human bone dataset was downloaded from NCBI Gene Expression Omnibus under accession number GSE263178 (https://www.ncbi.nlm.nih.gov/geo/query/acc.cgi?acc=GSE255646). The mouse brain single-cell dataset was downloaded from the 10x Genomics website (https://www.10xgenomics.com/datasets/fresh-embryonic-e-18-mouse-brain-5-k-1-standard-2-0-0). The mouse kidney nuclei dataset was downloaded from the 10x Genomics website (https://www.10xgenomics.com/datasets/mouse-kidney-nuclei-isolated-with-chromium-nuclei-isolation-kit-saltyez-protocol-and-10x-complex-tissue-dp-ct-sorted-and-ct-unsorted-1-standard). The human jejunum nuclei dataset was downloaded from the 10x Genomics website (https://www.10xgenomics.com/datasets/human-jejunum-nuclei-isolated-with-chromium-nuclei-isolation-kit-saltyez-protocol-and-10x-complex-tissue-dp-ct-sorted-and-ct-unsorted-1-standard). The human kidney cancer nuclei dataset was downloaded from the 10x Genomics website (https://www.10xgenomics.com/datasets/human-kidney-cancer-nuclei-isolated-with-chromium-nuclei-isolation-kit-saltyez-protocol-and-10x-complex-tissue-dp-ct-sorted-and-ct-unsorted-1-standard). The human breast dataset was downloaded from NCBI Gene Expression Omnibus under accession number GSM7821208 (https://www.ncbi.nlm.nih.gov/geo/query/acc.cgi?acc=GSM7821208).The human PBMC dataset was downloaded from the 10x Genomics website (https://www.10xgenomics.com/datasets/10-k-human-pbm-cs-multiome-v-1-0-chromium-x-1-standard-2-0-0). Retrieve the two ground-truth networks used in this study from BEELINE(https://zenodo.org/records/3701939).
Conflicts of Interest
The authors declare no conflicts of interest.
References
- Kim, J., et al., The co-regulation mechanism of transcription factors in the human gene regulatory network. Nucleic Acids Res, 2012. 40(18): p. 8849-61.
- Karlebach, G. and R. Shamir, Modelling and analysis of gene regulatory networks. Nature Reviews Molecular Cell Biology, 2008. 9(10): p. 770-780. [CrossRef]
- Zhao, M., et al., A comprehensive overview and critical evaluation of gene regulatory network inference technologies. Brief Bioinform, 2021. 22(5). [CrossRef]
- Xu, J., et al., STGRNS: an interpretable transformer-based method for inferring gene regulatory networks from single-cell transcriptomic data. Bioinformatics, 2023. 39(4). [CrossRef]
- Chen, J., et al., DeepDRIM: a deep neural network to reconstruct cell-type-specific gene regulatory network using single-cell RNA-seq data. Briefings in bioinformatics, 2021. 22(6). [CrossRef]
- KC, K., et al., GNE: a deep learning framework for gene network inference by aggregating biological information. BMC Systems Biology, 2019. 13(S2). [CrossRef]
- Zhao, M., et al., A hybrid deep learning framework for gene regulatory network inference from single-cell transcriptomic data. Brief Bioinform, 2022. 23(2). [CrossRef]
- Yuan, Y. and Z. Bar-Joseph, Deep learning for inferring gene relationships from single-cell expression data. Proc Natl Acad Sci U S A, 2019. 116(52): p. 27151-27158. [CrossRef]
- Xu, M., et al., A Comprehensive Survey of Image Augmentation Techniques for Deep Learning. PATTERN RECOGNITION, 2023. 137. [CrossRef]
- Liu, G., et al., RFCS-YOLO: Target Detection Algorithm in Adverse Weather Conditions via Receptive Field Enhancement and Cross-Scale Fusion. Sensors (Basel), 2025. 25(3). [CrossRef]
- Du Y, et al., Improving Biomedical Question Answering by Data Augmentation and Model Weighting. IEEE/ACM Trans Comput Biol Bioinform, 2023. 20(2): p. 1114-1124. [CrossRef]
- Zhang, R., Y. Yu and C. Zhang, {S}eq{M}ix: Augmenting Active Sequence Labeling via Sequence Mixup. 2020: Online. p. 8566--8579.
- Kim, D., et al., Gene regulatory network reconstruction: harnessing the power of single-cell multi-omic data. NPJ Syst Biol Appl, 2023. 9(1): p. 51. [CrossRef]
- Badia-I-Mompel, P., et al., Gene regulatory network inference in the era of single-cell multi-omics. Nat Rev Genet, 2023. 24(11): p. 739-754. [CrossRef]
- Zhang, S., et al., Inference of cell type-specific gene regulatory networks on cell lineages from single cell omic datasets. Nat Commun, 2023. 14(1): p. 3064. [CrossRef]
- Bravo González-Blas, C., et al., SCENIC+: single-cell multiomic inference of enhancers and gene regulatory networks. Nature Methods, 2023. 20(9): p. 1355-1367. [CrossRef]
- Song, Q., M. Ruffalo and Z. Bar-Joseph, Using single cell atlas data to reconstruct regulatory networks. Nucleic Acids Research, 2023. 51(7): p. e38-e38. [CrossRef]
- Vaswani, A., et al., Attention Is All You Need. arXiv, 2017.
- Binder, M., et al., Bone marrow stromal cells induce chromatin remodeling in multiple myeloma cells leading to transcriptional changes. Nat Commun, 2024. 15(1): p. 4139. [CrossRef]
- Bhat-Nakshatri, P., et al., Single nuclei chromatin accessibility and transcriptomic map of breast tissues of women of diverse genetic ancestry. bioRxiv, 2023: p. 2023.10.04.560911.
- 10k Human PBMCs, single cell multiome ATAC gene expression demonstration data by Cell Ranger ARC 1.0.0, 10x Genomics, (2021).
- Pratapa, A., et al., Benchmarking algorithms for gene regulatory network inference from single-cell transcriptomic data. Nature methods, 2020. 17(2): p. 147-154. [CrossRef]
- Szklarczyk, D., et al., The STRING database in 2023: protein-protein association networks and functional enrichment analyses for any sequenced genome of interest. Nucleic Acids Res, 2023. 51(D1): p. D638-D646. [CrossRef]
- Ma, A., et al., Single-cell biological network inference using a heterogeneous graph transformer. Nature communications, 2023. 14(1): p. 964-964. [CrossRef]
- Wang, C., et al., Integrative analyses of single-cell transcriptome and regulome using MAESTRO. Genome Biology, 2020. 21(1). [CrossRef]
- Huynh-Thu, V.A., et al., Inferring regulatory networks from expression data using tree-based methods. PLoS One, 2010. 5(9). [CrossRef]
- Moerman, T., et al., GRNBoost2 and Arboreto: efficient and scalable inference of gene regulatory networks. Bioinformatics, 2019. 35(12): p. 2159-2161. [CrossRef]
- Li, S. and T.O. Tollefsbol, DNA methylation methods: Global DNA methylation and methylomic analyses. Methods, 2021. 187: p. 28-43. [CrossRef]
- H., C., et al., Bayesian Data Fusion of Gene Expression and Histone Modification Profiles for Inference of Gene Regulatory Network. IEEE/ACM Transactions on Computational Biology and Bioinformatics, 2020. 17(2): p. 516-525.
- Schmidt, F., F. Kern and M.H. Schulz, Integrative prediction of gene expression with chromatin accessibility and conformation data. Epigenetics & Chromatin, 2020. 13(1): p. 4. [CrossRef]
Figure 1.
The Pipeline of MultiGRNFormer. (a) Transformation of chromatin accessibility data into a gene regulatory potential matrix. (b) Structure of the Transformer encoder module. (c) Overall framework of MultiGRNFormer.
Figure 1.
The Pipeline of MultiGRNFormer. (a) Transformation of chromatin accessibility data into a gene regulatory potential matrix. (b) Structure of the Transformer encoder module. (c) Overall framework of MultiGRNFormer.
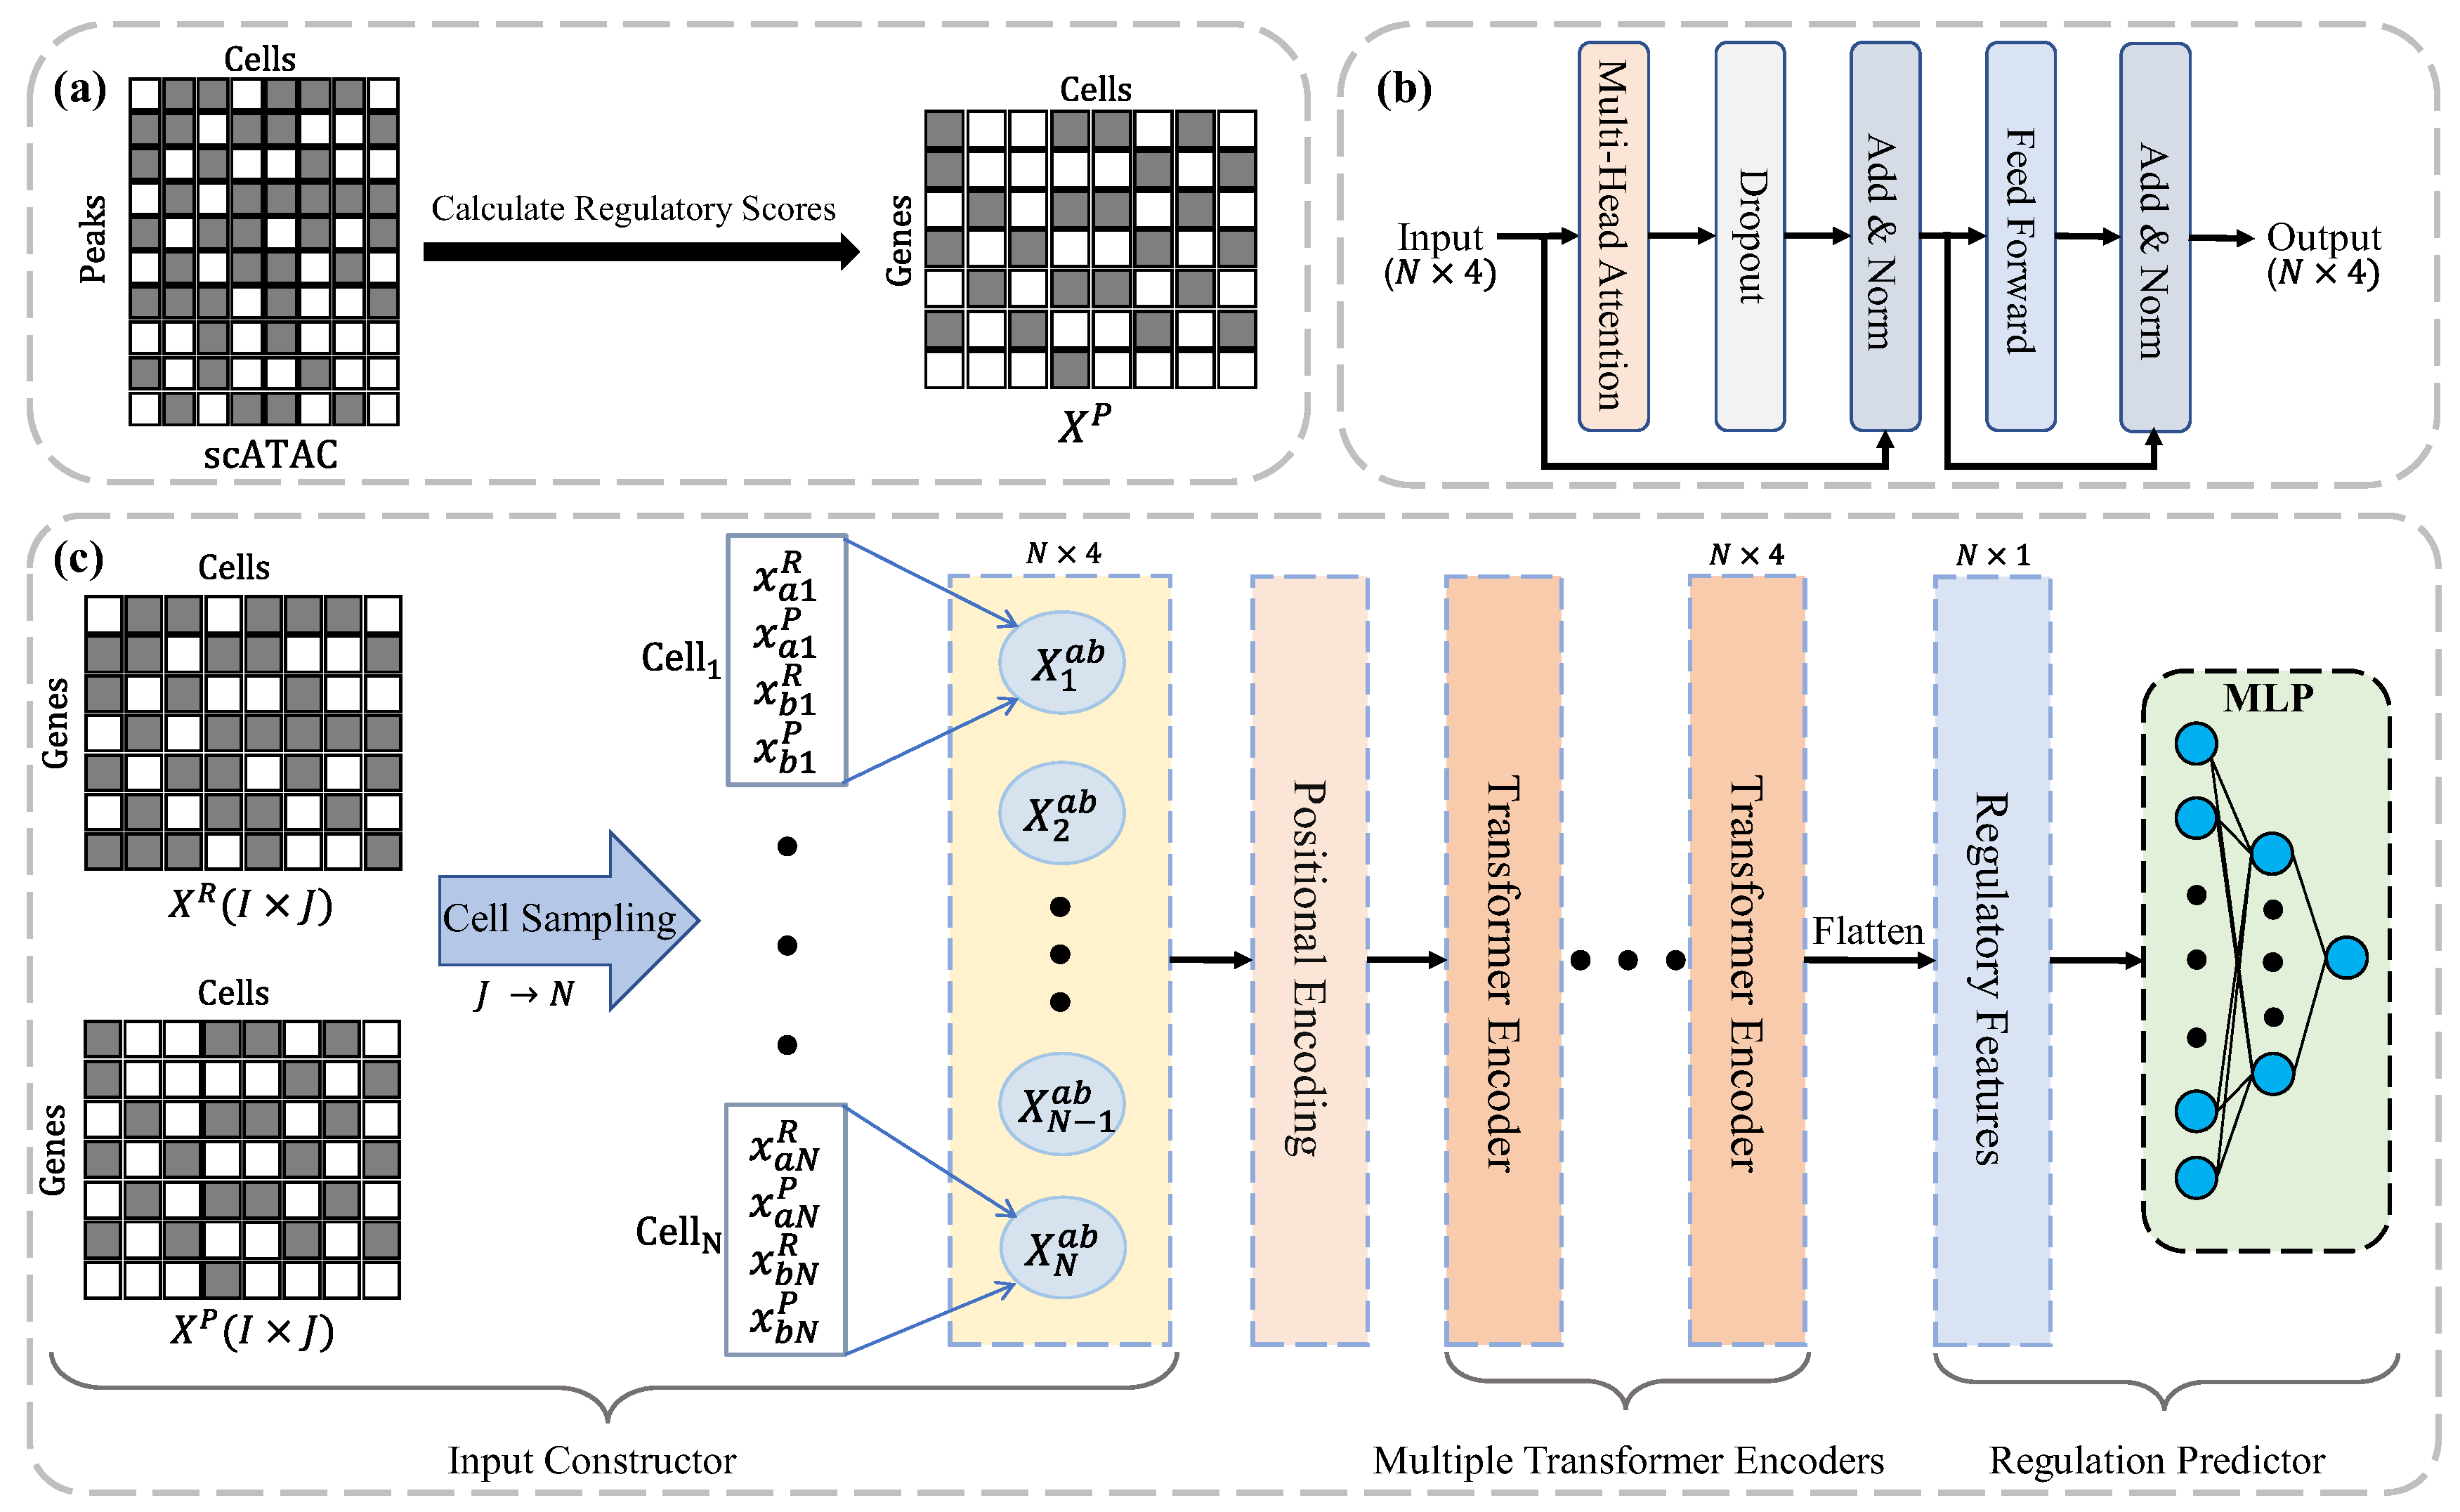
Figure 2.
Parameter Analysis of MultiGRNFormer. The figure presents the experimental results of five-fold cross-validation on the training sets of the human bone (top) and human breast (bottom) datasets.
Figure 2.
Parameter Analysis of MultiGRNFormer. The figure presents the experimental results of five-fold cross-validation on the training sets of the human bone (top) and human breast (bottom) datasets.
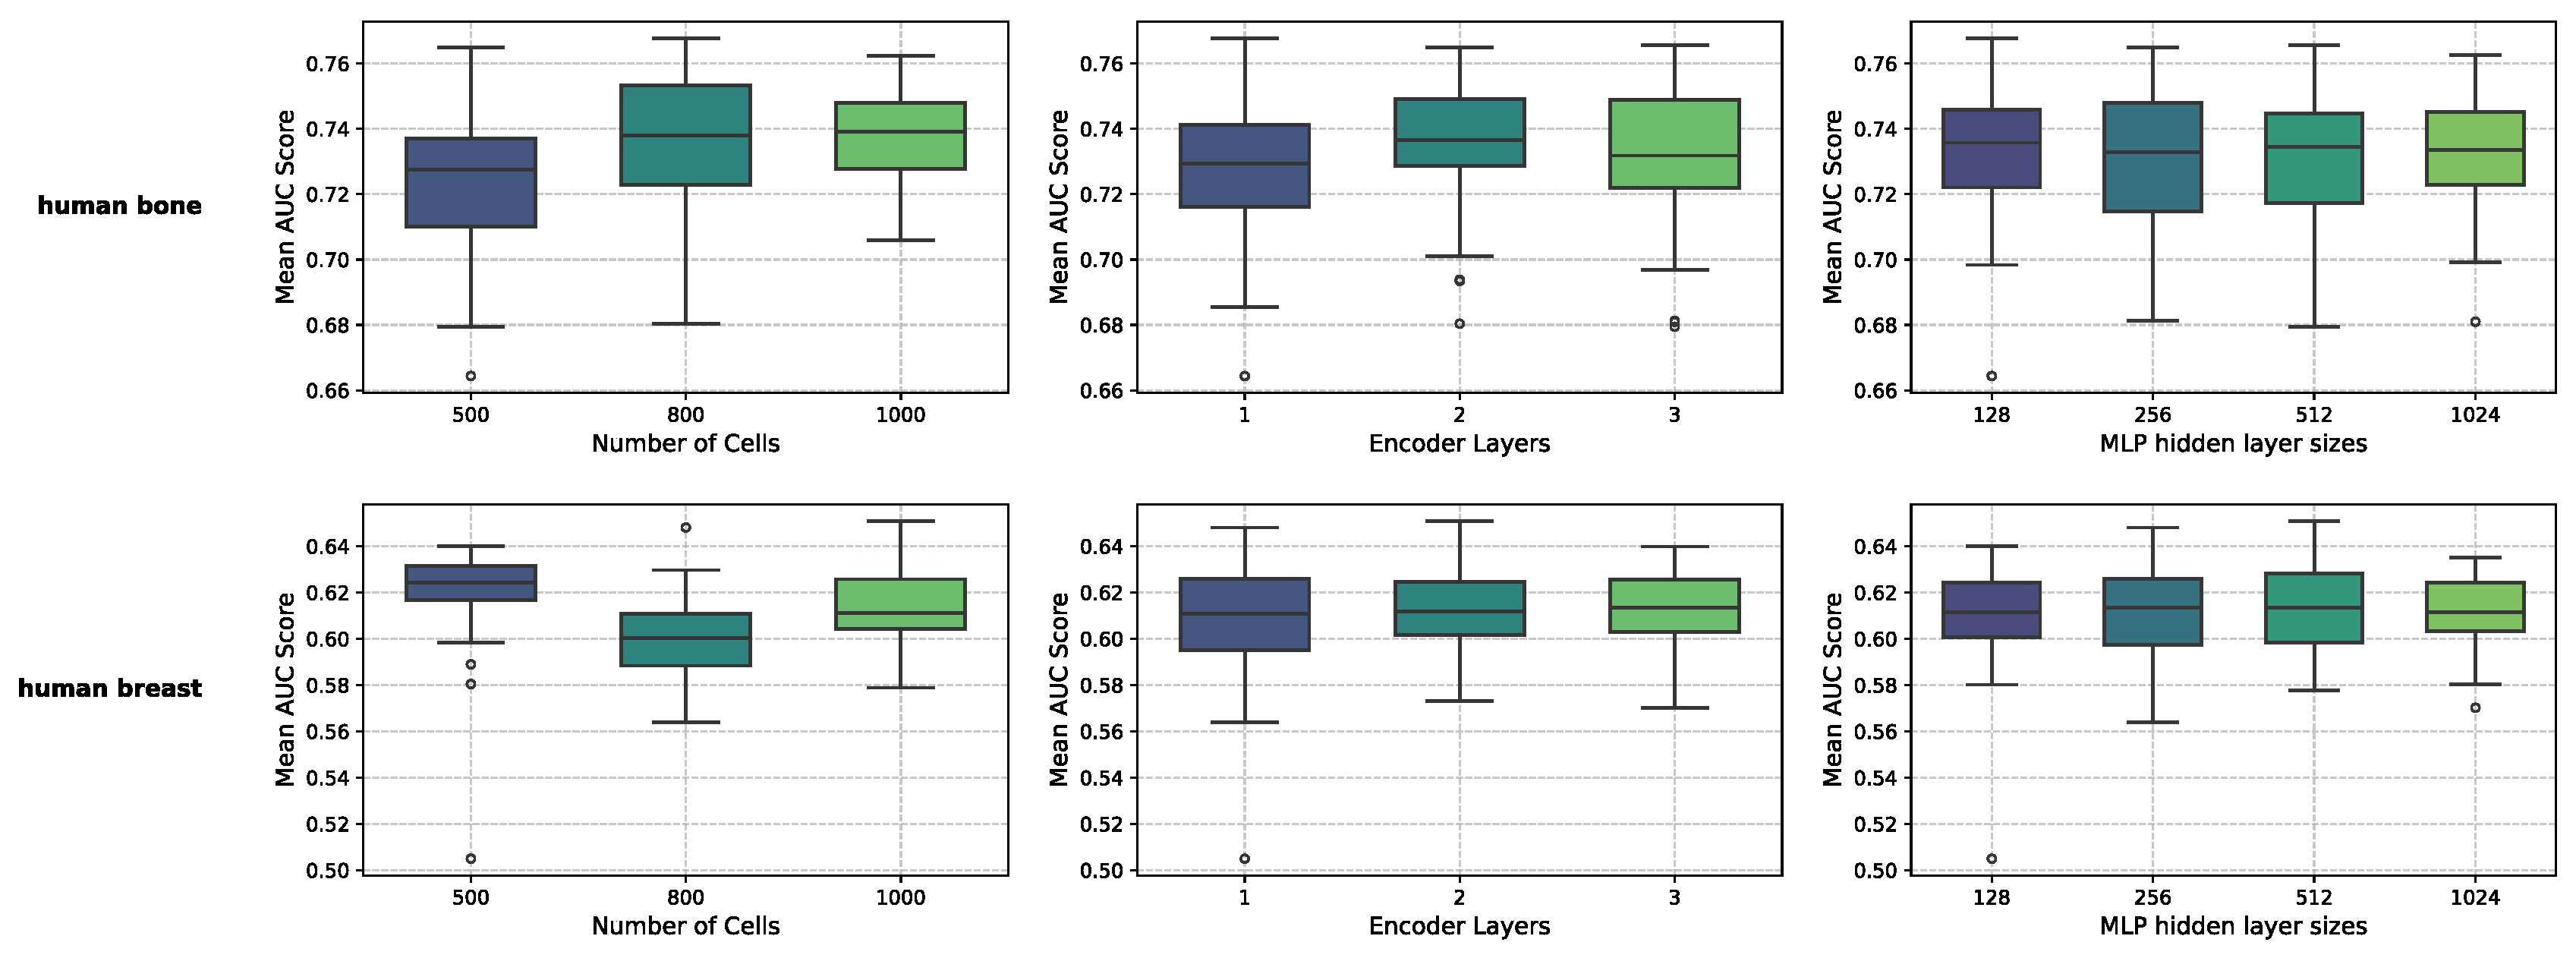
Figure 3.
Summary of GRN Prediction Performance Across Seven Multi-Omics Datasets. Each result in AUROC (a) and AUPRC (b) metrics represents the average of five independent runs. The evaluation includes seven datasets and two ground-truth networks (Non-specific ChIP-seq, STRING). Each multi-omics dataset consists of transcription factors (TFs) and either 500 highly variable genes (left) or 1000 highly variable genes (right).
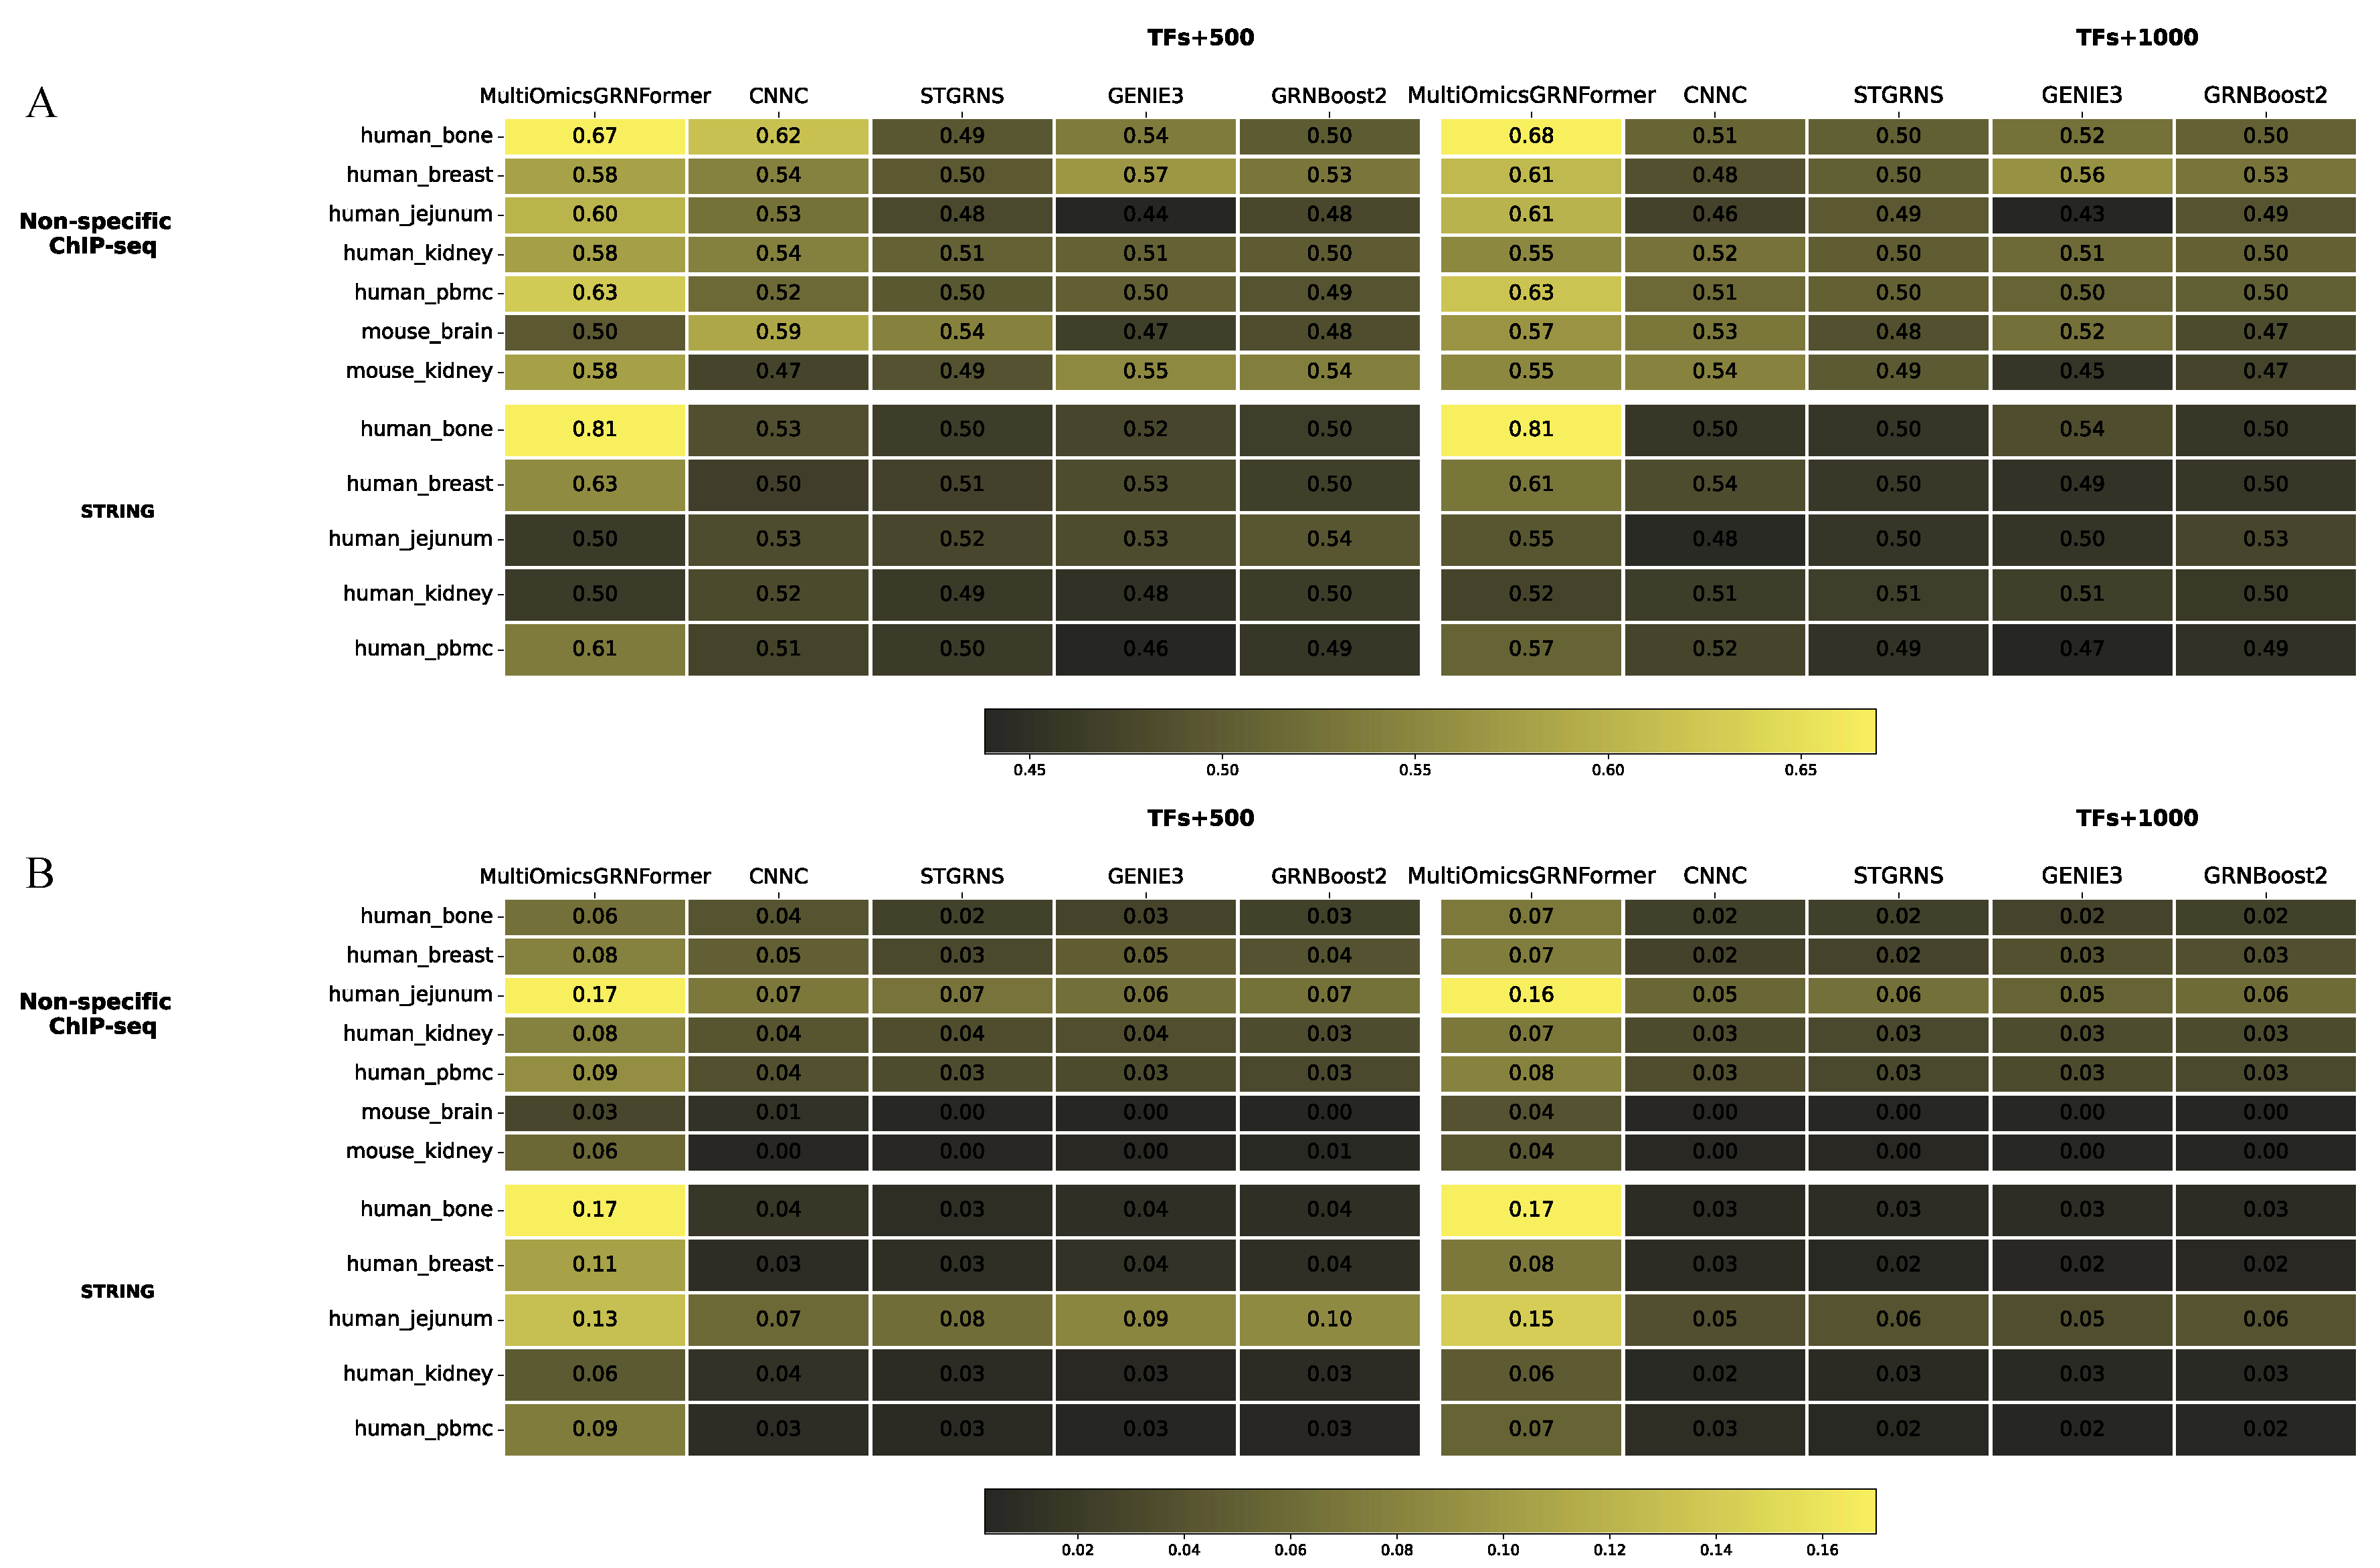
Figure 4.
Effect of Different Factors of Data Augmentation on Model Performance. MultiGRNFormer was trained on datasets with varying degrees of data augmentation and evaluated on the original test sets from across three datasets (TFs+1000). All experiments were conducted five times to ensure result consistency.
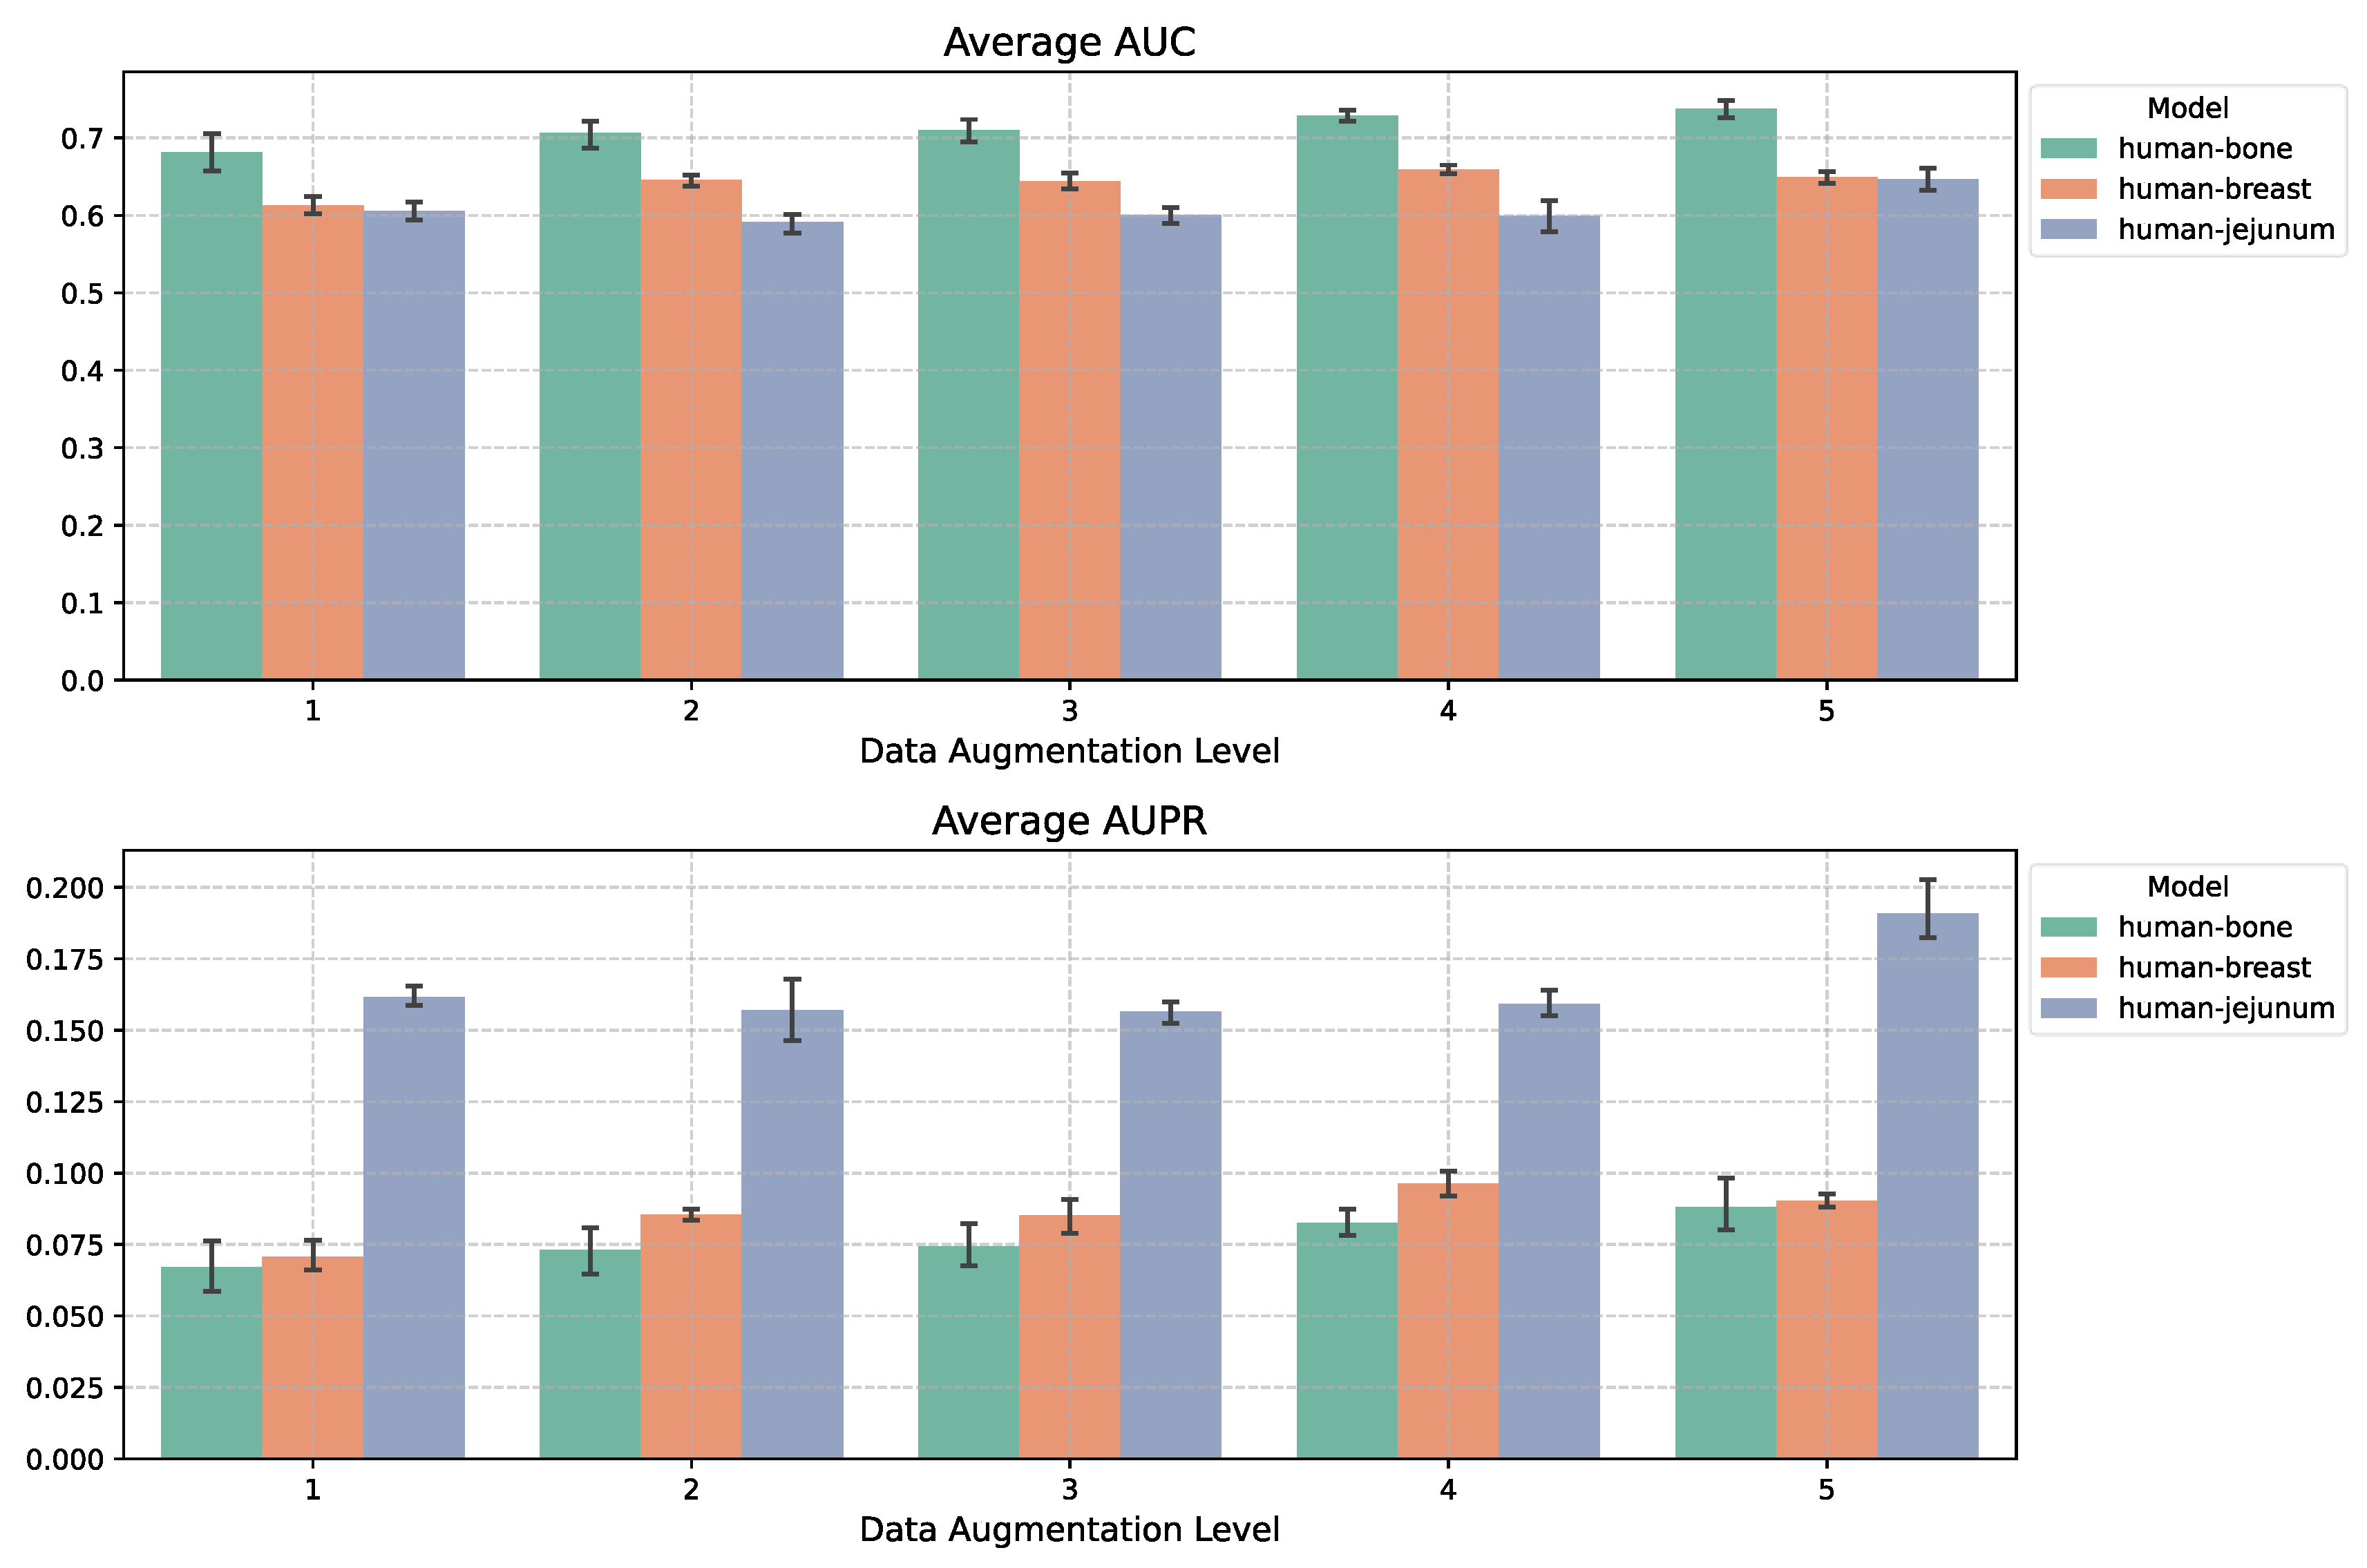
Figure 5.
Comparison of Test Results With Data Augmentation. The AUROC (left) and AUPRC (right) metrics were evaluated on seven datasets (TFs+1000) using Non-specific ChIP-seq (top) and STRING (bottom) as ground truth networks. Each experiment was repeated five times for consistency.
Figure 5.
Comparison of Test Results With Data Augmentation. The AUROC (left) and AUPRC (right) metrics were evaluated on seven datasets (TFs+1000) using Non-specific ChIP-seq (top) and STRING (bottom) as ground truth networks. Each experiment was repeated five times for consistency.
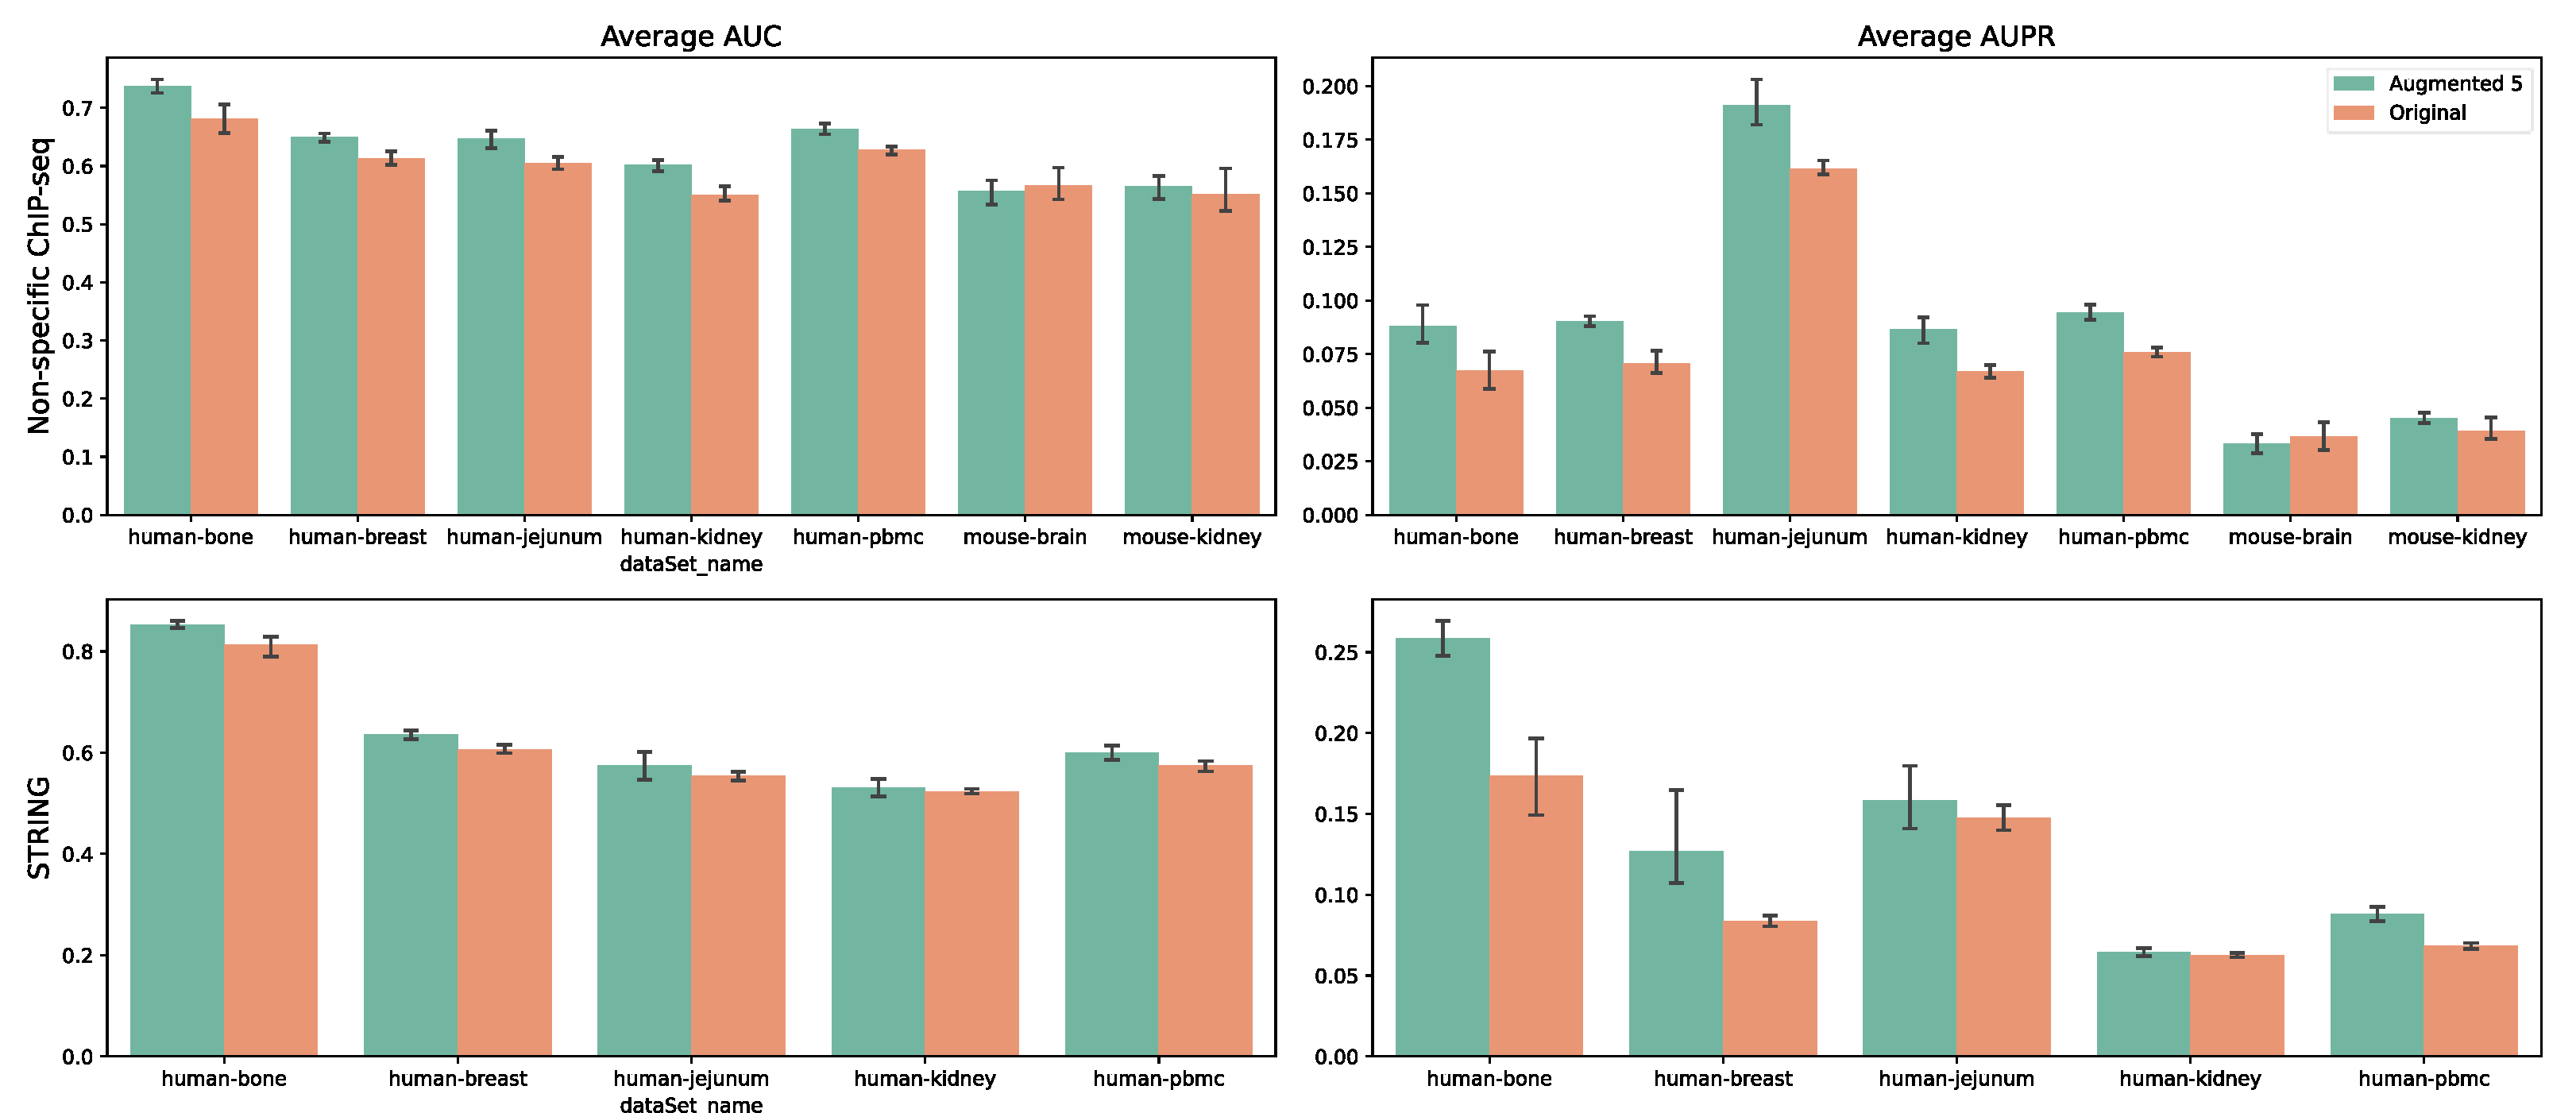
Figure 6.
Comparison of Results Using Different Training Strategies. The AUROC (left) and AUPRC (right) metrics were evaluated on seven datasets (TFs+1000) using Non-specific ChIP-seq as the ground truth network. Each experiment was repeated five times. (a) presents the test results of models trained with cross-dataset training versus standard training. (b) compares models trained with both cross-dataset training and fivefold data augmentation, models trained with only data augmentation, and models trained using standard methods.
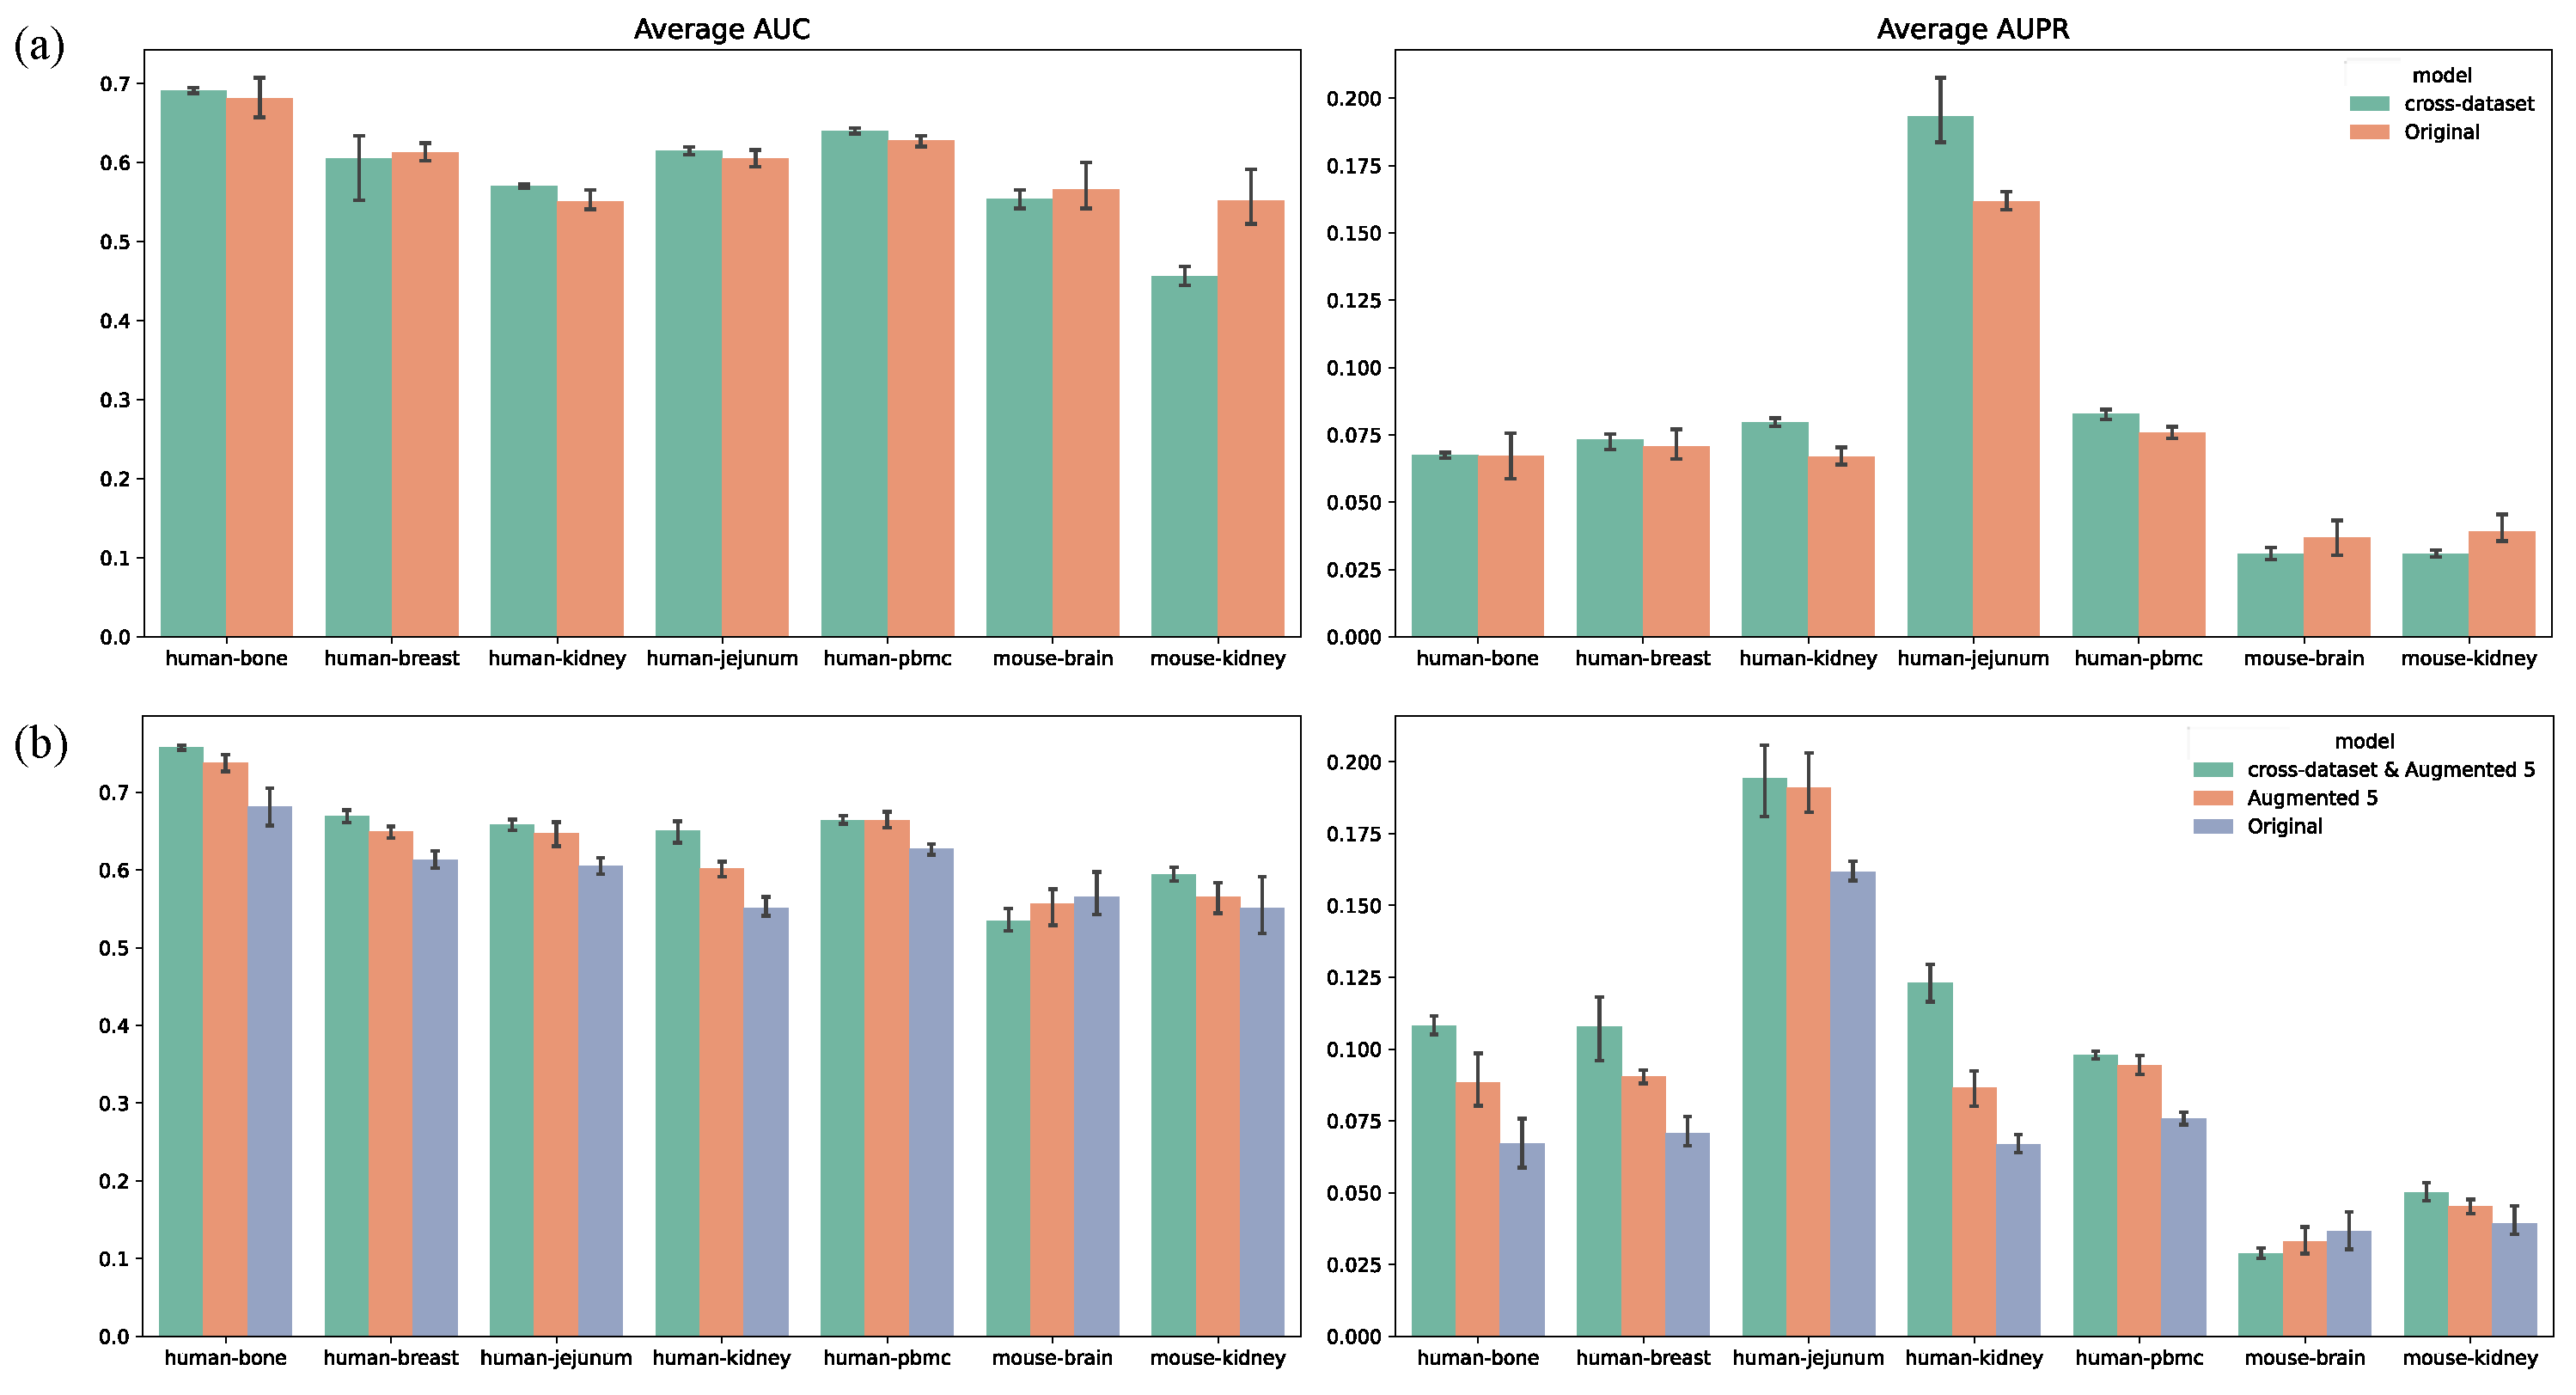
Figure 7.
Comparison of Gene Regulatory Network Inference Between Single-Omics and Multi-Omics Approaches. The AUROC (left) and AUPRC (right) metrics were evaluated on seven datasets (TFs+1000) using Non-specific ChIP-seq as the ground truth network. Each experiment was repeated five times. (a), (b), and (c) present the test results under standard training, data augmentation, and cross-dataset training strategies, respectively, comparing models that utilize both omics modalities versus those using only transcriptomic data.
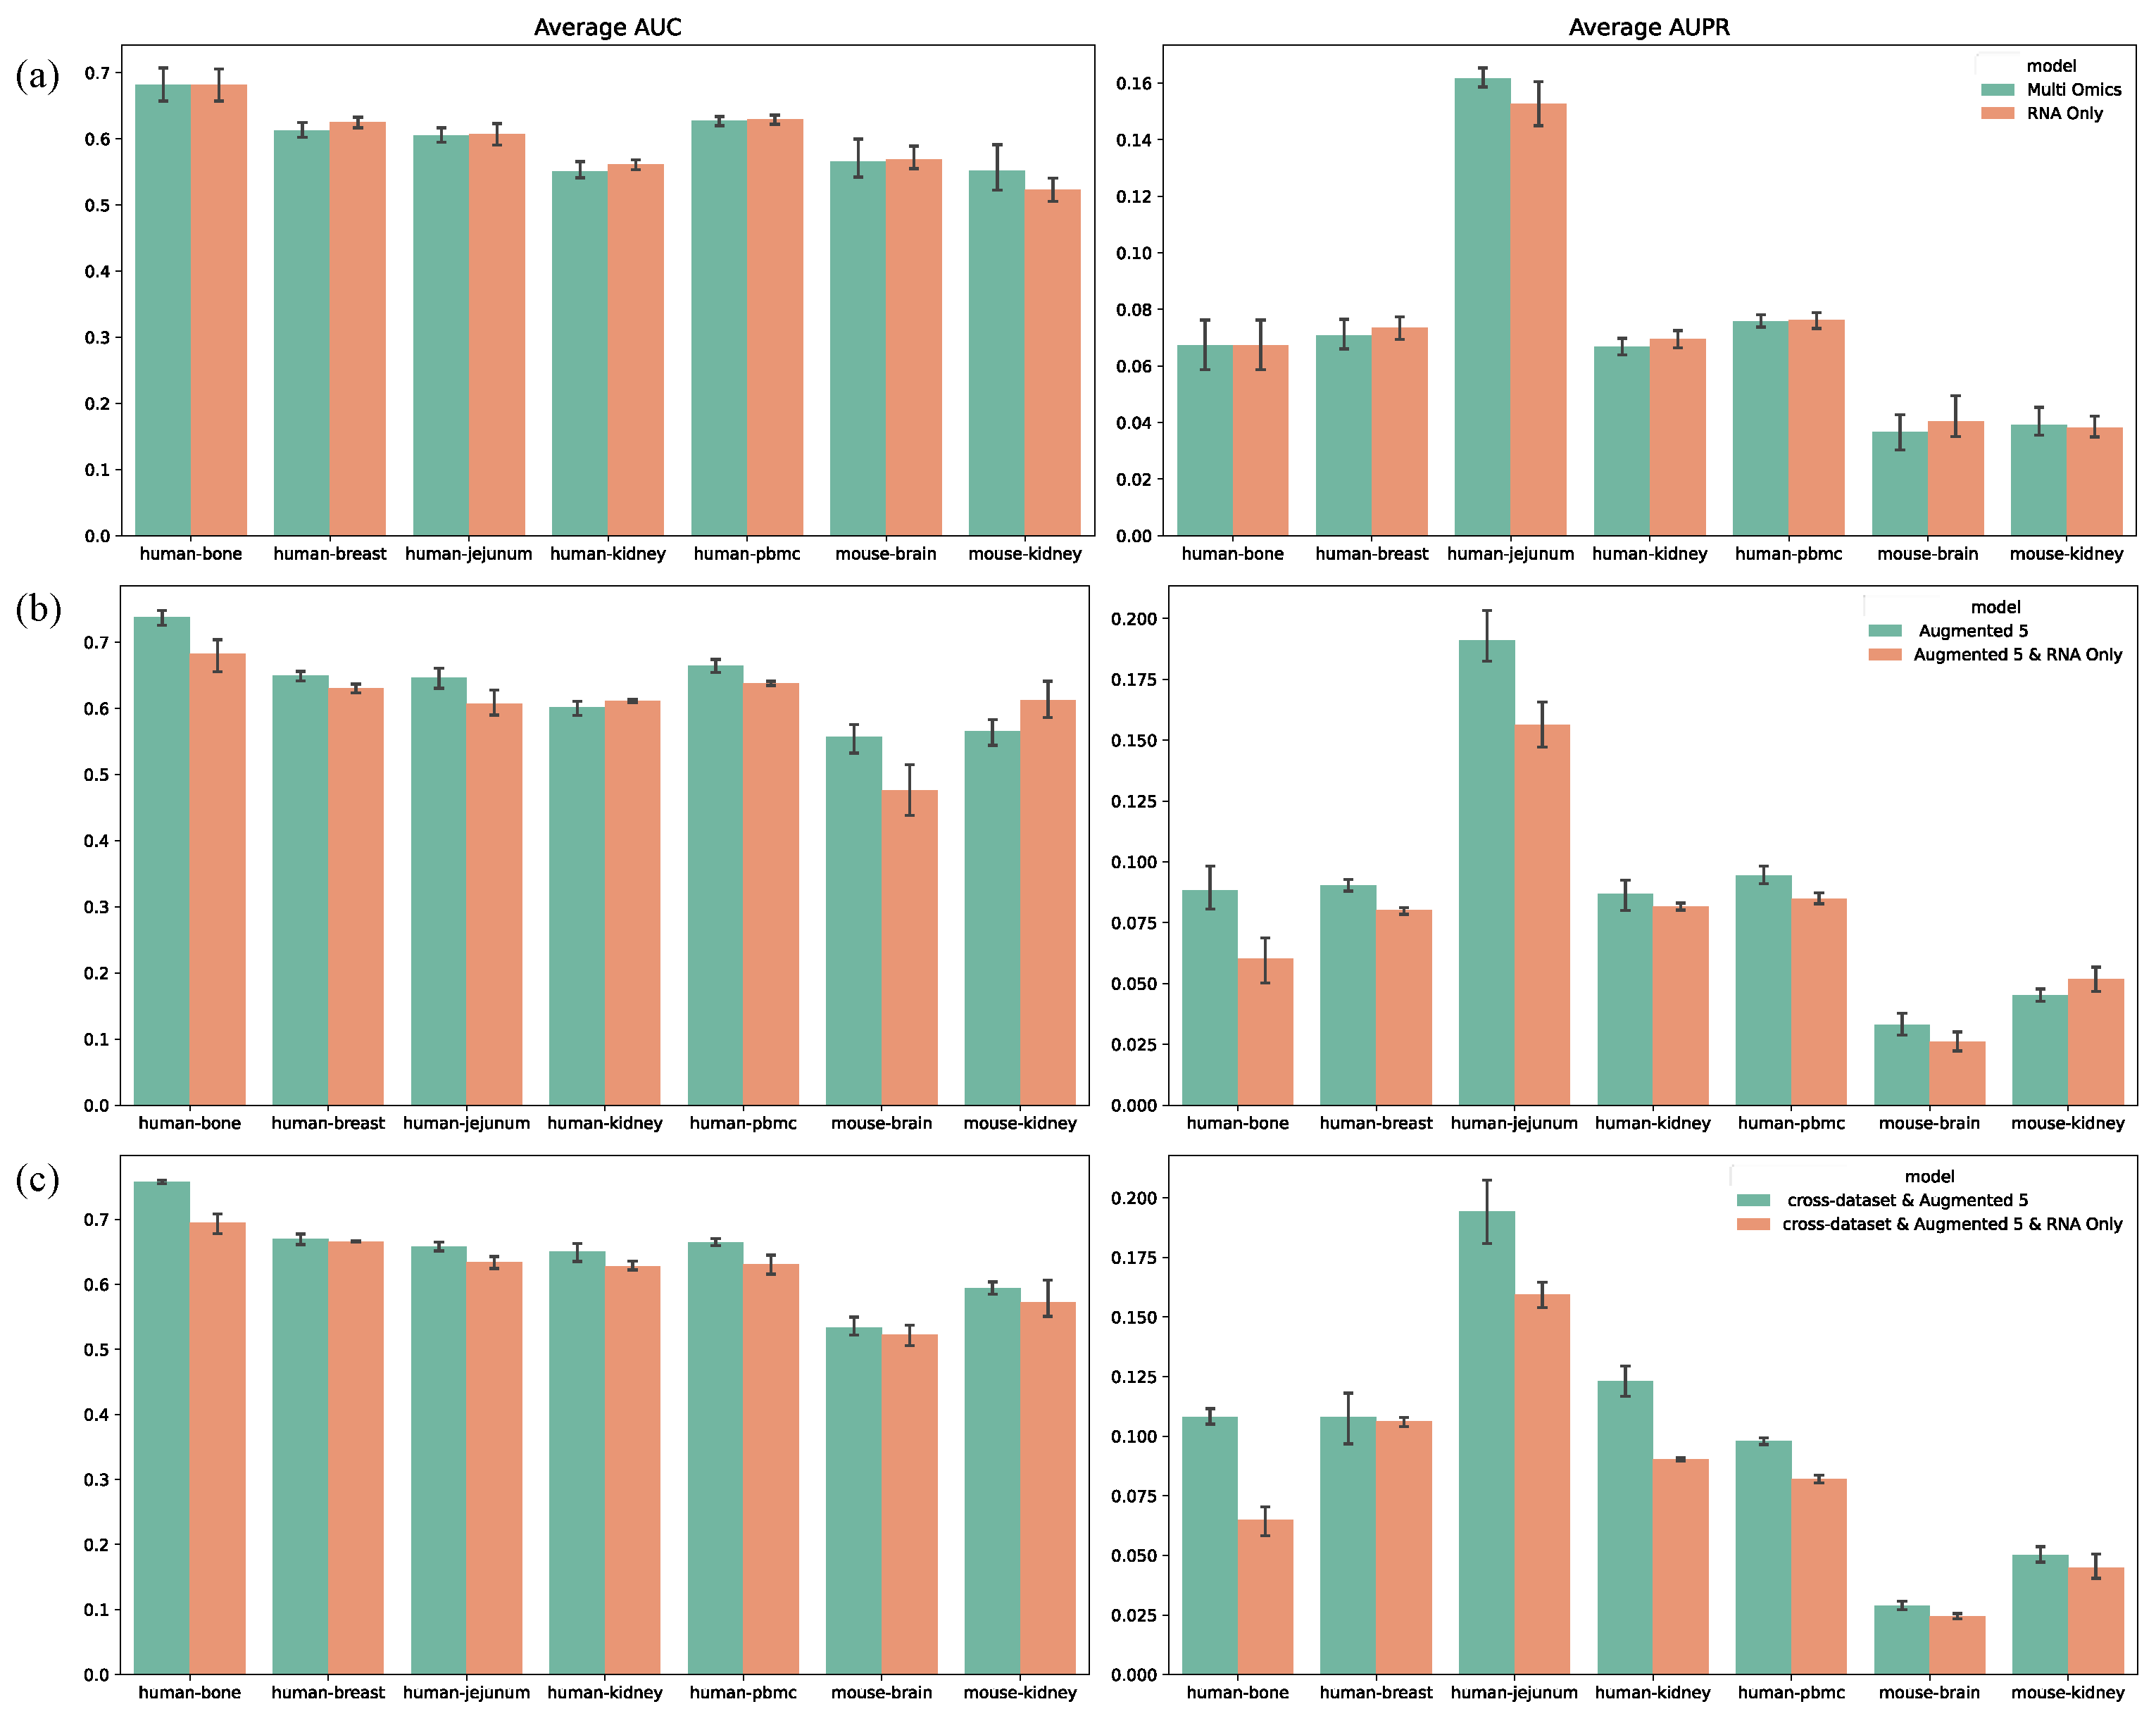

Table 1.
Statistics of scRNA-ATAC-seq datasets and two ground-truth networks composed of TFs and the top 500 most variable genes. The numbers in parentheses in the table represent corresponding statistics for networks composed of TFs and the top 1000 most variable genes.
Table 1.
Statistics of scRNA-ATAC-seq datasets and two ground-truth networks composed of TFs and the top 500 most variable genes. The numbers in parentheses in the table represent corresponding statistics for networks composed of TFs and the top 1000 most variable genes.
| Dataset | Cells | Non-specific ChIP-seq | STRING | |||||
| TFs | Genes | Density | TFs | Genes | Density | |||
| human | bone | 6742 | 717(722) | 1217(1566) | 0.032(0.029) | 792(796) | 937(1113) | 0.051(0.045) |
| breast | 1446 | 186(190) | 447(693) | 0.052(0.043) | 223(231) | 300(435) | 0.070(0.055) | |
| jejunum | 5368 | 57(59) | 124(166) | 0.134(0.117) | 81(84) | 87(105) | 0.133(0.116) | |
| kidney | 13666 | 175(176) | 407(583) | 0.060(0.053) | 226(230) | 277(344) | 0.065(0.057) | |
| pbmc | 6984 | 186(196) | 551(869) | 0.055(0.046) | 230(235) | 375(562) | 0.061(0.051) | |
| mouse | brain | 4362 | 100(109) | 137(167) | 0.028(0.025) | |||
| kidney | 12355 | 72(81) | 122(155) | 0.036(0.034) | ||||
Disclaimer/Publisher’s Note: The statements, opinions and data contained in all publications are solely those of the individual author(s) and contributor(s) and not of MDPI and/or the editor(s). MDPI and/or the editor(s) disclaim responsibility for any injury to people or property resulting from any ideas, methods, instructions or products referred to in the content. |
© 2025 by the authors. Licensee MDPI, Basel, Switzerland. This article is an open access article distributed under the terms and conditions of the Creative Commons Attribution (CC BY) license (http://creativecommons.org/licenses/by/4.0/).
Copyright: This open access article is published under a Creative Commons CC BY 4.0 license, which permit the free download, distribution, and reuse, provided that the author and preprint are cited in any reuse.


