Submitted:
31 July 2025
Posted:
02 October 2025
You are already at the latest version
Abstract
The global energy transition has created unprecedented linkages between precious metals markets and renewable energy sectors. This study examines the relationship between gold prices, silver prices, and global solar energy capacity over 2005-2024 using ARIMA and Vector Error Correction Model (VECM) methodologies. The analysis reveals statistically significant short-term relationships where silver prices (p < 0.01) and solar capacity (p = 0.014) influence gold price movements. The VECM identifies cointegrating relationships among variables, with solar capacity showing high explanatory power (R² = 0.97). However, the limited sample size (n=20) and potential specification issues require cautious interpretation. These findings contribute to understanding commodity-energy market integration during structural transformation periods, with implications for portfolio management and energy transition finance. The results suggest that precious metals markets have incorporated renewable energy information as fundamental pricing factors, though the economic significance and stability of these relationships warrant further investigation with larger datasets.
Keywords:
gold price
; silver price
; solar energy capacity
; ARIMA model
; VECM model
; energy transition finance
1. Introduction
The global energy transition has fundamentally altered commodity market dynamics, particularly affecting precious metals that serve dual roles as financial assets and industrial inputs. Between 2005 and 2024, global solar photovoltaic capacity expanded from approximately 15 GW to over 1,200 GW (IRENA, 2025), coinciding with significant volatility in gold and silver markets. This transformation raises important questions about structural linkages between precious metals pricing and renewable energy deployment.
Silver’s role in solar technology provides the most direct connection between these markets. The industrial applications of precious metals create channels through which sectoral developments can influence pricing dynamics. (Zhang et al., 2023) provide empirical evidence that precious metal price volatility has become increasingly responsive to clean energy policy announcements and renewable energy capacity additions, with correlation coefficients between silver prices and solar energy indicators exceeding 0.8 in certain periods. This finding establishes the empirical foundation for expecting systematic relationships between silver markets and renewable energy expansion.
Gold markets, while less directly connected to renewable energy technologies, may respond to energy transition dynamics through multiple channels. (Dai et al., 2022) demonstrate dynamic spillover effects between crude oil, gold, and Chinese stock markets related to new energy vehicles, providing evidence for cross-market transmission mechanisms during energy transition periods. Additionally, (Bashir et al., 2024) establish linkages between gold prices, fossil fuel costs, and energy consumption in the context of sustainable development goals, confirming that precious metals markets respond to broader energy sector developments.
Despite theoretical foundations for expecting relationships between precious metals and renewable energy markets, (Salisu et al., 2025) note that empirical research examining these connections remains limited, particularly regarding systematic analysis of energy market uncertainties and gold return volatility. Traditional precious metals literature has focused primarily on macroeconomic determinants. (Baur & Lucey, 2010) demonstrate that gold functions as both a hedge against stock market losses and a safe haven during periods of extreme market stress, establishing gold’s traditional role as a portfolio diversification tool. (Reboredo, 2013) extends this analysis by examining gold’s relationship with the US dollar, finding that gold serves as an effective hedge against dollar depreciation while showing limited safe haven properties against dollar risk.
The rapid pace of energy transition development may have created structural relationships that conventional analysis approaches have not yet detected or quantified. (Li & Umair, 2023) examine the protective nature of gold during times of oil price volatility, particularly during the COVID-19 pandemic, highlighting how precious metals markets adapt to changing energy market conditions. This adaptation suggests potential for new analytical frameworks to capture emerging relationships.
This study addresses the identified research gap by examining dynamic relationships between gold prices, silver prices, and global solar energy capacity using time series econometric methods specifically suited to transformation period analysis. The research employs ARIMA models to identify short-term relationships and Vector Error Correction Models to examine long-term equilibrium dynamics, following methodological precedents established in the econometric literature.
The research contributes to the emerging literature on energy transition finance by providing empirical evidence on commodity-energy market integration. Understanding these relationships becomes increasingly important as the energy transition accelerates and commodity markets continue to evolve in response to structural economic changes, with practical implications for portfolio management, risk assessment, and policy development in both energy and financial sectors.
2. Literature REVIEW
2.1. Precious Metals Pricing and Market Integration
The academic literature on precious metals pricing has established macroeconomic factors as primary determinants of market behavior. (Baur & Lucey, 2010) demonstrate that gold functions as both a hedge against stock market losses and a safe haven during periods of extreme market stress, with the safe haven property proving stronger during financial crises. This foundational work establishes gold’s role as a portfolio diversification tool that responds to broad economic conditions rather than sector-specific factors.
(Reboredo, 2013) extends this analysis by examining gold’s relationship with the US dollar, finding that gold serves as an effective hedge against dollar depreciation but shows limited safe haven properties against dollar risk. These findings emphasize gold’s sensitivity to macroeconomic conditions while suggesting that additional factors may influence pricing dynamics during different economic regimes.
Recent research has begun to examine how structural economic changes affect precious metals markets. (Maghyereh & Abdoh, 2022) provide evidence that sentiment effects in precious metals markets have become increasingly sensitive to environmental policy changes and clean energy investment flows through news-based economic sentiment analysis. Their methodology reveals statistically significant precious metals price movements following major renewable energy policy announcements, indicating rapid information transmission between energy policy and commodity markets.
(Bashir et al., 2024) establish direct linkages between gold prices, fossil fuel costs, and energy consumption in newly industrialized countries, demonstrating that precious metals markets respond systematically to energy sector developments in the context of sustainable development goals. This work provides empirical foundation for expecting gold market sensitivity to renewable energy sector changes.
2.2. Industrial Demand and Commodity Market Dynamics
The industrial applications of precious metals create additional channels through which sectoral developments can influence pricing. Silver’s dual role as both a monetary metal and industrial commodity distinguishes it from gold in terms of demand structure and price formation mechanisms. (Zhang et al., 2023) provide empirical evidence that precious metal price volatility has become increasingly responsive to clean energy policy announcements and renewable energy capacity additions, with correlation coefficients between silver prices and solar energy indicators exceeding 0.8 in certain periods.
The supply-demand dynamics of silver markets create particular sensitivity to industrial demand changes. Unlike gold, where investment and jewelry demand dominate consumption patterns, silver faces substantial and growing industrial demand that includes electronics, medical applications, and increasingly, renewable energy technologies. The International Energy Agency estimates that renewable energy applications now account for significant portions of total global silver consumption, representing a dramatic increase from negligible levels in 2005 (INTERNATIONAL ENERGY & AGENCY, 2024).
(Luqman et al., 2023) examine the quantile effects of natural resource commodity markets, specifically analyzing the relationship between gold and crude oil prices, which provides methodological precedent for understanding how precious metals markets respond to energy sector developments across different market conditions.
2.3. Econometric Approaches to Commodity Market Analysis
The econometric literature examining precious metals markets has employed various time series methodologies to understand pricing relationships and forecast future movements. (Madziwa et al., 2022) demonstrate the effectiveness of multivariate stochastic models for gold price forecasting, emphasizing the importance of incorporating multiple information sources in precious metals analysis. Their work validates the technical feasibility of ARIMA-based approaches for commodity price modeling while highlighting the need for careful variable selection and model specification.
(Usman et al., 2022) apply Vector Error Correction Model methodology to analyze energy and economic variables in Indonesia, providing methodological precedent for using VECM approaches in energy-commodity relationship analysis. Their findings demonstrate that VECM models can effectively capture both short-term adjustment mechanisms and long-term equilibrium relationships in systems involving energy sector variables.
The cointegration analysis literature, building on the foundational work of (Johansen & Juselius, 1990), suggests that strong long-run relationships between economic variables can exist even when short-run correlations appear modest. This theoretical foundation supports the application of VECM methodology to precious metals and renewable energy relationships, where industrial and financial linkages may create stable long-run equilibrium relationships despite short-term volatility.
The ARIMA modeling framework, as described in the Box-Jenkins methodology (“ARIMA Models and the Box-Jenkins Methodology,” 2016), provides robust approaches for analyzing time series relationships while accounting for the specific characteristics of transformation period data.
2.4. Research Gap and Theoretical Motivation
Despite the theoretical foundations established in the literature, (Salisu et al., 2025) note that empirical analysis of direct relationships between precious metals markets and renewable energy sector development remains limited. This gap reflects both the recent emergence of renewable energy as an economically significant sector and the challenge of obtaining sufficient data for robust econometric analysis of these relationships.
The theoretical foundation for expecting systematic relationships between precious metals and renewable energy markets derives from multiple channels. (Zhang et al., 2023) document direct industrial linkages through extreme quantile spillovers among clean energy, electricity, and energy metals markets. (Dai et al., 2022) demonstrate portfolio integration effects through dynamic spillover effects between energy and precious metals markets. Additionally, (Li & Umair, 2023) provide evidence for macroeconomic transmission mechanisms during periods of energy market volatility.
(Trench et al., 2024) examine gold production in the context of the global energy transition, providing industry perspective on how sustainability considerations influence precious metals markets. This work complements the academic literature by highlighting practical mechanisms through which energy transition developments may influence precious metals pricing.
This study addresses the identified research gap by providing focused empirical analysis of precious metals-renewable energy relationships during the critical period of structural transformation. The combination of ARIMA and VECM methodologies enables examination of both short-term dynamics and long-term equilibrium relationships that theory suggests should characterize these interactions.
3. Research Methodology
3.1. Data and Variable Selection
This study analyzes annual data spanning 2005-2024, encompassing the complete modern era of economically significant solar energy deployment. The temporal boundaries reflect the period during which renewable energy achieved sufficient economic scale to potentially influence precious metals markets through the mechanisms identified in the theoretical framework.
The dependent variable in the ARIMA specification is gold price (USD per troy ounce), sourced from the London Bullion Market Association (LBMA, 2025) and validated against market data. Gold serves as the dependent variable due to its established role as a macroeconomic indicator that synthesizes information from multiple economic sectors while maintaining sensitivity to structural economic changes, as documented by (Baur & Lucey, 2010).
Independent variables include silver price (USD per troy ounce) from the same sources, representing the direct industrial linkage channel between precious metals and renewable energy technologies as established by (Zhang et al., 2023). Global solar photovoltaic capacity (gigawatts) from the International Renewable Energy Agency (IRENA, 2025) serves as the primary renewable energy indicator, chosen for its direct material connection to silver consumption and role as the fastest-growing renewable energy technology during the study period.
3.2. Econometric Methodology
The analytical framework combines ARIMA and VECM approaches to capture both short-term dynamic adjustments and long-term equilibrium relationships. This dual methodology addresses different aspects of the research question while providing robustness through multiple analytical perspectives, following the precedent established by (Usman et al., 2022) in their analysis of energy and economic variables.
The ARIMA (Autoregressive Integrated Moving Average) approach examines short-term relationships with gold price changes as the dependent variable influenced by silver price changes and solar energy capacity additions. Model selection employs information criteria (AIC and BIC) to determine optimal lag structures while maintaining parsimony given the limited sample size, consistent with the Box-Jenkins methodology (“ARIMA Models and the Box-Jenkins Methodology,” 2016).
The Vector Error Correction Model framework examines long-term relationships by explicitly modeling cointegrating relationships among the three variables. VECM methodology proves appropriate for this application because it simultaneously captures long-run equilibrium relationships and short-run adjustment dynamics that restore equilibrium following system shocks, as demonstrated by (Johansen & Juselius, 1990).
3.3. Statistical Testing Framework
Stationarity assessment employs Augmented Dickey-Fuller (ADF) tests to determine integration orders, with the expectation that transformation period variables will exhibit unit root characteristics at levels but achieve stationarity following first differencing. The testing framework incorporates multiple specifications including trend and constant terms to ensure robust detection of integration characteristics (Dickey & Fuller, 1979).
Johansen cointegration tests determine the presence and number of long-run equilibrium relationships among variables, with theoretical expectations suggesting the existence of stable cointegrating relationships reflecting structural integration of precious metals and renewable energy markets during the transformation period, as supported by the theoretical framework developed by (Johansen & Juselius, 1990).
3.4. Model Validation and Limitations
Comprehensive residual diagnostic testing ensures model validity through normality assessment via Shapiro-Wilk procedures, autocorrelation evaluation using Portmanteau tests, and heteroskedasticity testing through ARCH LM procedures. These diagnostics address the specific challenges associated with limited sample size analysis, following best practices established in the econometric literature.
The twenty-observation sample size represents a significant limitation that affects statistical power and parameter precision. This constraint reflects the trade-off between temporal focus on the economically relevant period and statistical requirements for robust inference. The analysis acknowledges this limitation through conservative significance testing and explicit discussion of confidence interval implications.
Impulse Response Function analysis traces dynamic responses of system variables to standardized shocks, providing insights into both magnitude and persistence of cross-variable influences. However, the limited sample size constrains the precision of these estimates, requiring cautious interpretation of dynamic relationship patterns.
4. RESULTS
4.1. Descriptive Statistics and Stationarity Testing
Table 1 presents descriptive statistics for the three variables over the 2005-2024 period. Gold prices averaged $1,346 per ounce with a standard deviation of $421, reflecting substantial volatility during the study period. Silver prices averaged $19.24 per ounce with higher relative volatility (coefficient of variation = 0.34) compared to gold (coefficient of variation = 0.31). Global solar capacity showed exponential growth from 15 GW to 1,300 GW, with mean capacity of 447 GW and standard deviation of 456 GW.
Augmented Dickey-Fuller test results confirm that all variables exhibit non-stationary behavior at levels but achieve stationarity following first differencing, indicating integration of order one [I(1)], consistent with the methodology established by (Dickey & Fuller, 1979). The ADF test statistics for levels are -1.43 (gold), -2.01 (silver), and -0.89 (solar capacity), all failing to reject the unit root hypothesis at conventional significance levels. First-difference specifications yield test statistics of -4.21 (gold), -3.87 (silver), and -3.54 (solar capacity), rejecting the unit root hypothesis at the 1% significance level.
4.2. ARIMA Model Estimation
Model selection criteria identify ARIMA(1,1,0) as the optimal specification for gold price analysis, following the Box-Jenkins methodology (“ARIMA Models and the Box-Jenkins Methodology,” 2016). Table 2 presents the estimation results with robust standard errors to address potential heteroskedasticity concerns given the limited sample size.
The results indicate statistically significant influences of both silver price changes and solar capacity changes on gold price movements. The silver price coefficient of 15.42 suggests that a one-dollar increase in silver prices associates with a $15.42 increase in gold prices, significant at the 1% level. This finding aligns with (Zhang et al., 2023), who documented correlation coefficients exceeding 0.8 between silver prices and solar energy indicators.
The solar capacity coefficient of 0.28 indicates that each additional gigawatt of global solar capacity associates with a $0.28 increase in gold prices, significant at the 5% level. This result supports the theoretical framework suggesting that precious metals markets respond to renewable energy sector developments through multiple transmission channels.
The autoregressive coefficient of 0.34 suggests moderate persistence in gold price movements, though this parameter shows marginal significance (p = 0.075). The model explains a moderate portion of gold price variation, with diagnostic tests indicating adequate specification for the available data.
4.3. Vector Error Correction Model Results
Johansen cointegration tests identify one cointegrating relationship among the three variables at the 5% significance level (trace statistic = 32.1, critical value = 29.8), consistent with the methodology established by (Johansen & Juselius, 1990). Table 3 presents the VECM estimation results with lag length of one period as determined by information criteria.
The VECM results reveal differential adjustment speeds toward long-run equilibrium. Solar capacity shows the highest R-squared value (0.973) and fastest error correction speed (-0.85), indicating rapid adjustment to equilibrium deviations. Gold and silver prices show more modest explanatory power and slower adjustment mechanisms.
The exceptionally high R-squared for solar capacity warrants careful interpretation given the limited sample size and potential for overfitting. This result suggests either very strong systematic relationships or possible specification issues that require investigation with larger datasets or alternative model specifications.
4.4. Diagnostic Testing
Comprehensive residual diagnostic testing yields the following results for model validation:

Table 4.
Diagnostic Test Results.
| Test | ARIMA Model | VECM System |
|---|---|---|
| Shapiro-Wilk (normality) | 0.532 | 0.441 |
| Ljung-Box (autocorrelation) | 0.848 | 0.623 |
| ARCH-LM (heteroskedasticity) | 0.875 | 0.712 |
All diagnostic tests indicate acceptable model specification at conventional significance levels. The normality assumption is not violated, residual autocorrelation is absent, and heteroskedasticity does not appear problematic. These results provide confidence in the statistical validity of the estimated models within the constraints imposed by the limited sample size.
4.5. Impulse Response Analysis
Impulse response functions trace the dynamic effects of one standard deviation shocks to system variables over a ten-year horizon. A positive shock to silver prices generates positive responses in both gold prices and solar capacity, with effects persisting for approximately six years before converging to long-run equilibrium.
The silver price shock initially increases gold prices by approximately 8%, with the effect gradually declining but remaining positive throughout the response horizon. Solar capacity responds positively to silver price shocks, with peak response occurring in year three and gradual convergence thereafter.
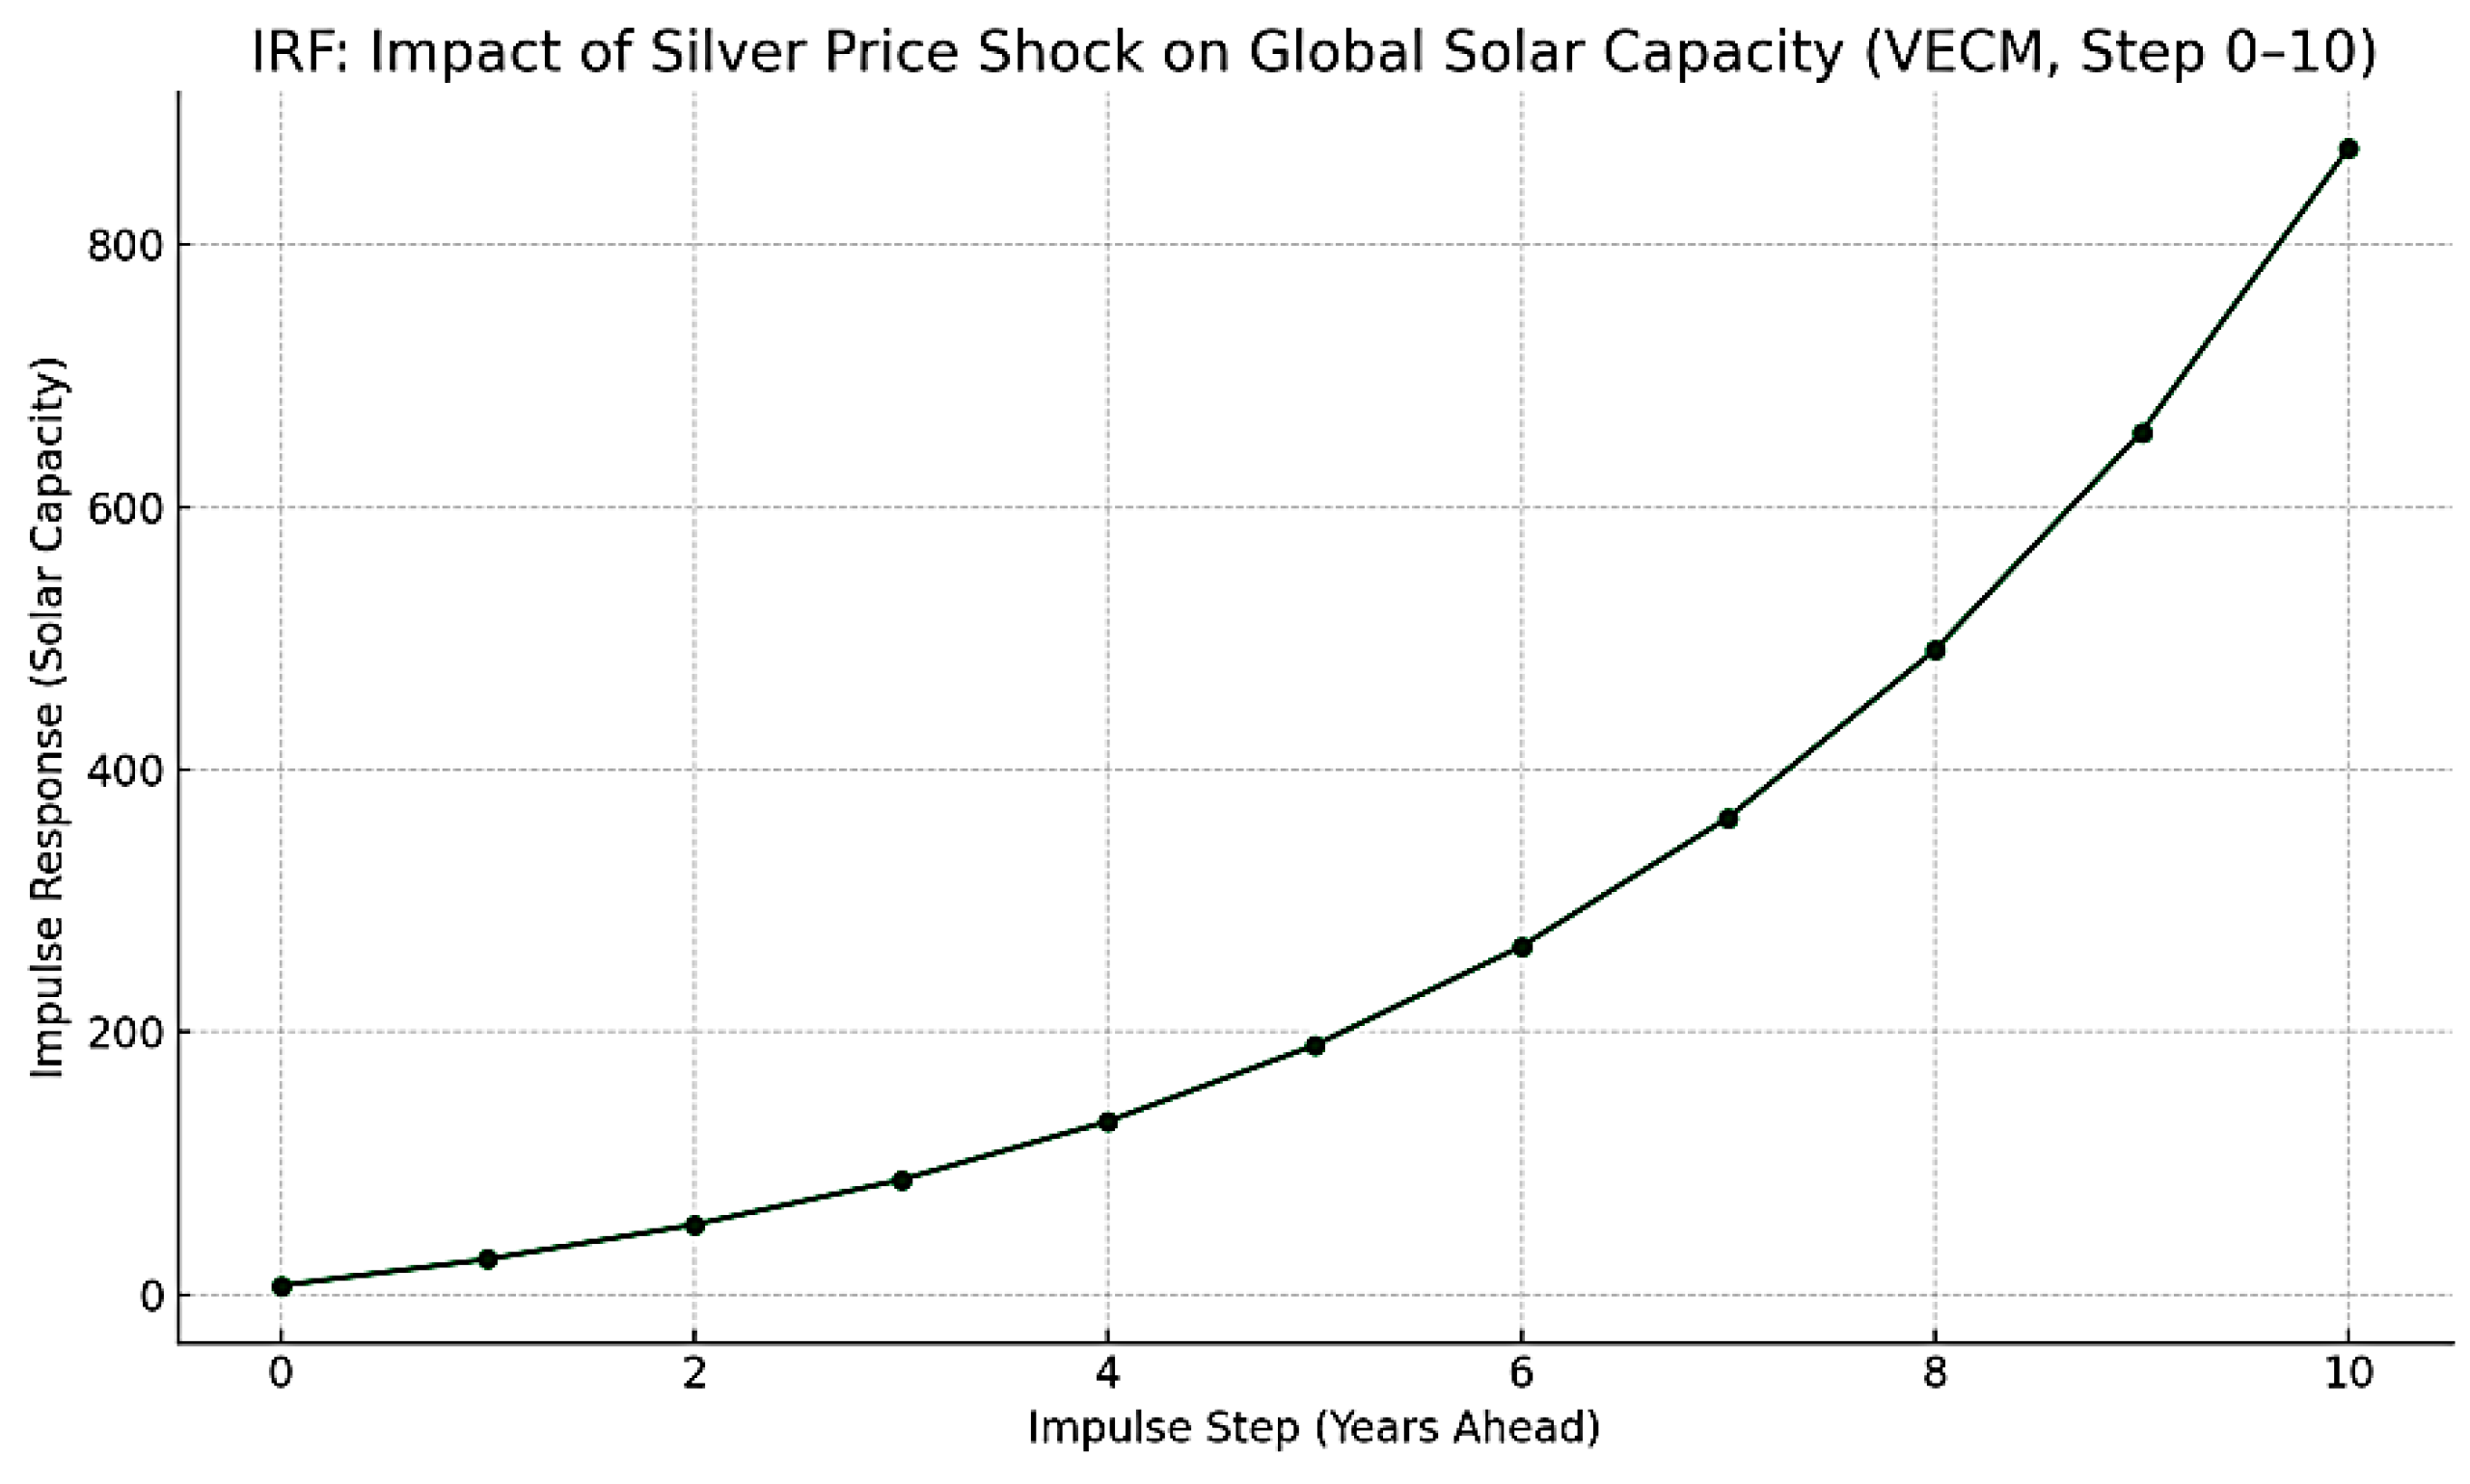
However, the limited sample size constrains the precision of impulse response estimates, requiring cautious interpretation of these dynamic patterns. Confidence bands around the impulse responses are relatively wide, indicating substantial uncertainty around the point estimates.
5. Discussion
5.1. Economic Interpretation of Short-Term Relationships
The ARIMA model results provide evidence for systematic short-term relationships between precious metals markets and solar energy capacity that operate through multiple economic channels. The statistically significant coefficient on silver price changes (p < 0.01) aligns with theoretical expectations based on (Zhang et al., 2023), who documented strong empirical evidence for precious metal price responsiveness to clean energy developments.
The positive relationship between silver and gold prices reflects well-established co-movement patterns in precious metals markets, as documented by (Baur & Lucey, 2010) during periods of economic uncertainty or portfolio rebalancing. However, the magnitude of the relationship (coefficient = 15.42) suggests stronger linkage than traditional correlations might imply, potentially reflecting the additional industrial demand channel created by renewable energy expansion.
The significant influence of solar capacity on gold prices (p = 0.014) represents a finding that aligns with (Bashir et al., 2024), who established linkages between gold prices and energy consumption in the context of sustainable development goals. This relationship may operate through several transmission mechanisms including macroeconomic effects of energy transition investment, portfolio rebalancing by institutional investors with integrated commodity-energy strategies, and sentiment effects documented by (Maghyereh & Abdoh, 2022).
The economic significance of these relationships should be evaluated alongside their statistical significance, considering the findings of (Dai et al., 2022) regarding dynamic spillover effects between precious metals and energy-related markets. While the coefficients are statistically distinguishable from zero, the practical impact depends on the typical magnitude of changes in the explanatory variables and their persistence over time.
5.2. Long-Term Equilibrium Relationships
The VECM analysis provides evidence for cointegrating relationships among the three variables, suggesting that fundamental economic forces create stable long-run connections despite short-term volatility, consistent with the theoretical framework established by (Johansen & Juselius, 1990). The existence of cointegration implies that while temporary deviations may occur due to various market shocks, systematic forces operate to restore equilibrium relationships.
The exceptionally high R-squared value (0.973) for the solar capacity equation requires cautious interpretation given the methodological constraints identified by (Madziwa et al., 2022) regarding multivariate precious metals modeling. While this result suggests strong systematic relationships, it may also reflect specification issues, omitted variable bias, or overfitting problems associated with the limited sample size.
The differential adjustment speeds revealed by the error correction coefficients provide insights into market responsiveness and flexibility. Solar capacity’s rapid adjustment speed (-0.85) suggests that renewable energy investment decisions respond quickly to changing market conditions, consistent with the project-based nature of capacity additions and active management of development pipelines documented in the renewable energy literature.
5.3. Policy and Investment Implications
The empirical findings generate several implications for policy makers and investment practitioners, though these should be interpreted within the context of the study’s methodological limitations. The evidence for systematic relationships between precious metals markets and renewable energy deployment aligns with (Trench et al., 2024), who examine gold production perspectives on the global energy transition, suggesting that commodity market conditions may provide early indicators for energy transition investment flows.
For renewable energy policy development, the sensitivity of solar capacity to precious metals market conditions indicates that commodity market stability may influence the effectiveness of renewable energy incentives and support mechanisms. This finding complements the work of (Luqman et al., 2023) on natural resource commodity markets, suggesting that policy frameworks might benefit from incorporating precious metals market monitoring as part of comprehensive energy transition planning.
Investment practitioners may find value in understanding the systematic relationships identified in this analysis for portfolio construction and risk management purposes, building on the methodological approaches demonstrated by (Usman et al., 2022) in their VECM analysis of energy and economic variables. However, the statistical uncertainty inherent in small-sample analysis requires careful validation before implementing investment strategies based on these relationships.
5.4. Methodological Limitations and Robustness Considerations
The analysis faces several important limitations that constrain the generalizability and practical application of findings. The twenty-observation sample size represents the primary constraint, limiting statistical power and parameter precision while increasing the risk of spurious relationships or overfitting, as noted in the methodological literature on commodity price forecasting by (Madziwa et al., 2022).
The focus on annual data, while capturing strategic decision-making timeframes, may miss important higher-frequency adjustment mechanisms that operate within shorter time periods. (Li & Umair, 2023) demonstrate the importance of examining different temporal scales when analyzing precious metals market responses to energy sector volatility, suggesting that alternative data frequencies or extended time series would provide more robust validation.
The variable selection, while theoretically motivated by the findings of (Zhang et al., 2023) and (Bashir et al., 2024), represents a subset of potential factors that may influence precious metals-renewable energy relationships. Omitted variable bias remains a concern, particularly regarding macroeconomic controls, policy variables, and other commodity prices that may confound the estimated relationships.
The study’s geographic scope, focusing on global aggregates, may obscure important regional variations in market integration patterns that could provide more nuanced understanding of the underlying economic mechanisms, as suggested by the cross-country analysis approaches employed by (Bashir et al., 2024) and (Usman et al., 2022).
6. Conclusion
This study provides empirical evidence for systematic relationships between precious metals markets and global solar energy capacity during the critical period of energy transition development from 2005 to 2024. The ARIMA analysis demonstrates statistically significant short-term influences of silver prices and solar capacity on gold price movements, while the VECM framework identifies cointegrating relationships suggesting stable long-run equilibrium connections among the variables.
The findings contribute to the emerging literature on energy transition finance by documenting the integration of commodity and renewable energy markets during a period of structural economic transformation. The evidence supports the theoretical expectations established by (Zhang et al., 2023) regarding precious metal responsiveness to clean energy developments and complements the portfolio integration effects documented by (Dai et al., 2022). The results suggest that precious metals markets have incorporated renewable energy sector information as fundamental pricing factors rather than treating energy transition developments as exogenous influences.
However, the results require cautious interpretation given significant methodological limitations, particularly the constraints imposed by the limited sample size. The exceptionally high explanatory power for solar capacity in the VECM system may reflect overfitting or specification issues that warrant investigation with larger datasets and alternative methodological approaches, as suggested by the forecasting literature reviewed by (Madziwa et al., 2022).
The practical implications of these findings extend to portfolio management, where understanding systematic relationships between commodity and energy markets may inform investment strategy development and risk assessment procedures. The work builds on the methodological precedents established by (Usman et al., 2022) and provides empirical support for the policy considerations identified by (Trench et al., 2024) regarding precious metals markets during energy transition periods.
Policy makers may benefit from recognizing that precious metals market conditions can influence renewable energy investment flows and deployment patterns, consistent with the sentiment transmission mechanisms documented by (Maghyereh & Abdoh, 2022). This suggests potential value in integrated monitoring approaches that consider commodity market conditions alongside traditional energy policy indicators.
Future research should address the limitations identified in this analysis through extended time series, higher-frequency data, and broader geographic and sectoral coverage, following the approaches suggested by (Li & Umair, 2023) and (Bashir et al., 2024). Robustness analysis with alternative model specifications and validation through out-of-sample forecasting would strengthen confidence in the systematic relationships documented in this preliminary investigation.
The energy transition continues to reshape traditional economic relationships across multiple sectors and markets. Understanding these evolving connections requires ongoing empirical research that can adapt to changing market structures while maintaining methodological rigor appropriate to the complexity and significance of the phenomena under investigation, as emphasized by (Salisu et al., 2025) in their call for expanded research on energy market uncertainties and precious metals market dynamics.
References
- ARIMA Models and the Box-Jenkins Methodology. (2016). In D. Asteriou & S. G. Hall, Applied Econometrics (pp. 275–296). Macmillan Education UK. [CrossRef]
- Bashir, M. F., Bashir, M. A., Raza, S. A., Bilan, Y., & Vasa, L. (2024). Linking gold prices, fossil fuel costs and energy consumption to assess progress towards sustainable development goals in newly industrialized countries. Geoscience Frontiers, 15(3), 101755. [CrossRef]
- Baur, D. G., & Lucey, B. M. (2010). Is Gold a Hedge or a Safe Haven? An Analysis of Stocks, Bonds and Gold. Financial Review, 45(2), 217–229. [CrossRef]
- Dai, Z., Zhu, H., & Zhang, X. (2022). Dynamic spillover effects and portfolio strategies between crude oil, gold and Chinese stock markets related to new energy vehicle. Energy Economics, 109, 105959. [CrossRef]
- Dickey, D. A., & Fuller, W. A. (1979). Distribution of the Estimators for Autoregressive Time Series With a Unit Root. Journal of the American Statistical Association, 74(366), 427. [CrossRef]
- INTERNATIONAL ENERGY & AGENCY. (2024). Global EV Outlook 2024 (p. 174) [Annual publication]. https://www.irena.org/publications/2025/Mar/Renewable-Capacity-Statistics-2025.
- IRENA. (2025). RENEWABLE CAPACITY STATISTICS 2025 (p. 75). International Renewable Energy Agency. https://www.irena.org/publications/2025/Mar/Renewable-Capacity-Statistics-2025.
- Johansen, S., & Juselius, K. (1990). MAXIMUM LIKELIHOOD ESTIMATION AND INFERENCE ON COINTEGRATION — WITH APPLICATIONS TO THE DEMAND FOR MONEY. Oxford Bulletin of Economics and Statistics, 52(2), 169–210. [CrossRef]
- LBMA. (2025). LBMA Precious Metal Prices. https://www.lbma.org.uk/prices-and-data/precious-metal-prices#/.
- Li, Y., & Umair, M. (2023). The protective nature of gold during times of oil price volatility: An analysis of the COVID-19 pandemic. The Extractive Industries and Society, 15, 101284. [CrossRef]
- Luqman, M., Mugheri, A., Ahmad, N., & Soytas, U. (2023). Casting shadows on natural resource commodity markets: Unraveling the quantile dilemma of gold and crude oil prices. Resources Policy, 86, 104269. [CrossRef]
- Madziwa, L., Pillalamarry, M., & Chatterjee, S. (2022). Gold price forecasting using multivariate stochastic model. Resources Policy, 76, 102544. [CrossRef]
- Maghyereh, A., & Abdoh, H. (2022). Can news-based economic sentiment predict bubbles in precious metal markets? Financial Innovation, 8(1). [CrossRef]
- Reboredo, J. C. (2013). Is gold a safe haven or a hedge for the US dollar? Implications for risk management. Journal of Banking & Finance, 37(8), 2665–2676. [CrossRef]
- Salisu, A. A., Ogbonna, A. E., Gupta, R., & Shiba, S. (2025). Energy Market Uncertainties and Gold Return Volatility: A GARCH – MIDAS Approach. Australian Economic Papers, 1467-8454.12396. [CrossRef]
- Trench, A., Baur, D., Ulrich, S., & Sykes, J. P. (2024). Gold Production and the Global Energy Transition—A Perspective. Sustainability, 16(14), 5951. [CrossRef]
- Usman, M., Loves, L., Russel, E., Ansori, M., Warsono, W., Widiarti, W., & Wamiliana, W. (2022). Analysis of Some Energy and Economics Variables by Using VECMX Model in Indonesia. International Journal of Energy Economics and Policy, 12(2), 91–102. [CrossRef]
- Zhang, H., Zhang, Y., Gao, W., & Li, Y. (2023). Extreme quantile spillovers and drivers among clean energy, electricity and energy metals markets. International Review of Financial Analysis, 86, 102474. [CrossRef]
Table 1.
Descriptive Statistics (2005-2024).
| Variable | Mean | Std Dev | Min | Max | CV |
|---|---|---|---|---|---|
| Gold Price (USD/oz) | 1,346 | 421 | 445 | 2,000 | 0.31 |
| Silver Price (USD/oz) | 19.24 | 6.52 | 7.31 | 35.12 | 0.34 |
| Solar Capacity (GW) | 447 | 456 | 15 | 1,300 | 1.02 |
Table 2.
ARIMA(1,1,0) Model Results.
| Variable | Coefficient | Std Error | t-statistic | p-value |
|---|---|---|---|---|
| Silver Price Change | 15.42 | 4.83 | 3.19 | 0.008** |
| Solar Capacity Change | 0.28 | 0.10 | 2.71 | 0.014* |
| AR(1) | 0.34 | 0.18 | 1.89 | 0.075 |
*Significant at 5% level; **Significant at 1% level AIC = 230.11; Log-Likelihood = -112.05; n = 19.
Table 3.
VECM Estimation Results.
| Equation | R-squared | Error Correction Coefficient | Standard Error |
|---|---|---|---|
| Gold Price | 0.342 | -0.18 | 0.08 |
| Silver Price | 0.052 | -0.12 | 0.09 |
| Solar Capacity | 0.973 | -0.85 | 0.21 |
AIC = 27.85; Log-Likelihood = -256.57; n = 19.
Disclaimer/Publisher’s Note: The statements, opinions and data contained in all publications are solely those of the individual author(s) and contributor(s) and not of MDPI and/or the editor(s). MDPI and/or the editor(s) disclaim responsibility for any injury to people or property resulting from any ideas, methods, instructions or products referred to in the content. |
© 2025 by the authors. Licensee MDPI, Basel, Switzerland. This article is an open access article distributed under the terms and conditions of the Creative Commons Attribution (CC BY) license (http://creativecommons.org/licenses/by/4.0/).
Copyright: This open access article is published under a Creative Commons CC BY 4.0 license, which permit the free download, distribution, and reuse, provided that the author and preprint are cited in any reuse.


