Submitted:
06 September 2025
Posted:
08 September 2025
You are already at the latest version
Abstract
Enzymatic browning in fruits such as apples is a major quality concern that shortens shelf life, decreases nutritional value, and reduces consumer acceptance. This study evaluated the effects of four treatments (lemon juice, bovine catalase, Aspergillus catalase, and a water control) on the browning of cubic apple slices. Slices were submerged in each solution, and browning intensity was quantified by measuring absorbance at 420 nm using a spectrophotometer at 15, 30, 45, and 60 minutes. Solution pH was also recorded to assess its relationship with browning progression. Results showed clear differences between treatments. Lemon juice, with strongly acidic pH values, consistently produced the lowest absorbance increases, confirming the inhibitory effect of acidity on polyphenol oxidase activity. In contrast, bovine catalase produced the greatest browning, with the largest net absorbance increase by 60 minutes, suggesting that near-neutral conditions favored rapid pigment formation. Aspergillus catalase and the control group showed intermediate browning levels, with steady increases over time but lower final values than bovine catalase. These findings demonstrate that catalase did not inhibit enzymatic browning; instead, pH was the dominant factor influencing outcomes. Overall, the results support the hypothesis that acidification with lemon juice slows enzymatic browning, while catalase treatments permit or enhance browning relative to control conditions. This study highlights the importance of pH in controlling oxidative browning and suggests that simple acidulant treatments may be effective in reducing postharvest losses. Such strategies have practical implications for improving food preservation, extending shelf life, and reducing waste in the fresh-produce industry.
Keywords:
Catalase
; Enzymatic browning
; Polyphenol oxidase
; Food preservation
; Food waste reduction
1. Introduction
Browning is a chemical process that significantly impacts the color, flavor, nutritional value, and texture of food. It is broadly categorized into enzymatic browning, which commonly occurs in fresh produce, and non-enzymatic browning, such as caramelization during cooking (Queiroz et al., 2008; Mayer, 2006). In apples, browning is mainly enzymatic, triggered when physical tissue damage, such as slicing, exposes inner cells to the atmospheric oxygen. Polyphenol oxidase (PPO) catalyzes the oxidation of phenolic compounds into quinones, which subsequently polymerize into brown melanin compounds. This process not only alters food appearance but also reduces nutritional value, including the degradation of vitamin C (Moon et al., 2020; Lee & Kader, 2000). Browning severity depends on enzyme concentration, phenolic content, and oxygen availability, and PPO activity also plays a role in plant defense against stress (Yoruk & Marshall, 2003).
1.1. Catalase
Catalase is an oxidative enzyme, common to both plants and animals, that decomposes hydrogen peroxide into water and oxygen, thereby protecting cells from oxidative stress (Chelikani et al., 2004). Catalase is widely distributed in animals, plants, fungi, and bacteria, with significant structural and functional diversity across sources. Animal catalases, such as bovine liver catalase, typically have stable tetrameric structures optimized for neutral pH and moderate temperatures, making them a common model enzyme in experimental settings (Gürsoy & Könönen, 2020). Fungal catalases, such as those from Aspergillus niger, exhibit greater structural variability and resilience, reflecting the diverse environments fungi inhabit. Both animal and fungal catalases share tetrameric structures with heme groups at their active sites, but their biochemical properties differ, offering an opportunity for comparative analysis.
In this study, we selected bovine liver catalase as the representative animal catalase and Aspergillus niger catalase as the fungal counterpart. Bovine catalase is relevant to mammalian systems and widely available, while Aspergillus catalase is known for its high stability and activity. Comparing these sources allows evaluation of whether catalase origin influences browning rates, especially relative to acidic inhibition by lemon juice.
1.2. Food Waste
Food waste is a global issue that occurs worldwide. According to Feeding America Food waste is a critical global issue with both environmental and economic consequences. Approximately one third of food produced for human consumption is lost or wasted annually, about 1.3 billion tons worldwide (FAO, 2011; Gustavsson et al., 2011). In the United States alone, food waste is valued at over $400 billion annually and significantly contributes to the landfill and greenhouse gas emissions (UNEP, 2021). Bacterial decomposition under anaerobic conditions produces methane, a greenhouse gas far more potent than carbon dioxide.
Enzymatic browning is one of the key factors that reduces the shelf life of fresh-cut fruits and vegetables, leading to consumer rejection and postharvest losses (Jiang & Zheng, 2016). PPO activity initiates oxidation of phenolic substrates, producing quinones that polymerize into pigmented compounds responsible for discoloration. This process accelerates spoilage, diminishes nutritional quality, and contributes directly to food waste. Therefore, identifying treatments that slow browning, such as acidification or modulation of enzyme activity, is essential for improving food preservation and reducing waste.
This experiment investigates the impact of acidic lemon juice, bovine catalase (animal-derived), and Aspergillus catalase (fungi-derived) on the enzymatic browning of apple slices, measured via absorbance over time. We hypothesized that the acidic lemon juice would slow browning effectively, while catalase treatments would yield distinct outcomes influenced by enzyme origin and reaction conditions.
2. Methods
2.1. Acquisition and Preparation of Treatment Solutions
Apple slices (Malus domestica) and lemon juice concentrate were purchased from a local grocery store. Bovine liver catalase (CAS: 9001-05-2; Chem Savers, USA) and Aspergillus niger catalase (Sigma-Aldrich, USA) were used as enzymatic treatments. Distilled water served as the control. pH was measured with a digital pH meter.
2.2. Preparation of Experimental Groups
Four treatment groups were tested: bovine catalase, Aspergillus catalase, lemon juice, and control (distilled water). For each treatment, two independent trials were conducted. Solutions were prepared to a final volume of 15 mL in 150 mL Erlenmeyer flasks. Each flask received five cubed apple slices (about 1 cm3 each), fully submerged in the respective solution. Slice size and immersion time were kept consistent across groups to minimize variability.
2.3. Preparation of Colorimetry Solutions
At each 15-minute interval (0, 15, 30, 45, and 60 min), a 1.0 mL aliquot of solution was withdrawn from each flask using a sterile syringe. Samples were diluted with distilled water to a final volume of 15 mL to standardize concentration. Absorbance was measured using a spectrophotometer at 420 nm to quantify pigment accumulation associated with browning.
2.4. Data Collection
Both qualitative and quantitative data were collected. pH was monitored with pH strips for general trends and with a calibrated pH meter for precise readings. Visual changes in color were noted. Quantitative browning was assessed through spectrophotometer absorbance readings every 15 minutes over a 60 minute period.
3. Results
Initial solution pH differed by each treatment (Table 1). Lemon juice was most acidic across trials (pH 3.83 and 3.24), bovine catalase was slightly acidic (6.82; 6.85), Aspergillus catalase was near neutral (7.17; 7.46), and the water control was neutral at 7. The span across treatments was approximately 4.2 pH units (from 3.24 to 7.46), showing distinct starting conditions before browning measurements. Replicate consistency within each treatment was high (within treatment ranges below 0.29 pH units), indicating stable preparation across trials (2 trials per treatment).
Table 2 presents the mean colorimetric absorbance (±SD, SE) value for each treatment at 15, 30, 45, and 60 minutes, along with the net change from 15 to 60 minutes mark. At 15 minutes, absorbance was lowest for the control (0.146 ± 0.096) and bovine catalase (0.152 ± 0.087), intermediate for lemon juice (0.243 ± 0.025), and highest for Aspergillus catalase (0.360 ± 0.120). By 30 minutes, lemon juice (1.433 ± 0.203) and the control (1.092 ± 0.138) exceeded bovine catalase (0.406 ± 0.310) and showed similar values to Aspergillus catalase (1.020 ± 0.400). At 45 minutes, Aspergillus catalase had the highest mean (1.351 ± 0.182), followed by lemon juice (1.219 ± 0.450), the control (1.075 ± 0.631), and bovine catalase (1.056 ± 0.096). At 60 minutes, bovine catalase reached the highest endpoint (1.567 ± 0.198), followed by Aspergillus catalase (1.440 ± 0.212) and the control (1.387 ± 0.088), while lemon juice was lowest (1.253 ± 0.245). Net change in mean absorbance from 15 to 60 minutes showed bovine catalase highest (+1.415), followed by the control (+1.241), Aspergillus catalase (+1.080), and lemon juice (+1.010). Expressed as percent change from 15 to 60 minutes, the increases were +930% for bovine catalase, +850% for the control, +420% for lemon juice, and +300% for Aspergillus catalase. Precision at 60 minutes, assessed by coefficient of variation, was greatest for the control (~0.06), followed by bovine catalase (~0.13), Aspergillus catalase (~0.15), and lemon juice (~0.20).
Figure 1 illustrates the time courses for lemon juice. Both replicates rose monotonically, with closely aligned traces. Lemon juice began higher at 15 minutes than the control and bovine catalase but displayed a slower rate of increase after 30 minutes, ultimately finishing with the lowest absorbance at 60 minutes. This pattern reflects an early surge followed by a plateau.
Figure 2 shows the bovine catalase replicates, which started with low absorbance at 15 minutes but exhibited the largest increase across the time course. After 30 minutes, the trajectory steepened, and by 60 minutes, bovine catalase produced the highest endpoint among treatments. Replicates were tightly grouped at later intervals, consistent with the relatively low standard deviations at 45 and 60 minutes.
Figure 3 presents the Aspergillus catalase trajectories. This treatment began with the highest absorbance at 15 minutes and continued to rise steadily through 60 minutes, maintaining a consistent upward trend. Although surpassed by bovine catalase at the final time point, Aspergillus catalase maintained strong midcourse values, especially at 45 minutes, where it led all treatments.
Figure 4 depicts the water control replicates, which showed a steady increase throughout the observation period. While values at 45 minutes displayed greater variability between replicates, they converged again at 60 minutes, resulting in a mean close to Aspergillus catalase and above lemon juice. The overall trajectory demonstrates a continuous upward trend with moderate variability that stabilized by the final measurement.
Because each treatment had n = 2, outcomes are presented descriptively (means, SDs, SEs, CVs, and percent changes) without inferential statistics. Additional replication would be required to support formal hypothesis testing with approaches such as mixed-effects modeling or endpoint/AUC comparisons with post-hoc corrections.
4. Discussion
Enzyme activity is strongly influenced by pH, with each enzyme functioning optimally within a narrow range. Deviation from this range can destabilize ionic and hydrogen bonds that maintain enzyme’s active site structure, leading to partial or full denaturation (Masson, 2022). Denaturation alters the active site and reduces catalytic efficiency, which can slow or prevent the browning process, mediated by polyphenol oxidase (PPO). This experiment compared browning across four conditions—lemon juice, bovine catalase, Aspergillus catalase, and a water control—allowing assessment of how pH and enzyme environment influenced browning outcomes.
4.1. Lemon Juice Group
Lemon juice produced the most acidic conditions (pH ~3.2–3.8), reflecting the high concentration of citric acid. Although low pH is known to inhibit PPO, both replicates showed progressive increases in absorbance. Compared to other groups, lemon juice had the smallest net increase in browning, consistent with acidity slowing but not halting the enzymatic process. Minor differences between replicates likely reflect variability in slice size or surface exposure. These findings support the role of acidity as a practical inhibitor of browning, a principle already applied in food preservation, though complete suppression was not achieved.
4.2. Bovine Catalase Group
Bovine catalase solutions were slightly acidic (pH ~6.8) and promoted the largest increase in browning by 60 minutes. The sharp late-interval rise suggests that near-neutral pH conditions allowed PPO to remain highly active. Importantly, catalase itself does not catalyze browning but may reduce hydrogen peroxide, a byproduct of oxidative stress, thereby creating a favorable environment for PPO activity. This finding indicates that bovine catalase did not inhibit browning; instead, conditions were permissive for strong pigment formation.
4.3. Aspergillus Catalase Group
Aspergillus catalase replicates had nearly neutral pH (7.2–7.5) and exhibited a steady trajectory of browning, with relatively high absorbance values throughout. Early time points started above the other groups, and final absorbance values were second only to bovine catalase. The consistent upward trend indicates that neutral pH environments favor PPO activity and melanin formation. Slight differences between replicates may be explained by small variations in solution preparation or tissue contact. Overall, the results highlight that fungal catalase at neutral pH did not reduce PPO-driven browning.
4.4. Control
The control group, consisting of neutral pH water, also showed substantial browning. Net increases were comparable to the Aspergillus catalase group, emphasizing that endogenous apple PPO activity alone is sufficient to drive rapid pigment formation in the absence of additives. Greater variability at mid-course (45 min) between replicates narrowed by the end of the experiment, indicating that browning trends were robust despite small experimental noise.
4.5. Comparative Analysis
When ranked by final browning intensity, bovine catalase treatment showed the highest intensity, followed by Aspergillus catalase, control, and lemon juice treatments. This suggests that acidic surrounding partially suppresses the PPO activity. In addition, catalase solutions did not inhibit browning and may have indirectly supported favorable conditions for pigment formation. These outcomes align with prior studies showing that acidity reduces enzymatic browning rates, whereas neutral environments accelerate pigment accumulation (Moon et al., 2020).
From a practical standpoint, results reinforce the effectiveness of acidic solutions (e.g., lemon juice) for mitigating but not preventing fruit browning, which has relevance in food processing and storage. Conversely, catalase treatments do not represent a viable intervention for reducing browning in apples.
4.6. Limitations
A key limitation of this study was the small sample size (n = 2 per group), which restricts the use of inferential statistics and increases sensitivity to variability between replicates. Only descriptive measures were reported. With larger sample sizes or with repeated-measures ANOVA test, future studies could produce treatment-by-time interactions more effectively. Future work should expand replicates, include additional pH affecting treatments, and test PPO specific inhibitors to directly evaluate enzymatic contributions. Applying microscopy or chemical assays of phenolic substrates could further validate the mechanistic link between pH, PPO activity, and pigment formation.
5. Conclusions
This study investigated how pH modifying substances and catalase variants influence enzymatic browning in apple slices. All treatments showed increasing absorbance over 60 minutes, indicating ongoing browning. Lemon juice produced the smallest net increase, consistent with the inhibitory effect of acidic conditions on PPO activity. In contrast, bovine catalase replicates exhibited the largest increase, suggesting that near-neutral conditions allowed browning to proceed more strongly than anticipated. Aspergillus catalase and the control showed intermediate results, reinforcing the role of neutral pH in facilitating pigment formation.
The findings supported our hypothesis that lemon juice slows browning, highlighting acidity as a practical intervention for food preservation. However, the unexpectedly strong browning in the bovine catalase group suggests that catalase did not inhibit enzymatic browning and may have indirectly maintained favorable conditions for PPO activity. These results emphasize the importance of pH as a key factor in oxidative browning. Despite the small sample size, this study demonstrates how simple food-based treatments can alter browning rates and provides a foundation for further work on enzymatic control strategies.
References
- Queiroz, C., Morais, S., Lima, A. M., & Fialho, E. (2008). Polyphenol oxidase: Characteristics and mechanisms of browning control. Food Reviews International, 24(4), 361–375. [CrossRef]
- Mayer, A. M. (2006). Polyphenol oxidases in plants and fungi: Going places? Phytochemistry, 67(21), 2318–2331.
- Moon, K. M., Kwon, E.-B., Lee, B., & Kim, C. Y. (2020). Recent trends in controlling the enzymatic browning of fruit and vegetable products. Molecules, 25(12), 2754. [CrossRef]
- Lee, S. K., & Kader, A. A. (2000). Preharvest and postharvest factors influencing vitamin C content of horticultural crops. Postharvest Biology and Technology, 20(3), 207–220. [CrossRef]
- Yoruk, R., & Marshall, M. R. (2003). Physicochemical properties and function of plant polyphenol oxidase: A review. Journal of Food Biochemistry, 27(5), 361–422.
- Chelikani, P., Fita, I., & Loewen, P. C. (2004). Diversity of structures and properties among catalases. Cellular and Molecular Life Sciences, 61(2), 192–208.
- Gürsoy, U. K., & Könönen, E. (2020). Understanding catalase: Function and importance. Molecules, 25(15), 3490. [CrossRef]
- FAO. (2011). Global food losses and food waste: Extent, causes and prevention. Food and Agriculture Organization of the United Nations.
- Gustavsson, J., Cederberg, C., & Sonesson, U. (2011). Global food losses and food waste: Extent, causes and prevention. Food and Agriculture Organization of the United Nations.
- UNEP. (2021). Food Waste Index Report 2021. United Nations Environment Programme.
- Jiang, Q., & Zheng, W. (2016). Effects of anti-browning agents on enzymatic browning and quality parameters of fresh-cut apples. Journal of Food Quality, 39(4), 326–334.
- Masson, P. (2022). Conformational Stability and Denaturation Processes of Proteins. Molecules, 27(20), Article 6861. [CrossRef]
Figure 1.
Absorbance of apple slices treated with lemon juice over 60 minutes. Both replicates increased monotonically, showing a relatively high starting absorbance at 15 minutes and the lowest endpoint among treatments at 60 minutes (n = 2).
Figure 1.
Absorbance of apple slices treated with lemon juice over 60 minutes. Both replicates increased monotonically, showing a relatively high starting absorbance at 15 minutes and the lowest endpoint among treatments at 60 minutes (n = 2).
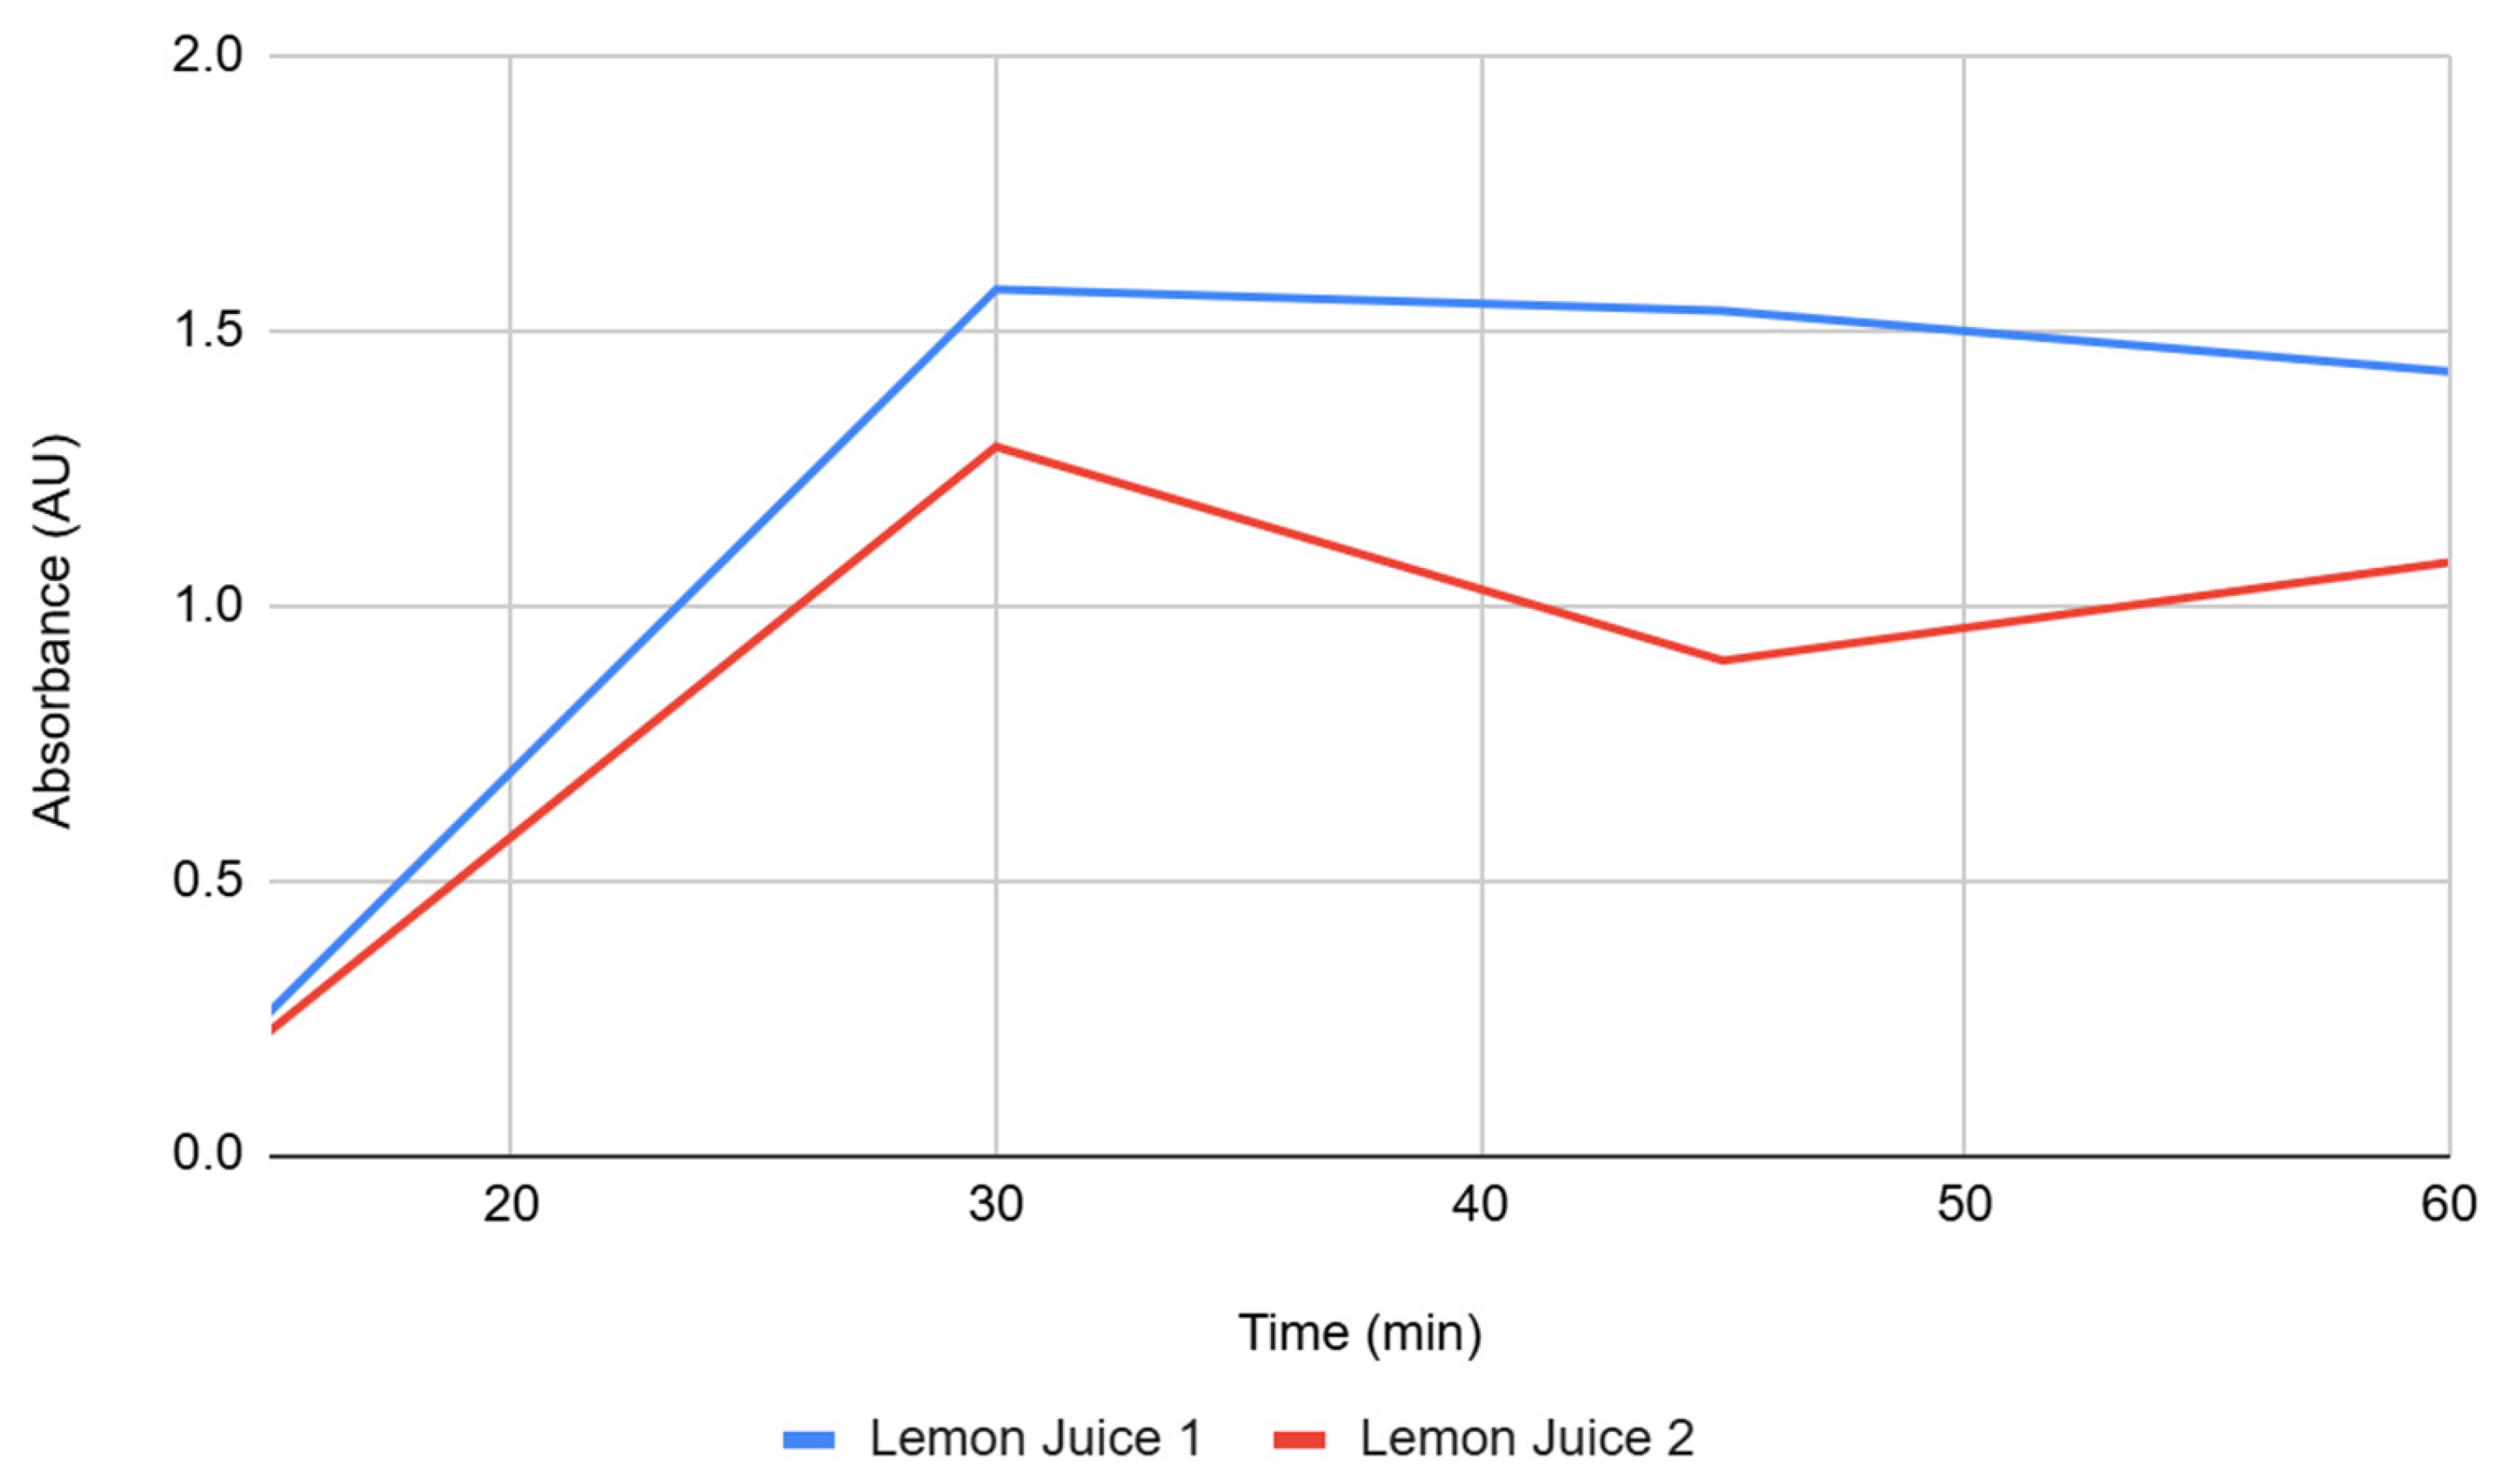
Figure 2.
Absorbance over time for Bovine 1 and Bovine 2 groups. The absorbance for each group was measured at 15-minute intervals for 60 minutes.
Figure 2.
Absorbance over time for Bovine 1 and Bovine 2 groups. The absorbance for each group was measured at 15-minute intervals for 60 minutes.
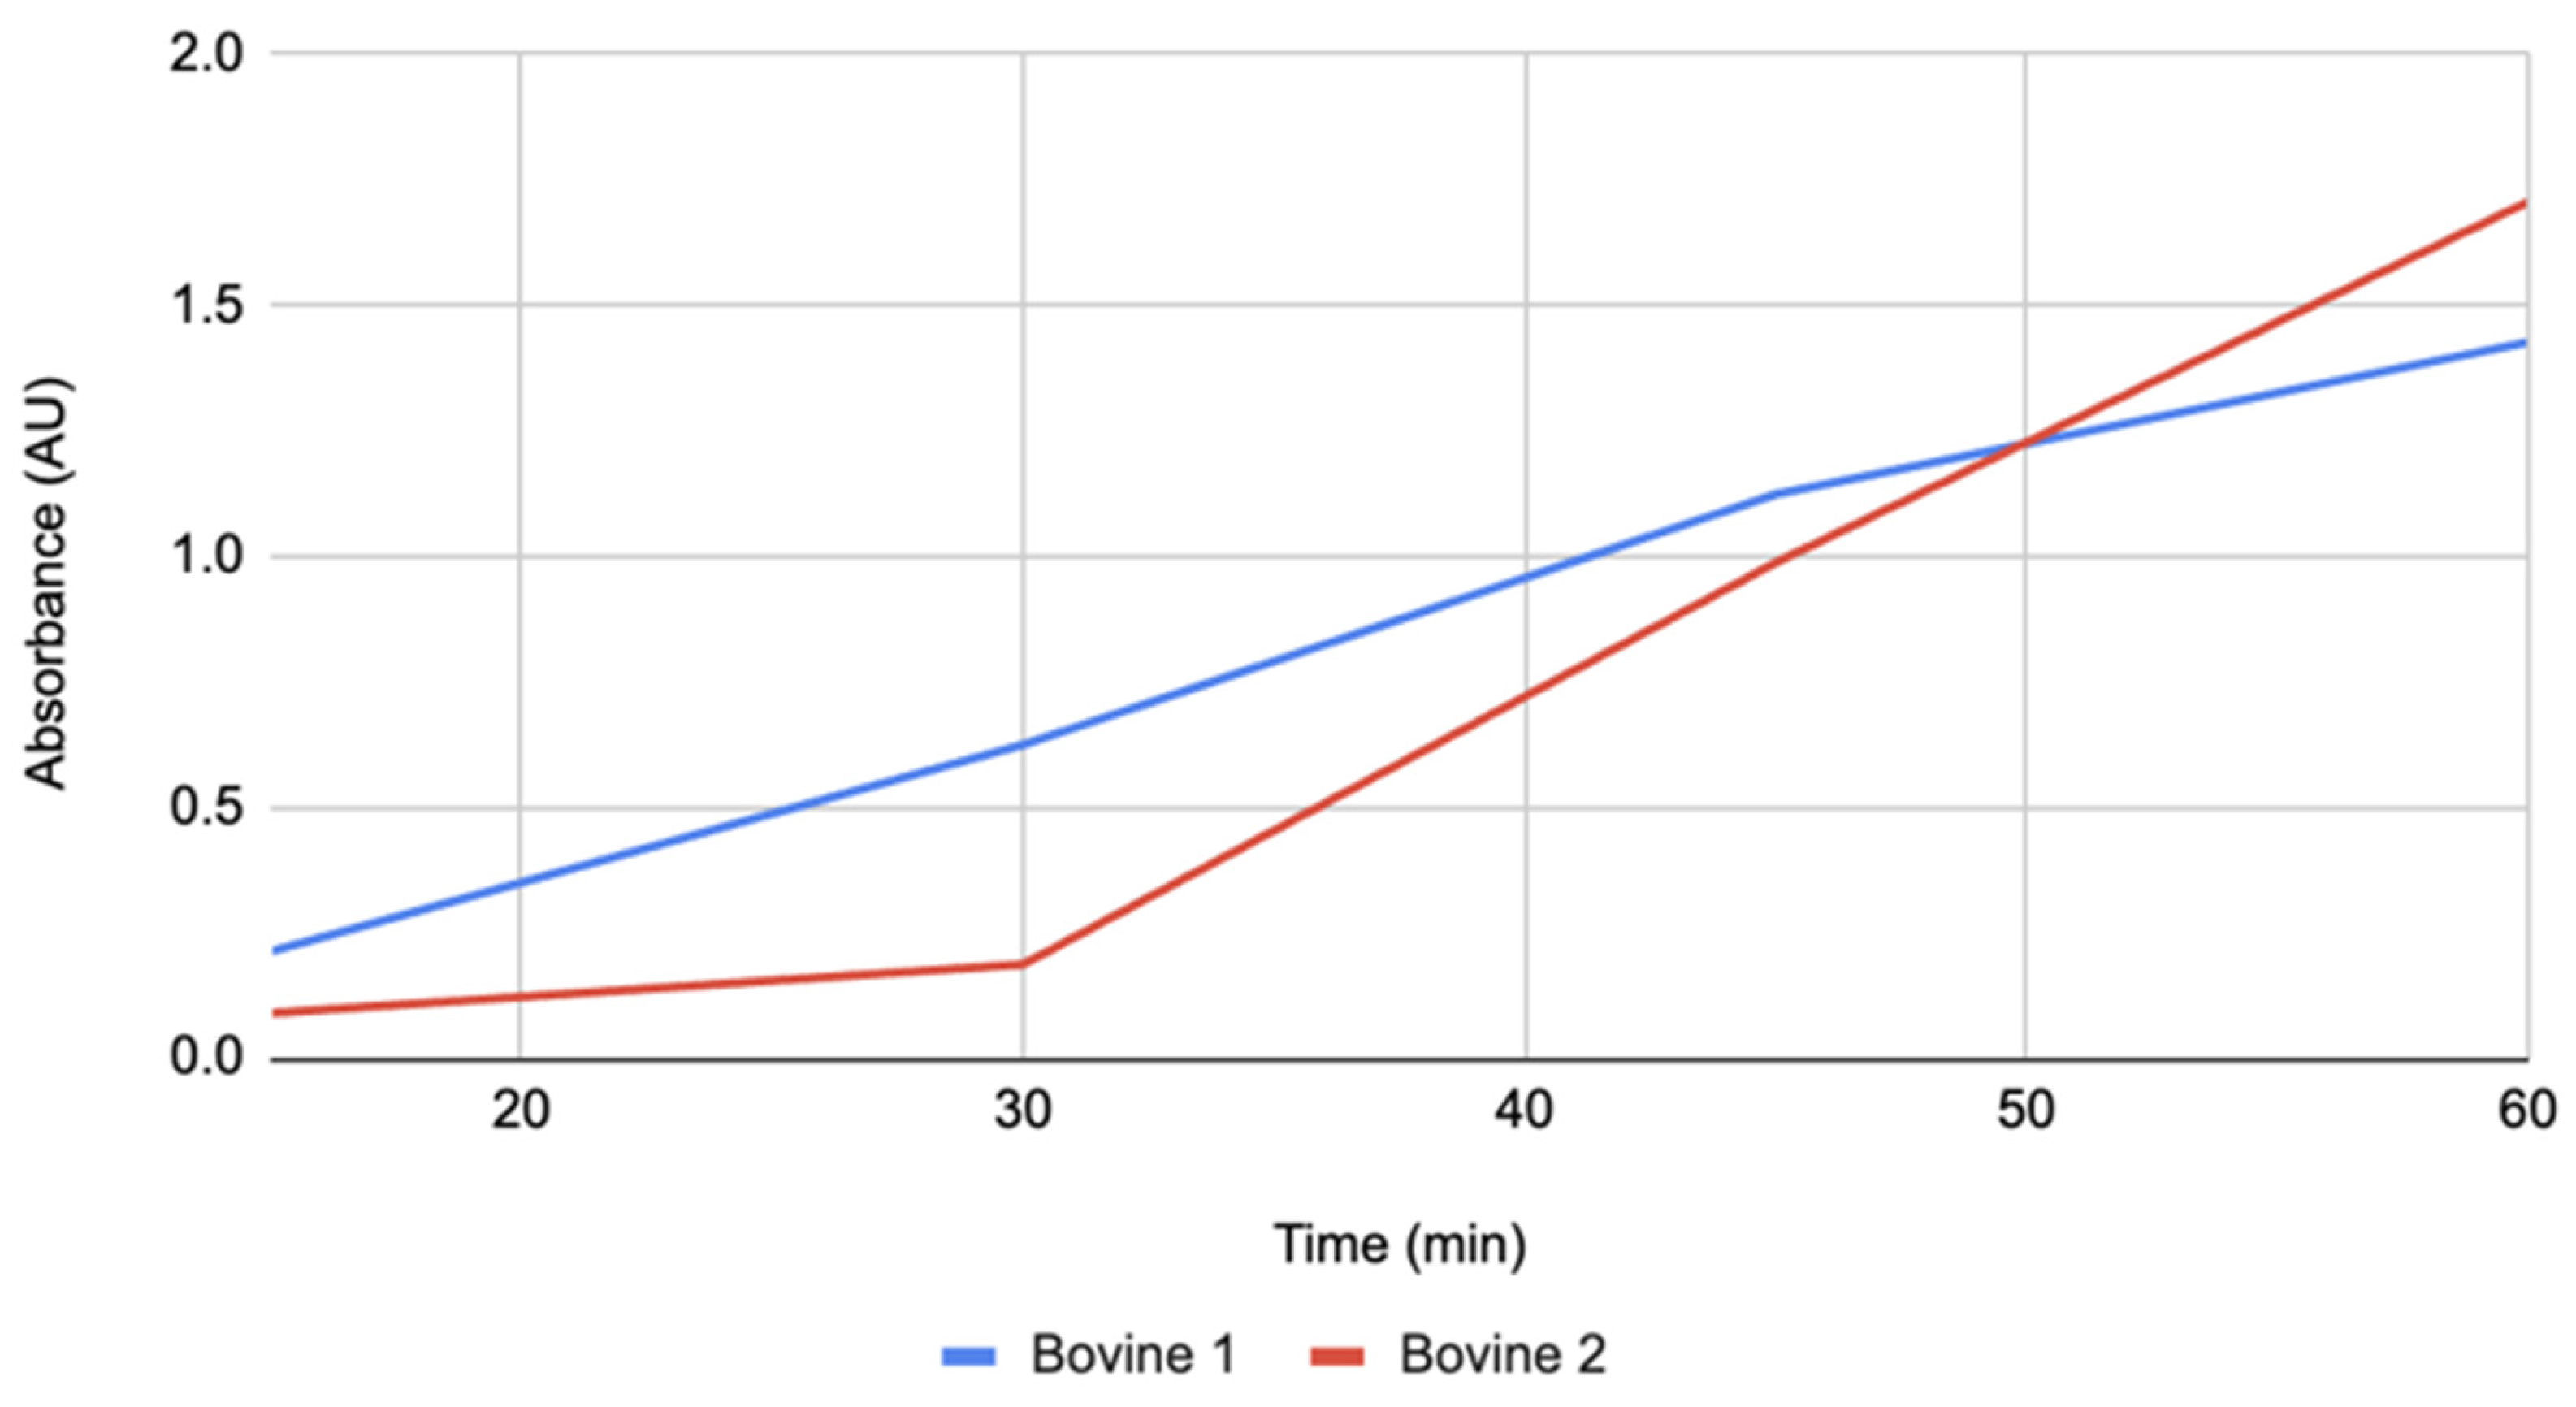
Figure 3.
Absorbance over time for Aspergillus 1 and Aspergillus 2 groups. The absorbance for each group was measured at 15-minute intervals for 60 minutes.
Figure 3.
Absorbance over time for Aspergillus 1 and Aspergillus 2 groups. The absorbance for each group was measured at 15-minute intervals for 60 minutes.
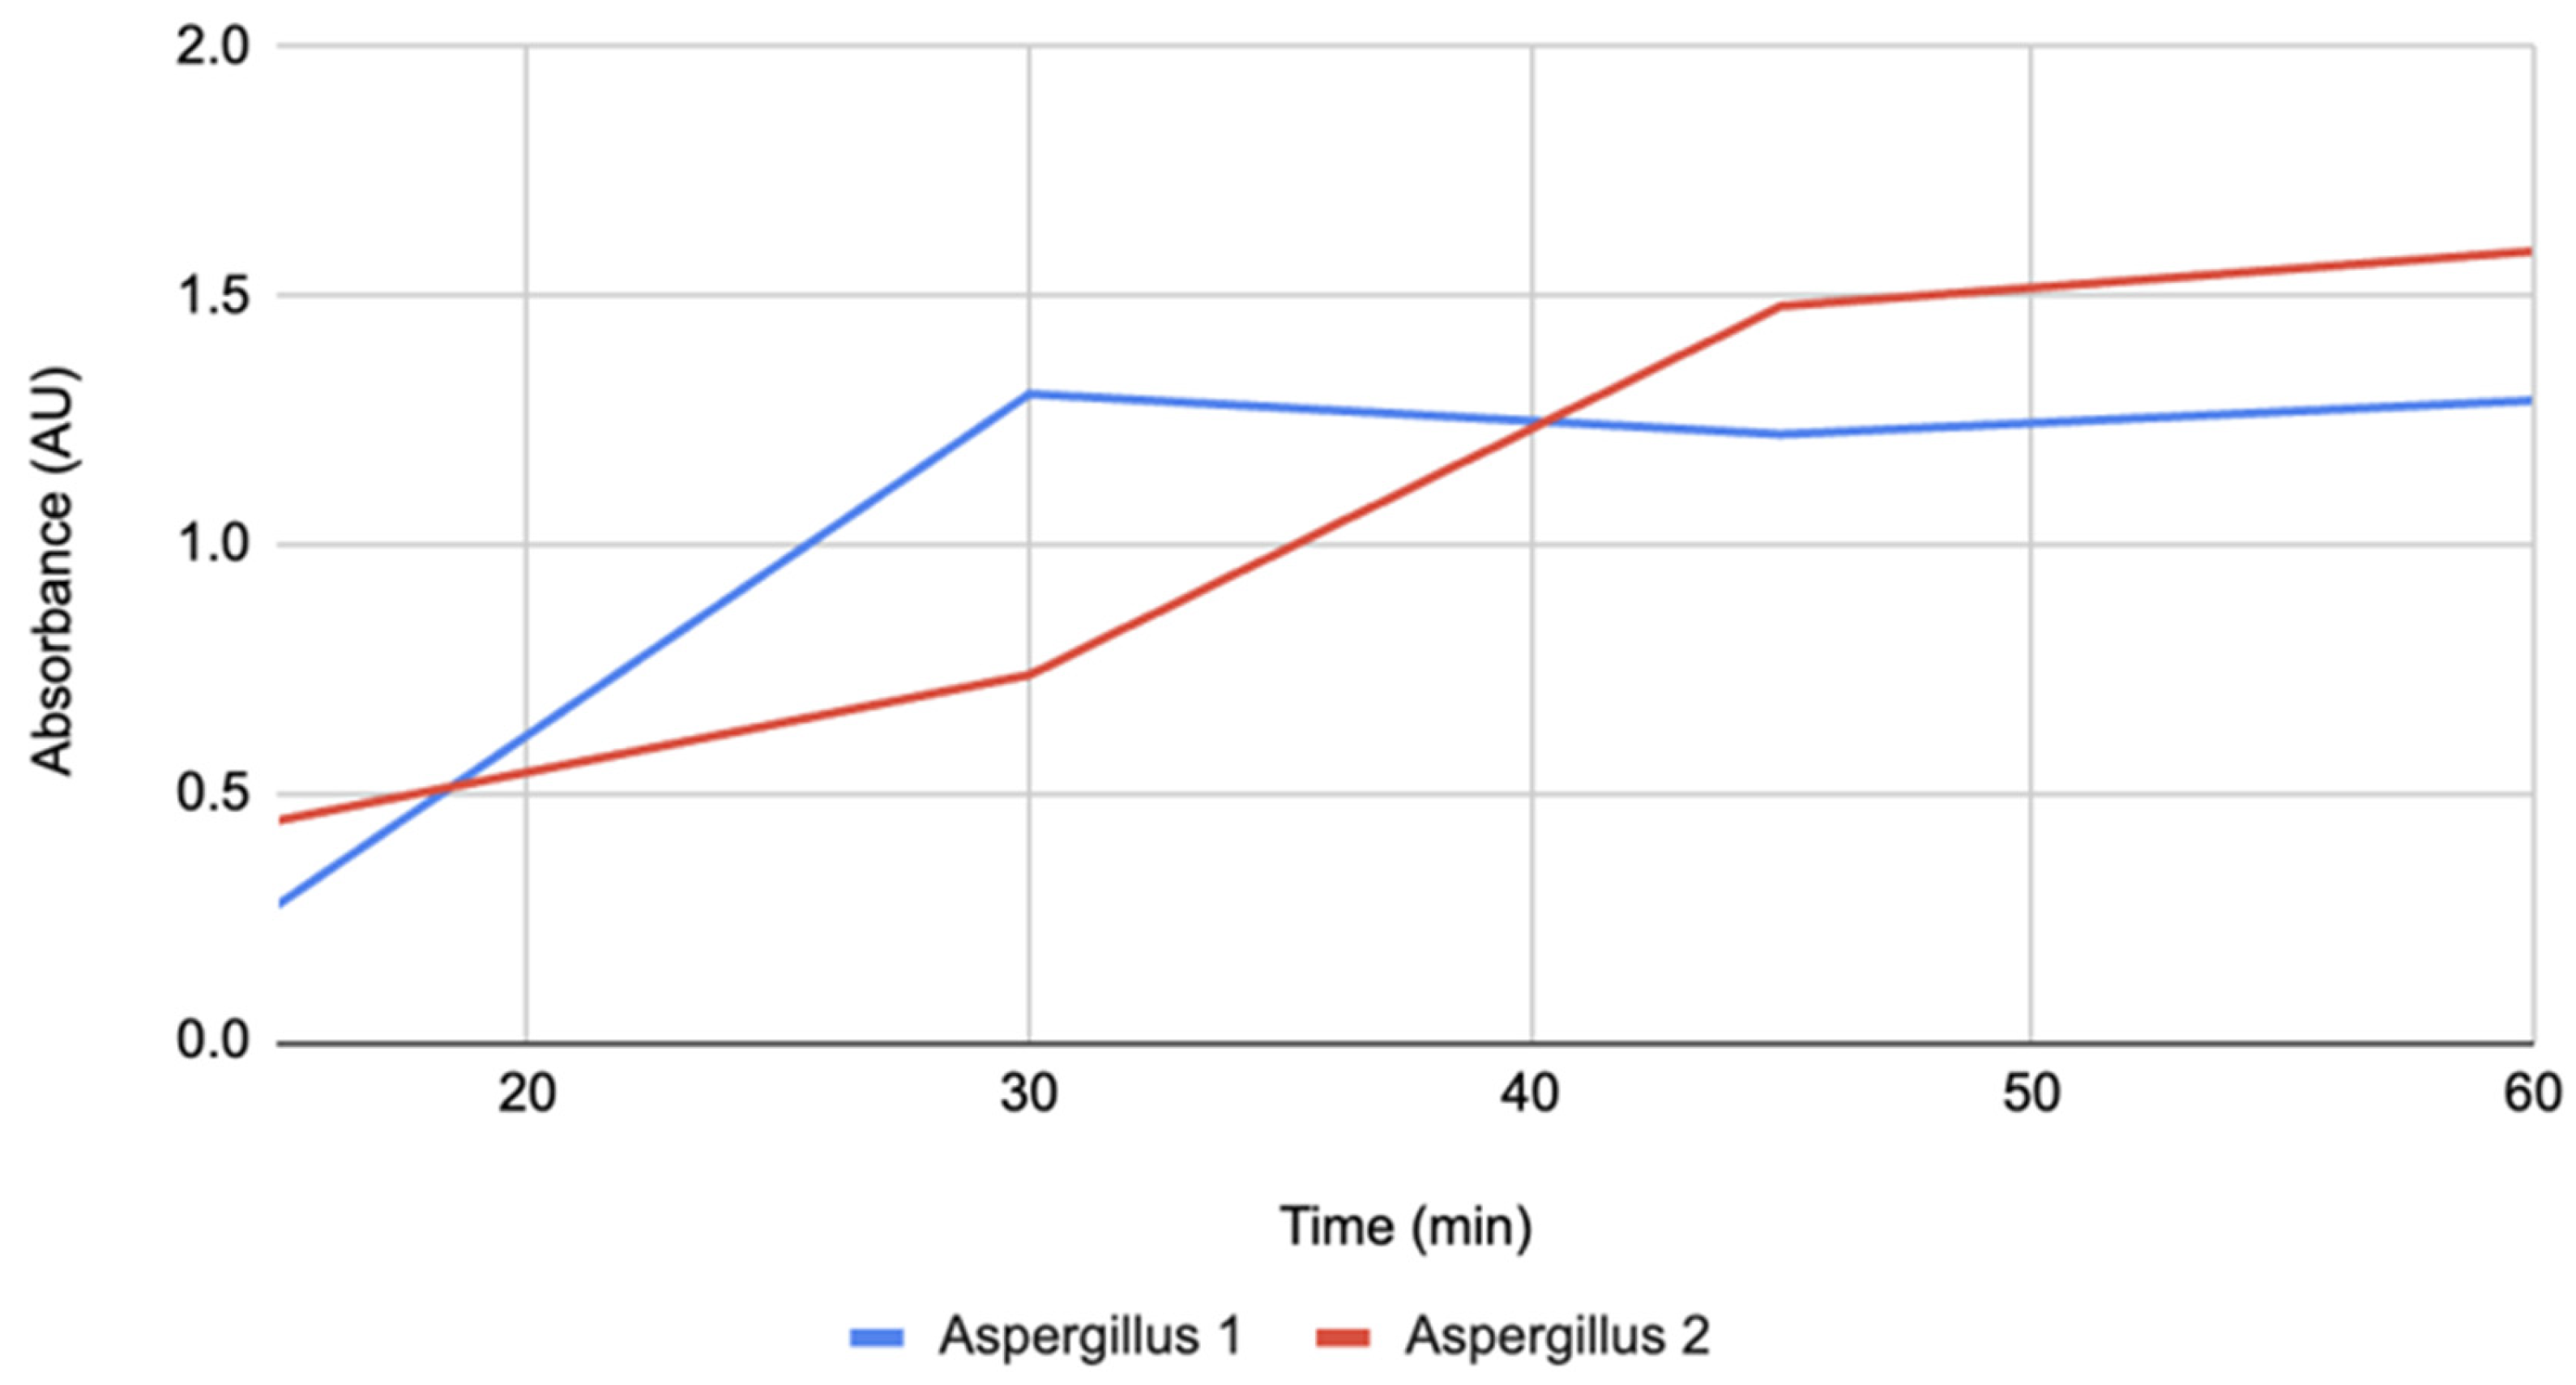
Figure 4.
Absorbance over time for Control 1 and Control 2 groups. The absorbance for each group was measured at 15-minute intervals for 60 minutes.
Figure 4.
Absorbance over time for Control 1 and Control 2 groups. The absorbance for each group was measured at 15-minute intervals for 60 minutes.
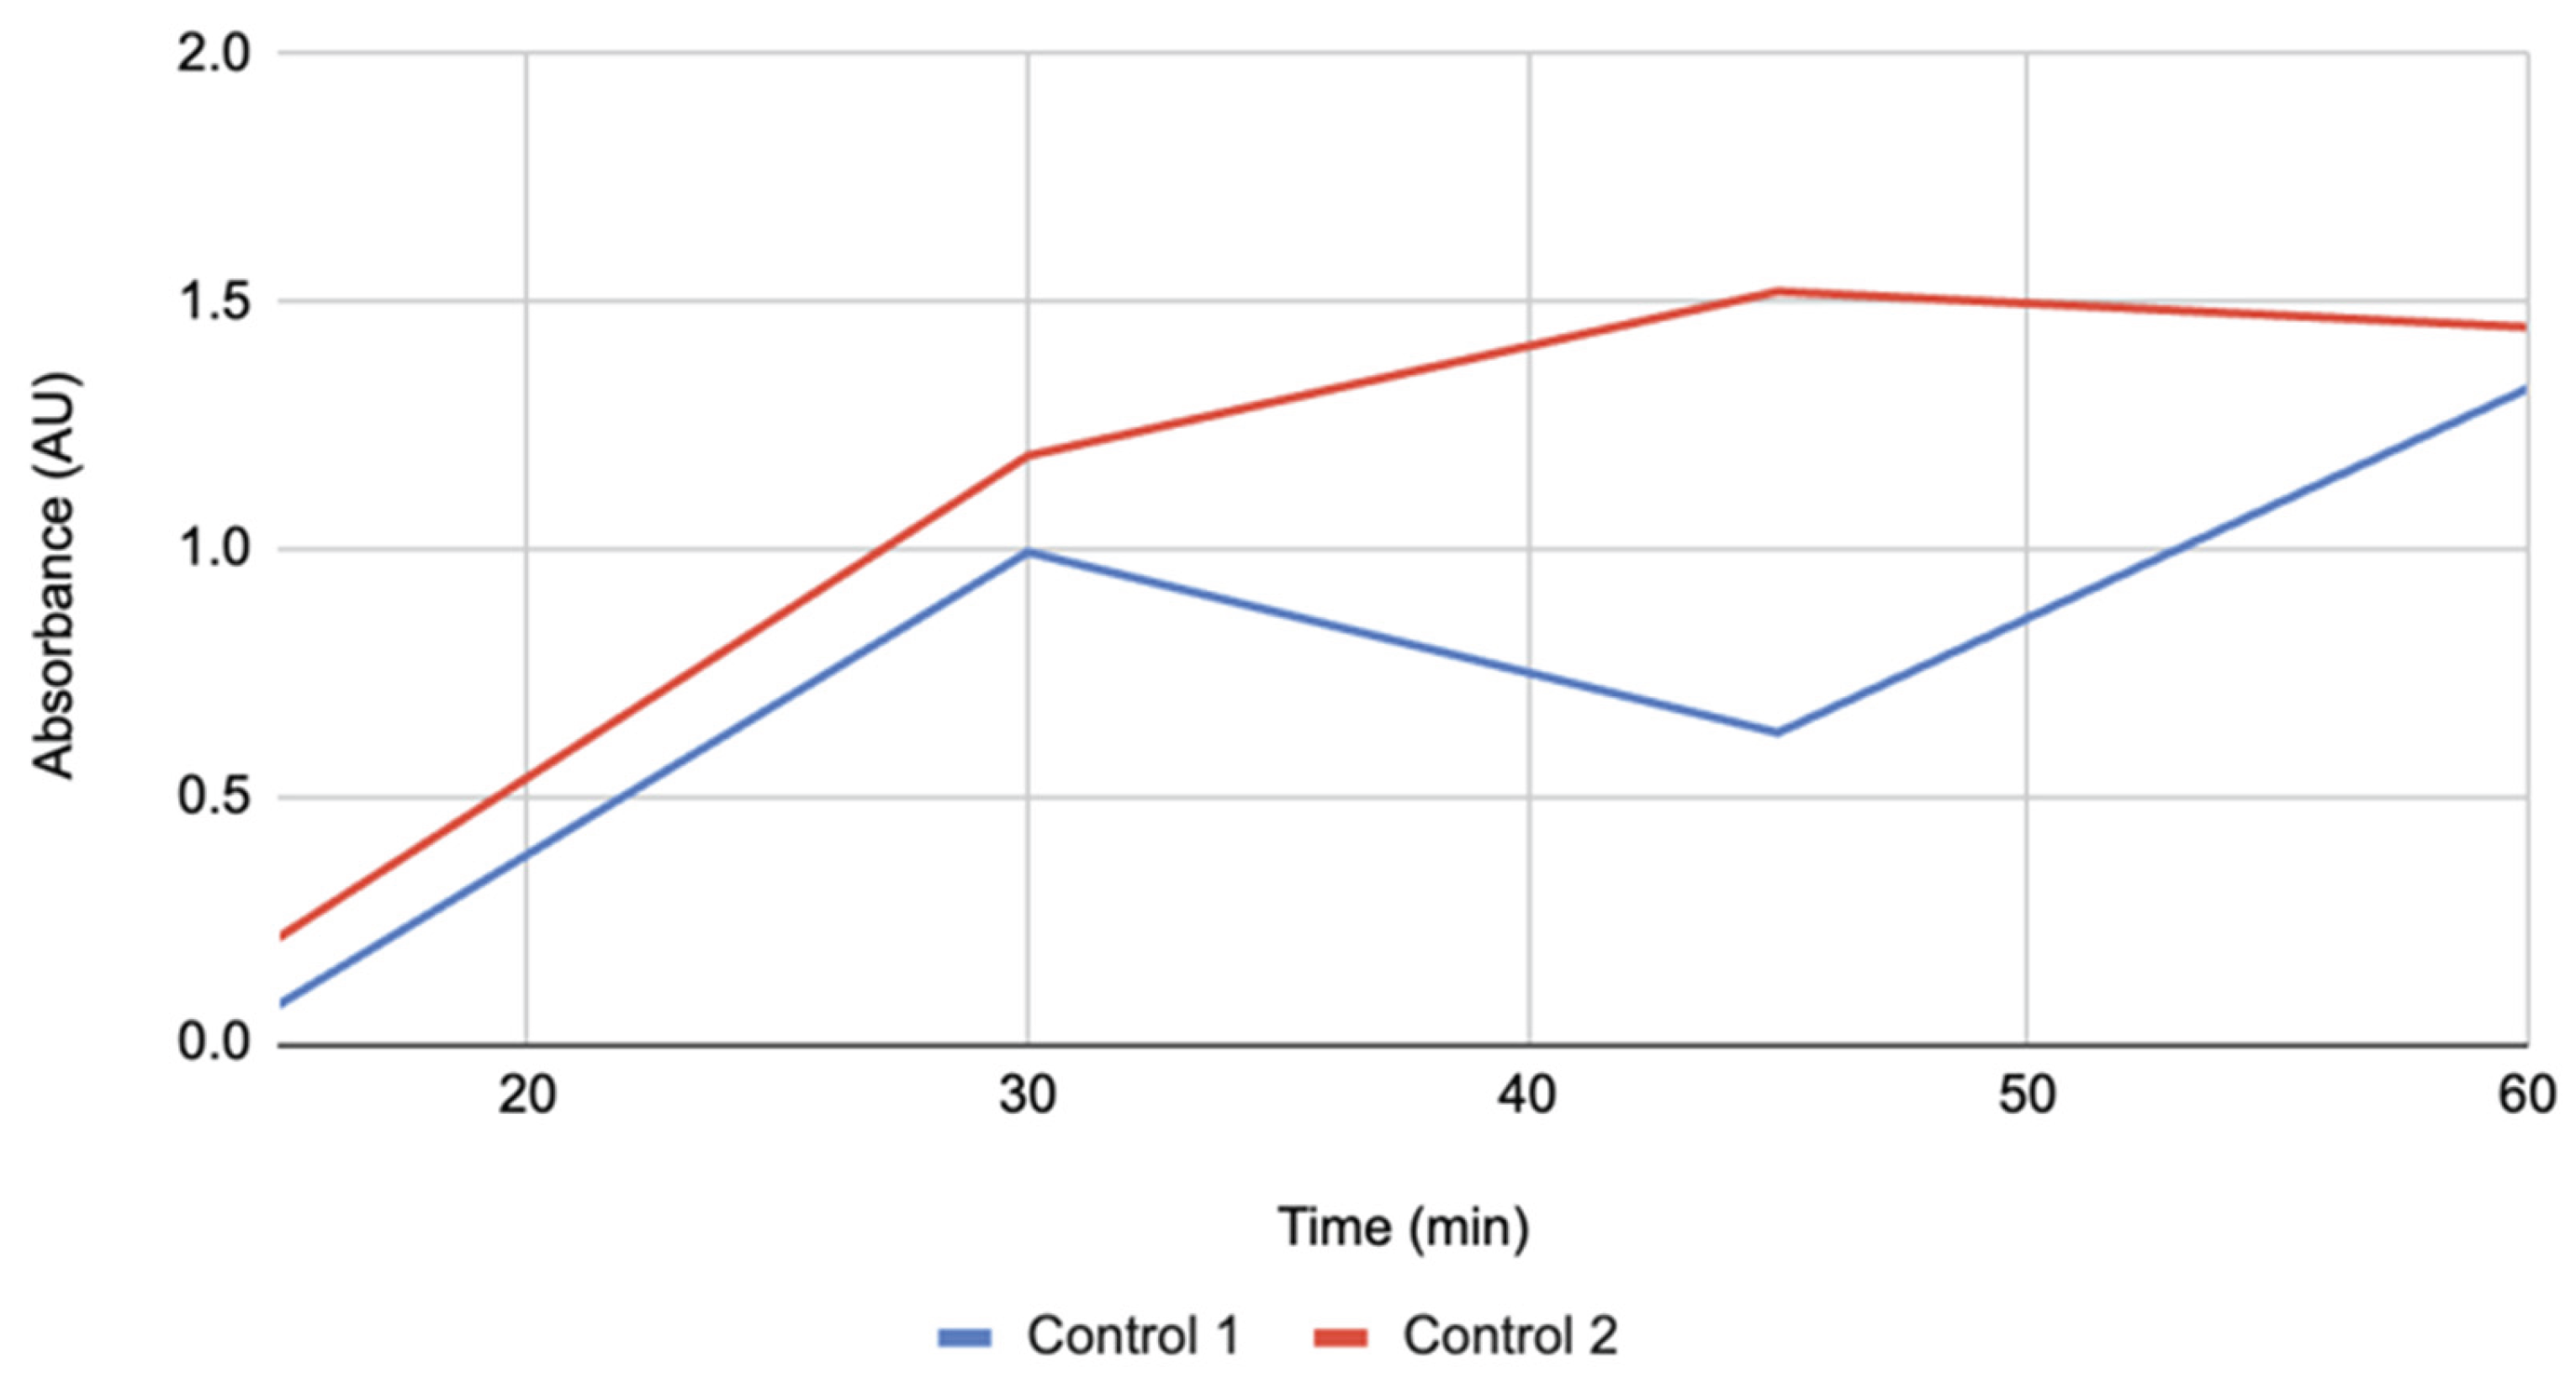

Table 1.
Initial solution pH by treatment prior to browning measurements (n = 2 per treatment). Values are from two independent preparations measured immediately before the first (15-min) absorbance reading.
Table 1.
Initial solution pH by treatment prior to browning measurements (n = 2 per treatment). Values are from two independent preparations measured immediately before the first (15-min) absorbance reading.
| Treatment | Group numbers | pH |
| Lemon Juice | 1 | 3.83 |
| Lemon Juice 2 | 2 | 3.24 |
| Bovine | 1 | 6.82 |
| Bovine | 2 | 6.85 |
| Aspergillus | 1 | 7.17 |
| Aspergillus | 2 | 7.46 |
| Control | 1 | 7 |
| Control | 2 | 7 |
Table 2.
Mean spectrophotometric absorbance (±SD, SE) of apple slices at 15, 30, 45, and 60 minutes under four treatments (lemon juice, bovine catalase, Aspergillus catalase, and water control), with net change from 15 to 60 minutes. Values represent two independent replicates per treatment (n = 2).
| Time (min) | Absorbance (AU) Lemon Juice (Mean ± SD, SE) |
Absorbance (AU) Bovine (Mean ± SD, SE) |
Absorbance (AU) Aspergillus (Mean ± SD, SE) |
Absorbance (AU) Control (Mean ± SD, SE) |
| 15 | 0.243 ± 0.025 (0.018) | 0.152 ± 0.087 (0.062) | 0.360 ± 0.120 (0.085) | 0.146 ± 0.096 (0.068) |
| 30 | 1.433 ± 0.203 (0.144) | 0.406 ± 0.310 (0.219) | 1.021 ± 0.400 (0.283) | 1.092 ± 0.138 (0.098) |
| 45 | 1.219 ± 0.450 (0.319) | 1.056 ± 0.096 (0.068) | 1.351 ± 0.182 (0.129) | 1.075 ± 0.631 (0.446) |
| 60 | 1.253 ± 0.245 (0.174) | 1.567 ± 0.198 (0.140) | 1.440 ± 0.212 (0.150) | 1.387 ± 0.088 (0.062) |
| Net Change | 1.163 ± 0.004 (0.003) | 1.415 ± 0.158 (0.112) | 1.080 ± 0.086 (0.061) | 1.241 ± 0.028 (0.020) |
Disclaimer/Publisher’s Note: The statements, opinions and data contained in all publications are solely those of the individual author(s) and contributor(s) and not of MDPI and/or the editor(s). MDPI and/or the editor(s) disclaim responsibility for any injury to people or property resulting from any ideas, methods, instructions or products referred to in the content. |
© 2025 by the authors. Licensee MDPI, Basel, Switzerland. This article is an open access article distributed under the terms and conditions of the Creative Commons Attribution (CC BY) license (http://creativecommons.org/licenses/by/4.0/).
Copyright: This open access article is published under a Creative Commons CC BY 4.0 license, which permit the free download, distribution, and reuse, provided that the author and preprint are cited in any reuse.


