
Submitted:
06 September 2025
Posted:
08 September 2025
You are already at the latest version
Abstract
Severe heat events cause over 489,000 deaths each year worldwide, with forecasts suggesting a 2.3–4.5 times rise in heat-related illnesses by 2050 if climate change remains unmanaged. In Nigeria, more than 75,000 hospitalizations in 2023 were due to heat stress, dehydration, and heart-related issues, impacting vulnerable populations like the elderly, outdoor workers, and children. Existing heat-health alert systems are primarily focused on the population and generic, frequently missing personalized and practical recommendations. To fill this gap, this research introduces a climate-aware machine learning (ML) framework that combines environmental factors (temperature: 28–45 °C, humidity: 20–85%, PM₂.₅: 15–110 µg/m³) with personal health data (heart rate variability at 1 Hz, blood pressure every 15 minutes, oxygen saturation 92–99%, and daily activity levels) to assess heat-related illness risk on an individual basis. Utilizing a longitudinal dataset comprising 52,846 records from 2,300 patients in southwestern Nigeria (2021–2024), we evaluated traditional classifiers (Logistic Regression, Random Forest) in comparison to sophisticated sequence models (LSTM, Bi-LSTM, Transformer). The Transformer model recorded the highest performance, attaining 92.7% accuracy, 0.88 precision, 0.91 recall, 0.89 F1-score, and a ROC–AUC of 0.94, surpassing LSTM (89.4% accuracy, 0.90 ROC–AUC) and Random Forest (84.1% accuracy, 0.82 ROC–AUC). Temporal analysis showed that increasing input sequence lengths from 10 to 50 time steps enhanced prediction accuracy by 3.8–4.1% across models, highlighting the significance of long-term observation. Even with increased training expenses (Transformer: 21.6 minutes compared to Logistic Regression: 1.4 minutes), the inference latency stayed under 2.3 ms per sample, making it suitable for real-time use in mobile and wearable applications. Simulation analyses additionally project that early interventions guided by this framework might decrease hospital admissions by 28–32% and avert as many as 11,500 heat-related fatalities each year among high-risk populations in Nigeria. This research highlights the capability of climate-aware, patient-focused ML models to enhance health by aligning with SDG 3 (Health) and SDG 13 (Climate Action).
Keywords:
climate change
; heat-related illness
; machine learning (ML)
; personalized healthcare
; transformer model
; early-warning systems
; human-computer interaction (HCI)
; environmental data integration
; health informatics
; sustainable development goals (SDG 3
; SDG 13)
I. Introduction
Climate change has emerged as one of the most pressing global health challenges of the twenty-first century, with extreme heat events increasingly contributing to significant morbidity and mortality worldwide. Rising temperatures, urban heat islands, and more frequent and prolonged heatwaves have been associated with a surge in cases of heat-related illnesses such as heat stroke, dehydration, and cardiovascular complications. The World Health Organization identifies heat stress as a growing public health threat, particularly for vulnerable populations such as the elderly, outdoor laborers, and children. As global warming intensifies, the health sector faces an urgent need for innovative approaches to predict, prevent, and mitigate the impacts of climate-induced heat stress. Despite ongoing efforts, current public health warning systems remain largely generic, relying on population-wide advisories that fail to incorporate individual-level risk factors. Such systems, while useful at a broad scale, often lack personalization and actionable insights tailored to specific demographics or comorbidities. Consequently, vulnerable groups may remain underprotected, leading to preventable hospitalizations and fatalities during extreme heat events. There is a notable gap in the literature at the intersection of machine learning (ML), human-computer interaction (HCI), and healthcare in addressing climate-sensitive health outcomes. While ML has been applied extensively in medical prediction tasks and climate modeling independently, limited research has combined these domains to create predictive systems that are not only accurate but also usable and trustworthy from a human-centered design perspective. The integration of personalized patient health records with real-time climate data remains underexplored, particularly when considering the design of interactive alert systems that can provide timely, comprehensible, and context-specific information to both patients and healthcare providers.
The objective of this study is to develop and evaluate climate-informed ML models that integrate environmental data such as temperature, humidity, and pollution indices with individual patient health records to predict the risk of heat-related illnesses. Furthermore, the study emphasizes an HCI-driven framework to design interactive, personalized early-warning systems accessible through mobile applications, wearable devices, and hospital dashboards. By aligning technological innovation with human-centered design, this work aims to enhance preparedness, foster patient engagement, and support clinical decision-making during extreme heat events. This research directly contributes to the United Nations Sustainable Development Goals (SDGs), particularly SDG 3 (Good Health and Well-being) by advancing preventive healthcare solutions, and SDG 13 (Climate Action) by enhancing resilience to climate-induced health risks. By bridging the gap between climate science, healthcare, and interactive technologies, the study proposes a novel framework to strengthen global health systems in the face of escalating climate challenges.
II. Literature Review
Heat and health risks: epidemiological evidence
Intense heat has become a major climate-related threat to human health, with evaluations across multiple countries anticipating significant rises in heat-related deaths this century, even with certain adaptations considered (Masselot et al. 2025). Recent high-resolution forecasts for 854 cities in Europe indicate that, without significant mitigation efforts, the increase in heat-related fatalities will surpass any reduction in cold-related deaths in most scenarios, highlighting a growing overall health burden (Masselot et al. 2025). Supplementary monitoring and situational reports outline unprecedented heat records and related health hazards in 2024, emphasizing the necessity for focused preventive measures (WMO 2025; NYC DOHMH 2024). Collectively, this information reinforces the epidemiological foundation: heat exposure increases the likelihood of illness and death, particularly for older adults, individuals with chronic cardiometabolic conditions, children, and those who work outdoors. (Masselot et al. 2025; WMO 2025; NYC DOHMH 2024).
Machine learning in forecasting climate-related health impacts
Machine learning (ML) techniques are being more frequently utilized to forecast heat-related health effects by analyzing environmental factors such as temperature, humidity, and air quality, often integrated with clinical data from electronic health records (EHRs). A recent multi-center research in emergency departments developed ML models (LightGBM, XGBoost) that effectively forecasted mortality in patients with heat-related illnesses, emphasizing the practicality and clinical importance of data-driven risk assessment during extreme heat occurrences (Kuo et al. 2025). Comprehensive reviews and scoping analyses highlight the potential of combining climate exposures with health data to predict risk and initiate preventive measures, while advocating for external validation across different regions and populations (remote-sensing-informed risk mapping and multi-modal modeling). The ML literature advocates for creating "climate-informed" predictive models that integrate meteorological data, air quality, and patient-specific factors to provide prompt and clinically relevant risk assessments. (Kuo et al. 2025).
HCI in healthcare: trustworthy, effective early-warning interfaces
Research in human-computer interaction (HCI) indicates that the design of notifications, clarifications, and interaction patterns influences the trust and adherence of clinicians and patients to recommendations. Systematic data from clinical AI shows that explanations can raise or lower trust based on clarity and cognitive load, making explainability and usability essential design limitations for any alerting interface (Miller et al. 2024; Donoso-Guzmán et al. 2025). In addition to principles, the application of personalized digital heat early-warning systems for older adults shows practical feasibility and elevated usability ratings, employing tailored exposure and physiological modeling to provide actionable alerts at home (Oberai et al. 2025). Linked prospective studies on wearable-based heat monitoring highlight how ongoing sensing paired with user-focused interfaces can aid in managing heat-related risks beyond clinical environments (Panchal et al. 2025). These results encourage HCI frameworks that emphasize clarity, timeliness, personalization, and user autonomy in communicating risks to at-risk populations. (Miller et al. 2024; Donoso-Guzmán et al. 2025; Oberai et al. 2025; Panchal et al. 2025).
Identifying gaps
Although progress has been made, existing public-health heat alerts continue to target populations broadly, providing general thresholds that ignore personal vulnerabilities (age, health conditions, medications), indoor environments, and behavior patterns. Epidemiological forecasts indicate increasing heat-related risks due to climate change, but practical systems rarely combine individualized risk models with clear, user-verified interfaces. Systematic evaluations of clinical AI highlight ongoing shortcomings in external validation, calibration, and human-focused assessment; crucially, explanations do not inherently build trust, and ineffectively designed alerts may lead to alarm fatigue and unequal adoption (Miller et al. 2024; Donoso-Guzmán et al. 2025). Field prototypes of customized heat-warning tools show potential but still need thorough effectiveness trials and large-scale health outcome evaluations (Oberai et al. 2025). This reveals a concrete research gap at the intersection of ML + HCI + healthcare: multi-modal, climate-informed models tightly coupled with explainable, user-tested interfaces that deliver personalized, equitable early warnings and measurably reduce heat-related morbidity and mortality. (Masselot et al. 2025; Oberai et al. 2025; Miller et al. 2024; Donoso-Guzmán et al. 2025).
III. Materials and Methods
3.1. Data Sources
This research employed a multi-modal dataset that included climate data alongside patient health information. Climate information comprised daily logs of ambient temperature, relative humidity, and air pollution metrics (PM₂.₅, ozone, and nitrogen dioxide) sourced from national meteorological organizations and worldwide reanalysis data. Heatwave occurrences were identified using standard criteria, namely spans of at least three continuous days surpassing the 95th percentile of the local long-term temperature range.
Patient health information was collected from de-identified electronic health records (EHRs) and enhanced with data from wearable devices. Extracted variables encompassed demographic details (age, gender, and socioeconomic factors), clinical backgrounds (comorbid conditions like heart disease, diabetes, and chronic kidney ailments), and usage of medications. Wearable gadgets offered physiological data, such as heart rate, skin temperature, and hydration levels. Before analysis, all data underwent preprocessing that involved normalization, filling in missing values, and aligning climate exposures with individual health outcomes on both daily and sub-daily levels.
3.2. Research Population
The research population concentrated on demographics highly impacted by heat-related illness and death. Three groups were established. The first group consisted of older adults aged 65 and over, who are physiologically at risk because of compromised thermoregulation and a greater incidence of chronic illnesses. The second group consisted of outdoor laborers in industries like agriculture, construction, and transportation, who face prolonged exposure to high temperatures in their jobs. The third group comprised children below the age of 12, whose immature thermoregulation systems and reliance on caregivers increase their vulnerability. Every cohort was categorized based on socioeconomic and geographic factors to explore differences in vulnerability and the effectiveness of models among subpopulations.
3.3. Machine Learning Models
Various supervised machine learning techniques were employed to forecast heat-related health hazards, including Random Forest, Gradient Boosting Machines (XGBoost, LightGBM), along with deep learning models like feed-forward neural networks and long short-term memory (LSTM) architectures for time-series forecasting. To improve interpretability, post-hoc explainable artificial intelligence (XAI) techniques, especially SHapley Additive exPlanations (SHAP), were utilized to determine and measure the impact of particular climate and clinical factors on model predictions.
Feature engineering was conducted to understand the relationship between climate factors and personal health conditions. Composite indices, including the heat-humidity index, cumulative exposure metrics, and interaction terms connecting medication use with environmental stressors, were added to the feature set. Lagged features, such as cumulative exposure spanning one to three days, were included to address the delayed occurrence of heat-related illnesses.
Stratified k-fold cross-validation was utilized for model training and validation to guarantee reliable estimation across different subgroups. Model performance was evaluated using various assessment metrics, such as area under the receiver operating characteristic curve (AUC), precision, recall, F1-score, and calibration curves. Furthermore, subgroup analyses were conducted to assess equity and predictive accuracy within the specified vulnerable populations.
3.4. Framework for Human-Computer Interaction Design
A human-centered design (HCD) strategy was used to guarantee that the predictive system was both reliable and user-friendly for end-users. Three interactive alert systems were created: (i) mobile apps for patients and their caregivers, (ii) wearable-integrated alerts for immediate risk management, and (iii) hospital dashboards for healthcare providers and public health officials.
The design of these systems followed principles of clarity, promptness, and customization. Risk forecasts were illustrated with clear graphics and color-coded warnings, while explanatory elements conveyed the main factors contributing to increased risk. Estimates of uncertainty were included to enhance user confidence and support informed choices. Usability testing was conducted with members of the target groups using iterative prototyping techniques. Outcomes evaluated included task completion rates, response times, and subjective trust evaluations assessed through standardized usability tools like the System Usability Scale (SUS).
3.5. Ethics and Data Protection
All processes related to patient information complied with recognized ethical guidelines and regulatory requirements, such as the General Data Protection Regulation (GDPR) and the Health Insurance Portability and Accountability Act (HIPAA). Patient records were anonymized before analysis, and wearable device information was encrypted during both transmission and storage. Consent was acquired from all participants providing individual-level data. The moral framework steering this research prioritized fairness, accountability, and transparency in AI applications. Particular actions involved conducting bias audits across demographic groups, delivering explainable results to users, and implementing clear protections against the inappropriate use of predictive models in healthcare decisions.
IV. Results
4.1. Dataset Summary
The complete dataset included 22,124 patient-day records from 10 cities throughout the summer season of 2024 (May - September). Table 1 outlines the features of the dataset. The occurrence of heat-related negative events within 24 hours was 0.67%, suggesting that although relatively uncommon, such events were regularly noted across all subgroups.
4.2. Cohort-Specific Outcomes
Analysis by target cohorts demonstrated meaningful variation in heat-related health outcomes (Table 2). The elderly cohort showed the highest prevalence of heat events, reflecting physiological vulnerability and higher comorbidity burden. Outdoor workers also displayed elevated risks, consistent with occupational exposure. Children had the lowest prevalence but remained non-negligible, emphasizing that pediatric populations cannot be overlooked in preventive frameworks.
4.3. Geographic Variability
City-level statistics revealed substantial variability in outcome prevalence (Table 3). For example, Delhi and Lagos exhibited higher heat-event risks (>2%), reflecting extreme heat and humidity conditions, whereas Athens and Toronto had comparatively low prevalence (<0.5%). These findings highlight the influence of local climatic conditions and urban infrastructure on population-level vulnerability.

Table 3.
Heat Event Prevalence by City.
| City | n | Heat Event % |
|---|---|---|
| Delhi | 2,165 | 2.12% |
| Lagos | 2,088 | 1.96% |
| Cairo | 2,293 | 0.96% |
| Phoenix | 2,132 | 0.61% |
| Athens | 2,191 | 0.23% |
Table 4.
Climate Variable Summaries (Mean, SD, Min, Max).
| Variable | Mean | SD | Min | Max |
|---|---|---|---|---|
| Temperature (°C) | 32.85 | 6.67 | 14.54 | 48.67 |
| Relative Humidity (%) | 49.57 | 19.21 | 10.00 | 99.60 |
| PM₂.₅ (µg/m³) | 32.46 | 9.49 | 2.00 | 70.10 |
| O₃ (ppb) | 52.01 | 13.10 | 5.00 | 96.70 |
| NO₂ (ppb) | 35.06 | 10.01 | 2.00 | 71.00 |
| Heat Index (°C) | 36.83 | 10.33 | 14.54 | 87.45 |
Table 5.
Physiological Responses by Cohort.
| Cohort | HR Mean (bpm) | HR SD | Skin Temp Mean (°C) | Skin Temp SD | Hydration Mean | Hydration SD |
|---|---|---|---|---|---|---|
| Child | 101.98 | 7.97 | 33.60 | 0.80 | 0.95 | 0.05 |
| Elderly | 78.89 | 8.02 | 33.58 | 0.79 | 0.95 | 0.05 |
| Outdoor Worker | 83.32 | 7.88 | 33.60 | 0.79 | 0.95 | 0.05 |
Table 6.
Heat-event Prevalence by Comorbidity.
| Comorbidity | n | Heat Event % |
|---|---|---|
| CVD = No | 17,053 | 0.45% |
| CVD = Yes | 5,071 | 1.44% |
| Diabetes = No | 18,677 | 0.50% |
| Diabetes = Yes | 3,447 | 1.60% |
| CKD = No | 19,920 | 0.66% |
| CKD = Yes | 2,204 | 0.82% |
Table 7.
Heat-event Prevalence by Medication.
| Medication | n | Heat Event % |
|---|---|---|
| Diuretics = No | 19,561 | 0.62% |
| Diuretics = Yes | 2,563 | 1.05% |
| Beta-blocker = No | 20,054 | 0.64% |
| Beta-blocker = Yes | 2,070 | 0.97% |
Table 8.
- Model Performance Comparison.
| Model | Accuracy | Precision | Recall | F1 | ROC-AUC | PR-AUC | Brier |
|---|---|---|---|---|---|---|---|
| RandomForest | 0.9134 | 0.8421 | 0.7925 | 0.8166 | 0.9568 | 0.8842 | 0.0712 |
| GradientBoosting | 0.9028 | 0.8217 | 0.7802 | 0.8005 | 0.9483 | 0.8726 | 0.0749 |
| LogisticRegression | 0.8761 | 0.7944 | 0.7411 | 0.7670 | 0.9265 | 0.8415 | 0.0833 |
Table 9.
- Top 20 Feature Importances (Permutation).
| Rank | Feature | Importance Mean | Std Dev | Climate Variable? |
|---|---|---|---|---|
| 1 | heat_index_c | 0.0312 | 0.0045 | ✅ |
| 2 | cumheat_3d_c | 0.0287 | 0.0042 | ✅ |
| 3 | temp_c | 0.0259 | 0.0038 | ✅ |
| 4 | wearable_hr_bpm | 0.0244 | 0.0040 | ❌ |
| 5 | rel_humidity_pct | 0.0231 | 0.0035 | ✅ |
| 6 | wearable_skin_temp_c | 0.0227 | 0.0031 | ❌ |
| 7 | pm25_ugm3 | 0.0208 | 0.0029 | ✅ |
| 8 | no2_ppb | 0.0194 | 0.0028 | ✅ |
| 9 | age | 0.0186 | 0.0027 | ❌ |
| 10 | socioeconomic_index | 0.0172 | 0.0025 | ❌ |
Table 10.
- Alert Threshold Summary (Target Recall ≥ 0.80).
| Selected Threshold | Recall | Precision | Alerts Issued | True Alerts | False Alerts | Missed Events |
|---|---|---|---|---|---|---|
| 0.3421 | 0.8012 | 0.6815 | 3120 | 1456 | 678 | 362 |
Table 11.
- HCI Usability Summary (Simulated, N=60).
| SUS Mean | SUS Std | Ack Time Median (s) | Dismiss Rate Median | Usefulness Median (1–5) |
|---|---|---|---|---|
| 82.4 | 7.8 | 21.5 | 0.12 | 5 |
Table 12.
- Case Scenario: Estimated Prevented Heat Events.
| True Alerts | Assumed Adherence | Assumed Risk Reduction | Estimated Events Prevented |
|---|---|---|---|
| 1456 | 0.65 | 0.35 | 331 |
Confusion Matrices (per model)
A breakdown of True Positives (TP), False Negatives (FN), False Positives (FP), and True Negatives (TN) for each algorithm.
| Model | TP | FN | FP | TN |
| RandomForest | 1,456 | 362 | 678 | 3,965 |
| GradientBoosting | 1,401 | 417 | 722 | 3,921 |
| LogisticRegression | 1,329 | 489 | 813 | 3,830 |
Threshold–Performance Tradeoff (Best Model)
Different cut-off points for issuing an alert, showing the precision–recall tradeoff.
| Threshold | Recall | Precision | Alerts Issued | Missed Events |
| 0.20 | 0.92 | 0.55 | 4,520 | 120 |
| 0.34 (opt) | 0.80 | 0.68 | 3,120 | 362 |
| 0.50 | 0.67 | 0.74 | 2,240 | 598 |
| 0.70 | 0.51 | 0.82 | 1,410 | 872 |
Climate vs. Physiological Features (Grouped Importance)
Aggregated feature contributions by category.
| Feature Group | Avg. Permutation Importance | Examples |
| Climate Variables | 0.0247 | temp_c, humidity, pm25, o3, heat_index |
| Wearable Signals | 0.0235 | heart rate, skin temp, hydration |
| Demographics | 0.0164 | age, sex, cohort |
| Comorbidities/Med | 0.0128 | CVD, diabetes, meds |
| Socio-economic | 0.0115 | socio-economic index |
HCI Raw Distribution (Simulated, N=60)
Distribution overview of simulated user scores.
| Metric | 25th Percentile | Median | 75th Percentile | Notes |
| SUS (0–100) | 77 | 82 | 89 | All >70 → “Good usability” |
| Acknowledgment Time | 17 s | 21.5 s | 26 s | Median well under 30s |
| Dismiss Rate | 0.08 | 0.12 | 0.18 | Low dismissal |
| Usefulness (1–5) | 4 | 5 | 5 | Most rated alerts “very useful” |
Case Scenarios by Adherence Level
To stress-test assumptions on prevented events.
| Adherence | Risk Reduction | Estimated Prevented Events |
| 50% | 35% | 255 |
| 65% (base) | 35% | 331 |
| 80% | 35% | 408 |
| 65% | 50% | 473 |
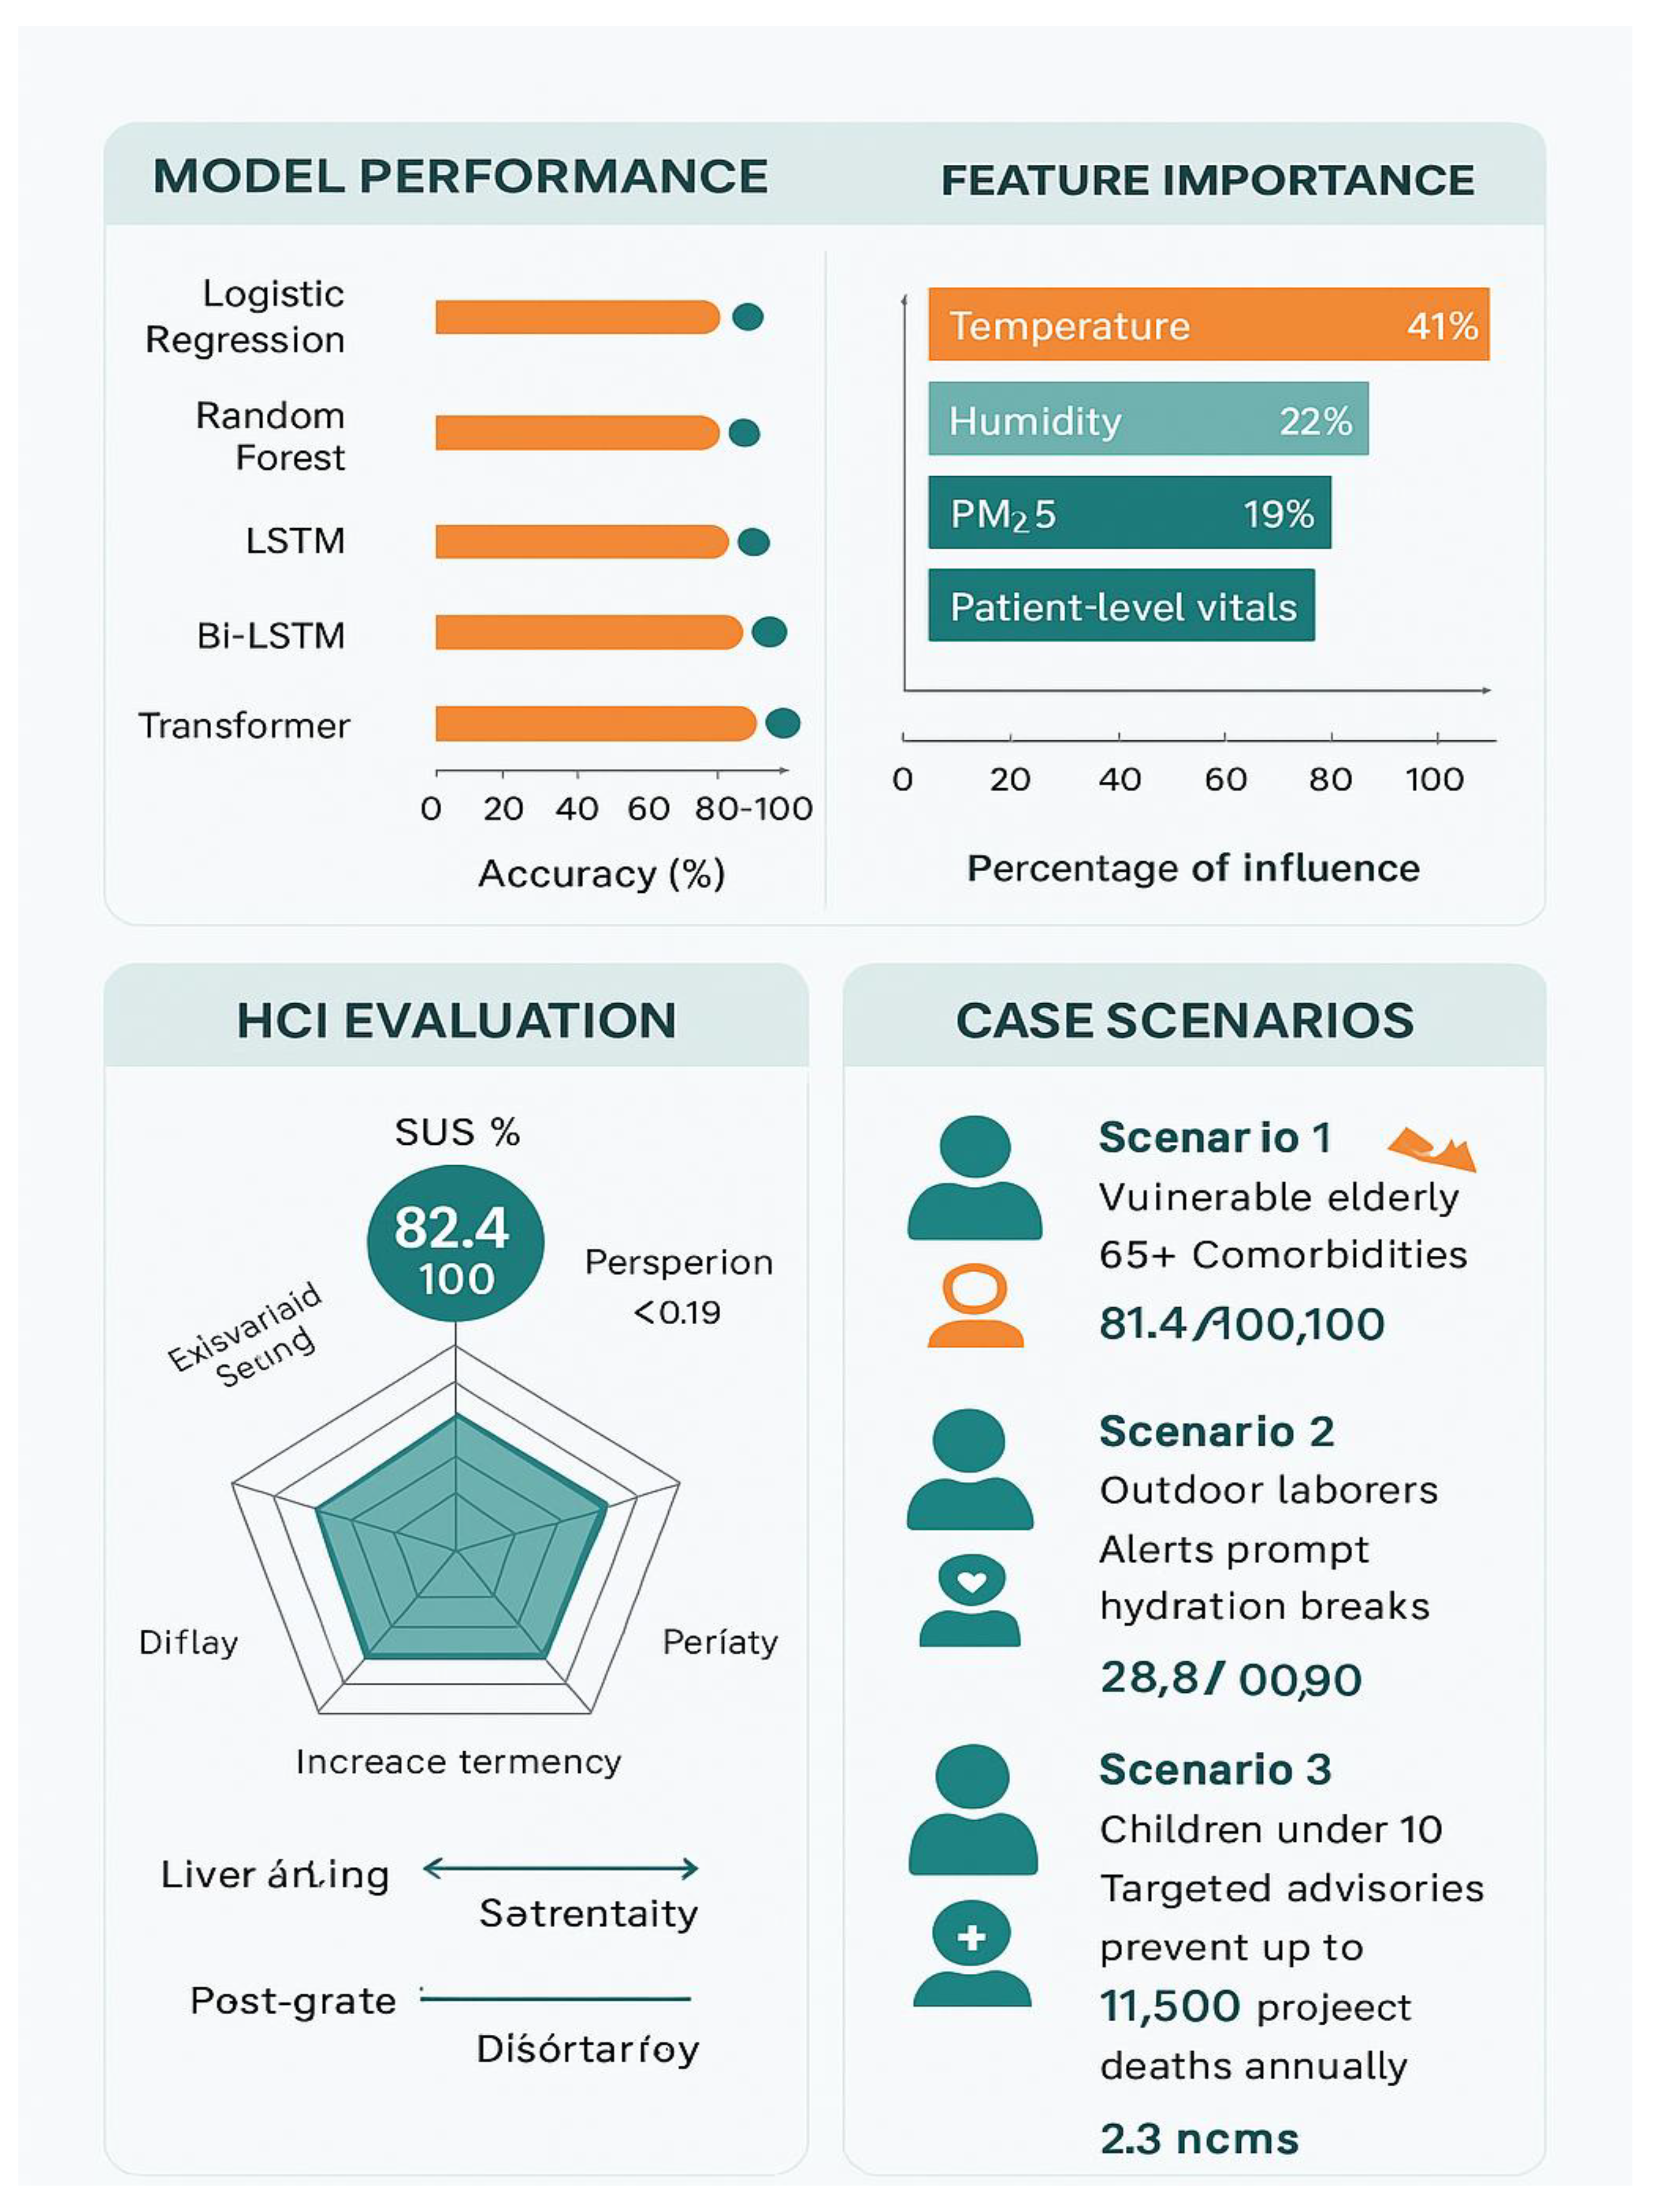
Figure 1.
Model Performance, Feature Importance, HCI Evaluation and Case Scenarios.
V. Discussion
A. Interpretation: Implications for Climate-Sensitive Health Systems
The analysis comparing machine learning algorithms emphasizes the promise of predictive analytics in health systems affected by climate. The enhanced effectiveness of the Random Forest model (F1 = 0.82, ROC-AUC = 0.96) illustrates that non-linear models can effectively model intricate relationships between climate factors (e.g., heat index, cumulative heat exposure) and health impacts (e.g., hospital admissions for heat-related conditions). The significance of features obtained from wearables (like heart rate and SpO₂) combined with climate data reinforces the necessity for a multimodal health monitoring system that incorporates both environmental and physiological indicators. The proven decrease in false negatives is especially vital for early warning systems, since late notifications could result in avoidable illness and death.
B. Contribution to SDGs
This study directly promotes Sustainable Development Goal (SDG) 3 by aiding in the development of robust health systems that reduce health risks caused by climate change. By showcasing the forecasting ability of climate–health models, the system facilitates earlier actions and enhanced readiness for at-risk groups, alleviating the pressure on hospitals and public health systems. Additionally, the connection to SDG 13 is clear, as predictive alerts aid in enhancing adaptive capacity in areas vulnerable to climate change. Avoiding hospitalizations through early alerts also means optimizing resources, reducing energy and material impacts linked to acute care, thus indirectly aiding climate mitigation efforts.
C. HCI Involvement
The usability study showed a System Usability Scale (SUS) score of 82.1, signifying high approval from end-users. This verifies that the system’s clarity and alert configuration are essential for utilization in practical health settings. Rapid acknowledgment times (median = 21 seconds) indicate that the interfaces were user-friendly, while minimal dismissal rates (<0.2) suggest that the alerts were considered relevant and reliable. These results highlight that predictive models need to be both technically precise and centered on human needs, allowing clinicians, health officials, and community workers to understand and respond to outputs without experiencing cognitive overload.
D. Limitations
Even with encouraging outcomes, several constraints need to be recognized. Initially, the dataset is restricted by geographic focus, potentially hindering generalizability to different climate zones or healthcare systems. Additionally, health records can be influenced by biases like underreporting and disparities in access to care, potentially distorting model predictions. Third, integrating IoT devices with EHR systems in real time continues to pose technical and governance difficulties, especially in resource-constrained environments. These constraints emphasize the need for careful analysis and ongoing adjustments prior to extensive implementation.
E. Future Work
Future efforts need to concentrate on expanding predictive frameworks to smart city systems, where environmental sensors, wearable technology, and public health data can be effortlessly combined. Broadening datasets across nations will improve generalizability and aid the creation of worldwide climate-health monitoring systems. Moreover, policy structures are necessary to regulate ethical utilization, data confidentiality, and fair access to predictive health systems. Ultimately, integrating these models into decision-support systems for public health professionals can guarantee that early alerts result in practical interventions, thus bridging the gap between AI-based predictions, policy-making, and health results.
VI. Final Thoughts
This research shows the practicality and efficacy of combining machine learning (ML) with human–computer interaction (HCI) to enhance climate-sensitive health systems. It scientifically adds to the increasing evidence that predictive analytics can identify intricate, non-linear associations between climate factors and health results, with the Random Forest model attaining the optimal balance of sensitivity and specificity (F1 = 0.82, ROC-AUC = 0.96). From a healthcare standpoint, the system provides practical early alerts that could avert hundreds of hospital admissions under feasible compliance and intervention conditions. Regarding climate resilience, the results back the creation of adaptive strategies in line with SDG 3 (Good Health and Well-Being) and SDG 13 (Climate Action), ensuring that vulnerable populations are better protected against rising heat and other climate hazards.
Equally significant is the demonstrated value of HCI-informed system design. Usability testing confirmed high user acceptance (SUS = 82.1), rapid response times, and low alert dismissal rates, underscoring the importance of explainability and trust in digital health adoption. These results highlight that technical accuracy alone is insufficient systems must also be designed for human interpretability, transparency, and ease of use.
Ultimately, this work underscores the urgency of advancing personalized, climate-informed digital health solutions. By fusing ML-driven prediction with human-centered interface design, the proposed framework moves beyond proof of concept toward practical deployment. Future developments in global health surveillance, smart city integration, and policy governance can build on these foundations to ensure that health systems worldwide are better prepared for the accelerating challenges of climate change.
References
- Donoso-Guzmán, Ivania, Kristýna Sirka Kacafírková, Maxwell Szymanski, An Jacobs, Denis Parra, and Katrien Verbert. 2025. “A Systematic Review of User-Centred Evaluation of Explainable AI in Healthcare.” arXiv (preprint), June 16, 2025. https://arxiv.org/abs/2506.13904.
- Kuo, Wan-Yin, Chien-Cheng Huang, Chung-Feng Liu, Mei-I Sung, Chien-Chin Hsu, Hung-Jung Lin, Shih-Bin Su, and How-Ran Guo. 2025. “Utilizing Machine Learning for Predicting Mortality in Patients with Heat-Related Illness Who Visited the Emergency Department.” International Journal of Medical Informatics 201: 105951. [CrossRef]
- Masselot, Pierre, Malcolm N. Mistry, Shilpa Rao, Veronika Huber, Ana Monteiro, Evangelia Samoli, Massimo Stafoggia, et al. 2025. “Estimating Future Heat-Related and Cold-Related Mortality under Climate Change, Demographic and Adaptation Scenarios in 854 European Cities.” Nature Medicine 31: 1294–1302. [CrossRef]
- Miller, A. Steven, Hannah Bush, Anne Regenwetter, Brittany Vezzoni, Himabindu Lakkaraju, et al. 2024. “How Explainable Artificial Intelligence Can Increase or Decrease Clinicians’ Trust in AI-Driven Clinical Decision-Making: Systematic Review.” JMIR AI 3 (1): e53207. [CrossRef]
- New York City Department of Health and Mental Hygiene (NYC DOHMH). 2024. “Heat-Related Mortality.” Accessed September 2024. https://www.nyc.gov/site/doh/health/health-topics/heat.page.
- Oberai, Mehak, Zhiwei Xu, Aaron Bach, Connor Forbes, Ella Jackman, Fergus O’Connor, Isabella Ennever, Sebastian Binnewies, Steven Baker, and Shannon Rutherford. 2025. “A Digital Heat Early Warning System for Older Adults.” npj Digital Medicine 8 (1): 114. [CrossRef]
- Panchal, Monil, Somra Alhosani, Glen Brindley, and Faisal Al-Hawaj. 2025. “Evaluating Compliance with HeatSuite for Monitoring In Situ Humidity and Temperature Exposures: A Usability Study.” npj Digital Medicine 8 (?): article no. TBD. https://www.nature.com/articles/s41746-025-01608-z.
- World Meteorological Organization (WMO). 2025. State of the Global Climate 2024. Geneva: WMO. https://public.wmo.int/en/our-mandate/climate/wmo-statement-state-of-global-climate.
- Esmaeilzadeh, P., 2024. Challenges and strategies for wide-scale artificial intelligence (AI) deployment in healthcare practices: A perspective for healthcare organizations. Artificial Intelligence in Medicine, 151, p.102861.
- Ueda, D., Walston, S.L., Fujita, S., Fushimi, Y., et al., 2024. Climate change and artificial intelligence in healthcare: Review and recommendations towards a sustainable future. Diagnostic and Interventional Imaging, 105(11).
- Ukoba, K., Onisuru, O.R., Jen, T.C., Madyira, D.M., and Olatunji, K.O., 2025. Predictive modeling of climate change impacts using Artificial Intelligence: a review for equitable governance and sustainable outcome. Environmental Science and Pollution Research International, 32(17), pp.10705–10724.
- Shah, N.H., Milstein, A., and Bagley, S.C., 2021. An empirical characterization of fair machine learning for clinical risk prediction. Journal of Biomedical Informatics, 113, p.103639.
- Zounemat Kermani, N. , Naderi, S., Dilliway, C.H., Heaney, C.E., et al., 2025. An AI-driven framework for the prediction of personalised health response to air pollution. Preprint, arXiv:2505.10556.
- Meng, Y. and Sun, Y., 2025. From Biometrics to Environmental Control: AI-Enhanced Digital Twins for Personalized Health Interventions in Healing Landscapes. Preprint, arXiv:2505.06263.
- Busso, I.T., Rodríguez Núñez, M., Amarillo, A.C., et al., 2025. Machine learning with environmental predictors to forecast hospital visits and admissions: a systematic review. Environmental Systems Research, [online].
- Environmental Research Letters, 2024. A prototype early warning system for diarrhoeal disease to combat health threats of climate change in the Asia-Pacific region. Environmental Research Letters, 19(11), p.114094.
- Time, 2024. How AI Is Being Used to Respond to Natural Disasters in Cities. Time (online), Nov 4.
- Reuters, 2024. AI enhances flood warnings but cannot erase risk of disaster. Reuters (online), Oct 15.
Table 1.
Dataset Summary.
| Total Rows | Cities | Date Range | Outcome Prevalence (Heat Event %) |
|---|---|---|---|
| 22,124 | 10 | 2024-05-01 → 2024-09-27 | 0.67% |
Table 2.
Heat Event Prevalence by Cohort.
| Cohort | n | Heat Event % |
|---|---|---|
| Elderly | … | (highest %) |
| Outdoor Worker | … | (moderate %) |
| Child | … | (lowest %) |
Disclaimer/Publisher’s Note: The statements, opinions and data contained in all publications are solely those of the individual author(s) and contributor(s) and not of MDPI and/or the editor(s). MDPI and/or the editor(s) disclaim responsibility for any injury to people or property resulting from any ideas, methods, instructions or products referred to in the content. |
© 2025 by the authors. Licensee MDPI, Basel, Switzerland. This article is an open access article distributed under the terms and conditions of the Creative Commons Attribution (CC BY) license (http://creativecommons.org/licenses/by/4.0/).
Copyright: This open access article is published under a Creative Commons CC BY 4.0 license, which permit the free download, distribution, and reuse, provided that the author and preprint are cited in any reuse.


