Submitted:
19 August 2025
Posted:
20 August 2025
You are already at the latest version
Abstract
Climate change has intensified the frequency and severity of heatwaves globally, posing significant public health risks, particularly in Mediterranean countries such as Greece, where rising temperatures coincide with vulnerable aging populations. This study develops a machine learning framework employing XGBoost models to predict monthly heatwave-attributable mortality from cardiovascular and respiratory diseases across Greek regions, stratified by age groups. Using high-resolution climate projections under RCP4.5 and RCP8.5 scenarios, the models integrate meteorological and demographic data to capture complex nonlinear relationships and regional heterogeneity. Model performance was rigorously validated with a temporally held-out dataset, demonstrating high predictive accuracy (R² > 0.96). Projections indicate a sharp increase in elderly mortality due to heat exposure by mid-century, with marked geographic disparities emphasizing urban centers like Attica. This work advances prior studies by incorporating detailed spatial and demographic stratification and applying robust machine learning techniques beyond traditional statistical approaches. The model offers a valuable tool for public health planning and climate adaptation in Greece and similar Mediterranean contexts. Our findings highlight the urgent need for targeted mitigation strategies to address the growing burden of heat-related mortality under changing climate conditions.
Keywords:
heatwaves
; machine learning
; XGBoost model
; mortality prediction
; cardiovascular diseases
; respiratory diseases
; Greece
; climate change adaptation
1. Introduction
Climate change is driving a marked intensification in the frequency, duration, and severity of extreme heat events worldwide [1,2,3]. Europe has emerged as a hotspot of climate-related health risks, with Southern Europe facing some of the most acute vulnerabilities due to combined exposure to extreme summer temperatures, aging populations, and densely populated urban environments [4,5]. Greece is at the frontline of this public health challenge, experiencing recurrent record-breaking heatwaves with profound impacts on mortality, particularly from cardiovascular and respiratory causes [6,7].
Heatwaves—extended intervals of abnormally high temperatures—pose significant physiological stress, overwhelming the body’s thermoregulatory mechanisms and increasing the likelihood of heatstroke, cardiovascular collapse, and respiratory failure [8,9,10]. These effects are not evenly distributed across the population. The elderly, people with chronic cardiovascular or respiratory conditions, those taking certain medications, and socially isolated individuals are consistently identified as the most susceptible groups [11]. Moreover, urban environments can exacerbate heat exposure through the urban heat island effect, especially during nighttime hours, while co-exposure to air pollutants such as ozone and fine particulates further aggravates cardiopulmonary stress [12,13].
Greece has already witnessed the severe impacts of recent heatwaves. Historical records highlight the severity of heat-related risks: the devastating 1987 heatwave caused thousands of excess deaths, primarily among older adults in urban areas [14]. More recent events in 2007 and 2021 further confirmed the strong link between extreme heat and increased daily mortality in Greece [15,16]. Research since then has consistently shown that both extremely high and low temperatures are closely tied to higher death rates, with evidence identifying temperature thresholds beyond which mortality rises sharply, particularly from cardiovascular causes [17,18].
Future climate projections warn that the situation is likely to intensify. By the latter half of this century, many Mediterranean cities are expected to experience unprecedented numbers of heatwave days, with prolonged episodes of maximum temperatures exceeding 40 °C [19,20]. For Greece, such conditions could impose a severe and sustained burden on healthcare systems, emergency services, and vulnerable populations. Yet, despite a strong body of epidemiological evidence linking heatwaves to mortality [21,22], significant gaps remain in the predictive tools available to policymakers. Much of the existing literature focuses on large metropolitan centers, often neglecting smaller urban, rural, and island communities that may experience distinct exposure patterns and vulnerabilities [23,24]. Furthermore, most studies have relied on statistical models—such as Poisson regression or generalized additive models—which, while effective for identifying short-term and largely linear associations, may not adequately capture the complex, nonlinear interplay between meteorology, air quality, demographic characteristics, and mortality [25,26]. These models also tend to be static, limiting their capacity to adapt to evolving climate patterns and socio-demographic changes.
Recent developments in machine learning (ML) offer a promising avenue to address these shortcomings. ML algorithms excel at handling high-dimensional, nonlinear datasets and can reveal intricate interactions between environmental, demographic, and social determinants of health that traditional models may overlook [27]. Internationally, several studies have demonstrated the potential of ML to predict heat-related mortality with high accuracy, particularly when using ensemble learning methods or integrating meteorological data with land surface temperature, air quality, and socio-economic indicators [28,29,30]. Despite this global progress, the application of ML to environmental health challenges in Greece remains limited. To the best of our knowledge, no national-scale ML framework currently exists to predict region-specific, demographically stratified heatwave mortality under current and future climate conditions.
The present study aims to fill this critical void by developing a novel machine learning framework to predict daily heatwave-related mortality across Greece, focusing on cardiovascular and respiratory causes and stratified by age and sex. By leveraging high-resolution meteorological, demographic, and air quality data across multiple regions, the model seeks to capture complex interactions influencing mortality risk and produce interpretable, region-specific forecasts. The application of explainable ML methods further enhances the transparency and usability of the model for public health authorities and policymakers.
Ultimately, this work aspires to provide a powerful, evidence-based tool to support climate-adaptive health planning in Greece. It also offers a methodological template for other Mediterranean and climate-vulnerable countries facing similar challenges, advancing the broader goal of safeguarding population health in an era of accelerating climate change.
2. Materials and Methods
2.1. Data Acquisition and Sources
This study utilizes a range of high-resolution datasets to construct a geographically and demographically stratified model of heatwave-induced mortality in Greece under future climate scenarios. The analysis integrates climate reanalysis data, regional climate projections, mortality records, population statistics, air quality indicators, and spatial geoinformation to support robust and region-specific forecasting.
Historical meteorological data were retrieved from the ERA5 reanalysis dataset provided by the European Centre for Medium-Range Weather Forecast’s (ECMWF). The dataset includes daily values of maximum temperature (Tmax) and relative humidity (RH) at a spatial resolution of 0.25° × 0.25°, covering the period from 2000 to 2024. For this study, the data were extracted only for the summer season (June to September) and spatially bounded to the Greek mainland and islands (longitude 19°E to 29°E, latitude 34°N to 42°N) from the ERA5-Land dataset, which is available to download from https://cds.climate.copernicus.eu/ (accessed on 10 May 2025). ERA5 is widely recognized for its high temporal consistency and physical coherence across variables, making it suitable for climate-health applications in data-sparse regions [31]. Future meteorological projections spanning 2026 to 2050 were obtained from the EURO-CORDEX initiative, which provides dynamically downscaled regional climate simulations at a high spatial resolution of 0.11° × 0.11° [32]. The variables used include daily Tmax and RH for Greece, under two Representative Concentration Pathways (RCPs): RCP4.5, representing an intermediate greenhouse gas emissions trajectory assuming stabilization without overshoot; and RCP8.5, reflecting a high-emissions scenario with minimal mitigation. These projections were derived from the global climate model CNRM-CERFACS-CM5 coupled with the regional climate model CNRM-ALADIN52 available on https://cds.climate.copernicus.eu/ (accessed on 10 May 2025). The combination ensures consistency between large-scale climatic patterns and regional thermal extremes relevant for health impact studies.
Mortality data were obtained from the Hellenic Statistical Authority (ELSTAT) and consist of monthly counts of deaths attributed to cardiovascular (CVD) (ICD-10 code: IOO-I99) and respiratory (RD) (ICD-10 code: JOO-J99) diseases, disaggregated by sex and detailed age groups (15<, 15-19, 20-24, 25-29, 30-34, 35-39, 40-44, 45-49, 50-54, 55-59, 60-64, 65-69, 70-74, 75-79, 80+). These records span the historical baseline period from 2012 to 2014 and serve as the primary outcome variable for model training and validation. The analysis was conducted at the NUTS 2 administrative level to balance spatial resolution with data availability and reliability. CVD and RD mortality are commonly used in environmental epidemiology studies, as these outcomes are highly sensitive to environmental stressors such as air pollution, extreme temperatures, and other climatic factors. Exposure to high temperatures can exacerbate pre-existing cardiovascular conditions by increasing blood viscosity, dehydration, and cardiac workload, potentially triggering events like stroke or heart failure. Similarly, heat can worsen respiratory health by promoting airway inflammation and impairing thermoregulation, particularly in vulnerable populations [33,34,35]. Their inclusion provides a focused lens for assessing population health impacts related to environmental variability.
Demographic data were drawn from two main sources. Historical population counts stratified by sex and age were sourced from national census datasets published by ELSTAT. Future demographic projections for the period 2026 to 2050 were extracted from the EUROPOP database maintained by Eurostat. These projections offer harmonized estimates of population structure across EU member states, enabling age- and sex-specific exposure-risk modeling at the regional level [36].
Air quality data were also incorporated to account for the potential confounding and interacting effects of air pollution on heat-related mortality. Daily gridded historical concentrations of PM2.5, PM10, and ozone (O3) were obtained from Copernicus Atmosphere Monitoring Service (CAMS) global reanalysis (EAC4), which provides data at approximately 0.75° × 0.75° resolution, available to download from https://atmosphere.copernicus.eu/ (accessed on 20 May 2025). Future air quality projections were retrieved from the CAMS Regional Ensemble product, which offers bias-corrected and downscaled air pollution data aligned with RCP scenarios. These datasets were spatially aligned with the meteorological data to ensure consistency in exposure assessment.
Last but not least, to delineate regional boundaries and restrict analyses to land areas only, a NUTS 2 shapefile for Greece was obtained from the Eurostat GISCO database, while a land-sea mask NetCDF file from ERA5 was employed to exclude marine grid cells. These spatial layers were essential for correctly mapping gridded data to administrative regions and for ensuring the geographic integrity of the analysis (Figure S1).
2.2. Heatwave Definition and Metrics
Despite substantial research efforts, there is no universally accepted definition of a heatwave in the scientific community. This is largely due to the inherently regional nature of extreme heat events, which are highly dependent on local climatological conditions [37,38]. In general, a heatwave is understood as a prolonged period of unusually high near-surface air temperatures relative to the historical norms of a given location [39]. Definitions vary significantly across disciplines, with some based on absolute thresholds [40,41]—such as fixed temperature values exceeding 35–40 °C—while others rely on relative approaches using percentiles of historical temperature distributions (e.g., the 90th or 95th percentile) [42,43]. The relative definition is particularly advantageous for regional assessments and climate impact studies, as it accounts for differences in baseline temperature conditions and allows for standardized comparisons across varying climatic zones [44]. Heatwave identification criteria also differ with respect to duration, ranging from two to six consecutive days in the literature, and may incorporate additional variables such as humidity or bioclimatic indices when assessing health-related impacts [45,46,47].
In this study, a relative threshold-based approach was adopted to define heatwaves in a climatologically consistent and regionally sensitive manner. For each NUTS 2 region of Greece, the 95th percentile of the daily maximum temperature Tmax was calculated using ERA5 data over the historical summer period (June to September) from 2000 to 2024. These thresholds were computed individually for each grid point within a region to ensure spatial granularity. A heatwave event was defined as a sequence of at least three consecutive days during which Tmax exceeded the 95th percentile threshold at a given grid cell. To gain deeper insight into the intensity and frequency characteristics of heatwaves, three widely used heatwave metrics were calculated:
- Heatwave Duration (HWD): The average duration (in days) of individual heatwave events per season;
- Heatwave Frequency (HWF): The total number of heatwave days (i.e., days part of a heatwave) within each summer season;
- Heatwave Number (HWN): The count of distinct heatwave events occurring in each season.
After establishing historical thresholds, these were applied directly to the future climate projections (2026–2050) under RCP4.5 and RCP8.5 scenarios. This methodological choice—using historical rather than future percentiles—was made deliberately to preserve comparability across time periods and to avoid masking the effects of climate change by recalibrating thresholds under warmer future baselines. This approach provides a more consistent measure of how the absolute burden of heat extremes evolves over time, which is crucial for evaluating public health risks and developing long-term adaptation strategies.
2.3. Heatwave-Attributable Mortality Estimation
Heatwave-attributable mortality for RD and CVD causes was estimated for each region, age group, sex, and year, using both historical records and climate–mortality projections. Following established epidemiological approaches [48,49], we calculated the summer (May–September) number of attributable deaths () as:
Here, is the population size in year y and region p, is the monthly cause-specific mortality rate (converted from per 100,000 population to per person), is the fraction of days in month m classified as heatwave days, and is the attributable fraction of mortality due to heatwave exposure. The attributable fraction was derived from the relative risk of mortality during heatwave days using:
where represents the estimated increase in mortality risk for year y and region p during heatwave periods compared to non-heatwave days. In this study, values were obtained from published epidemiological studies for Greece and the wider Mediterranean region to ensure context-specific estimates.
2.4. Feature Engineering and Machine Learning Modeling
To predict future heatwave-induced mortality across Greek regions, we implemented a supervised machine learning approach using the eXtreme Gradient Boosting (XGBoost) algorithm. XGBoost is a highly efficient, scalable tree-based method known for its strong predictive performance, especially in structured data problems. It is particularly well-suited for this type of modeling due to its ability to capture complex non-linear interactions, handle multicollinearity, and accommodate missing values [50].
Separate regression models were developed to estimate monthly mortality rates from cardiovascular and respiratory diseases. The modeling process relied on two main datasets: one constructed from historical observations (used for model training and validation) and another derived from projected inputs for the period 2026–2050 under RCP4.5 and RCP8.5 scenarios (used for mortality forecasting). Both datasets were stratified by region, year, month, age group, and sex to enable demographic sensitivity in the forecasts.
The training dataset incorporated both outcome variables and predictive features. Outcome variables included the monthly cardiovascular and respiratory mortality rates, which were expressed per 100,000 population to standardize comparisons across groups and regions. Corresponding mortality counts were also included. Predictor variables consisted of historical climate and air quality indicators, specifically the mean of the daily Tmax, the number of heatwave days and events (based on the threshold definition described earlier), RH, and mean concentrations of PM2.5, PM₁₀, and O₃. Demographic structure was accounted for using raw population counts and age-group encoding.
Future target datasets for both RCP scenarios were constructed using the same structure, though they naturally excluded the observed mortality values. Instead, the trained models generated predicted mortality rates, which were then multiplied by future population estimates (and scaled to per-100,000) to yield expected mortality counts for each demographic and regional group.
To enhance model performance, we conducted hyperparameter tuning using Bayesian optimization, aiming to minimize the Mean Absolute Error (MAE) while maximizing the coefficient of determination (R²) on a hold-out validation set. Model evaluation relied on three standard regression metrics. The MAE was used to quantify the average absolute difference between predicted and observed values, providing an intuitive measure of typical prediction error. The Root Mean Squared Error (RMSE) offered a complementary view by penalizing larger errors more heavily, thus being sensitive to outliers or extreme deviations. Lastly, R² assessed the proportion of variance in the observed data that was explained by the model, serving as an indicator of overall goodness-of-fit.
This framework enabled accurate, demographically resolved forecasting of heatwave-attributable mortality in Greece under varying climate scenarios. By grounding predictions in standardized rates and region-specific environmental and demographic inputs, the approach ensures consistency across space and time, allowing for reliable comparisons and supporting evidence-based adaptation strategies in the public health sector.
3. Results and Discussion
3.1. Historical Heatwave Characteristics (2000–2024)
To characterize the spatial variability of historical heat extremes across Greece, we examined three key indicators over the summer season (June–September) for the period 2000–2024: Heatwave Duration (HWD), Heatwave Day Frequency (HWF), and Heatwave Number (HWN).
Figure 1, Figure 2 and Figure 3 present the spatial distribution of these metrics across NUTS 2 regions. The HWD, shown in Figure 1, varied substantially across regions, with values ranging from approximately 3.7 to 5.3 days. The longest average durations were observed in Eastern Macedonia and Thrace, Western Greece, Peloponnese, and Western Macedonia, with heatwaves typically persisting for over 5 days. These inland and semi-continental regions may be more prone to prolonged thermal episodes due to limited maritime influence and stable synoptic conditions. By contrast, Crete, the Southern Aegean, and several island areas recorded the shortest mean durations, below 4.0 days, highlighting the dampening effect of coastal and island climatology.
Figure 2 presents the Heatwave Day Frequency (HWF)—the proportion of summer days classified as part of a heatwave. This metric further confirms the geographical gradient in heat exposure. Northern and western mainland regions, especially Eastern Macedonia and Thrace, Epirus, Western Greece, and Western Macedonia, experienced the most intense seasonal burden, with up to 2.5% of summer days falling under heatwave conditions. Conversely, southern and insular regions, including Crete, Southern Aegean, and the Cyclades, exhibited markedly lower frequencies, in some cases below 1.0%.
Completing the picture, Figure 3 illustrates the Heatwave Number (HWN), defined as the average number of distinct heatwave events per summer season. This indicator ranged from 0.36 to 0.96 events per season, once again emphasizing significant regional disparities. The highest HWN values—approaching one heatwave per summer—were concentrated in Epirus, Western Greece, Eastern Macedonia and Thrace, Central Macedonia, and parts of the Peloponnese. These regions not only experienced longer and more frequent heatwave conditions but also a greater number of discrete heatwave episodes, pointing to repeated cycles of thermal stress within a single summer.
These regional disparities in heatwave characteristics reveal important spatial patterns in thermal exposure. Northern and western mainland regions of Greece, such as Western Macedonia, Eastern Macedonia and Thrace, Epirus, and parts of Central Greece, consistently exhibit higher values for all three metrics. In contrast, southern islands and Crete show relatively milder heatwave statistics. These spatial patterns are consistent with previous findings of Galanaki et al. [45], which also reported increased heatwave frequency in mountainous and northern regions of Greece. This pattern may initially seem counterintuitive, as urban centers like Athens (Attica) and Thessaloniki (Central Macedonia) are traditionally perceived as heat-vulnerable due to population density and the urban heat island (UHI) effect. However, the elevated heatwave metrics in northern and mountainous regions can be attributed to the use of percentile-based thresholds, which account for local climatology. In such areas, even moderate temperature increases above historical norms can trigger heatwave classification, particularly when long-term warming trends are considered. This phenomenon has been observed in other regions with complex topography and varying baseline climates. For instance, in Central Europe, studies have documented increased heatwave frequency in highland areas when relative thresholds are used (e.g., [51,52]). In Switzerland, Scherrer et al. [53] found that alpine regions experienced more frequent warm extremes relative to local climate baselines. Similarly, parts of northern Spain have seen disproportionate increases in heatwave frequency under percentile-based definitions [54].
Such findings emphasize that relative thresholds, like the 95th percentile of maximum daily temperature, are crucial for detecting climatological extremes in regions not typically considered "hot" by absolute standards. This approach avoids underestimating risk in mountainous or temperate zones, where adaptation to heat is lower and public health infrastructure may not be heat-prepared.
3.2. Projected Heatwave Trends Under RCP Scenarios (2026–2050)
Climate projections for the period 2026–2050 indicate a pronounced intensification of heatwave characteristics across all regions of Greece, with the severity of changes depending on the emissions scenario considered. Under both RCP4.5 and RCP8.5, increases are projected in the frequency, number, and duration of heatwaves relative to the historical baseline (2000–2024).
Analysis of national-level heatwave indicators from 2014 to 2024 reveals a modest but noticeable upward trend in all three metrics—frequency (HWF), number of events (HWN), and duration (HWD)—suggesting a gradual intensification of heatwave characteristics in Greece during the last decade (Figure 4). Mean HWF values increased from approximately 0.8% in 2014 to 2.5% by 2024, while HWD rose from 3 days to nearly 4.8 days. Although interannual variability remains high—especially for HWN—this trend is consistent with a growing body of regional and Mediterranean-wide studies that highlight southeastern Europe as a climate change hotspot, particularly with respect to temperature extremes [55,56,57].
Under future projections, the divergence between RCP4.5 and RCP8.5 scenarios becomes increasingly pronounced. By 2050, HWF is projected to reach 15.3% under RCP4.5 and 30.5% under RCP8.5, indicating a doubling of the summer days affected by heatwaves in the high-emissions pathway. Similarly, HWN increases to 3 events/year in RCP4.5, while under RCP8.5 it nearly doubles to 5.8 events/year. Notably, the HWD also extends significantly, with projections reaching 8 days under RCP4.5 and 8.5 days under RCP8.5, compared to ~3–4 days historically (Figure 4). These changes reflect both an increase in heatwave occurrence and persistence, pointing toward compound climate risks—especially under high-emission pathways. The consistency across indicators underscores a compounding threat, with more frequent, longer-lasting, and more intense heatwaves becoming the norm by mid-century.
The spatial distribution of heatwave characteristics across Greek NUTS-2 regions reveals notable heterogeneity in exposure patterns and temporal evolution, strongly influenced by the emissions scenario. Across all three indicators regional disparities are evident, and these differences become more pronounced under the high-emissions RCP8.5 pathway. In the early time horizon of 2030, under RCP4.5, inland and mountainous regions such as Epirus, Thessaly, and Western Macedonia already exhibit relatively high values of HWF, ranging from 13 to 15 days (Figure 5). Attica and the southern mainland (e.g., Peloponnese and Central Greece) record moderate frequencies around 9 to 11 days, while most island regions and Crete remain below 6 days. Under RCP8.5, however, the same year shows a marked intensification in heatwave frequency across nearly all regions. Epirus, Thessaly, and Eastern Macedonia & Thrace surpass 19 days, while Peloponnese and Attica reach 19 and 13 days, respectively (Figure 6). The Ionian Islands and Crete—regions with moderate exposure under RCP4.5—register significant increases to 12 and 15 days respectively, underscoring the sensitivity of coastal and insular regions to high emissions (Figure 5). By 2040, the divergence between RCP4.5 and RCP8.5 scenarios becomes more distinct. Under RCP4.5, regions such as Thessaly and Epirus experience modest increases in HWF to approximately 15.4 and 15.6 days, respectively. Attica rises to 12 days, while the rest of the mainland averages between 10 and 14 days. Island regions show minimal change, with most remaining below 7 days (Figure 5). In contrast, RCP8.5 projects substantial amplification in heatwave exposure: Eastern Macedonia & Thrace, Thessaly, and Epirus exceed 21 days of heatwave-affected summer days, and even Crete and the Ionian Islands register frequencies of 17 and 13 days, respectively (Figure 6). This shift indicates not only an increase in frequency but also an expansion of spatial risk toward typically less-exposed coastal zones. By 2050, the spatial gradient under RCP4.5 remains relatively consistent, with Thessaly, Epirus, and Eastern Macedonia reaching 15 to 16 days, and southern regions like the Peloponnese and Attica experiencing between 12 and 13 days (Figure 5). However, under RCP8.5, heatwave frequency exhibits a step-change in both magnitude and spatial reach. Epirus, Thessaly, and Eastern Macedonia all exceed 24 days, while Attica, the Peloponnese, and Central Greece approach or surpass 22 days (Figure 6). Crete, which exhibited low exposure in 2030 under RCP4.5, rises to 18.5 days under RCP8.5, highlighting the acceleration of thermal extremes in southern insular Greece. The spatial uniformity of high HWF values under RCP8.5 underscores a convergence of risk across previously distinct climatic zones. These results are supported by broader European-scale analyses. Lhotka et al. [58], using an ensemble of EURO-CORDEX and ENSEMBLES RCM simulations, found that heatwave frequency in Central Europe is likely to double by 2049 compared to the late 20th century, with severe heatwaves becoming significantly more common. Furthermore, Molina et al. [59] projected increases in both frequency and duration of heatwaves across the Mediterranean using an ensemble of Euro-CORDEX simulations.
Turning to HWN, a similar pattern emerges. Under RCP4.5, the number of discrete heatwave events increases modestly over time, with most regions experiencing 2 to 3 events per year by 2050. The Ionian Islands and Attica start near 2 in 2030 and rise to approximately 2.4 and 4, respectively. Under RCP8.5, however, HWN increases far more dramatically. Western Macedonia, Thessaly, and Eastern Macedonia exceed 5–6 events per year by 2050, while even insular regions such as Crete and the Ionian Islands experience 4.5 to 5 annual events. This rise in event count indicates not only more frequent heat exposure but also an interruption of recovery periods between episodes, further compounding heat stress. Giannakopoulos et al. [60] also demonstrated that a global 2 °C warming scenario, expected around 2031–2060, would result in an additional month of summer days and heatwave conditions, with up to 4 weeks of tropical nights and extended drought durations inland and in coastal basins.
The spatial distribution of HWD reflects both the intensity and persistence of extreme events. Under RCP4.5, durations generally remain stable, with most regions experiencing events of 4 to 6 days in length by mid-century (Figure 5). Exceptions include Epirus and Thessaly, where durations reach 9 and 5.6 days, respectively. In contrast, RCP8.5 projections show a pronounced elongation of heatwaves across most regions. By 2050, Thessaly and Epirus approach or exceed 9 days per event, while Eastern Macedonia, Central Greece, and the Peloponnese also record extended durations of 8 to 9 days. Notably, island regions such as Crete and the Southern Aegean, which begin the period with shorter events (3.9 to 5 days), exhibit prolonged heatwaves of up to 5.5 days under RCP8.5 (Figure 6). This growth in duration, especially in the continental interior, points to increased thermodynamic stability and persistent blocking patterns conducive to extended heatwave episodes. Similar trends were observed in high-resolution WRF projections for Thessaloniki by Papadopoulos et al. [61], where heatwave days were projected to rise from 8 currently to over 60 annually by 2100, with some events persisting beyond 30 consecutive days. In support, Giorgi and Lionello [62] noted that the Mediterranean is particularly sensitive to changes in atmospheric circulation and land–sea contrasts, which amplify the persistence of extreme temperature events. Likewise, the EURO-CORDEX-based ensemble simulations presented by Georgoulias et al. [63] projected a significant increase in heat-related indices across Greece, including a dramatic rise in Hot Days and Tropical Nights, alongside a warming of 4.3 °C by 2100 under RCP8.5. Their ensemble further projects a 30% increase in consecutive dry days, which may exacerbate land–atmosphere feedbacks and extend the persistence of heatwave episodes.
Collectively, these findings highlight a spatial intensification of heatwave risk that is both scenario- and region-dependent. Under RCP4.5, inland and mountainous regions remain the most exposed, while coastal and island zones exhibit relatively moderate metrics. However, under RCP8.5, heatwave impacts become geographically widespread, blurring distinctions between mainland and insular regions and revealing an alarming trend toward homogenized thermal extremes across the Greek territory. The co-evolution of frequency, number, and duration underlines the compounded nature of future heatwave threats, necessitating region-specific adaptation strategies that account for both the scale and complexity of projected changes.
3.3. Model Results and Future Mortality Projections
3.3.1. Model Performance
The predictive performance of the XGBoost models was evaluated using a temporally held-out validation set covering the historical baseline period (2012–2014). The evaluation used three standard regression metrics: Mean Absolute Error (MAE), Root Mean Squared Error (RMSE), and the coefficient of determination (R²). Separate models were trained to estimate monthly mortality rates for cardiovascular disease (CVD) and respiratory disease (RD) across NUTS 2 regions of Greece, under both RCP4.5 and RCP8.5 climate scenarios.
The results indicate that the models perform exceptionally well across both disease categories. CVD models achieve near-perfect performance (R² > 0.99), likely due to the strong and well-documented link between heat exposure and acute cardiovascular stress. RD models also perform very well (R² > 0.96), capturing subtler but significant temperature–respiratory mortality relationships, particularly in relation to air quality and humidity covariates (Table 1). The MAE values below 1 mortality unit per 100,000 population indicate minimal average deviation between predicted and observed rates. The slightly higher RMSE values reflect the model’s sensitivity to larger deviations but remain within acceptable bounds for public health forecasting. These results demonstrate the robustness of the models, even under more extreme climate input conditions associated with RCP8.5.
Figure 7 illustrates the predicted vs. actual mortality rates under the RCP4.5 scenario for CVD mortality. The tight clustering of data points along the 1:1 reference line confirms the high degree of model fidelity. This suggests that the model accurately captures both lower and higher mortality cases, without systematic over- or underestimation across the range of mortality intensities. A similar pattern was observed for RD mortality (Figure S2), as well as for all mortality rates under the RCP8.5 scenario (see Supplementary Figures S3 and S4), reaffirming the model’s capacity to generalize well across distinct emissions pathways and climatic extremes.
To ensure generalizability and prevent overfitting, model training incorporated a temporal hold-out validation strategy, with hyperparameter optimization via Bayesian search. The approach prioritized minimizing MAE while maximizing R², and incorporated early stopping to further enhance out-of-sample performance. Collectively, these metrics and visual assessments validate the suitability of the model for forecasting future heatwave-attributable mortality under evolving climate and demographic conditions. The consistently high predictive accuracy supports its application in downstream analyses, including scenario-based mortality projections and adaptation planning.
3.3.2. Projected Heatwave-Attributable Mortality (2026–2050)
During the historical baseline period (2014–2022), elderly (+65) mortality attributable to heat exposure in Greece ranged from approximately 10 to 90 deaths per year, displaying marked variability likely driven by specific extreme heat events. At the same time, our adjusted non-elderly (<65) mortality remained extremely low, rarely exceeding one death per year on a national scale (Figure 8).
Under future climate scenarios, projections show a steep rise in elderly mortality. By the mid-century, annual heat-related deaths among the elderly are projected to reach ~540 under RCP4.5 and ~720 under RCP8.5. Despite warming trends, non-elderly mortality remains minimal after adjustment, staying below ~13 deaths per year, even under RCP8.5. These projections correspond to a relative increase of ~2.7% and ~4.1% in all-cause elderly mortality, respectively. Furthermore, this pattern affirms the disproportionate risk older populations face due to advancing climate stress and physiological susceptibility.
These results are broadly consistent with epidemiological evidence. Multi-country assessments (e.g., [64,65]) report that more than 80–90% of heat-related deaths occur in individuals ≥65 years old, owing to impaired thermoregulation, higher prevalence of cardiovascular and respiratory disease, and social vulnerability. These estimates also align closely with published national-scale projections by Kendrovski et al. [66] who report mid-century attributable fractions (AFs) for Greece of 2.72% (RCP4.5) and 4.10% (RCP8.5), equivalent to ~540 and ~840 elderly deaths/year when applied to national mortality totals. The concordance between our results and this independent modelling study provides strong validation for our approach. Broader European-scale modelling supports this pattern. The multi-country assessment by Relvas et al. [67] projects that by 2040–2050, heat-related mortality rates will triple compared to the 2015–2030 baseline across Europe. Southern Europe, including Greece, is projected to experience the steepest increases, particularly under high-emissions pathways (SSP3-7.0 and SSP5-8.5), with estimated annual excess mortality ranging from 9–46 deaths per 100,000 population. Even under strong mitigation (SSP1-2.6), moderate increases persist, underscoring the inevitability of some climate-driven health burden and the critical importance of adaptation measures.
Furthermore, local epidemiological and climate–health studies reinforce these projections, showing that urban environments amplify heat-related mortality. In Athens, analysis of cardiovascular and respiratory mortality in residents aged 65+ revealed that high and very high temperatures increased mortality risk by 20–35%, with the hottest days producing 23% excess mortality and heatwaves 20.6% above seasonal baselines. A one-day lag in temperature effects and a strong UHI effect suggest Athens will face greater increases than national averages [68]. In Thessaloniki, future modelling indicates that heat-related mortality will rise from 0.64% to 3.32% of all-cause deaths, with elderly individuals facing an even greater burden—5.14% of deaths attributable to high temperatures—while cold-related mortality will slightly decline [69]. High-resolution WRF simulations for the city further project a sharp increase in heatwave activity, from about eight days annually at present to more than 60 days per year by 2100, with some events lasting over a month. These prolonged episodes, driven largely by nighttime heat stress, are expected to significantly raise mortality risk, particularly in densely built coastal Mediterranean settings such as Thessaloniki [61].
The spatial distribution of attributable mortality across Greek regions reveals marked variations both geographically and temporally under different climate change scenarios (RCP4.5 and RCP8.5), stratified by age group (elderly vs. non-elderly) and cause of death (respiratory and cardiovascular diseases), as illustrated on Figure 9 and Figure 10.
Attica consistently shows the highest attributable mortality burden across all years and scenarios, reflecting its large population and urban density. Under the RCP4.5 scenario (Figure 9), total attributable mortality in the elderly population is projected to rise sharply from approximately 217 deaths in 2030 to over 485 deaths by 2050. This burden increases dramatically under the RCP8.5 scenario, with elderly attributable mortality reaching an alarming 822 deaths by 2050 (Figure 10). Non-elderly populations, although with lower absolute numbers, also show increasing trends, emphasizing a broad public health impact. Central Macedonia and Thessaly follow Attica with considerable attributable mortality increases, especially notable in the elderly group. Central Macedonia under RCP4.5 sees elderly attributable deaths rise from approximately 27 in 2030 to 103 in 2050, and under RCP8.5 this increase is even more pronounced, reaching over 212 deaths in 2050. Thessaly exhibits a similar pattern, with elderly deaths increasing from 58 in 2030 to 94 in 2050 under RCP4.5. Regions like East Macedonia and Thrace, Crete, and the Southern Aegean show moderate increases in attributable mortality over time, with elderly deaths expected to roughly double or triple by 2050 under both scenarios. For example, East Macedonia and Thrace elderly deaths under RCP4.5 rise from about 49 in 2030 to nearly 88 in 2050. Less populated or more rural regions such as Western Greece, West Macedonia, and the Ionian Islands show lower attributable mortality counts but still exhibit increasing trends over time, indicating that climate-related health impacts are widespread across different settings. The elderly population bears the overwhelming majority of attributable mortality burden in all regions and scenarios, consistent with higher vulnerability to respiratory and cardiovascular diseases aggravated by climate factors. In most regions, elderly attributable deaths exceed those in the non-elderly by at least an order of magnitude. Non-elderly attributable mortality remains relatively low but shows slight increases over time and is more pronounced under the high-emission RCP8.5 scenario, suggesting potential future risks even for younger populations.
Taken together, our model, national-scale projections, pan-European analyses, and detailed city-level studies all converge on the conclusion that Greece is among the most vulnerable European countries to future heat-related mortality. Without aggressive mitigation and targeted urban adaptation, mid-century mortality burdens will rise sharply, with late-century trajectories pointing toward potentially catastrophic health impacts. The spatial analysis underscores a clear trend of increasing climate-attributable mortality across Greece, with pronounced regional disparities. Urbanized and populous regions like Attica and Central Macedonia face the highest burdens, particularly among the elderly and for cardiovascular causes. The projections highlight the urgent need for tailored regional strategies to mitigate and adapt to the escalating health impacts of climate change.
4. Conclusions
This study provides a comprehensive and spatially explicit assessment of heatwave-related mortality risks across Greece under contrasting climate change scenarios (RCP4.5 and RCP8.5) through mid-century. By integrating high-resolution climate projections with robust machine learning models trained on historical mortality data, our work delivers nuanced projections of cardiovascular and respiratory heat-attributable mortality at the NUTS-2 regional scale, distinguishing impacts by age group and cause of death.
Our findings underscore a substantial and spatially heterogeneous increase in heatwave frequency, intensity, and duration, which translate into a sharp rise in heat-attributable mortality, particularly among the elderly population. The unprecedented predictive performance of the XGBoost models (R² > 0.96 across disease categories) and their ability to generalize under both moderate and extreme warming scenarios represent a key advancement in climate-health impact modeling. This methodological innovation enables fine-grained projections that reveal not only the magnitude but also the evolving geographic distribution of health risks, highlighting urban centers like Attica and Central Macedonia as hotspots for future mortality burdens.
Importantly, our results confirm that heat-related mortality risks in Greece will nearly double under a high-emission pathway (RCP8.5) compared to moderate mitigation (RCP4.5), with elderly deaths rising to critical levels by 2050. The study also highlights emerging vulnerabilities in typically less-exposed coastal and island regions, indicating a convergence of risk across the country. These insights advance the understanding of compound climate risks by linking projected heatwave dynamics directly to health outcomes in a spatially resolved manner.
Despite these strengths, future work should aim to improve projections by incorporating additional socio-demographic variables, such as population aging trends, urbanization patterns, and socio-economic factors, to better capture vulnerability heterogeneity. Further integration of air quality dynamics and healthcare access could refine respiratory mortality estimates. Moreover, expanding model frameworks to include other heat-sensitive health outcomes and exploring adaptive capacity and intervention effectiveness would provide valuable guidance for public health planning.
Given the projected escalation in heat-related mortality, our findings emphasize the urgent need for region-specific climate adaptation strategies focused on vulnerable populations, especially the elderly in urban settings. Enhanced early warning systems, urban heat mitigation measures, and healthcare preparedness should be prioritized alongside aggressive emissions reductions to limit the health burden of future heat extremes.
In conclusion, this study delivers a novel, data-driven foundation for climate-health risk assessment in Greece, supporting evidence-based policymaking to safeguard public health under a warming climate. Continued interdisciplinary efforts combining climate science, epidemiology, and machine learning will be essential to anticipate and mitigate the growing threat of heat-related mortality.
Supplementary Materials
The following supporting information can be downloaded at: Preprints.org, Figure S1: Spatial Distribution of Grid Points by NUTS2 Region in Greece; Figure S2: Predicted vs. actual mortality rates under the RCP4.5 scenario for RD mortality; Figure S3: Predicted vs. actual mortality rates under the RCP8.5 scenario for CVD mortality; Figure S4: Predicted vs. actual mortality rates under the RCP8.5 scenario for RD mortality.
Author Contributions
Conceptualization, I.P. and P.K.; Software, I.P., Methodology, I.P. and P.K.; Validation, I.P. and P.K.; Formal analysis, I.P. and P.K.; Investigation, I.P.; Resources, I.P.; Data curation, I.P and N.K..; Writing—original draft preparation, I.P and N.K..; Writing—review and editing, P.K.; Visualization, I.P. and N.K.; Supervision, P.K.; Funding acquisition, P.K. All authors have read and agreed to the published version of the manuscript.
Funding
This work has been funded by the project “Support for upgrading the operation of the National Network for Climate Change (CLIMPACT)” which is financed by the National Section of the PDE National Development Program 2021–2025 (General Secretariat of Research and Innovation, Ministry of Development).
Institutional Review Board Statement
Not applicable.
Informed Consent Statement
Not applicable.
Data Availability Statement
The authors do not have permission to share the data.
Acknowledgments
The authors gratefully acknowledge the Hellenic Statistical Authority (ELSTAT) for providing the cause-specific mortality data by age and sex that formed the basis of this analysis.
Conflicts of Interest
The authors declare no conflicts of interest.
Abbreviations
The following abbreviations are used in this manuscript:
| HWD | Heatwave Duration |
| HWF | Heatwave Frequency |
| HWN | Heatwave Number |
| CVD | Cardiovascular mortality |
| RD | Respiratory mortality |
| MAE | Mean Absolute Error |
| R² | Coefficient of determination |
| RMSE | Root Mean Squared Error |
| ML | Machine Learning |
| XGBoost | eXtreme Gradient Boosting |
| RCP | Representative Concentration Pathways |
References
- IPCC. Climate Change 2021: The Physical Science Basis. Contribution of Working Group I to the Sixth Assessment Report of the Intergovernmental Panel on Climate Change; Masson-Delmotte, V.; Zhai, P.; Pirani, A.; Connors, S.L.; Péan, C.; Berger, S.; et al., Eds.; Cambridge University Press: Cambridge, UK; New York, NY, USA, 2021. [CrossRef]
- Perkins-Kirkpatrick, S.E.; Lewis, S.C. Increasing Trends in Regional Heatwaves. Nat. Commun. 2020, 11, 3357. [CrossRef]
- King, A.D.; Harrington, L.J. The Inequality of Climate Change from 1.5 to 2 °C of Global Warming. Geophys. Res. Lett. 2018, 45, 5030–5033. [CrossRef]
- Zafeiratou, S.; Samoli, E.; Analitis, A.; Gasparrini, A.; Stafoggia, M.; de’ Donato, F.K.; Rao, S.; Zhang, S.; Breitner, S.; Masselot, P.; Aunan, K.; Schneider, A.; Katsouyanni, K.; on behalf of the EXHAUSTION project team. Assessing Heat Effects on Respiratory Mortality and Location Characteristics as Modifiers of Heat Effects at a Small Area Scale in Central-Northern Europe. Environ. Epidemiol. 2023, 7 (5), e269. [CrossRef]
- Liu, J.; Varghese, B.M.; Hansen, A.; Zhang, Y.; Driscoll, T.; Morgan, G.; Dear, K.; Gourley, M.; Capon, A.; Bi, P. Heat Exposure and Cardiovascular Health Outcomes: A Systematic Review and Meta-Analysis. Lancet Planet. Health 2022, 6 (6), e484-e495. [CrossRef]
- Kouis, P.; Psistaki, K.; Yiallouros, P.K.; Paschalidou, A.K. The Role of Heatwave Characteristics in Cardiovascular Mortality in the Eastern Mediterranean Region. Environ. Int. 2025, 201, 109563. [CrossRef]
- Giannakopoulos, C.; Kostopoulou, E.; Varotsos, K.V.; Tziotziou, K.; Plitharas, A. An Integrated Assessment of Climate Change Impacts for Greece in the Near Future. Reg. Environ. Change 2011, 11, 829–843. [CrossRef]
- Kovats, R.S.; Hajat, S. Heat Stress and Public Health: A Critical Review. Annu. Rev. Public Health 2008, 29, 41–55. [CrossRef]
- Faurie, C.; Varghese, B.M.; Liu, J.; Bi, P. Association between High Temperature and Heatwaves with Heat-Related Illnesses: A Systematic Review and Meta-Analysis. Sci. Total Environ. 2022, 852, 158332. [CrossRef]
- Kang, Y.; Park, J.; Jang, D.H. Compound Impact of Heatwaves on Vulnerable Groups Considering Age, Income, and Disability. Sci. Rep. 2024, 14, 24732. [CrossRef]
- Hutton, A.; Maud, K.; Giggins, H.; Peden, A.E.; Caldicott, D.; FitzGerald, G. Are We Adequately Promoting Climate Change Adaptation to Address the Increasing Heatwaves Affecting the Elderly? Int. J. Disaster Risk Sci. 2025, 16, 182–189. [CrossRef]
- Petrou, I.; Kyriazis, N.; Kassomenos, P. Evaluating the Spatial and Temporal Characteristics of Summer Urban Overheating through Weather Types in the Attica Region, Greece. Sustainability 2023, 15, 10633. [CrossRef]
- Votsi, N.; Papangelis, G.; Varotsos, K.V.; Giannakopoulos, C.; Tiniakou, A.; Efthymiou, D. A Multi-Faceted, Integrated Methodological Approach to Identify Hotspots of Combined Urban Environmental Pressures in the Climate Change Context. Euro-Mediterr. J. Environ. Integr. 2025. [CrossRef]
- Geronikolou, S.; Zimeras, S.; Tsitomeneas, S.; Chrousos, G.P. Heatwave 1987: The Piraeus versus Athens Case. F1000Research 2024, 12, 115. [CrossRef]
- Giannaros, C.; Agathangelidis, I.; Papavasileiou, G.; Galanaki, E.; Kotroni, V.; Lagouvardos, K.; Giannaros, T.M.; Cartalis, C.; Matzarakis, A. The Extreme Heat Wave of July–August 2021 in the Athens Urban Area (Greece): Atmospheric and Human-Biometeorological Analysis Exploiting Ultra-High Resolution Numerical Modeling and the Local Climate Zone Framework. Sci. Total Environ. 2023, 857, 159300. [CrossRef]
- Founda, D.; Giannakopoulos, C. The Exceptionally Hot Summer of 2007 in Athens, Greece—A Typical Summer in the Future Climate? Glob. Planet. Change 2009, 67 (3–4), 227–236. [CrossRef]
- Psistaki, K.; Kouis, P.; Michanikou, A.; Yiallouros, P.K.; Papatheodorou, S.I.; Paschalidou, A.K. Temporal Trends in Temperature-Related Mortality and Evidence for Maladaptation to Heat and Cold in the Eastern Mediterranean Region. Sci. Total Environ. 2024, 943, 173899. [CrossRef]
- Kouis, P.; Kakkoura, M.; Ziogas, K.; Paschalidou, A.K.; Papatheodorou, S.I. The Effect of Ambient Air Temperature on Cardiovascular and Respiratory Mortality in Thessaloniki, Greece. Sci. Total Environ. 2019, 647, 1351–1358. [CrossRef]
- Nastos, P.; Saaroni, H. Living in Mediterranean Cities in the Context of Climate Change: A Review. Int. J. Climatol. 2024, 44 (10), 3169–3190. [CrossRef]
- Wedler, M.; Pinto, J.G.; Hochman, A. More Frequent, Persistent, and Deadly Heat Waves in the 21st Century over the Eastern Mediterranean. Sci. Total Environ. 2023, 870, 161883. [CrossRef]
- Anderson, G.B.; Bell, M.L. Heat Waves in the United States: Mortality Risk during Heat Waves and Effect Modification by Heat Wave Characteristics in 43 US Communities. Environ. Health Perspect. 2011, 119 (2), 210–218. [CrossRef]
- Gasparrini, A.; Guo, Y.; Hashizume, M.; Lavigne, E.; Zanobetti, A.; Schwartz, J.; Armstrong, B. Mortality Risk Attributable to High and Low Ambient Temperature: A Multicountry Observational Study. Lancet 2015, 386 (9991), 369–375. [CrossRef]
- Vicedo-Cabrera, A.M.; Sera, F.; Guo, Y.; et al. The Burden of Heat-Related Mortality Attributable to Recent Human-Induced Climate Change. Nat. Clim. Change 2021, 11 (6), 492–500. [CrossRef]
- Kovats, R.S.; Hajat, S.; Wilkinson, P. Contrasting Patterns of Mortality and Hospital Admissions during Hot Weather and Heat Waves in Greater London, UK. Occup. Environ. Med. 2004, 61 (11), 893–898. [CrossRef]
- Pyrgou, A.; Santamouris, M. Probability Risk of Heat- and Cold-Related Mortality to Temperature, Gender, and Age Using GAM Regression Analysis. Climate 2020, 8, 40. [CrossRef]
- Sahani, J.; Kumar, P.; Debele, S.; Emmanuel, R. Heat Risk of Mortality in Two Different Regions of the United Kingdom. Sustain. Cities Soc. 2022, 80, 103758. [CrossRef]
- James, G.; Witten, D.; Hastie, T.; Tibshirani, R. An Introduction to Statistical Learning, 2nd ed.; Springer: New York, NY, USA, 2021.
- V, R.C.; Johnvictor, A.C.; N, P.S. Comparative Analysis of Machine Learning Approaches for Heatwave Event Prediction in India. Sci. Rep. 2025, 15, 22431. [CrossRef]
- Georgiades, P.; Economou, T.; Proestos, Y.; Araya, J.; Lelieveld, J.; Neira, M. Global Projections of Heat Stress at High Temporal Resolution Using Machine Learning. Earth Syst. Sci. Data 2025, 17, 1153–1171. [CrossRef]
- Boudreault, J.; Campagna, C.; Chebana, F. Machine and Deep Learning for Modelling Heat-Health Relationships. Sci. Total Environ. 2023, 892, 164660. [CrossRef]
- Hersbach, H.; Bell, B.; Berrisford, P.; et al. The ERA5 Global Reanalysis. Q. J. R. Meteorol. Soc. 2020, 146, 1999–2049. [CrossRef]
- Jacob, D.; Petersen, J.; Eggert, B.; Alias, A.; Christensen, O.B.; Bouwer, L.M.; Braun, A.; Colette, A.; Déqué, M.; Georgievski, G.; et al. EURO-CORDEX: New High-Resolution Climate Change Projections for European Impact Research. Reg. Environ. Change 2014, 14, 563–578. [CrossRef]
- Bouchama, A.; Knochel, J.P. Heat Stroke. N. Engl. J. Med. 2002, 346 (25), 1978–1988. [CrossRef]
- Basu, R. High Ambient Temperature and Mortality: A Review of Epidemiologic Studies from 2001 to 2008. Environ. Health 2009, 8 (1), 40. [CrossRef]
- Anderson, G.B.; Bell, M.L. Heat Waves in the United States: Mortality Risk during Heat Waves and Effect Modification by Heat Wave Characteristics in 43 US Communities. Environ. Health Perspect. 2011, 119 (2), 210–218. [CrossRef]
- Eurostat. EUROPOP2023 Population Projections. Statistical Office of the European Union, 2023. https://ec.europa.eu/eurostat.
- Smith, T.T.; Zaitchik, B.F.; Gohlke, J.M. Heat Waves in the United States: Definitions, Patterns and Trends. Clim. Change 2013, 118, 811–825. [CrossRef]
- Xu, Z.; FitzGerald, G.; Guo, Y.; Jalaludin, B.; Tong, S. Impact of Heatwave on Mortality under Different Heatwave Definitions: A Systematic Review and Meta-Analysis. Environ. Int. 2016, 89–90, 193–203. [CrossRef]
- Kovats, R.S.; Ebi, K.L. Heatwaves and Public Health in Europe. Eur. J. Public Health 2006, 16 (6), 592–599. [CrossRef]
- Founda, D.; Santamouris, M. Synergies between Urban Heat Island and Heat Waves in Athens (Greece), during an Extremely Hot Summer (2012). Sci. Rep. 2017, 7, 10973. [CrossRef]
- Barcena-Martin, E.; Molina, J.; Ruiz-Sinoga, J.D. Issues and Challenges in Defining a Heat Wave: A Mediterranean Case Study. Int. J. Climatol. 2019, 39, 331–342. [CrossRef]
- Luo, M.; Lau, N.C.; Liu, Z. Different Mechanisms for Daytime, Nighttime, and Compound Heatwaves in Southern China. Weather Clim. Extremes 2022, 36, 100449. [CrossRef]
- Su, Q.; Dong, B. Recent Decadal Changes in Heat Waves over China: Drivers and Mechanisms. J. Clim. 2019, 32, 4215–4234. [CrossRef]
- Wu, S.; Luo, M.; Zhao, R.; et al. Local Mechanisms for Global Daytime, Nighttime, and Compound Heatwaves. npj Clim. Atmos. Sci. 2023, 6, 36. [CrossRef]
- Galanaki, E.; Giannaros, C.; Kotroni, V.; Lagouvardos, K.; Papavasileiou, G. Spatio-Temporal Analysis of Heatwaves Characteristics in Greece from 1950 to 2020. Climate 2023, 11, 5. [CrossRef]
- Russo, S.; Dosio, A.; Graversen, R.G.; Sillmann, J.; Carrao, H.; Dunbar, M.B.; Singleton, A.; Montagna, P.; Barbola, P.; Vogt, J.V. Magnitude of Extreme Heat Waves in Present Climate and Their Projection in a Warming World. J. Geophys. Res. Atmos. 2014, 119, 12,500–12,512. [CrossRef]
- Rennie, J.J.; Palecki, M.A.; Heuser, S.P.; Diamond, H.J. Developing and Validating Heat Exposure Products Using the U.S. Climate Reference Network. J. Appl. Meteor. Climatol. 2021, 60, 543–558. [CrossRef]
- Perkins-Kirkpatrick, S.E.; et al. Projections of Heatwave-Attributable Mortality under Climate Change and Future Population Scenarios in China. Environ. Res.: Climate 2025, 4, 015004. [CrossRef]
- Chen, H.; et al. Projections of Heatwave-Attributable Mortality under Climate Change and Future Population Scenarios in China. Lancet Reg. Health – West. Pac. 2023, 28, 100582. [CrossRef]
- Chen, T.; Guestrin, C. XGBoost: A Scalable Tree Boosting System. In Proceedings of the 22nd ACM SIGKDD International Conference on Knowledge Discovery and Data Mining, KDD ’16; ACM: New York, NY, USA, 2016; pp. 785–794. [CrossRef]
- Cardell, M.F.; Amengual, A.; Romero, R.; Ramis, C. Future extremes of temperature and precipitation in Europe derived from a combination of dynamical and statistical approaches. Int. J. Climatol. 2020, 40, 4800–4827. [CrossRef]
- Kuglitsch, F.G.; Toreti, A.; Xoplaki, E.; Della-Marta, P.M.; Zerefos, C.S.; Türkeş, M.; Luterbacher, J. Heat wave changes in the eastern Mediterranean since 1960. Geophys. Res. Lett. 2010, 37, L04802. [CrossRef]
- Scherrer, S. C., Fischer, E. M., Posselt, R., Liniger, M. A., Croci-Maspoli, M., & Knutti, R. (2016). Emerging trends in heavy precipitation and hot temperature extremes in Switzerland. Journal of Geophysical Research: Atmospheres, 121, 2626–2637. [CrossRef]
- Paredes-Fortuny, L., & Khodayar, S. (2023). Understanding the magnification of heatwaves over Spain: Relevant changes in the most extreme events. Weather and Climate Extremes, 42, 100631. [CrossRef]
- Zittis, G., Almazroui, M., Alpert, P., Ciais, P., Cramer, W., Dahdal, Y., et al. (2022). Climate change and weather extremes in the Eastern Mediterranean and Middle East. Reviews of Geophysics, 60, e2021RG000762. [CrossRef]
- Giorgi, F., & Lionello, P. (2008). Climate change projections for the Mediterranean region. Global and Planetary Change, 63, 90–104. [CrossRef]
- Lorenzo, N., Díaz-Poso, A., & Royé, D. (2021). Heatwave intensity on the Iberian Peninsula: Future climate projections. Atmospheric Research, 258, 105655. [CrossRef]
- Lhotka, O., Kyselý, J., & Plavcová, E. (2018). Evaluation of major heat waves’ mechanisms in EURO-CORDEX RCMs over Central Europe. Climate Dynamics, 50, 4249–4262. [CrossRef]
- Molina, M. O., Sánchez, E., & Gutiérrez, C. (2020). Future heat waves over the Mediterranean from an Euro-CORDEX regional climate model ensemble. Scientific Reports, 10, 8801. [CrossRef]
- Giannakopoulos, C., Le Sager, P., Bindi, M., Moriondo, M., Kostopoulou, E., & Goodess, C. M. (2009). Climatic changes and associated impacts in the Mediterranean resulting from a 2 °C global warming. Global and Planetary Change, 68(3), 209–224. [CrossRef]
- Papadopoulos, G.; Keppas, S.C.; Parliari, D.; Kontos, S.; Papadogiannaki, S.; Melas, D. Future Projections of Heat Waves and Associated Mortality Risk in a Coastal Mediterranean City. Sustainability 2024, 16, 1072. [CrossRef]
- Giorgi, F., & Lionello, P. (2008). Climate change projections for the Mediterranean region. Global and Planetary Change, 63(2–3), 90–104. [CrossRef]
- Georgoulias, A. K., Akritidis, D., Kalisoras, A., Kapsomenakis, J., Melas, D., Zerefos, C. S., & Zanis, P. (2022). Climate change projections for Greece in the 21st century from high-resolution EURO-CORDEX RCM simulations. Atmospheric Research, 271, 106049. [CrossRef]
- Gasparrini, A., Guo, Y., Sera, F., Vicedo-Cabrera, A. M., Huber, V., Tong, S., de Sousa Zanotti Stagliorio Coelho, M., Nascimento Saldiva, P. H., Lavigne, E., Matus Correa, P., Valdes Ortega, N., Kan, H., Osorio, S., Kyselý, J., Urban, A., Jaakkola, J. J. K., Ryti, N. R. I., Pascal, M., Goodman, P. G., ... Armstrong, B. (2017). Projections of temperature-related excess mortality under climate change scenarios. The Lancet Planetary Health, 1(9), e360–e367. [CrossRef]
- Honda, Y., Kondo, M., McGregor, G., Kim, H., Guo, Y. L., Hijioka, Y., Yoshikane, T., Oka, K., Takano, S., Hales, S., & Tong, S. (2014). Heat-related mortality risk model for climate change impact projection. Environmental Health and Preventive Medicine, 19(1), 56–63. [CrossRef]
- Kendrovski, V.; Baccini, M.; Martinez, G.S.; Wolf, T.; Paunovic, E.; Menne, B. Quantifying Projected Heat Mortality Impacts under 21st-Century Warming Conditions for Selected European Countries. Int. J. Environ. Res. Public Health 2017, 14, 729. [CrossRef]
- Relvas, H., Monjo, R., Coelho, S., Rodríguez, R., Trigo, R. M., & Russo, S. (2025). Rising temperatures, rising risks: Heat-related mortality in Europe under climate change. Earth Systems and Environment. Advance online publication. [CrossRef]
- Paravantis, J., Santamouris, M., Cartalis, C., Efthymiou, C., & Kontoulis, N. (2017). Mortality associated with high ambient temperatures, heatwaves, and the urban heat island in Athens, Greece. Sustainability, 9(4), 606. [CrossRef]
- Parliari, D.; Keppas, S.; Papadogiannaki, S.; Papadopoulos, G.; Kontos, S.; Melas, D. Projections of Heat-Related Mortality under the Impact of Climate Change in Thessaloniki, Greece. Environ. Sci. Proc. 2023, 26, 72. [CrossRef]
Figure 1.
Spatial distribution of mean HWD (days) in Greece during the summer season (2000–2024).
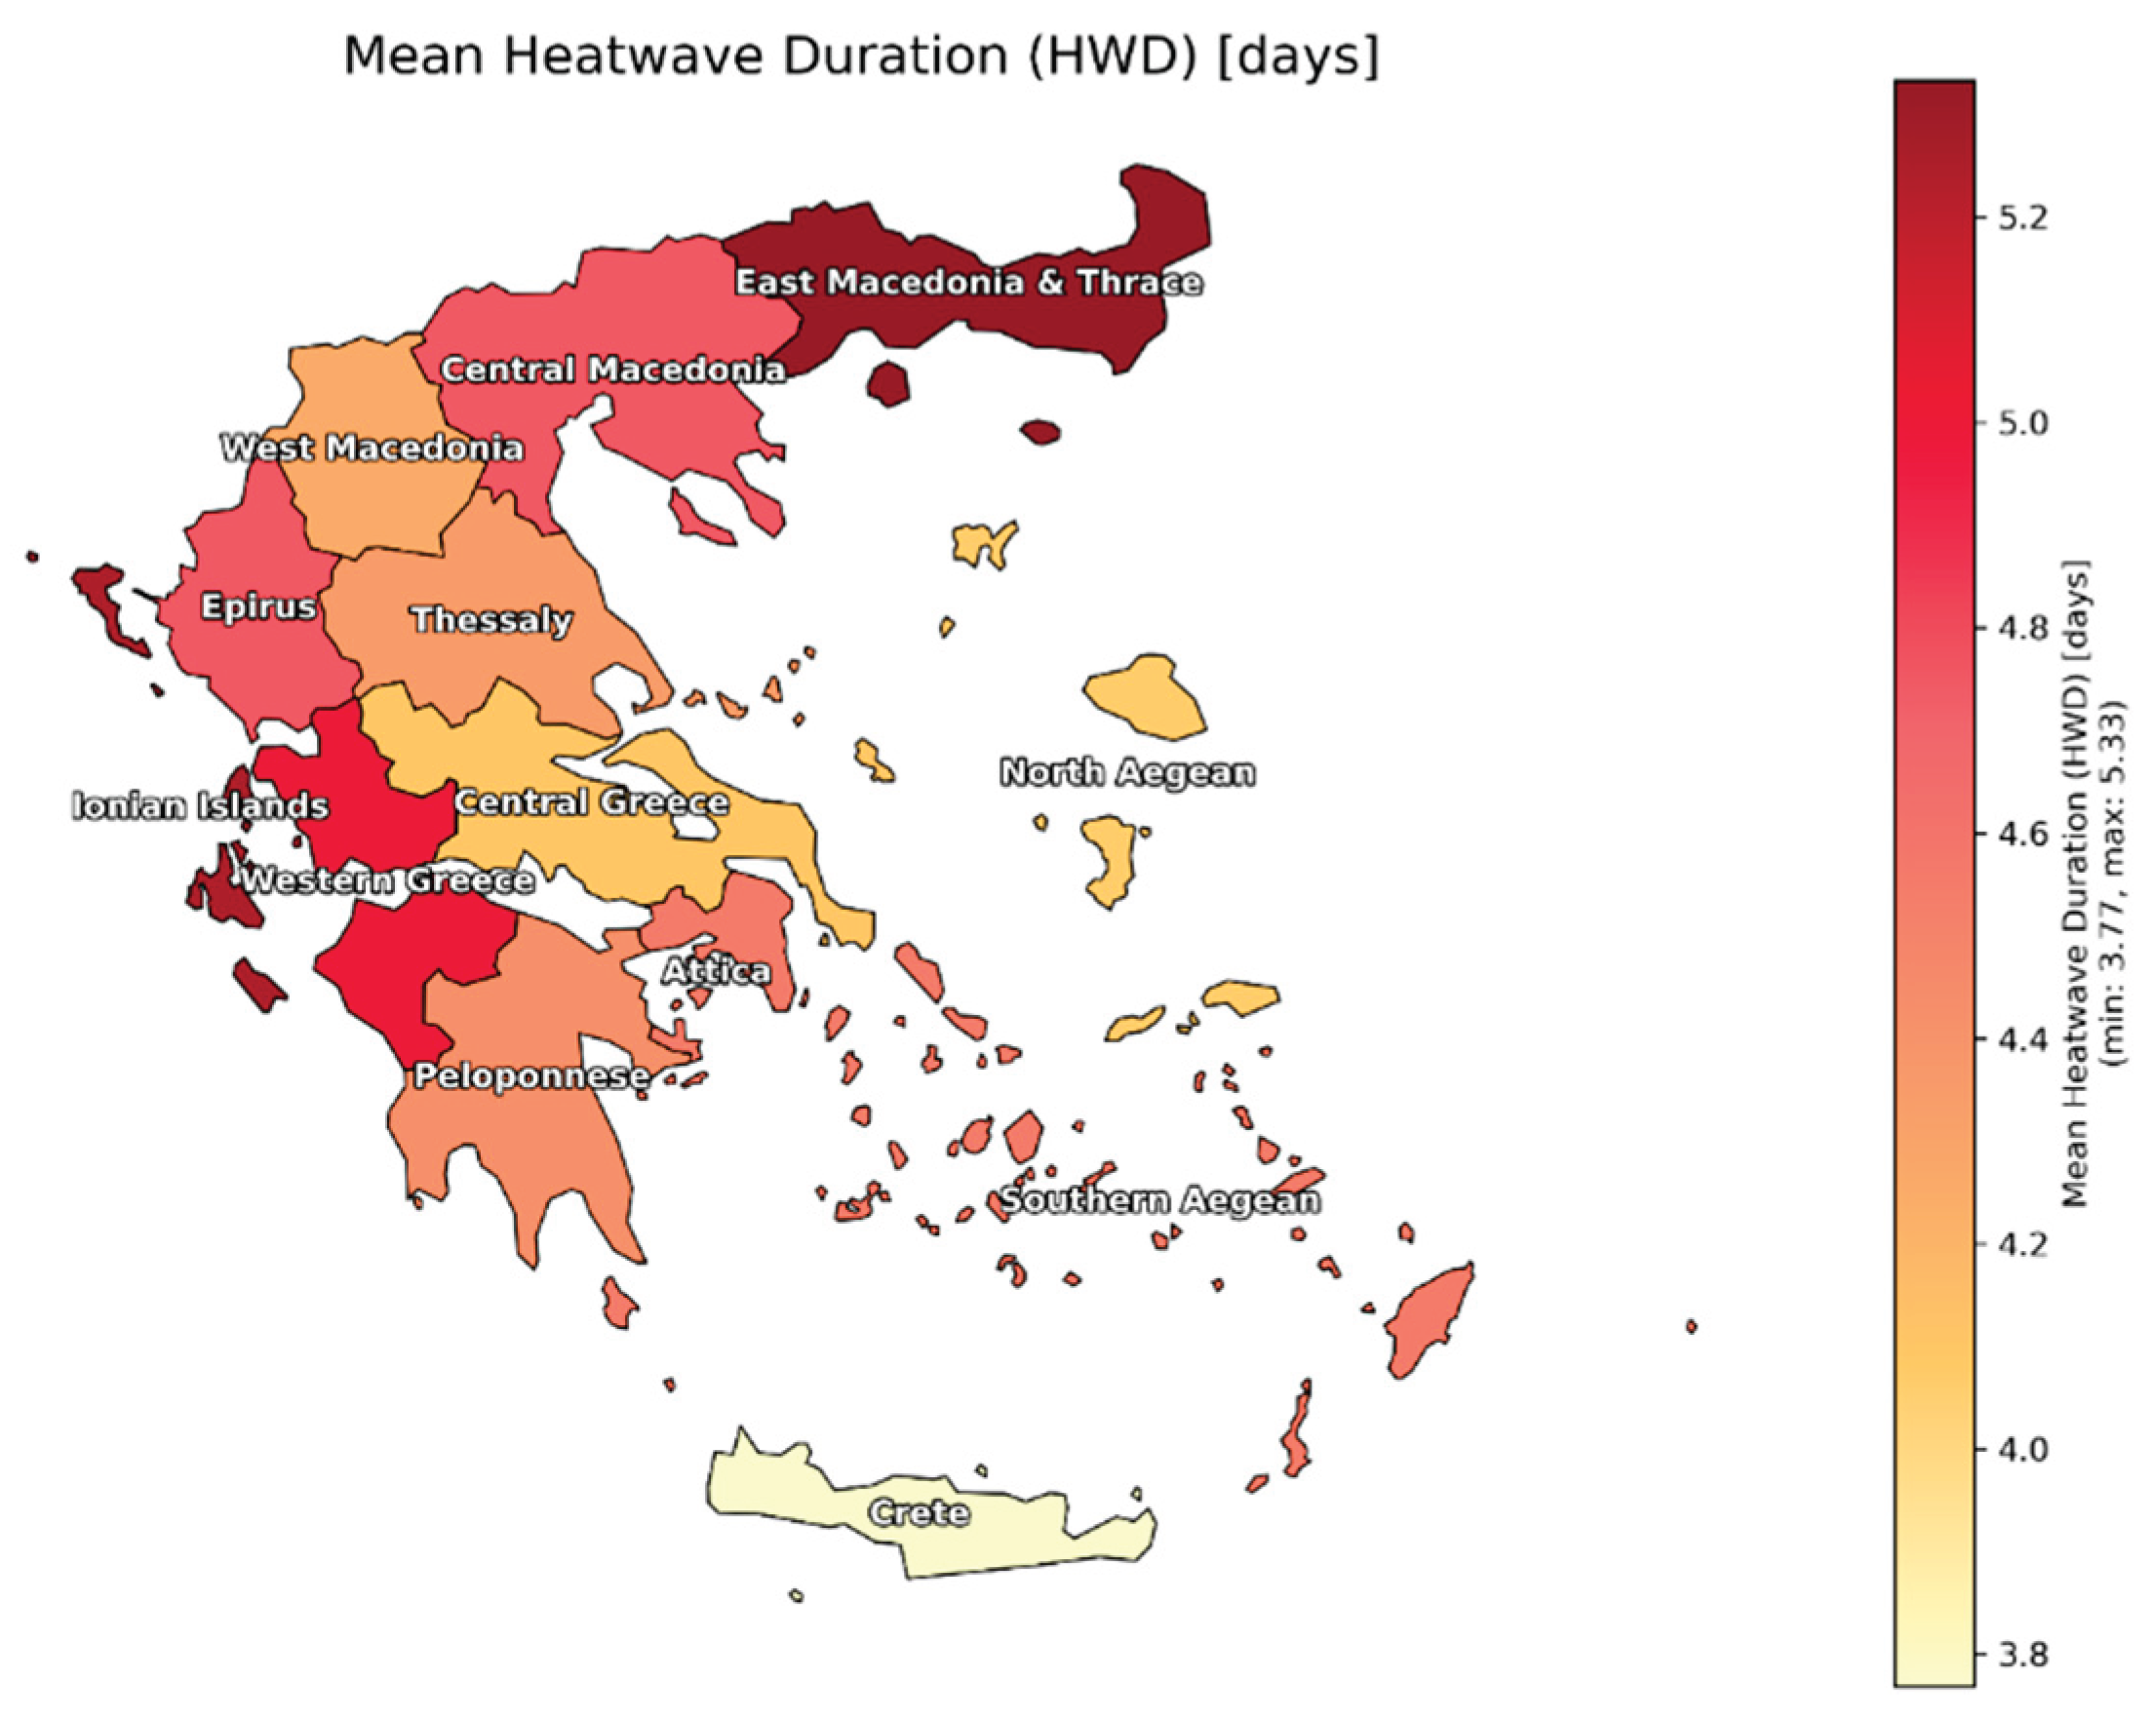
Figure 2.
Spatial distribution of mean HWF (%) in Greece during the summer season (2000–2024).
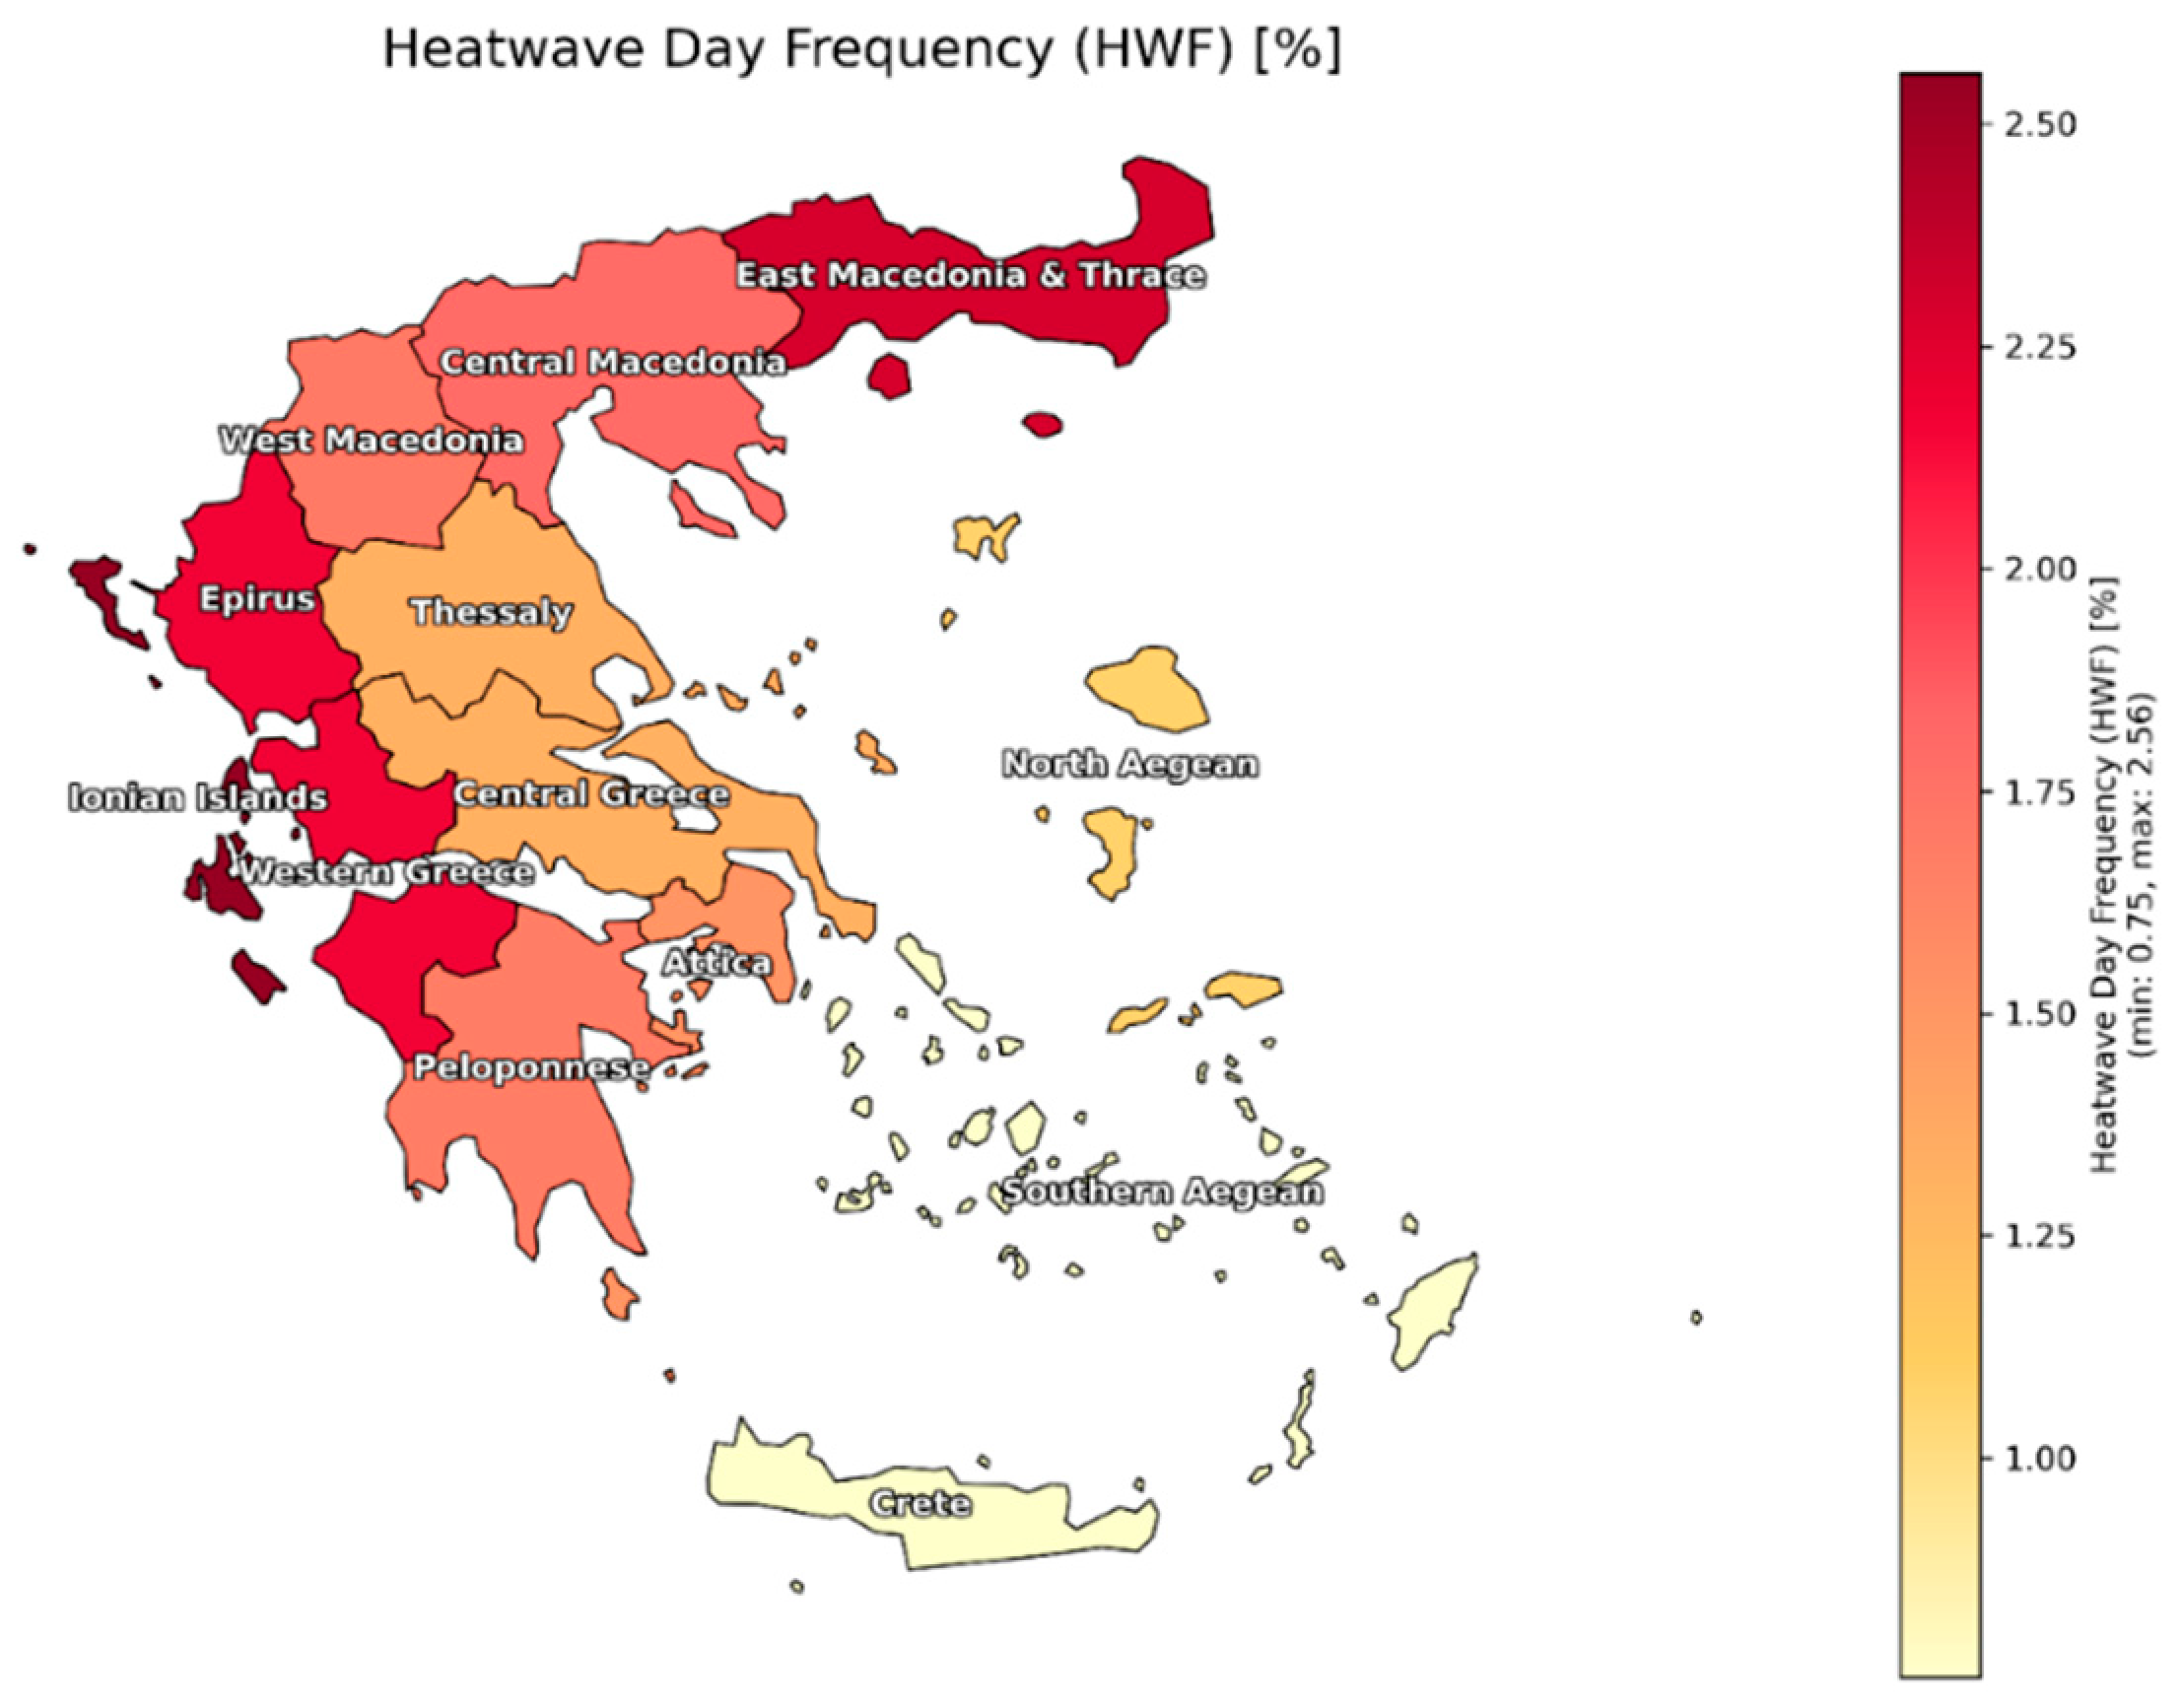
Figure 3.
Spatial distribution of mean HWN in Greece during the summer season (2000–2024).
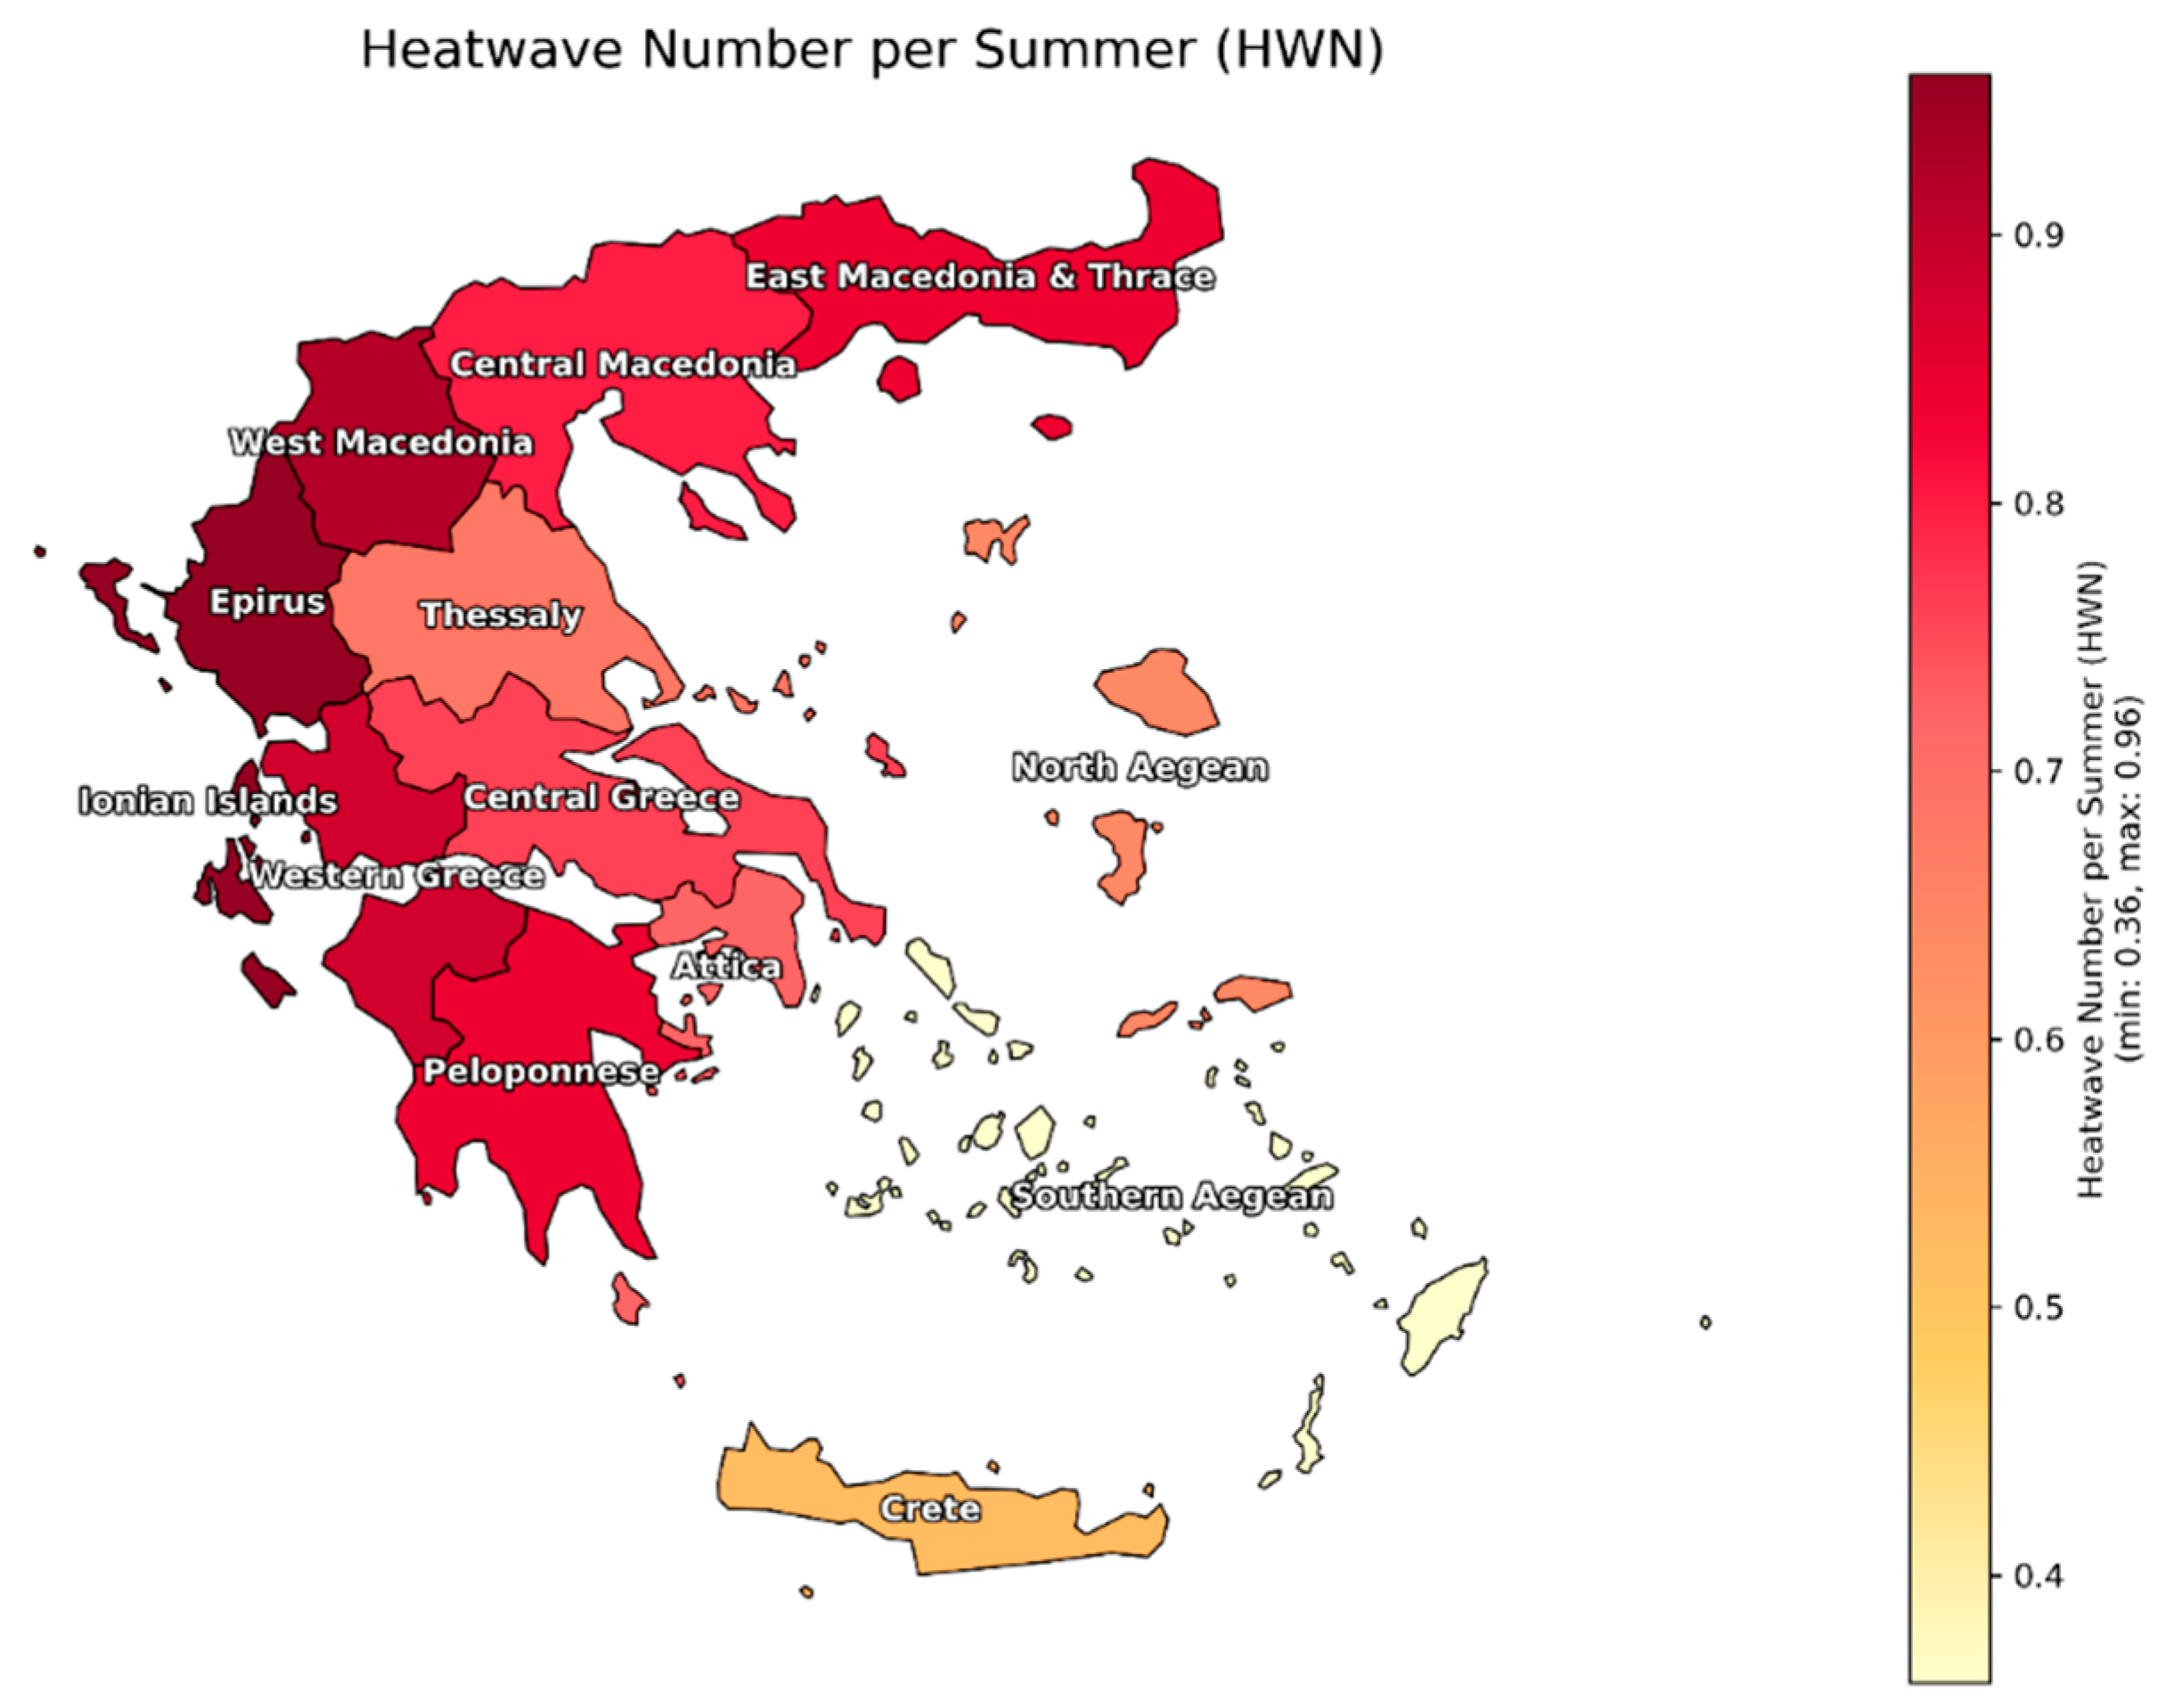
Figure 4.
National heatwave trends in Greece (2014–2050). (a) Temporal trends of national annual heatwave day frequency under RCP45 scenario (green line) and RCP85 (red line) from 2026 to 2050. (b) Temporal trends of national annual heatwave events under RCP45 scenario (green line) and RCP85 (red line) from 2026 to 2050 and (c) Temporal trends of national annual mean heatwave duration (days) under RCP45 scenario (green line) and RCP85 (red line) from 2026 to 2050. The blue line corresponds to the trend on the baseline period (2014−2024). The vertical dashed line marks the transition from historical observations to future projections.
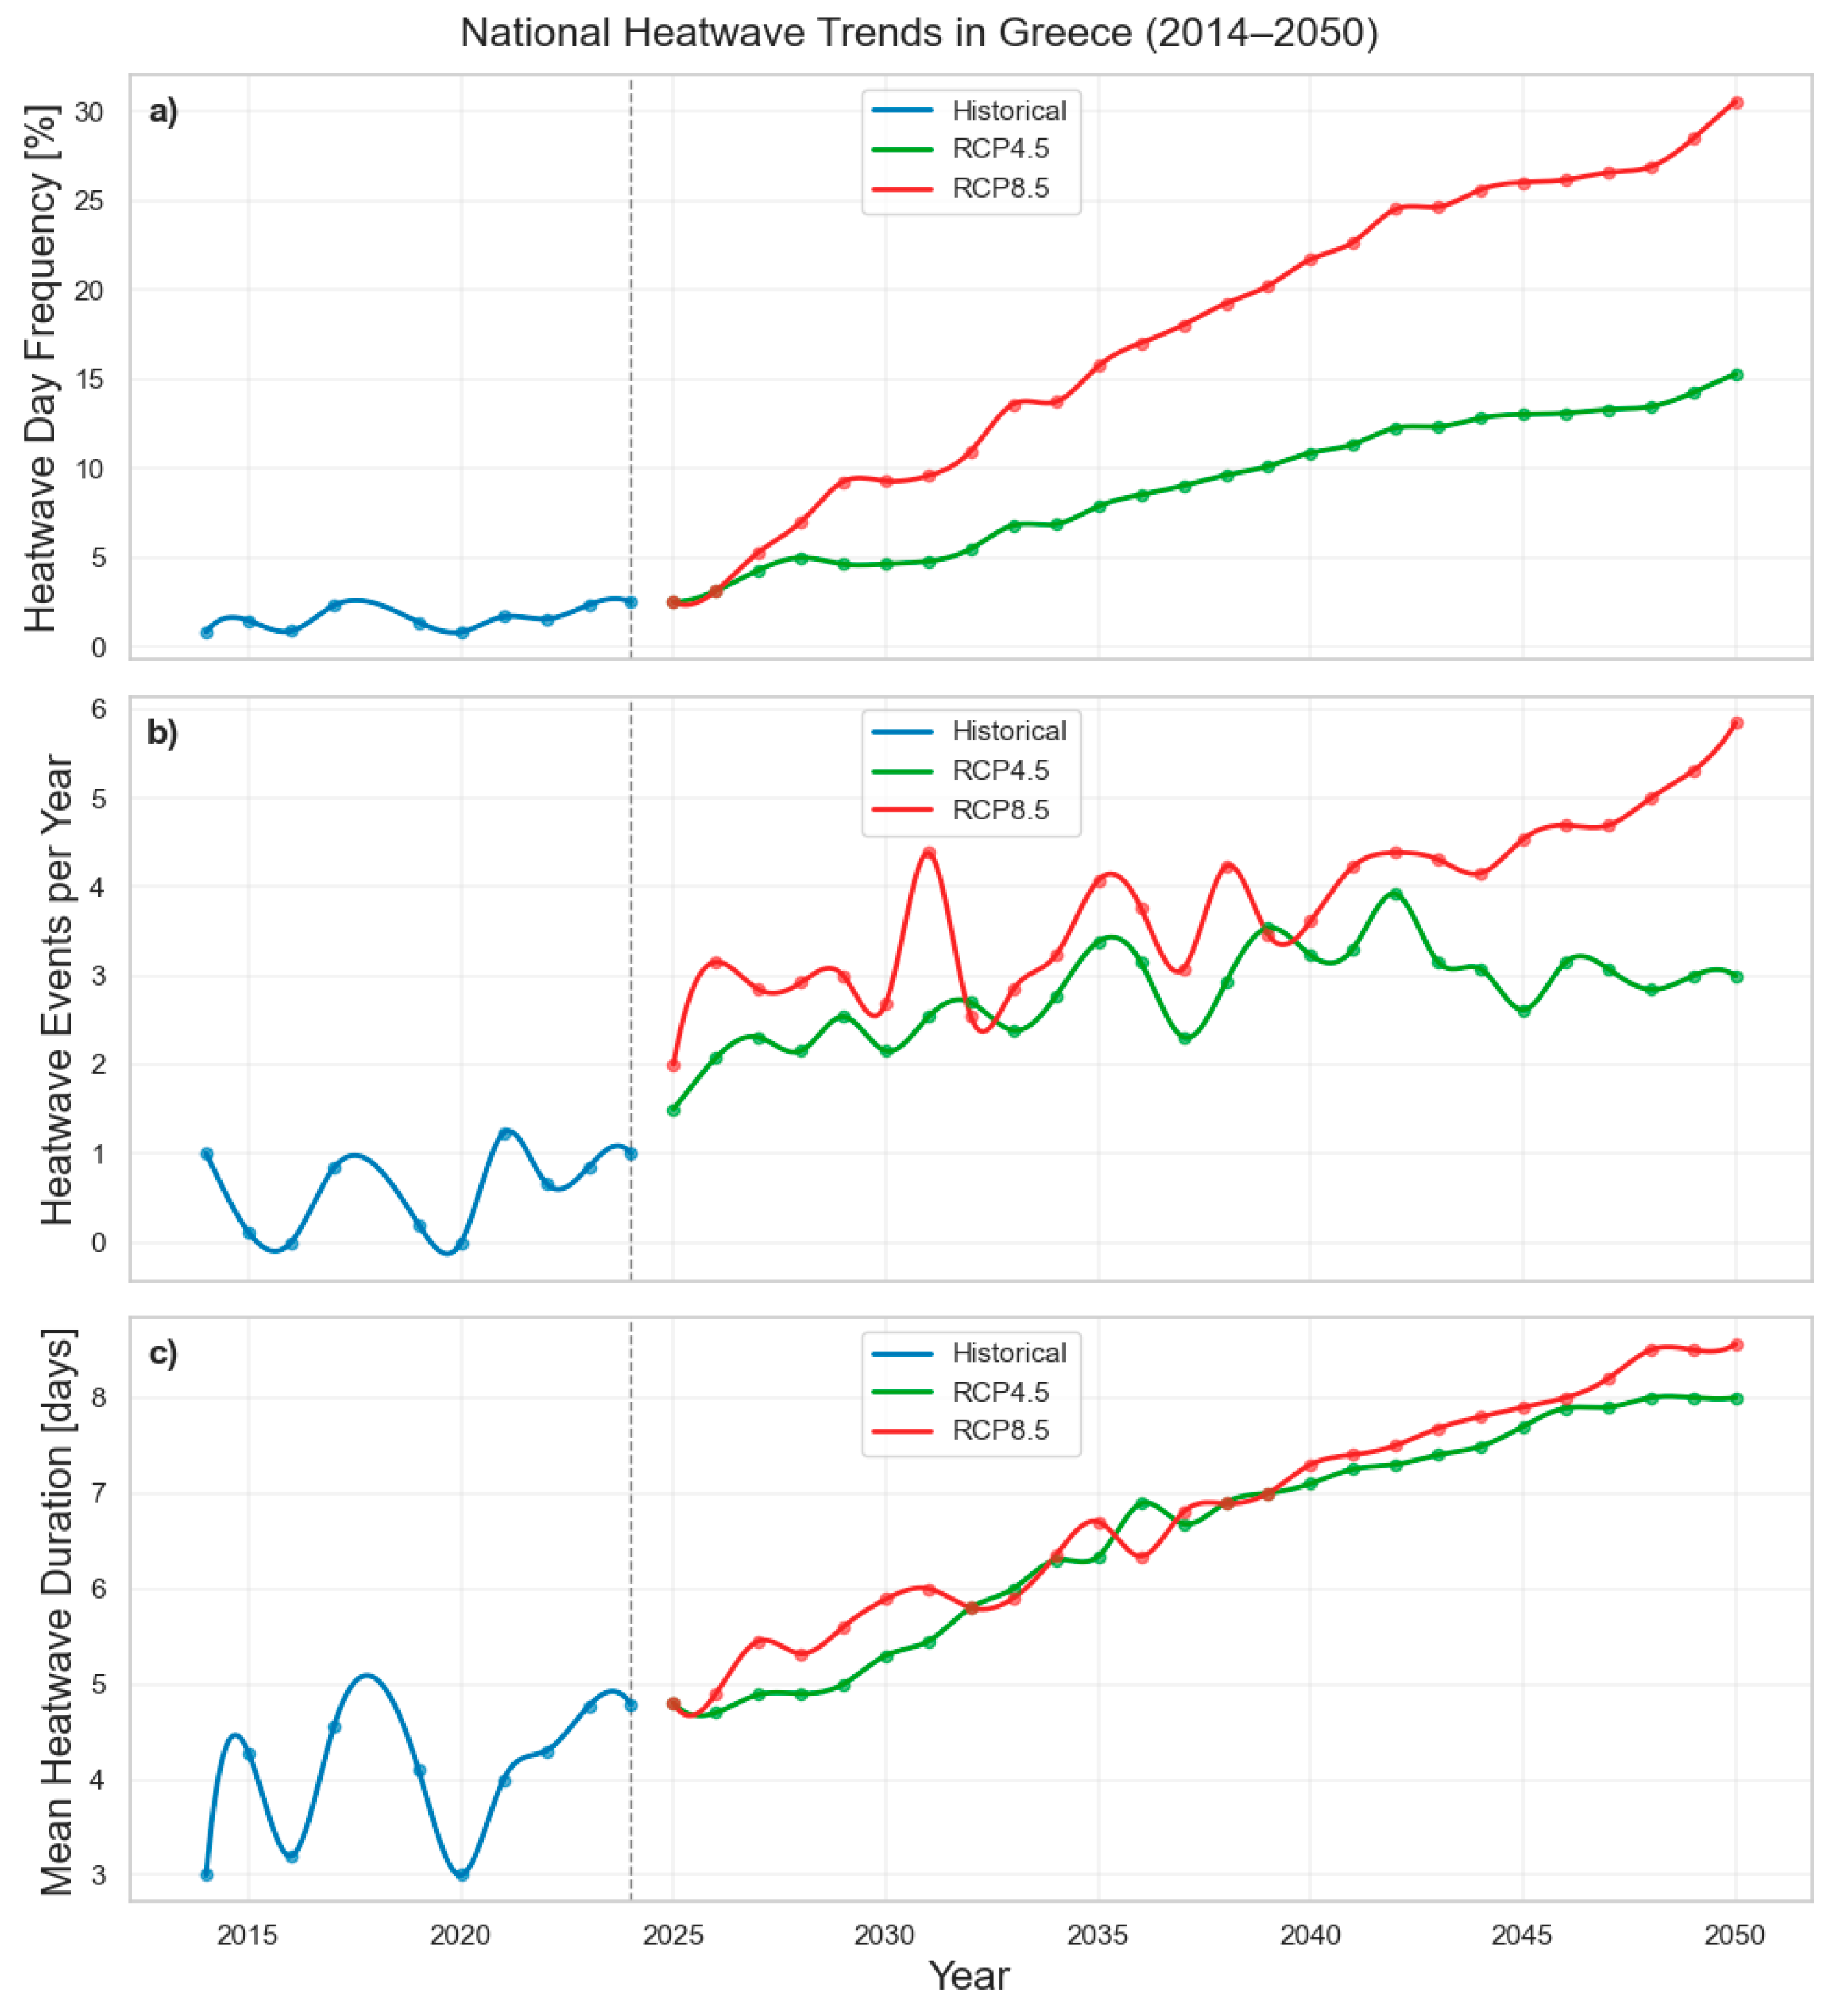
Figure 5.
Spatial distribution of HWF (top), HWN (middle) and HWD (bottom) in 2030, 2040 and 2050 under RCP45 scenario.
Figure 5.
Spatial distribution of HWF (top), HWN (middle) and HWD (bottom) in 2030, 2040 and 2050 under RCP45 scenario.
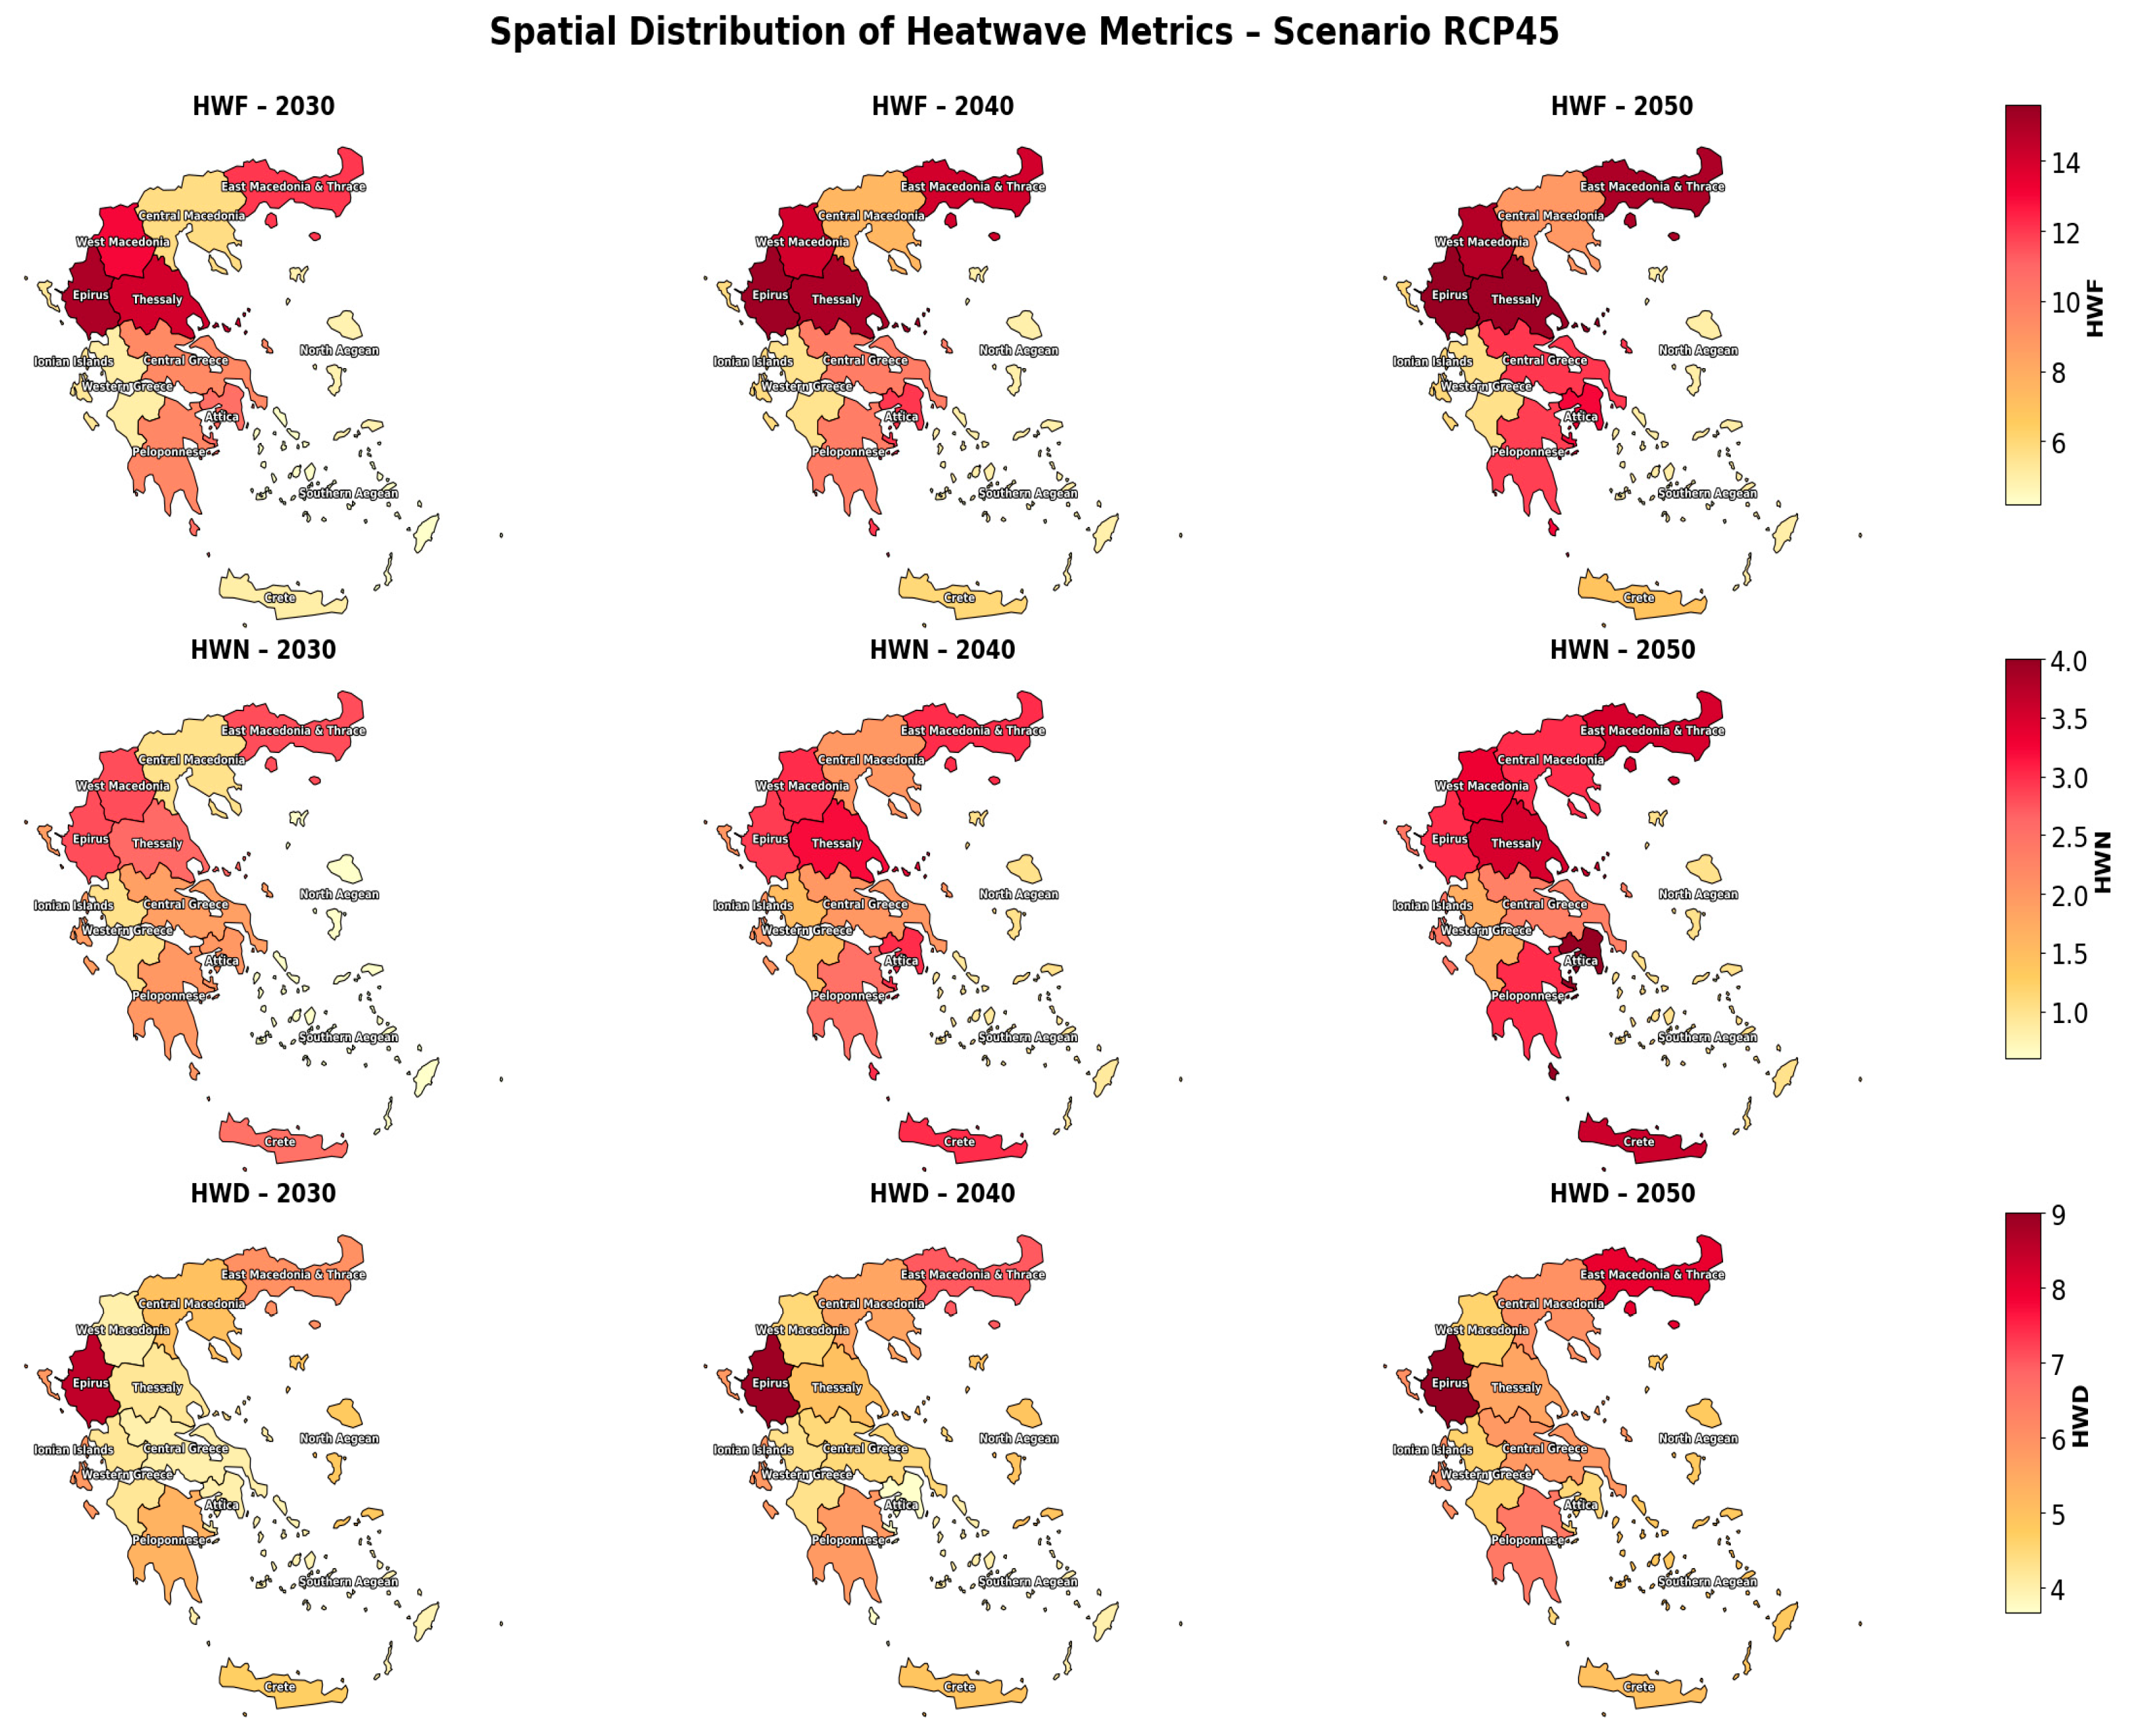
Figure 6.
Spatial distribution of HWF (top), HWN (middle) and HWD (bottom) in 2030, 2040 and 2050 under RCP85 scenario.
Figure 6.
Spatial distribution of HWF (top), HWN (middle) and HWD (bottom) in 2030, 2040 and 2050 under RCP85 scenario.
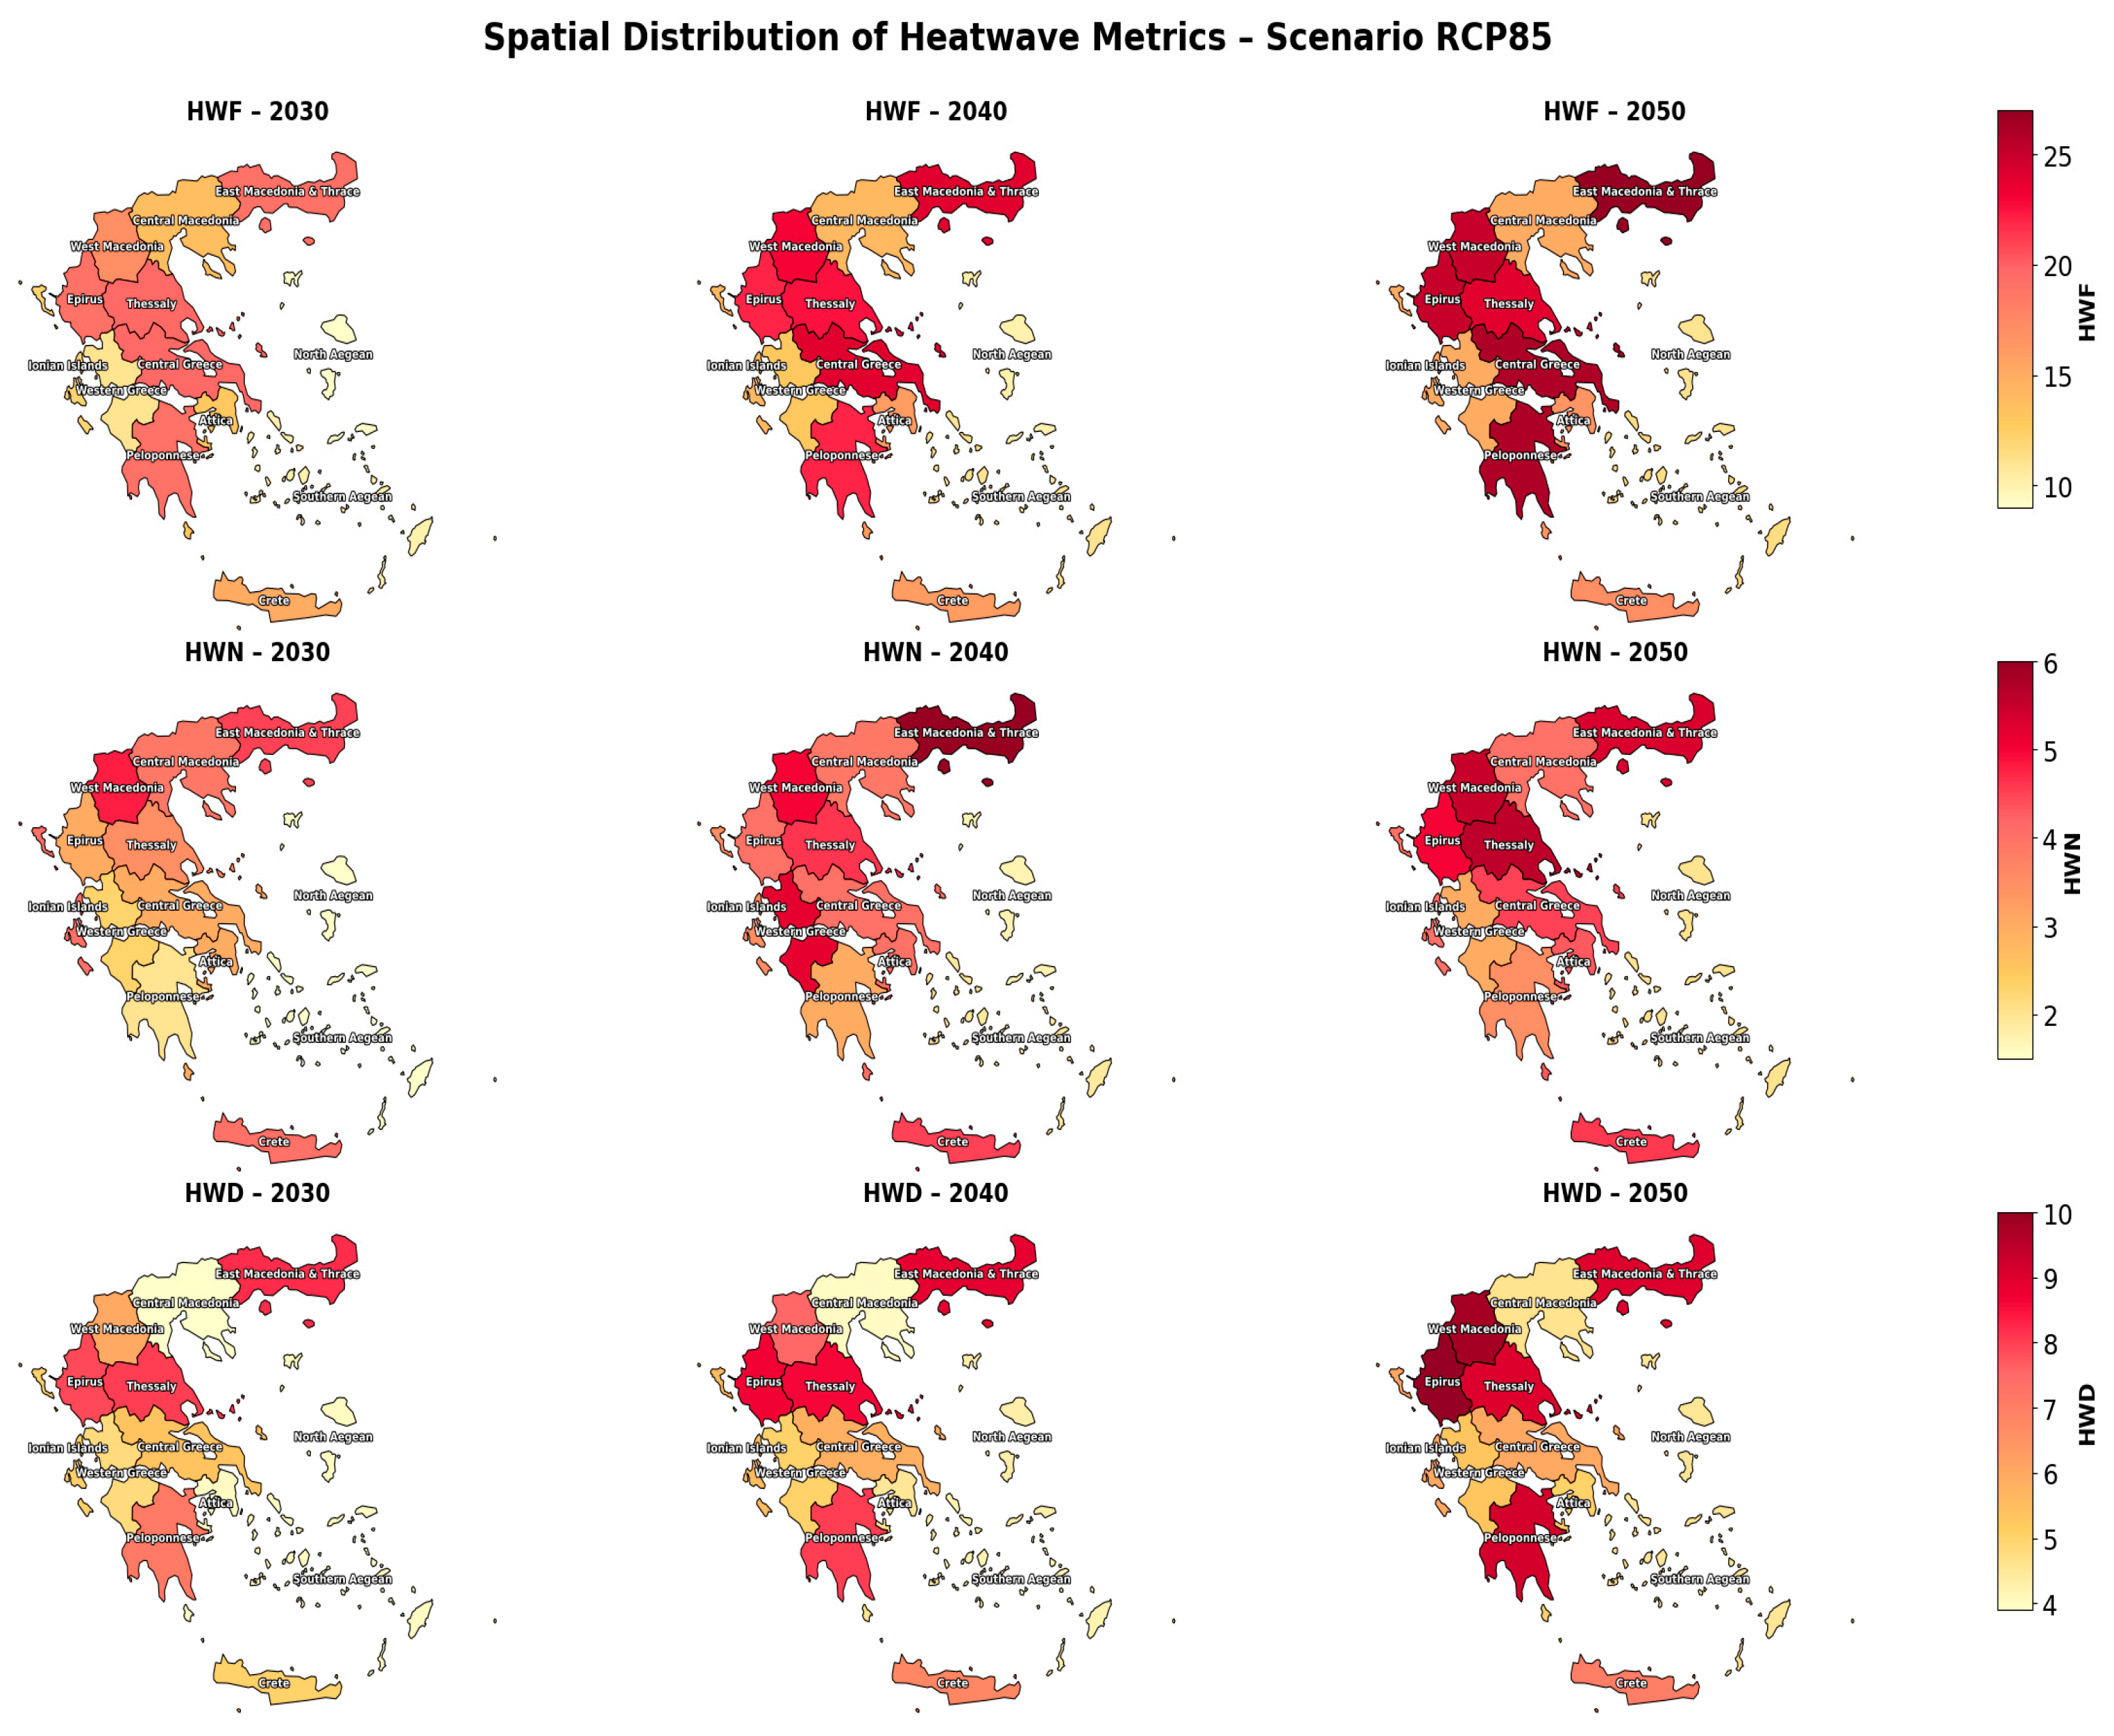
Figure 7.
Figure 7. Predicted vs. actual mortality rates under the RCP4.5 scenario for CVD mortality.
Figure 7.
Figure 7. Predicted vs. actual mortality rates under the RCP4.5 scenario for CVD mortality.
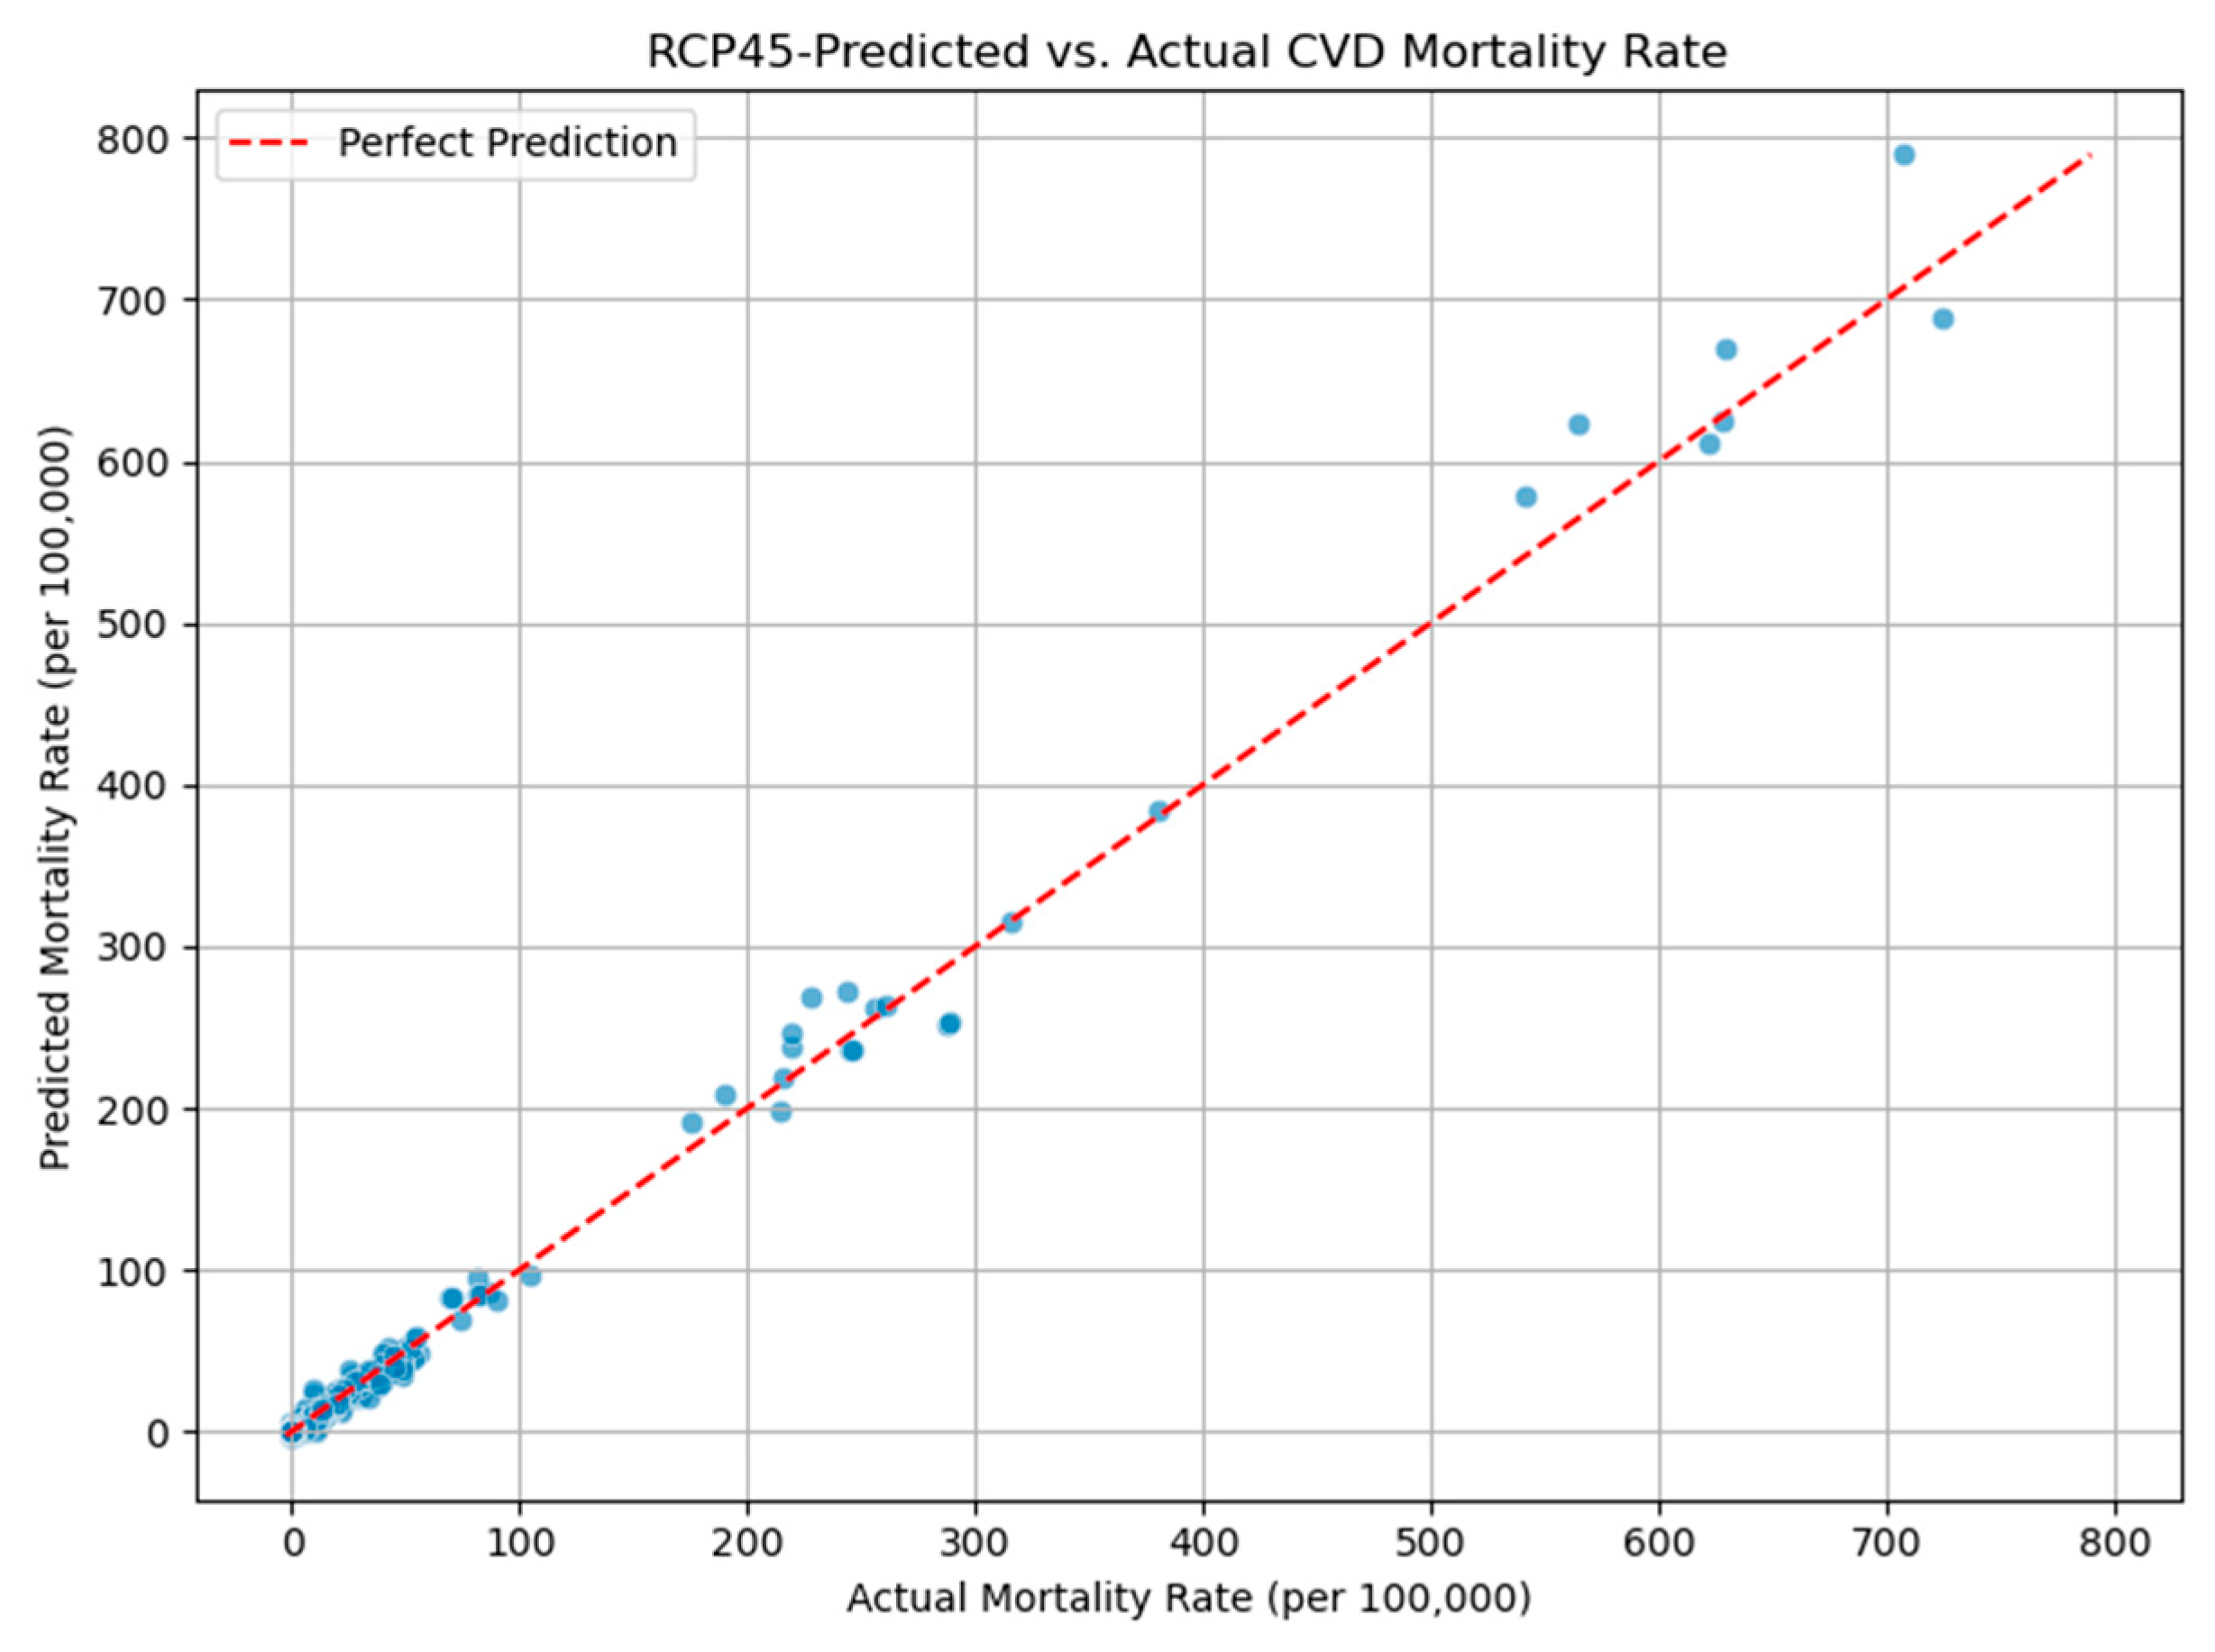
Figure 8.
Projected mortality attributable to heatwaves in Greece for elderly and non-elderly populations from 2015 to 2050 under different climate scenarios. The top panel shows the estimated annual deaths among the elderly, with historical data (2015–2020) in black, and projections for RCP4.5 (blue) and RCP8.5 (red) scenarios from 2026 to 2050. The bottom panel shows corresponding data for the non-elderly population, with historical data in gray, and projections for RCP4.5 (cyan) and RCP8.5 (orange) scenarios. The solid vertical line represents the 95% empirical confidence interval (CI).
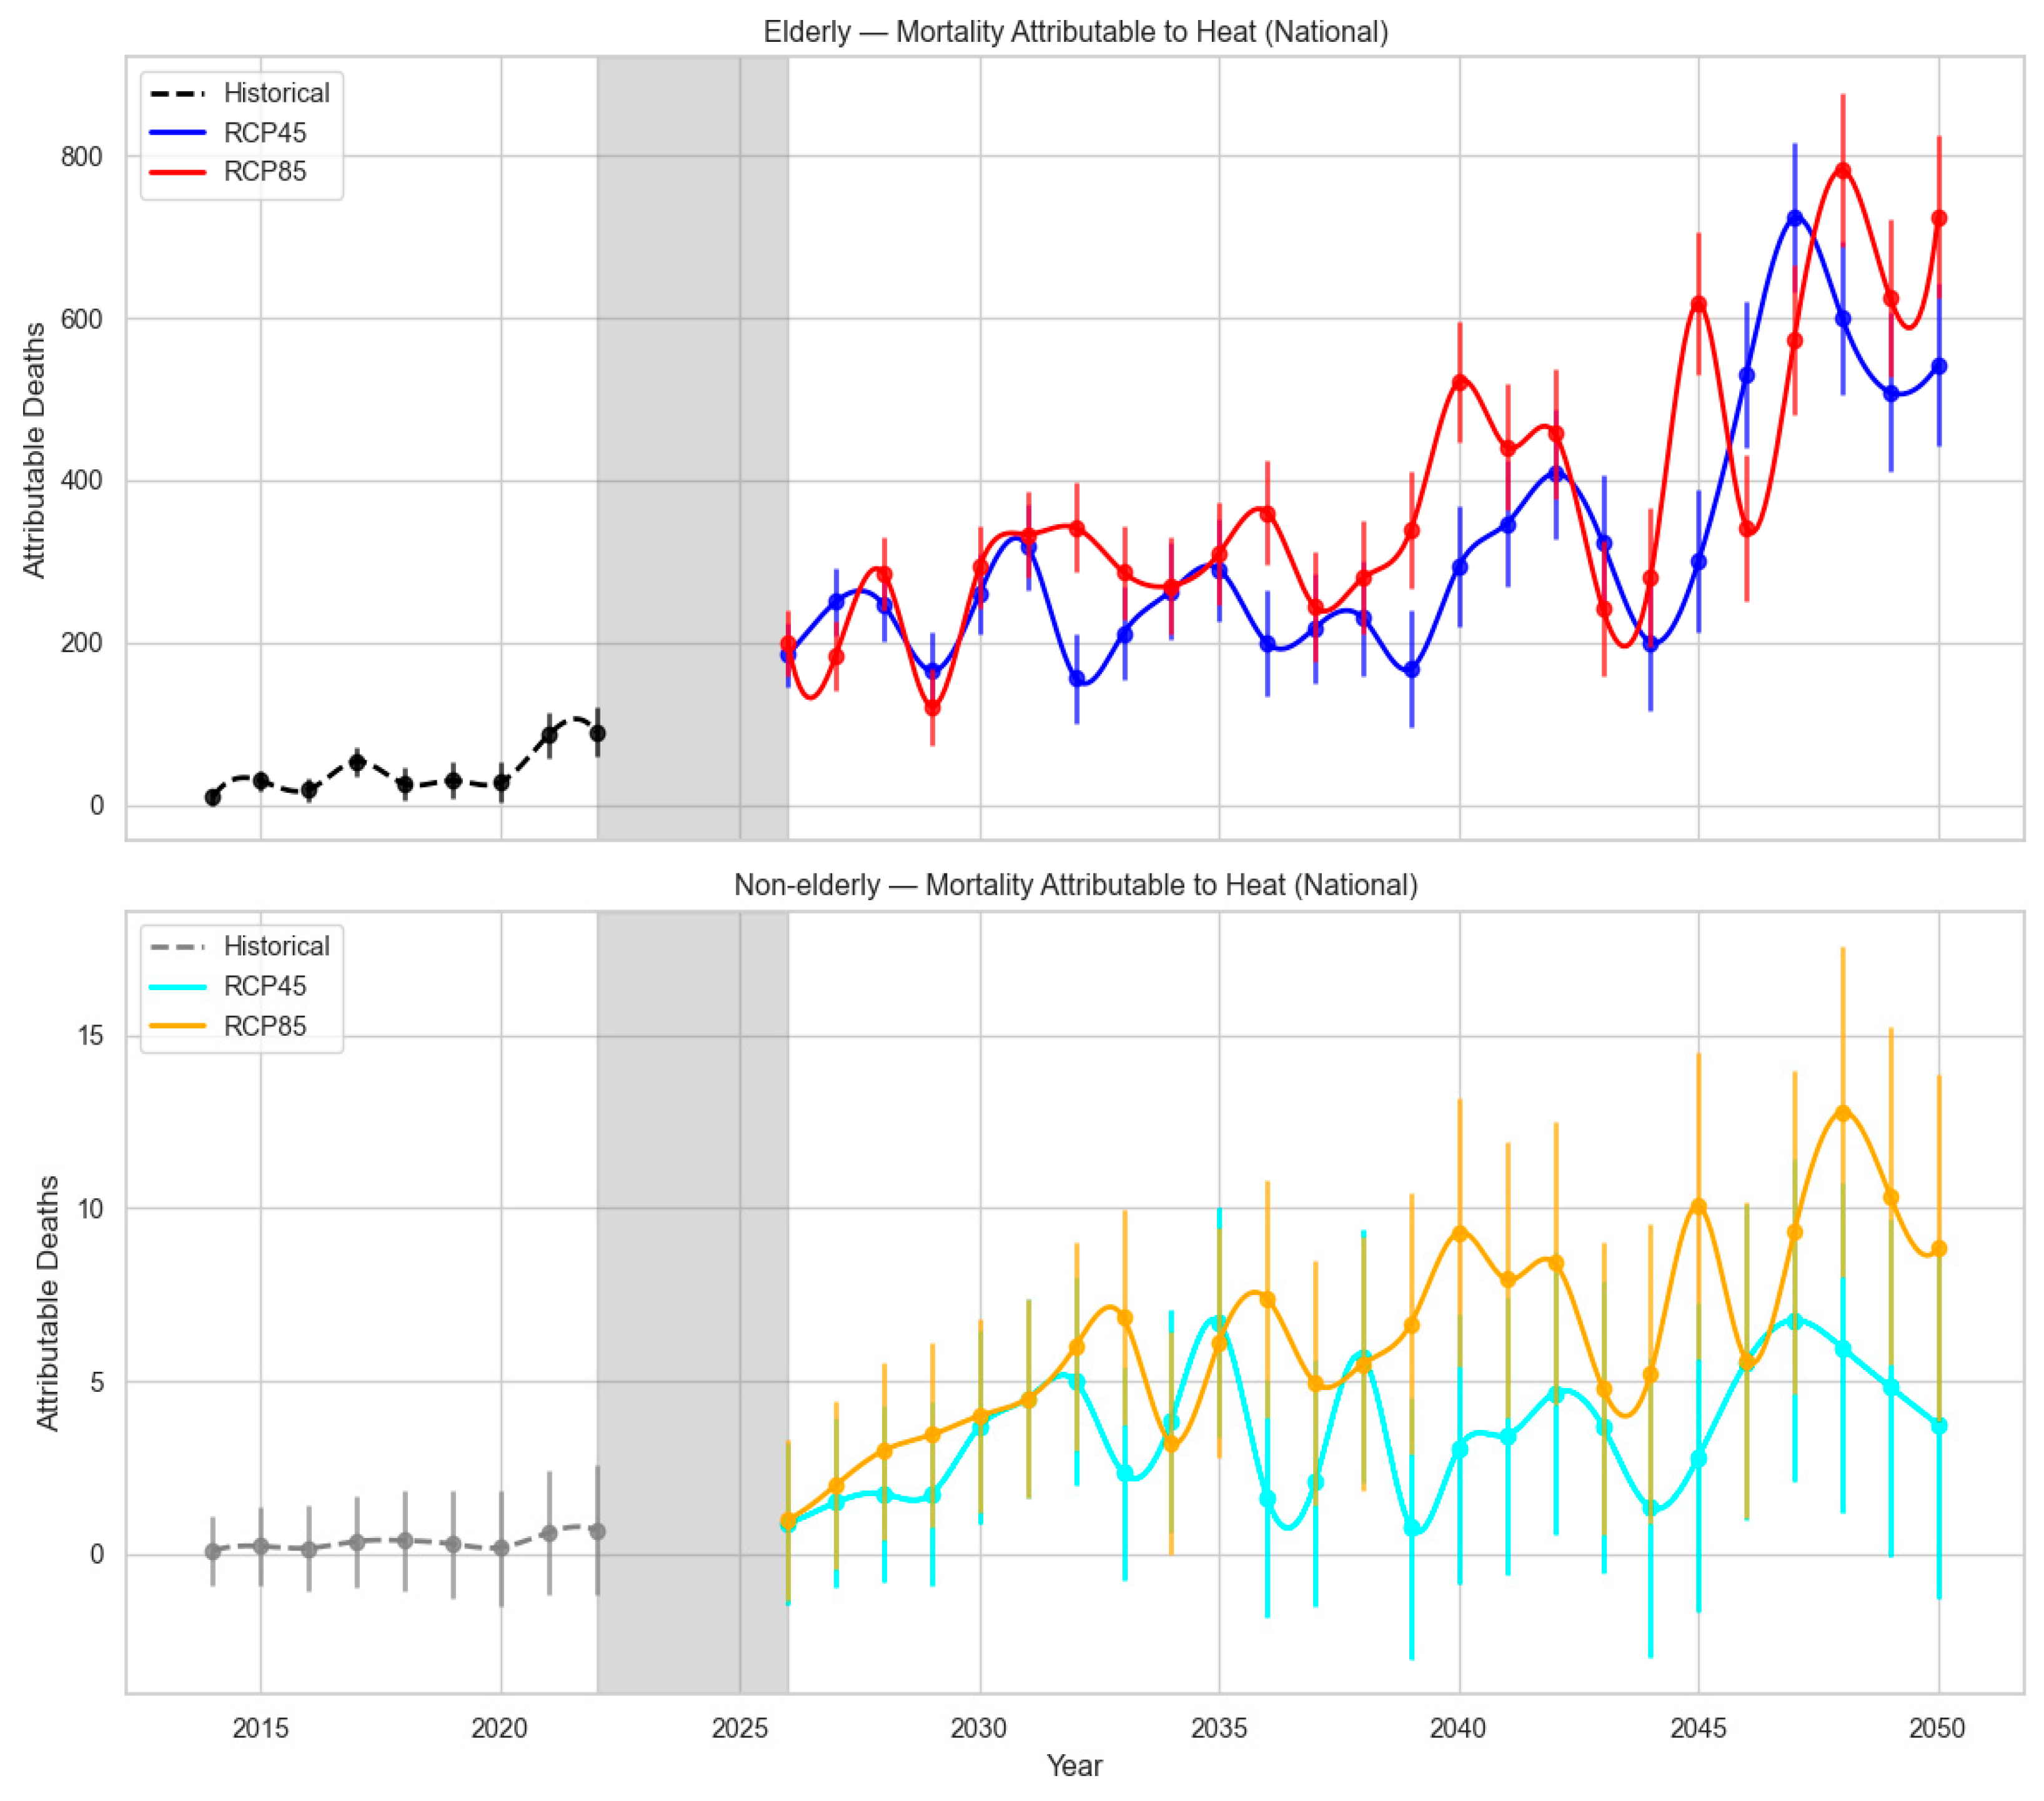
Figure 9.
Spatial distribution of heatwave attributable mortality for elderly (top), and non-elderly (bottom) in 2030, 2040 and 2050 under RCP45 scenario.
Figure 9.
Spatial distribution of heatwave attributable mortality for elderly (top), and non-elderly (bottom) in 2030, 2040 and 2050 under RCP45 scenario.
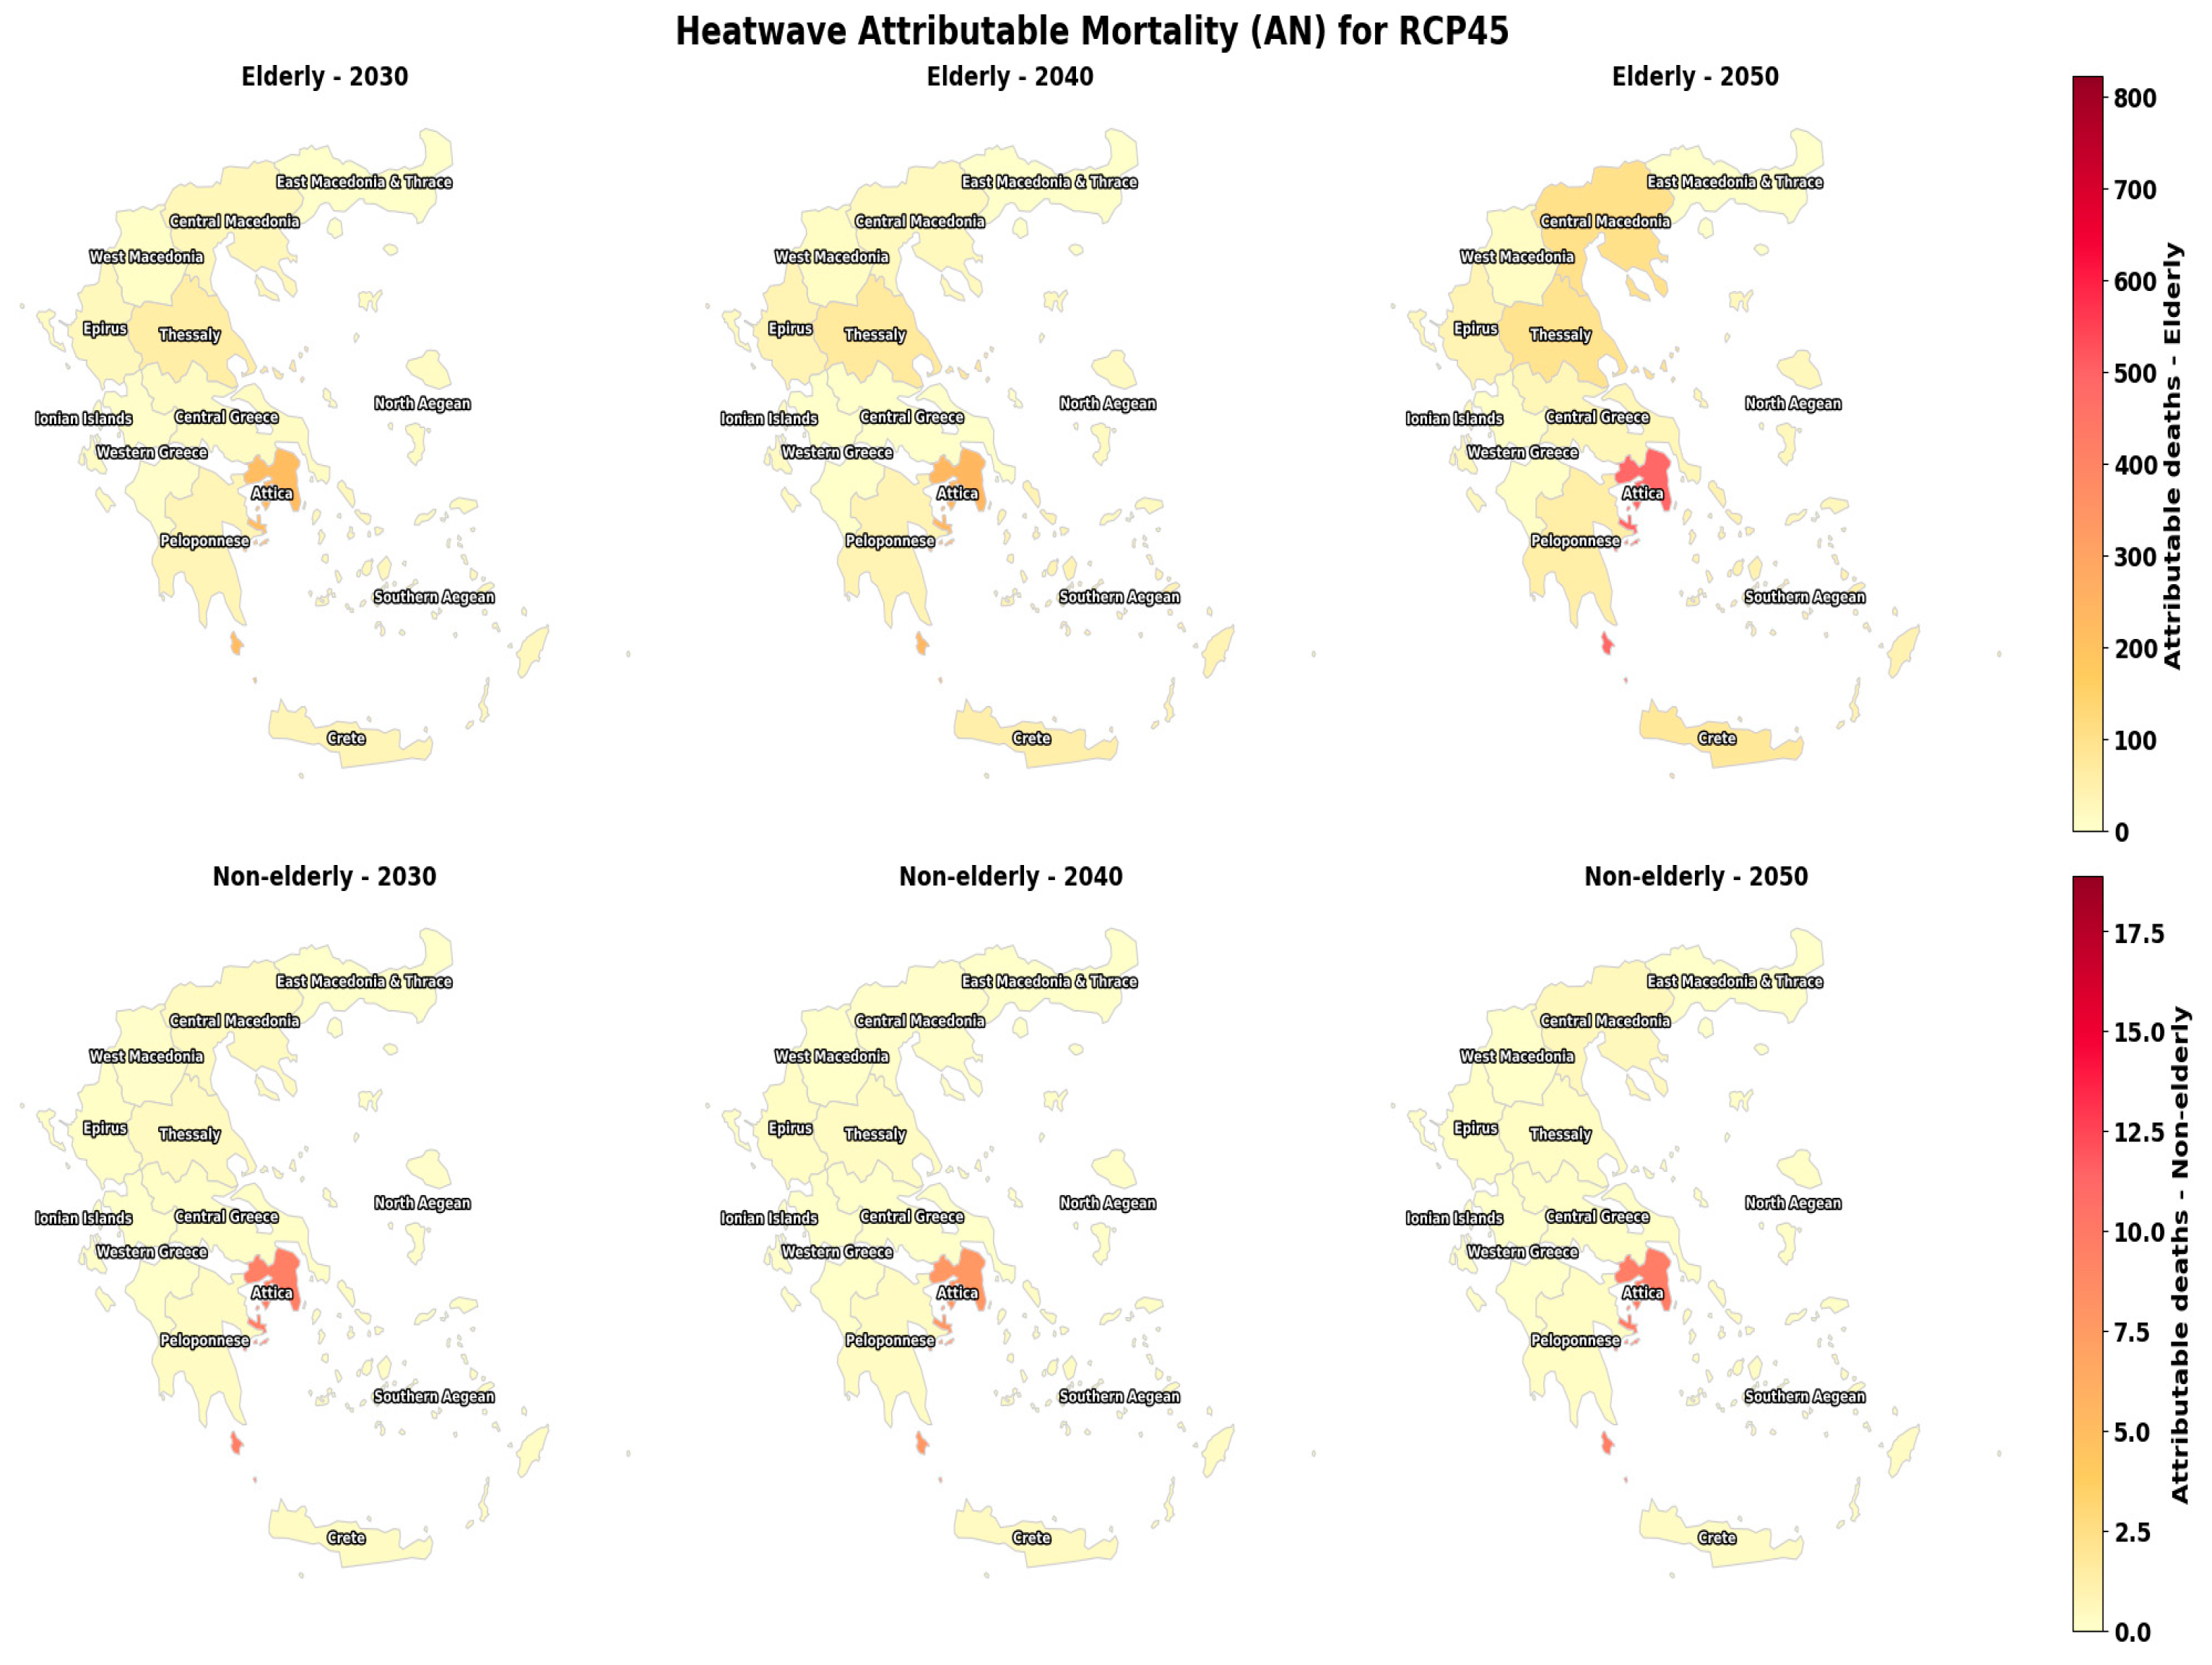
Figure 10.
Spatial distribution of heatwave attributable mortality for elderly (top), and non-elderly (bottom) in 2030, 2040 and 2050 under RCP85 scenario.
Figure 10.
Spatial distribution of heatwave attributable mortality for elderly (top), and non-elderly (bottom) in 2030, 2040 and 2050 under RCP85 scenario.
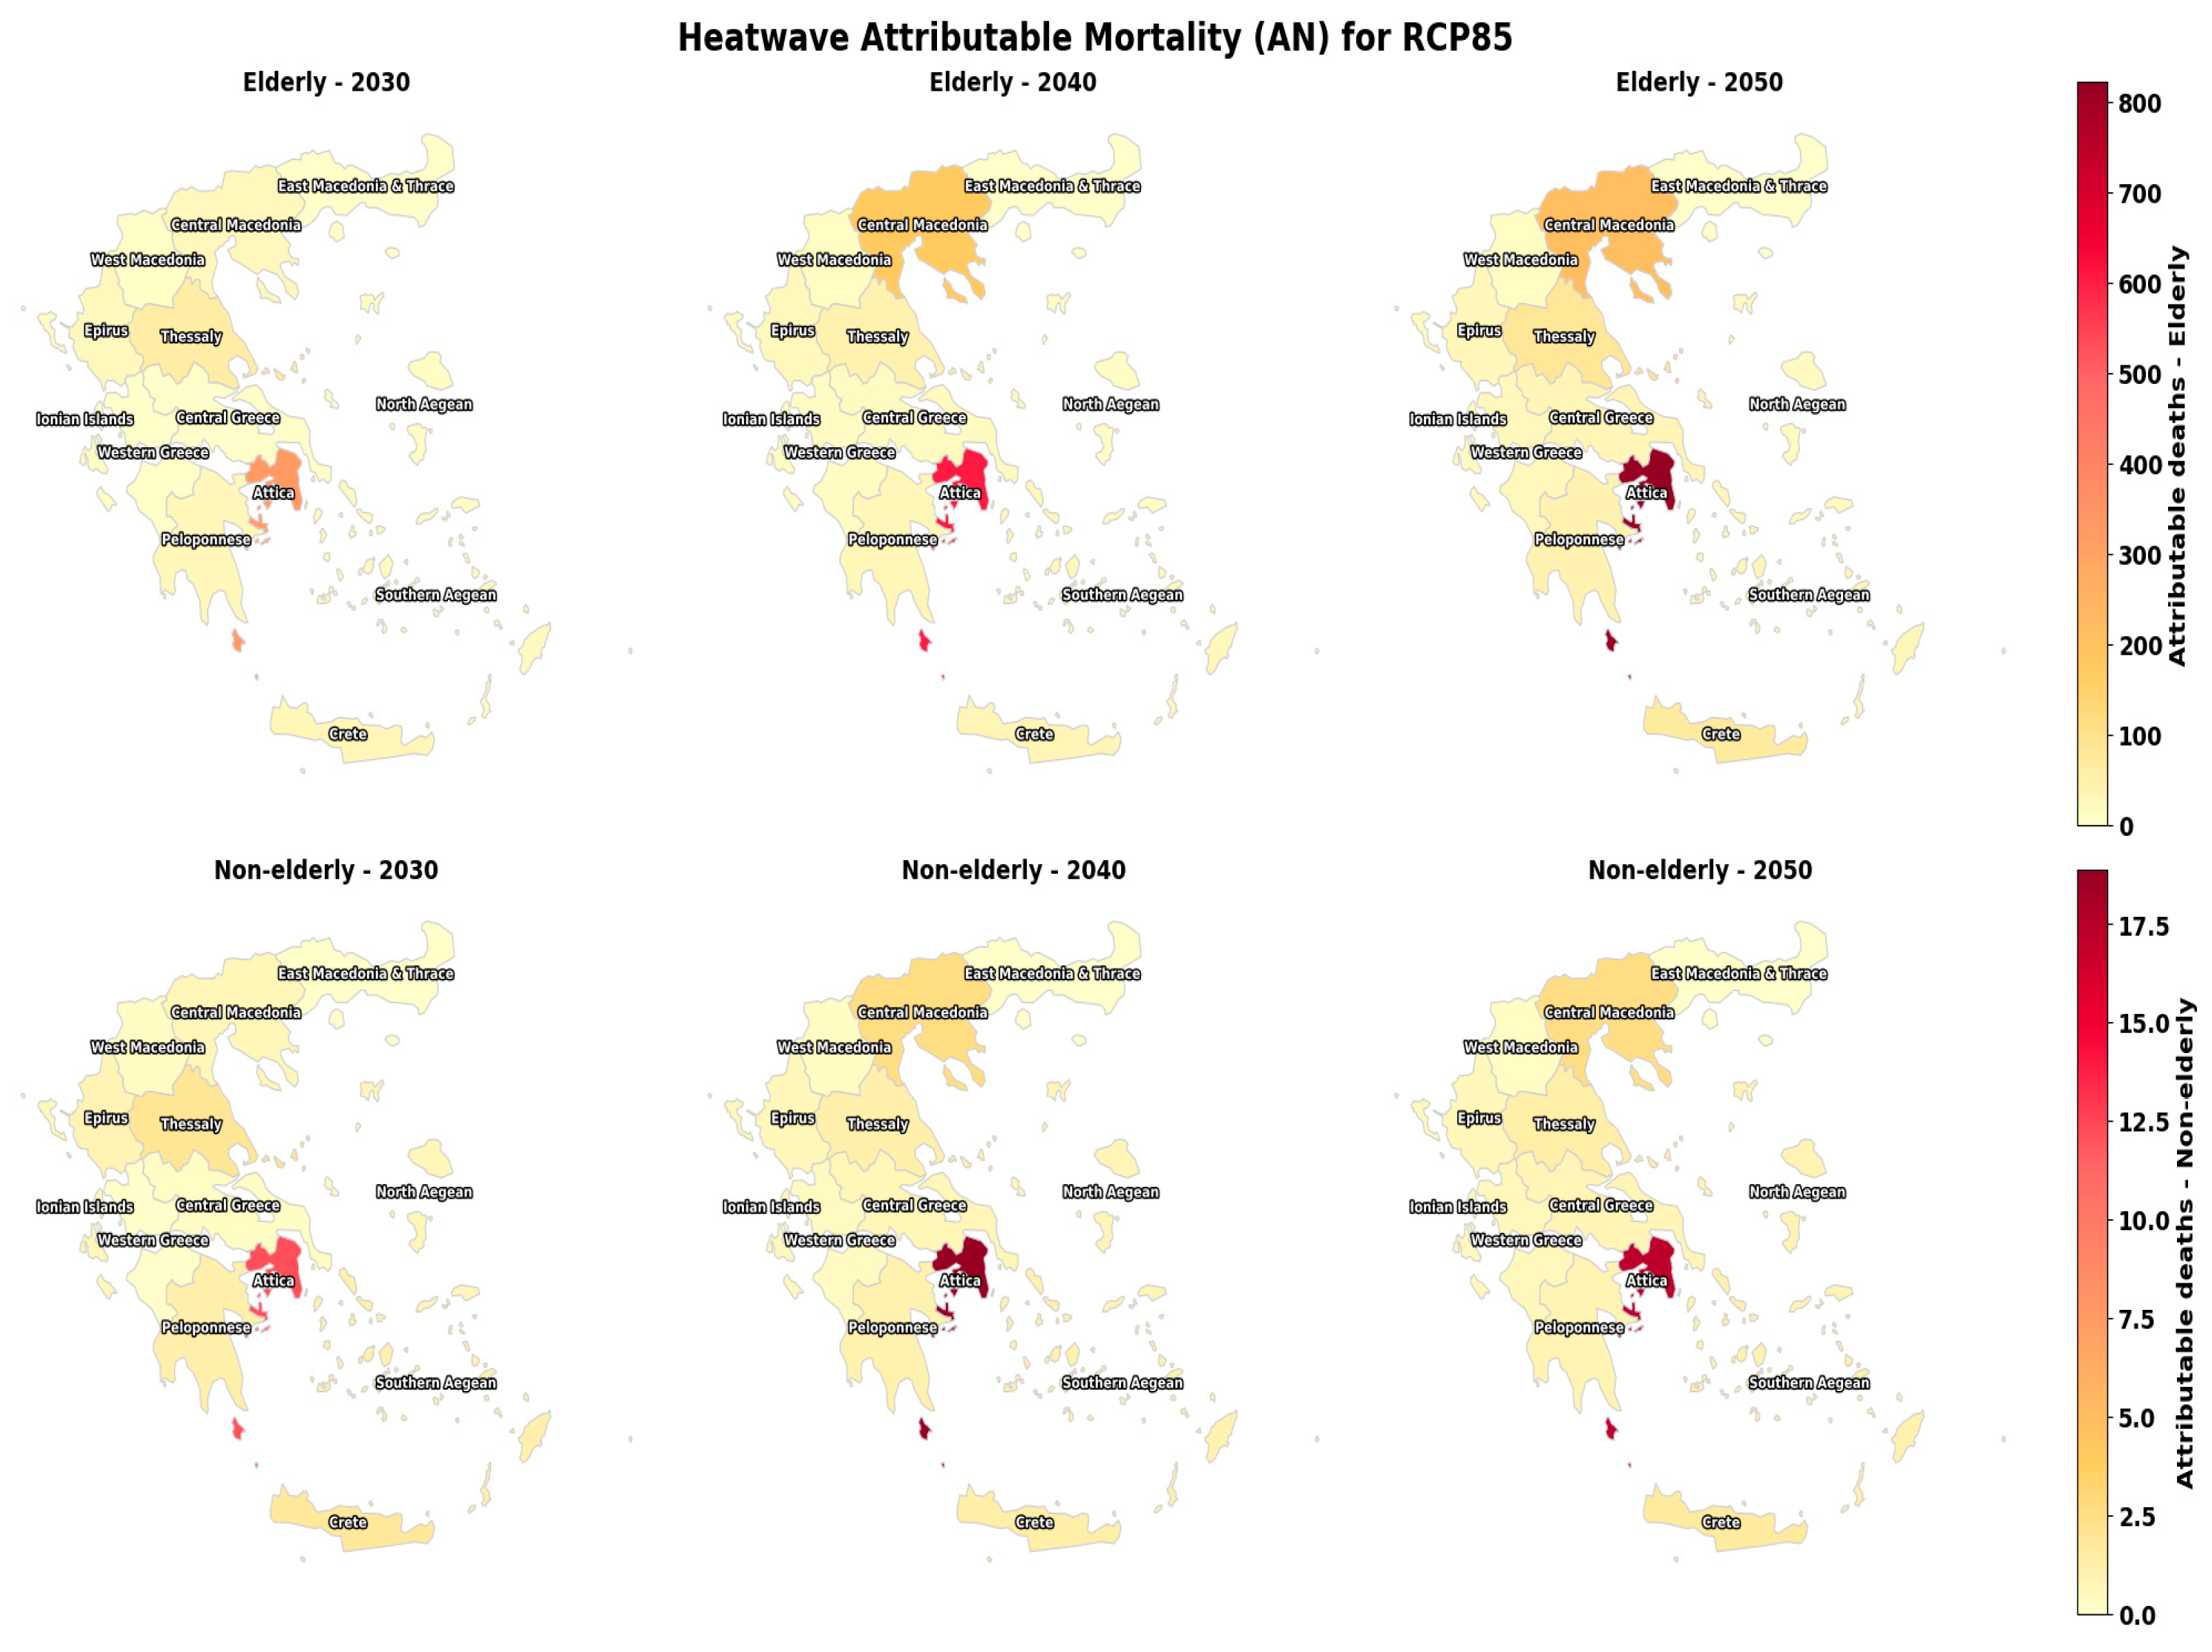

Table 1.
Model performance metrics (MAE, RMSE, and R²) for predicting monthly cardiovascular (CVD) and respiratory (RD) mortality rates per 100,000 population across Greek NUTS 2 regions under RCP4.5 and RCP8.5 climate scenarios. Evaluation was based on a hold-out validation period (2012–2014).
Table 1.
Model performance metrics (MAE, RMSE, and R²) for predicting monthly cardiovascular (CVD) and respiratory (RD) mortality rates per 100,000 population across Greek NUTS 2 regions under RCP4.5 and RCP8.5 climate scenarios. Evaluation was based on a hold-out validation period (2012–2014).
| Disease Type | Scenario | MAE | RMSE | R2 | Interpretation |
|---|---|---|---|---|---|
| CVD | RCP4.5 | 0.7274 | 3.2359 | 0.9926 | Excellent fit; high accuracy under moderate warming. |
| RCP8.5 | 0.7344 | 3.5984 | 0.9909 | Slight increase in error under extreme warming, still robust. | |
| RD | RCP4.5 | 0.3818 | 2.5487 | 0.9677 | Strong fit with relatively low error; captures RD trends effectively. |
| RCP8.5 | 0.3701 | 2.6682 | 0.9646 | Comparable accuracy under extreme warming; slight decline in R². |
Disclaimer/Publisher’s Note: The statements, opinions and data contained in all publications are solely those of the individual author(s) and contributor(s) and not of MDPI and/or the editor(s). MDPI and/or the editor(s) disclaim responsibility for any injury to people or property resulting from any ideas, methods, instructions or products referred to in the content. |
© 2025 by the authors. Licensee MDPI, Basel, Switzerland. This article is an open access article distributed under the terms and conditions of the Creative Commons Attribution (CC BY) license (https://creativecommons.org/licenses/by/4.0/).
Copyright: This open access article is published under a Creative Commons CC BY 4.0 license, which permit the free download, distribution, and reuse, provided that the author and preprint are cited in any reuse.


