
Submitted:
23 March 2025
Posted:
25 March 2025
You are already at the latest version
Abstract
This study analyzes the impact of heatwaves on hospital admissions in the Matam region, Senegal, by integrating climate modeling and advanced machine-learning techniques. Given the increasing frequency and severity of heatwaves, particularly in vulnerable regions such as the Sahel, it is critical to understand their health impacts to enhance public health responses. The primary objective of this research is to characterize the temporal dynamics of heatwave-induced hospitalizations and to identify key climatic and socio-demographic factors influencing these admissions.
Our methodological approach involved detecting and characterizing heatwaves using climatic indices, such as daily maximum temperatures (TMAX) and maximum heat index (HI), and assessing their impacts on hospital admissions using Ourossogui Regional Hospital data from January 2017 to May 2022. Advanced predictive models, including Random Forest (RF), Extreme Gradient Boosting (XGB), and traditional Generalized Additive Models (GAM), were developed and compared to evaluate their effectiveness in capturing complex interactions between climatic and health variables. To ensure the robustness of our findings, a bootstrapping approach with 1000 iterations was applied, allowing for the estimation of confidence intervals and reducing dependence on a single training sample.
The results revealed a significant delayed increase in hospitalizations occurring approximately three to five days after heatwave events, suggesting that physiological deterioration and behavioral factors, such as delayed health-seeking due to environmental constraints and social behaviors, contribute to this latency. Among the predictive models tested, RF achieved the best performance with an R² of [0.51; 0.72], clearly outperforming traditional statistical approaches. Bootstrapping further confirmed the stability of these predictions, reinforcing the reliability of machine learning models in climate-health studies.
These findings highlight the critical need for enhancing heatwave monitoring and establishing robust early-warning systems. Integrating climate predictions into public health strategies could significantly improve preparedness and enable health systems to respond more effectively to extreme heat events. Targeted prevention measures, particularly focused on vulnerable groups such as the elderly, children, and outdoor workers, should be prioritized.
In future research, incorporating additional environmental factors such as air pollution, wind, and others could further refine predictions. Moreover, expanding the study to include a greater number of healthcare facilities and integrating vulnerability factors such as the availability of healthcare structures, access to potable water, energy access, vegetation cover, hydrology, mobile network coverage, poverty dimension, and other socioeconomic indicators would enhance the analysis. The use of advanced Deep Learning techniques could also improve prediction accuracy by effectively modeling complex and nonlinear interactions. Additionally, it would be relevant to extend the study to other regions particularly vulnerable to extreme heat, to gain a more comprehensive understanding of its health and climatic impacts.
Keywords:
heatwave
; health
; machine learning
; Senegal
1. Introduction
Climate change is now an undeniable reality, with major impacts on ecosystems, societies, and, more particularly, human health (Barry, 2012; Harper & Snowden, 2017). According to the Sixth Assessment Report of the Intergovernmental Panel on Climate Change (IPCC, 2021), the frequency, duration, and intensity of extreme temperatures have significantly increased worldwide, exacerbating health risks, especially for vulnerable populations. The World Health Organization (WHO, 2024) estimates that heat stress could become one of the leading causes of climate-related mortality in the coming decades, particularly in sub-Saharan Africa, where access to healthcare remains limited (Amegah et al., 2016; Ayal, 2021).
Although Africa contributes minimally to global greenhouse gas emissions, it disproportionately suffers from the effects of climate change, particularly in Sahelian regions (Giannini, 2010; Kanu & Ndubisi, 2020). The Sahel is identified as one of the most climate-sensitive areas (Sissoko et al., 2011), with projected increases in average temperatures ranging from 1.5 °C to 6.5 °C by the end of the 21st century, depending on different greenhouse gas emission scenarios (Sylla et al., 2016). This temperature rise is accompanied by an intensification of extreme weather events, particularly heatwaves and droughts (Acosta et al., 2024; Sylla et al., 2016), exposing populations to severe health consequences.
Heatwaves have become a major public health issue, particularly in arid and semi-arid regions such as the Sahel (Sy et al., 2024). They lead to a significant increase in morbidity and mortality, especially among vulnerable populations (Alho et al., 2024; Clark et al., 2024; Sy et al., 2022). These climate events can cause or exacerbate certain pathologies, including heat stroke, dehydration, cardiovascular diseases, and respiratory illnesses (Cheng et al., 2019; Hopp et al., 2018).
Beyond their direct effects, heatwaves place considerable pressure on healthcare infrastructure, especially in areas with limited access to medical care (Berry et al., 2024; Muhammad et al., 2024). They also compromise food security and access to clean water, further increasing the prevalence of infectious and nutritional diseases (Iriti & Vitalini, 2025; Kurebwa & Kurebwa, 2025).
In response to these challenges, several initiatives have been implemented to improve heatwave management and mitigate their health impacts. In Senegal, the National Civil Aviation and Meteorology Agency (ANACIM), in collaboration with the National Oceanic and Atmospheric Administration (NOAA), the Senegalese Ministry of Health, the Senegalese Red Cross, and the Centre de Suivi Écologique (CSE), has been working since 2016 to establish monitoring and early warning systems for heatwaves and their effects on public health (Thiaw et al., 2022). However, these efforts remain limited, particularly in establishing precise links between heatwaves and increased hospitalizations. The lack of consolidated health data hinders the formulation of appropriate recommendations and the determination of region-specific alert thresholds.
Globally, the increasing occurrence of heatwaves has led to a sharp rise in hospitalizations and deaths, as demonstrated by the dramatic 2003 heatwave in Europe, which caused thousands of fatalities (D’Ippoliti et al., 2010). In Africa, these events are becoming more frequent, exacerbating their public health consequences (Nhamo et al., 2025).
The impacts of heatwaves vary depending on several socio-demographic factors. Elderly and dependent individuals are particularly vulnerable due to their reduced thermoregulation capacity and the higher prevalence of chronic diseases in this age group (Gamble et al., 2013). Infants and young children are also at risk due to the immaturity of their thermoregulation system, making them more susceptible to dehydration and febrile seizures (Li et al., 2015). Outdoor workers, including construction workers, farmers, and herders, are exposed to prolonged high temperatures, increasing their risk of heat stress and heat-related illnesses (Narocki, 2021). People with chronic diseases such as cardiovascular, respiratory, or metabolic disorders are more likely to experience health deterioration during extreme heat episodes (Mayrhuber et al., 2018). Lastly, individuals with reduced mobility, whether due to physical or cognitive disabilities, face greater difficulties adapting to extreme conditions and accessing healthcare (Lindsay et al., 2023).
Other environmental factors amplify the effects of heatwaves. High humidity reduces the efficiency of sweating, exacerbating heat stress and increasing the risk of hyperthermia (Steadman, 1979). Additionally, atmospheric dust and fine particulate matter during extreme heat periods can worsen respiratory and cardiovascular diseases, particularly asthma and chronic obstructive pulmonary disease (Wills-Karp, 2024).
Given the complexity of interactions between climate and health, it is essential to adopt analytical approaches capable of capturing these multiple dynamics. However, traditional statistical methods often have limitations in accurately assessing these relationships (Marcucci & Verhulst, 2025), necessitating the exploration of more suitable approaches. Artificial intelligence, particularly Machine Learning, provides powerful solutions for improving the analysis of climate impacts on health.
The application of Machine Learning enables the detection and characterization of heatwaves by leveraging algorithms such as the Patient Rule Induction Method (PRIM) and Multivariate Adaptive Regression Splines (MARS) (Masselot et al., 2021), as well as Random Forest (RF) (Huang et al., 2025). These techniques facilitate the identification of critical periods and climate thresholds that may have significant health consequences
Moreover, these methods are also used to predict hospitalizations linked to heatwaves (Galves et al., 2024; Ke et al., 2023). They allow for the integration of delayed and cumulative effects of extreme temperatures on human health, improving forecasting accuracy and facilitating the implementation of early warning systems (Aerens, 2022).
Although several studies have explored the impact of heatwaves on health in West Africa and Senegal, significant gaps remain. For instance, Sambou et al. (Sambou et al., 2020) analyzed heatwaves in Senegal without integrating health data, limiting the assessment of direct links between extreme heat and morbidity. Similarly, Diouf et al. (Diouf et al., 2024) studied the impact of atmospheric dust on these phenomena but did not examine their repercussions on hospitalizations. Additionally, existing research primarily relies on traditional statistical methods, which struggle to capture the complexity of interactions between extreme temperatures, humidity, and health vulnerabilities, posing a major limitation in understanding the real impacts of heatwaves on populations (Sy et al., 2022).
The objective of this study is to analyze the impact of heatwaves on hospitalizations in Matam over the period 2017–2022. Unlike previous studies that have primarily focused on characterizing heatwaves or assessing their climate trends, this research innovates by exploring the links between extreme heat episodes and hospital admissions, incorporating advanced analytical approaches.
More specifically, this study aims to identify critical thresholds of maximum temperature and optimal combinations of temperature and humidity associated with a significant increase in hospital admissions. It also distinguishes itself by integrating socio-demographic variables (age, gender) to better understand the most vulnerable groups and improve the accuracy of predictive models. The selection of explanatory variables is optimized using advanced selection methods to minimize statistical noise and enhance model robustness.
In terms of methodology, this study evaluates the performance of Machine Learning compared to traditional statistical approaches in predicting heatwave-related hospitalizations. Three models are tested: a traditional statistical model and two Machine Learning models. This comparison assesses the extent to which Machine Learning models outperform conventional approaches in predictive accuracy and in capturing nonlinear interactions between climate and health variables.
The scientific contribution of this research lies in the integration of artificial intelligence techniques to model the complex relationships between climate and health - an approach that remains underexplored in the Sahelian context. By providing relevant and actionable results, this study aims to enhance the existing early warning system and guide public health policies, considering the climatic and socio-economic specificities of the Matam region.
2. Materials and Methods
2.1. Study Area
Matam, located in northeastern Senegal (see Figure 1), is one of the hottest regions in the country, with extreme temperatures reaching 44–45 °C between March and June (Sagna et al., 2016; Sow & Gaye, 2024). Its semi-arid climate, characterized by a dominant dry season and low annual precipitation (369 mm/year) (Bodian et al., 2020; Sagna et al., 2016), exacerbates the frequency of droughts, increasing health and economic risks for the population.
The region has a young and rapidly growing population, with 60% under the age of 25 (ANSD, 2023). Access to healthcare remains limited, with a high maternal mortality rate (252 deaths per 100,000 births) and a high prevalence of cardiovascular, respiratory, and infectious diseases (ANSD, 2023). More than half of the population lacks adequate sanitation, and 82.8% of rural households still rely on firewood for cooking.
2.2. Data
The data used in this study come from two main sources:
- Climate data from the Matam meteorological station, established in 1918.
- Health data, collected from Ourossogui Regional Hospital, the region’s largest healthcare facility, receives the highest number of patients and the most severe cases.
2.2.1. Climate Data
The climate data used consists of three relevant variables for detecting heatwaves with potential health impacts. These variables were selected primarily based on their availability over time. The selected variables are daily maximum temperature (TMAX) and minimum relative humidity (RHMIN). These parameters were chosen for their relevance in identifying heatwaves and their potential impact on health. Their use allows for the assessment of heatwave events.
2.2.2. Health Data
Health data were obtained from Ourossogui Hospital through field surveys aimed at digitizing medical records and collecting information on patients and the pathologies associated with heatwaves.
It is worth noting that Ourossogui Hospital is located at the entrance or exit of the city, depending on the direction of travel. It serves as the main healthcare facility in the Matam region and acts as a reference hospital for a vast territory extending from Bakel to Ndioum and from Ranérou to Linguère. As the largest hospital in the region, it offers a wide range of medical services, covering both general medicine and various specialties, thanks to a qualified and dedicated staff.
However, the hospital faces high demand that exceeds its capacity due to the limited space available. This situation restricts its ability to efficiently care for patients, who come not only from across the region but also from neighboring Mauritania.
Due to limited resources, the collected data cover the period from January 2017 to May 2022. A meticulous process of verification and standardization was carried out to ensure the accuracy of diagnoses. One of the main challenges encountered was reading and digitizing handwritten entries in certain hospital registers, which were not always legible. However, some of the hospital’s data had already been digitized, facilitating the processing.
The information collected from patients includes age, sex, date of admission, and primary pathology. A data-cleaning process was undertaken to exclude cases unrelated to climatic conditions, such as road accidents, fractures, scorpion stings, and snake bites.
This selection was carried out in collaboration with medical staff to focus on pathologies potentially correlated with extreme temperatures. The pathologies selected for analysis include cardiovascular diseases, respiratory diseases, metabolic and renal disorders, infectious and febrile illnesses, heat-related conditions, and other severe ailments.
This approach aims to better understand the impact of heatwaves on public health by identifying the most vulnerable population groups and highlighting hospitalization trends associated with extreme temperatures.
2.3. Detection and Characterization of Heatwaves
2.3.1. Identification of Heatwaves
In this study, we used TMAX and the daily maximum heat index (HI) to detect heatwaves.
TMAX is a key indicator due to its direct link with heat stress and health impacts (Schwingshackl et al., 2021). It reflects heat intensity and helps identify periods of extreme heat (Guigma, 2021; Perkins & Alexander, 2013).
HI is used to estimate the perceived temperature by incorporating relative humidity. The equation developed in the studies of Rothfusz (Rothfusz & Headquarters, 1990), based on the work of Steadman (Steadman, 1979), is commonly employed for this calculation. In dry climates, low humidity enhances evaporation and reduces thermal discomfort, whereas in humid climates, high humidity hinders sweat evaporation, exacerbating heat stress (Kaynakli et al., 2014; J. Zhang & You, 2023).
The Rothfusz equation used for HI is:
when R < 13% and 27 °C (80 °F) ≤ T ≤ 49 °C (120 °F), an adjustment is applied to correct the drying effect of the air:
13% is the threshold at which air becomes extremely dry (Wolkoff, 2018), and 95 °F (35 °C) is where human thermoregulation begins to be significantly affected (Rothfusz & Headquarters, 1990; Steadman, 1979).
When R > 85% and 27 °C ≤ T ≤ 30 °C, another correction is applied:
85% is the threshold at which air becomes saturated with humidity, reducing sweat evaporation, and 87 °F (30.5 °C) is a reference point for perceived heat (Verdaguer-Codina et al., 1995).
When T < 27 °C (80 °F), a simplified equation is used:
If HI > 80 °F (27 °C), the full Rothfusz equation is applied to ensure a more precise estimation of the perceived temperature.
Integrating HI into heatwave detection enhances the accuracy of assessments, particularly in environments where humidity plays a critical role in thermal perception. In this study, T represents TMAX, and R represents RHMIN. Assuming the atmospheric moisture content remains constant, an increase in temperature generally leads to a decrease in relative humidity, which typically reaches its minimum at the peak temperature. Based on this assumption, we match the TMAX with the RHMIN to calculate the HI.
The methodological approach is based on the 90th percentile (90thP), calculated over the reference period 1991–2020 and smoothed using a 7-day moving window. A heatwave is thus defined as a period of at least three consecutive days during which the indicator exceeds this threshold.
2.3.2. Heatwave Characterization Variables
After detecting heatwaves, it is essential to extract the most relevant characteristics to understand their impact on human health. These variables help identify key indicators that influence physiology and heat-related pathologies. Table 1 defines the main variables used to characterize these events:
The identification of these variables is based on their ability to capture climatic fluctuations that may impact human health. They help assess the duration, intensity, and dynamics of heatwaves and understand their pathophysiological effects.
Heatwave Presence (hw): This variable is essential for identifying periods when the temperature exceeds a critical threshold for several consecutive days. Studies have shown that prolonged heatwaves are strongly associated with increased mortality and morbidity, particularly among the elderly and individuals with chronic diseases (Y. Zhang et al., 2024). Prolonged exposure to high temperatures increases heat stress, potentially leading to cardiovascular decompensations and metabolic complications (Gasparrini et al., 2012).
Duration (D): A key factor influencing health risks. Prolonged exposure exacerbates heat stress, increasing dehydration and exhausting thermoregulation mechanisms (McCubbin et al., 2024). Studies (Thongprayoon et al., 2020) have demonstrated that heatwaves lasting more than five days significantly increase the risk of hospitalization for acute kidney failure and cardiovascular diseases, mainly due to fluid loss and vascular dysfunction.
Mean Intensity (): Reflects the overall thermal burden experienced by the body during a heatwave (Pantavou et al., 2024). A high can lead to severe hyperthermia, heatstroke, and heat exhaustion (Marchand & Gin, 2022).
Peak Temperature (): Represents a critical risk factor (Deng et al., 2025). A sudden rise in temperature places significant pressure on the cardiovascular system, increasing the risk of strokes and myocardial infarction (Rowland et al., 2020). A maximum temperature exceeding the seasonal threshold by 5°C is correlated with an increase in hospital admissions for acute coronary syndromes (Kuźma et al., 2021).
Daily Variability of Excess Temperatures (): Rapid fluctuations in temperature during an extreme event can worsen physiological stress (Vermandele et al., 2024). Large temperature variations are associated with metabolic dysfunction and an increased risk of electrolyte imbalances (Smoll, 2024). The human body struggles to adapt to sudden temperature changes, which may worsen respiratory and neurological conditions (McGeehin & Mirabelli, 2001).
Cumulative Intensity (): Measures heat accumulation throughout the event. The higher this value, the greater the health impact, as the body's compensatory mechanisms become progressively exhausted (Ioannou et al., 2021). Research (Bobb et al., 2014) has shown a correlation between cumulative intensity and increased hospital admissions for chronic respiratory diseases, mainly due to prolonged airway inflammation.
Rate of Onset (RO): Quantifies the speed at which the temperature reaches its peak. A sudden increase in heat leaves little time for physiological adaptation, increasing the risk of acute heat stress and respiratory distress (Sawka et al., 2011). Interviews with healthcare personnel confirmed that this phenomenon is particularly dangerous for individuals with pre-existing conditions.
Rate of Decline (RD): A rapid drop in temperature after the peak can also be harmful. A sudden decrease disrupts physiological regulation mechanisms, increasing the risk of neurovascular disorders (Cheshire, 2016). During a heatwave, the body gradually develops thermal tolerance and adjusts its physiological responses to cope with extreme conditions. However, a sudden drop in temperature can cause abrupt imbalances (Hanna & Tait, 2015).
The health impacts of heatwaves do not always occur immediately but can extend several days after the event (Woodman & Mayner, 2016). To better understand these delayed effects, we incorporated lag variables, which track hospitalization trends from 1 to 7 days after a heatwave (, where x represents the heatwave variable and k is the lag in days). Studies (Vandal, 2022) indicate that health consequences peak between Day +3 and Day +5 after a heatwave, as pathophysiological complications take time to manifest. Other research (Anderson & Bell, 2009; Hughes et al., 2024) confirms that heat stress triggers delayed health effects, particularly affecting cardiovascular and respiratory diseases.
2.4. Selection of Explicit Variables
Several studies have demonstrated that age and gender are key vulnerability factors in the face of heatwaves (Alonso & Renard, 2020; Arsad et al., 2022; Kollanus et al., 2021; Trahan et al., 2023). Our field surveys and interviews with healthcare personnel confirmed these observations:
- Differences in Hospital Attendance: Although men generally visit healthcare facilities more frequently, heatwaves lead to an increase in female consultations, suggesting higher vulnerability among women;
- At-Risk Groups: Infants and dependent elderly individuals, despite benefiting from family protection, remain the most vulnerable to the effects of heatwaves.
To integrate these findings into our analysis, we added additional variables, including:
- Number of female patients consulted per day;
- Number of infants (0–4 years) consulted per day;
- Number of fragile seniors (65-79 years) consulted per day;
- Number of very elderly and dependent seniors (80+ years) consulted per day.
These variables enhance predictions by accounting for differential vulnerabilities among exposed populations.
A total of 68 climate and vulnerability-related variables were identified. However, not all of them are necessarily relevant for predictive model construction. To reduce overfitting and improve model robustness, we applied the Least Absolute Shrinkage and Selection Operator (LASSO) method.
Developed by Robert Tibshirani (1996), this variable selection technique applies an L1 penalty to regression coefficients, automatically eliminating non-significant variables and reducing model complexity.
The LASSO is defined as follows:
where:
- : the dependent variable (observed values),
- : the matrix of explanatory variables,
- : les coefficients des variables explicatives,
- λ: the regularization parameter, which controls the strength of the penalty,
- n: the number of observations,
- p: the total number of explanatory variables.
For interpretation, if λ = 0, the LASSO estimator is equivalent to a classical linear regression without regularization. If λ is large, many coefficients will be reduced to zero, leading to an automatic selection of the most relevant variables.
To ensure that the scale of the variables does not influence the selection, a standardization of the explanatory variables was applied. Then, cross-validation was performed to optimize the parameter λ by selecting the value that minimizes the prediction error. This process balances the minimization of the mean squared error and the penalization of coefficients, thereby ensuring a more reliable model.
Once λ was optimized, only variables with nonzero coefficients were retained as the most influential in explaining hospitalizations related to heatwaves. Furthermore, the selected variable was prioritized along with its 7 lags to facilitate the interpretation of the delayed effects of heatwaves on hospital admissions.
2.5. Optimization and Evaluation Method of Models
After selecting the most relevant explanatory variables, the dataset was divided into two subsets:
- Training set (80%): Used to fit and train the models;
- Test set (20%): Used to evaluate model performance.
To ensure a reliable model evaluation and avoid overfitting, a 10-fold cross-validation approach was implemented. This method divides the data into 10 subsets (using 9 for training and 1 for testing, repeated 10 times), which helps reduce variance in performance estimates by testing the model on multiple sub-samples.
After this phase, model hyperparameters were optimized using Grid Search combined with cross-validation to fine-tune the key parameters and maximize predictive performance.
Model performance was evaluated using three metrics:
- Coefficient of Determination (R²): Measures the proportion of variance in the observed data explained by the model (Pearson & Henrici, 1997).
- Root Mean Square Error (RMSE): Indicates the dispersion of prediction errors, heavily penalizing large errors (Gauss, 1823).
- Mean Absolute Error (MAE): Computes the average magnitude of absolute differences between predicted and observed values, offering a direct interpretation of average error magnitude (Gibbs, 1902).
The combined use of these metrics (Table 2) provides comprehensive insights into model performance. Specifically, R² assesses the overall explanatory power and global fit of the model (Nagelkerke, 1991). RMSE, by emphasizing larger errors, is especially valuable for identifying significant deviations and understanding error dispersion. MAE, less sensitive to outliers, provides a robust measure of average error magnitude (Willmott & Matsuura, 2005). This combination aligns with best practices recommended in predictive modeling literature, enabling effective evaluation of both explanatory capability and error distribution (Willmott et al., 2012; Willmott & Matsuura, 2005).
Bootstrapping was used to estimate the variability and robustness of the model performance metrics while avoiding reliance on single-point estimates. This method is based on resampling with replacement, allowing the generation of multiple independent subsamples from the original dataset. This approach mitigates dependency on a single training sample and reduces biases associated with data variability, ensuring a more reliable estimation of model performance. We applied 1000 iterations to ensure stable convergence of the estimates, in accordance with existing study recommendations (Grunkemeier & Wu, 2004; Martin, 1990; Y.F. Chan & M.S. Lee, 2001). At each iteration, a new sample was drawn with replacement, and performance metrics were recalculated. This process generated an empirical distribution, enabling the estimation of 95% confidence intervals (CIs) for each metric.
The primary advantage of bootstrapping is its ability to assess model robustness in response to data variations. A wide confidence interval indicates increased sensitivity to sample fluctuations, suggesting a more unstable model or a tendency toward overfitting (Peng & Nagata, 2020). Conversely, a narrow confidence interval reflects better generalization of the model to new data.
Finally, a variable importance analysis is conducted to identify the key factors influencing hospitalizations. This analysis helps determine the variables that have the greatest impact on hospital admissions.
We selected two machine learning models, Random Forest (RF) and XGBoost (XGB), as well as a statistical model, namely Generalized Additive Models (GAM).
RF model relies on an ensemble of decision trees trained on random samples and subsets of variables. This approach reduces variance and mitigates the risk of overfitting while providing variable importance measures to facilitate interpretation (Breiman, 2001).
XGB employs a gradient boosting method with regularization (L1/L2) and internal optimizations (parallelization, memory management). It is fast and often highly performant, making it a popular choice in Data Science competitions (Chen & Guestrin, 2016).
GAM (Hastie & Tibshirani, 1986) was chosen for its ability to model nonlinear relationships by incorporating temporal smoothing effects using 50 splines, as in the work of Wood (Wood, 2004). A Poisson distribution with a logarithmic link function was used, making it suitable for count data such as hospitalizations (Ibrahim & Mongare, 2024; Kamoljitprapa & Leelasilapasart, 2024).
3. Results
The TMAX index was used to identify heatwaves without considering the effect of humidity. This approach allows for a more pronounced observation of extreme event variability. In Figure 2, a higher frequency and greater variability in intensity and duration are observed, with a total of 30 events lasting between 3 and 14 days.
The longest episode, which occurred from March 2 to March 15, 2018, lasted 14 days with maximum temperatures ranging between 42.6 °C and 45.5 °C, accompanied by relatively low humidity levels (20–25%). These conditions suggest an interaction with dust episodes, as indicated in the study by Diouf et al. (Diouf et al., 2024), which could exacerbate respiratory diseases.
The most intense event, recorded in March 2020, lasted five days with a maximum intensity of 5.56 °C and temperatures reaching up to 48 °C. The events occur more frequently, with a notable concentration between March and June, as well as in October and November. These periods coincide with seasonal transitions, where extreme heat combined with dry conditions could increase the risk of dehydration, heatstroke, and strokes, particularly among young children and outdoor workers
The analysis of heatwaves based on the HI index (Figure 3) identifies 11 events meeting the defined criteria, with a notable intensification in recent years. The duration of heatwaves detected using this index ranges from 3 to 9 days.
The most intense event occurred in January 2021, lasting four days, with a maximum intensity of 7.45 °C and peak TMAX values between 37 °C and 41 °C, accompanied by humidity levels ranging from 16% to 23%.
The most affected months are those characterized by residual humidity, particularly January, February, March, August, September, November, and December. This distribution suggests that persistent humidity after the rainy season influences thermal perception.
These results highlight the low frequency of heatwaves detected using the HI index. This can be understood in a Sahelian region like Matam, where humidity levels are generally lower than in the western regions of Senegal.
Additionally, analyzing the most extreme heatwaves using TMAX helps identify the longest and most intense episodes, providing key insights for assessing associated health risks (see Figure 4). The longest event, which occurred from March 2 to March 15, 2018, recorded an intensity of 1.54 °C with TMAX values ranging between 42.6 °C and 45.5 °C and low humidity levels (10–15%). Meanwhile, the most intense heatwave, recorded from March 4 to March 8, 2020, reached an intensity of 5.56 °C, with TMAX peaking at 48 °C, and was characterized by a high rate of decline (RD) of 6.1 °C/day.
In Figure 5, we illustrate the most intense and longest heatwave detected using the HI index. With this threshold, the longest event lasted 9 days, from March 2 to March 10, 2018, with an Imax of 1.2 °C and an Icum of 4.6 °C.
The most intense heatwave was recorded from 26 December to 31 December 2020, lasting 7 days, with an Imax of 4 °C and a sharp decline in temperature, characterized by a RD of 2.5 °C/day.
The impact of heatwaves on health can be assessed through hospitalizations recorded during the study period. A descriptive analysis of the collected data by age group and gender helps identify the most affected populations.
Figure 6(a) shows that adults aged 18 to 44 years are the most frequently hospitalized (1218 patients), followed by those aged 45 to 64 years (774 patients) and 65 to 79 years (622 patients). This trend can be explained by the increased exposure of young adults and workers to challenging environmental conditions (outdoor work, limited access to preventive healthcare, precarious living conditions), as well as the necessity to travel long distances to access schools or administrative services.
Unlike infants and dependent elderly individuals, these groups receive less healthcare and social protection. Hospitalizations of dependent elderly individuals (80+ years) and young children (0–4 years, 162 patients) are less frequent, despite their higher physiological vulnerability. This lower representation may be due to stronger family care, underreporting of cases, or high mortality before hospital admission. Additionally, their lower proportion in the population could also explain this trend, as highlighted by the Fifth General Population and Housing Census (RGPH-5) conducted by the National Agency for Statistics and Demography (ANSD, 2023).
Regarding the gender distribution (Figure 6(b)), men (2045 patients) were hospitalized more frequently than women (1627 patients). This disparity can be attributed to their overrepresentation in occupations with high heat exposure risks (agriculture, transportation, informal trade, and construction) and a tendency to delay seeking preventive care, often leading to consultations at more advanced stages of illness. Although women are biologically more vulnerable, they are more likely to access healthcare earlier, which could explain their lower proportion in recorded hospitalizations.
The application of LASSO variable selection revealed that and its lagged variables are the most predictive. Therefore, these variables were selected as the main climatic features (TMAX-based events), complementing the already-defined demographic vulnerability variables.
The model evaluation presented in Table 3 highlights differences in predictive performance. RF emerges as the most effective model, with an R² ranging from 0.51 to 0.72, a RMSE between 0.91 and 1.38, and a MAE between 0.74 and 0.89. XGB follows closely, with an R² between 0.46 and 0.72, RMSE between 0.91 and 1.46, and MAE between 0.74 and 0.90, indicating a similar level of accuracy but with slightly higher variability. In contrast, GAM demonstrate lower performance, with an R² ranging from 0.33 to 0.48, RMSE between 1.22 and 1.50, and MAE between 0.89 and 0.98, confirming its limited ability to capture the complex interactions between heatwaves and hospital admissions.
The 95% CI obtained through bootstrapping reveal different levels of variability among the models. RF has a CI width of 0.21, indicating good stability, although some variations exist depending on the data sampling. XGB has a slightly wider CI (0.26 on R²), suggesting a higher sensitivity to data variations. On the other hand, GAM has a narrower CI (0.15 on R²), but this does not indicate greater robustness. Instead, it reflects rigidity in modeling, limiting its adaptability to nonlinear dynamics.
These results confirm that machine learning models outperform GAM. RF stands out for its robustness and balance between accuracy and stability, making it the best choice for predicting heatwave-related hospitalizations. XGB remains a competitive alternative, with performance close to RF, though slightly more sensitive to data variations. GAM, while useful for interpretability, struggles to capture the complexity of climate-health interactions, reducing its predictive relevance.
We observed that only 11 heatwave events were detected using HI, and the application of LASSO identified a limited number of explanatory variables. Furthermore, when applying the models, all R² values were negative, and the RMSE and MAE values were high, indicating that the model fails to adequately explain the relationship between hospitalizations and HI-based heatwaves.
This limitation justifies the use of TMAX, which provides a relatively better explanatory capacity. This difference could be attributed to the short study period, which may have affected the robustness of the HI-based analysis.
In Figure 7, the immediate effect of I_cum on heatwaves shows a positive coefficient (0.0203), suggesting a possible increase in hospitalizations. However, this result remains non-significant (p = 0.1117), preventing any firm conclusion regarding the immediate impact of heatwaves on hospital admissions.
Regarding delayed effects, only Lag5 is significant (p = 0.0361), with a negative coefficient (−0.0334), indicating a decrease in hospitalizations five days after the heatwave event. This result is unexpected. The other lags (Lag1 to Lag4, Lag6, and Lag7) are not significant (p > 0.05), meaning they do not provide robust evidence of a delayed effect of heatwaves on hospitalizations.
The fact that only Lag5 is significant with a negative effect could also suggest methodological biases. These findings emphasize the need to explore machine learning approaches, which have already demonstrated higher predictive performance
In Figure 8, the increase in the mean squared error (%IncMSE) was used to measure the impact of each variable on the model’s performance: a higher value indicates a greater contribution of the variable to model accuracy. The results show that the immediate effect of heat on hospitalizations is relatively low, whereas delayed effects are more pronounced, peaking on the third day (Lag3), followed by a slight decrease on the fourth day (Lag4) and then another increase on the fifth day (Lag5).
-
Lag3 is the most influential variable (%IncMSE = 183.52), indicating a rise in hospitalizations three days after an extreme heat event.
- o
- This trend can be explained by behavioral and physiological factors.
- o
- Based on interviews with healthcare staff, during a heatwave and the day after, vulnerable individuals hesitate to leave their homes or visit hospitals due to extreme temperatures.
- o
- Many try to manage their symptoms at home or physically struggle to travel, leading to a delay in hospitalizations.
- o
- As a result, those who should have sought medical attention earlier end up requiring hospitalization on the third day.
- Lag4 (%IncMSE = 157.73) shows a slight decrease in hospitalizations, likely because some patients had already been admitted on the previous day.
-
Lag5 (%IncMSE = 172.32) reveals another increase in hospitalizations.
- o
- This rebound effect could be due to the delayed onset of heat-related illnesses, particularly cardiovascular diseases, which can take around 72 hours to cause severe complications requiring hospitalization.
- o
- Heat-related cardiovascular conditions, such as myocardial infarction and stroke, often result from prolonged physiological stress, reaching a critical threshold after several days.
- Beyond the fifth day, the impact of heatwaves gradually diminishes, with Lag6 (%IncMSE = 93.99) and Lag7 (%IncMSE = 59.55) playing a less significant role in predicting hospitalizations.
- The critical period for increased hospital admissions is between the third and fifth day after a heatwave.
- Immediate heat exposure (, %IncMSE = 59.80) and early effects (Lag1 = 69.31, Lag2 = 75.77) have less influence, confirming that delayed effects of heatwaves are more pronounced than immediate effects.
These findings highlight the importance of monitoring hospital admissions for at least five days following a heatwave and suggest that health interventions should not only focus on immediate responses but also consider delayed health risks.
Figure 9 shows the importance of various variables associated with heatwaves detected via TMAX, expressed in terms of Gain, a key metric indicating the relative contribution of each variable to prediction improvement for the XGB model. Results reveal that Lag3 and Lag5 are the most critical, with Gain values of 0.021 and 0.022, respectively. This suggests that hospitalizations increase three and five days after a heatwave episode. This delay can be explained by a pathophysiological process in which heat stress leads to delayed complications, as illustrated by the case of RF, which performs better. According to the XGB model, the immediate effect of heat on hospitalizations appears relatively weak, as indicated by the lower Gain values for immediate cumulative index () as well as Lag1 and Lag2, suggesting that hospital admissions do not surge significantly on the day of or the day after the heatwave. The contribution of variables gradually decreases after the fifth day, with lower values for Lag6 and Lag7, indicating that the delayed effects of heatwaves diminish beyond this critical period.
The evaluation of the three models highlights significant differences in terms of accuracy and ability to capture variations in hospital admissions related to heatwaves. The GAM model, although based on a flexible parametric approach, shows significantly lower performance, struggling to adequately represent nonlinear effects and complex interactions between climatic and health variables. The analysis of the model's coefficients indicates that the immediate effect of heatwaves on hospitalizations is limited, and only Lag5 is significant, with a surprisingly negative influence.vThese results suggest that GAM does not effectively capture the temporal dynamics of hospital admissions. In contrast, the machine learning models, RF and XGB, demonstrate significantly better performance. RF achieves an R² of [0.51; 0.72], with an RMSE of [0.91; 1.38] and an MAE of [0.74; 0.89] at a 95% CI, making it the best-performing algorithm in this study. Its ability to capture nonlinear relationships and delayed heatwave effects allows it to better explain variations in hospitalizations. XGB closely follows, and although slightly less accurate than RF, it remains a robust tool, particularly useful for interpreting the most influential variables. Analysis of variable importance indicates that Lag3 and Lag5 are the most critical predictors, confirming that delayed effects of heatwaves on hospitalizations are more pronounced than immediate effects.
Figure 10 highlights the joint evolution of TMAX and hospital admissions over 7 days before and 14 days after a heatwave event (from June 15 to June 21, 2019), during which was equal to 14 °C. During this period, several temperature peaks reaching 46 to 48 °C were recorded, significantly increasing thermal stress on the population. Examination of the curves reveals a correlation between high temperatures and hospital admissions. Indeed, the blue curve representing hospital admissions shows an increase a few days following periods of extreme heat. This trend suggests a delayed effect of heatwaves on hospitalizations, potentially due to the gradual worsening of underlying conditions and the slow physiological response of patients exposed to heat. This delayed effect is consistent with observations by Kenny et al. (Kenny et al., 2010), who reported that heat stress could trigger medical complications within a period varying from one to five days following exposure.
The trend in hospital admissions also indicates that certain peaks occur after the hottest days, which could be explained by the behavior of exposed populations. Vulnerable individuals might delay seeking medical care until their symptoms become severe, possibly due to long distances to healthcare facilities or varying perceptions of risk among different social groups. This observation is particularly concerning for outdoor workers and elderly populations, whose ability to adapt to heat is limited.
Finally, 6 to 7 days after the heatwave, a decrease in hospital admissions is observed in parallel with the gradual decline in temperatures. This suggests a return to more physiologically tolerable conditions, leading to stabilization in hospital admissions. These results confirm the importance of establishing surveillance and early warning systems, which can anticipate hospitalization peaks associated with heatwaves and implement preventive measures tailored to at-risk populations.
These observations concretely illustrate the impact of heatwaves on hospital morbidity, reinforcing the need to integrate climate parameters into health management strategies.
4. Discussion
This study highlighted a correlation between rising extreme temperatures and increased hospital admissions. The findings demonstrated a clear relationship between extreme temperatures and hospital attendance rates. Specifically, a delayed effect was observed, with heatwave-related hospital admissions peaking several days after the heat event itself, possibly due to symptom worsening or delayed care-seeking behavior influenced by distance to healthcare facilities and varied risk perception among social groups. This delayed response is especially concerning for outdoor workers and elderly populations, whose adaptive capacities to heat stress are limited.
Machine learning models outperformed traditional approaches, with RF achieving the highest accuracy (R² = [0.51; 0.72]) in capturing nonlinear relationships and delayed effects. XGB also demonstrated strong predictive capabilities. Model robustness was assessed using bootstrapping (1000 iterations) to estimate 95% CI, confirming RF’s stability (CI = 0.21) compared to XGB (CI = 0.26). While GAM exhibited a narrower CI (0.15), it reflected structural rigidity rather than better robustness, limiting its ability to model complex interactions.
These findings align with previous research: Kenny et al. highlighted delayed medical complications from heat stress, while Amegah et al. (Amegah et al., 2016) and Deng et al. (Deng et al., 2025) confirmed increased hospitalizations due to heat-related conditions such as heatstroke, dehydration, and cardiovascular complications.
Distinct regional characteristics emerged, particularly comparing Matam and Dakar. Unlike Dakar, where humidity exacerbates the sensation of heat, Matam experiences dry heat, potentially accelerating dehydration and worsening existing health conditions. Furthermore, limited healthcare infrastructure access in Matam amplifies vulnerability and complicates prompt healthcare interventions, exacerbating the delayed health impacts observed.
Physiologically, cardiovascular and respiratory conditions triggered by heat stress may require latency periods before hospital admission becomes necessary. Behavioral factors, including reluctance to seek care during extreme heat to avoid additional exposure, may also delay medical interventions. Limited healthcare infrastructure and underestimation of heat-related risks by local populations contribute further to these delays.
Methodologically, integrating demographic vulnerability factors (number of women, infants, and dependent elderly individuals) and temporal lag variables enhanced model accuracy, emphasizing the critical need to consider demographic factors and temporal dynamics in heat-health studies, elements often overlooked in previous research.
However, the study acknowledges limitations: potential inaccuracies or diagnostic errors due to handwritten hospital records, and the exclusion of environmental factors such as air pollution or Saharan dust, which could amplify heatwave health impacts.
These findings underline the importance of establishing effective surveillance and early warning systems to anticipate hospitalization peaks linked to heatwaves. Integrating climate forecasts into health response plans would enable better management of heat-related health risks. Preventive measures should specifically target vulnerable populations—elderly, children, and outdoor workers—by ensuring adequate hydration, improving infrastructure ventilation and air conditioning, and training healthcare providers for emergency situations.
Hospitals must reinforce emergency preparedness by stocking essential supplies (water, rehydration solutions, electrolytes), improving facility ventilation and air conditioning, and training healthcare staff. Targeted interventions for vulnerable groups, particularly the elderly, children, and outdoor workers, should be prioritized.
Future research directions include extending studies to other health facilities and regions to allow comparative analyses. Advanced Deep Learning techniques could further enhance prediction accuracy by integrating complex datasets and modeling nonlinear interactions more effectively.
5. Conclusions
This study highlighted a correlation between increased extreme temperatures and hospital attendance through combined climate modeling and machine learning predictive approaches. The results indicate a delayed relationship between rising extreme temperatures and hospital admissions, with hospitalization peaks occurring between three and five days after heatwave events. This latency may be due to the gradual worsening of underlying health conditions, delays in symptom recognition, or delayed health-seeking behavior influenced by geographical barriers and varying perceptions of risk.
Evaluation of predictive models revealed that machine learning algorithms (RF and XGB) outperformed the classical statistical model (GAM) in terms of accuracy and capturing complex interactions between climate and health variables. The RF model achieved the best performance with an R² of [0.51; 0.72], demonstrating superior predictive capabilities compared to traditional statistical models. The robustness of these results was further validated using bootstrapping, which provided confidence intervals for performance metrics, reducing dependence on specific training samples and confirming the stability of model predictions.
These findings underscore the importance of improving surveillance and early warning systems for heatwaves to better anticipate their impacts on public health. Integrating weather forecasts into health strategies would enhance hospital preparedness and optimize health service responses during heatwave events. Future studies should also focus on refining predictive models by integrating additional climate-health interactions and ensuring the generalizability of findings across diverse settings.
In future research, incorporating additional environmental factors such as air pollution, wind, and others could further refine predictions. Moreover, expanding the study to include a greater number of healthcare facilities and integrating vulnerability factors such as the availability of healthcare structures, access to potable water, energy access, vegetation cover, hydrology, mobile network coverage, poverty dimension, and other socioeconomic indicators would enhance the analysis. The use of advanced Deep Learning techniques could also improve prediction accuracy by effectively modeling complex and nonlinear interactions. Additionally, it would be relevant to extend the study to other regions particularly vulnerable to extreme heat, to gain a more comprehensive understanding of its health and climatic impacts.
Author Contributions
Conceptualization, Mory Toure, Wassila Thiaw, Ibrahima Sy, Papa Ngor Ndiaye, Daouda Badiane and Amadou Thierno Gaye; Data curation, Mory Toure and Ousmane Gueye; Formal analysis, Mory Toure, Endalkachew Bekele and Md abul Ehsan Bhuiyan; Investigation, Mory Toure, Ibrahima Sy and Ousmane Gueye; Methodology, Mory Toure, Endalkachew Bekele, Ousmane Gueye, Md abul Ehsan Bhuiyan, Ibrahima Diouf, Papa Ngor Ndiaye, Marie Jeanne Sambou, Daouda Badiane, Adama Faye and Ousmane Ndiaye; Project administration, Mory Toure, Wassila Thiaw, Ibrahima Sy, Daouda Badiane and Ousmane Ndiaye; Resources, Wassila Thiaw and Ibrahima Sy; Software, Mory Toure; Supervision, Wassila Thiaw, Ousmane Gueye, Ibrahima Diouf, Aida Diongue Niang, Daouda Badiane, Adama Faye and Ousmane Ndiaye; Validation, Wassila Thiaw, Ibrahima Sy, Endalkachew Bekele, Ousmane Gueye, Md abul Ehsan Bhuiyan, Ibrahima Diouf, Marie Jeanne Sambou, Aida Diongue Niang, Daouda Badiane, Adama Faye, Ousmane Ndiaye and Amadou Thierno Gaye; Visualization, Mory Toure; Writing—original draft, Mory Toure and Ibrahima Diouf; Writing—review & editing, Mory Toure, Wassila Thiaw, Ibrahima Sy, Endalkachew Bekele, Ousmane Gueye, Md abul Ehsan Bhuiyan, Ibrahima Diouf, Marie Jeanne Sambou, Aida Diongue Niang, Daouda Badiane, Adama Faye and Ousmane Ndiaye.
Funding
This research received no external funding.
Data Availability Statement
The climate data used in this study are publicly available through the Senegal Meteorological Service database. The health data are accessible from the registers of the Ourossogui Regional Hospital but require prior authorization from the Senegalese Ministry of Health due to privacy and ethical restrictions, which the authors have committed to and signed before data collection.
Acknowledgments
We thank UCAR and NOAA for their support in data collection, the CSE for technical and logistical support through the BRCCAA, the Senegalese Ministry of Health for granting the necessary authorizations, the Ourossogui Hospitals for their assistance and cooperation, and ANACIM for facilitating access to climate data.
Conflicts of Interest
The authors declare no conflicts of interest.
References
- Acosta, D.; Barrow, A.; Mahamadou, I.S.; Assuncao, V.S.; Edwards, M.E.; McKune, S.L. Climate change and health in the Sahel : A systematic review. Royal Society Open Science 2024, 11, 231602. [Google Scholar] [CrossRef] [PubMed]
- Aerens, N. (2022). ÉTUDE DES VULNÉRABILITÉS SANITAIRES AUX ÉVÉNEMENTS MÉTÉOROLOGIQUES EXTRÊMES ET ÉLABORATION DE SEUILS D’ALERTE POUR LE QUÉBEC. https://policycommons.net/artifacts/3809946/etude-des-vulnerabilites-sanitaires-aux-evenements-meteorologiques-extremes-et-elaboration-de-seuils-dalerte-pour-le-quebec/4615862/.
- Alho, A.M.; Oliveira, A.P.; Viegas, S.; Nogueira, P. Effect of heatwaves on daily hospital admissions in Portugal, 2000–2018: An observational study. The Lancet Planetary Health 2024, 8, e318–e326. [Google Scholar] [CrossRef]
- Alonso, L.; Renard, F. A Comparative Study of the Physiological and Socio-Economic Vulnerabilities to Heat Waves of the Population of the Metropolis of Lyon (France) in a Climate Change Context. International Journal of Environmental Research and Public Health 2020, 17, 3. [Google Scholar] [CrossRef] [PubMed]
- Amegah, A.K.; Rezza, G.; Jaakkola, J.J.K. Temperature-related morbidity and mortality in Sub-Saharan Africa : A systematic review of the empirical evidence. Environment International 2016, 91, 133–149. [Google Scholar] [CrossRef] [PubMed]
- Anderson, B.G.; Bell, M.L. Weather-related mortality : How heat, cold, and heat waves affect mortality in the United States. Epidemiology 2009, 20, 205–213. [Google Scholar] [CrossRef]
- ANSD. (2023). Cinquième Recensement général de la Population et de l’Habitat (RGPH-5). https://www.ansd.sn/recensement/rgph-5-2023. https://www.ansd.sn/recensement/rgph-5-2023.
- Arsad, F.S.; Hod, R.; Ahmad, N.; Ismail, R.; Mohamed, N.; Baharom, M.; Osman, Y.; Radi, M.F.M.; Tangang, F. The Impact of Heatwaves on Mortality and Morbidity and the Associated Vulnerability Factors : A Systematic Review. International Journal of Environmental Research and Public Health 2022, 19, 23. [Google Scholar] [CrossRef]
- Ayal, D.Y. Climate change and human heat stress exposure in sub-Saharan Africa. CABI Reviews 2021, PAVSNNR202116049. [Google Scholar] [CrossRef]
- Barry, J. (2012). The politics of actually existing unsustainability : Human flourishing in a climate-changed, carbon constrained world. Oxford University Press. https://academic.oup.com/book/2057.
- Berry, P.; Ebi, K.L.; Enright, P. (2024). Developing health system resilience for the climate crisis. In Handbook of Health System Resilience (p. 307-328). Edward Elgar Publishing. https://www.elgaronline.com/edcollchap/book/9781803925936/book-part-9781803925936-31.xml.
- Bobb, J.F.; Obermeyer, Z.; Wang, Y.; Dominici, F. Cause-Specific Risk of Hospital Admission Related to Extreme Heat in Older Adults. JAMA 2014, 312, 2659–2667. [Google Scholar] [CrossRef]
- Bodian, A.; Diop, L.; Panthou, G.; Dacosta, H.; Deme, A.; Dezetter, A.; Ndiaye, P.M.; Diouf, I.; Vischel, T. Recent Trend in Hydroclimatic Conditions in the Senegal River Basin. Water 2020, 12, 2. [Google Scholar] [CrossRef]
- Breiman, L. Random Forests. Machine Learning 2001, 45, 5–32. [Google Scholar] [CrossRef]
- Chen, T.; Guestrin, C. XGBoost : A Scalable Tree Boosting System. Proceedings of the 22nd ACM SIGKDD International Conference on Knowledge Discovery and Data Mining 2016, 785–794. [Google Scholar] [CrossRef]
- Cheng, J.; Xu, Z.; Bambrick, H.; Prescott, V.; Wang, N.; Zhang, Y.; Su, H.; Tong, S.; Hu, W. Cardiorespiratory effects of heatwaves : A systematic review and meta-analysis of global epidemiological evidence. Environmental research 2019, 177, 108610. [Google Scholar] [CrossRef] [PubMed]
- Cheshire, W.P. Thermoregulatory disorders and illness related to heat and cold stress. Autonomic Neuroscience 2016, 196, 91–104. [Google Scholar] [CrossRef]
- Clark, A.; Grineski, S.; Curtis, D.S.; Cheung, E.S.L. Identifying groups at-risk to extreme heat : Intersections of age, race/ethnicity, and socioeconomic status. Environment International 2024, 191, 108988. [Google Scholar] [CrossRef] [PubMed]
- Deng, X.; Zhao, L.; Xiao, C.; Dai, R.; Xu, Q.; Yao, Y.; Liang, C.; Yao, L.; He, D. Heatstroke characteristics and meteorological conditions in Hefei, China : Thresholds and driving factors. BMC Public Health 2025, 25, 352. [Google Scholar] [CrossRef]
- Diouf, S.; Sambou, M.-J. G.; Deme, A.; Fall, P.; Gueye, D.; Mignot, J.; Janicot, S. Dust Content Modulation and Spring Heat Waves in Senegal (2003–2022). Atmosphere 2024, 15, 12. [Google Scholar] [CrossRef]
- D’Ippoliti, D.; Michelozzi, P.; Marino, C.; de’Donato, F.; Menne, B.; Katsouyanni, K.; Kirchmayer, U.; Analitis, A.; Medina-Ramón, M.; Paldy, A.; Atkinson, R.; Kovats, S.; Bisanti, L.; Schneider, A.; Lefranc, A.; Iñiguez, C.; Perucci, C.A. The impact of heat waves on mortality in 9 European cities : Results from the EuroHEAT project. Environmental Health 2010, 9, 37. [Google Scholar] [CrossRef]
- Galves, V.L.; Cataldi, M.; Souza, J. (2024). Developing a Multivariate System for Predicting and Mitigating the Health Effects ofHeat waves in Niterói, Rio de Janeiro. 2014. EGU General Assembly Conference Abstracts. [CrossRef]
- Gamble, J.L.; Hurley, B.J.; Schultz, P.A.; Jaglom, W.S.; Krishnan, N.; Harris, M. Climate Change and Older Americans : State of the Science. Environmental Health Perspectives 2013, 121, 15–22. [Google Scholar] [CrossRef]
- Gasparrini, A.; Armstrong, B.; Kovats, S.; Wilkinson, P. The effect of high temperatures on cause-specific mortality in England and Wales. Occupational and Environmental Medicine 2012, 69, 56–61. [Google Scholar] [CrossRef]
- Gauss, C.-F. (1823). Theoria combinationis observationum erroribus minimis obnoxiae. Henricus Dieterich. https://books.google.sn/books?hl=en&lr=&id=hrZQAAAAcAAJ&oi=fnd&pg=PA1&dq=Theoria+combinationis+observationum+erroribus+minimis+obnoxiae&ots=rX4a-bKiBZ&sig=lhBc36Vo858OKTf8XPbxeSgFTiQ&redir_esc=y#v=onepage&q=Theoria%20combinationis%20observationum%20erroribus%20minimis%20obnoxiae&f=false.
- Giannini, A. Mechanisms of Climate Change in the Semiarid African Sahel : The Local View; 2010. [Google Scholar] [CrossRef]
- Gibbs, J.W. Elementary principles in statistical mechanics : Developed with especial reference to the rational foundations of thermodynamics; C. Scribner’s sons, 1902. [Google Scholar]
- Grunkemeier, G.L.; Wu, Y. Bootstrap resampling methods : Something for nothing? The Annals of Thoracic Surgery 2004, 77, 1142–1144. [Google Scholar] [CrossRef]
- Guigma, K.H. (2021). Heat Waves in the West African Sahel : Nature, Drivers and Predictabilty [PhD Thesis, University of Sussex]. https://sussex.figshare.com/articles/thesis/Heat_waves_in_the_West_African_Sahel_nature_drivers_and_predictabilty/23482199/1/files/41191130.pdf.
- Hanna, E.G.; Tait, P.W. Limitations to Thermoregulation and Acclimatization Challenge Human Adaptation to Global Warming. International Journal of Environmental Research and Public Health 2015, 12, Article 7. [Google Scholar] [CrossRef] [PubMed]
- Harper, C.; Snowden, M. (2017). Environment and society : Human perspectives on environmental issues. Routledge. https://www.taylorfrancis.com/books/mono/10.4324/9781315463254/environment-society-charles-harper-monica-snowden.
- Hastie, T.; Tibshirani, R. Generalized additive models. Statistical science 1986, 1, 297–310. [Google Scholar]
- Hopp, S.; Dominici, F.; Bobb, J.F. Medical diagnoses of heat wave-related hospital admissions in older adults. Preventive medicine 2018, 110, 81–85. [Google Scholar] [CrossRef]
- Huang, R.; Xiao, Y.; Li, S.; Li, J.; Weng, W.; Shao, Q.; Zhang, J.; Zhang, Y.; Yang, L.; Huang, C.; Sun, W.; Liu, W.; Jin, H.; Huang, J. A novel framework for dynamic and quantitative mapping of damage severity due to compound Drought–Heatwave impacts on tea Plantations, integrating Sentinel-2 and UAV images. Computers and Electronics in Agriculture 2025, 228, 109688. [Google Scholar] [CrossRef]
- Hughes, F.; Parsons, L.; Levy, J.H.; Shindell, D.; Alhanti, B.; Ohnuma, T.; Kasibhatla, P.; Montgomery, H.; Krishnamoorthy, V. Impact of Wildfire Smoke on Acute Illness. Anesthesiology 2024, 141, 779–789. [Google Scholar] [CrossRef] [PubMed]
- Ibrahim, D.; Mongare, J. Modelling Claim Frequency with Spatial Effects for Accurate Insurance Premium Cost Calculations. Indonesian Journal of Applied Mathematics and Statistics 2024, 1, 65–70. [Google Scholar] [CrossRef]
- Ioannou, L.G.; Mantzios, K.; Tsoutsoubi, L.; Panagiotaki, Z.; Kapnia, A.K.; Ciuha, U.; Nybo, L.; Flouris, A.D.; Mekjavic, I.B. Effect of a Simulated Heat Wave on Physiological Strain and Labour Productivity. International Journal of Environmental Research and Public Health 2021, 18, 6. [Google Scholar] [CrossRef]
- IPCC. (2021). Climate Change 2021 : The Physical Science Basis | Climate Change 2021 : The Physical Science Basis. https://www.ipcc.ch/report/ar6/wg1/.
- Iriti, M.; Vitalini, S. Climate change, natural disasters, armed conflicts and migrations at the crossroads between food and nutrition insecurity and undernourishment. Functional Food Science-Online 2025, 5, 1–5. [Google Scholar] [CrossRef]
- Kamoljitprapa, P.; Leelasilapasart, P. Nonlinear Models for Influenza Patients for Different Age Groups in Thailand. Proceedings of the 2024 9th International Conference on Information and Education Innovations 2024, 109–112. [Google Scholar] [CrossRef]
- Kanu, I.A.; Ndubisi, E.J. (2020). Climate Change In Africa. https://www.researchgate.net/profile/Kanu-Ikechukwu/publication/339602687_Climate_Change_In_Africa_Problems_Prospects_and_Perspectives/links/5e5bd4c74585152ce8ff04cd/Climate-Change-In-Africa-Problems-Prospects-and-Perspectives.pdf.
- Kaynakli, O.; Mutlu, M.; Atmaca, I.; Kilic, M. (2014). Investigation of Humidity Effects on the Thermal Comfort and Heat Balance of the Body. In I. Dincer, A. Midilli, & H. Kucuk (Éds.), Progress in Exergy, Energy, and the Environment (p. 421-434). Springer International Publishing. [CrossRef]
- Ke, D.; Takahashi, K.; Takakura, J.; Takara, K.; Kamranzad, B. Effects of heatwave features on machine-learning-based heat-related ambulance calls prediction models in Japan. Science of The Total Environment 2023, 873, 162283. [Google Scholar] [CrossRef]
- Kenny, G.P.; Yardley, J.; Brown, C.; Sigal, R.J.; Jay, O. Heat stress in older individuals and patients with common chronic diseases. CMAJ 2010, 182, 1053–1060. [Google Scholar] [CrossRef]
- Kollanus, V.; Tiittanen, P.; Lanki, T. Mortality risk related to heatwaves in Finland – Factors affecting vulnerability. Environmental Research 2021, 201, 111503. [Google Scholar] [CrossRef] [PubMed]
- Kurebwa, J.; Kurebwa, N.Y. (2025). Climate Change and Health Resilient Systems : Strengthening Public Health in a Changing World. In Managing the Health Risks of Climate Change (p. 33-56). IGI Global Scientific Publishing. https://www.igi-global.com/chapter/climate-change-and-health-resilient-systems/363177.
- Kuźma, Ł.; Kurasz, A.; Niwińska, M.; Zalewska-Adamiec, M.; Bachórzewska-Gajewska, H.; Dobrzycki, S. Does climate change affect the chronobiological trends in the occurrence of acute coronary syndrome. Arch. Med. Sci 2021, 1–9. [Google Scholar] [CrossRef]
- Li, M.; Gu, S.; Bi, P.; Yang, J.; Liu, Q. Heat Waves and Morbidity : Current Knowledge and Further Direction-A Comprehensive Literature Review. International Journal of Environmental Research and Public Health 2015, 12, 5. [Google Scholar] [CrossRef] [PubMed]
- Lindsay, S.; Hsu, S.; Ragunathan, S.; Lindsay, J. The impact of climate change related extreme weather events on people with pre-existing disabilities and chronic conditions : A scoping review. Disability and Rehabilitation 2023, 45, 4338–4358. [Google Scholar] [CrossRef] [PubMed]
- Marchand, M.; Gin, K. The Cardiovascular System in Heat Stroke. CJC Open 2022, 4, 158–163. [Google Scholar] [CrossRef]
- Marcucci, S.; Verhulst, S. (2025). Reimagining the Policy Cycle in the Age of Artificial Intelligence (SSRN Scholarly Paper 5137557). Social Science Research Network. [CrossRef]
- Martin, M.A. On Bootstrap Iteration for Coverage Correction in Confidence Intervals. Journal of the American Statistical Association 1990, 85, 1105–1118. [Google Scholar] [CrossRef]
- Masselot, P.; Chebana, F.; Campagna, C.; Lavigne, É.; Ouarda, T.B.M.J.; Gosselin, P. Machine Learning Approaches to Identify Thresholds in a Heat-Health Warning System Context. Journal of the Royal Statistical Society Series A: Statistics in Society 2021, 184, 1326–1346. [Google Scholar] [CrossRef]
- Mayrhuber, E.A.-S.; Dückers, M.L.A.; Wallner, P.; Arnberger, A.; Allex, B.; Wiesböck, L.; Wanka, A.; Kolland, F.; Eder, R.; Hutter, H.-P.; Kutalek, R. Vulnerability to heatwaves and implications for public health interventions – A scoping review. Environmental Research 2018, 166, 42–54. [Google Scholar] [CrossRef]
- McCubbin, A.J.; Irwin, C.G.; Costa, R.J.S. Nourishing Physical Productivity and Performance On a Warming Planet—Challenges and Nutritional Strategies to Mitigate Exertional Heat Stress. Current Nutrition Reports 2024, 13, 399–411. [Google Scholar] [CrossRef]
- McGeehin, M.A.; Mirabelli, M. The potential impacts of climate variability and change on temperature-related morbidity and mortality in the United States. Environmental Health Perspectives 2001, 109 (suppl 2), 185–189. [Google Scholar] [CrossRef]
- Morakinyo, T.E.; Ishola, K.A.; Eresanya, E.O.; Daramola, M.T.; Balogun, I.A. Spatio-temporal characteristics of Heat stress over Nigeria using evaluated ERA5-HEAT reanalysis data. Weather and Climate Extremes 2024, 45, 100704. [Google Scholar] [CrossRef]
- Muhammad, A.; Qureshi, A.Z.; Farhan, M.; Oduoye, M.O.; Shehzad, F.; Imran, M. Emergency trauma care : Pakistan’s preparedness amidst the growing impact of rapid climate change. International Journal of Surgery 2024, 110, 2532–2534. [Google Scholar] [CrossRef] [PubMed]
- Nagelkerke, N.J. A note on a general definition of the coefficient of determination. biometrika 1991, 78, 691–692. [Google Scholar] [CrossRef]
- Narocki, C. (2021). Heatwaves as an occupational hazard : The impact of heat and heatwaves on workers’ health, safety and wellbeing and on social inequalities (Research Report 2021.06). Report. https://www.econstor.eu/handle/10419/299657.
- Nhamo, G.; Chapungu, L.; Mutanda, G.W. Trends and Impacts of Climate-induced Extreme Weather Events in South Africa (1920-2023). Environmental Development 2025, 101183. [Google Scholar] [CrossRef]
- Pantavou, K.; Kotroni, V.; Kyros, G.; Lagouvardos, K. Thermal bioclimate in Greece based on the Universal Thermal Climate Index (UTCI) and insights into 2021 and 2023 heatwaves. Theoretical and Applied Climatology 2024, 155, 6661–6675. [Google Scholar] [CrossRef]
- Pearson, K.; Henrici, O.M.F.E. VII. Mathematical contributions to the theory of evolution.—III. Regression, heredity, and panmixia. Philosophical Transactions of the Royal Society of London. Series A, Containing Papers of a Mathematical or Physical Character 1997, 187, 253–318. [Google Scholar] [CrossRef]
- Peng, Y.; Nagata, M.H. An empirical overview of nonlinearity and overfitting in machine learning using COVID-19 data. Chaos, Solitons & Fractals 2020, 139, 110055. [Google Scholar] [CrossRef]
- Perkins, S.E.; Alexander, L.V. On the measurement of heat waves. Journal of climate 2013, 26, 4500–4517. [Google Scholar] [CrossRef]
- Rothfusz, L.P.; Headquarters, N.S.R. The heat index equation (or, more than you ever wanted to know about heat index). Fort Worth, Texas: National Oceanic and Atmospheric Administration, National Weather Service, Office of Meteorology 1990, 9023, 640. [Google Scholar]
- Rowland, S.T.; Boehme, A.K.; Rush, J.; Just, A.C.; Kioumourtzoglou, M.-A. Can ultra short-term changes in ambient temperature trigger myocardial infarction? Environment International 2020, 143, 105910. [Google Scholar] [CrossRef] [PubMed]
- Sagna, P.; Ndiaye, O.; Diop, C.; Niang, A.D.; Sambou, P.C. Les variations récentes du climat constatées au Sénégal sont-elles en phase avec les descriptions données par les scénarios du GIEC ? Pollution atmosphérique. Climat, santé, société 2016, 227. [Google Scholar] [CrossRef]
- Sambou, M.-J. G.; Janicot, S.; Pohl, B.; Badiane, D.; Dieng, A.L.; Gaye, A. Heat wave occurrences over Senegal during spring : Regionalization and synoptic patterns. International Journal of Climatology 2020, 40, 440–457. [Google Scholar] [CrossRef]
- Sawka, M.N.; Leon, L.R.; Montain, S.J.; Sonna, L.A. Integrated physiological mechanisms of exercise performance, adaptation, and maladaptation to heat stress. Compr Physiol 2011, 1, 1883–1928. [Google Scholar] [CrossRef]
- Schwingshackl, C.; Sillmann, J.; Vicedo-Cabrera, A.M.; Sandstad, M.; Aunan, K. Heat Stress Indicators in CMIP6 : Estimating Future Trends and Exceedances of Impact-Relevant Thresholds. Earth’s Future 2021, 9, e2020EF001885. [Google Scholar] [CrossRef]
- Sissoko, K.; van Keulen, H.; Verhagen, J.; Tekken, V.; Battaglini, A. Agriculture, livelihoods and climate change in the West African Sahel. Regional Environmental Change 2011, 11, 119–125. [Google Scholar] [CrossRef]
- Smoll, L.I. (2024). Sirenian conservation physiology : An integrated approach to evaluate the health of dugongs and manatees. https://espace.library.uq.edu.au/view/UQ:abb2936.
- Sow, M.; Gaye, D. Categorization and multi-criteria analysis of heat wave vulnerability in Senegal. Journal of Water and Climate Change 2024, 15, 5382–5396. [Google Scholar] [CrossRef]
- Steadman, R.G. The Assessment of Sultriness. Part I : A Temperature-Humidity Index Based on Human Physiology and Clothing Science. Journal of Applied Meteorology and Climatology 1979, 18, 861–873. [Google Scholar] [CrossRef]
- Sy, I.; Cissé, B.; Ndao, B.; Touré, M.; Aziz Diouf, A.; Adama Sarr, M.; Ndiaye, O. (2024). Heat waves and health impacts in the northern part of Senegal : Implementation of an early warning system to support Health National Adaptation Plan (HNAP). 20179. EGU General Assembly Conference Abstracts. [CrossRef]
- Sy, I.; Cissé, B.; Ndao, B.; Touré, M.; Diouf, A.A.; Sarr, M.A.; Ndiaye, O.; Ndiaye, Y.; Badiane, D.; Lalou, R.; Janicot, S.; Ndione, J.-A. Heat waves and health risks in the northern part of Senegal : Analysing the distribution of temperature-related diseases and associated risk factors. Environmental Science and Pollution Research 2022, 29, 83365–83377. [Google Scholar] [CrossRef]
- Sylla, M.B.; Nikiema, P.M.; Gibba, P.; Kebe, I.; Klutse, N.A.B. (2016). Climate Change over West Africa : Recent Trends and Future Projections. In J. A. Yaro & J. Hesselberg (Éds.), Adaptation to Climate Change and Variability in Rural West Africa (p. 25-40). Springer International Publishing. [CrossRef]
- Thiaw, W.M.; Bekele, E.; Diouf, S.N.; Dewitt, D.G.; Ndiaye, O.; Ndiaye, M.K.N.; Ndiaye, P.N.; Diene, N.; Diouf, M.; Diaw, A.; Diop, S.; Badj, F.; Diouf, A. Toward Experimental Heat–Health Early Warning in Africa. Bulletin of the American Meteorological Society 2022, 103, E1843–E1860. [Google Scholar] [CrossRef]
- Thongprayoon, C.; Qureshi, F.; Petnak, T.; Cheungpasitporn, W.; Chewcharat, A.; Cato, L.D.; Boonpheng, B.; Bathini, T.; Hansrivijit, P.; Vallabhajosyula, S.; Kaewput, W. Impact of Acute Kidney Injury on Outcomes of Hospitalizations for Heat Stroke in the United States. Diseases 2020, 8, 3. [Google Scholar] [CrossRef] [PubMed]
- Trahan, A.; Walshe, R.; Mehta, V. Extreme heat, gender, and access to preparedness measures : An analysis of the heatwave early warning system in Ahmedabad, India. International Journal of Disaster Risk Reduction 2023, 99, 104080. [Google Scholar] [CrossRef]
- Vandal, G. (2022). Impact de facteurs de vulnérabilité à l’échelle de secteurs géographiques sur la morbidité et mortalité associés à la chaleur dans la région de l’Estrie [PhD Thesis, Université de Sherbrooke]. https://savoirs.usherbrooke.ca/bitstream/handle/11143/19455/vandal_guillaume_MSc_2022.pdf?sequence=4.
- Verdaguer-Codina, J.; Martin, D.E.; Pujol-Amat, P.; Ruiz, A.; Prat, J.A. Climatic heat stress studies at the barcelona olympic games, 1992. Sports Medicine, Training and Rehabilitation, 1995, 6, 167–192. [Google Scholar] [CrossRef]
- Vermandele, F.; Sasaki, M.; Winkler, G.; Dam, H.G.; Madeira, D.; Calosi, P. When the Going Gets Tough, the Females Get Going : Sex-Specific Physiological Responses to Simultaneous Exposure to Hypoxia and Marine Heatwave Events in a Ubiquitous Copepod. Global Change Biology 2024, 30, e17553. [Google Scholar] [CrossRef]
- WHO. (2024). Heat and health. https://www.who.int/fr/news-room/fact-sheets/detail/climate-change-heat-and-health.
- Willmott, C.J.; Matsuura, K. Advantages of the mean absolute error (MAE) over the root mean square error (RMSE) in assessing average model performance. Climate research 2005, 30, 79–82. [Google Scholar] [CrossRef]
- Willmott, C.J.; Robeson, S.M.; Matsuura, K. A refined index of model performance. International Journal of climatology 2012, 32, 2088–2094. [Google Scholar] [CrossRef]
- Wills-Karp, M. Climate change-associated health impacts : A way forward. Frontiers in Science 2024, 2. [Google Scholar] [CrossRef]
- Wolkoff, P. Indoor air humidity, air quality, and health – An overview. International Journal of Hygiene and Environmental Health 2018, 221, 376–390. [Google Scholar] [CrossRef]
- Woodman, R.J.; Mayner, L. The usefulness of maximum daily temperatures versus defined heatwave periods in assessing the impact of extreme heat on ED Admissions for chronic conditions. International Journal 2016, 5, 81. [Google Scholar] [CrossRef]
- Chan, Y.F.; Lee, M.S. An exact iterated bootstrap algorithm for small-sample bias reduction. Computational Statistics & Data Analysis 2001, 36, 1–13. [Google Scholar] [CrossRef]
- Zhang, J.; You, Q. Avoidable heat risk under scenarios of carbon neutrality by mid-century. Science of The Total Environment 2023, 892, 164679. [Google Scholar] [CrossRef] [PubMed]
- Zhang, Y.; Paparoditis, E.; Politis, D.N. Simultaneous statistical inference for second order parameters of time series under weak conditions. The Annals of Statistics 2024, 52, 2375–2399. [Google Scholar] [CrossRef]
Figure 1.
Map of Matam with the main transport network and key infrastructure.
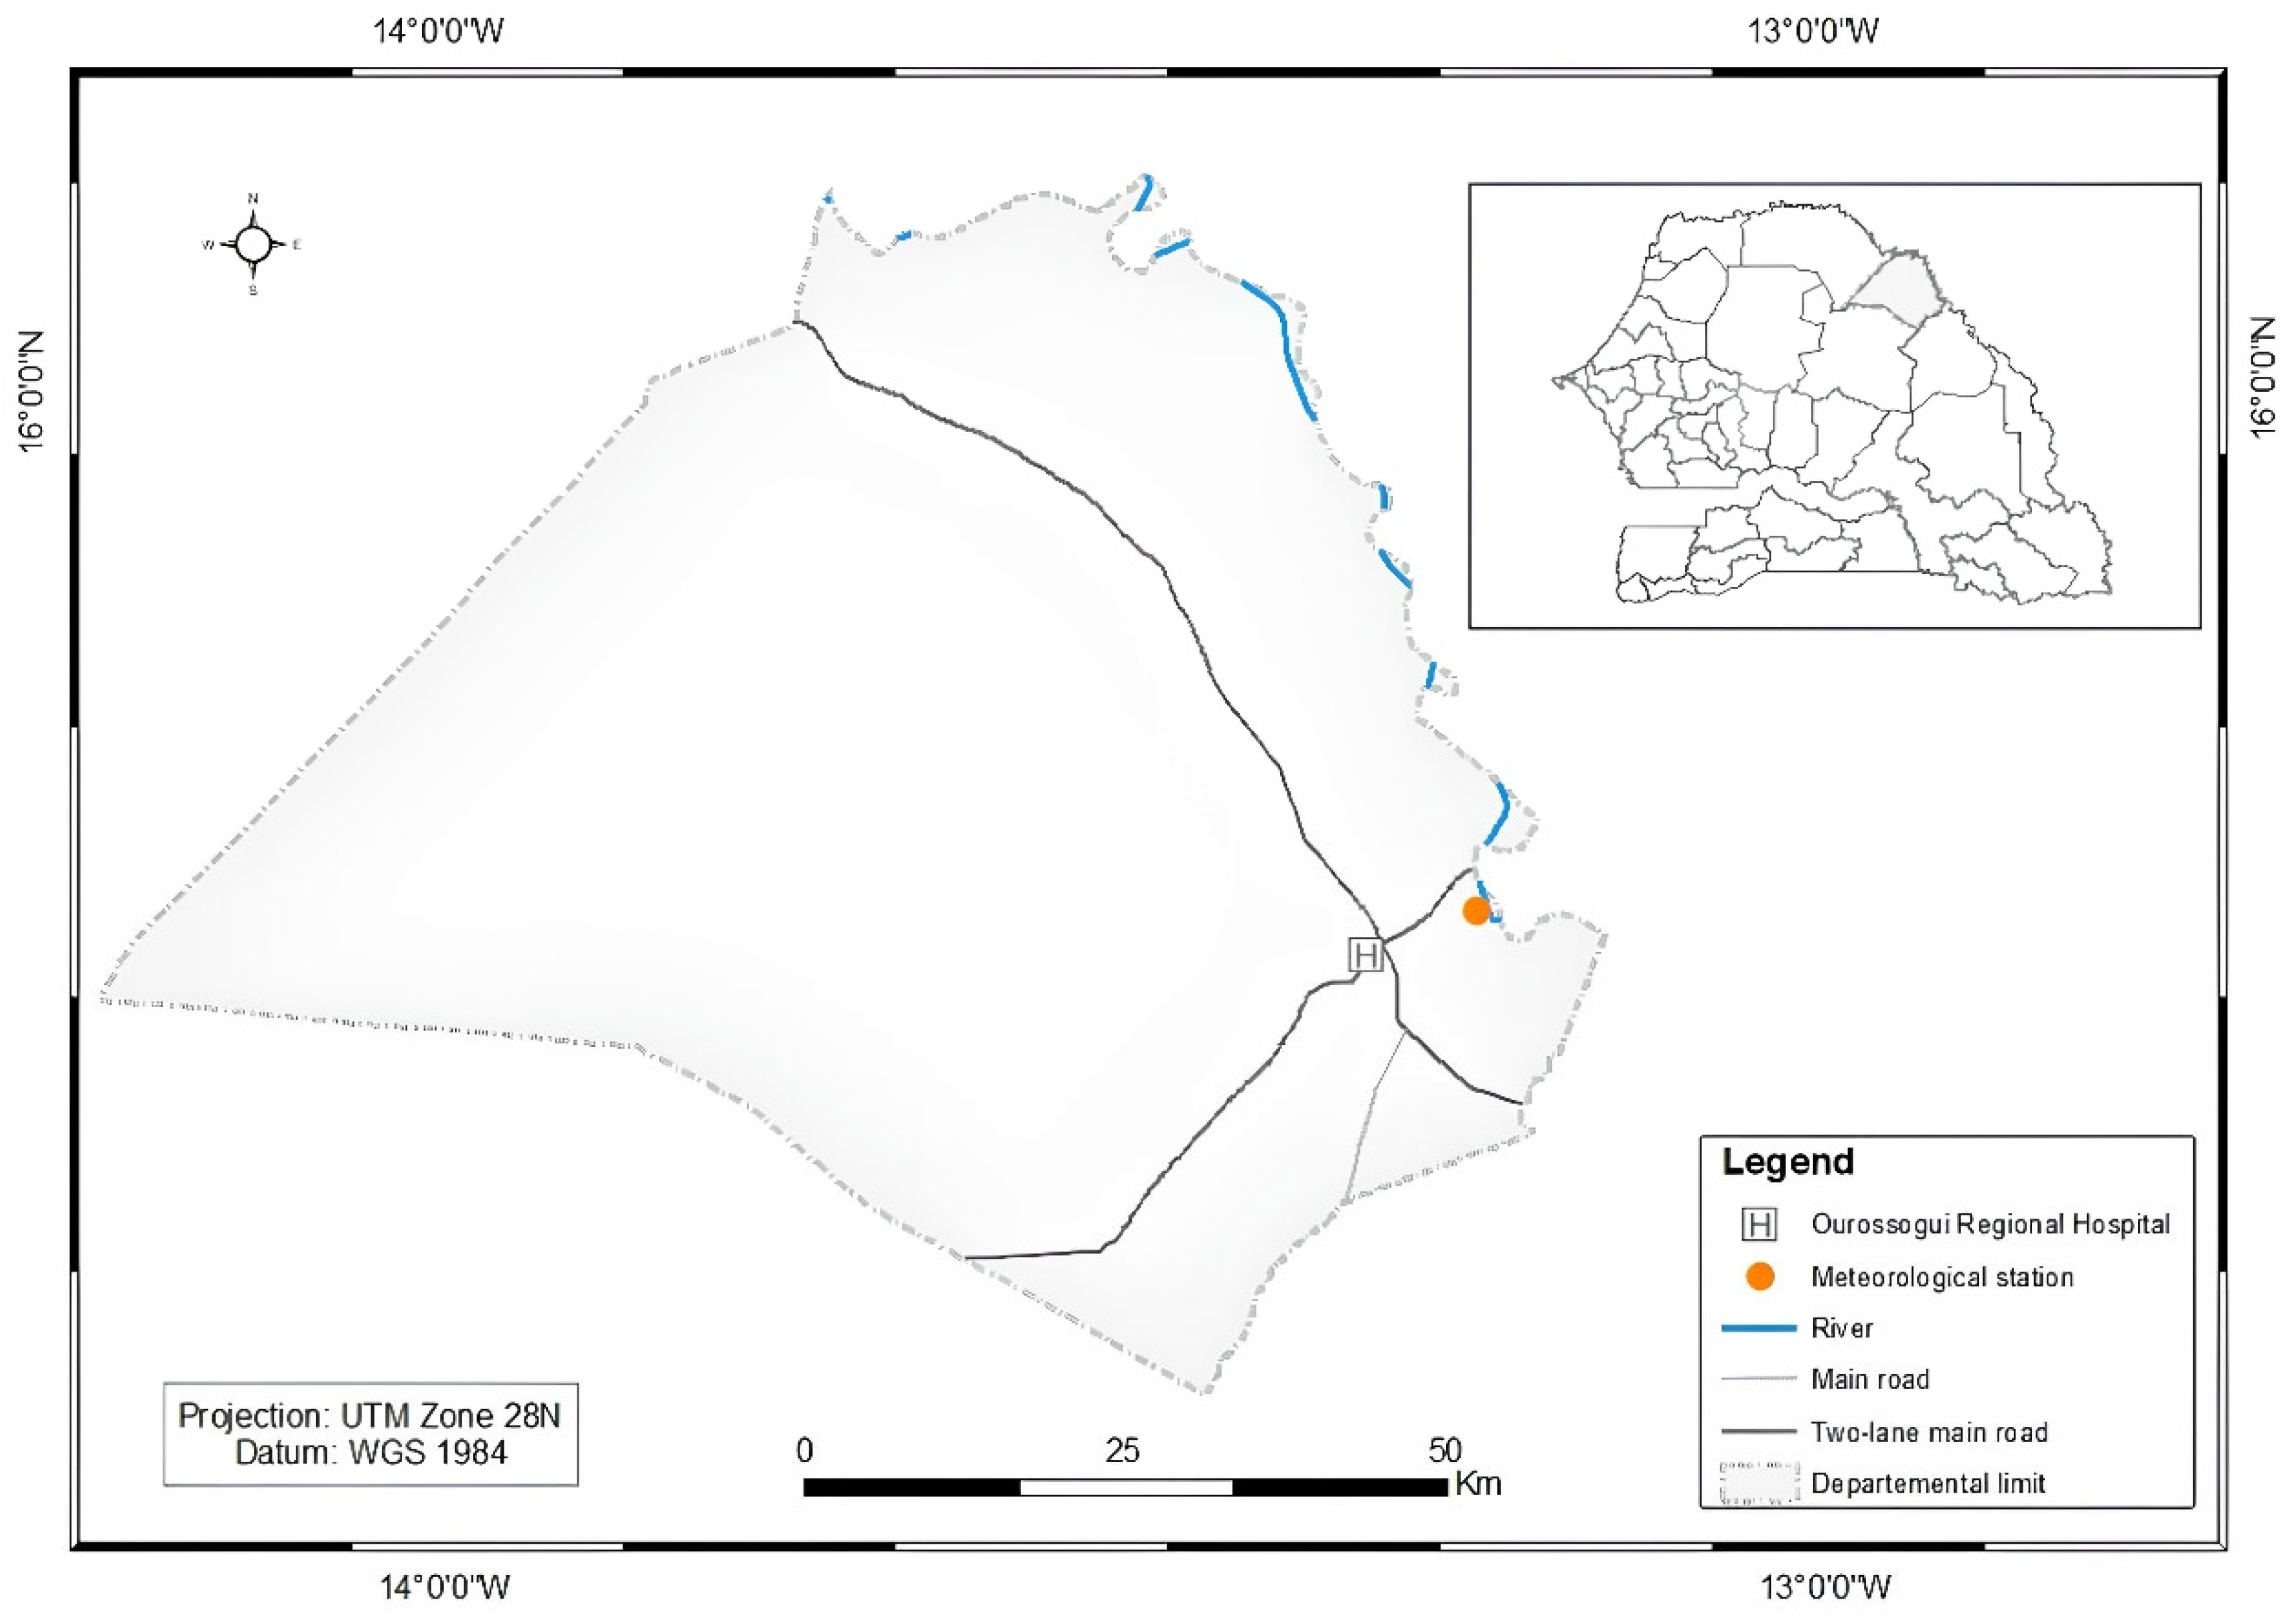
Figure 2.
Heatwaves Detected with TMAX (2017–2022). Each point represents a heatwave event, with the date on the x-axis and Imax on the y-axis. The size of the circles reflects the event duration in days, while their color indicates the Imax, ranging from yellow (low) to red (high).
Figure 2.
Heatwaves Detected with TMAX (2017–2022). Each point represents a heatwave event, with the date on the x-axis and Imax on the y-axis. The size of the circles reflects the event duration in days, while their color indicates the Imax, ranging from yellow (low) to red (high).
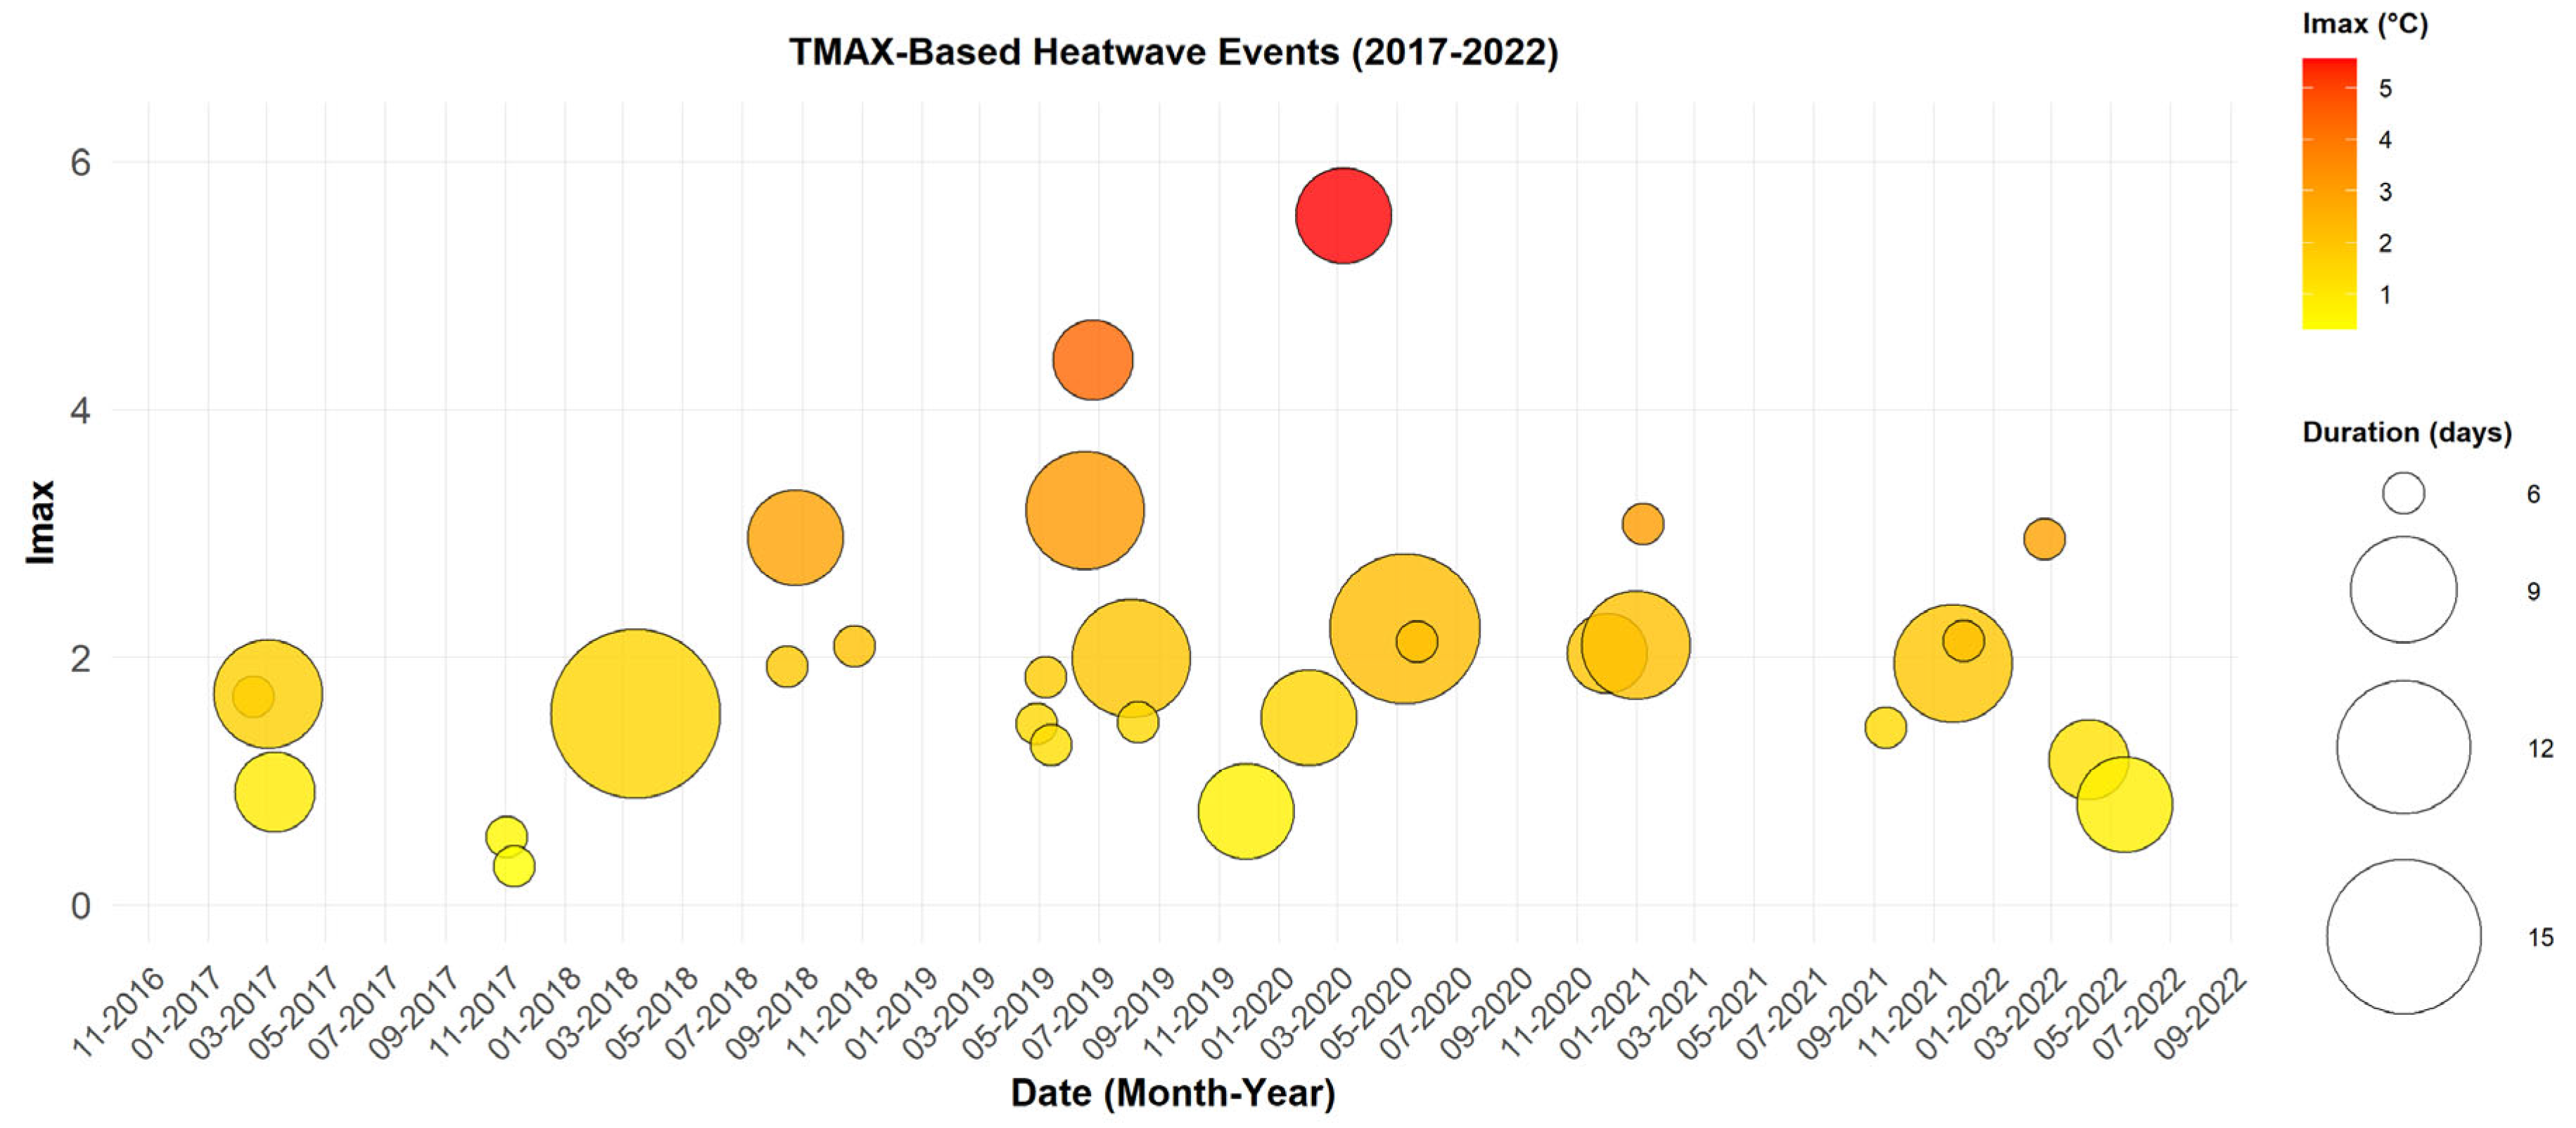
Figure 3.
Heatwaves Detected with HI (2017–2022). Each point represents a heatwave event, with the date on the x-axis and Imax on the y-axis. The size of the circles reflects the event duration in days, while their color indicates the Imax, ranging from yellow (low) to red (high).
Figure 3.
Heatwaves Detected with HI (2017–2022). Each point represents a heatwave event, with the date on the x-axis and Imax on the y-axis. The size of the circles reflects the event duration in days, while their color indicates the Imax, ranging from yellow (low) to red (high).
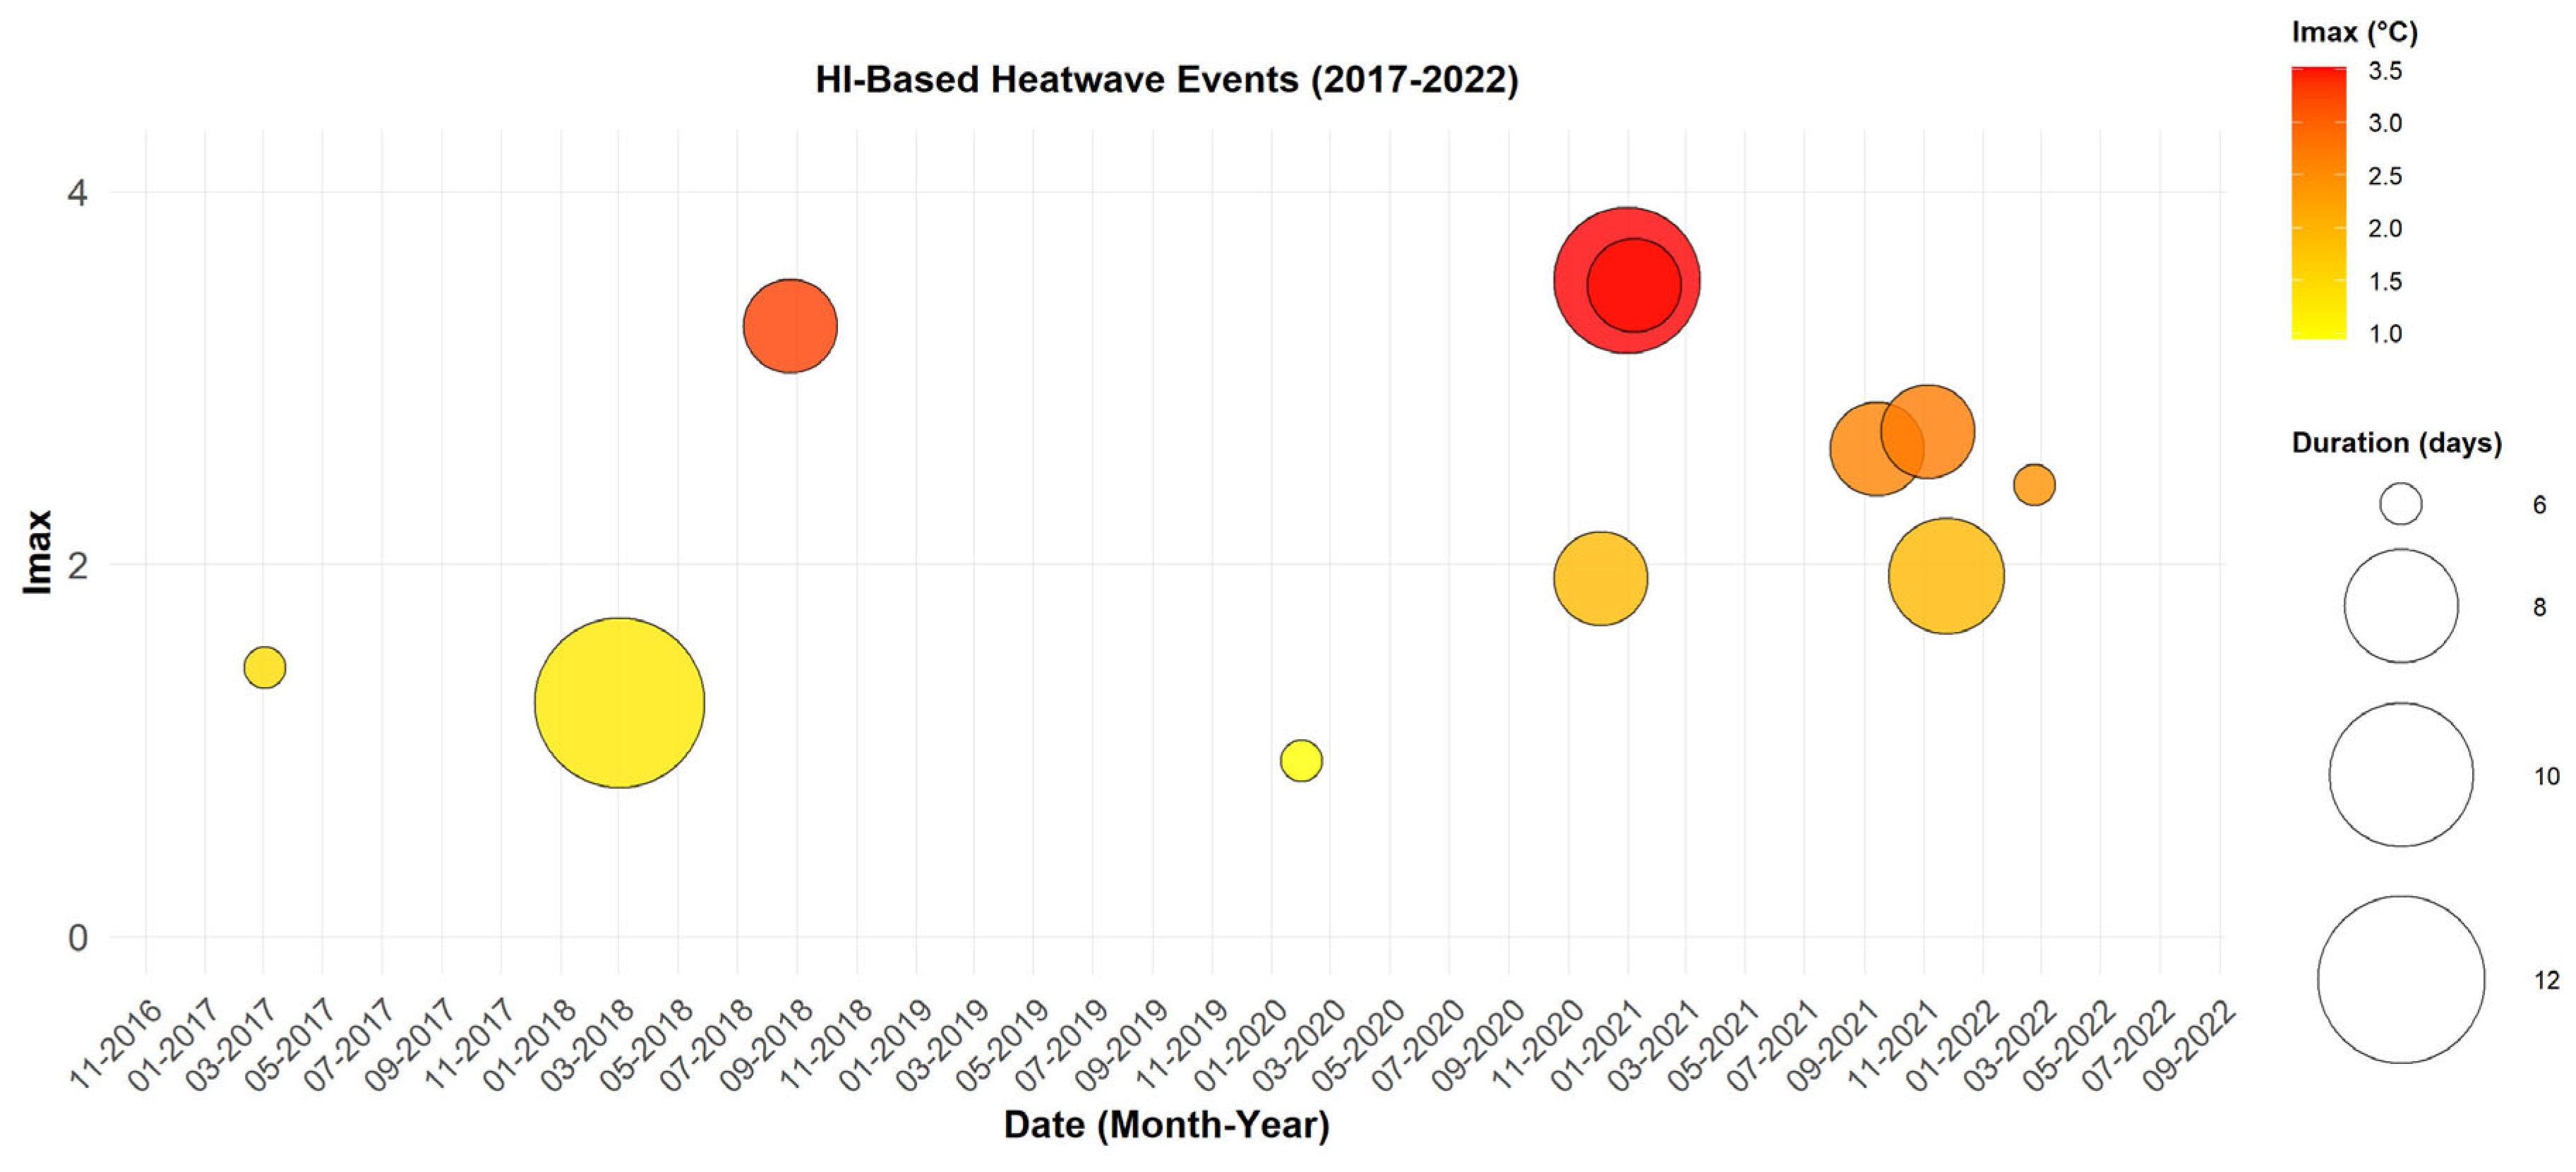
Figure 4.
Longest and Most Intense Heatwaves Based on TMAX. Panel (a) represents the longest heatwave, while panel (b) shows the most intense one, both observed in Matam. The orange-shaded areas indicate periods when the HI index exceeded the threshold, turning red if the duration reached at least three days. The black line represents the HI index, the green line denotes the threshold, and the gray line represents the daily climatology.
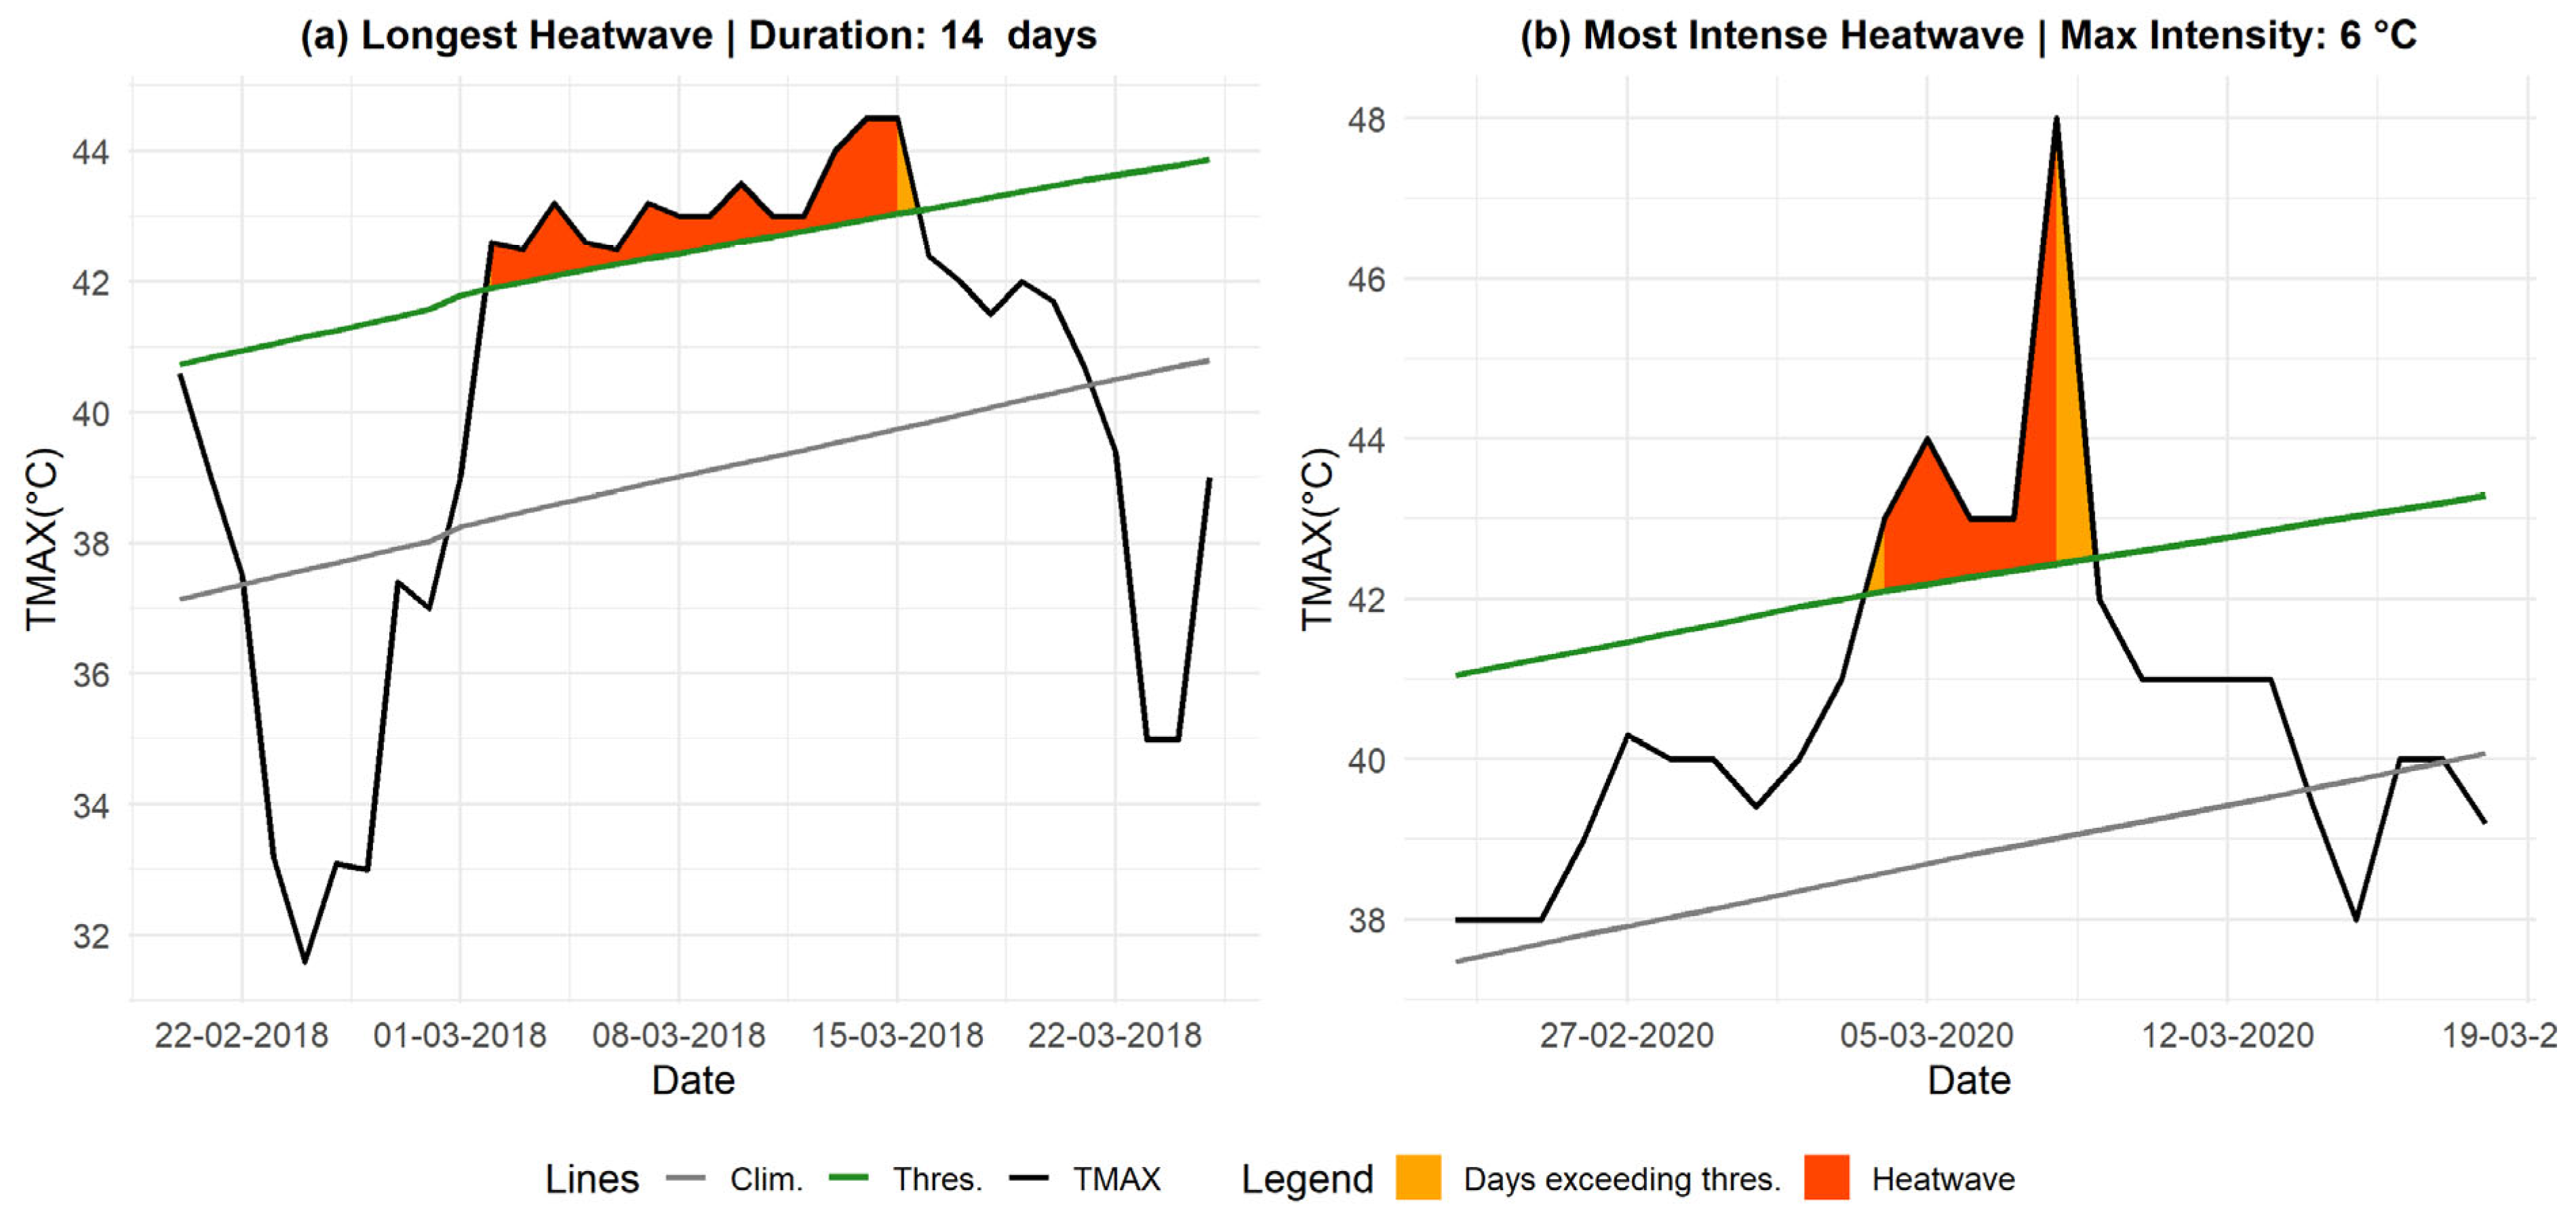
Figure 5.
Longest and Most Intense Heatwaves Based on HI. Panel (a) represents the longest heatwave, while panel (b) shows the most intense one, both observed in Matam. The orange-shaded areas indicate periods when the HI index exceeded the threshold, turning red if the duration reached at least three days. The black line represents the HI index, the green line denotes the threshold, and the gray line represents the daily climatology.
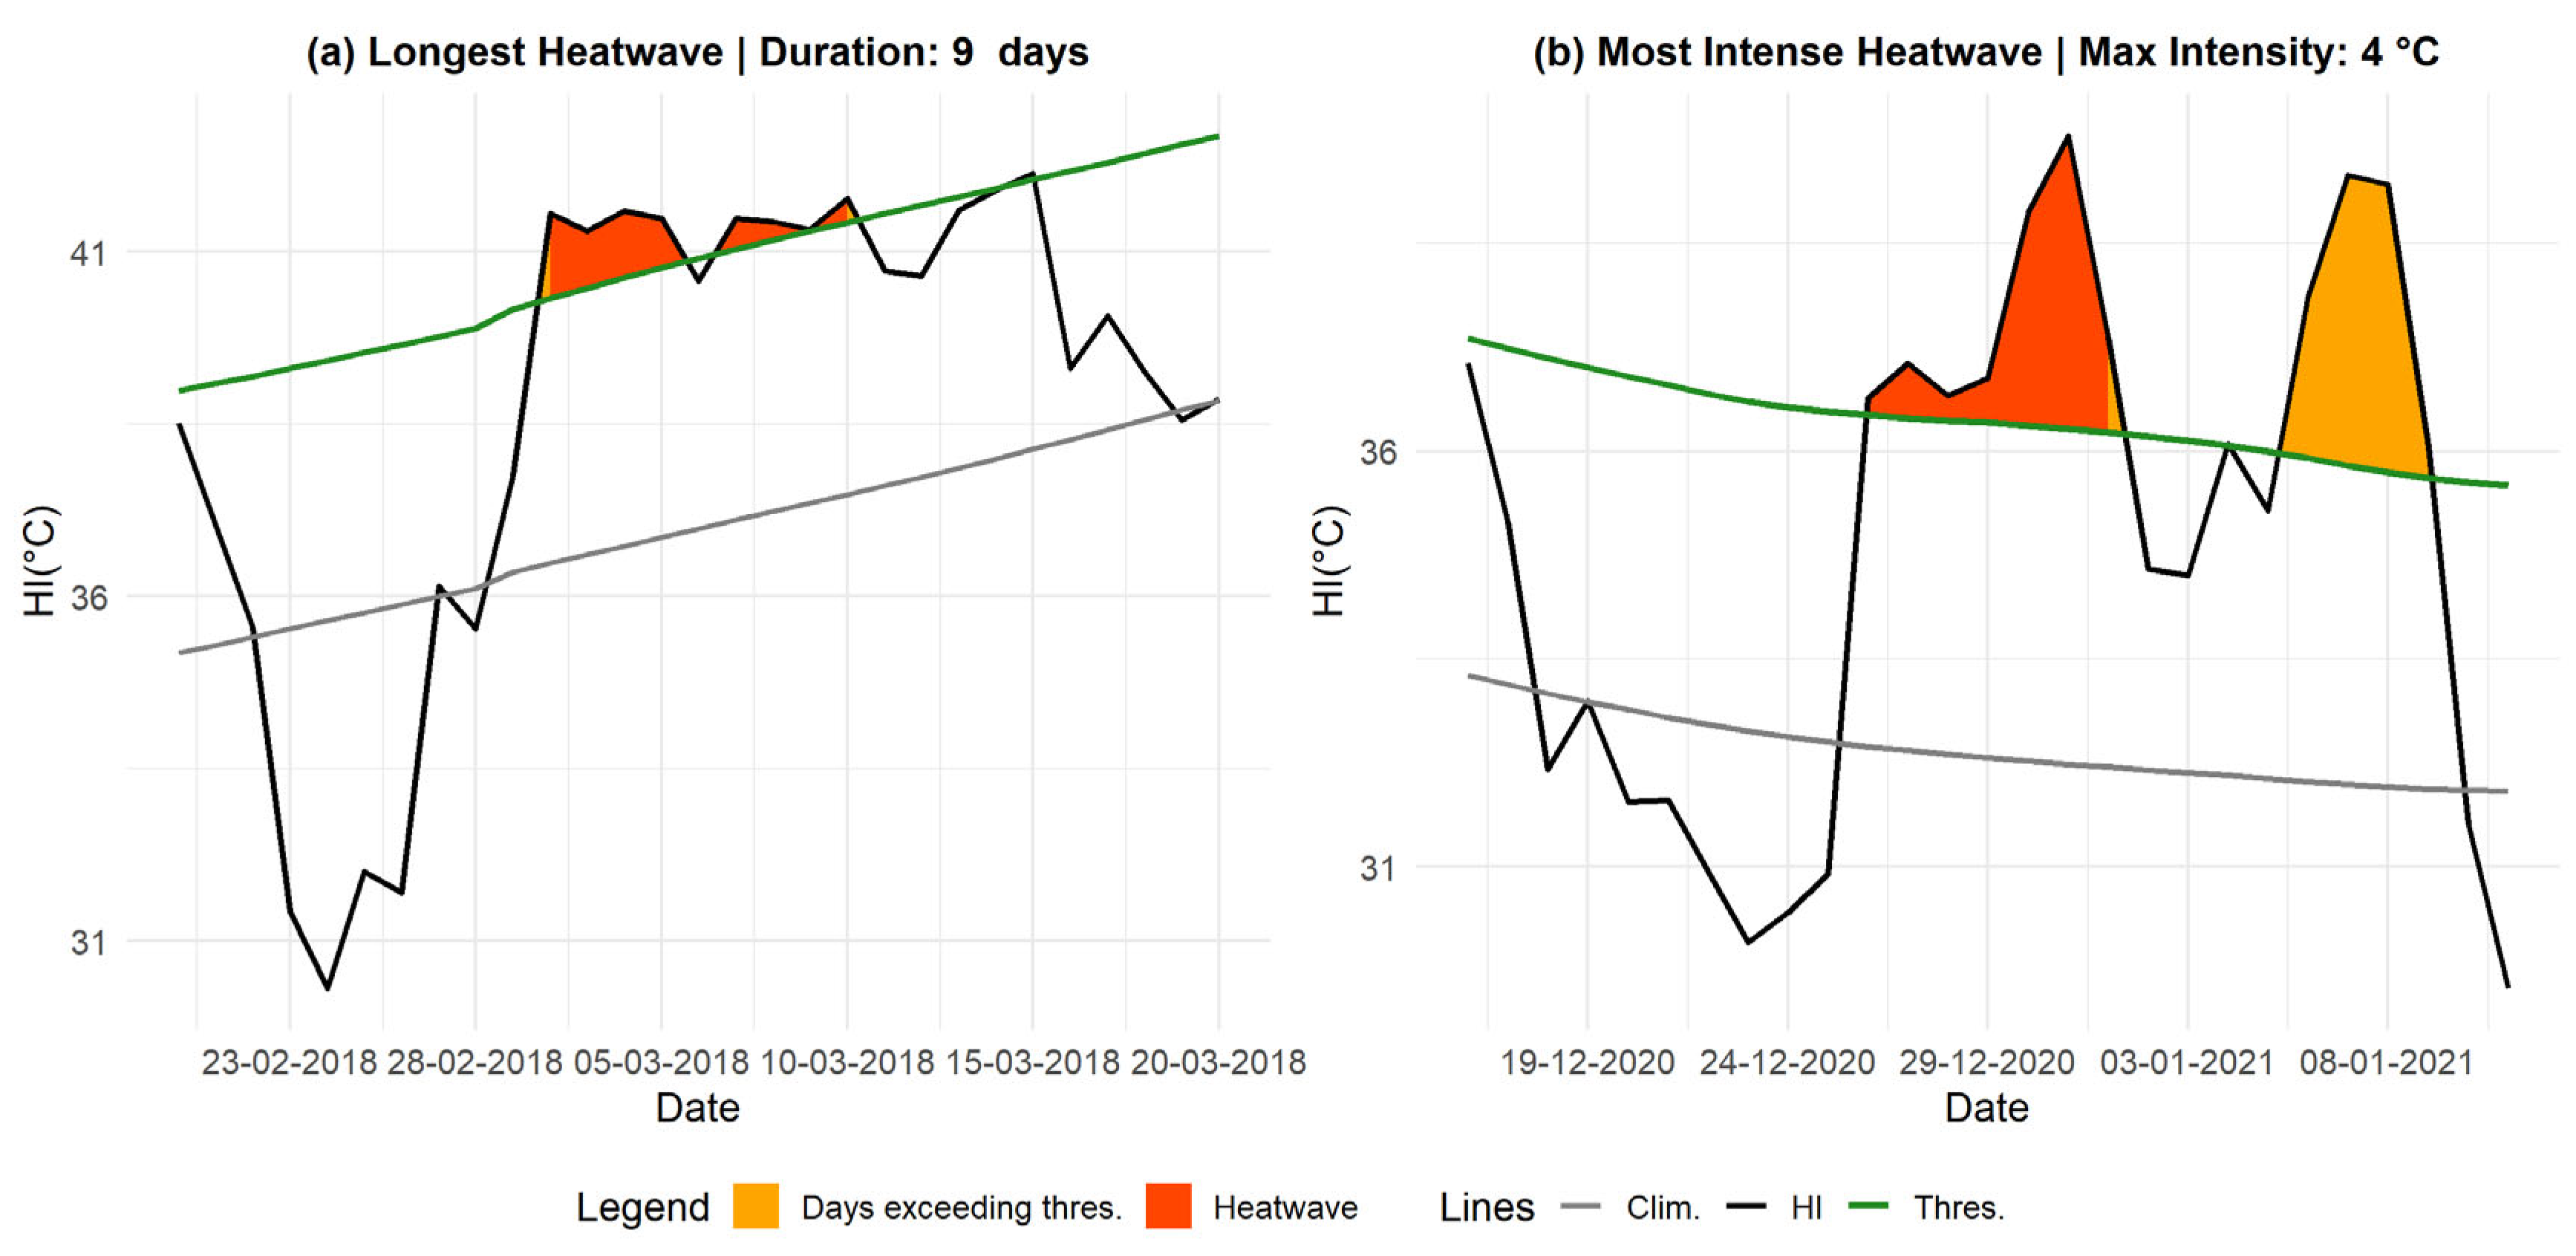
Figure 6.
Distribution of hospitalizations by age group and gender (January 2017–May 2022) at Ourossogui Hospital. (a): Distribution of hospitalizations by age group. (b): Distribution of hospitalizations by gender.
Figure 6.
Distribution of hospitalizations by age group and gender (January 2017–May 2022) at Ourossogui Hospital. (a): Distribution of hospitalizations by age group. (b): Distribution of hospitalizations by gender.
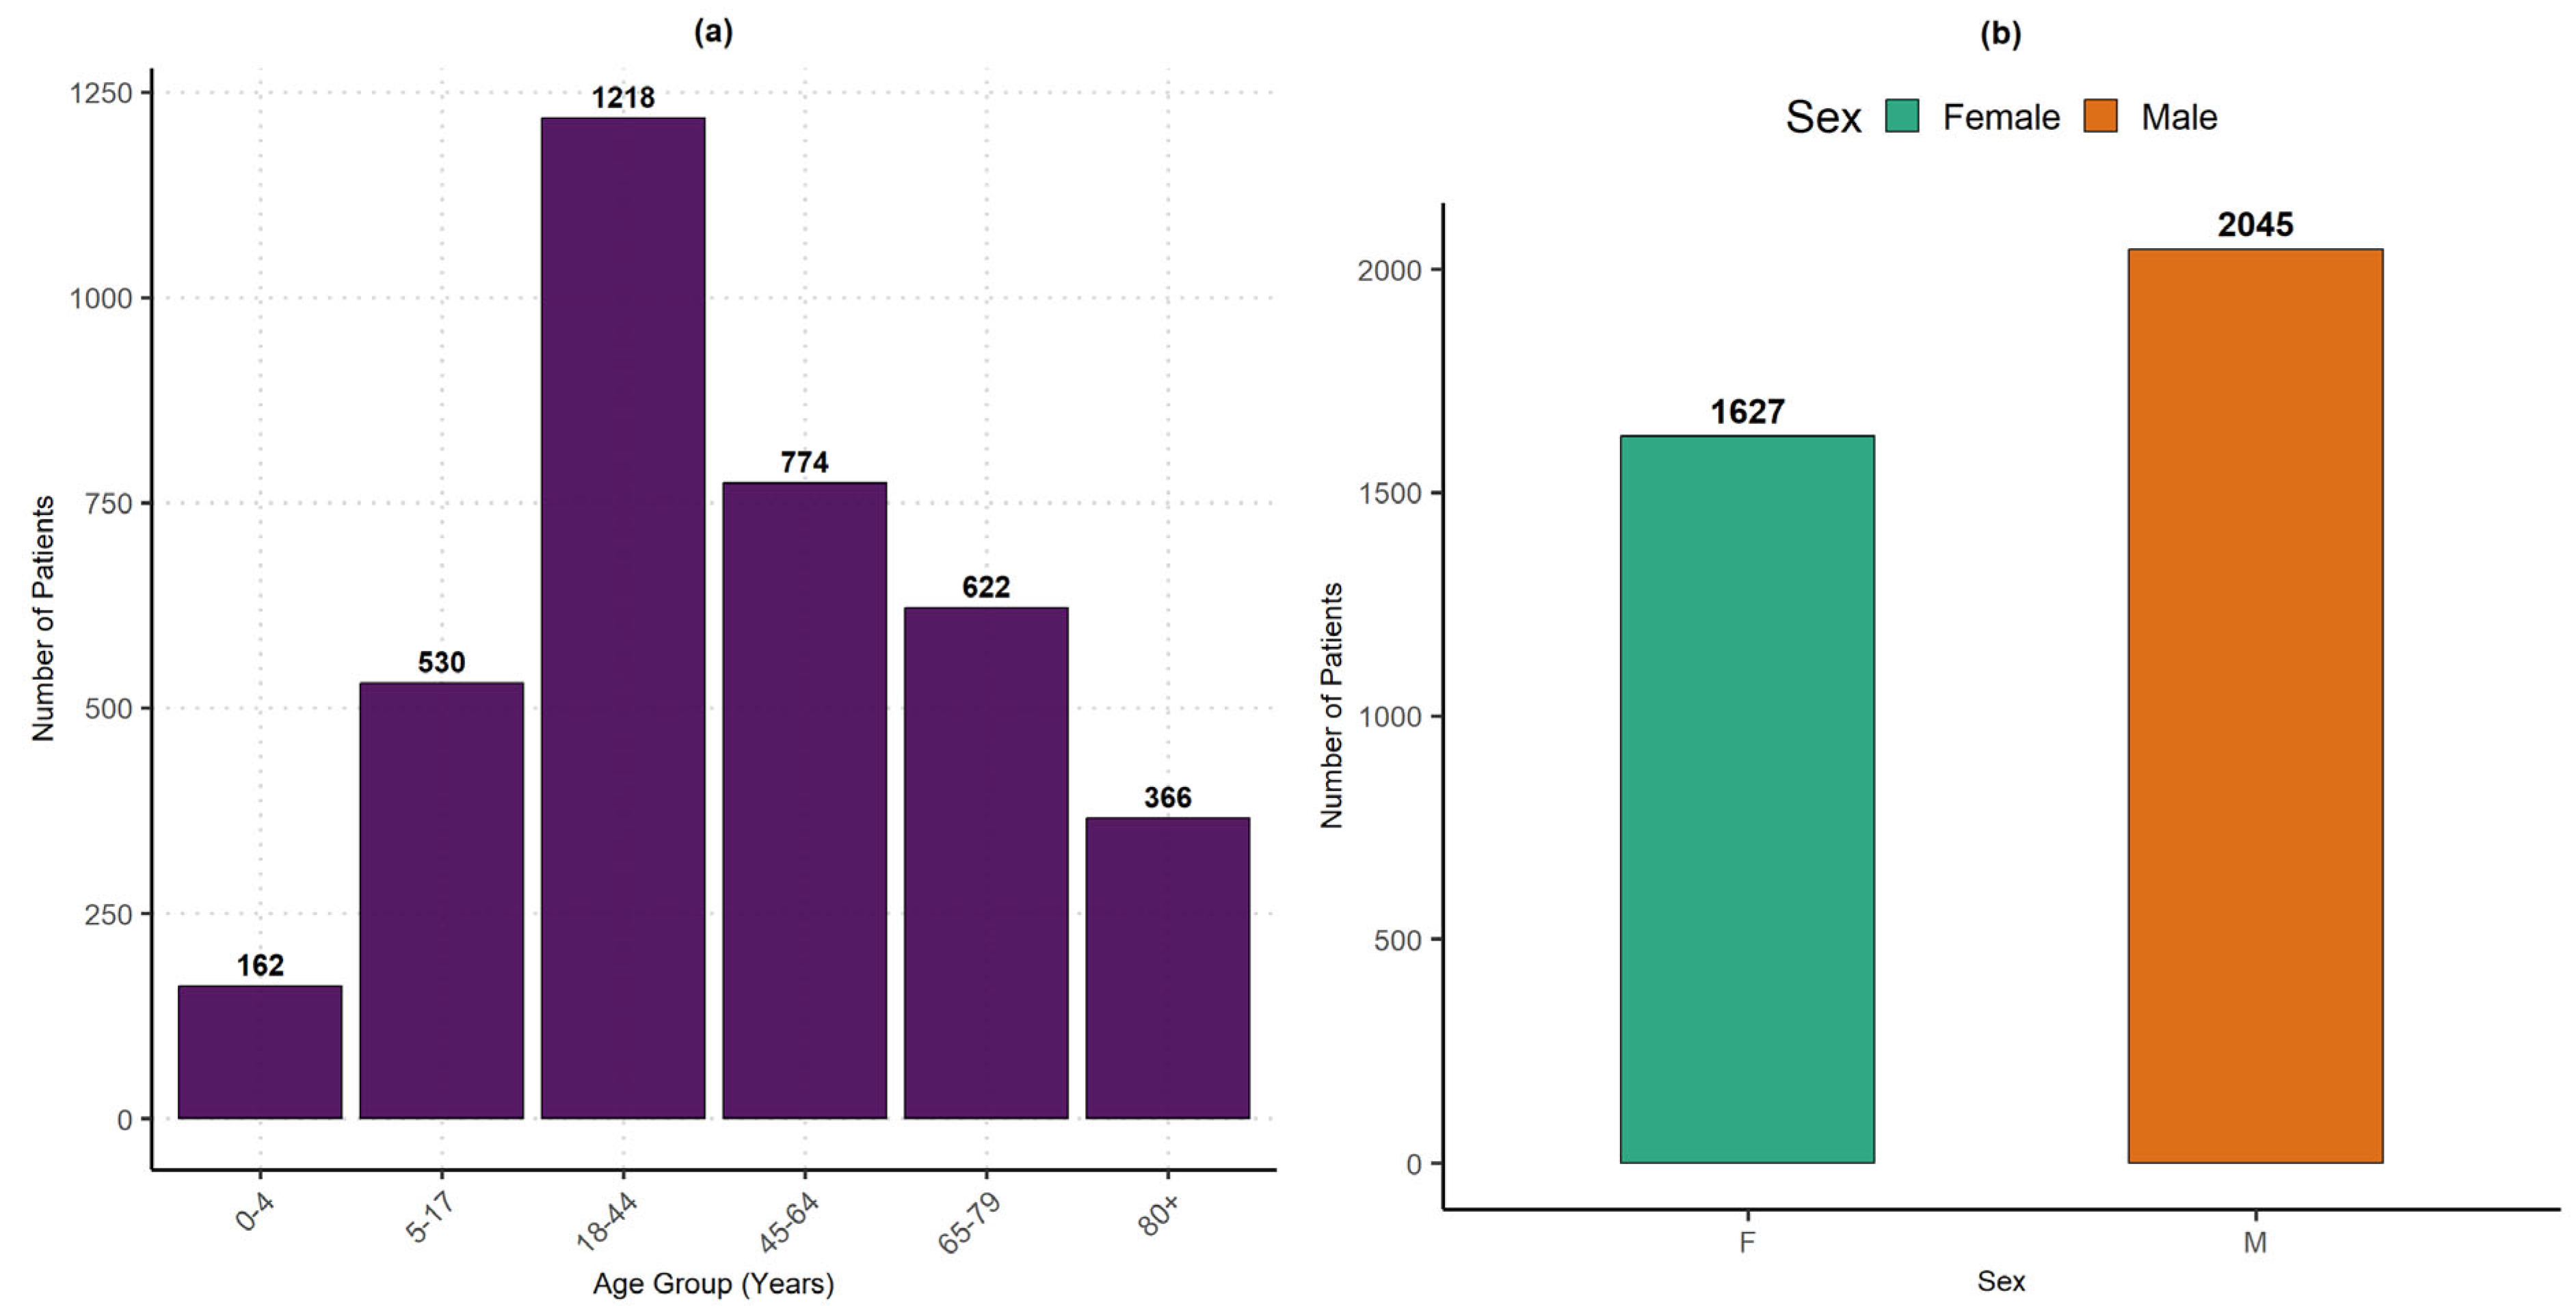
Figure 7.
Importance of Heatwave Variables in the GAM Model. A higher coefficient value indicates a greater contribution to the model. The colors range from red for variables with a strong impact to orange and yellow for those with a lower impact.
Figure 7.
Importance of Heatwave Variables in the GAM Model. A higher coefficient value indicates a greater contribution to the model. The colors range from red for variables with a strong impact to orange and yellow for those with a lower impact.
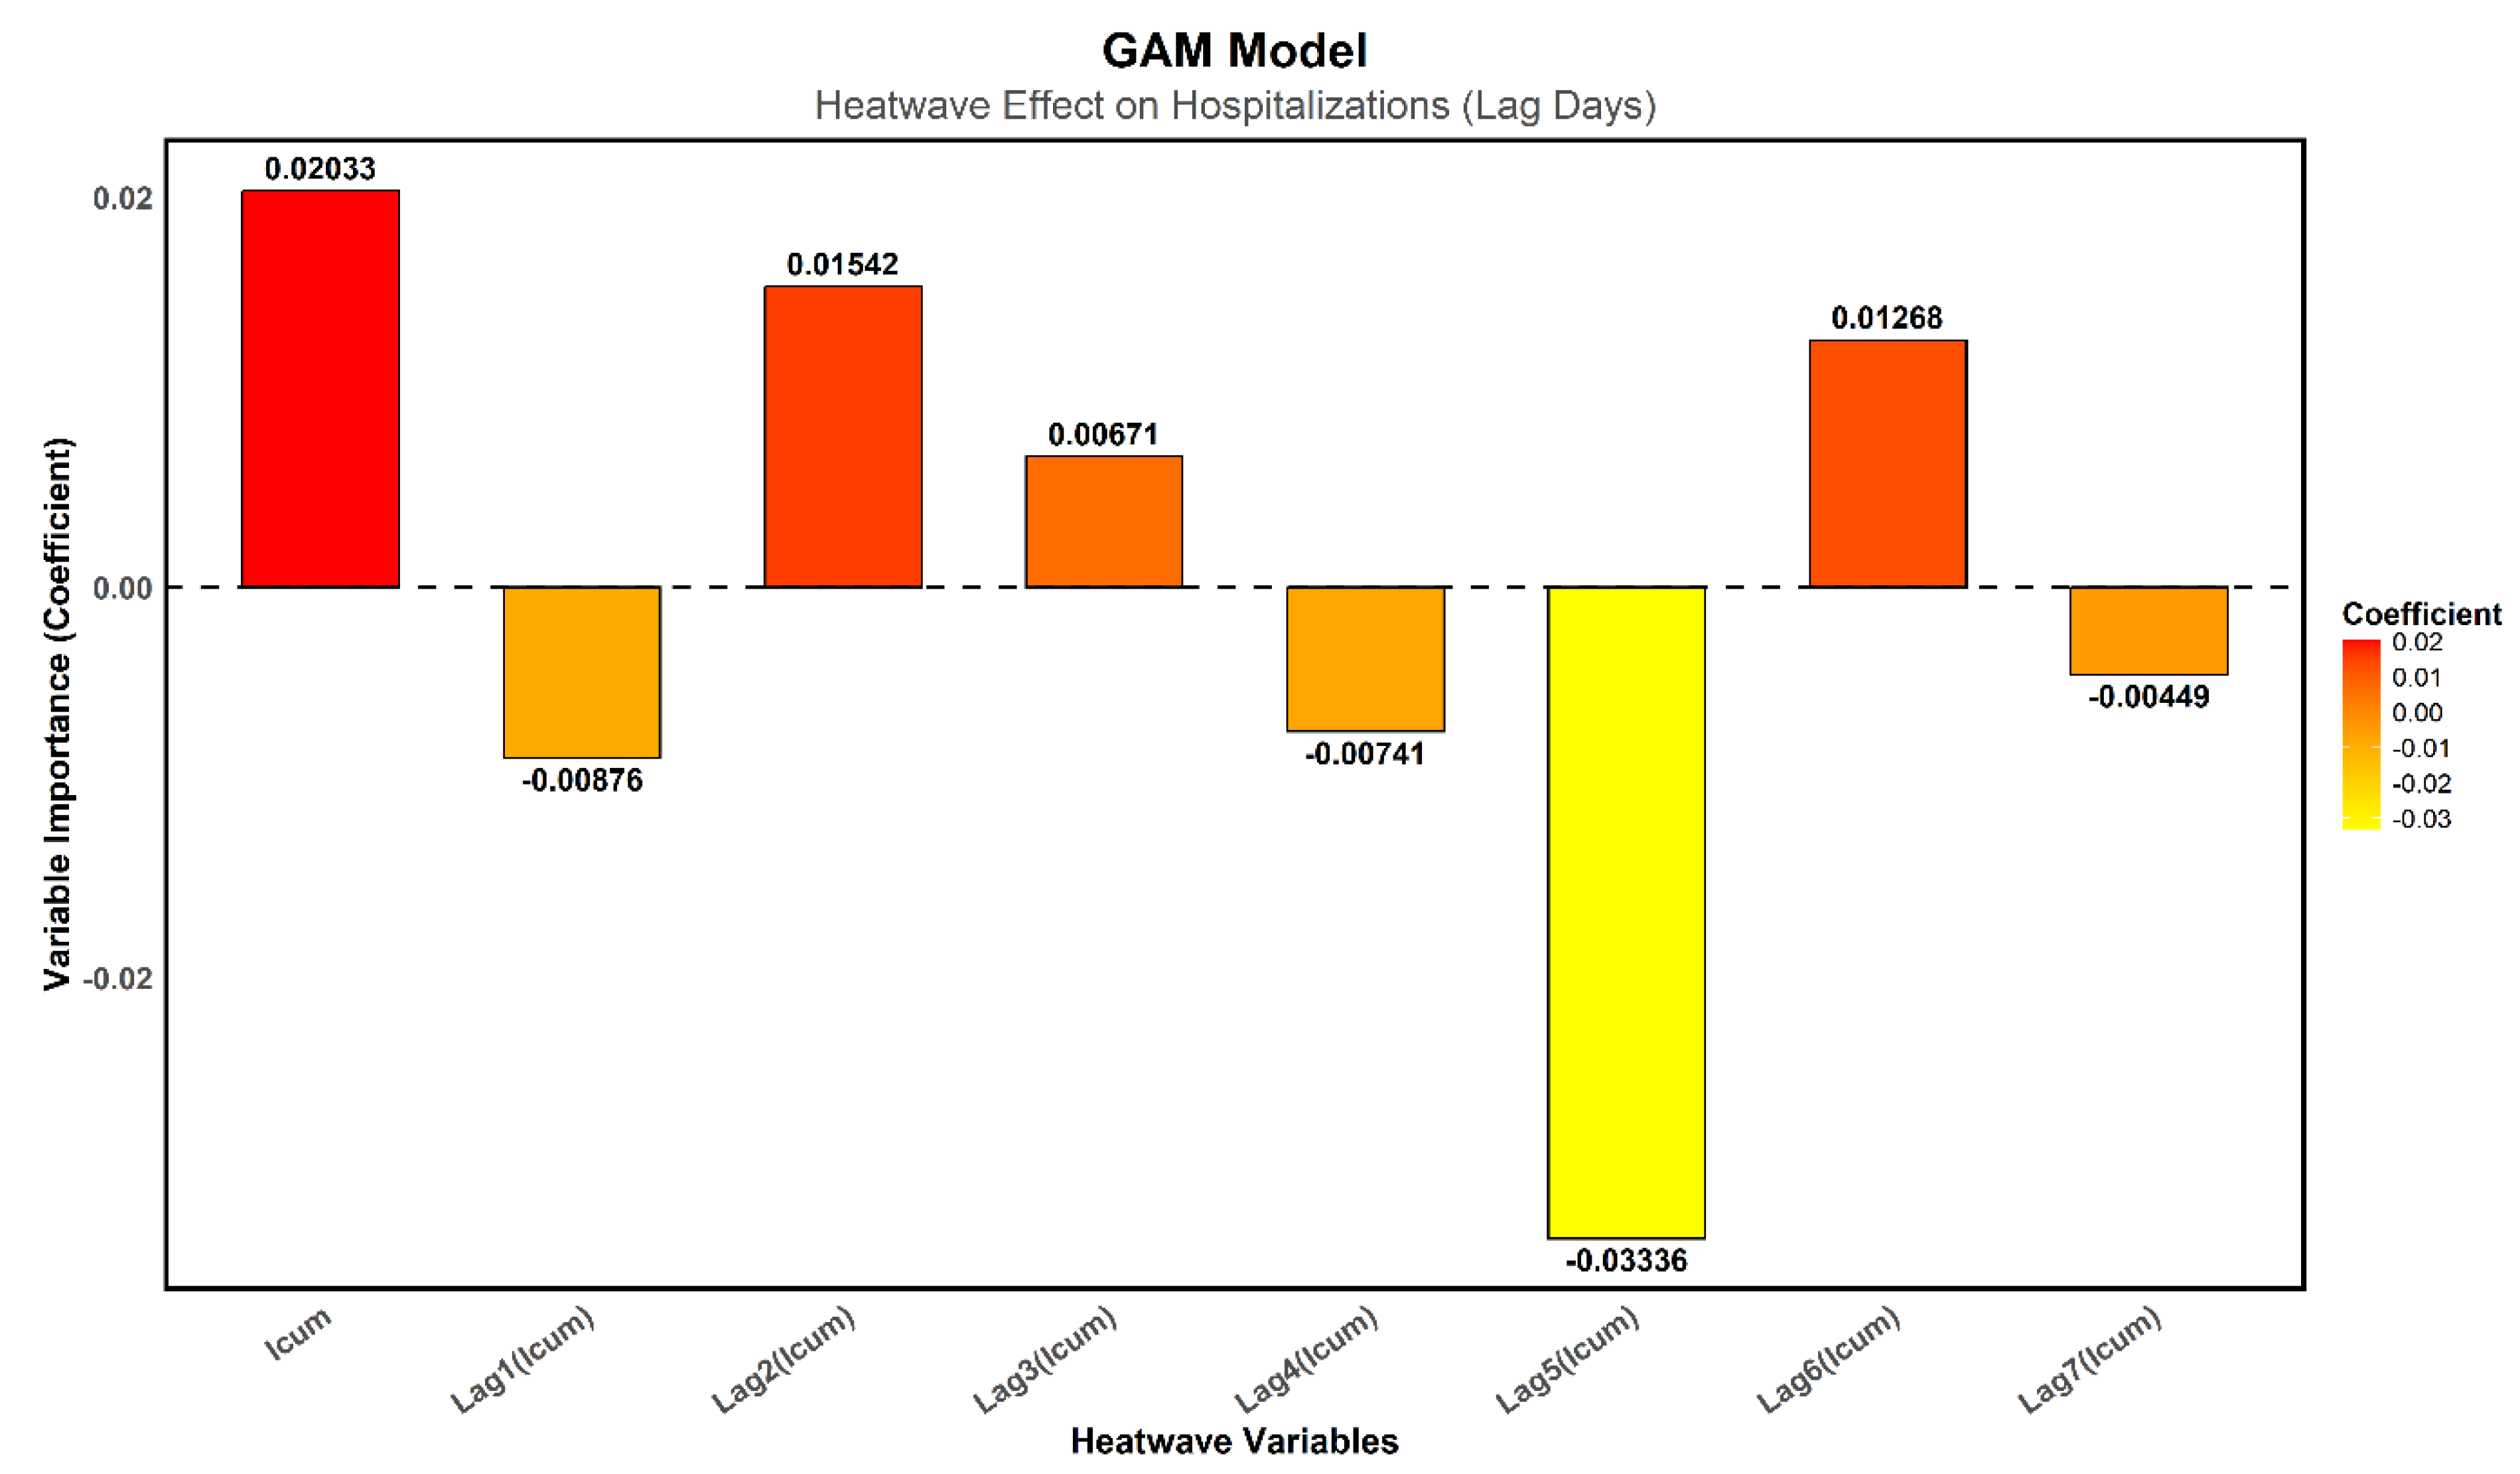
Figure 8.
Importance of Heatwave Variables in the RF Model. A high %IncMSE value indicates a strong contribution to the model. The colors range from red for variables with a high impact to orange and yellow for those with a lower impact.
Figure 8.
Importance of Heatwave Variables in the RF Model. A high %IncMSE value indicates a strong contribution to the model. The colors range from red for variables with a high impact to orange and yellow for those with a lower impact.
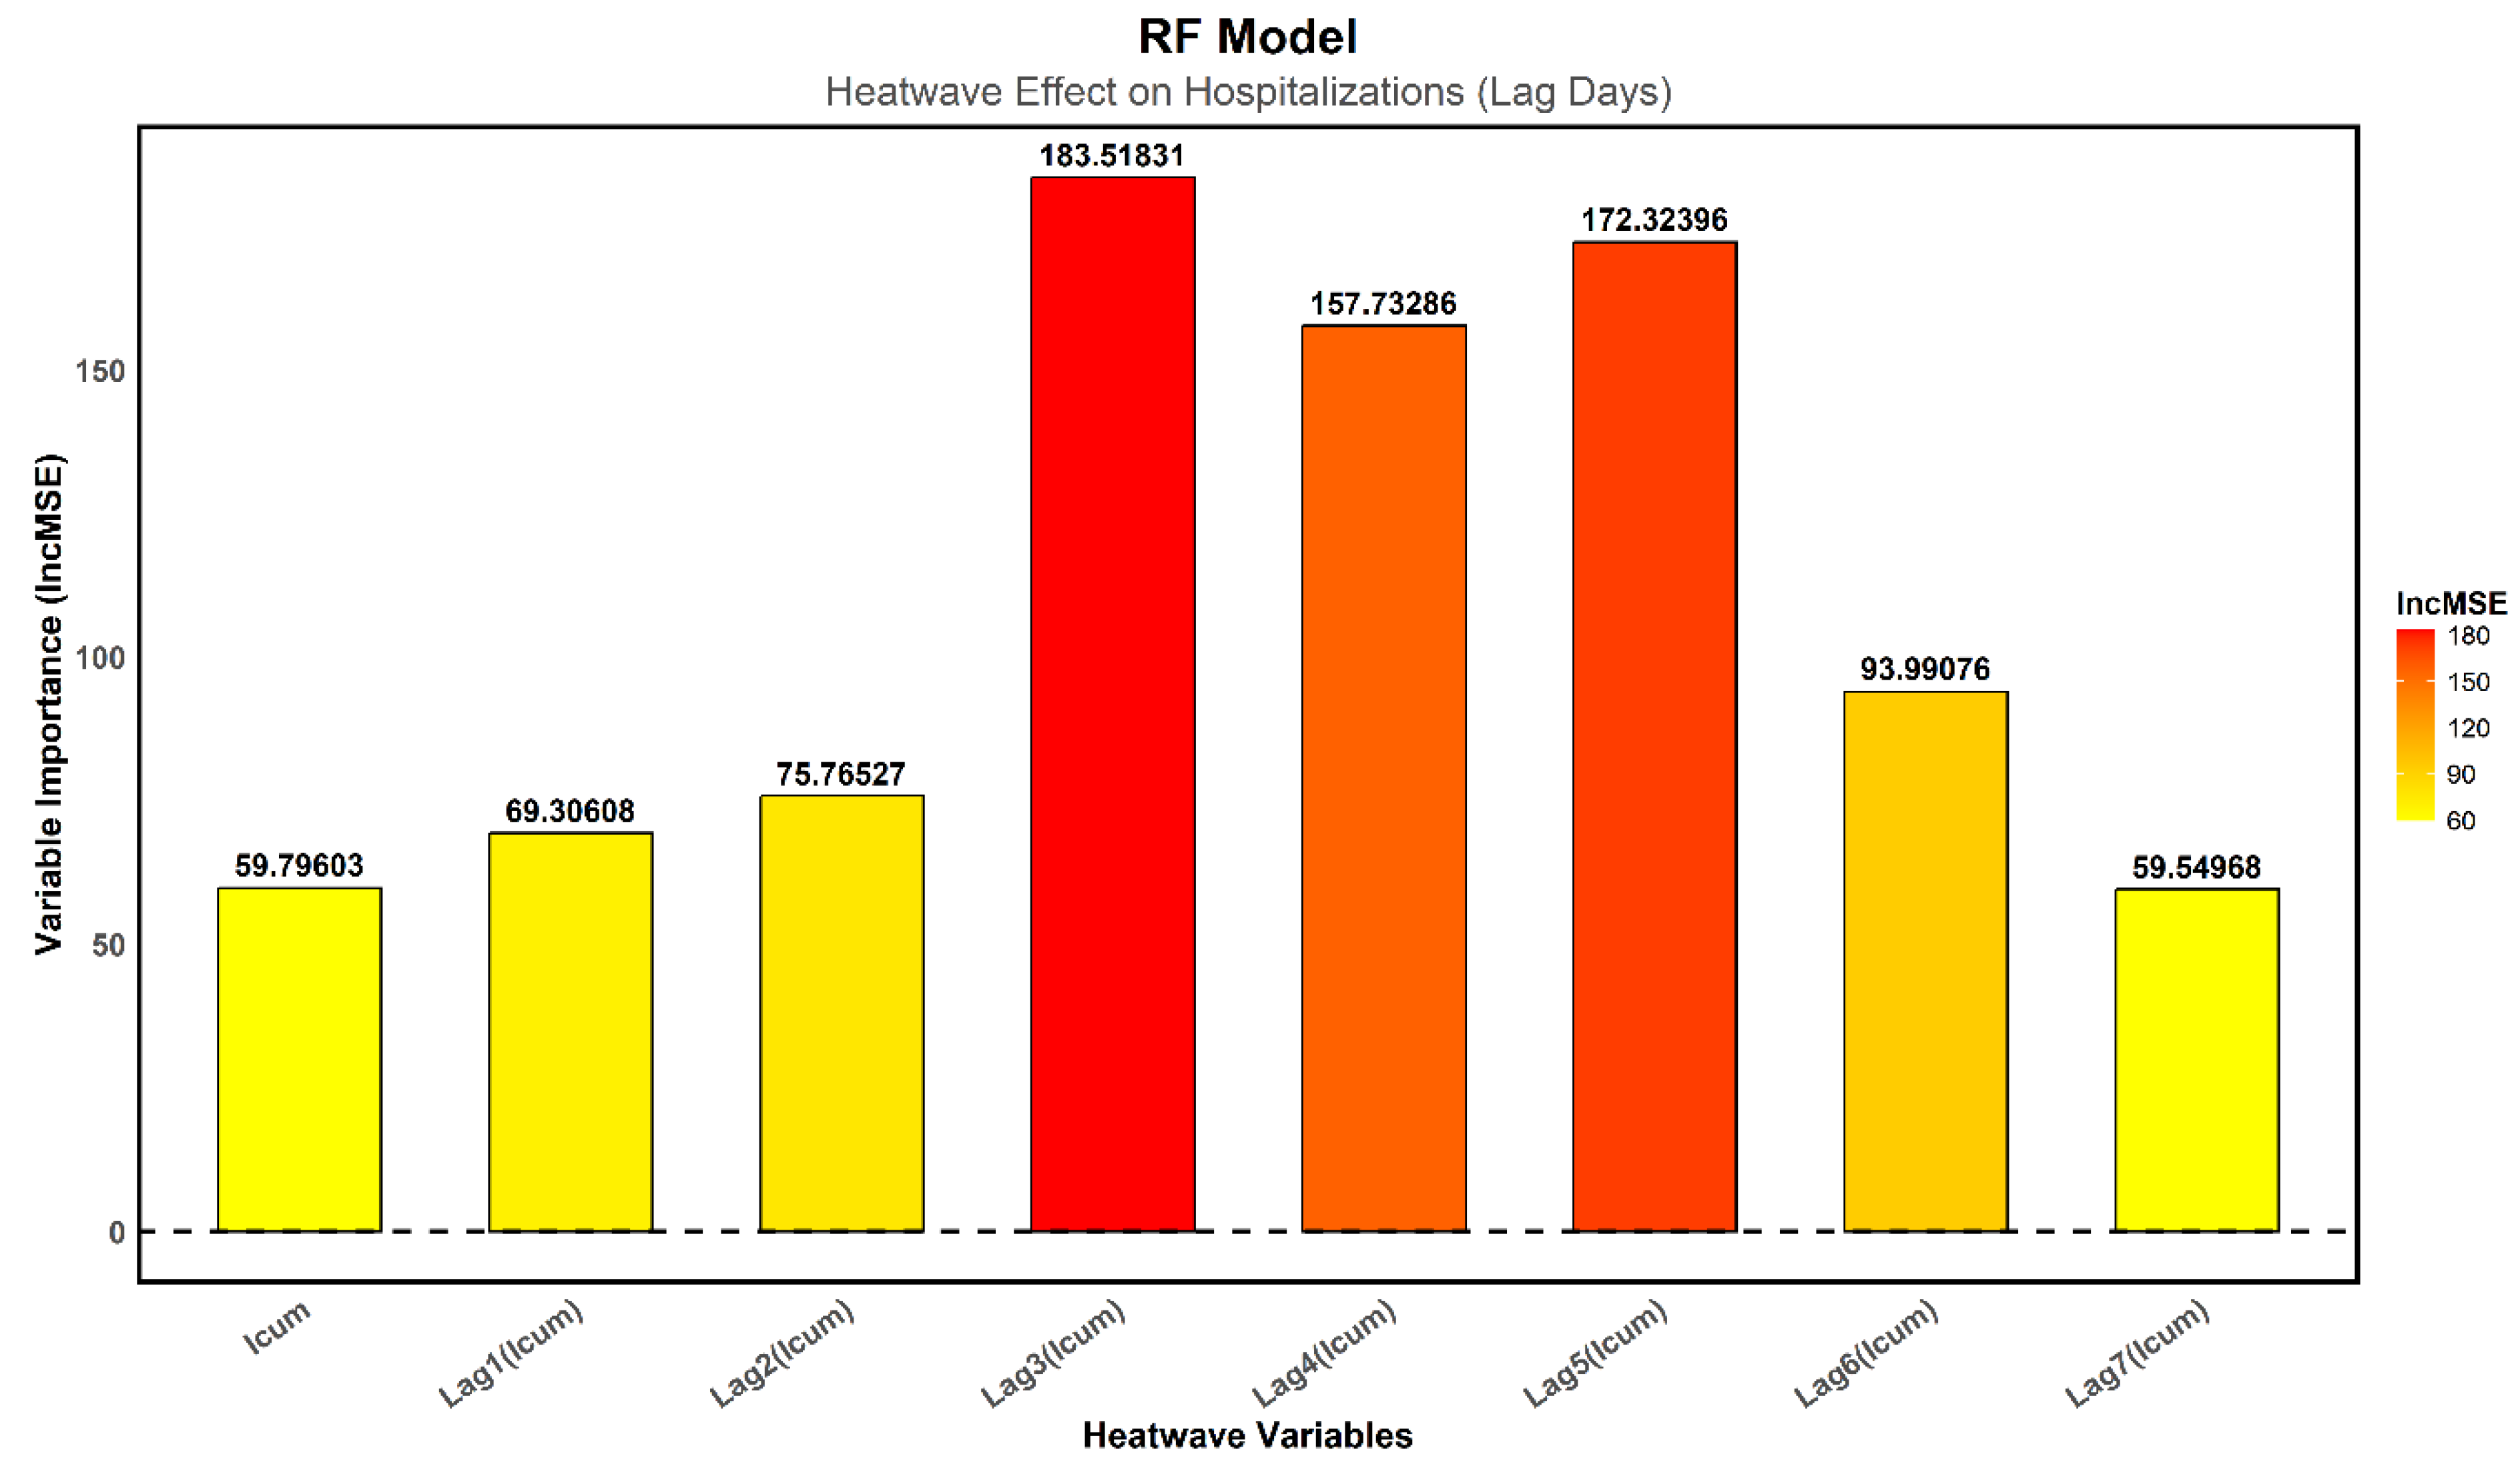
Figure 9.
Importance of heatwave variables in the XGB Model. A higher Gain value indicates a significant contribution. Colors range from red for variables with high impact to orange and yellow for those with lower impact.
Figure 9.
Importance of heatwave variables in the XGB Model. A higher Gain value indicates a significant contribution. Colors range from red for variables with high impact to orange and yellow for those with lower impact.
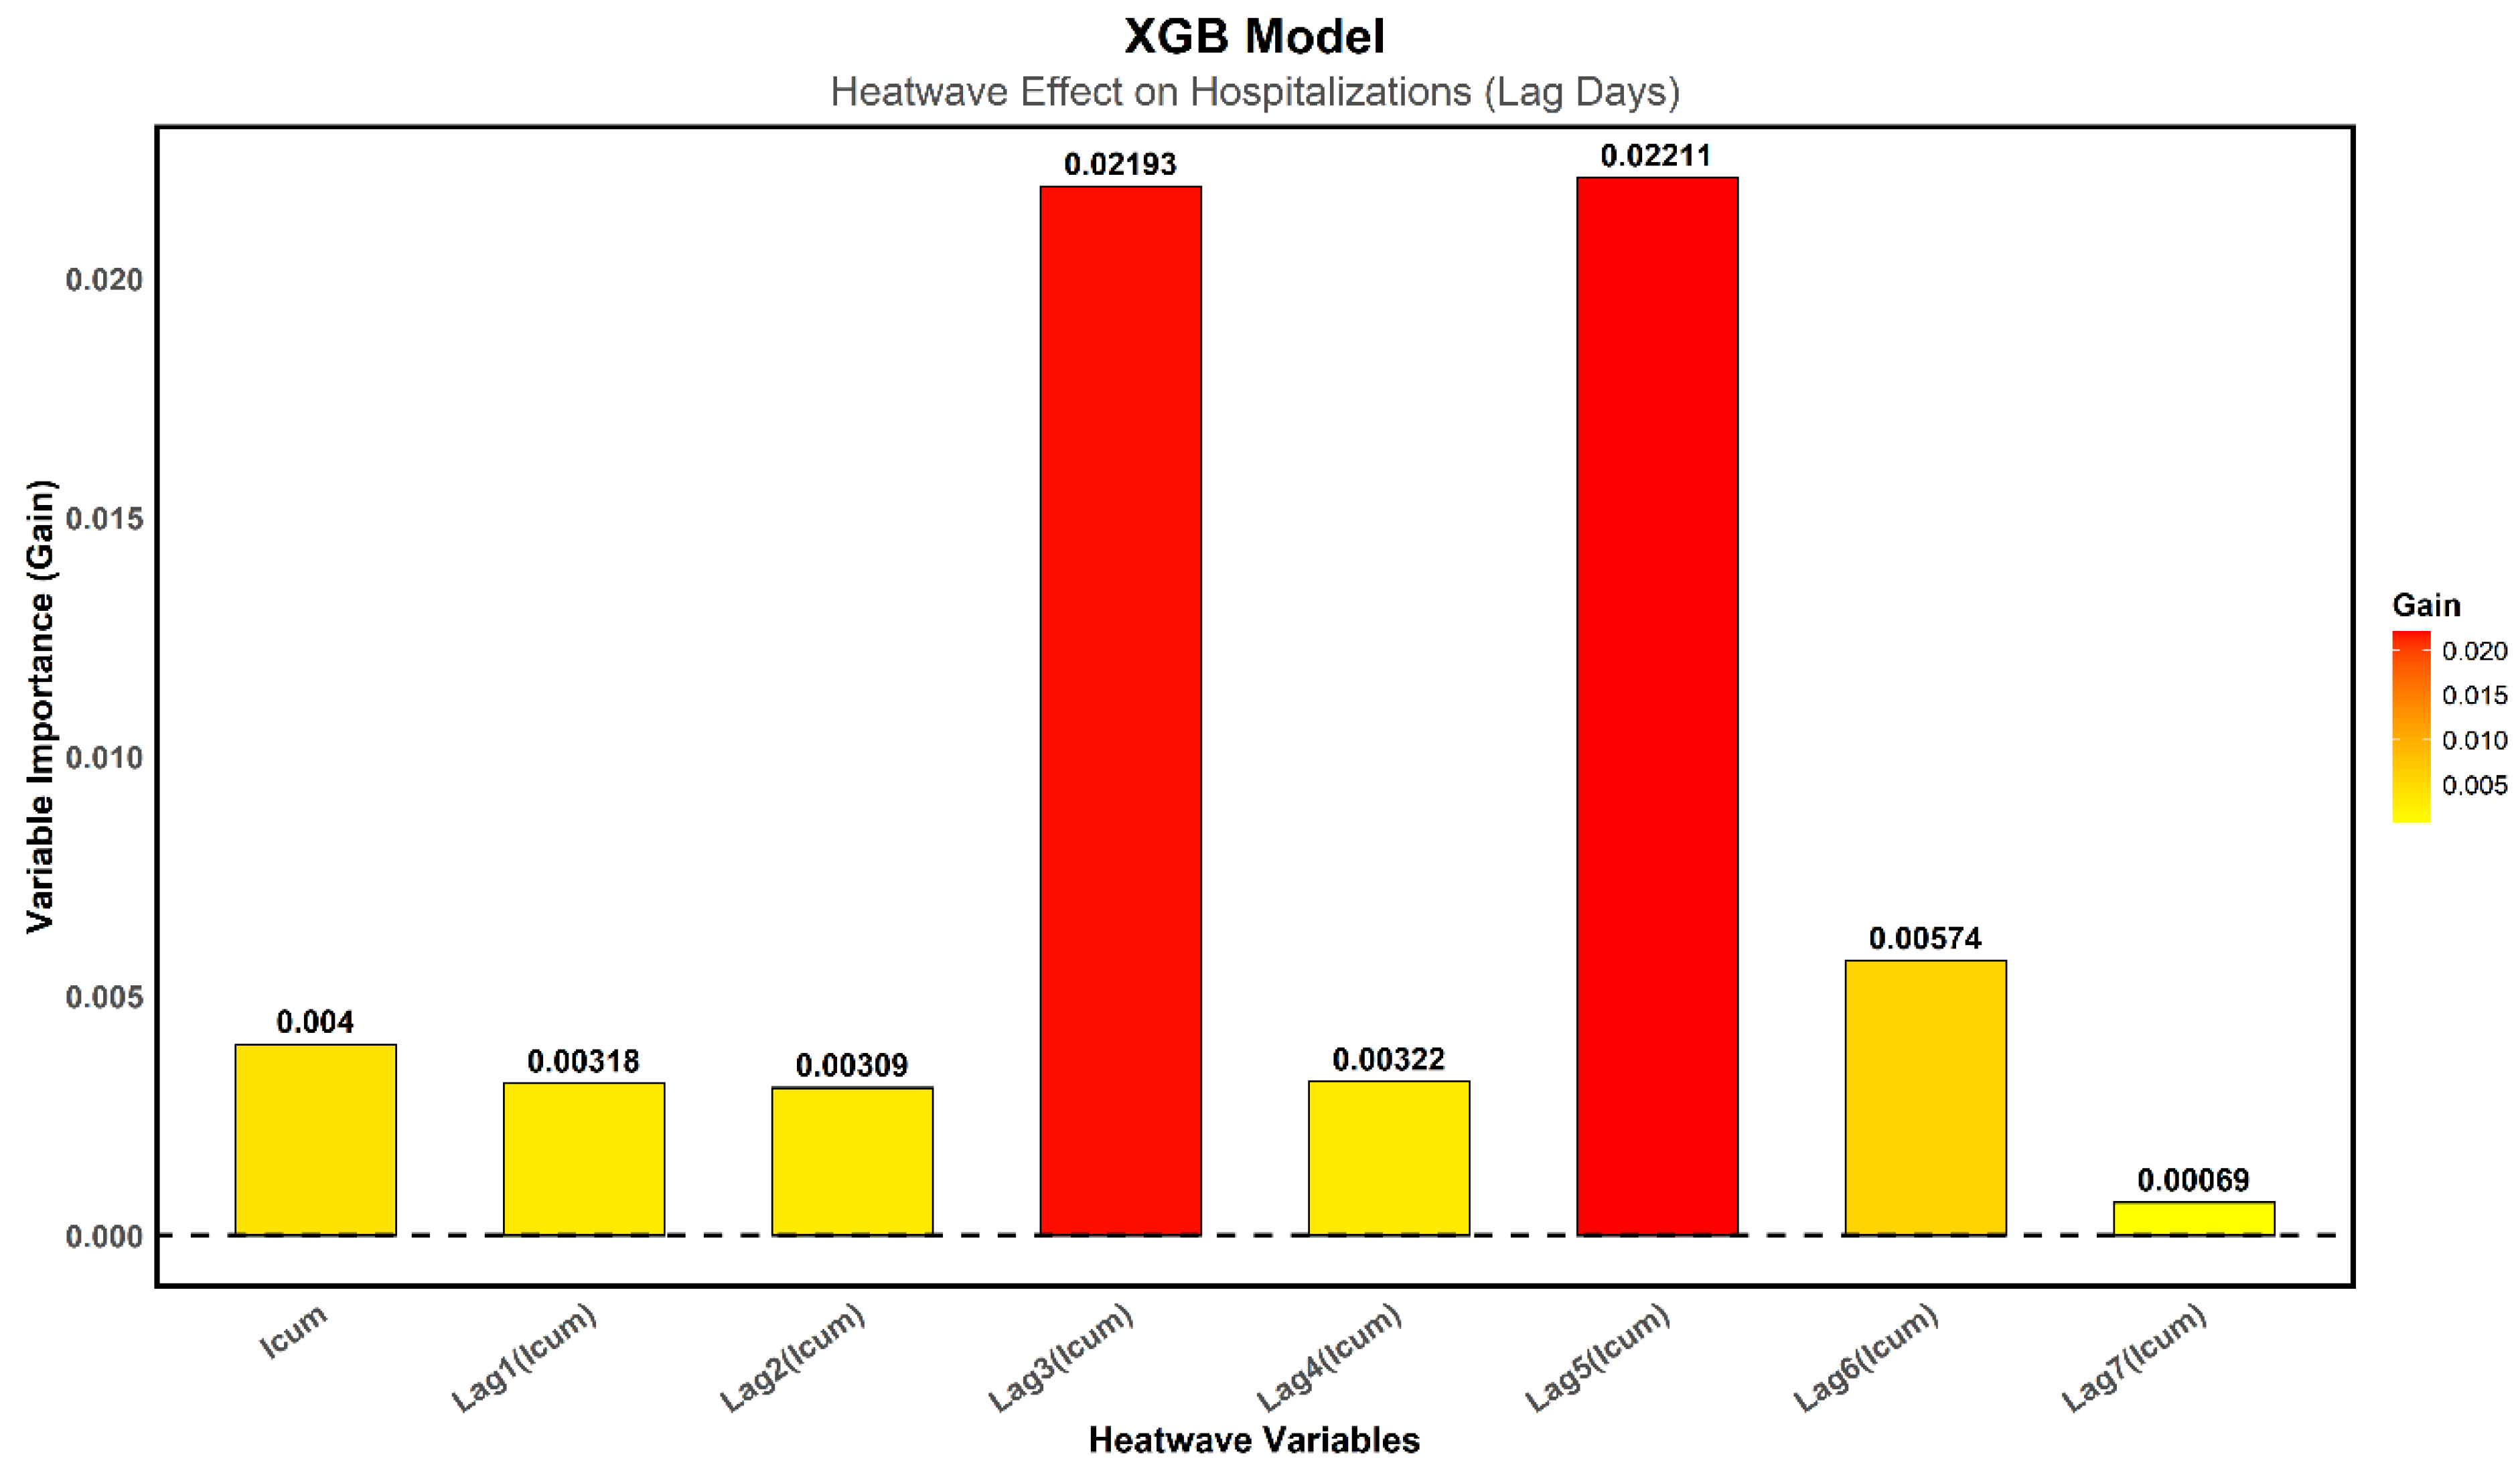
Figure 10.
Relationship between heatwaves (June 15–21, 2019) and hospital admissions.TMAX is shown in black, and hospital admissions in blue. Orange shading indicates days exceeding the temperature threshold (90th percentile, green line), and red shading marks the heatwave period.
Figure 10.
Relationship between heatwaves (June 15–21, 2019) and hospital admissions.TMAX is shown in black, and hospital admissions in blue. Orange shading indicates days exceeding the temperature threshold (90th percentile, green line), and red shading marks the heatwave period.
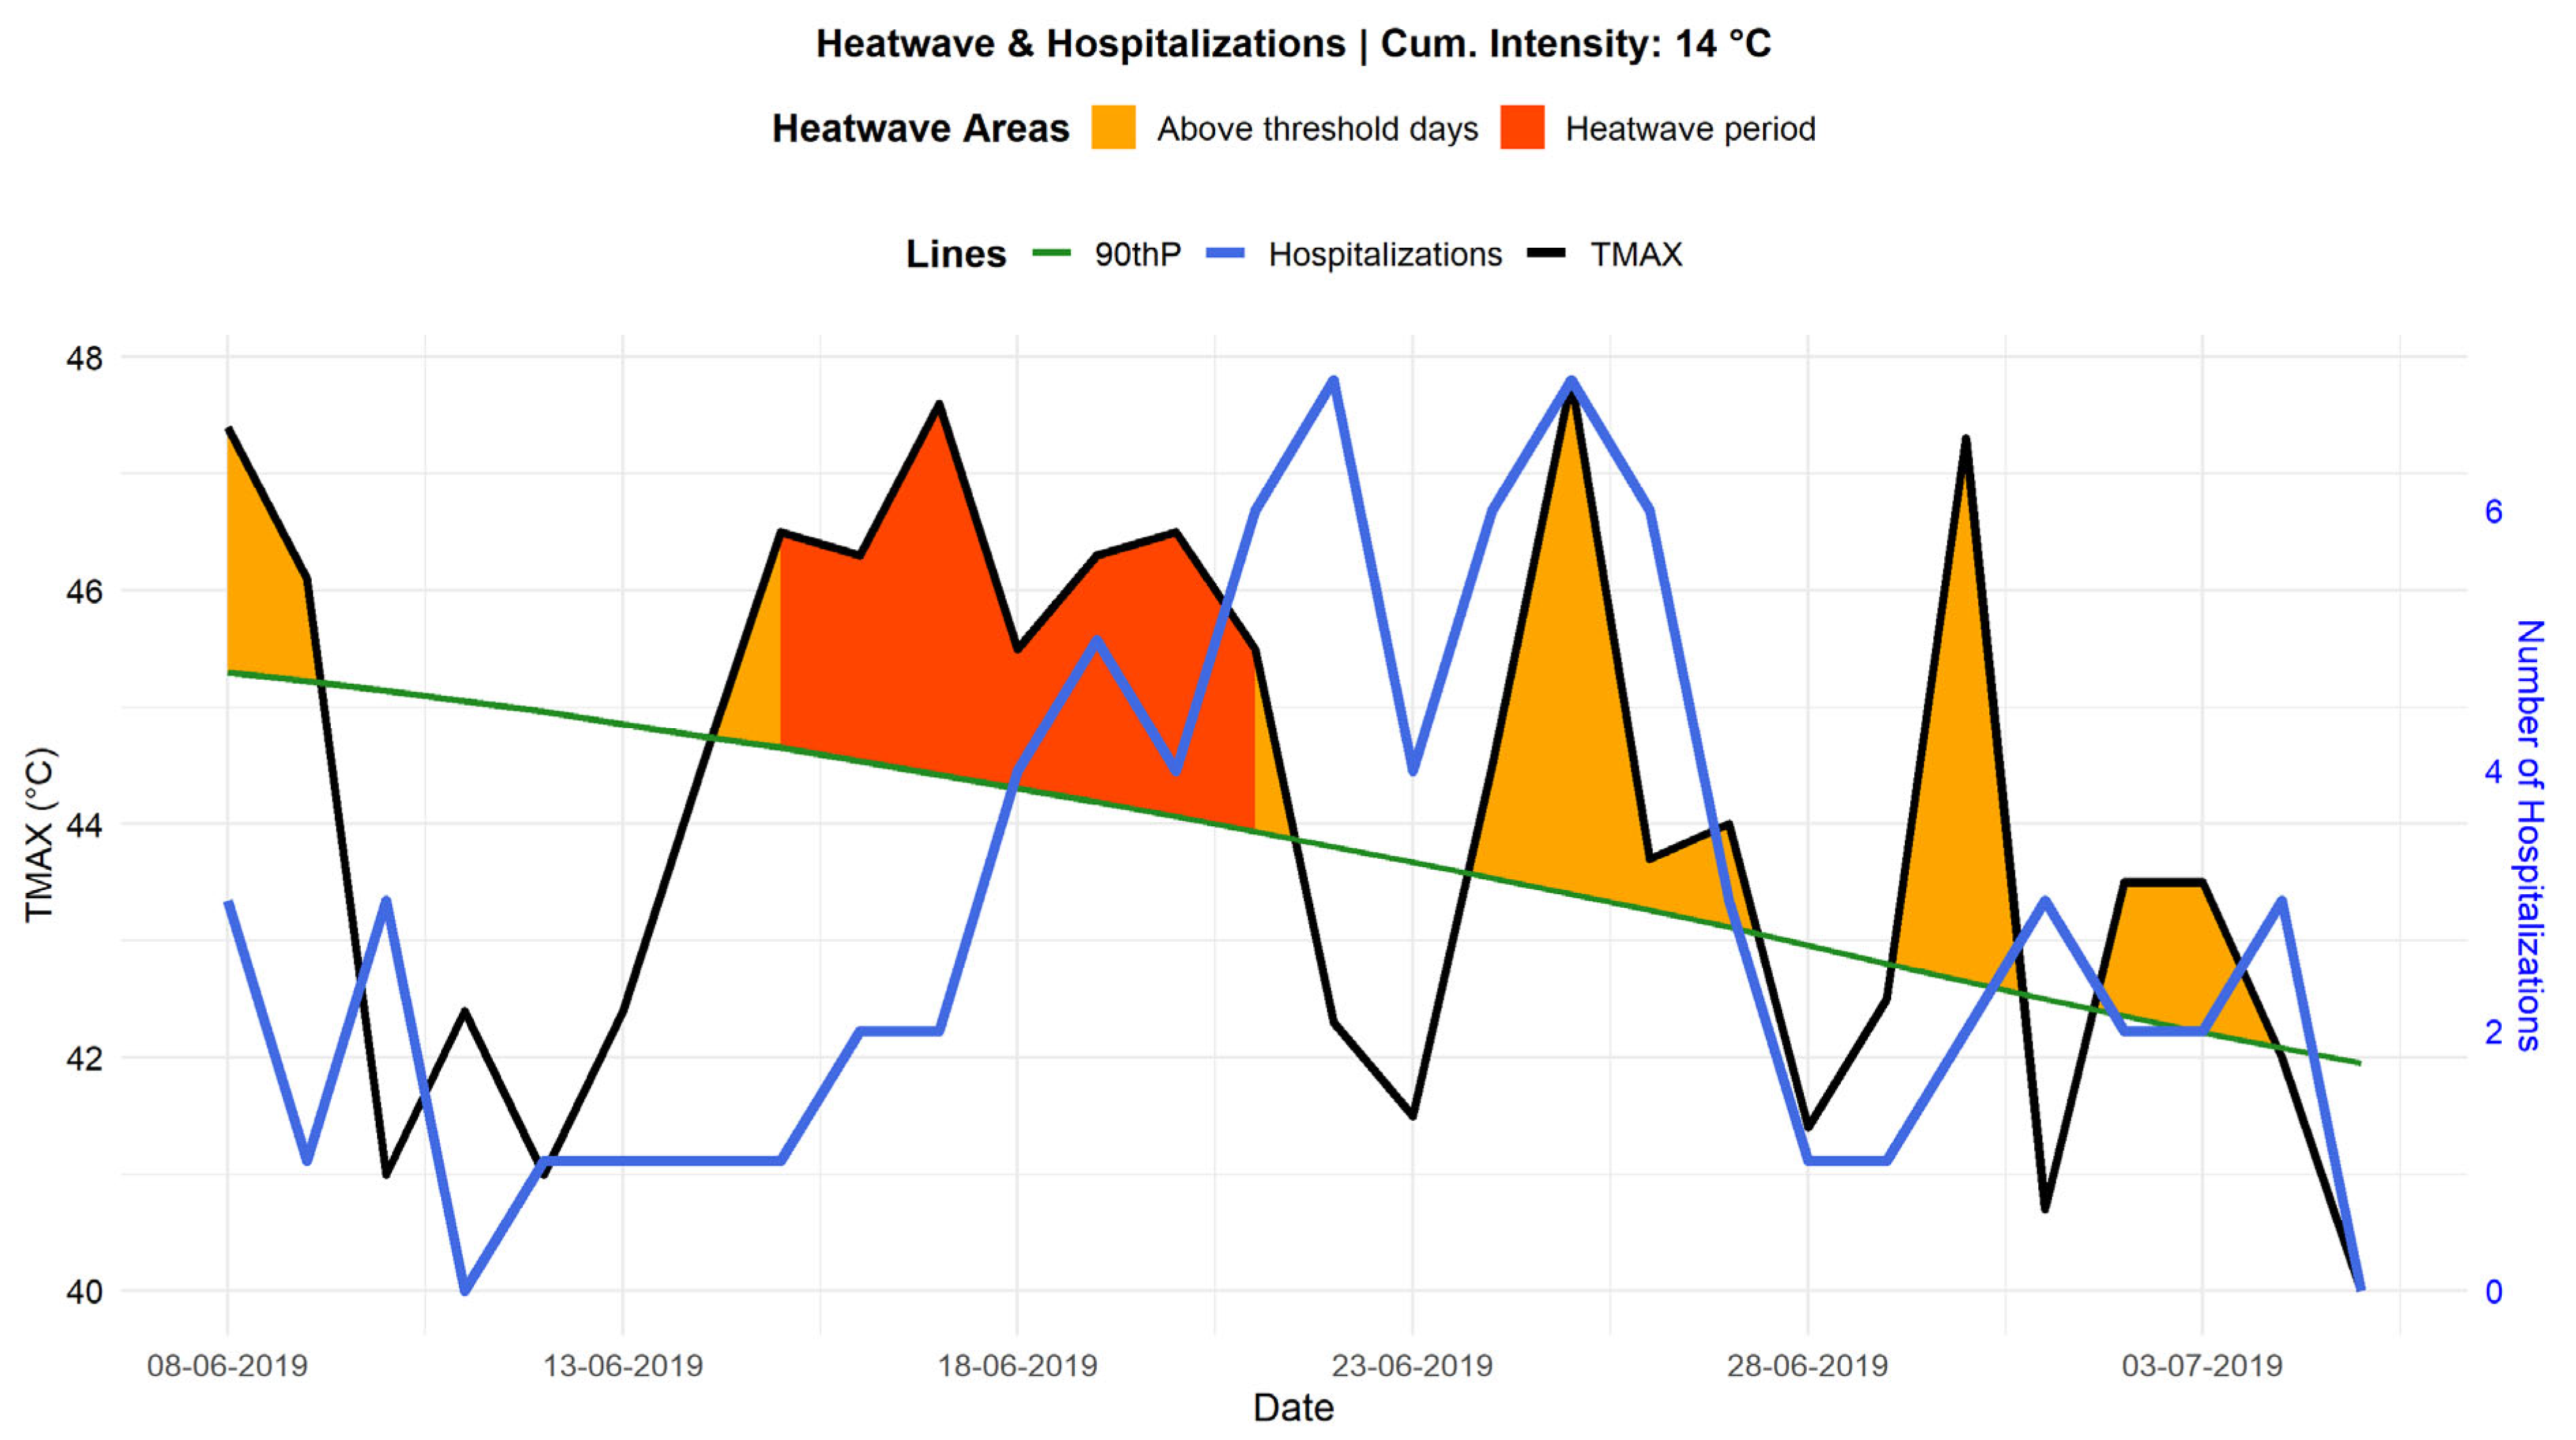

Table 1.
Variables characterizing heatwaves.
| Variable | Formula | Unit | Description |
|---|---|---|---|
| hw | hw = 1 if Index > 90thP for at least 3 days, otherwise 0 | - | Presence of a heatwave. Indicates whether the thermal index exceeds the threshold for at least three consecutive days. |
| D | days | Total duration of the heatwave in consecutive days. | |
| °C | Average excess temperature index above the threshold during the event. | ||
| °C | Maximum excess value reached by the temperature index during the heatwave. | ||
| °C² | Daily variability of excess temperatures. | ||
| °C | Total heat accumulation during the event. | ||
| °C/day | Rate of temperature increase until the heatwave peak. | ||
| °C/day | Rate of temperature decrease after the heatwave peak. |
Table 2.
Error metrics for model evaluation.
| Error Metrics | Formula | Interpretation |
|---|---|---|
| R² | Higher values (closer to 1) indicate better model fit. | |
| RMSE | Lower = better performance | |
| MAE |
where: is the total number of data points; is the predicted value at point i; is the observed value at point i; is the mean of the observed values.
Table 3.
Model performance metrics and parameters.
| Model | R² | RMSE | MAE | Parameters |
|---|---|---|---|---|
| GAM | [0.33; 0.48] | [1.22; 1.5] | [0.89; 0.98] | Family: Poisson |
| RF | [0.51; 0.72] | [0.91; 1.38] | [0.74; 0.89] | Trees: 5000; Optimal number of variables (mtry): 3 |
| XGB | [0.46; 0.72] | [0.91; 1.46] | [0.74; 0.9] | Trees: 100; Max Depth: 3; Learning Rate: 0.05; Gamma: 0; Colsample bytree: 0.8; Subsample: 0.8; Min Child Weight: 1 |
Disclaimer/Publisher’s Note: The statements, opinions and data contained in all publications are solely those of the individual author(s) and contributor(s) and not of MDPI and/or the editor(s). MDPI and/or the editor(s) disclaim responsibility for any injury to people or property resulting from any ideas, methods, instructions or products referred to in the content. |
© 2025 by the authors. Licensee MDPI, Basel, Switzerland. This article is an open access article distributed under the terms and conditions of the Creative Commons Attribution (CC BY) license (http://creativecommons.org/licenses/by/4.0/).
Copyright: This open access article is published under a Creative Commons CC BY 4.0 license, which permit the free download, distribution, and reuse, provided that the author and preprint are cited in any reuse.


