
Submitted:
04 September 2025
Posted:
05 September 2025
You are already at the latest version
Abstract
Solidification cracking and liquation cracking have been reported frequently in additive manufacturing (AM) as well as welding. In the vast majority of weldability tests, a single-pass, single-layer weld is tested though multiple-pass, multiple-layer welding is common in welding practice. In AM, evaluating the cracking susceptibility based on the total number or length of cracks per unit volume requires repeated cutting and polishing of a built object, and the cracks are often too small to open easily for fracture-surface examination. The present study identified an existing weldability test and modified it to serve as a cracking susceptibility test for AM. A single-pass, single-layer deposit of metal powder was made along a slender specimen that was pulled like in tensile testing but with acceleration. Cracks were visible on the deposit surface and opened easily for examination. The critical pulling speed, i.e., the minimum pulling speed required to cause cracking, was determined as an index for the cracking susceptibility. The lower the critical pulling speed is, the higher the cracking susceptibility. 6061 Al and 7075 Al alloys were selected for testing in view of their high susceptibility to solidification cracking and liquation cracking in welding, respectively.
Keywords:
additive manufacturing
; welding
; solidification cracking
; liquation cracking
; directed-energy deposition
; 6061 Al
; 7075 Al
1. Introduction
Liquid metals tend to shrink upon solidification, called solidification shrinkage (e.g., 4 % for Al alloys) [1], and solid metals tend to shrink upon cooling (i.e., thermal contraction). Free contraction of an alloy can be obstructed during solidification and cooling, e.g., by the walls of the casting mold and the solid materials connected to the weld being made. Consequently, tension can be induced, and cracking can occur along a thin grain-boundary liquid that exists during the terminal stage of solidification of an alloy. The resultant intergranular cracking is called hot tearing in casting [1] and solidification cracking in both welding and additive manufacturing (AM) [2]. In any case, the fracture surface is dendritic because cracking occurs during the terminal stage of dendritic solidification. Kou and coworkers [3,4,5] have shown why grain refining can reduce solidification cracking [3], why undercooling due to fast cooling can increase solidification cracking [4], and why back diffusion can reduce solidification cracking [5]. The first two of these three factors are relevant to AM. In arc welding, the most effective way to reduce solidification cracking is to change the composition of the weld metal by using a filler metal different in composition from the base metal [2,6]. This option, unfortunately, is not available in AM. The effect of the composition, back diffusion, grain refining and undercooling can all be shown by a simple index for the susceptibility to solidification cracking proposed by Kou [7,8].
In welding of an alloy, the fusion zone refers to the region in which the alloy melts completely and solidifies, and the partially melted zone (PMZ) refers to the region immediately outside the fusion zone, heated above the liquid-forming temperature, e.g., the eutectic temperature in most Al alloys [2,6]. Melting occurs only along grain boundaries and at isolated spots within grains. So, liquid formation, i.e., liquation, occurs along grain boundaries in the PMZ to form a thin grain-boundary liquid, and intergranular cracking can occur along the grain-boundary liquid in the PMZ, called liquation cracking. The fracture surface is not dendritic because non-dendritic grains already exist in the PMZ before cracking. Like solidification cracking in arc welding, the most effective way to reduce liquation cracking is to change the composition of the weld metal by using a filler metal different in composition [2,6], but this is not feasible in AM. Decreasing the heat input per unit length of the weld can decrease the extent of liquation and hence liquation cracking [2]. This is true both in welding and AM.
Kannengiesser and Boellinghaus [9] reviewed the weldability tests developed to evaluate the susceptibility of alloys to hot cracking during welding, i.e., solidification cracking, liquation cracking and ductility-dip cracking. In the vast majority of weldability tests, a single-pass, single-layer weld is tested though multiple-pass, multiple-layer welding is common in practice. This is because a weldability test is typically designed to show cracks clearly and evaluate the cracking susceptibility easily, not to duplicate the welding procedure even when it is a multiple-pass, multiple-layer one. For example, the effect of the alloy composition on the cracking susceptibility can be shown quickly to decide how to adjust the composition to reduce the cracking susceptibility. For another example, the effect of inoculation can be shown quickly to determine which inoculant is effective and how much is needed.
As in welding, solidification cracking and liquation cracking have also been reported frequently in additive manufacturing (AM) [10,11,12,13,14] and shown to degrade mechanical properties [11]. In AM the PMZ of the current pass can be located inside either the substrate or the fusion zone of a previous pass or layer next to the current pass.
Similar to welding, grain refining has been used in AM to reduce solidification cracking, e.g., by inoculation [15,16,17]. A master alloy containing a grain-refining agent was added to the melt and atomized [15]. Particles of a grain-refining agent were attached to the powder for AM by a special coating procedure [16]. Ultrasonic grain refining was applied during deposition [18]. Substrate preheating has been reported to reduce solidification cracking in AM [19,20]. Substrate cooling, on the other hand, was reported to reduce liquation cracking in AM [21].
In AM most cracks are located inside a built object, not visible from outside. Cracks can be found by cutting, polishing, and etching at various depths under the surface of the object. Cracks are often small and difficult to open up to examine the fracture surfaces to identify the type of cracking or further analyze cracking. The cracking susceptibility is often assessed based on the total number or length of cracks per unit volume. Naturally, this can be time consuming, and some cracks may be missed.
The purpose of the present study was to identify a weldability test that could be modified and used as a test for evaluating the susceptibility to solidification cracking and liquation cracking in AM. To prove the concept of the test, the present study was conducted to determine the following: 1. if the test could be conducted inside an Ar-filled chamber for AM, 2. if specimens could be tested one by one without opening the chamber, 3. if cracks could be readily visible, 4. if fracture surfaces could be accessed easily to identify the type of cracking, and 5. if the cracking susceptibility under the deposition and testing conditions used could be determined.
2. Materials and Methods
2.1. Identifying a Weldability Test for AM
A series of specimens needs to be tested to see the differences in their cracking susceptibility in order to determine the effect of a certain factor on the cracking susceptibility, e.g., the alloy composition or a process parameter. This is easy in arc welding because it can be done in open air. However, this can be challenging in AM because it needs to be done in an Ar-filled chamber, e.g., a LENS MR7 chamber for laser directed-energy deposition. If the chamber has to be opened in order to remove one tested specimen and mount the next specimen, overnight Ar purging will be required to remove oxygen from the chamber. So, specimens need to be tested one by one without opening the chamber. Typically, two long rubber gloves at the front panel of the chamber are available for specimen manipulation inside the chamber.
Since many weldability tests have been developed and their reliability has been verified extensively [9], it is desirable to identify a weldability test that can be modified into a test for evaluating the cracking susceptibility of alloys in AM. However, the authors are unaware of any existing weldability tests being used in AM.
In the present study, the first step was to identify an existing weldability test that potentially could be modified into a cracking susceptibility test for AM. Which weldability test is a good candidate may become obvious after it has been identified and tried but certainly not before. During the course of the present study, it became increasingly clear to the authors that a weldability test with any of the following requirements might be difficult to use for AM:
(1) Lengthy specimen mounting/removal: A weldability test such as the Sigmajig test [22] uses many (ten) screws to clamp down a specimen and pre-stretch it. This lengthy procedure can be difficult to perform with gloves from outside an Ar-filled chamber.
(2) Welding along a joint: Since a single-pass, single-layer deposit is narrow and shallow, precise alignment with a joint and melting/wetting both sides of the joint can be difficult. For example, the Circular-Patch test [23] has a butt joint, and the Transverse-Tension Weldability test [24] has a lap joint.
(3) Transverse tension during welding: The workpiece is typically greater in length than width. So, transverse tension, e.g., in the Controlled-Tension Weldability test [25], requires a heavier horizontal tensile testing machine than longitudinal tension.
(4) Instantaneous tension during welding: The widely used Varestraint test [26] is an example. Since the liquid pool in arc welding travels slowly, the tension applied instantaneously has risen to its full level before the pool travels significantly. However, since the liquid pool in AM travels fast, the pool has already moved significantly while the tension is still rising, i.e., the applied tension varies along the deposit.
(5) Automatic crack initiation at specimen’s leading edge: A weld pool fully penetrating through the specimen at its leading edge may initiate cracks automatically when the pool travels inward, e.g., in the Houldcroft test [27]. In AM, the liquid pool can be too shallow to penetrate through the thickness of the specimen.
(6) Automatic crack initiation in a pre-stressed specimen: When a rectangular specimen is pre-stressed in the longitudinal direction [28,29] before welding, cracks may be initiated near a weld pool that penetrates through the thickness of the specimen. Examples included a specimen thickness of 2.3 mm in arc welding [28] and 2.0 or 5.7 mm in laser welding (in the so-called U-Type Hot Cracking test [29]). Since the liquid pool is shallow in AM, cracks may not be initiated.
The present study identified one weldability test that does not have any of the six requirements mentioned above. It was a German weldability test called the PVR test [30,31,32], which in German stands for the Programmierter (Programmable) Verformungs (Deformation) Riss (Crack) test [30]. Figure 1 shows an example of the PVR test [32], with a rectangular plate as the specimen, 300 mm long, 40 mm wide and 3.5 mm thick. The specimen is joined to a grip at each end. One end is fixed, and the other is pulled as in tensile testing to induce cracking near the weld pool while the specimen is welded along its centerline at the welding speed Vweld. Pulling is accelerated linearly with time. The pulling speed Vpull at which the first crack forms represents the minimum pulling speed required for cracking, i.e., the critical pulling speed Vcr, which can be determined as follows:
where a is acceleration and L1st is the distance between the first crack and the starting end of the weld. The ratio L1st / Vweld represents the time available for acceleration. Vcr can be considered as an index for the cracking susceptibility. The lower Vcr is, the higher the susceptibility to cracking.
Vcr= a (L1st/ Vweld)
The second step was to check the reliability of the PVR test. According to the review by Kannengiesser and Boellinghaus [9], “The PVR-test is a convenient tool principally for arc welding, laser beam welding, and hybrid welding with or without filler material. It has been standardized in ISO17641 [33] owing to its high repeat accuracy and ease of handling.” and “The PVR test can be used to investigate all types of hot cracks.” So, the PVR test is reliable and potentially can be modified into a susceptibility test for solidification cracking and liquation cracking in AM.
2.2. The Proposed Cracking Susceptibility Test for AM
The third step was to modify the PVR test as a test for evaluating the cracking susceptibility in AM as follows. The tensile testing machine selected was compact enough to fit in an Ar-filled chamber designed for AM. The workpiece (i.e., the specimen) travelled because the heat source (i.e., the laser beam) was stationary. So, the tensile test machine selected was light enough to travel quickly with the base that supported it and the specimen. A slender specimen was designed to allow pulling by a compact light tensile test machine. Lastly, metal powder was fed into the stationary laser beam.
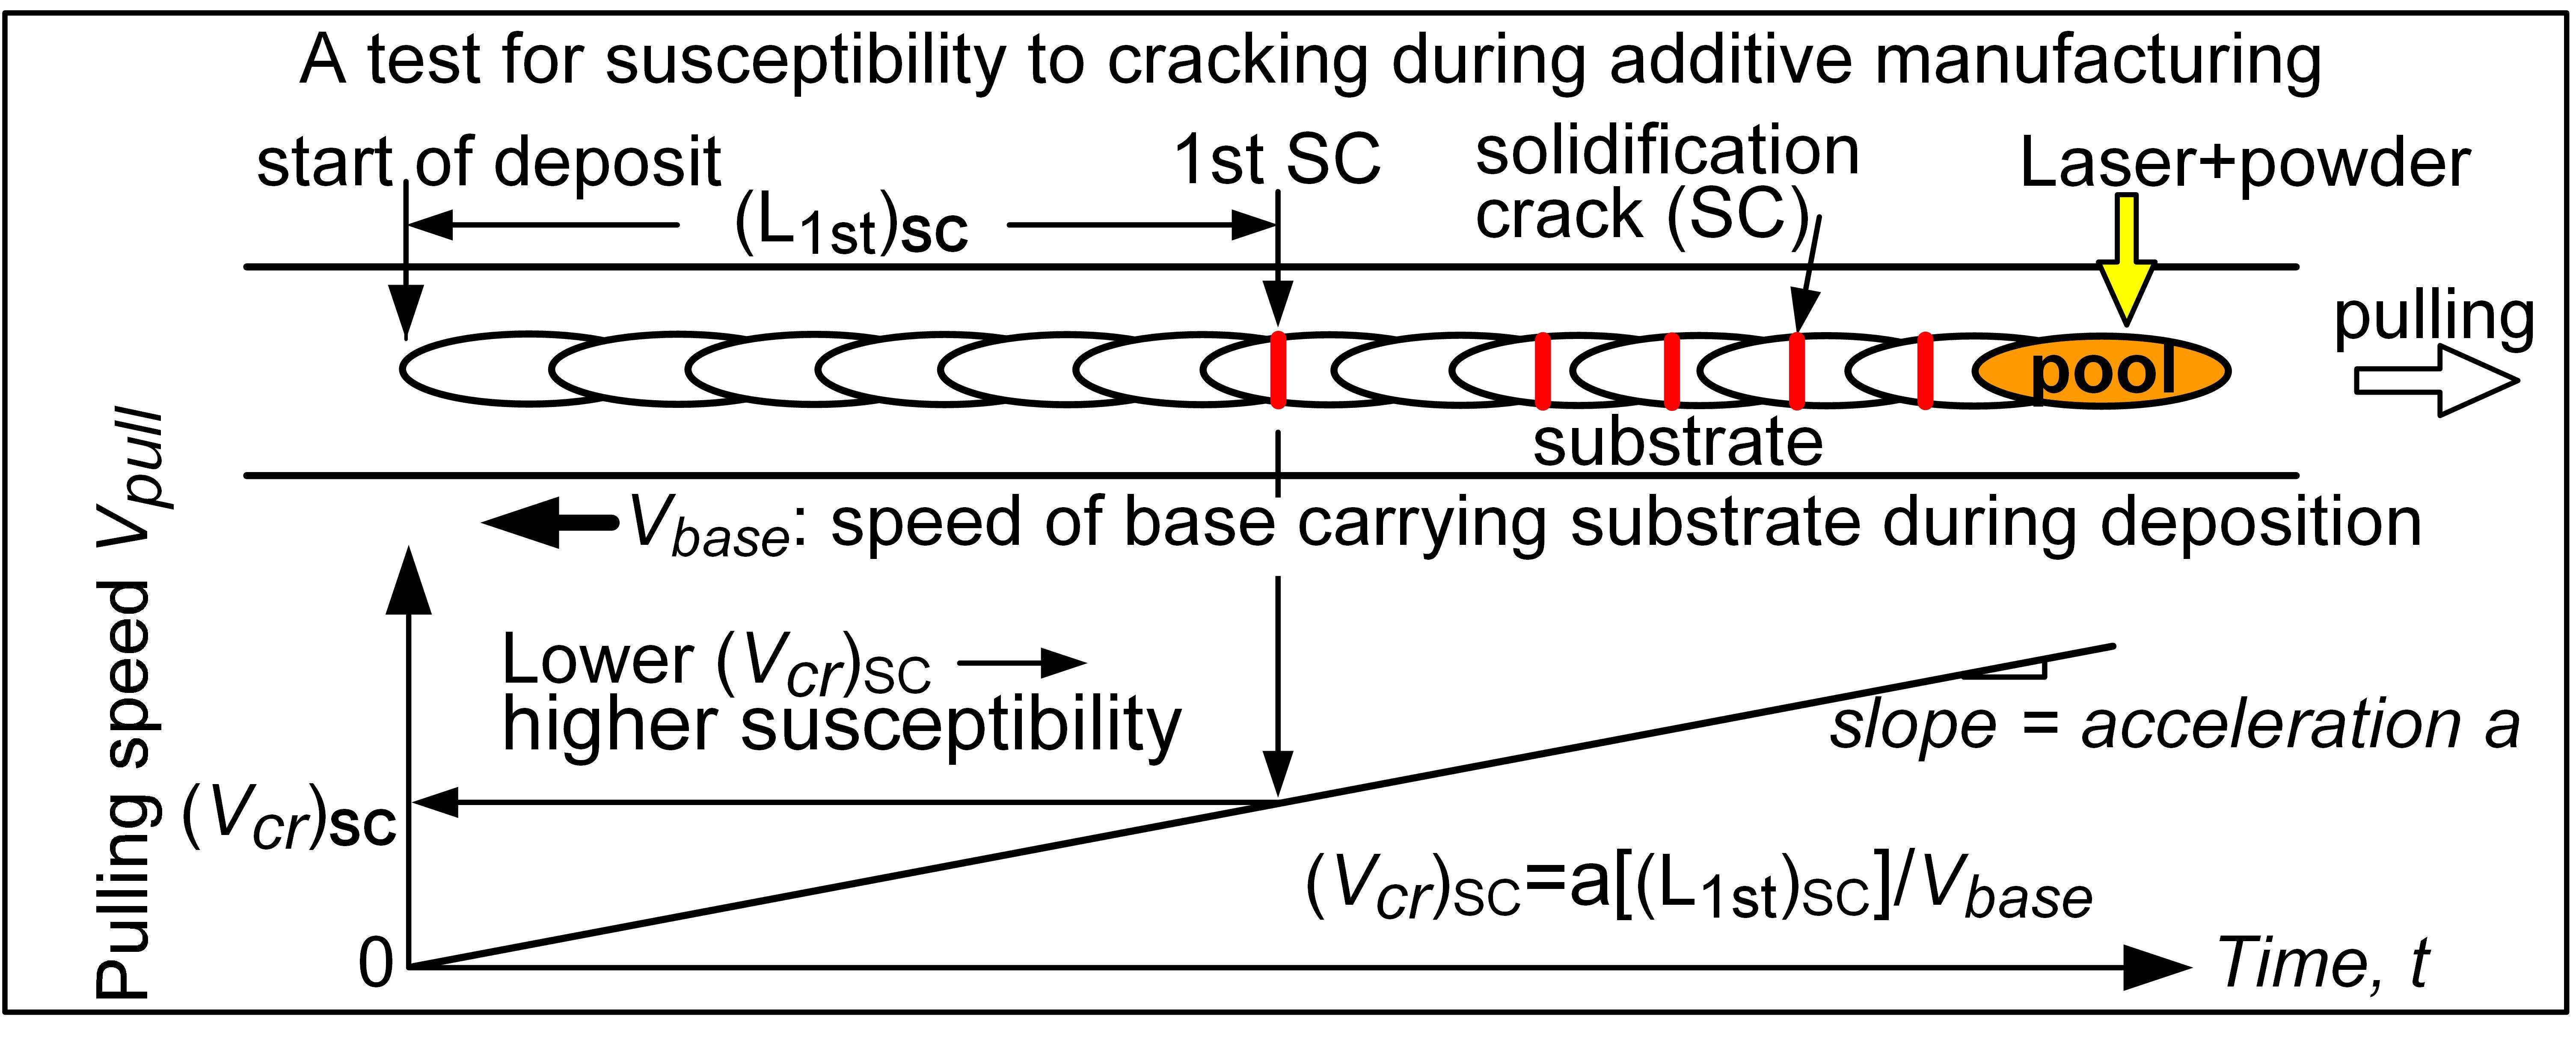
As illustrated in Figure 2, the substrate was in the form of a slender tensile test specimen (details described later), mounted on a base that traveled at the speed Vbase under a stationary laser beam, to which metal powder was fed to deposit powder along the specimen. While one end of the specimen was fixed on the base, the other end was pulled at the speed Vpull by a preprogrammed servomotor. This test can be extended to study the effect of substrate preheating on cracking by heating the specimen from below.
The specimen was a pin-loaded specimen, with two end sections and a slender gauge section in between. The end sections were similar to those in a flat specimen for tensile testing. The dimensions shown in Figure 2 were chosen to be similar to those of Kotkunde et al. [34] for ASTM E8/E8M-11 sub-size standard specimen, but the length of the gauge section was extended to 365 mm in order to accommodate very fast deposition speeds (e.g., 100 mm/s) if needed. However, this length could be reduced significantly as the typical travel speed in laser directed energy deposition can be much slower. The use of a pin-loaded tensile test specimen allowed a specimen to be mounted and removed easily from outside the Ar-filled chamber. Prior to the test, both the travel of the base and the accelerated pulling of the specimen were preprogrammed with the help of two servo motors [35].
The distance between the first crack and the starting end of the deposit L1st was measured after the test. The quantity (L1st / Vbase) represents the available deposition time at constant acceleration from zero travel speed to Vbase. Since the travel speed Vbase is much greater than Vpull, the critical pulling speed velocity can be determined as follows:
Vcr = a (L1st / Vbase)
As in the PVR test, Vcr can be considered as an index for the cracking susceptibility, i.e., the lower Vcr is, the higher the cracking susceptibility.
6061 Al alloy was selected in view of its high susceptibility to solidification cracking in welding [36,37,38]. Spherical gas-atomized 6061 Al powder, supplied by Valimet, Inc., Stockton, CA, was used for directed energy deposition by laser. In gas-metal arc welding, the susceptibility of 6061 Al to solidification cracking was tested by welding a 6061 Al workpiece with a 6061 Al wire as a matching filler metal [38]. So, in AM by laser directed energy deposition, the susceptibility of 6061 Al to solidification cracking was tested by depositing 6061 Al powder on a 6061 Al substrate. Since solidification cracking occurs in the region where the substrate is melted completely, whether the substrate is a wrought 6061 Al or an AM-prepared 6061 Al does not matter. What matters is the composition of the deposit. Thus, for convenience, wrought 6061 Al was used as the substrate.
6061 Al powder was also deposited on a 7075 Al substrate in view of the high susceptibility of 7075 Al to liquation cracking in welding [39,40]. For convenience, wrought 7075 Al was used as the substrate. This represented the case of a PMZ in the substrate at the start of AM. To consider a PMZ in a previous pass or layer next to the liquid pool during AM, a groove can be prepared in a wrought 7075 Al sheet and filled with laser-deposited 7075 Al powder. The groove can be about 3 mm wide and 2 mm deep (wider and deeper than the deposit expected in a cracking-susceptibility test) and longer than the expected L1st. Waterjet-cutting the sheet and milling the top surface flat can help prepare a specimen with laser deposited 7075 Al along its centerline. Table 1 shows the compositions of the alloys.
Experiments were conducted inside a LENS® chamber (Optomec MR-7®). It was a lab-scale unit for laser directed-energy deposition in an Ar-filled chamber, with an X-Y table for specimen motion. Two long rubber gloves on the transparent front panel allowed specimen manipulation in the chamber. The powder was filled in one of the four hoppers connected to the system. Ar flow gas was used to bring the powder from the hoppers into the laser path to be melted and deposited on the specimen. A 1-kW Nd:YAG fiber laser was used, with a 1070 nm wavelength and a 600 µm spot size. The experimental parameters are shown in Table 2. The powder feed rate was set at 10 rotations per minute (rpm) on the LENS hopper rotors, which amounted to 6.8 gm/min of the powder feed rate.
Each specimen was inspected for cracks after testing. If cracking occurred, the Vcr value was determined by Eq. (2) for the deposition and testing conditions used in the test. The fracture surfaces were examined using scanning electron microscopy (SEM) to confirm the type of cracking.
Similar to welding [2], if a group of Al alloys of different compositions needs to be ranked in the cracking susceptibility, they should all be tested under identical conditions so that their cracking susceptibility can be compared. In the present study 6061 Al alone was tested for the susceptibility to solidification cracking. However, since several different testing conditions were tried in the course of the present study, the effect of the test conditions on the value of Vcr can be discussed subsequently.
3. Results
The experimental results are summarized in Table 2. “6061” indicates specimens with 6061 Al as the substrate, and “7075” specimens with 7075 Al as the substrate. As mentioned previously, the powder was 6061 Al in both cases, fed at 6.8 g/min.
3.1. Solidification Cracking Susceptibility
Specimen 6061-P2 was tested by depositing 6061 Al powder at on a 6061 Al substrate at laser power P = 350 W, Vbase = 7.5 mm/s and a = 0.020 mm/s2. No solidification or liquation cracking occurred. The deposit was thin (< 1 mm width) and discontinuous initially, suggesting 350 W was too low for a 7.5 mm/s travel speed of 6061 Al substrate. A higher laser power, e.g., 400 W, might be needed.
Specimen 6061-P3, shown in Figure 3, was tested by depositing 6061 Al powder on a 6061 Al substrate at P = 400 W, Vbase = 7.5 mm/s and a = 0.020 mm/s2. The energy per unit length of the deposit = 53.3 J/mm (i.e., 400 W ÷ 7.5 mm/s). The deposit is 223 mm long. The pulling speed rose linearly from 0 mm/s at the start of the deposit to 0.59 mm/s at the end, i.e., 0.020 mm/s2 × (223 mm/s ÷ 7.5 mm/s). As can be seen in Figure 3, no solidification or liquation cracking is visible.
Two comments can be made as follows. First, incompletely melted metal powder is visible at the top surface of the deposit. However, as will be shown subsequently by the transverse cross-section of the specimen, incompletely melted metal powder existed only as a thin layer at the top surface of the deposit and did not affect the validity of the test.
Second, the deposit deviates from a straight-line path. During pulling, local deformation of the 6061 Al specimen at the pins (Figure 2a) caused the gauge section of the tensile specimen to shift slightly in the lateral direction. This deformation seems consistent with the excellent extrudability of 6061 Al through dies in the production of 6061 Al channels and pipes. Increasing the pin diameters or the thickness of the end sections may decrease the deformation and improve the straightness of the deposit.
To increase the chance of solidification cracking, Specimen 6061-P9 was made at P = 400 W, Vbase = 7.0 mm/s and a significantly higher acceleration of a = 0.050 mm/s2. So, the energy per unit length of the deposit = 57.1 J/mm (i.e., 400 W ÷ 7.0 mm/s). As shown in Figure 4, solidification cracking is now visible in the deposit. The crack at 97 mm (from the starting point of the deposit) is the first one that runs across the width of the deposit (i.e., fusion zone) and is taken as the first solidification crack. According to Eq. (2), the critical pulling speed Vcr = a (L1st / Vbase) = (0.05 mm/s2) (97 mm / 7.0 mm/s) = 0.69 mm/s. An alternative is to consider the shorter cracks earlier as well. That is, the 1st solidification crack is located at 91 to 97 mm (i.e., 94 ± 3 mm), corresponding to Vcr = 0.67 ± 0.02 mm/s. This value is greater than the Vcr = 0.59 mm/s at the end of the deposit in 6061-P3, consistent with no solidification cracking in 6061-P3.
Figure 5 shows solidification cracking in Specimen 6061-P5. 6061 Al powder was deposited on a 6061 Al substrate at P = 350 W, Vbase = 6.5 mm/s and a = 0.050 mm/s2. The energy per unit length of the deposit was 53.8 J/mm (i.e., 350 W ÷ 6.5 mm/s). As shown in Figure 5, L1st = 82 - 93 mm or 87.5 ± 5.5 mm. So, Vcr = a (L1st / Vbase) = (0.050 mm/s2) (87.5 ± 5.5 mm / 6.5 mm/s) = 0.67 ± 0.04 mm/s.
3.2. Liquation Cracking Susceptibility
Figure 6 shows Specimen 7075-P3, which was prepared by depositing 6061 Al powder on a 7075 Al substrate at P = 400 W, Vbase = 6.0 mm/s and a = 0.010 mm/s2. The energy per unit length of the deposit = 66.7 J/mm (i.e., 400 W ÷ 6.0 mm/s). The deposit is 114 mm long (a section of that was cut off for metallography), and no solidification or liquation cracking is visible. The pulling speed rose linearly from 0 mm/s at the start of the deposit to 0.19 mm/s at the end, i.e., 0.010 mm/s2 × (114 mm/s ÷ 6 mm/s).
To increase the chance for liquation cracking, Specimen 7075-P4, shown in Figure 7, was prepared still at P = 400 W and Vbase = 6.0 mm/s but with a faster acceleration of a = 0.025 mm/s2. The thinner deposit in the 1st 10 mm was an old one made at a lower laser power. After a thin old deposit had cooled down, a new deposit was made. So, the energy per unit length of the new deposit was still 66.7 J/mm (i.e., 400 W ÷ 6.0 mm/s). Liquation cracking caused the specimen to break into two pieces. The first liquation crack occurred at 77 mm, and it ran across the entire width of the specimen including the fusion zone. According to Eq. (2), the critical pulling speed Vcr = a (L1st / Vbase) = (0.025 mm/s2) (77 mm / 6.0 mm/s) = 0.32 mm/s. The maximum pulling speed at the end of the deposit on specimen 7075-P3 (Figure 6), i.e., 0.19 mm/s, was still below this critical pulling speed, consistent with no liquation cracking in 7075-P3.
Figure 8 shows liquation cracking in Specimen 7075-P6, in which 6061 Al powder was deposited on a 7075 Al substrate at P = 350 W, Vbase = 6.0 mm/s and a = 0.030 mm/s2. The crack was normal to the specimen, and it ran across the specimen, breaking it into two pieces. The portion of the specimen indicated by the rectangular box was cut off for examination of the fracture surfaces. The energy per unit length of the deposit = 58.3 J/mm (i.e., 350 W ÷ 6 mm/s). Figure 8a shows L1st = 86 mm. So, Vcr = a (L1st / Vbase) = (0.030 mm/s2) (86 mm / 6.0 mm/s) = 0.43 mm/s. This is higher than the Vcr = 0.32 mm/s in Specimen 7075-P4 (Figure 7), thus suggesting a lower susceptibility to liquation cracking. Again, liquation cracking in the substrate propagated through the specimen, breaking it into two pieces. Figure 8b shows Specimen 7075-P6 at a higher magnification. The deposit came off at a few spots during clamping and cutting of the specimen for SEM examination of the fracture surfaces. Bonding between the deposit and the substrate was better after 65 mm from the starting point of the deposit.
3.3. Fracture Surfaces
Figure 9 shows the SEM images of the fracture surface of Specimen 7075-P6 that was prepared at P = 350 W, Vbase = 6.0 mm/s and a = 0.030 mm/s2. The image is rotated 90o counterclockwise from its horizontal position. In the higher-magnification image, the deposit is on the left side and the substrate on the right. Columnar grains grew epitaxially from the substrate into the deposit. Some metal particles did not melt completely at the top surface. However, complete melting occurred during deposition within the area occupied by the columnar grains. Thus, the incomplete melting of some particles at the top surface of the deposit could not have affected the test result significantly.
Figure 10 enlarges a portion of the fracture surface near the interface between the deposit, which is dendritic, and the substrate, which is nondendritic. The dendritic fracture surface on the deposit side can be seen more clearly in Figure 11. Thus, liquation cracking occurred in the substrate, and it propagated as solidification cracking through the deposit, which is a very common phenomena in welding [2,41].
As will be explained subsequently, the extent of liquation can become significantly higher if the distance between the deposit and the edge of the specimen is shortened. This can cause more significant liquation along the grain boundaries in the substrate next to the deposit, and liquation cracking can occur prematurely. Figure 12 shows Specimen 6061-P7 prepared by depositing 6061 Al powder on a 6061 Al substrate at P = 400 W, Vbase = 6.5 mm/s and a = 0.050 mm/s2. As shown, liquation cracking occurred prematurely when the distance between the deposit and the specimen edge was shortened suddenly due to deformation of 6061 Al at the pins during pulling. Liquation cracking occurred at 82 mm from the starting point of the deposit. This and many other liquation cracks propagated as solidification cracks into the deposit. On the opposite side of the deposit, liquation cracks were very short or not visible because there was much more substrate material to act as a bigger heat sink to reduce liquation. The liquation crack at 148 mm initiated fracture, and the specimen bent significantly before rupture. This is because the substrate between the deposit and the opposite specimen edge was much less liquated, still able to deform during pulling.
Figure 13 shows the fracture surface of Specimen 6061-P7. Figure 14 enlarge an area near the interface between the deposit and the substrate. As shown, cracking is intergranular on both sides of the interface. It is dendritic in the deposit, thus confirming solidification cracking. It is nondendritic in the substrate near the deposit, on the other hand, thus confirming liquation cracking.
Figure 15 enlarges the columnar dendrites in the deposit. The primary dendrite arm spacing was about 0.7 μm, measured across several dendrites as indicated by the broken rectangle. As shown in Figure 16, this corresponds to a cooling rate of about 500 K/s based on the data for alloy Al-3Cu-1Li as an approximation [42].
4. Discussion
4.1. Solidification Cracking Susceptibility
As mentioned previously, different Al alloys can be tested under identical conditions to compare the effect of the alloy composition on the susceptibility to solidification cracking [2]. In the present study 6061 Al alone was tested for susceptibility to solidification cracking. However, since different testing conditions were tried in the course of the present study, the effect of the test conditions on the value of Vcr can be discussed as follows.
Specimen 6061-P5 (Figure 5) can be compared with Specimen 6061-P9 (Figure 4) as follows. The heat input per unit length of the deposit was 53.8 J/mm for 6061-P5, slightly lower than that of 57.1 J/mm for 6061-P9. In arc welding, a lower heat input per unit length of the weld can lead to a lower susceptibility to solidification cracking [43]. From this point of view, 6061-P5 can be expected to be slightly less susceptible to solidification cracking than 6061-P9, and hence a slightly higher Vcr. However, Vcr = 0.67 for both 6061-P5 and 6061-P9. The susceptibility of 6061 Al to solidification cracking in arc welding can be much less sensitive to a change in the heat input per unit length of the weld (e.g., caused by doubling the welding speed) than to a change in the composition of the fusion zone (e.g., caused by changing the filler metal from 6061 Al to 4043 Al) [38]. Thus, it can be hypothesized that a relatively small change in the heat input per unit length of the deposit may not affect Vcr significantly.
4.2. Liquation Cracking Susceptibility
For Specimen 7075-P6 (Figure 8), the heat input per unit length of the deposit was 58.3 J/mm, and the critical pulling speed Vcr = 0.43 mm/s. For Specimen 7075-P4 (Figure 7), the heat input per unit length of the deposit was higher at 66.7 J/mm, and the critical pulling speed was lower at Vcr = 0.32 mm/s. The lower heat input for 7075-P6 suggests less liquation, less chance for liquation cracking to occur, and hence a higher Vcr indicating a lower cracking susceptibility. This is consistent with the susceptibility to liquation cracking increasing with increasing heat input in laser additive manufacturing of Inconel 718 [44]. In arc welding, a lower heat input per unit length of the weld suggests less liquation and hence less liquation cracking [2].
Since 6061 Al powder was deposited on 7075 Al as well as 6061 Al, the effect of the substrate composition on the susceptibility to liquation cracking can be discussed. Specimen 7075-P6 (Figure 8) is compared with Specimen 6061-P9 (Figure 4) as follows. The 6061-P9 deposit was prepared with the heat input of 57.1 J/mm (i.e., 400 W ÷ 7.0 mm/s) and the acceleration of 0.050 mm/s2. No liquation cracking occurred (solidification cracking occurred at 91 – 97 mm). As for Specimen 7075-P6, the heat input was 58.3 J/mm (i.e., 350 W ÷ 6.0 mm/s), very close to the 57.1 J/mm of 6061-P9, and the acceleration a = 0.030 mm/s2 was significantly lower than a = 0.050 mm/s2 in 6061-P9. Yet, liquation cracking occurred in 7075-P6 but not 6061-P9. This suggests 7075 Al is much more susceptible to liquation cracking than 6061 Al similar to arc welding [40]. Thus, more liquation cracking can be expected in building a 7075 Al part from 7075 Al powder than in building a 6061 Al part from 6061 Al powder under similar AM conditions.
4.3. Effect of Substrate and Deposit Location
Figure 17 illustrates the effect of the substrate material and the deposit location on the susceptibility to liquation cracking. For illustration, grain boundaries are shown to be normal to the pulling direction (similar to Figure 10). Liquation cracking might be easier to occur when grains are normal to the pulling direction [2].
As mentioned previously, 7075 Al (Figure 17a) is more susceptible to liquation cracking than 6061 Al (Figure 17b). The difference can be explained based on the curves of temperature T vs. fraction of solid fS of 6061 Al and 7075 Al shown in Figure 18. The curves were calculated based on their compositions shown in Table 1, using the thermodynamic software Pandat [45] and aluminum database PanAl [46] of CompuTherm, LLC based on the Scheil-Gulliver solidification model [1]. The portion of the T-fS curve near the end of solidification, i.e., the eutectic temperature, is much wider and lower for 7075 Al than 6061 Al. The fraction of eutectic could have been somewhat reduced by heat treating after casting. Upon heating during welding or AM, however, the eutectic reaction occurs again. During heating, the reaction can be expected to occur earlier in 7075 Al and form significantly more liquid along grain boundaries to weaken them. This can explain why 7075 Al is more susceptible to liquation cracking than 6061 Al.
If the deposit gets close to the one edge of the 6061 Al substrate (Figure 17c), liquation can become much more severe in the PMZ close to that edge because much less substrate material is available to act as a heat sink, i.e., the edge behaves like a thermal insulation. Consequently, liquation cracking can be promoted (Figure 12).
Before closing, it is worth mentioning that the test can be improved in future studies. The first improvement is to reduce the deviation of the deposit from a straight-line path. Increasing the pin diameter or end-section thickness (Figure 2) can be tried. The second improvement is to melt the surface of the deposit completely. Optimizing the laser power and the base travel speed can be tried. The third improvement is to melt the substrate surface from the starting point of the deposition. Laser heating the substrate briefly before the base starts traveling can be tried.
5. Conclusions
- (1)
- The PVR weldability test has been selected, modified and used as a test for evaluating the susceptibility to solidification cracking and liquation cracking in AM. In this test a single-pass, single-layer deposit is made along a slender specimen that is pulled like in tensile testing but with acceleration.
- (2)
- The test can be conducted in an Ar-filled chamber for AM. Specimens can be tested one by one without having to open the chamber.
- (3)
- Solidification cracks are visible on the surface of the deposit.
- (4)
- Liquation cracks are visible in the substrate near the deposit, and they can propagate through the specimen.
- (5)
- The fracture surfaces are readily accessible for examination by SEM. Dendritic fracture surfaces of the deposits have confirmed solidification cracking. Nondendritic fracture surfaces of the substrates showing intergranular cracking have confirmed liquation cracking.
- (6)
- The critical pulling speed for solidification cracking can be determined as an index for the cracking susceptibility under the conditions of deposition and testing used in the test, so can that for liquation cracking. In either type of cracking, the lower the critical pulling speed is, the higher the cracking susceptibility.
- (7)
- The results of the present study can be considered as a proof of concept for this AM cracking-susceptibility test.
6. Patents
S. Kou, Patent Application Publication No. US 2024/0139811 A1, May 2, 2024, submitted by WARF of University of Wisconsin-Madison, October 28, 2022.
Author Contributions
Conceptualization, Sindo Kou; methodology, Sindo Kou; Investigation, Soumyadeep Dasgupta and Sindo Kou; writing—original draft preparation, Sindo Kou; writing—review and editing, Soumyadeep Dasgupta and Dan Thoma; supervision, Sindo Kou and Dan Thoma; project administration, Sindo Kou; funding acquisition, Sindo Kou.
Funding
This work was supported by the National Science Foundation of the United States under Grant No. DMR 1904503.
Data Availability Statement
Data will be available upon request.
Acknowledgments
The authors thank Phalgun Nelaturu and the AM Lab Manager Mythili Thevamaran for their help in conducting the laser directed-energy deposition experiments. Soumyadeep Dasgupta, former Graduate Student at the University of Wisconsin-Madison supervised by Professor Sindo Kou, is now Graduate Student at the University of Michigan-Ann Arbor.
Conflicts of Interest
The authors declare no conflicts of interest.
Abbreviations
The following abbreviations are used in this manuscript:
| AM | Additive Manufacturing |
| PMZ | Partially Melted Zone |
| PVR | Programmierter (Programmable) Verformungs (Deformation) Riss (Crack) |
| SEM | Scanning Electron Microscopy |
References
- Flemings, M.C. Solidification Processing; McGraw-Hills: New York, 1974; pp. 252–258. [Google Scholar]
- Kou, S. Welding Metallurgy, 3rd ed.; John Wiley and Sons: Hoboken, NJ, 2021; pp. 323–366, 419–439. [Google Scholar]
- Kou, S. Grain refining and cracking during solidification. Metallurgical and Materials Transactions A 2024, 55, 4663–4675. [Google Scholar] [CrossRef]
- Dasgupta, S.; Kou, S. Undercooling and cracking during solidification. Metallurgical and Materials Transactions A 2024, 55, 3450–3462. [Google Scholar] [CrossRef]
- Liu, J.; Duarte, H.P.; Kou, S. Evidence of back diffusion reducing cracking during solidification. Acta Materialia 2017, 122, 47–59. [Google Scholar] [CrossRef]
- Kou, S. Predicting susceptibility to solidification cracking and liquation cracking by CALPHAD. Metals 2021, 11, 1442. [Google Scholar] [CrossRef]
- Kou, S. A criterion for cracking during solidification. Acta Materialia 2015, 88, 366–374. [Google Scholar] [CrossRef]
- Kou, S. A simple index for predicting the susceptibility to solidification cracking. Welding Journal 2015, 94, 374s–388s. [Google Scholar]
- Kannengiesser, T.; Boellinghaus, T. Hot cracking tests—An overview of present technologies and applications. Welding in the World 2014, 58, 397–421. [Google Scholar] [CrossRef]
- Yu, J.; Rombouts, M.; Maes, G. Cracking behavior and mechanical properties of austenitic stainless steel parts produced by laser metal deposition. Materials & Design. 2013, 45, 228–235. [Google Scholar]
- Yang, J.; Li, F.; Wang, Z.; Zeng, X. Cracking behavior and control of Rene 104 superalloy produced by direct laser fabrication. Journal of Materials Processing Technology 2015, 225, 229–239. [Google Scholar] [CrossRef]
- Hu, Z.; Nie, X.; Qi, Y.; Zhang, H.; Zhu, H. Cracking criterion for high strength Al–Cu alloys fabricated by selective laser melting. Additive Manufacturing 2021, 37, 101709. [Google Scholar] [CrossRef]
- Hyer, H.; Zhou, L.; Mehta, A.; Park, S.; Huynh, T.; Song, S.; Bai, Y.; Cho, K.; McWilliams, B.; Sohn, Y. Composition-dependent solidification cracking of aluminum-silicon alloys during laser powder bed fusion. Acta Materialia 2021, 208, 116698. [Google Scholar] [CrossRef]
- Qi, T.; Zhu, H.; Zhang, H.; Yin, J.; Ke, L.; Zeng, X. Selective laser melting of Al7050 powder: Melting mode transition and comparison of the characteristics between the keyhole and conduction mode. Materials & Design 2017, 135, 257–266. [Google Scholar] [CrossRef]
- Mehta, A.; Zhou, L.; Huynh, T.; Park, S.; Hyer, H.; Song, S.; Bai, Y.; Imholte, D.D.; Woolstenhulme, N.E.; Wachs, D.M.; Sohn, Y. Additive manufacturing and mechanical properties of the dense and crack free Zr-modified aluminum alloy 6061 fabricated by the laser-powder bed fusion. Additive Manufacturing 2021, 41, 101966. [Google Scholar] [CrossRef]
- Martin, J.H.; Yahata, B.D.; Hundley, J.M.; Mayer, J.A.; Schaedler, T.A.; Pollock, T.M. 3D printing of high-strength aluminium alloys. Nature 2017, 549, 365–369. [Google Scholar] [CrossRef] [PubMed]
- Bermingham, M.J.; StJohn, D.H.; Krynen, J.; Tedman-Jones, S.; Dargusch, M.S. Promoting the columnar to equiaxed transition and grain refinement of titanium alloys during additive manufacturing. Acta Materialia 2019, 168, 261–274. [Google Scholar] [CrossRef]
- Zhang, D.; Prasad, A.; Bermingham, M.J.; Todaro, C.J.; Benoit, M.J.; Patel, M.N.; Qiu, D.; StJohn, D.H.; Qian, M.; Easton, M.A. Grain refinement of alloys in fusion-based additive manufacturing processes. Metallurgical and Materials Transactions A 2020, 51, 4341–4359. [Google Scholar] [CrossRef]
- Uddin, S.Z.; Murr, L.E.; Terrazas, C.A.; Morton, P.; Roberson, D.A.; Wicker, R.B. Processing and characterization of crack-free aluminum 6061 using high-temperature heating in laser powder bed fusion additive manufacturing. Additive Manufacturing 2018, 22, 405–415. [Google Scholar] [CrossRef]
- Seidel, A.; Finaske, T.; Straubel, A.; Wendrock, H.; Maiwald, T.; Riede, M.; Lopez, E.; Brueckner, F.; Leyens, C. Additive manufacturing of powdery Ni-based superalloys Mar-M-247 and CM 247 LC in hybrid laser metal deposition. Metallurgical and Materials Transactions A 2018, 49, 3812–3830. [Google Scholar] [CrossRef]
- Chen, Y.; Lu, F.; Zhang, K.; Nie, P.; Hosseini, S.R.E.; Feng, K.; Li, Z. Dendritic microstructure and hot cracking of laser additive manufactured Inconel 718 under improved base cooling. Journal of Alloys and Compounds 2016, 670, 312–321. [Google Scholar] [CrossRef]
- Goodwin, G.M. Development of a new hot-cracking test – the Sigmajig. Welding Journal 1987, 66, 33–38. [Google Scholar]
- Borland, J.C.; Rogerson, J.H. Examination of the patch test for assessing hot cracking tendencies of weld metal. British Welding Journal 1963, 8, 494–499. [Google Scholar]
- Soysal, T.; Kou, S. A simple test for assessing solidification cracking susceptibility and checking validity of susceptibility prediction. Acta Materialia 2018, 143, 181–197. [Google Scholar] [CrossRef]
- Coniglio, N.; Cross, C.E.; Michael, T.; Lammers, M. Defining a critical weld dilution to avoid solidification cracking in aluminum. Welding Journal 2008, 87, 237s–247s. [Google Scholar]
- Savage, W.F.; Lundin, C.D. The varestraint test. Welding Journal 1965, 44, 433s–442s. [Google Scholar]
- Houldcroft, P.T. A simple cracking test for use with argon-arc welding. British Welding Journal 1955, 2, 471–475. [Google Scholar]
- Niel, A.; Deschaux-Beaume, F.; Bordreuil, C.; Fras, G.; Drezet, J.M. Hot tearing test for TIG welding of aluminum alloys: Application of a stress parallel to the fusion line. In Hot cracking phenomena in welds III; Springer: Berlin, Heidelberg, 2011; pp. 43–58. [Google Scholar]
- Shinozaki, K.; Kuroki, H.; Luo, X.; Ariyoshi, H.; Shirai, M. Comparison of hot-cracking susceptibilities of various Ni-base, heat-resistant superalloys by U-type hot cracking test. Study of laser weldability of Ni-base, heat-resistant superalloys (2nd report). Welding International 1999, 13, 952–959. [Google Scholar] [CrossRef]
- Folkhard, E.; Rabensteiner, G.S.H.; Fuchs, K.; Tösch, L. The PVR test, a highly significant, quantitative test method for determining the hot cracking resistance of weld metals. Wien. (in German). 1977. [Google Scholar]
- Yushchenko, K.; Savchenko, V.; Chervyakov, N.; Zvyagintseva, A.; Guyot, E. Comparative hot cracking evaluation of welded joints of alloy 690 using filler metals Inconel Sr 52 and 52 Mss. Welding in the World 2011, 55, 28–35. [Google Scholar] [CrossRef]
- Yushchenko, K.A.; Savchenko, V.S.; Chervyakov, N.O.; Zvyagintseva, A.V.; Monko, G.G.; Pestov, V.A. Comparative evaluation of sensitivity of welded joints on alloy Inconel 690 to hot cracking. The Paton Welding J 2011, 11, 2–7. [Google Scholar]
- DINENISO17641: Destructive tests on welds in metallic materials— hot cracking tests for weldments, part 1–3—Arc welding processes (2005).
- Kotkunde, N.; Krishnamurthy, H.N.; Singh, S.K.; Jella, G. Experimental and numerical investigations on hot deformation behavior and processing maps for ASS 304 and ASS 316. High Temperature Materials and Processes 2018, 37, 73–888. [Google Scholar] [CrossRef]
- Kou, S. Patent Application Publication No. US 2024/0139811 A1, May 2, 2024, submitted by WARF of University of Wisconsin-Madison, October 28, 2022.
- Dowd, J.D. Weld cracking of aluminum alloys. Weld. J. 1952, 31, 448–456. [Google Scholar]
- Dudas, J.H.; Collins, F.R. Preventing weld cracks in high-strength aluminum alloys. Weld. J. 1966, 45, 241–249. [Google Scholar]
- Soysal, T.; Kou, S. A Simple Test for Solidification Cracking Susceptibility and Filler Metal Effect. Welding Journal 2017, 96, 389-s–401-s. [Google Scholar]
- Li, Z.; Zhang, Y.; Li, H.; Wang, Y.; Wang, L.; Zhang, Y. Liquation cracking susceptibility and mechanical properties of 7075 aluminum alloy GTAW joints. Materials 2022, 15, 3651. [Google Scholar] [CrossRef]
- Huang, C.; Cao, G.; Kou, S. Liquation cracking in partial-penetration aluminum welds. Science and Technology of Welding and Joining 2004, 9, 149–157. [Google Scholar] [CrossRef]
- Yu, P.; Kou, S.; Lin, C.M. Solidification and liquation cracking in welds of high entropy CoCrFeNiCux Alloys. Materials 2023, 16, 5621. [Google Scholar] [CrossRef] [PubMed]
- Santos, G.M.; Goulart, P.R.; Couto, A.A.; Garcia, A.M.A.U.R.I. Primary dendrite arm spacing effects upon mechanical properties of an Al–3wt% Cu–1wt% Li alloy. In Properties and Characterization of Modern Materials; Springer: Singapore, 2017; pp. 215–229. [Google Scholar]
- Kromm, A.; Thomas, M.; Kannengiesser, T.; Gibmeier, J.; Vollert, F. Assessment of the solidification cracking susceptibility of welding consumables in the Varestraint test by means of an extended evaluation methodology. Advanced Engineering Materials 2022, 24, 2101650. [Google Scholar] [CrossRef]
- Chen, Y.; Zhang, K.; Huang, J.; Hosseini, S.R.E.; Li, Z. Characterization of heat affected zone liquation cracking in laser additive manufacturing of Inconel 718. Materials & Design 2016, 90, 586–594. [Google Scholar] [CrossRef]
- CompuTherm LLC, M. WI, USA, Pandat, Phase Diagram Calculation Software Package for Multicomponent Systems. 2020.
- CompuTherm LLC, M. WI, USA, PanAluminum, Thermodynamic Database for Aluminum Alloys. 2020.
Figure 1.
The PVR test for cracking susceptibility in welding: (a) longitudinal cross-section along specimen centerline; (b) top view. Adapted from Yushchenko et al. [32].
Figure 1.
The PVR test for cracking susceptibility in welding: (a) longitudinal cross-section along specimen centerline; (b) top view. Adapted from Yushchenko et al. [32].
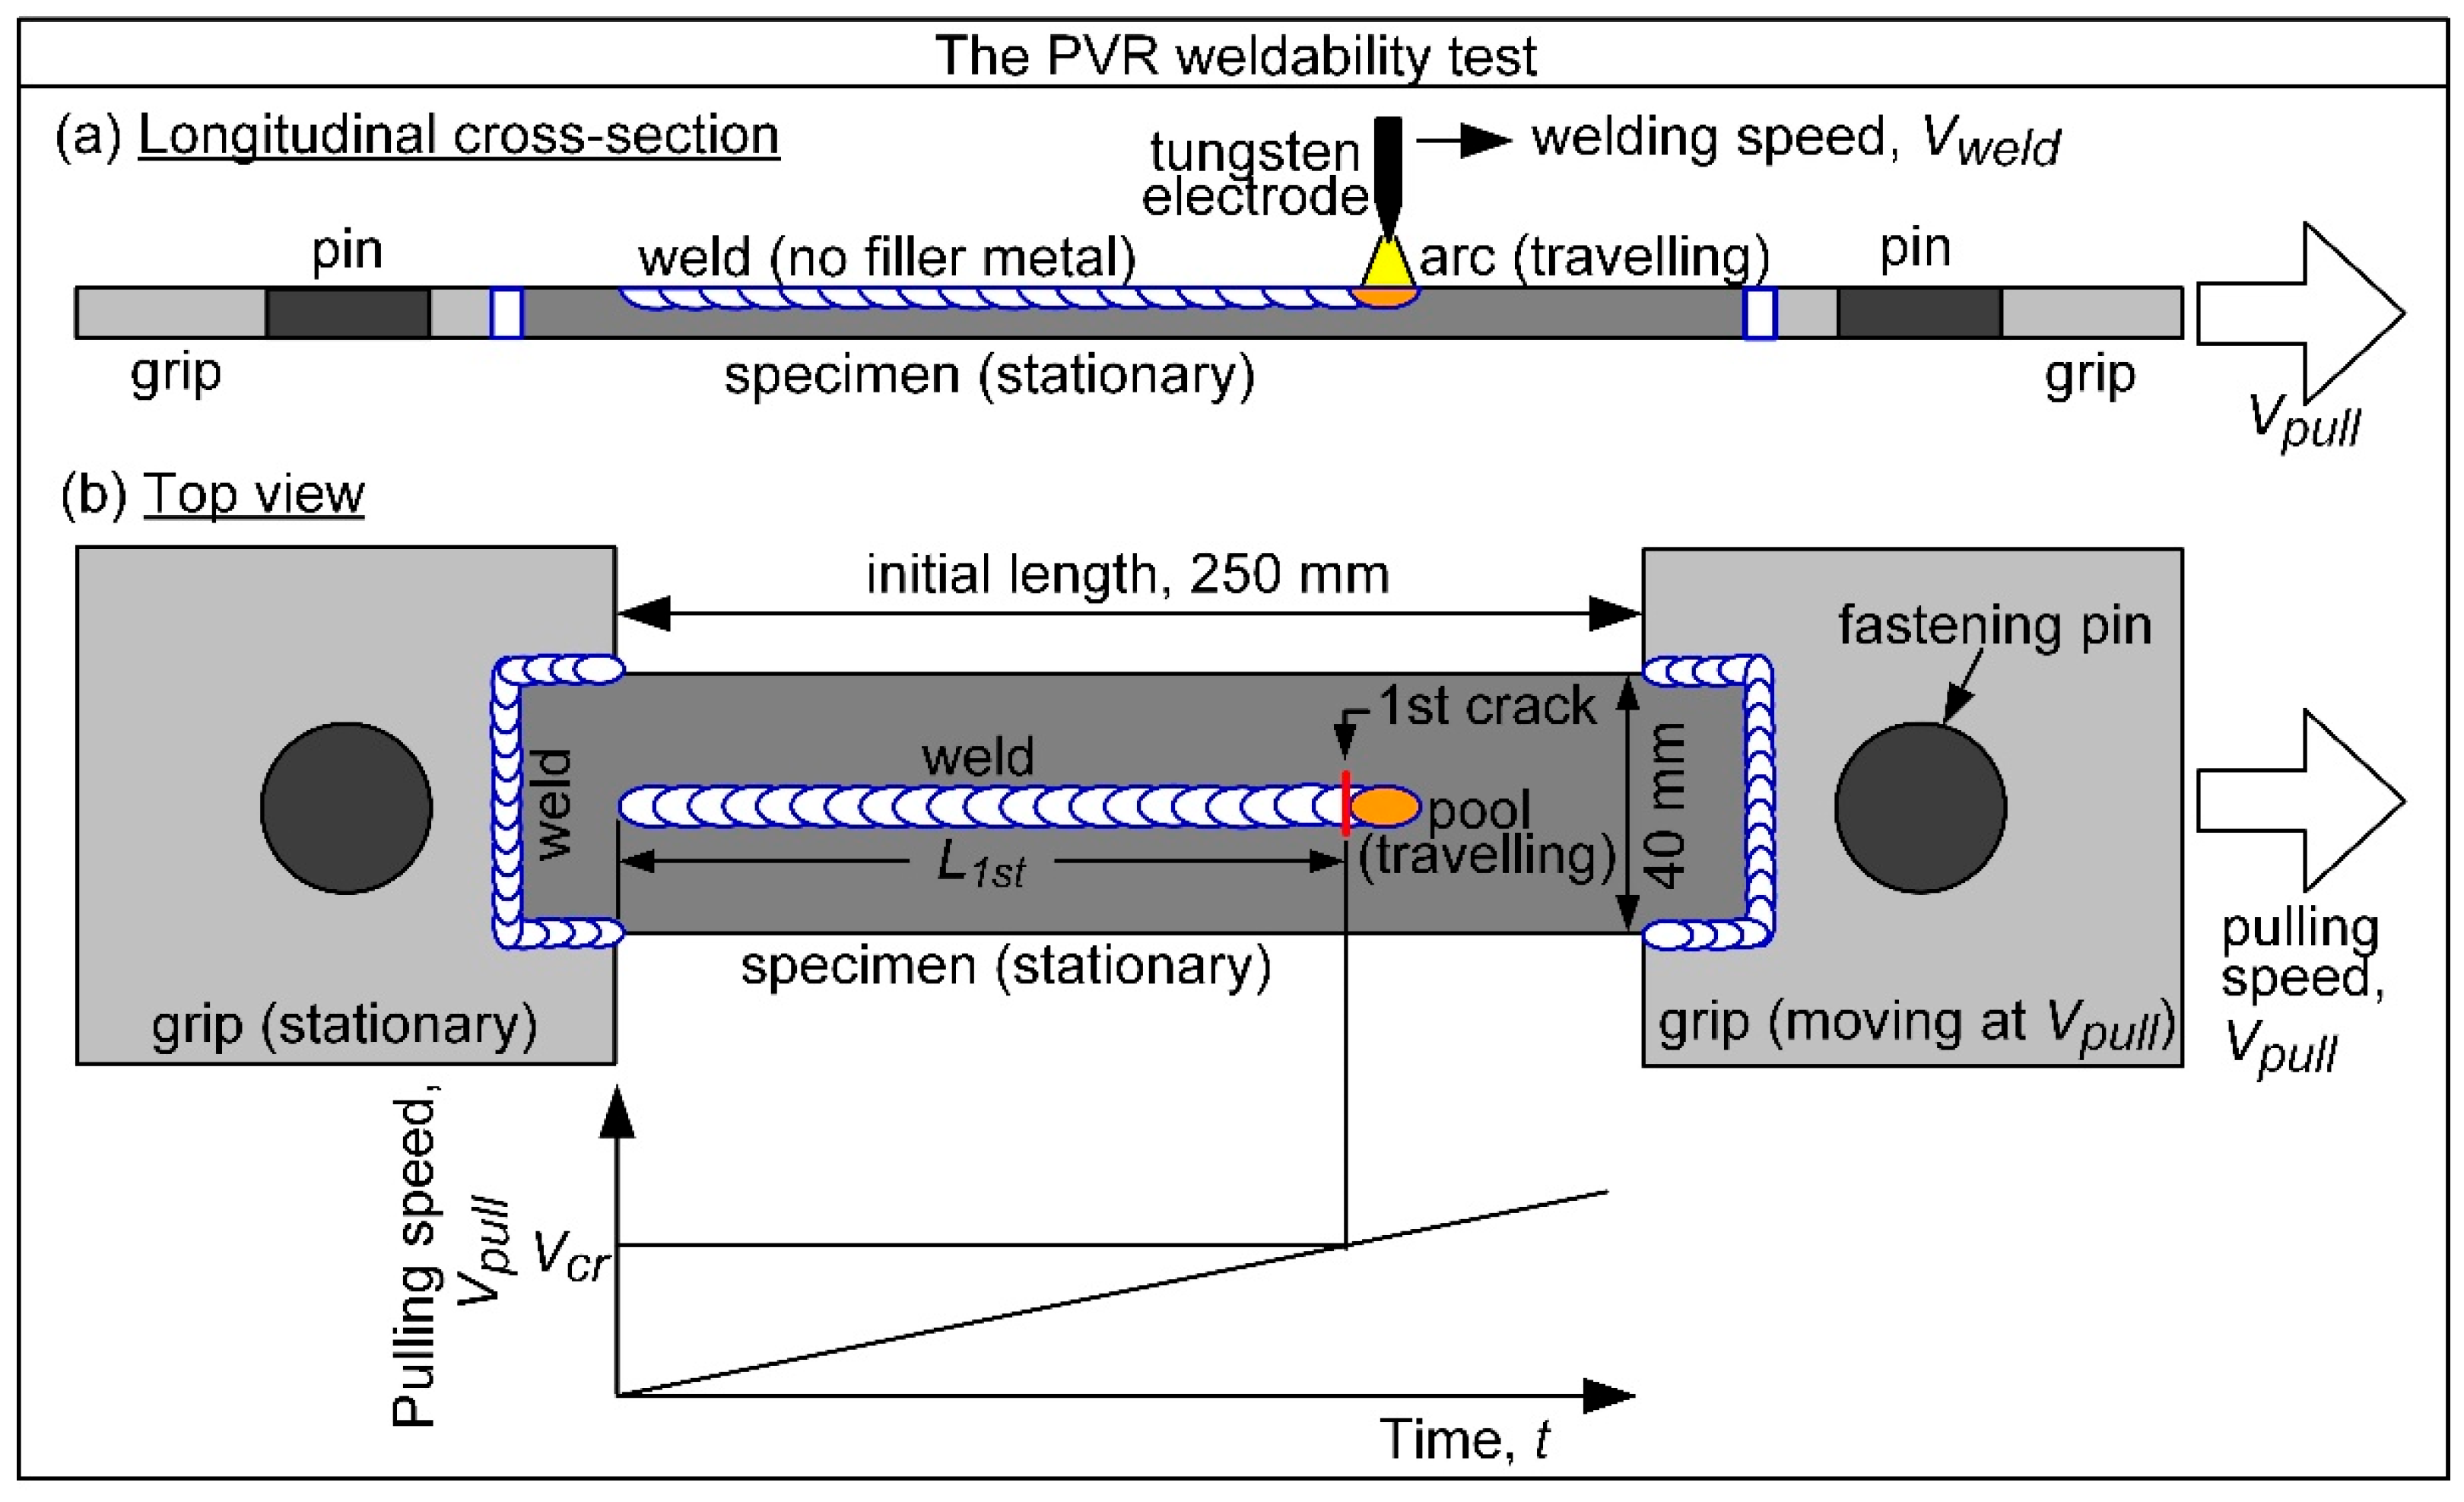
Figure 2.
The test proposed in the present study: (a) longitudinal cross-section along specimen centerline; (b) top view of specimen; (c) critical pulling speed for solidification cracking, (Vcr)SC; (d) critical pulling speed for liquation cracking (Vcr)LC. The lower the critical pulling speed is, the higher the cracking susceptibility.
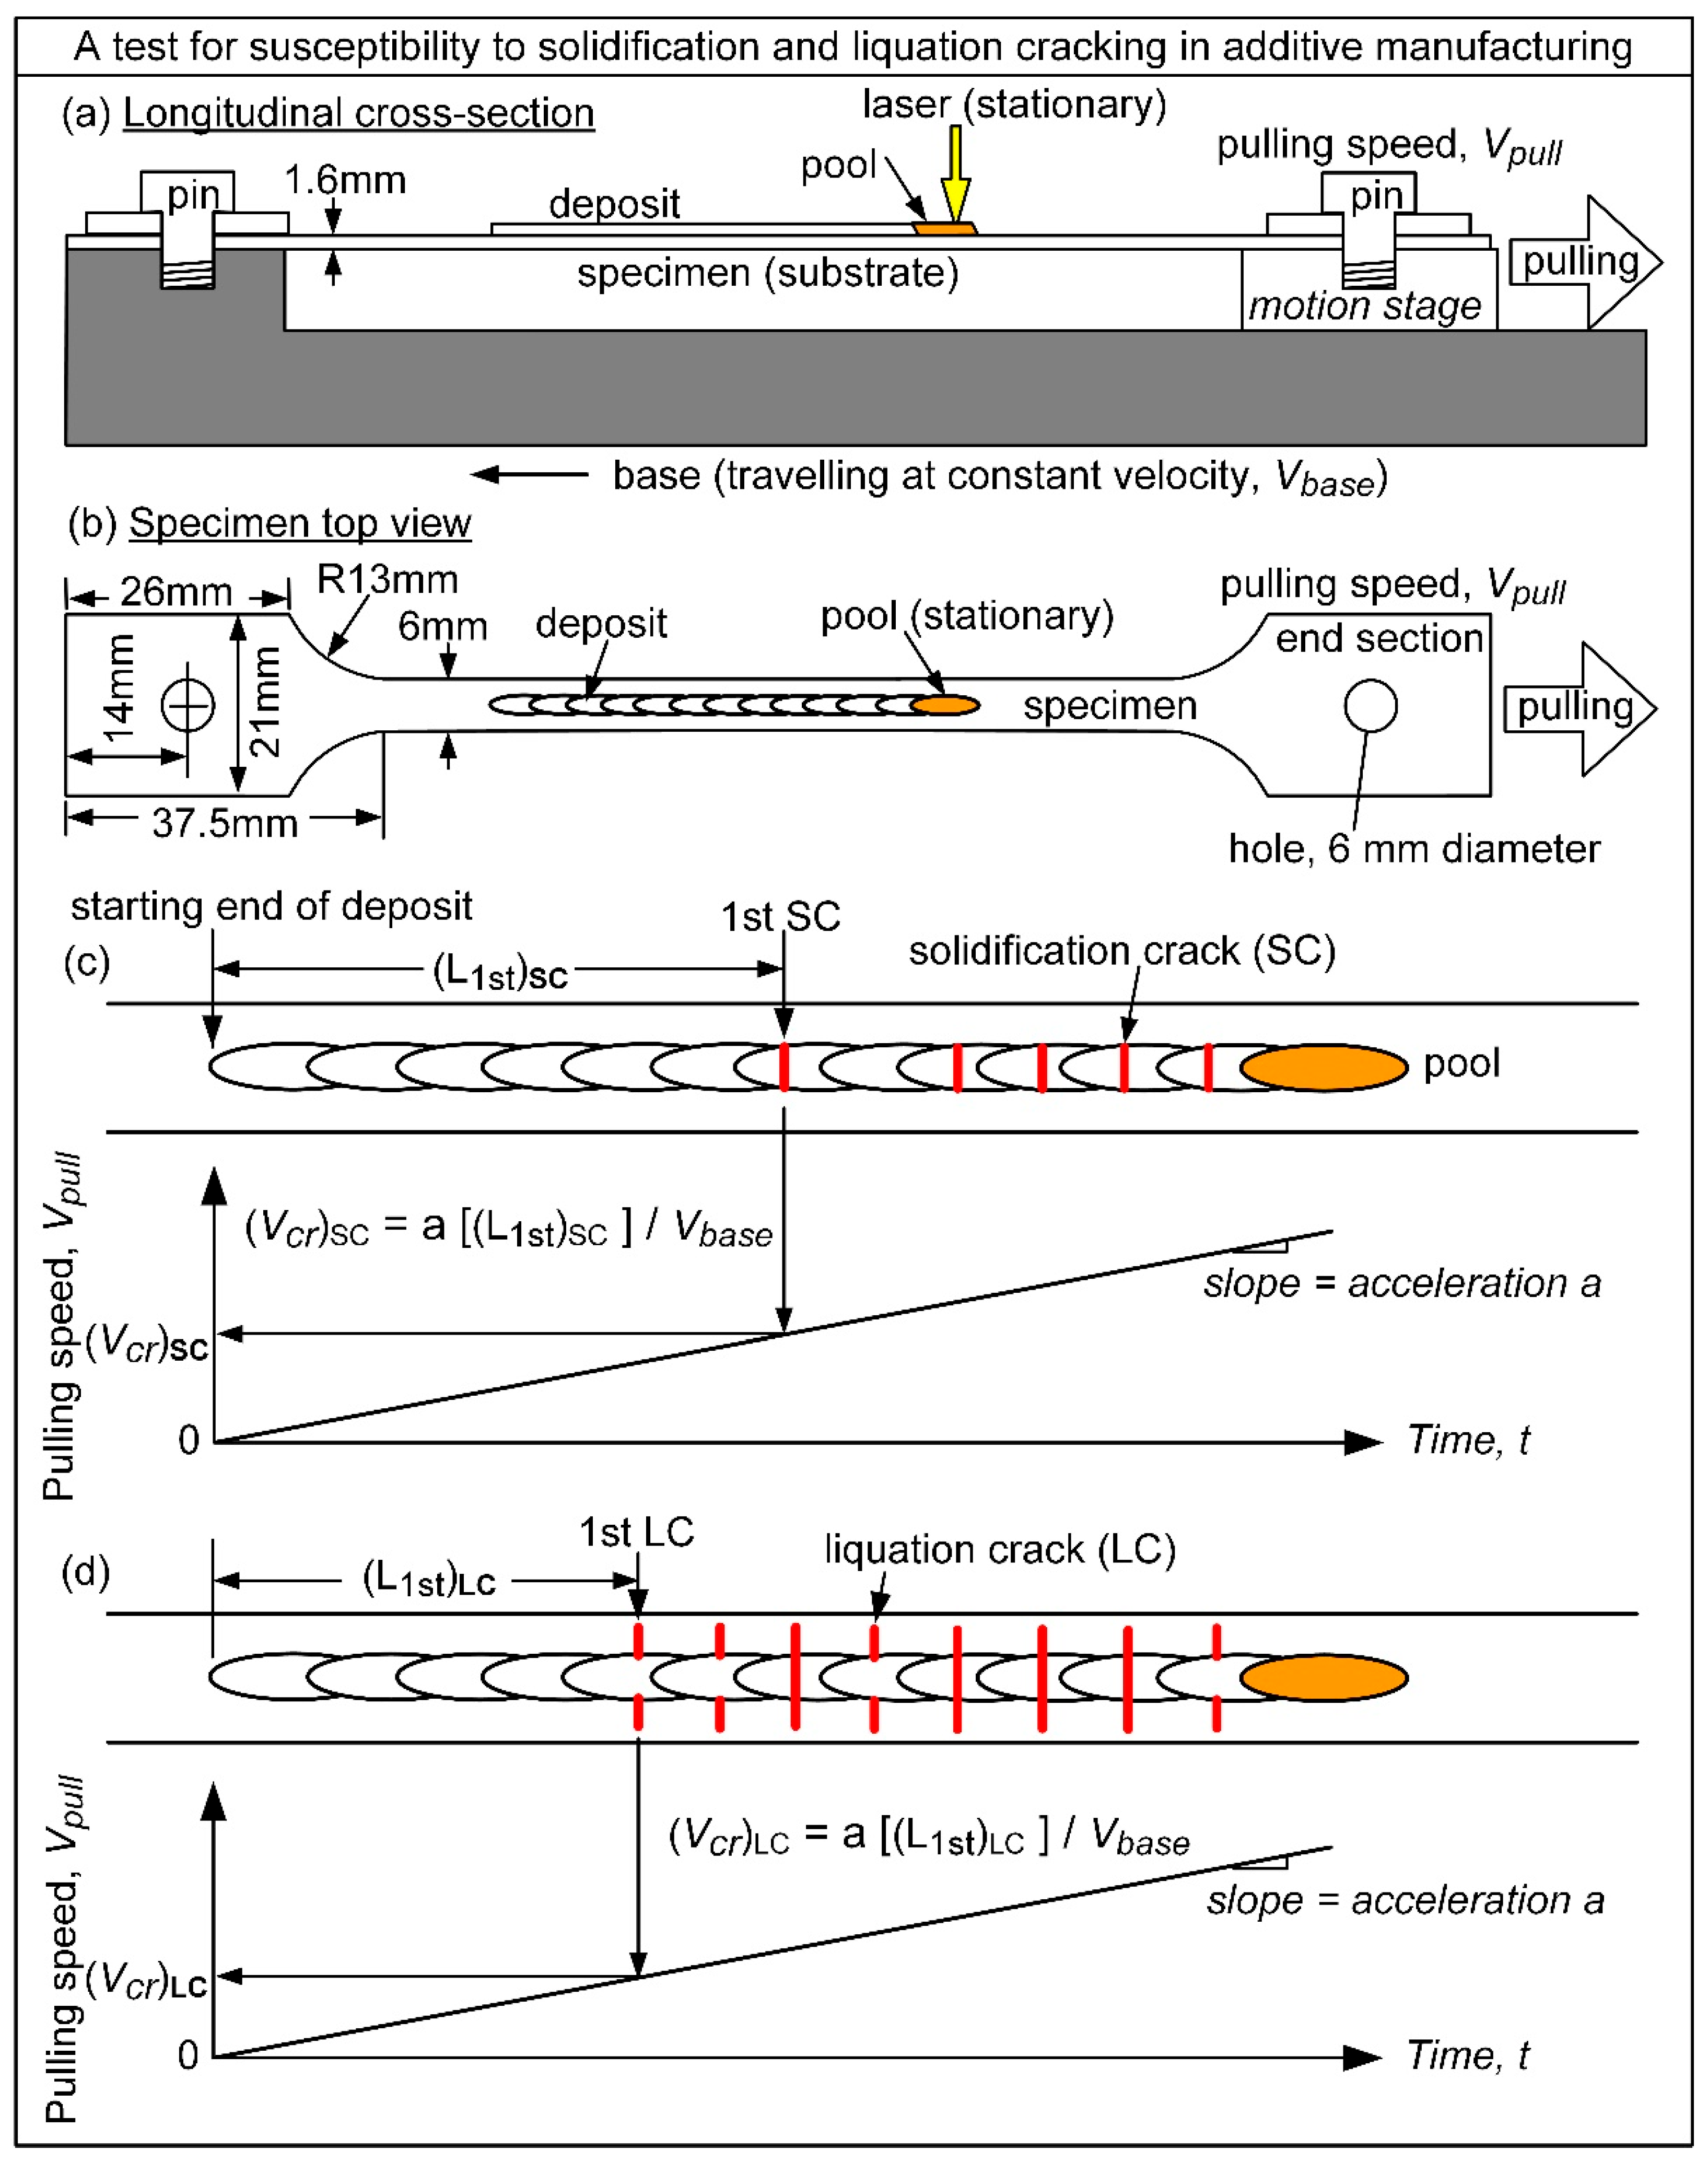
Figure 3.
Specimen 6061-P3 showing no solidification cracking. The deposit starts at 0 mm and ends at 223 mm.
Figure 3.
Specimen 6061-P3 showing no solidification cracking. The deposit starts at 0 mm and ends at 223 mm.
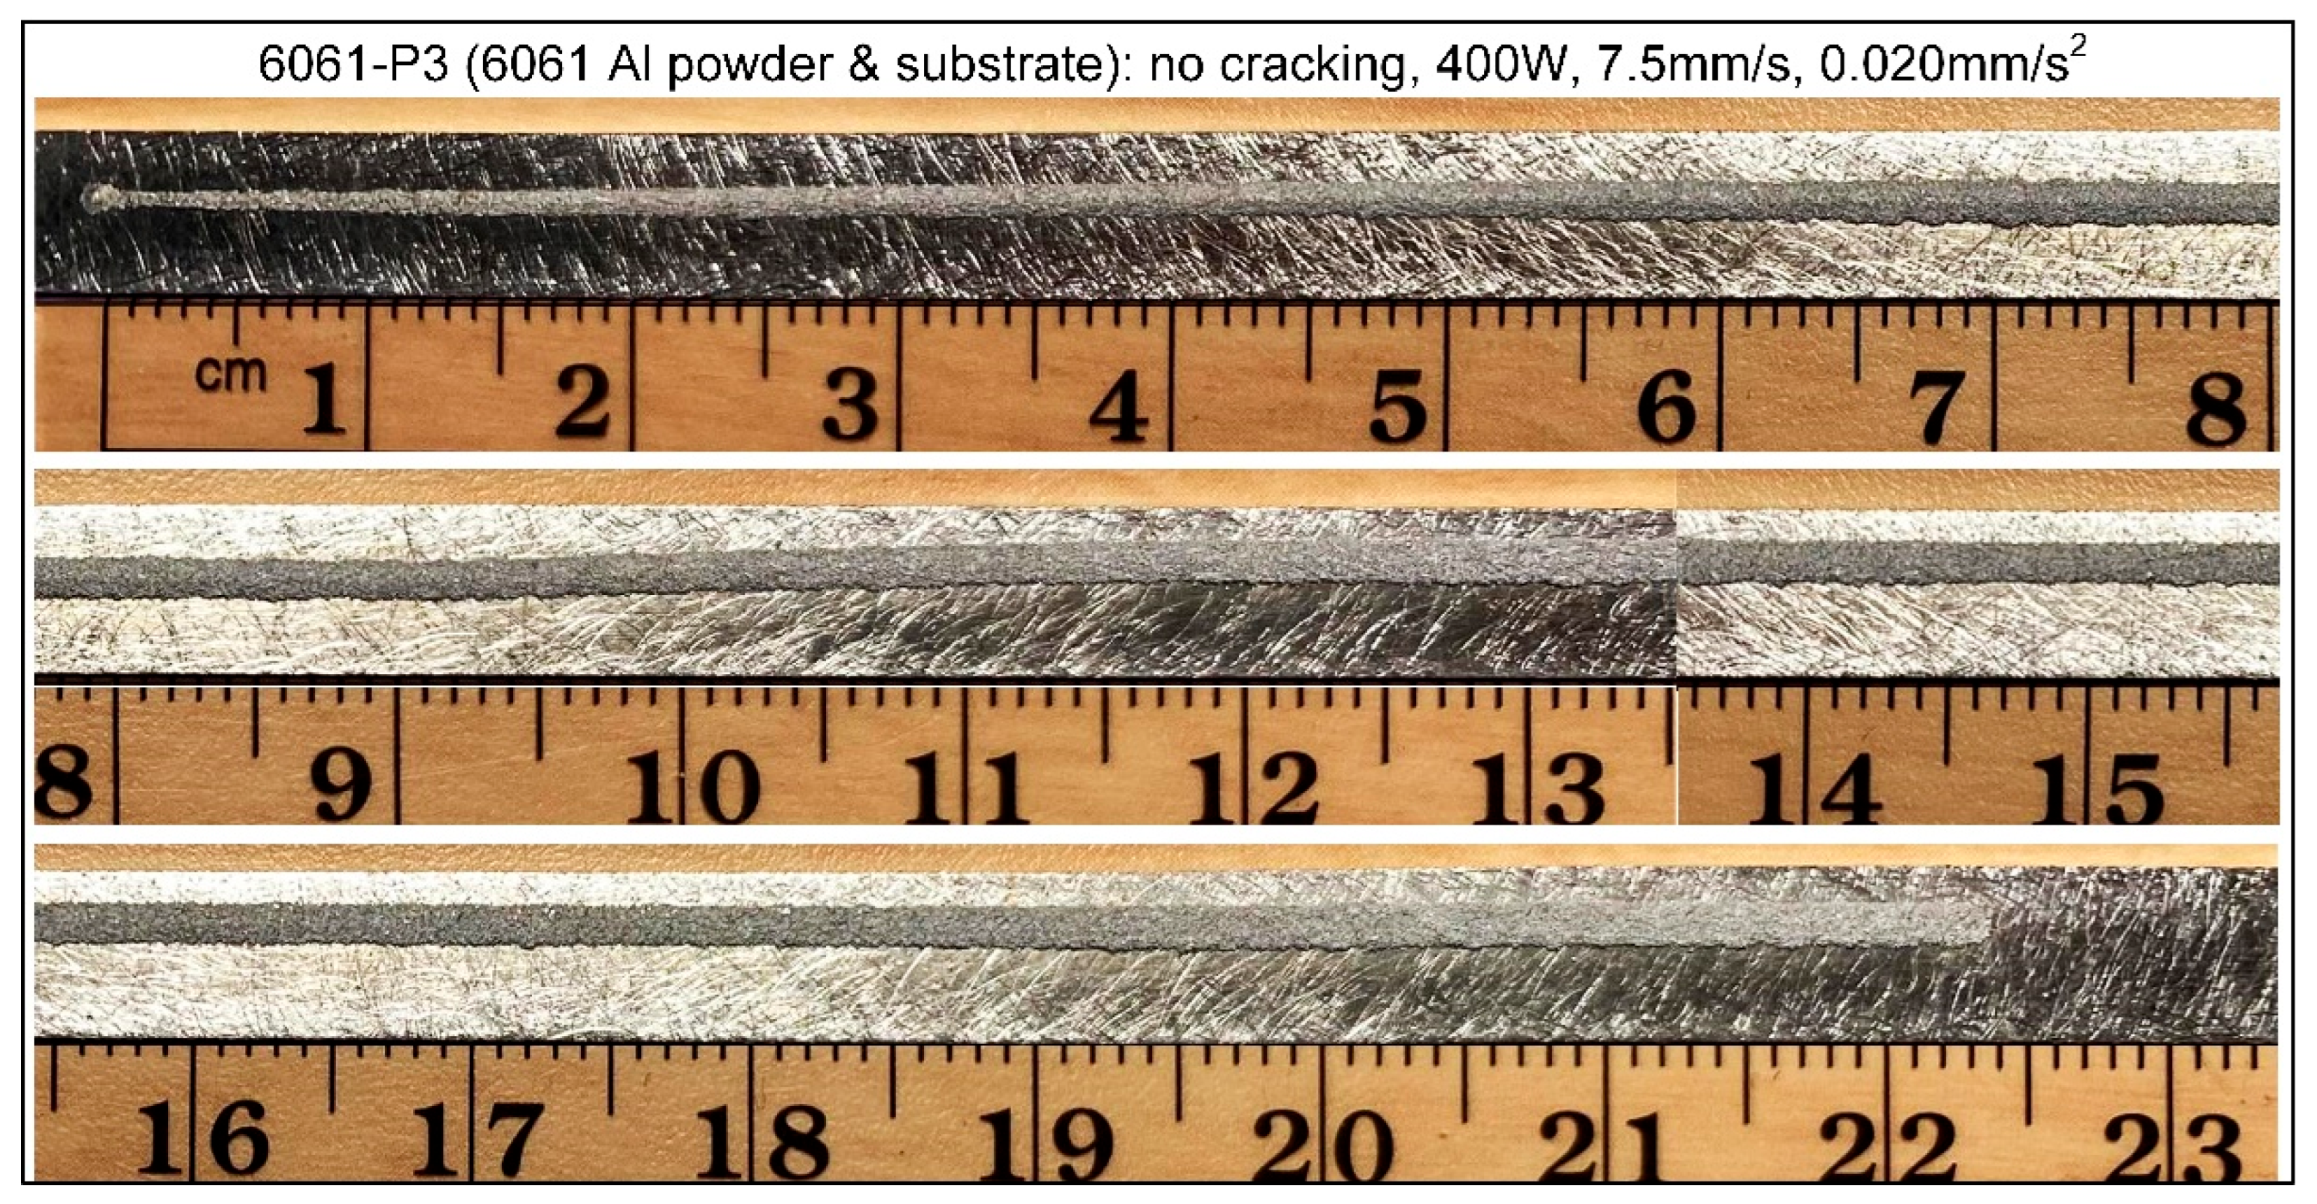
Figure 4.
Specimen 6061-P9 showing solidification cracking: (a) lower magnification; (b) higher magnification showing first solidification crack at (L1st)SC = 91 – 97 mm from starting point of deposit.
Figure 4.
Specimen 6061-P9 showing solidification cracking: (a) lower magnification; (b) higher magnification showing first solidification crack at (L1st)SC = 91 – 97 mm from starting point of deposit.
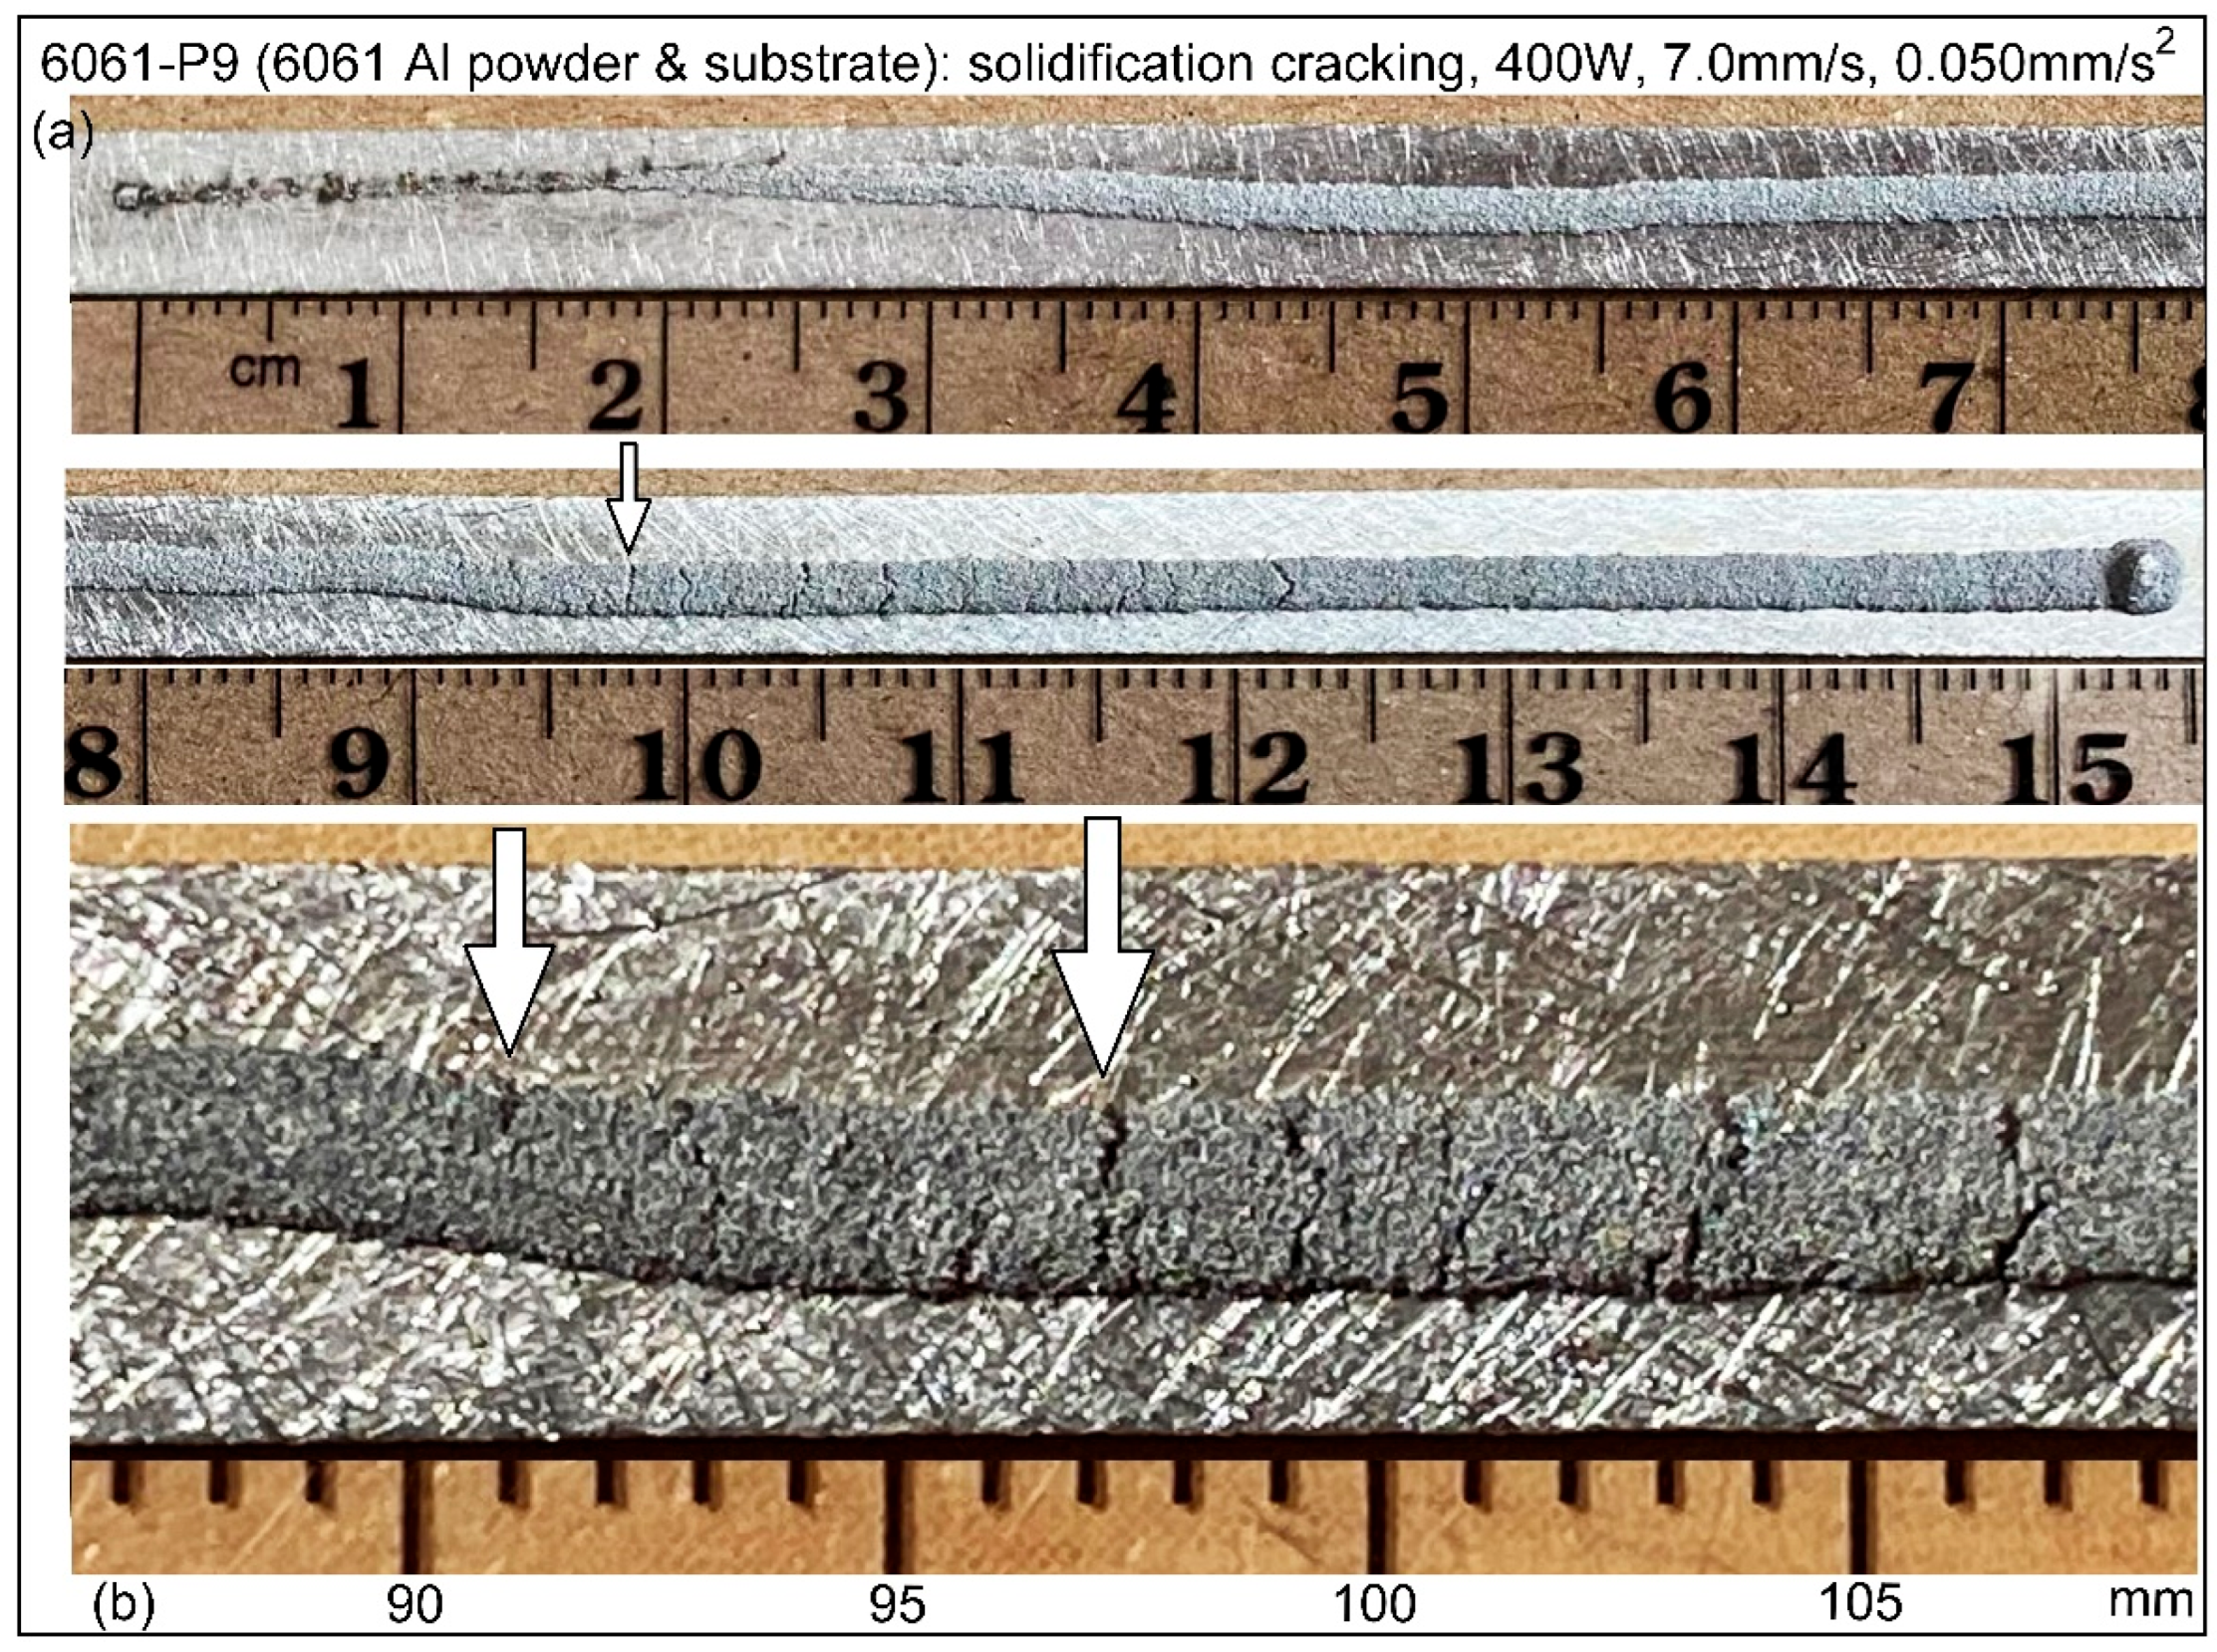
Figure 5.
Specimen 6061-P5 showing solidification cracking: (a) lower magnification; (b) higher magnification showing first solidification crack at (L1st)SC = 82 – 93 mm from starting point of deposit.
Figure 5.
Specimen 6061-P5 showing solidification cracking: (a) lower magnification; (b) higher magnification showing first solidification crack at (L1st)SC = 82 – 93 mm from starting point of deposit.
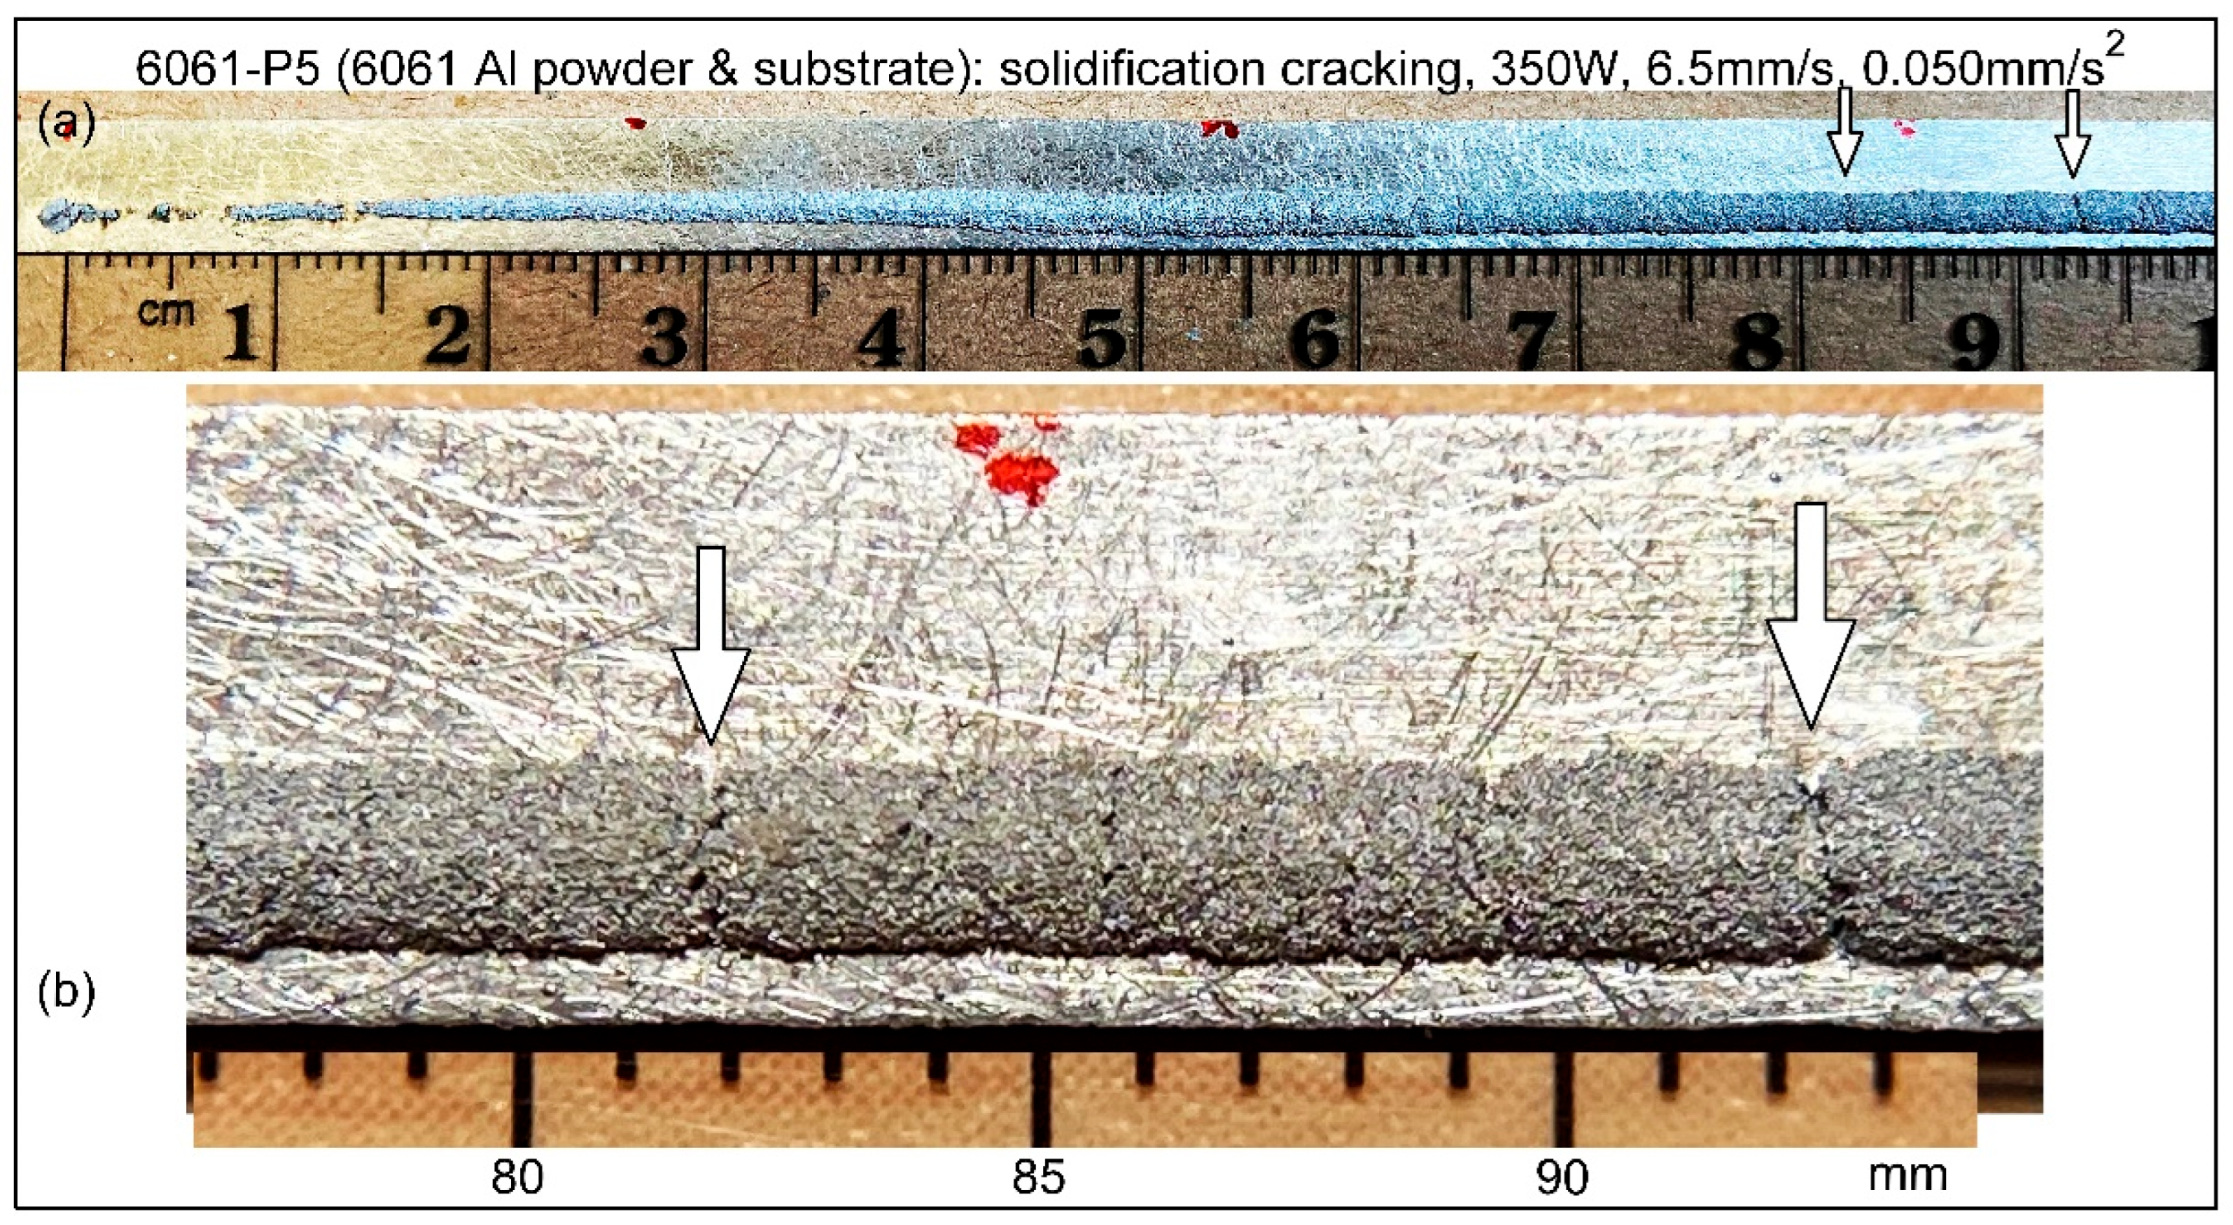
Figure 6.
Specimen 7075-P3 showing no liquation or solidification cracking: (a) lower magnification; (b) higher magnification. A section of the specimen about 40 mm long was cut off for metallography, not included in the photos.
Figure 6.
Specimen 7075-P3 showing no liquation or solidification cracking: (a) lower magnification; (b) higher magnification. A section of the specimen about 40 mm long was cut off for metallography, not included in the photos.

Figure 7.
Specimen 7075-P4 showing liquation cracking in the substrate propagating through the specimen and breaking it into two pieces: (a) (b) lower magnifications; (b) higher magnification showing the first liquation crack at (L1st)SC = 77 mm from the starting point of the new deposit, which was made after the old deposit had cooled down.
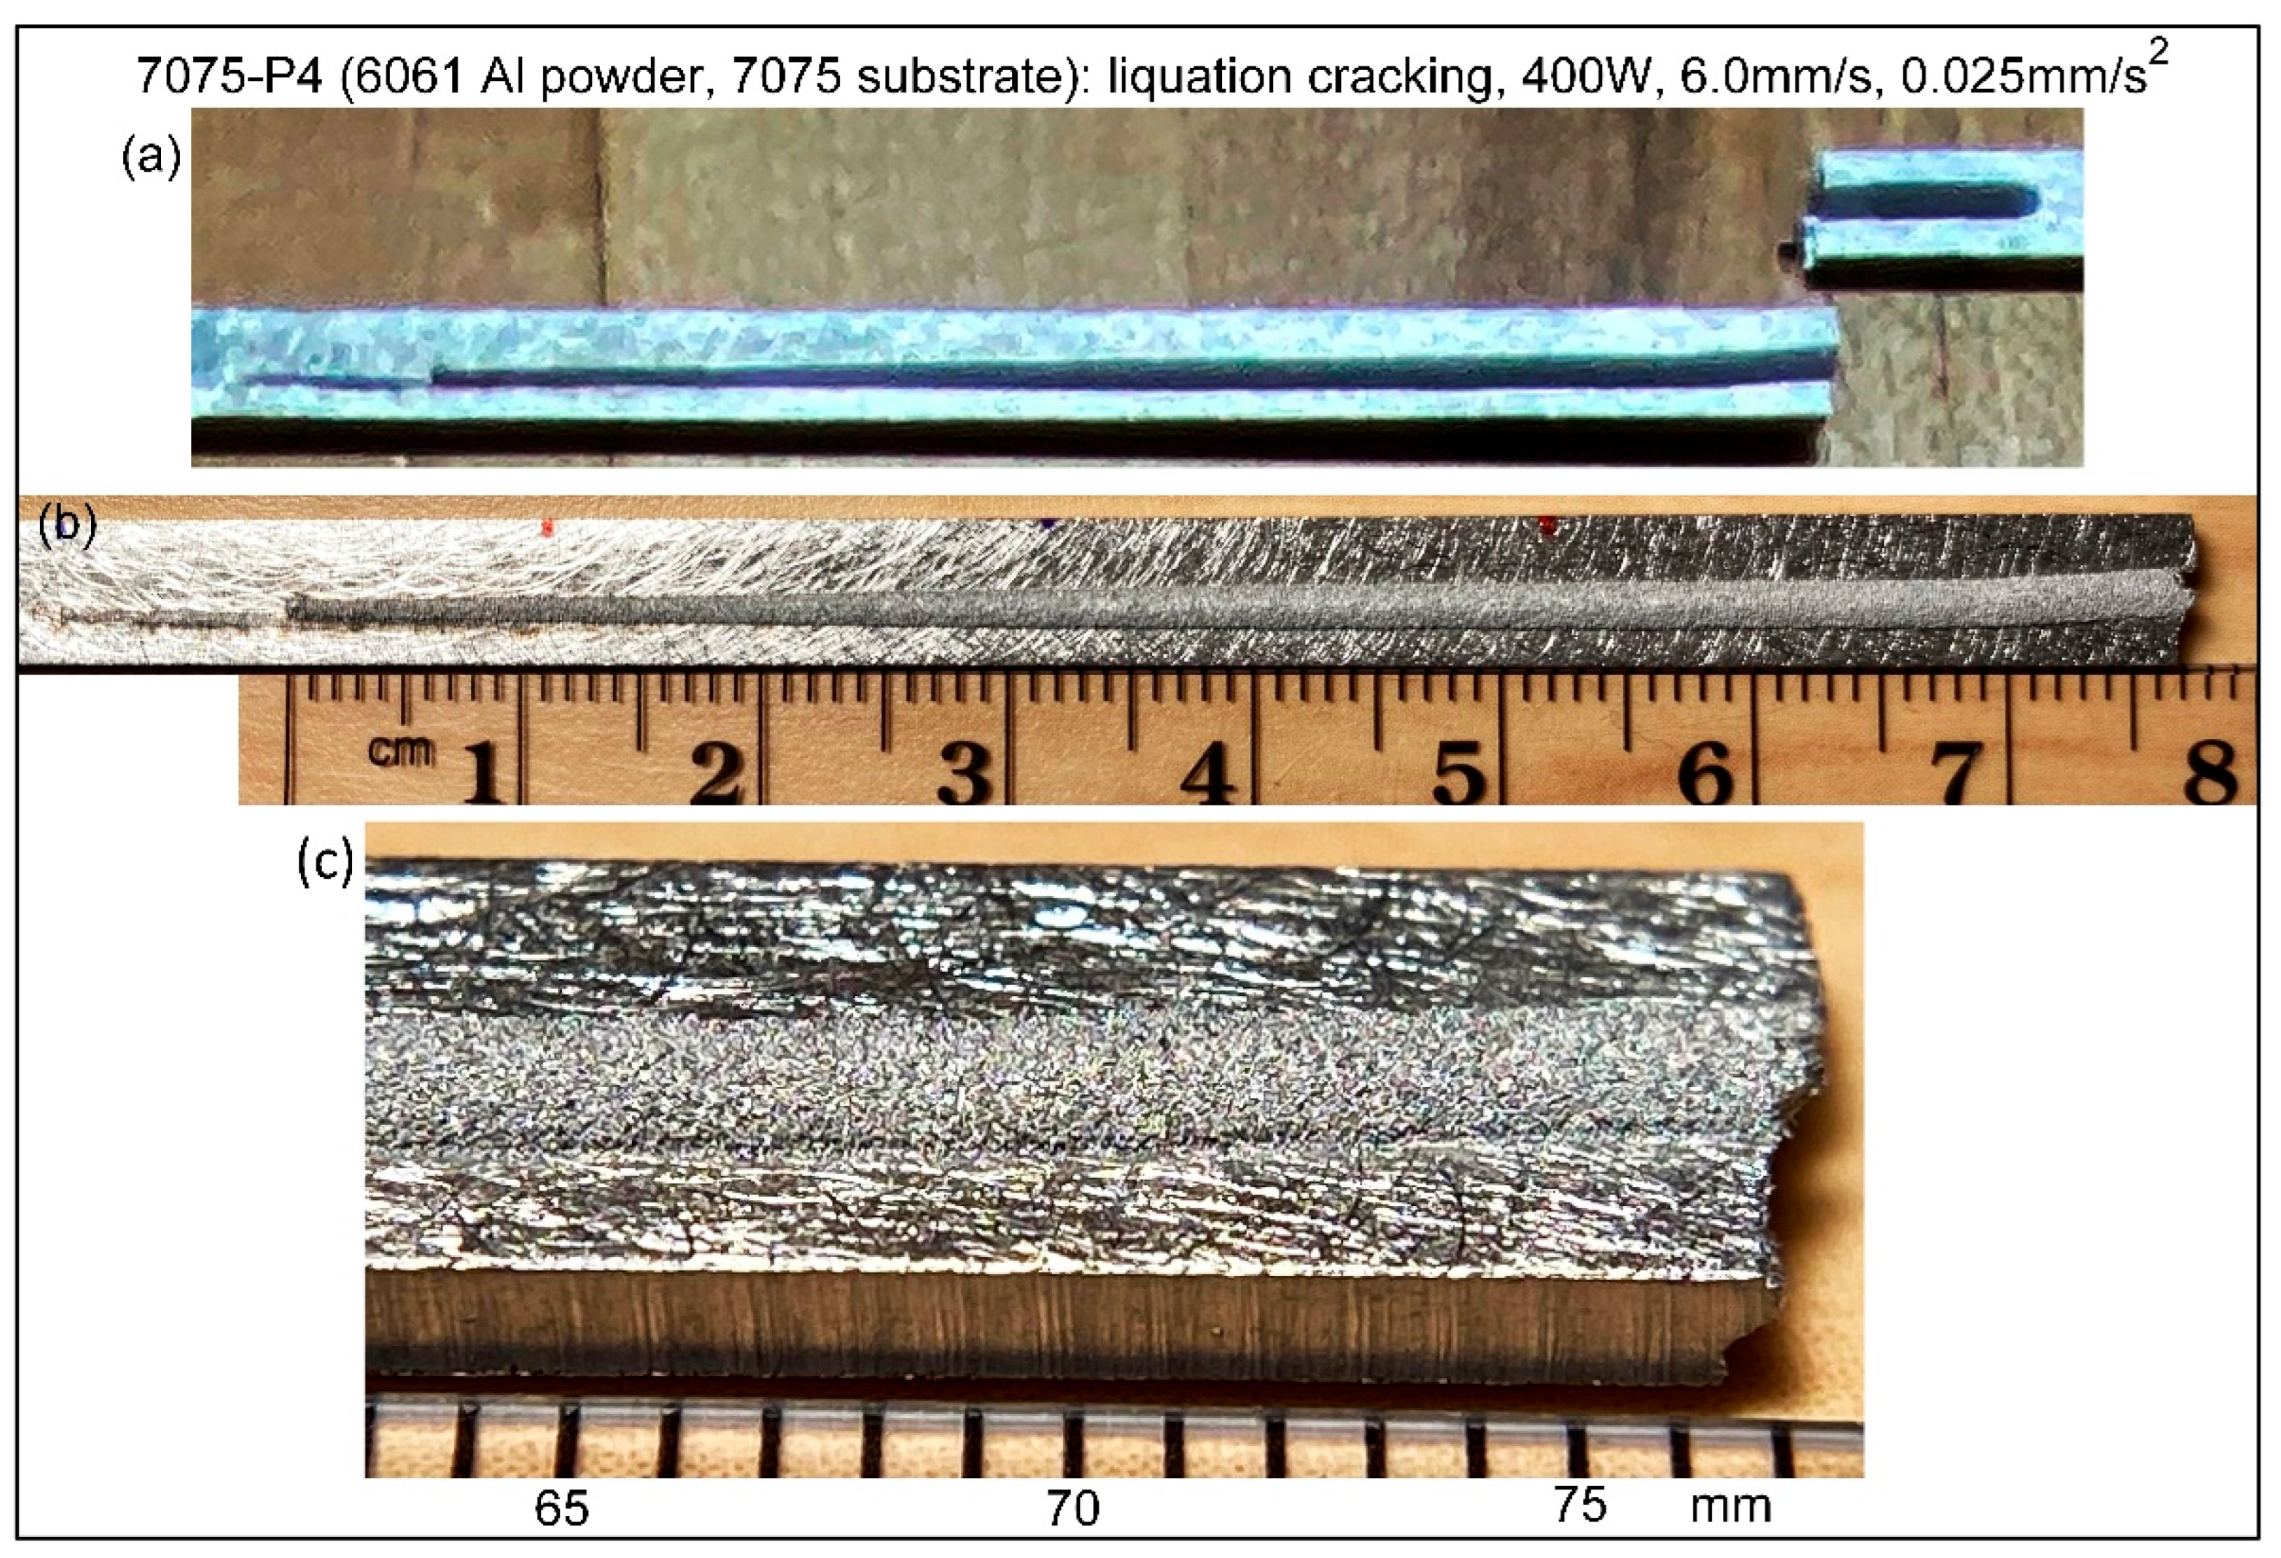
Figure 8.
Specimen 7075-P6 showing liquation cracking in the substrate propagating through the specimen and breaking it into two pieces: (a) lower magnification showing first liquation crack at (L1st)SC = 86 mm from starting point of deposit (material in rectangular box was cut off for examination of fracture surfaces); (b) higher magnification.
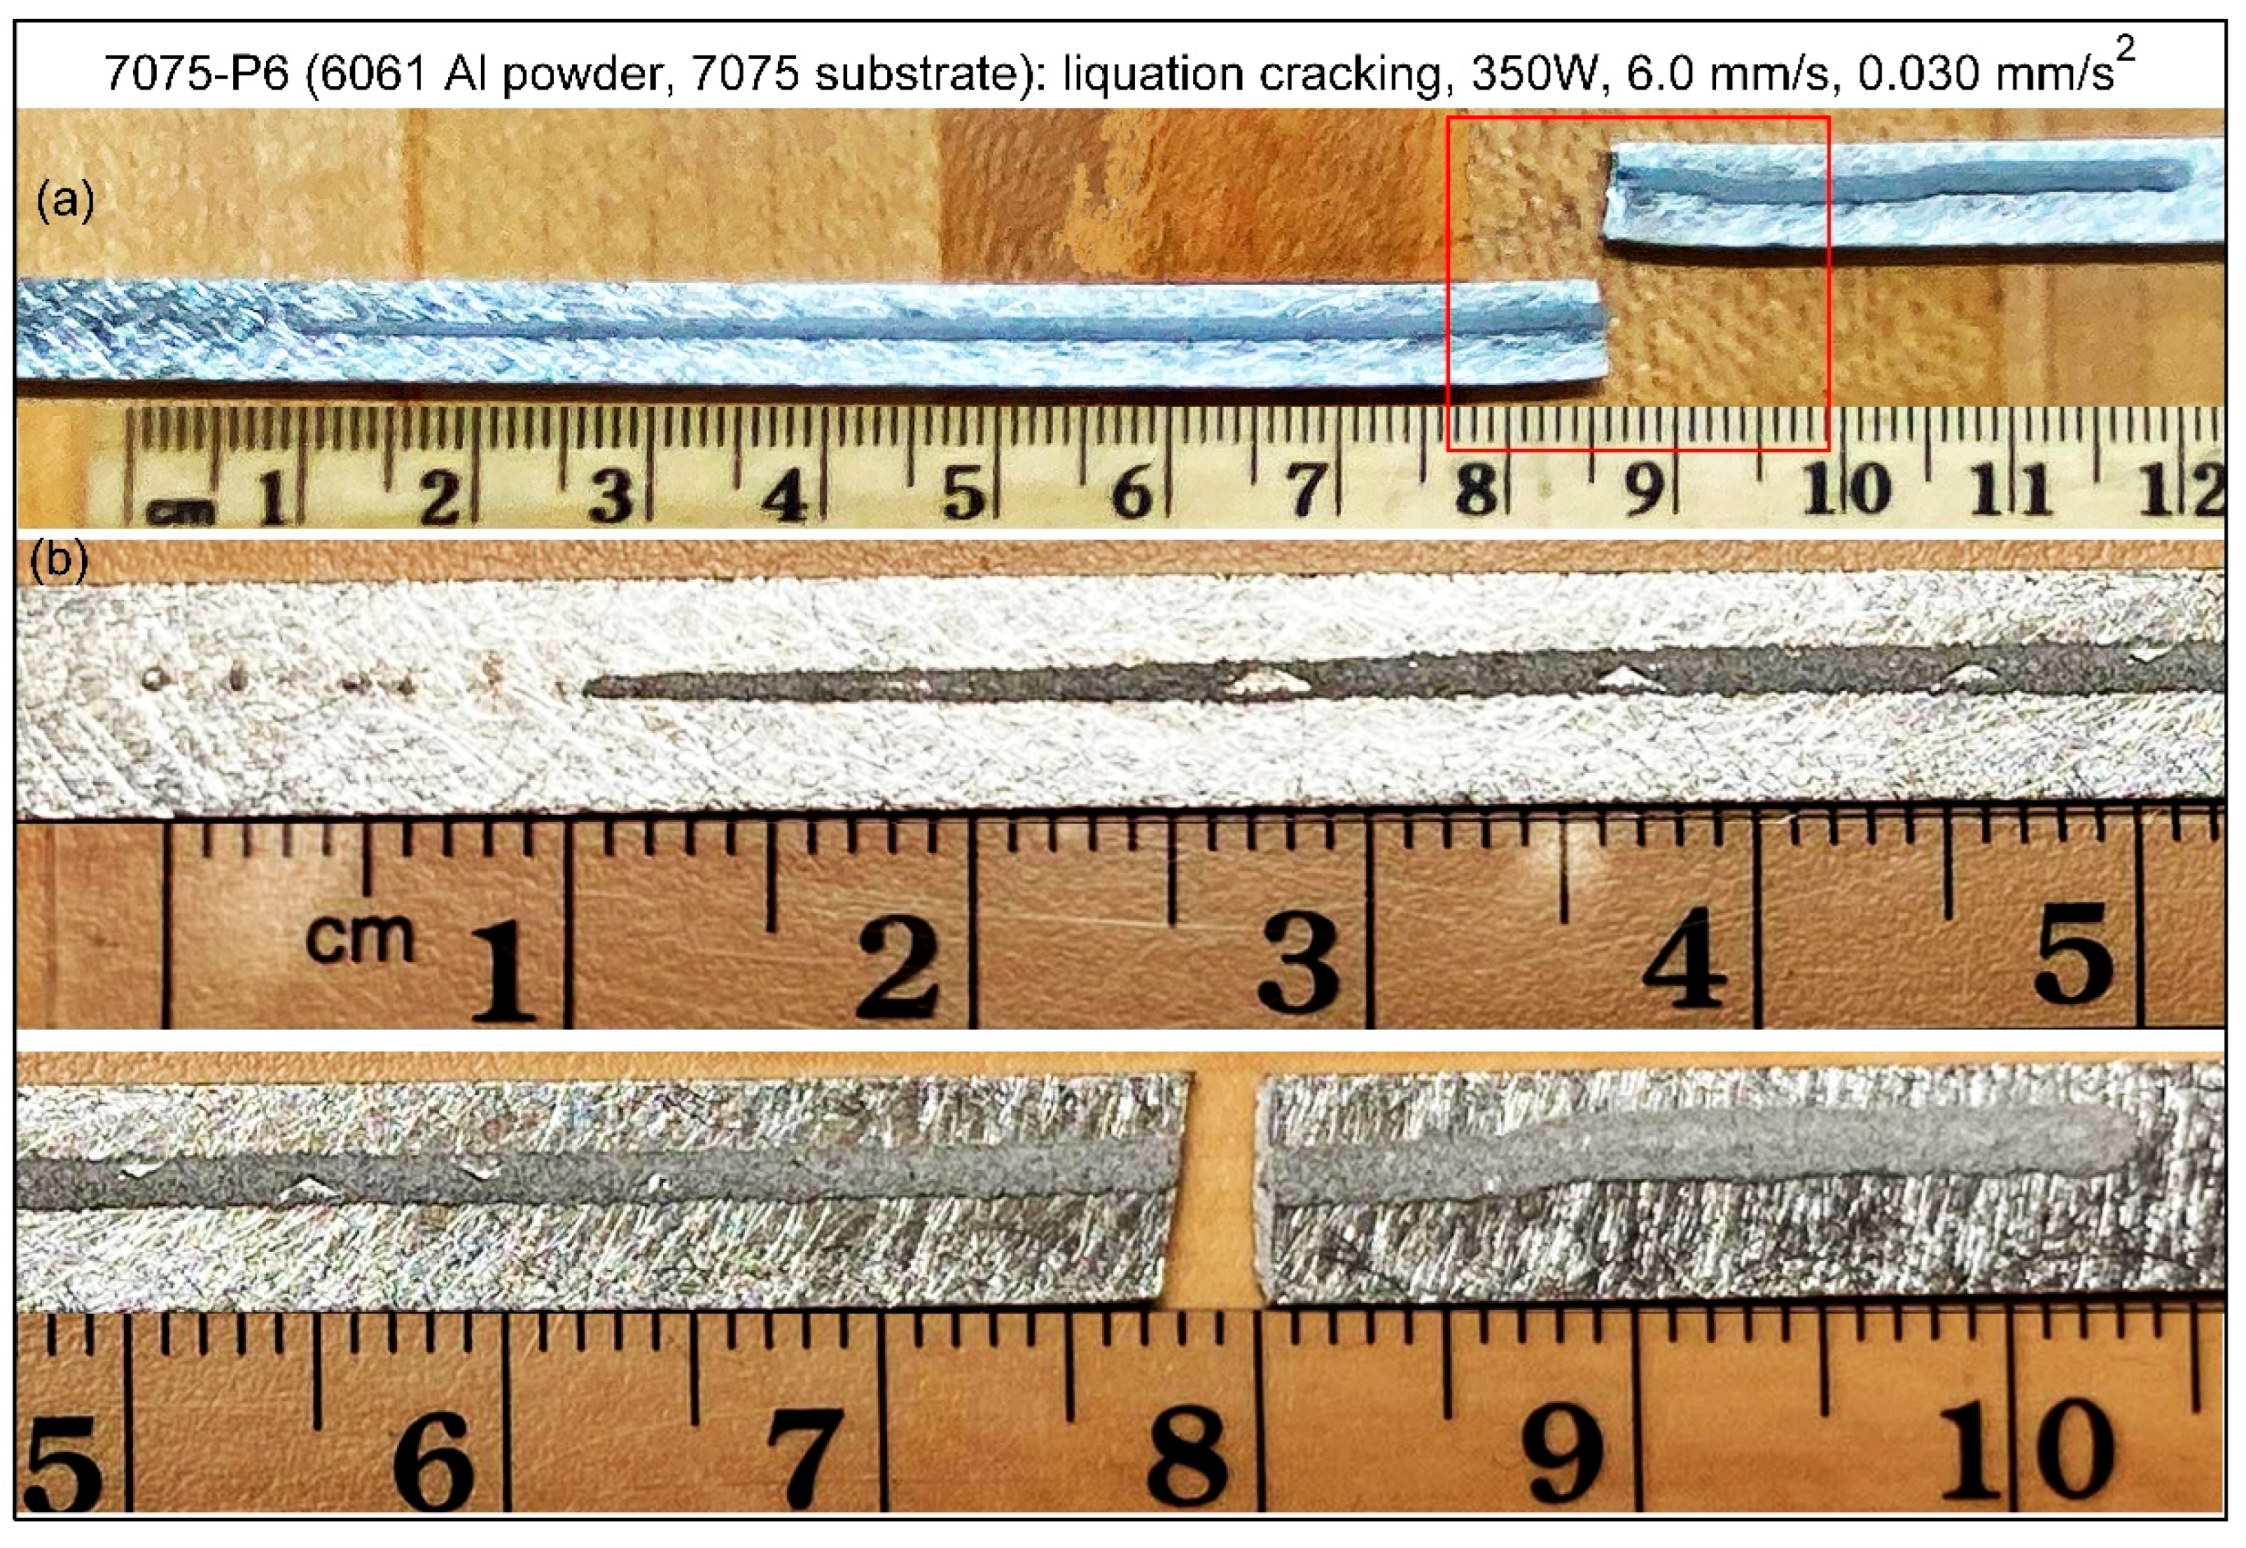
Figure 9.
SEM image of fracture surface of Specimen 7075-P6 (350W, 6.0 mm/s and 0.030 mm/s2) showing liquation cracking in the substrate propagating through the deposit (as solidification cracking) and breaking the specimen into two pieces: (a) lower magnification; (b) higher magnification. The specimen is rotated 90 degrees counterclockwise, so its top surface is on the left side of SEM image and its bottom surface on the right.
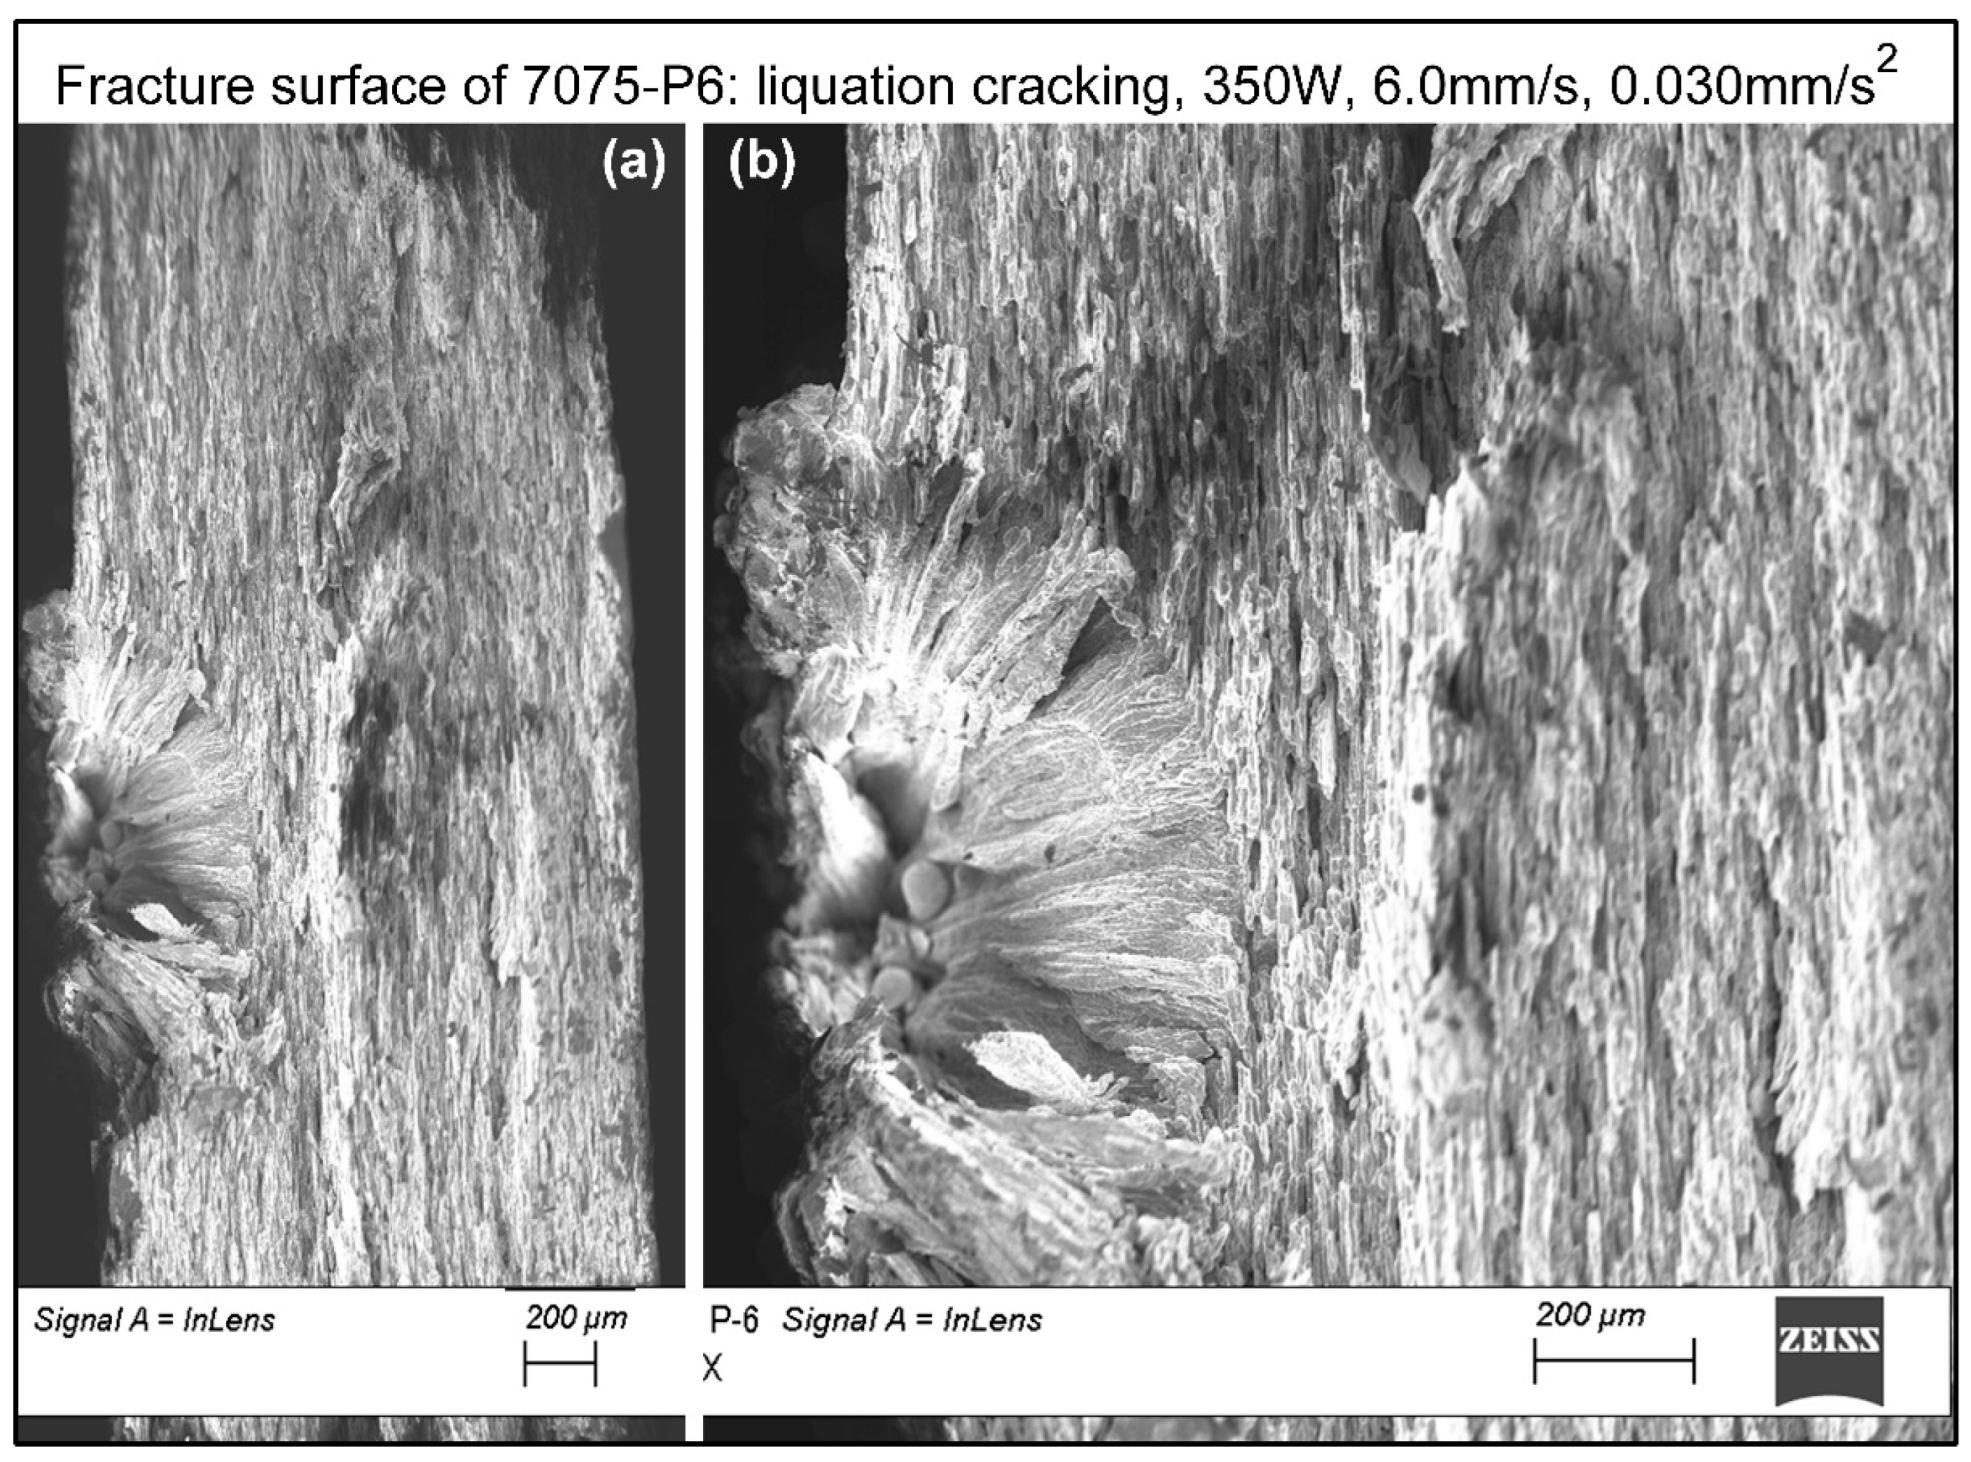
Figure 10.
SEM image of fracture surface of Specimen 7075-P6 (350W, 6.0mm/s and 0.030 mm/s2) showing liquation cracking in the substrate (right side; intergranular nondendritic grains aligning in the rolling direction) and solidification cracking in the deposit (left side; intergranular dendritic grains).
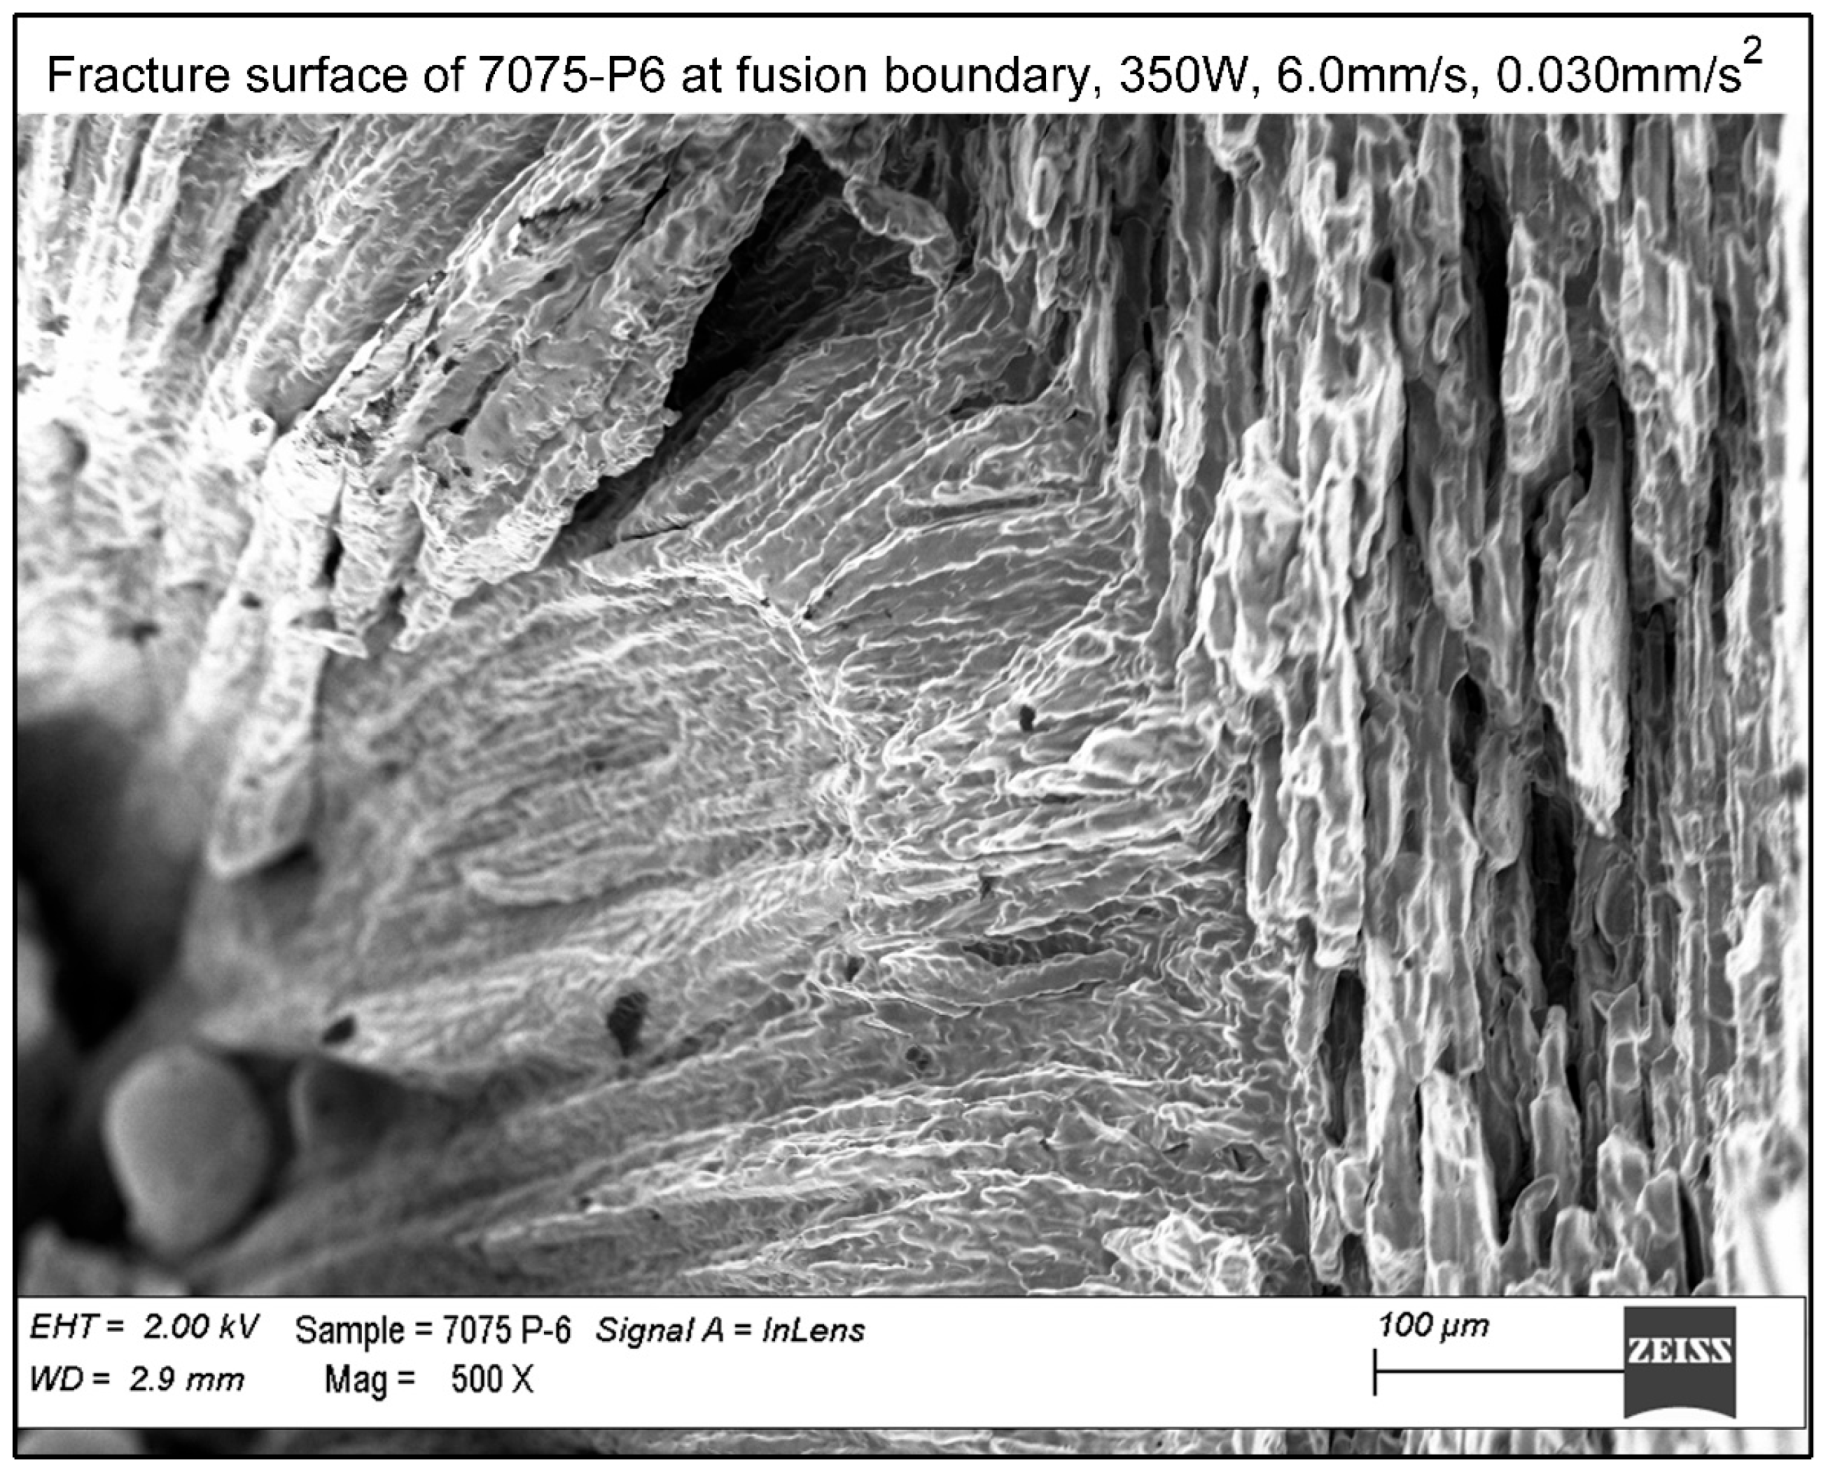
Figure 11.
SEM image of fracture surface of the deposit in Specimen 7075-P6 (350W, 6.0mm/s and 0.030 mm/s2) showing solidification cracking (intergranular dendritic grains).
Figure 11.
SEM image of fracture surface of the deposit in Specimen 7075-P6 (350W, 6.0mm/s and 0.030 mm/s2) showing solidification cracking (intergranular dendritic grains).
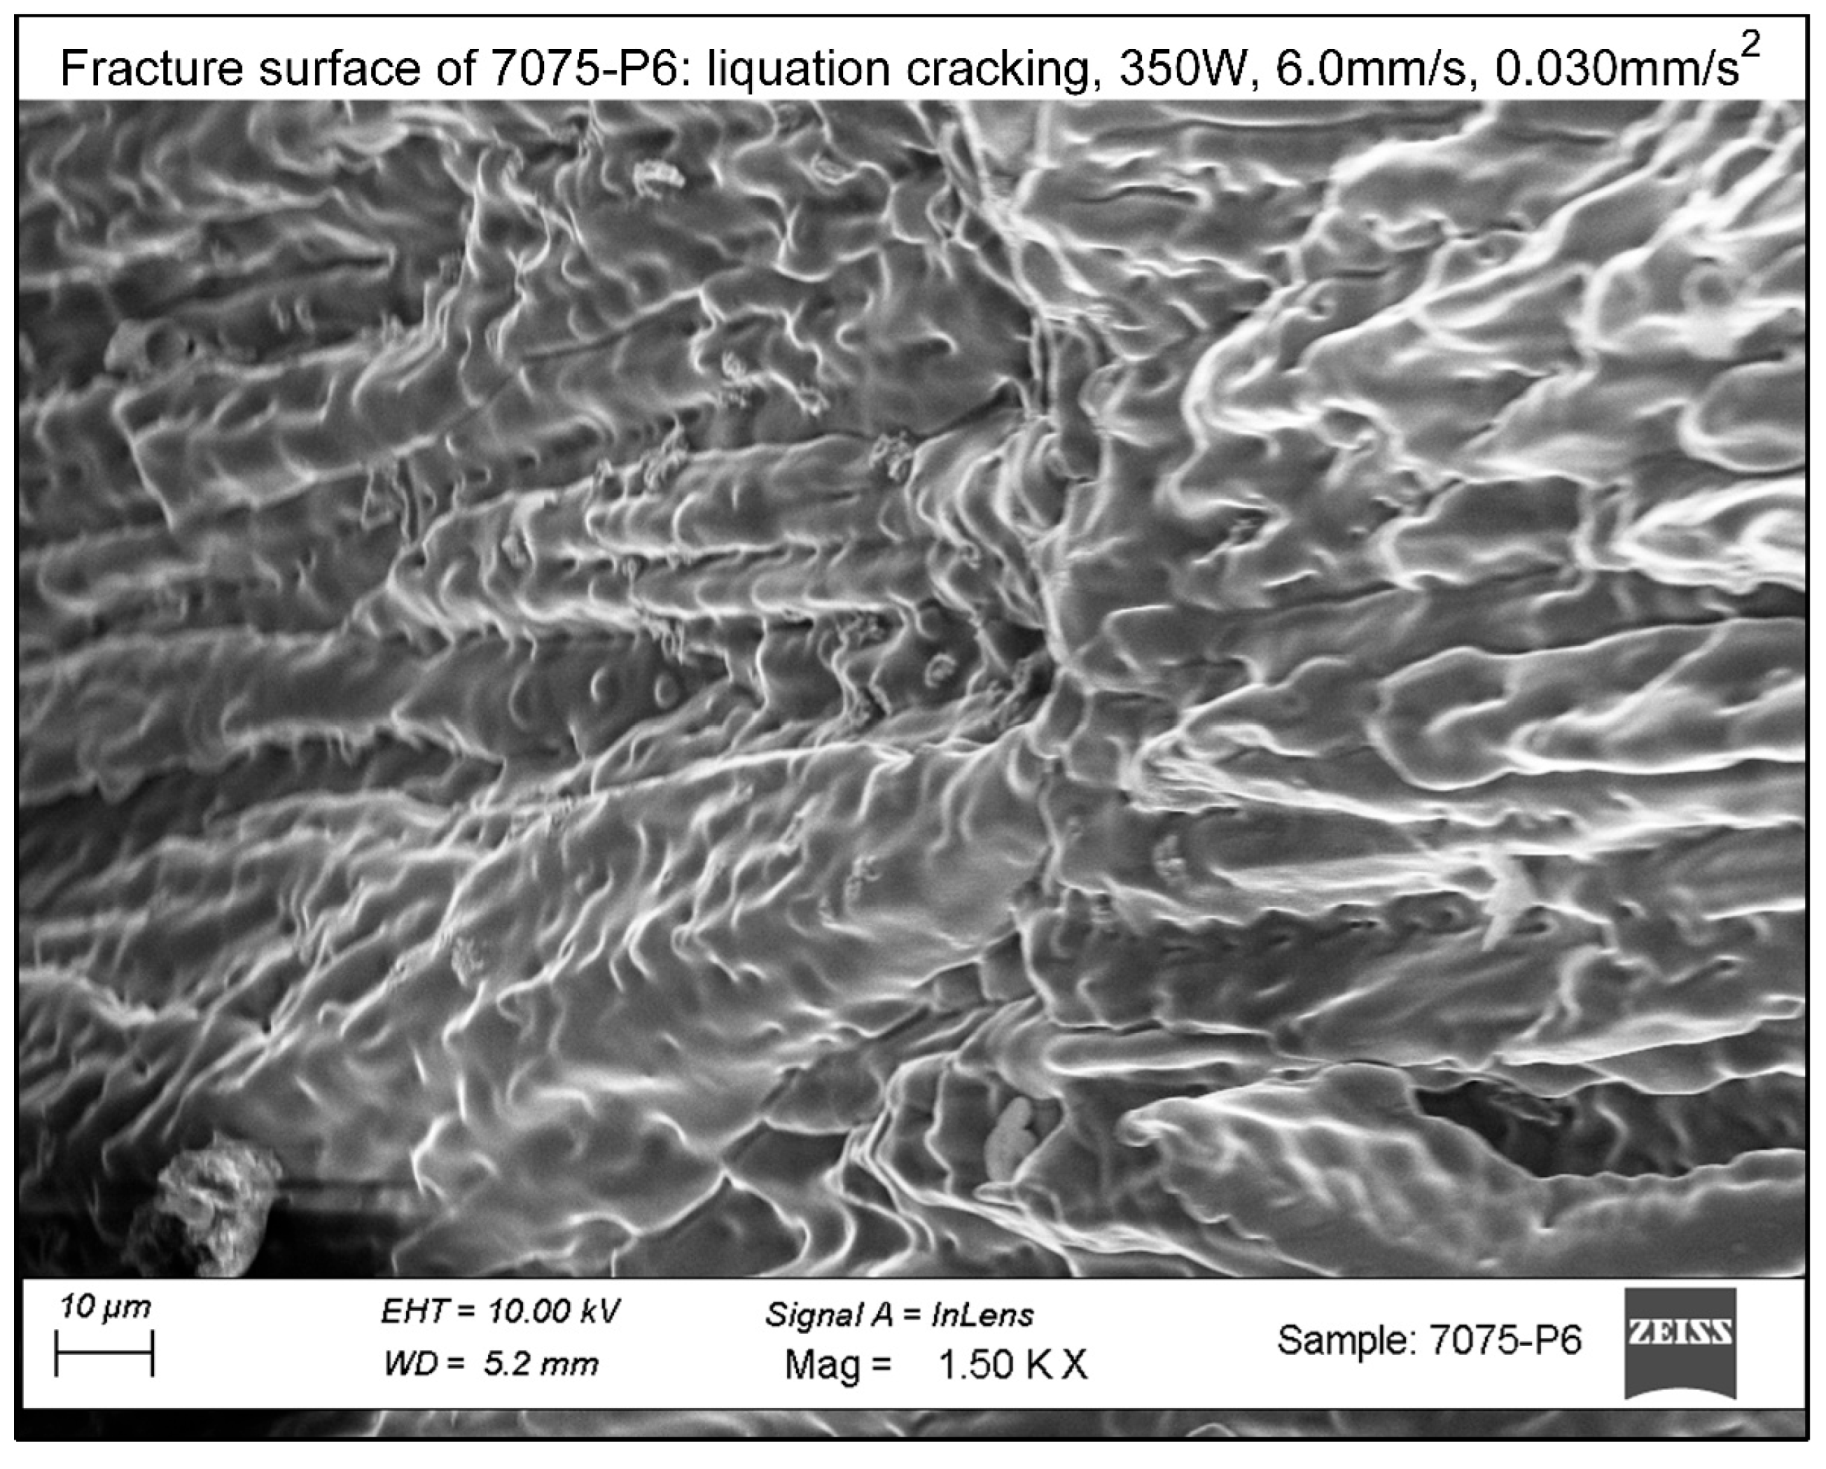
Figure 12.
Specimen 6061-P7 showing liquation cracking in the substrate propagating through the deposit (as solidification cracking): (a) lower magnification; (b) higher magnification.
Figure 12.
Specimen 6061-P7 showing liquation cracking in the substrate propagating through the deposit (as solidification cracking): (a) lower magnification; (b) higher magnification.
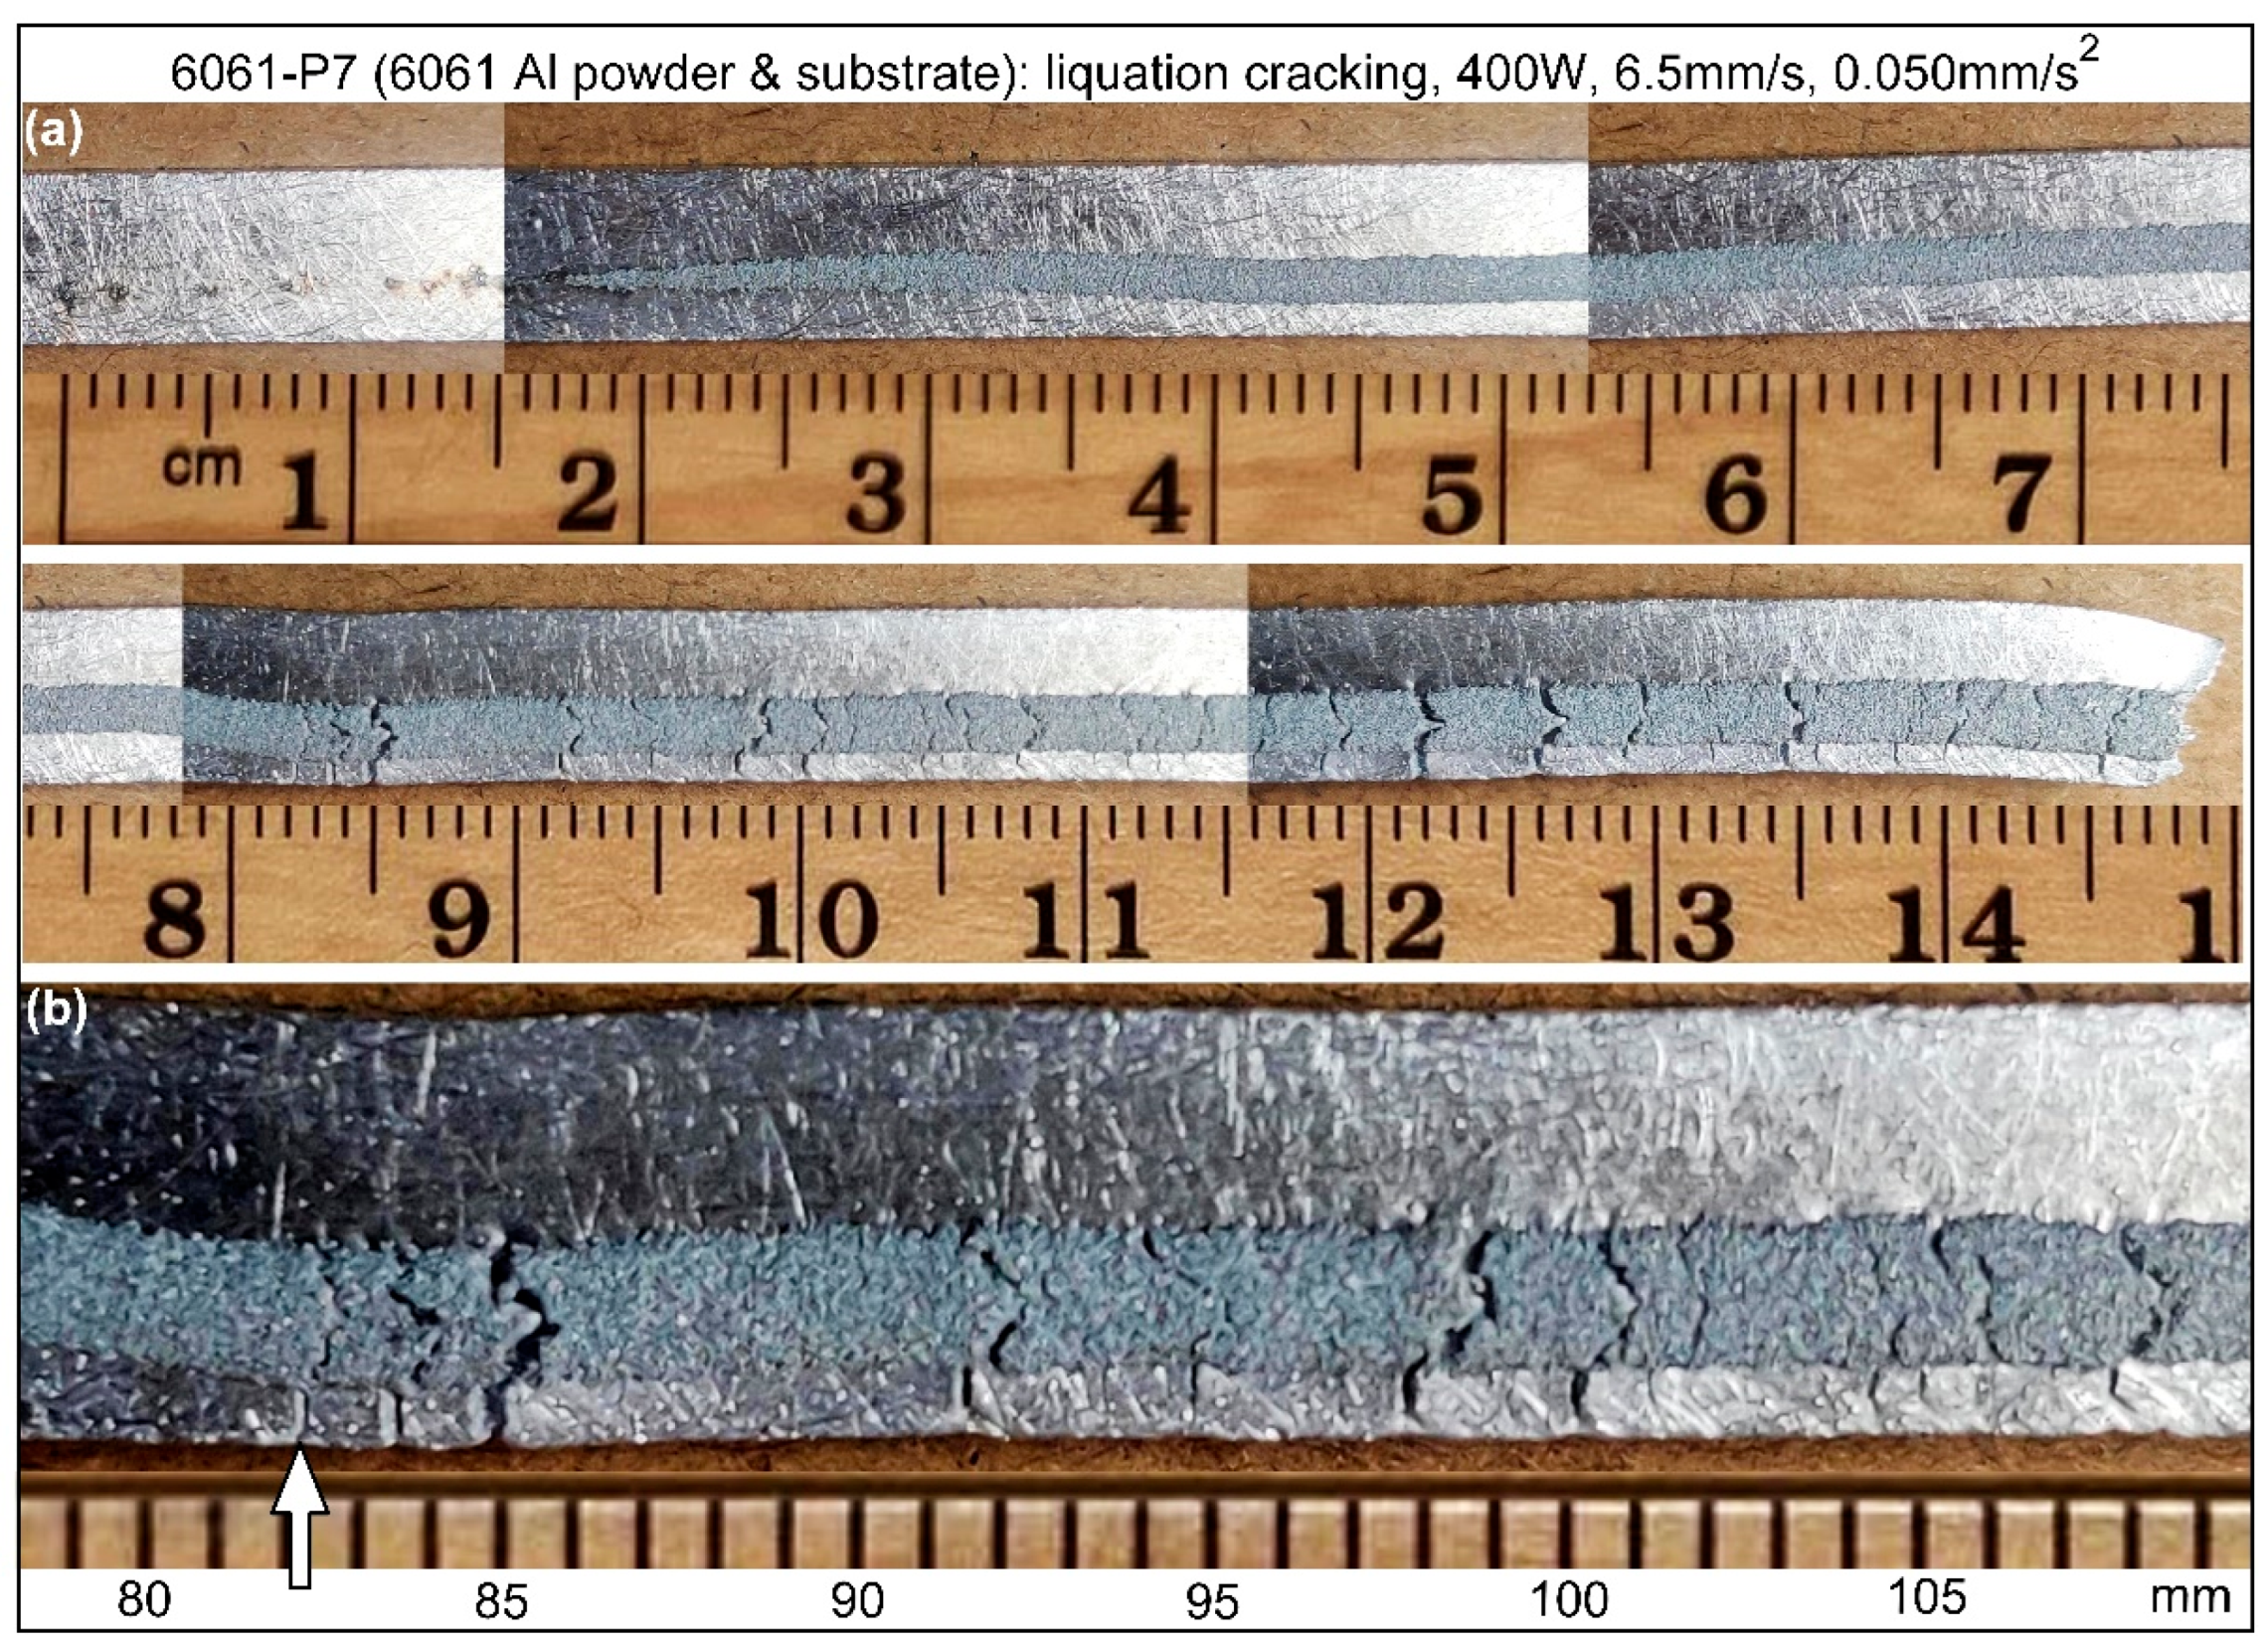
Figure 13.
SEM image of fracture surface of Specimen 6061-P7 (6061 Al deposited with 6061). The sample is rotated 90 degrees counterclockwise, so its top surface is on the left side of SEM image and its bottom surface on the right.
Figure 13.
SEM image of fracture surface of Specimen 6061-P7 (6061 Al deposited with 6061). The sample is rotated 90 degrees counterclockwise, so its top surface is on the left side of SEM image and its bottom surface on the right.
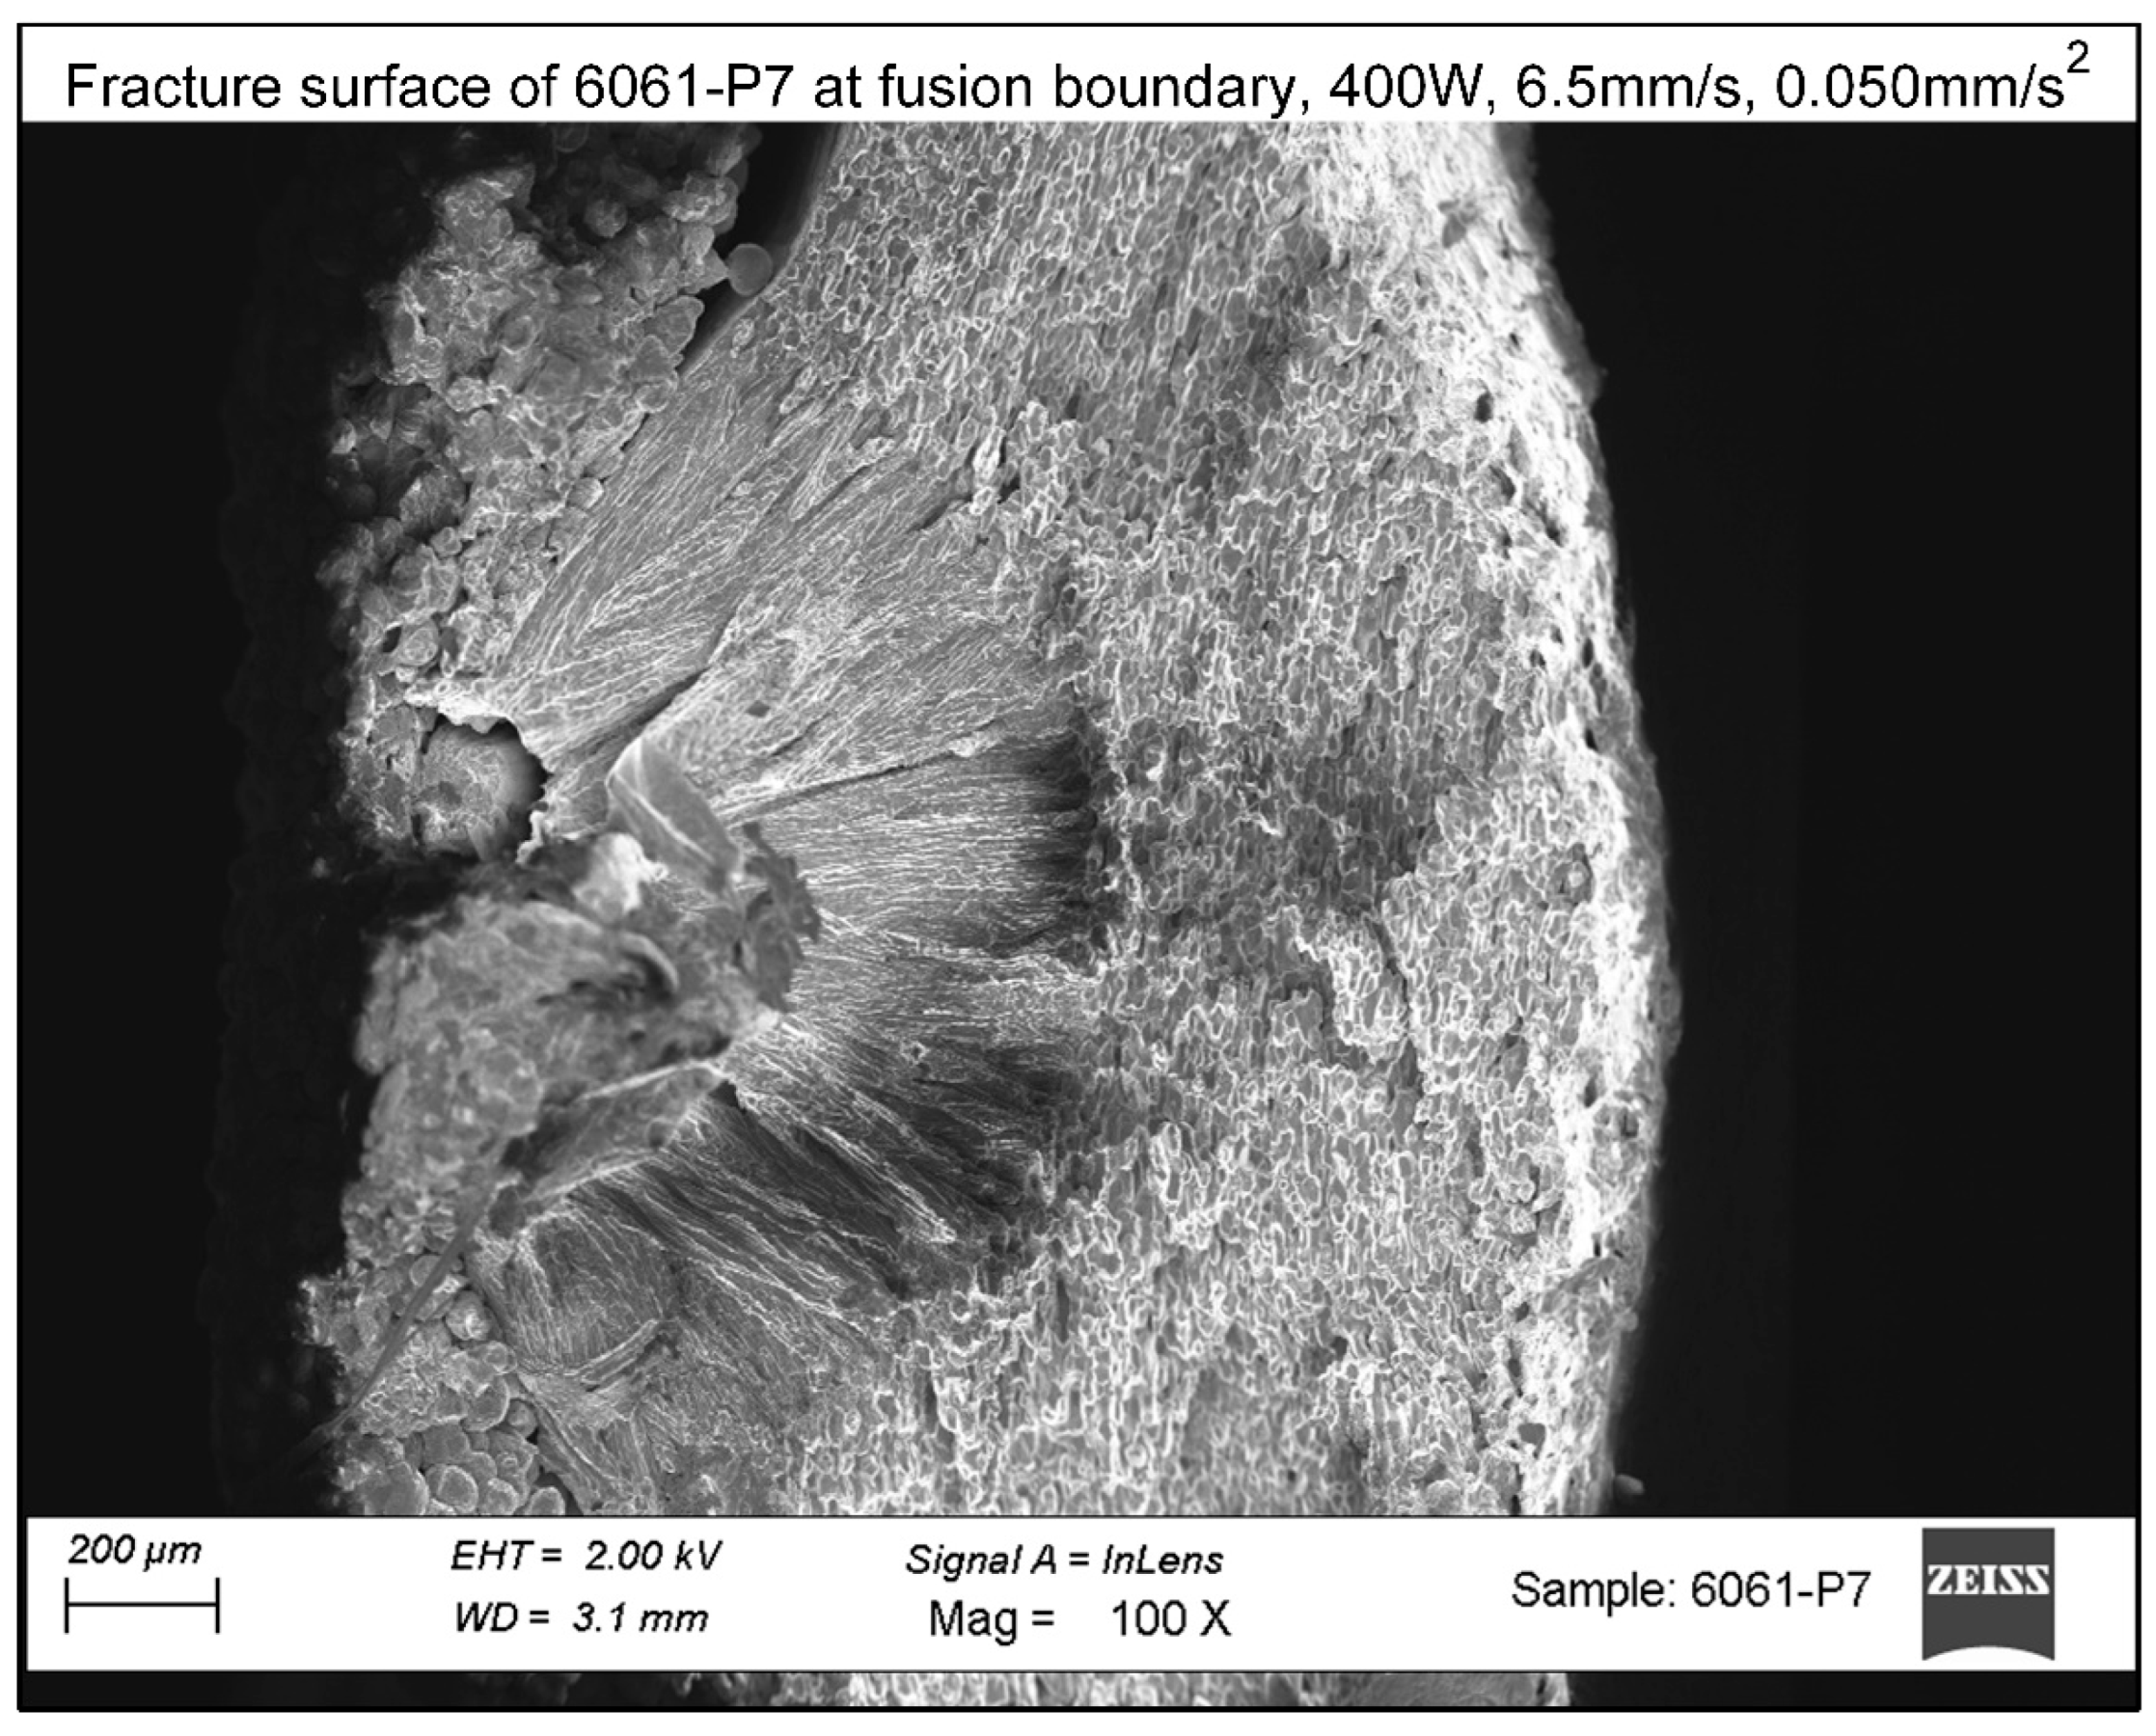
Figure 14.
Center of the SEM image of Sample 6061 P7 in Figure 13 enlarged to show the fracture surface near the fusion boundary, which is dendritic in the deposit (solidification cracking) and nondendritic in the nearby substrate (liquation cracking).
Figure 14.
Center of the SEM image of Sample 6061 P7 in Figure 13 enlarged to show the fracture surface near the fusion boundary, which is dendritic in the deposit (solidification cracking) and nondendritic in the nearby substrate (liquation cracking).
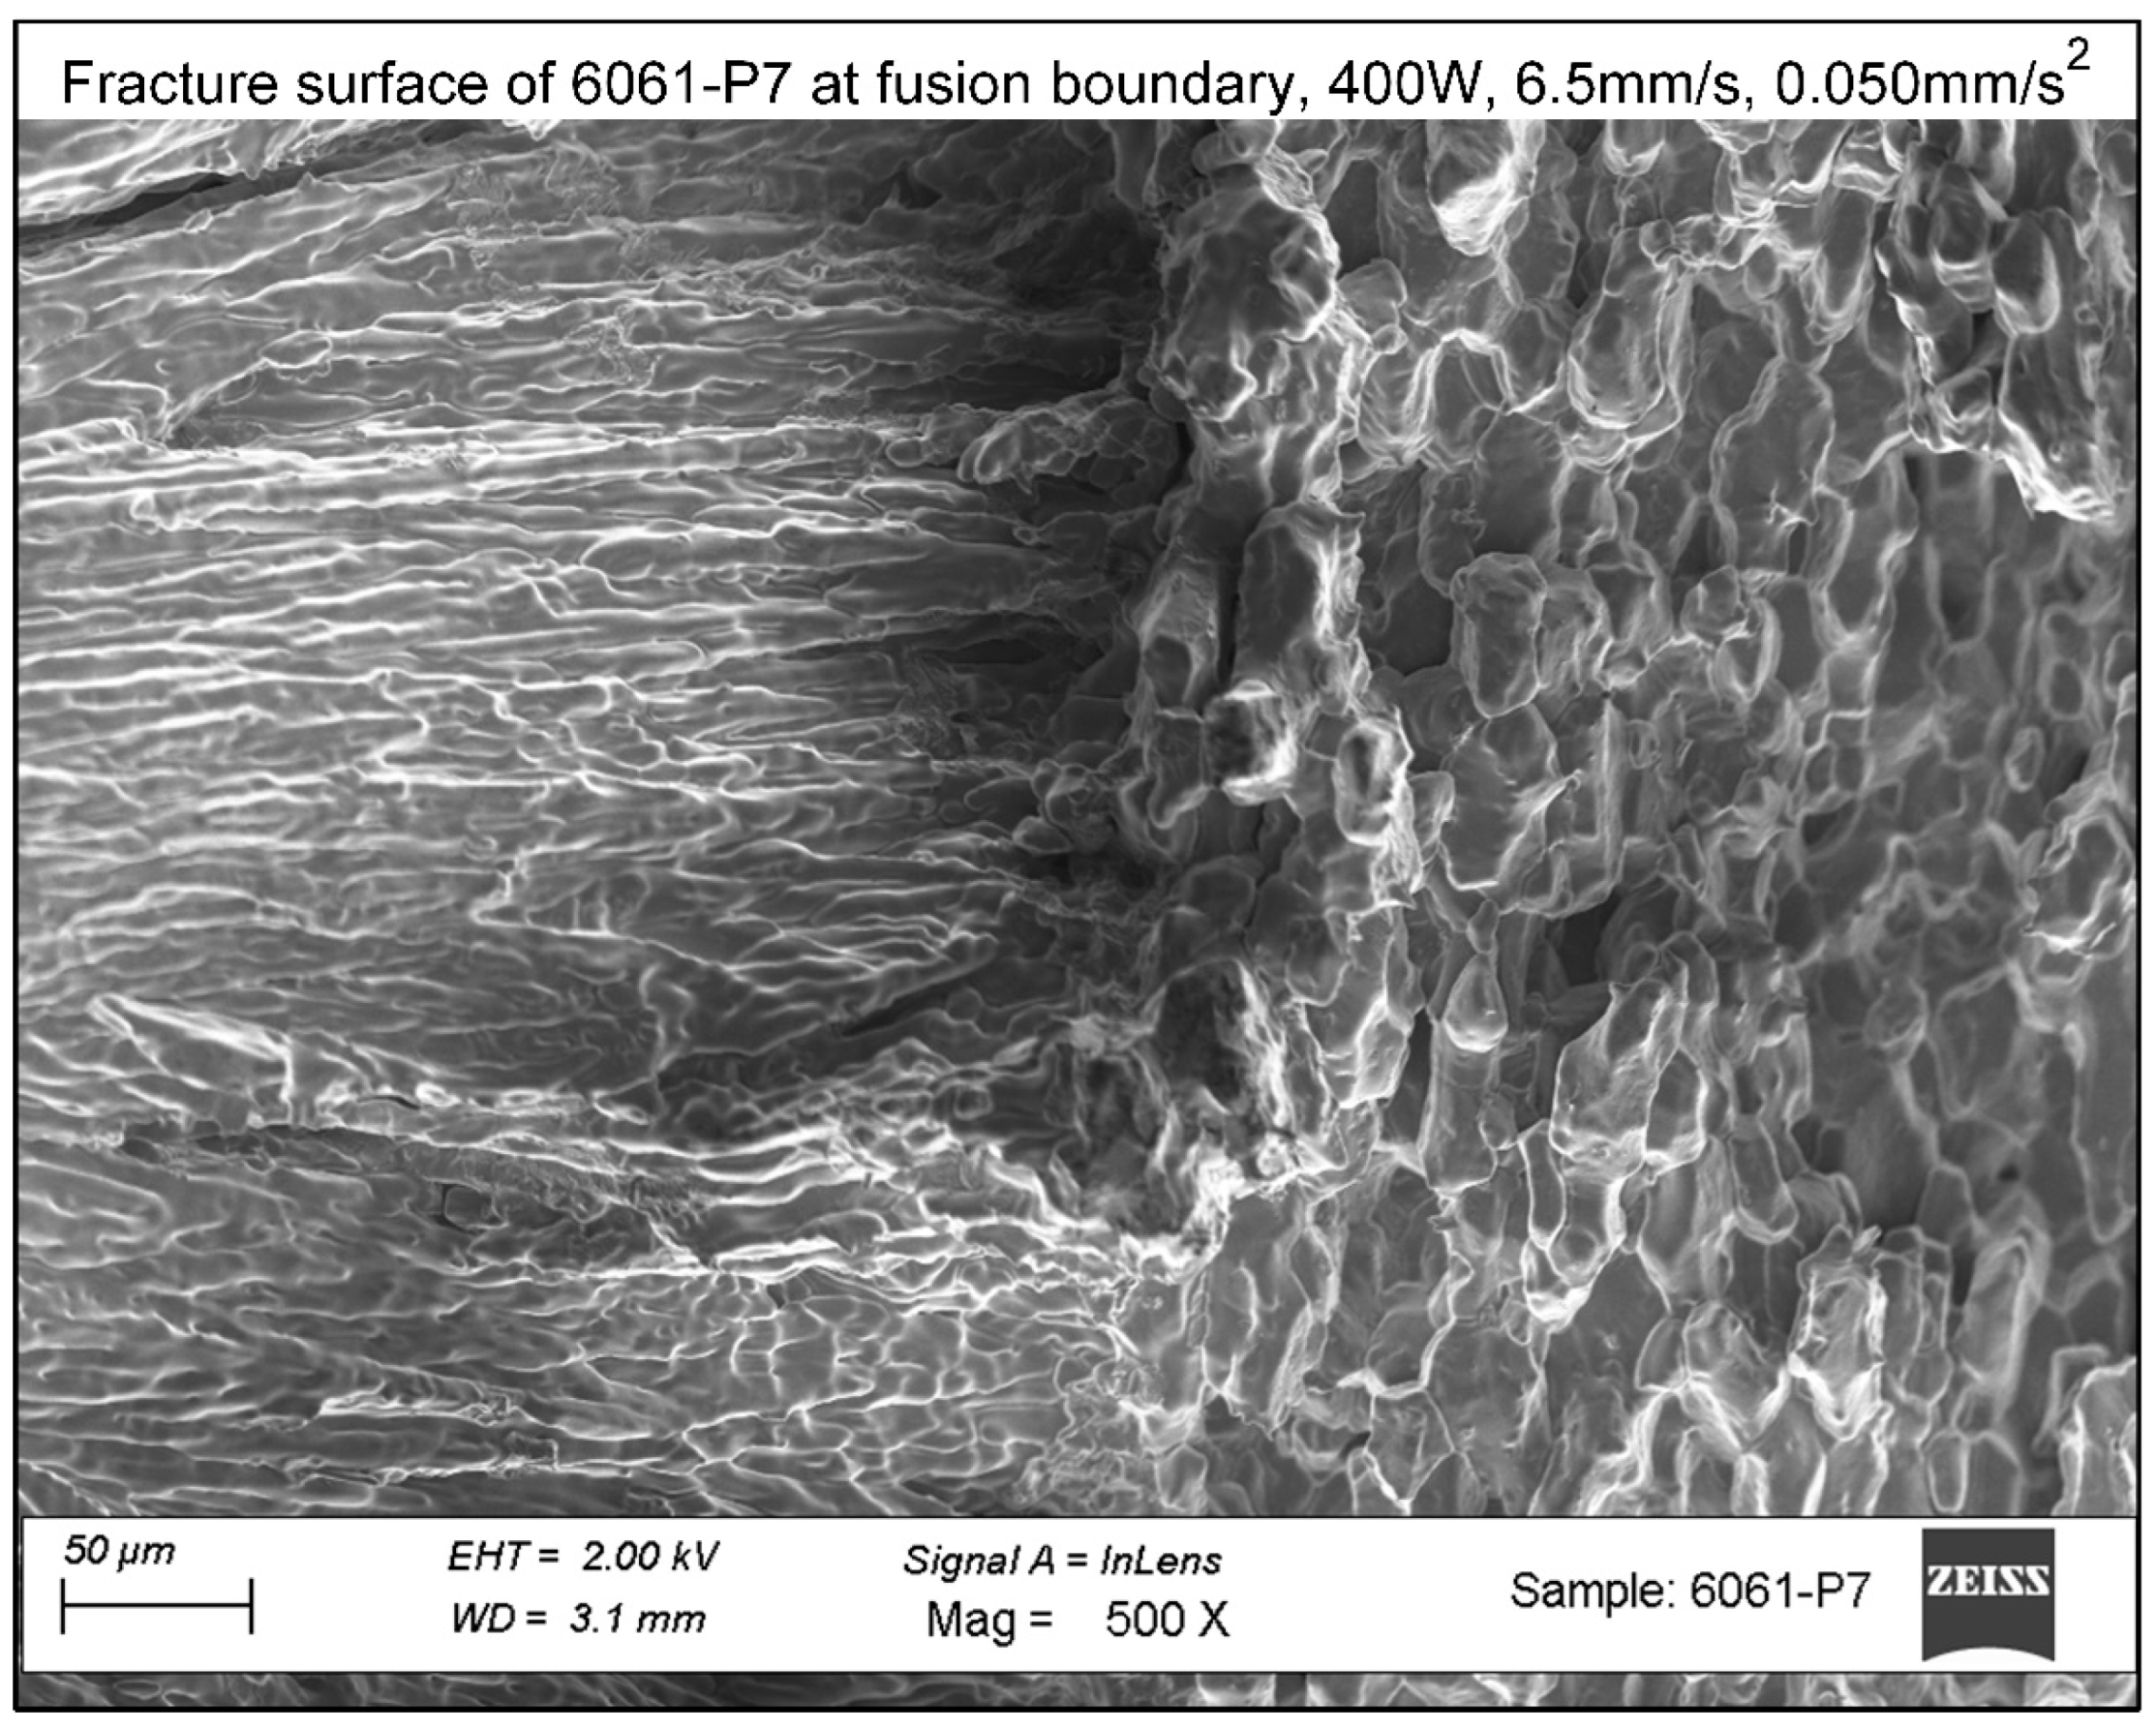
Figure 15.
SEM image showing cellular/dendritic fracture surface of Sample 6061 P7, confirming solidification cracking in the deposit.
Figure 15.
SEM image showing cellular/dendritic fracture surface of Sample 6061 P7, confirming solidification cracking in the deposit.
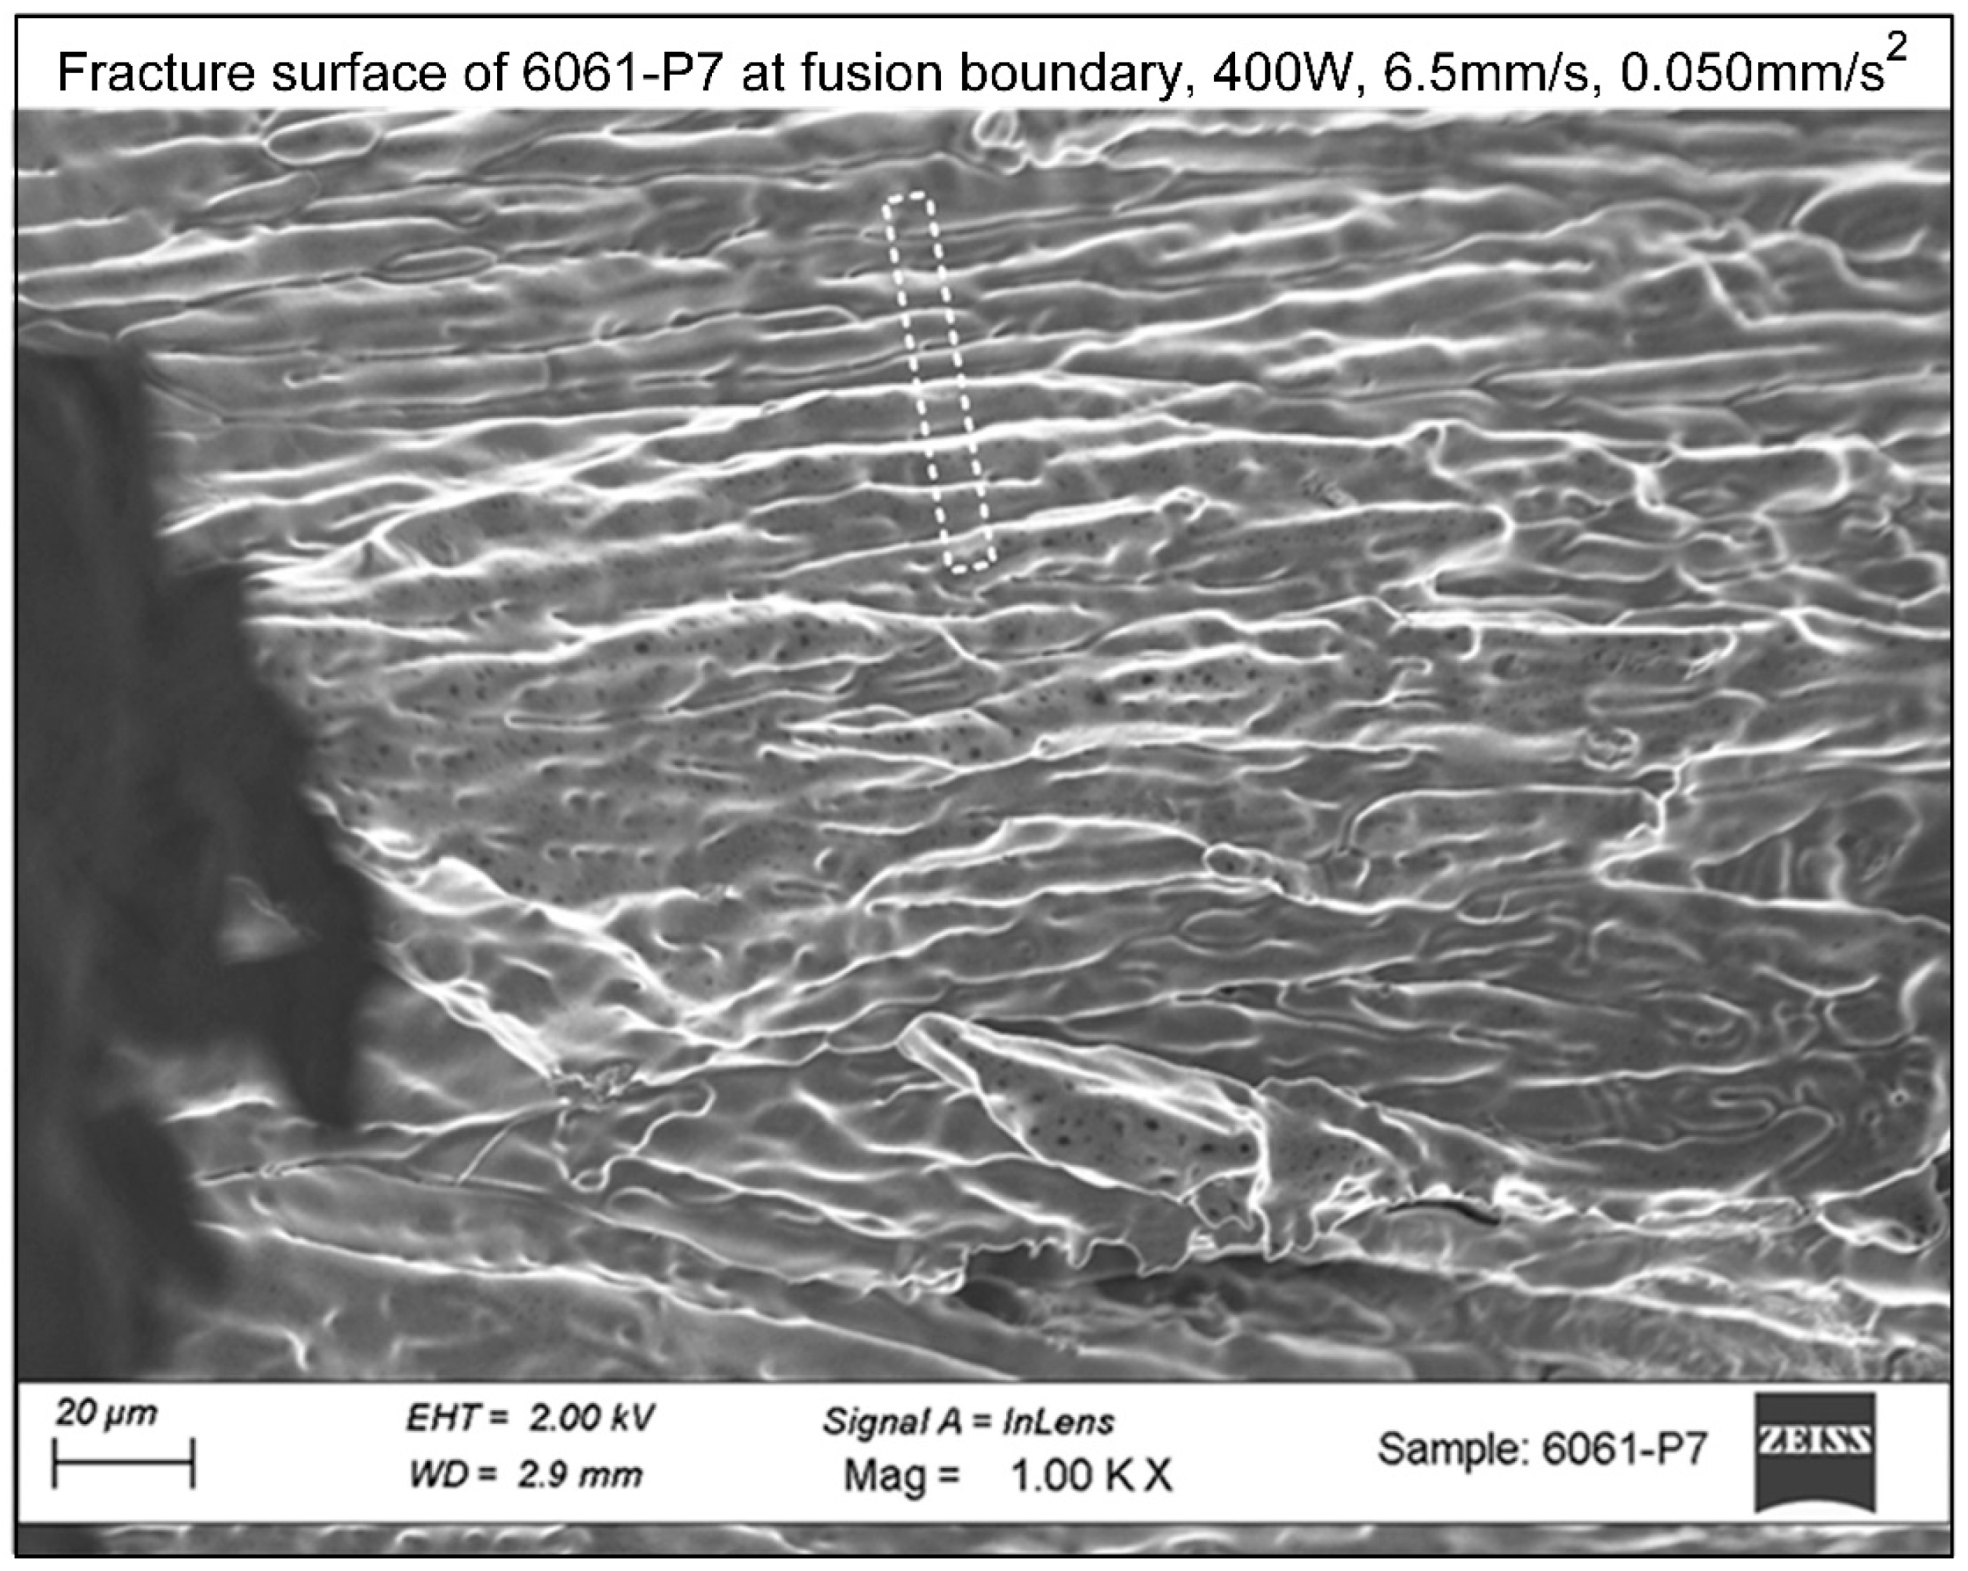
Figure 16.
Primary dendrite arm spacing vs. cooling rate of Al-3Cu-1Li alloy as an approximation for 6061 Al. Adapted from Santos et al. [42].
Figure 16.
Primary dendrite arm spacing vs. cooling rate of Al-3Cu-1Li alloy as an approximation for 6061 Al. Adapted from Santos et al. [42].
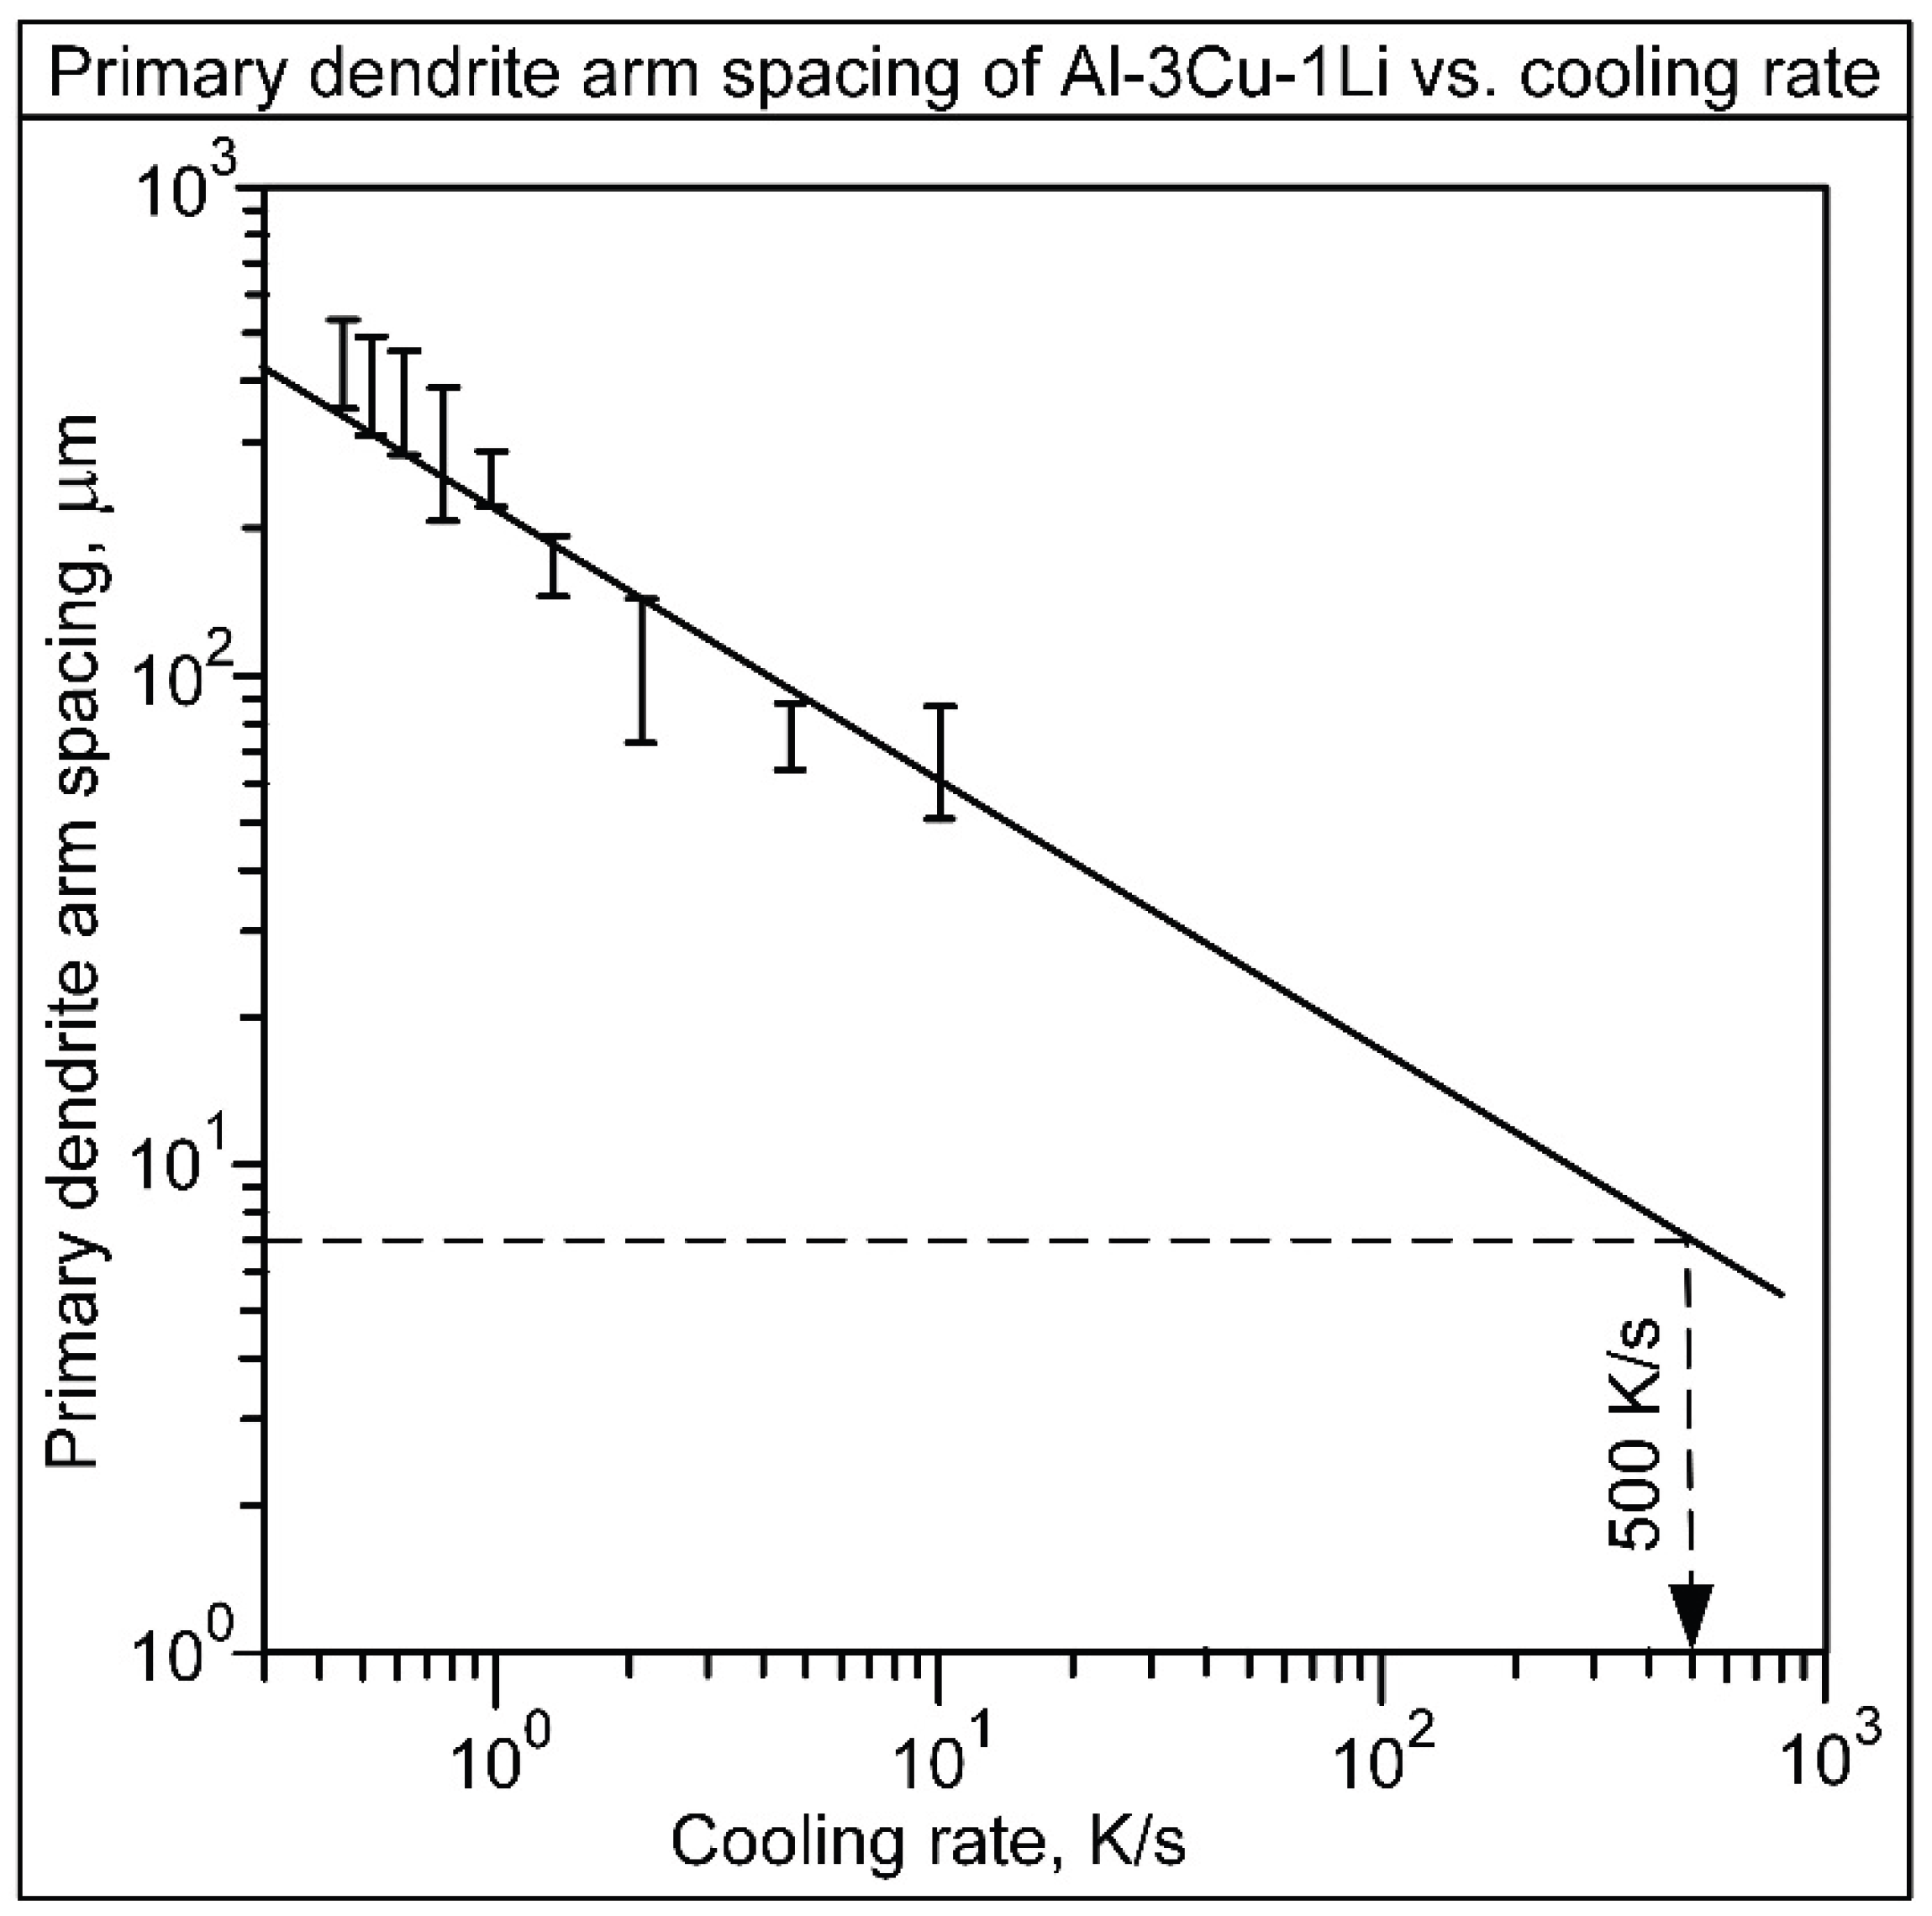
Figure 17.
Effect of substrate and deposit location on liquation: (a) 7075 Al substrate; (b) less liquation in 6061 Al substrate; (c) liquation in 6061 Al substrate worsens if deposit gets close to substrate edge. For illustration, grain boundaries are shown normal to pulling direction (similar to Figure 10).
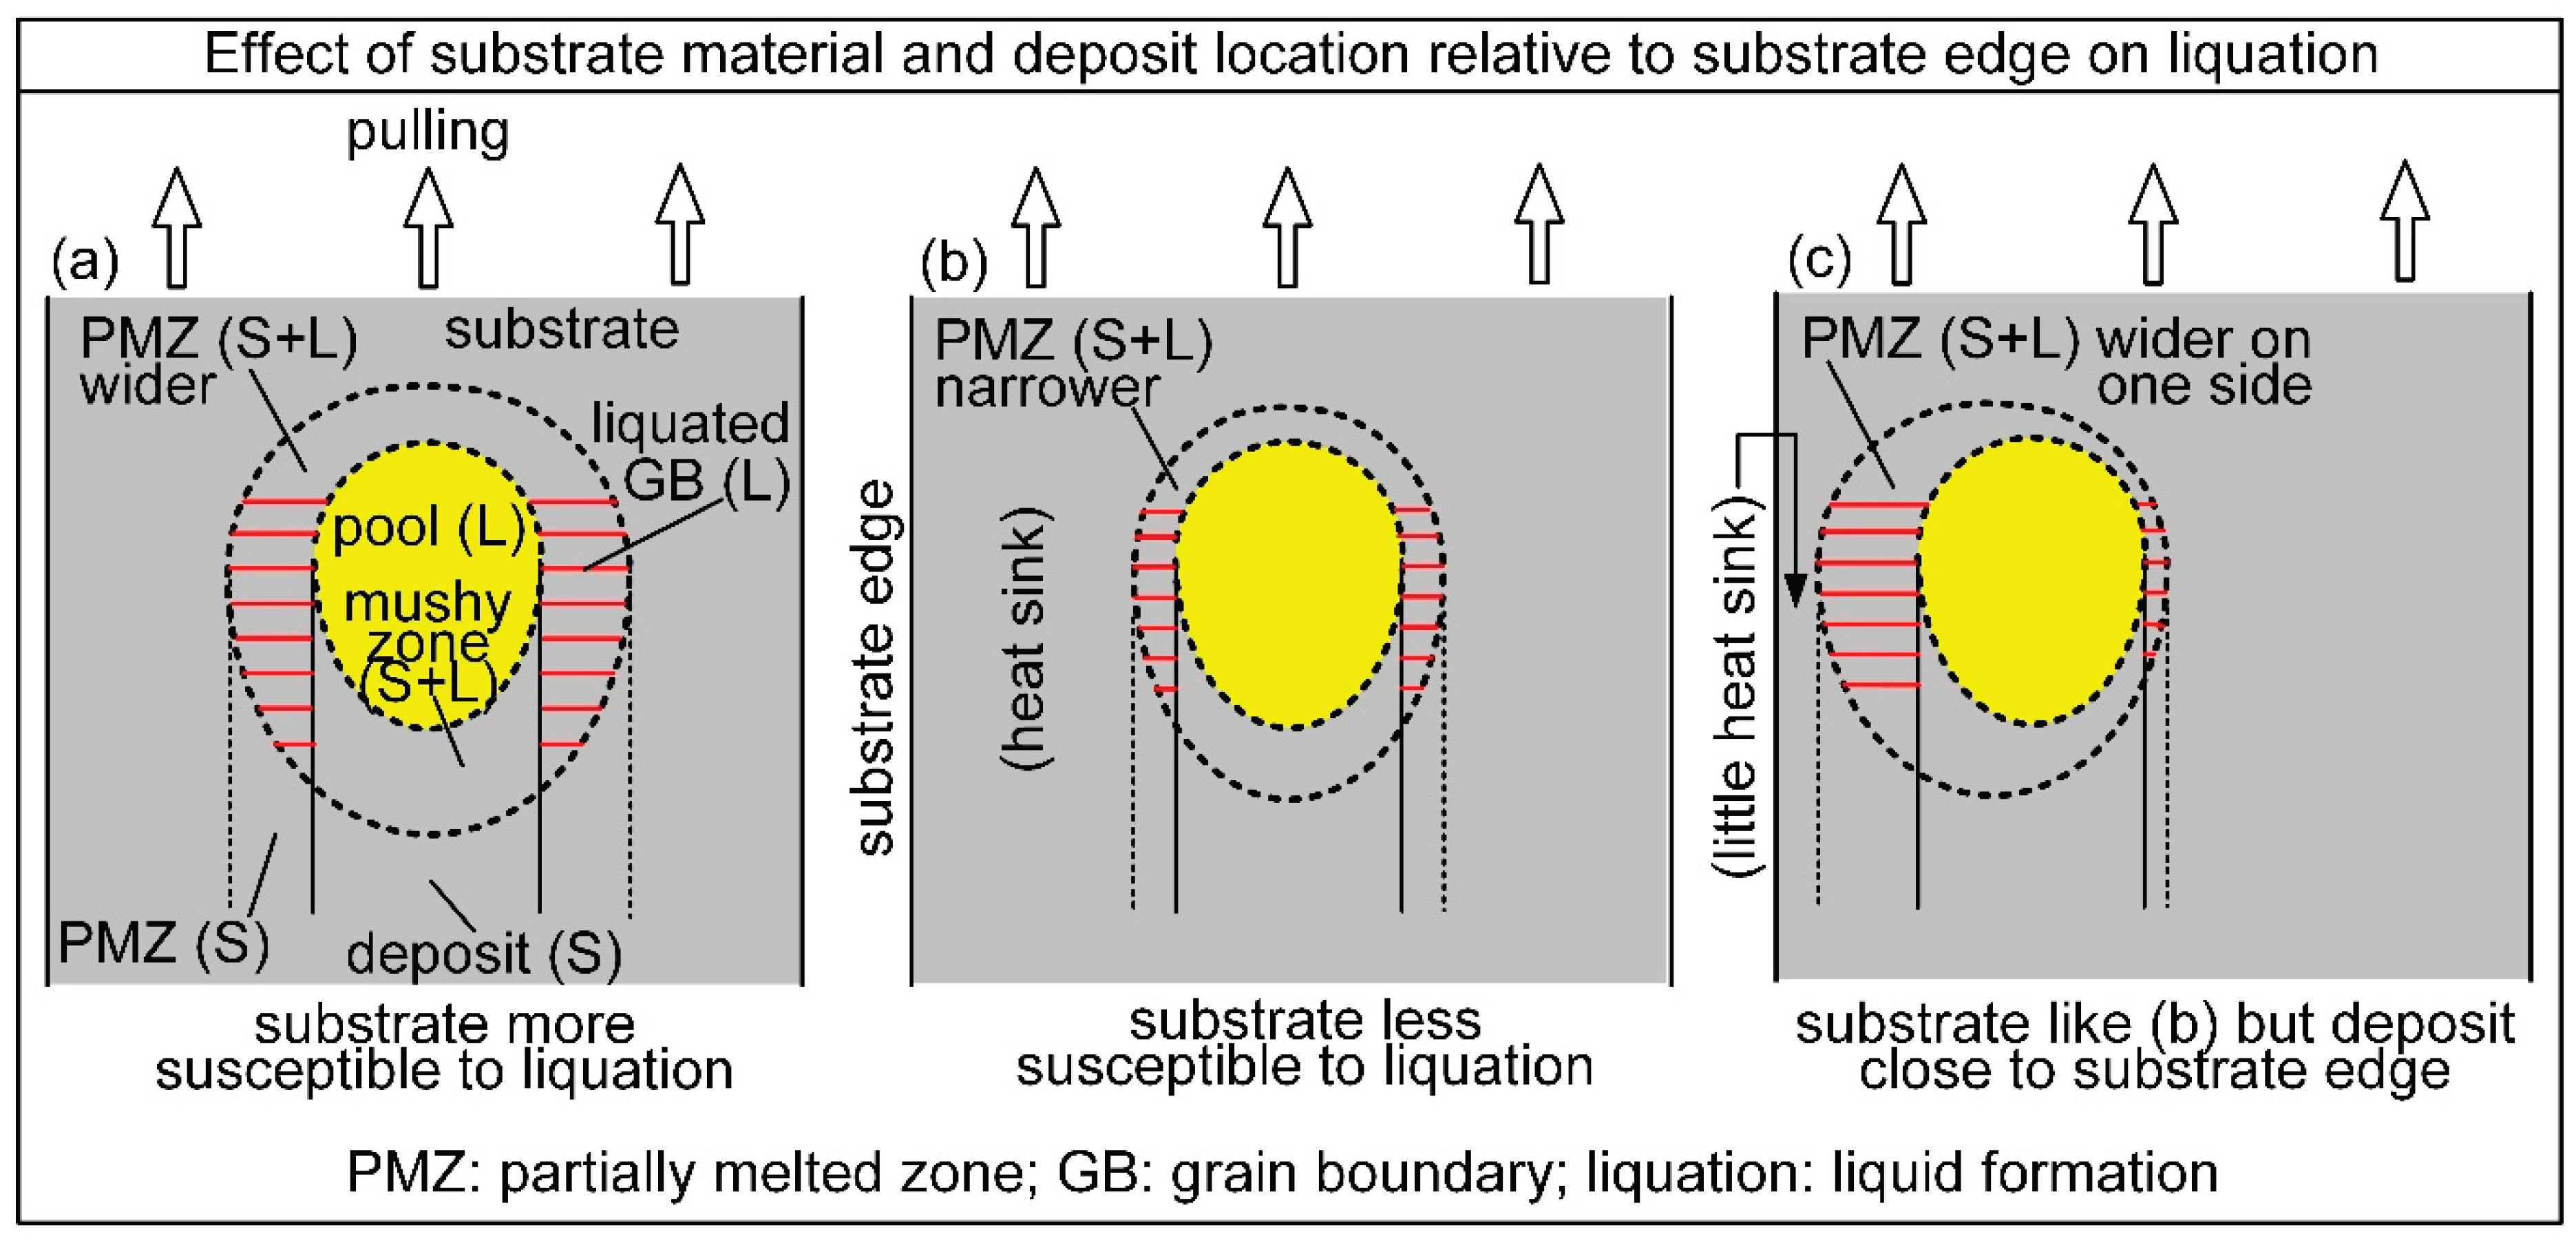
Figure 18.
Curves of temperature vs. fraction of solid for 6061 Al and 7075 Al.
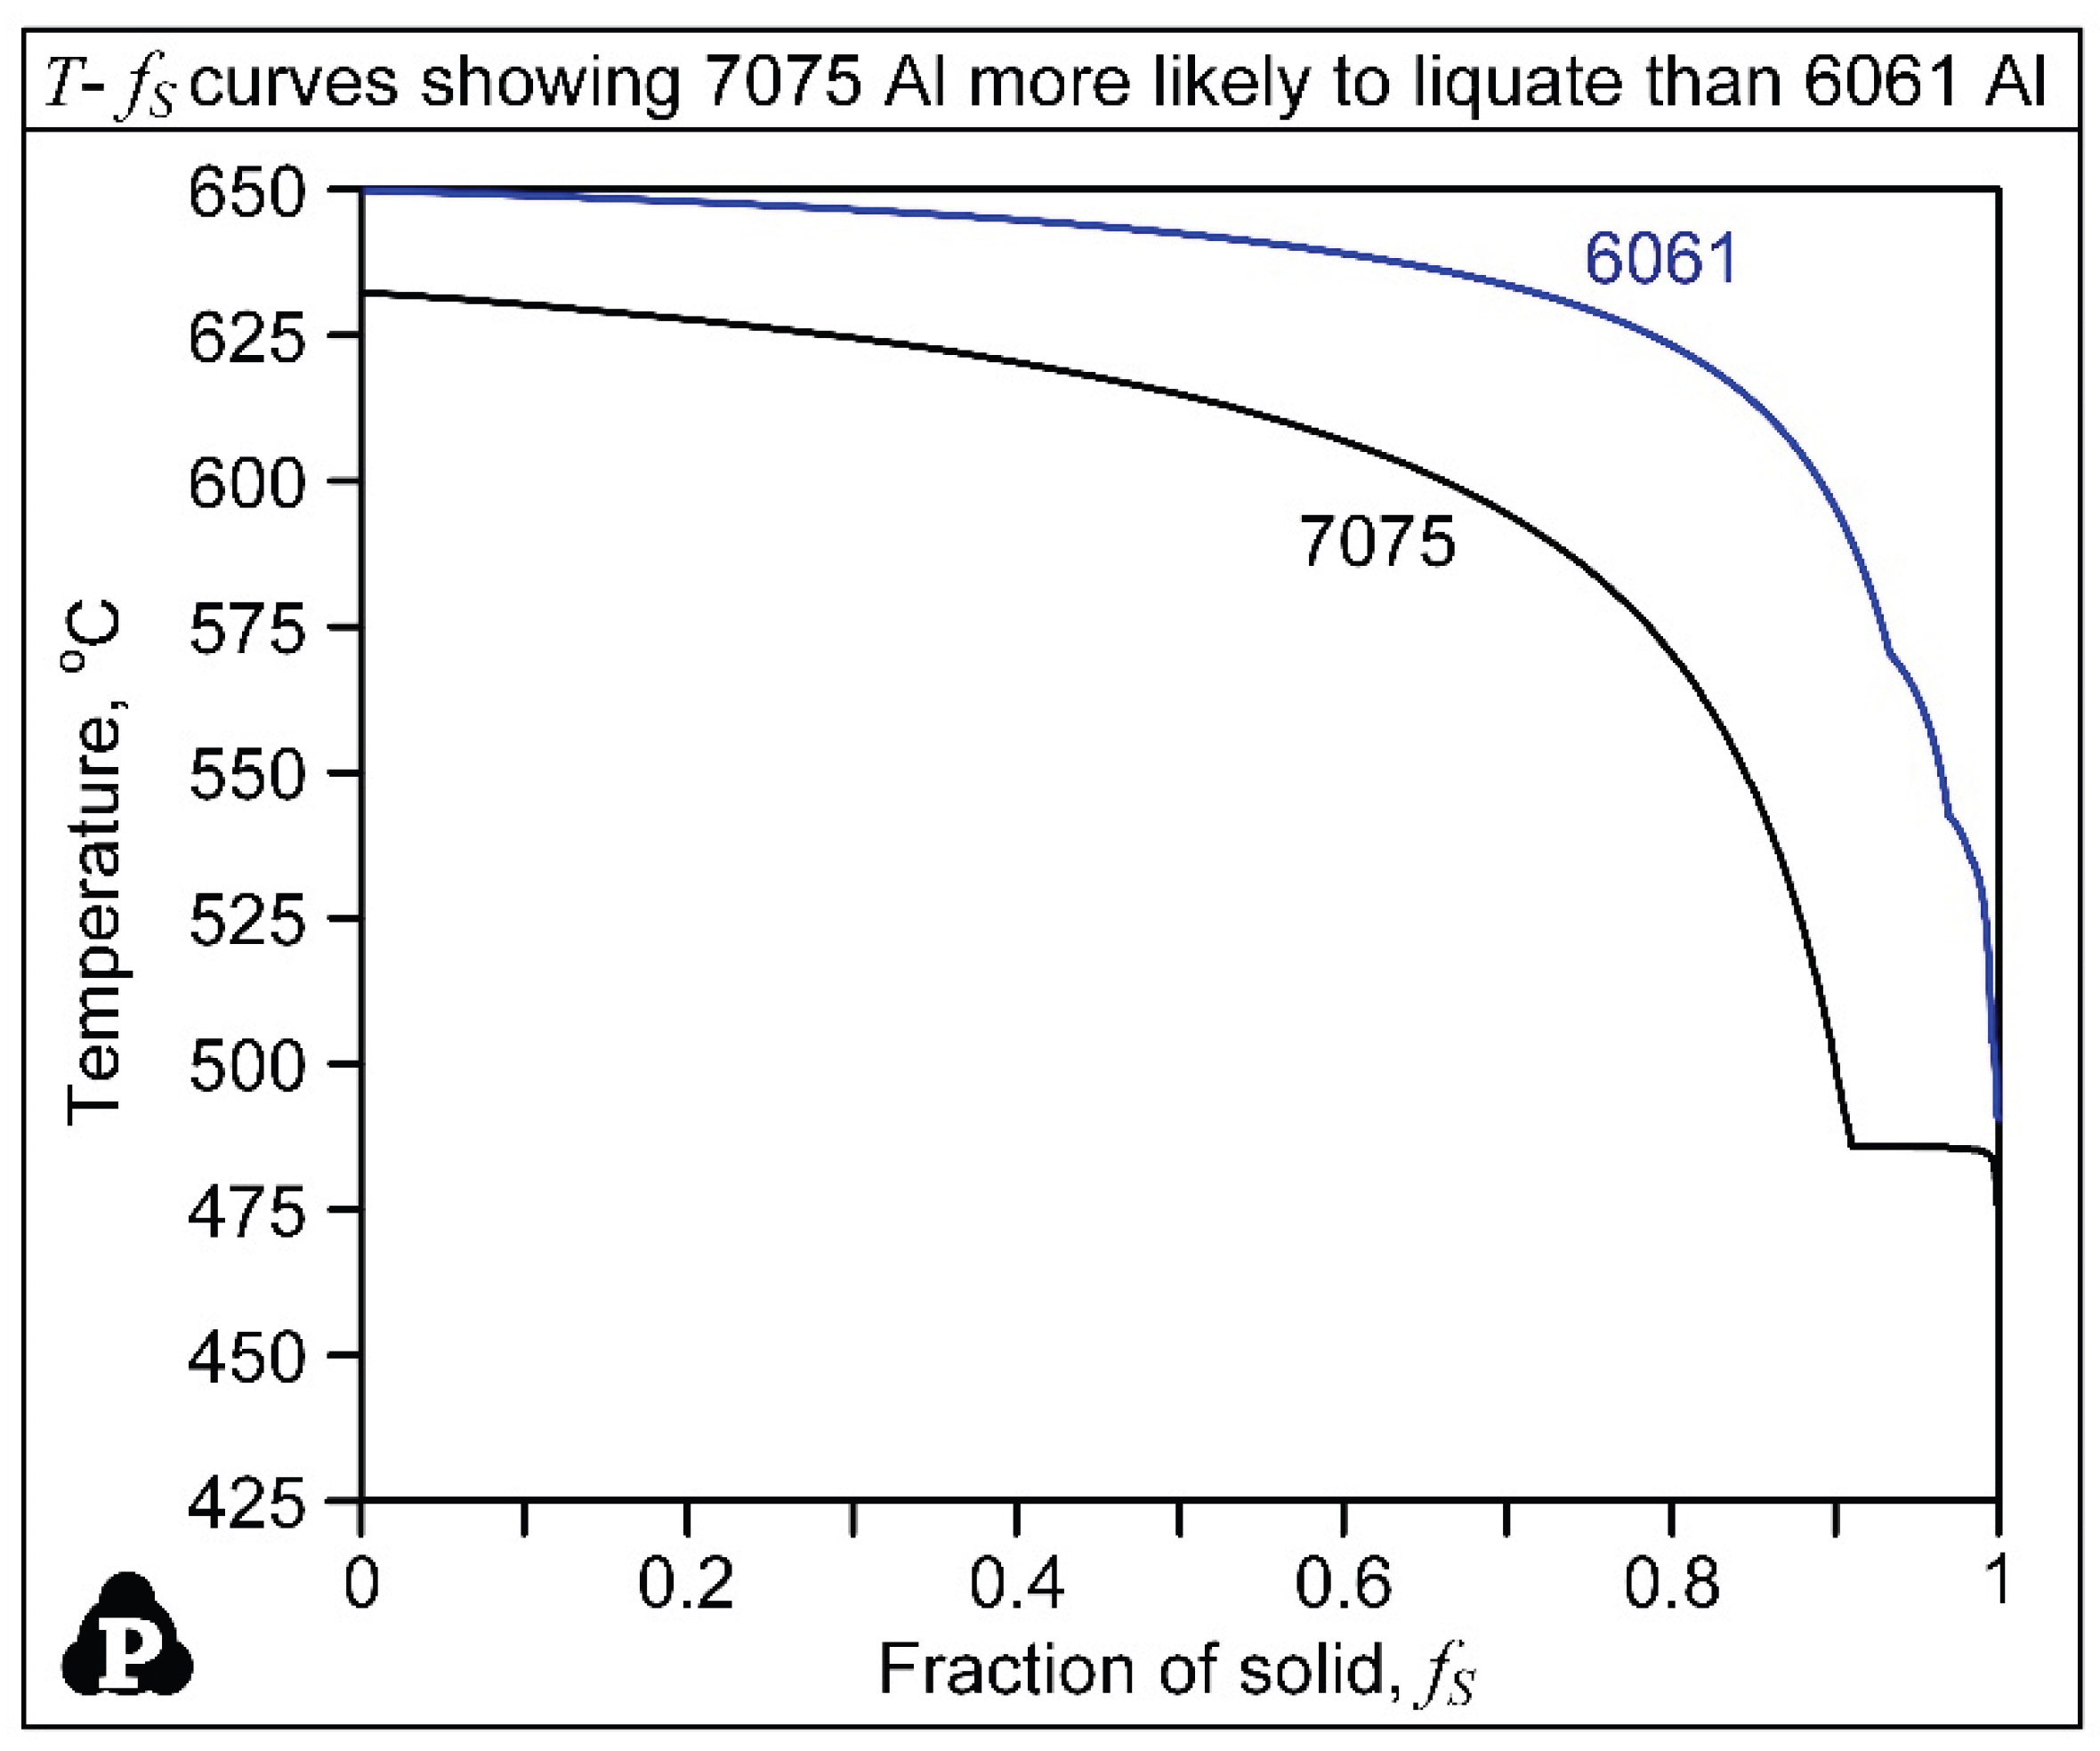

Table 1.
Compositions of Al-6061 and Al-7075 specimens.
| Wt% | Cr | Cu | Fe | Mg | Mn | Si | Ti | Zn | Al |
| 6061 | 0.20 | 0.33 | 0.6 | 1.0 | 0.08 | 0.72 | 0.02 | 0.1 | balance |
| 7075 | 0.19 | 1.5 | 0.17 | 2.4 | 0.03 | 0.07 | 0.03 | 5.7 | balance |
Table 2.
Deposition parameters, solidification cracking (SC) and liquation cracking (LC)*.
| Specimen | Laser power (W) | Travel velocity, Vbase (mm/s) | Acceleration, a (mm/s2) | Total deposit length (mm) | Deposit length at 1st SC, L1st (mm) | Critical pulling speed Vcr for SC (mm/s) | Deposit length at 1st LC, L1st (mm) | Critical pulling speed Vcr for LC (mm/s) |
| 6061-P2 | 350 | 7.5 | 0.020 | 175 | ||||
| 6061-P3 | 400 | 7.5 | 0.020 | 223 | ||||
| 6061-P5 | 350 | 6.5 | 0.050 | 199 | 82 - 93 | 0.67± 0.04 | ||
| 6061-P7 | 400 | 6.5 | 0.050 | 197 | 82 | 0.63 | ||
| 6061-P9 | 400 | 7.0 | 0.050 | 154 | 91 - 97 | 0.67± 0.02 | ||
| 7075-P3 | 400 | 6.0 | 0.010 | 114 | ||||
| 7075-P4 | 400 | 6.0 | 0.025 | 89 | 77 | 0.32 | ||
| 7075-P6 | 350 | 6.0 | 0.030 | 121 | 86 | 0.43 |
*Powder feed rate: 6.8 g/min (10 rpm).
Disclaimer/Publisher’s Note: The statements, opinions and data contained in all publications are solely those of the individual author(s) and contributor(s) and not of MDPI and/or the editor(s). MDPI and/or the editor(s) disclaim responsibility for any injury to people or property resulting from any ideas, methods, instructions or products referred to in the content. |
© 2025 by the authors. Licensee MDPI, Basel, Switzerland. This article is an open access article distributed under the terms and conditions of the Creative Commons Attribution (CC BY) license (http://creativecommons.org/licenses/by/4.0/).
Copyright: This open access article is published under a Creative Commons CC BY 4.0 license, which permit the free download, distribution, and reuse, provided that the author and preprint are cited in any reuse.


