Submitted:
03 September 2025
Posted:
04 September 2025
You are already at the latest version
Abstract
Cancer therapeutics development has been a challenge in medical and scientific areas by their toxicity, biocompatibility and unfortunate side effects on the human body. However, despite advances in early detection and the study of novel treatments, the mortality rate for breast cancer remains high, making it a significant global health concern. Thus, there is still a need for more effective and targeted therapies, where nanotechnology emerges as a promising solution in this field. For this reason, four series of core–shell for breast cancer remains poly(methyl methacrylate, MMA) nanoparticles functionalized with acrylic acid (AA), fumaramide (FA) and curcumin (CUR) as chelating agents were synthesized by emulsion polymerization techniques. Comprehensive physiochemical characterization studies based on gravimetry, dynamic light scattering (DLS), electrophoresis, Fourier transform infrared (FT-IR), ultraviolet-visible (UV-Vis) and photoluminescence (PL) spectroscopy, X-ray diffraction (XRD) and scanning electron microscopy (SEM) were made to analyze their pH-dependence. The calorimetric thermodynamic properties of interaction between the particles and calcium chloride (CaCl2) or magnesium chloride (MgCl2) solutions were evaluated by isothermal titration calorimetry (ITC). Among the most relevant results were that nanoparticles showed a strong pH-dependence by underwent structural changes when they interacted with calcium (Ca2+) and magnesium (Mg2+) ions. Furthermore, the interaction parameters such as intermolecular forces, binding constant (Kb), interaction enthalpies (H), and Gibbs free energy (G) confirmed a strong coordination bond between the functional groups and the metal ions. According to obtained results, nanoparticles could have the ability to chelate ions available in the medium, suggesting their potential use in improving drug delivery systems (DDS) for breast cancer therapies.
Keywords:
emulsion polymerization
; polymeric nanoparticles
; chelating agents
; drug delivery systems (DDS)
; breast cancer (BC)
1. Introduction
Cancer is a health issue caused by abnormal cells growing and multiplying uncontrolled in organs or tissue of the human body [1,2]. Currently, this disease is considered the world second leading cause of death, according to data reported by the World Health Organization, with an estimated of 10 million deaths annually, predominantly affecting women [3]. The most common cancer types affecting the global population are breast, lung, and colon cancer [4,5]. Most breast cancer (BC) cases originate in the connective tissue ducts (ductal carcinoma in situ, DCIS) or lobules, (lobular carcinoma in situ, LCIS) and can be classified in four main subtypes: hormonal (luminal A or B), human epidermal growth factor receptor (HER2-positive) and triple-negative breast cancer (TNBC); each one with different standard treatments [4,5,6,7,8]. Tamoxifen, trastuzumab, taxane-based chemotherapy, radiotherapy and mastectomy are the primary conventional therapies [4,5,6,7,8,9,10,11]. However, these treatments have adverse health effects including hot flushes, sweating, cardiac issues, neutropenia, diarrhea, fatigue, anemia, thrombosis and problems with drug distribution specificity [7,12,13,14,15]. For this reason, advances in nanoscience, biotechnology, medicine, chemistry and immunotherapy have led to novel complementary and alternative therapies with promising benefits against breast cancer. For instance, repurposing drugs, metronomic chemotherapy, antibody conjugation systems, targeting BC stem cells, micelles, liposomes, particles and other nanostructures have been used as drug delivery systems and for breast cancer detection (diagnosis) [10,16,17,18].
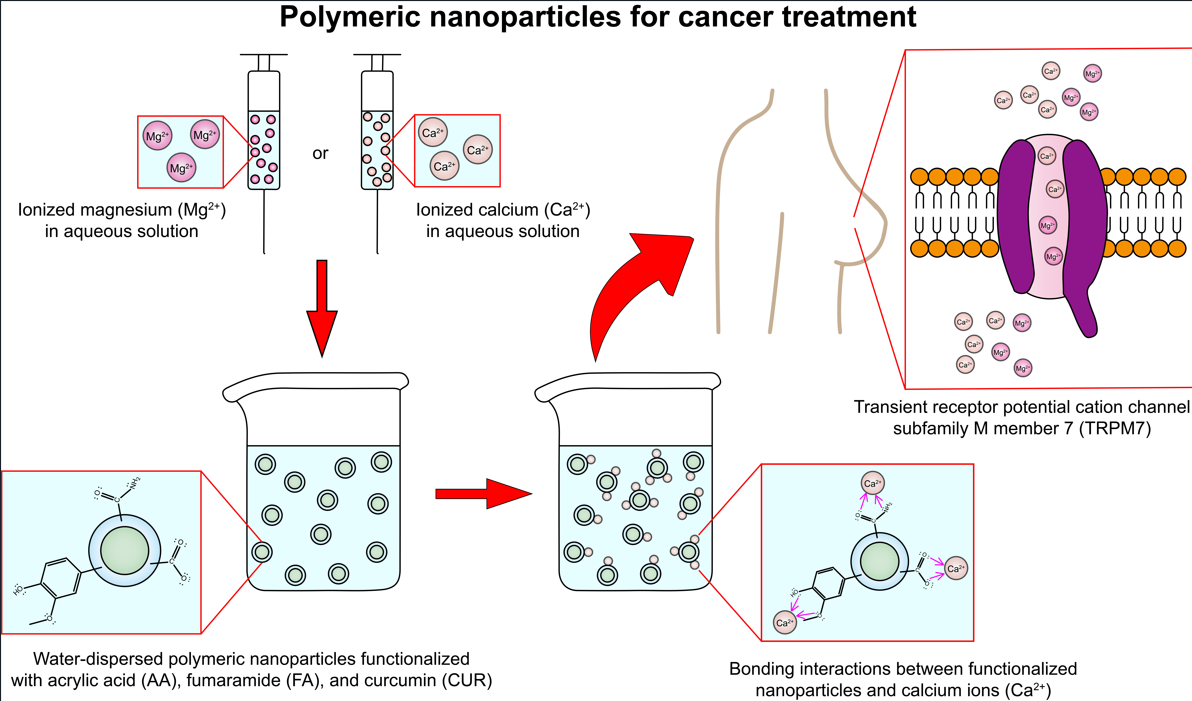
Especially, nanoparticles have garnered significant interest in the scientific community by their physicochemical properties such as molar mass, chemical reactivity, specific surface area, size, shape, stability, morphology, elasticity, ductility, compatibility, solubility, hydrophilicity, durability and biodegradability, making them suitable for developing new therapeutic interventions [19,20,21,22,23,24,25]. Thus, polymeric nanoparticles ranging in size from 1 nm to 1000 nm have emerged as release systems to solve difficulties in delivery drugs to tumor cells and reduce the risk of adverse effects on healthy cells. Previous studies have shown that the optimal nanoparticle size is around 100 nm, as they can access regions inside the human body where traditional medical substances are limited [26]. This approach enables the design of the chemical structure, sensitivity, solubility in water and the amount of drug release using functional groups in the particles from the synthesis [26,27]. This means attaching to the surface area some chemical functional segments such as phosphonic (–PO(OH)2), thiol (–SH), carboxylic (–COOH), amine (–NH2) or amide (–CONH2) groups, useful for binding several molecules and/or metal ions to form complex structures (chelates) through the coordination of atoms such as nitrogen (N), oxygen (O) and sulfur (S), which possess a pair of free electrons in their structure [27,28,29,30]. In particular, chelating functionalized polymer nanoparticles are organic molecules with two or more electron donor groups that bind coordinately to polyvalent metal ions through the interaction of atoms in their chemical structure [31]. If the functional groups consist of an electron-donating species or can form a resonant structure, the interactions can be stabilized further with (sigma) σ– and/or (pi) π–bond donation [32]. This is attributed to they have differing coordination strengths such as electronegativity, electron distribution and the number of coordination sites. Hence, acrylic acid is one of the most used monomers to the functionalization of nanoparticles by its ability to form chelate complexes between the carboxylic group and divalent metal ions; for example, copper (Cu2+), cadmium (Cd2+), lead (Pb2+), zinc (Zn2+), nickel (Ni2+), cobalt (Co2+), calcium (Ca2+) and magnesium (Mg2+) [33,34]. Fumaramide also leads to the generation of hydrogen bonds by its conformational chemical structure and affinity towards metal ions and finally, curcumin has been widely researched because of its antibacterial, metabolic, detoxification, antioxidant, anti-inflammatory and anticancer properties and the formation of intermolecular bonds with ions of iron (Fe), mercury (Hg), and selenium (Se) [35,36,37]. Specifically, calcium (Ca2+) and magnesium (Mg2+) ions are the most abundant cations in the human body. They control a diverse and wide range of cellular processes such as cell cycle, gene transcription, DNA replication, energy metabolism, protein synthesis, bone mineralization, the cytoskeleton activation and besides, function as antioxidant agents and even as an immune response in therapeutic treatments for certain illnesses [38,39,40]. Thereby, calcium and magnesium have equally important roles in regulating cell growth, where magnesium is considered the natural calcium antagonist [40]. Several studies have provided evidence that alterations in Ca:Mg ratio suggest frequently dysregulated cell functions, increasing the risk factor in the development of cancer [40]. Both divalent cations are correlated through the TRPM7 protein (Transient Receptor Potential Melastatin 7). These gene functions as flow channel for the transport of calcium and magnesium ions within cell, regulating the permeation of these species during the cellular mechanisms [8,40,41]. On the other hand, adenosine-5′-triphosphate (ATP) is a synthesized biological molecule in the mitochondrial membrane of cells required for the cellular energy exchange of all living beings [8,40,42]. In most cases, ATP is coordinated to a divalent cation of Ca2+ or Mg2+, which interacts with the negative charges of the phosphate groups located in them the chemical structure. That is, at high concentrations of calcium or magnesium ions, greater amounts of ATP are required [42]. This fundamental nucleotide carries out essential functions such as chromosome maintenance, macromolecular transport, cell motility, muscle contraction, nerve impulse propagation and the synthesis of DNA and RNA. Therefore, variations in the Ca:Mg ratio also influence mitochondrial performance and the normal cellular growth [42]. From this approach, TRPM7 protein and ATP regulate the proportions of calcium (Ca2+) and magnesium (Mg2+) ions used in the different cellular processes mentioned earlier. Hence, if calcium level rises (high Ca-ATP), serum magnesium content (lower Mg-ATP levels) is significantly impaired and reduced [8,40,43]. This indicates that calcium inhibits magnesium transport, with one ion regulating the other. This means, high intracellular calcium can indeed affect magnesium influx into cells [7,40]. Notably, calcium is involved in cell replication, and elevated calcium levels can enhance cell multiplication. This can promote the abnormal growth of cancer cells, suggesting a potential relationship between calcium dysregulation, cancer development and the overcoming the anti-cancer effects of drugs [7,40]. That is, the balance between both species have a significant role in breast cancer prevention and/or in the continued growth of cancer cells [40,44]. For this reason, polymeric nanoparticles could be employed to regulate calcium and magnesium ions in the TRPM7 channel and the supply of ATP to combat growth, invasion and metastasis of breast cancer cells. Treatments and diagnostic approaches with the use of polymeric nanomaterials are expected to have important benefits for medicine in the future, but the use of functionalized nanomaterials also presents significant challenges, particularly regarding impacts on human health and the environment. In this study, it is reported the synthesis, characterization and functionalization of four series of polymer-based nanoparticles with surface-anchored functional groups and a core-shell morphology synthetized via emulsion polymerization. The ratios of chelating agents such as acrylic acid (AA), curcumin (CUR), and fumaramide (FA) were changed. The functional properties and the interaction effects of calcium (Ca2+) and magnesium (Mg2+) ions with the anchored functional groups on the particle surface were analyzed.
This research aims to advance the development of an original polymeric material for breast cancer treatment, with potential applications in drug delivery systems (DDS). These innovations could have the ability to enhance the physicochemical behavior, release efficiency, efficacy, safety, and biocompatibility of the novel delivery technologies in the fields of nanoscience and biomedicine for breast cancer therapy.
2. Materials and Methods
2.1. Materials
The used specifications of chemicals in this research are listed in Table 1. The reagents were used as received, without further purification. The distilled water was double deionized using a Barnstead Micropure water purification system (Thermo Fisher Scientific Inc., Niederelbert, Germany).
2.2. Synthesis of Functionalized Polymeric Nanoparticles
Core–shell polymeric nanoparticles were synthesized via emulsion polymerization techniques in a semicontinuous process in two stages. All polymers were prepared with a total solids content of 5 wt.%, and 1 wt.%, 3 wt.% and 5 wt.% of functional groups on the surface of particles. The recipe of synthesized particles is presented in Table 2, as example. The polymerization procedure is schematized in Figure 1. In the first stage, a mixture of surfactant (Abex® EP 120, 0.5 wt.%), initiator (sodium persulfate, 2 wt.%) and deionized water was prepared in a flask and then transferred to a 250 mL glass reactor equipped with an external jacket heating system connected to a thermal bath (PolyScience, Illinois, USA) with a nitrogen (N2) flow. The emulsion was stirred (180 rpm) using a mechanical stirrer (Heidolph, Schwabach, Germany) until full homogenization at 75 ± 0.1 °C. Once the system temperature was reached, the content of Tank 1 was added to the reactor at 0.3 g min-1 using a piston pump (Ismatec® MCP, Wertheim, Germany). In the second stage, a combination of chelating agents of acrylic acid (AA), fumaramide (FA), and curcumin (CUR) were added as follow: (a) AA:FA, (b) AA:CUR, (c) FA:CUR and (d) AA:FA:CUR as shown in Figure 2. Different feed proportions of functional groups or chelating agents (1 wt.%, 3 wt.%, and 5 wt.%) were added to cover the core, according to Table 2 (Tank 2). The second stage was carried out under similar operating conditions that the first stage.
2.3. Characterization Techniques
Functionalized polymer nanoparticles with varying ratios of chelating agents were characterized to evaluate their chemical structure, composition, physicochemical properties, and interaction mechanisms before and after to be submitted a titration process with divalent metal ions.
2.3.1. Gravimetry
The total solid contentof the polymer materials was determined using gravimetric analysis [29]. Five samples were taken from the stock solutions and placed in separate aluminum containers with increments of 0.1 g, ranging from 0.1 g to 0.5 g. The polymeric dispersions were then weighed in an analytical balance (Ohaus Pioneer PA214, New Jersey, USA) to determine the mass of latex. Subsequently, the polymers were dried in a heating oven (Memmert, Schwabach, Germany) at 60.0 ± 0.1 ºC during 12 h to remove water. After drying, the materials were weighed again to obtain the mass of the dry polymer Finally, the percentage of solids (%) in the polymeric systems was calculated using the following equation (1) [45]:
2.3.2. Dynamic Light Scattering (DLS) and Electrophoresis
The particle size distribution and zeta potential (ζ) of the polymer nanoparticles were measured using dynamic light scattering (DLS) and electrophoretic techniques, respectively. Measurements were conducted on a Zetasizer Nano ZSP (Malvern Instruments Ltd., Malvern, UK) equipped with a red laser (λ = 632.8 nm) and a 90° light scattering detector. Before analysis, 0.5 g of each latex was diluted with 15 mL of deionized water to achieve a 1:500 polymer-to-water ratio. A sample was placed in a folded capillary cell (DTS1070). Quadruplicate measurements were performed at 25.0 ± 0.1 °C, to obtain the particle size distribution, zeta potential (ζ) and pH changes during the interaction between the chelating agents and metal ions. For that, the latex was titrated with calcium chloride (CaCl2) and magnesium chloride (MgCl2) solutions using a MPT II multi-purpose autotitrator (Malvern Instruments Ltd., Malvern, UK). For this, 0.1 g aliquots of each sample were diluted in 10 mL of deionized water, and the assays were set up over a concentration range of 0.55 mM to 3.15 mM at 25 °C. The collected data were then evaluated to determine stability and calculate the average particle diameters [45,46]. To ensure accuracy and reliability of data, the measurements were performed by triplicate, following the manufacturer protocol [47].
2.3.3. Fourier Transform Infrared Spectroscopy (FT-IR)
FT-IR spectra of polymers were recorded by a Frontier spectrometer (Perkin-Elmer Inc., Massachusetts, USA) in ATR mode from 4000 to 400 cm–1 with a resolution of 4 cm–1. All measurements were performed without diluting the sample at 25 °C.
2.3.4. Ultraviolet–Visible Spectroscopy (UV-Vis)
Absorption spectra of all synthesized materials were collected in the 200 – 1100 wavelength range using an UV-Vis spectrophotometer (Perkin-Elmer Inc., Massachusetts, USA) at λ = 25 nm. Before starting the analysis, 0.1 mL of the polymeric dispersion was diluted with deionized water up to 100 ppm (1:100 ratio) at room temperature.
2.3.5. Scanning Electron Microscopy (SEM)
The morphology and structure of polymeric particles were observed using a field scanning electron microscope (JSM-7800F, JEOL, Tokyo, Japan) operating under high vacuum at an accelerating voltage of approximately 5 kV, a working distance (WD) of 6 mm, and a secondary electron beam. For analysis, the polymer material was prepared by diluting the latex with deionized water at a 1:100 ratio. A drop of the diluted dispersion was placed and dried onto the surface of a standard cylindrical copper specimen holder. After a thin gold coating was deposited on the sample. Micrographs of non-titrated and titrated polymer particles were obtained using magnifications ranging from 10,000x to 50,000x.
2.3.6. Photoluminescence Spectroscopy (PL)
Photoluminescence (PL) spectra of polymers were recorded at room temperature using a spectrofluorometer FS5 (Edinburgh Instruments, Livingston, United Kingdom) in an indirect configuration. The samples were prepared by diluting 0.1 mL of latex in deionized water to obtain a final concentration of 100 ppm (1:100 ratio). The polymeric dispersions were analyzed in a wavelength (λ) range from 240 nm to 750 nm by varying the excitation wavelength (λexc) of 397 nm, 510 nm, 507 nm, and 511 nm for Poly(AA:FA), Poly(FA:CUR), Poly(AA:FA:CUR), and Poly(AA:FA:CUR)-Ca2+, and Poly(AA:FA:CUR)-Mg2+ systems, respectively. The emission wavelengths (λem) were also determined.
2.3.7. X-Ray Diffraction (XRD)
X-ray diffraction (XRD) analyses of the titrated polymer materials were performed by a MiniFlex 600 diffractometer (Rigaku, Tokyo, Japan) with a copper X-ray tube (wavelength, λCu = 1.5406 Å, 600 W, 40 mA, and 40 kV). The diffraction patterns were recorded over an angular range (2θ) from 2° to 80°. To prepare the samples for XRD analysis, 10 mL of each latex was placed in a crystallizer and dried in a heating oven at 60 °C. The resulting samples were used in powder form.
2.3.8. Isothermal Titration Calorimetry (ITC)
Calorimetry experiments were conducted using a MicroCal PEAQ-ITC automated calorimeter (Malvern Instruments Ltd., Malvern, UK). Polymeric solutions were prepared by diluting latex particles in deionized water at 2 mM concentration. Calcium chloride (CaCl2) and magnesium chloride (MgCl2) solutions were prepared in deionized water at 100 mM, maintaining a molar ratio of 1:10 of functional groups and the electrolyte. For each titration experiment, the polymeric material was put in the cell (200 µL), while the syringe (40 µL) was loaded with the electrolyte solution. The experiments were made by establishing 39 injections of 1 µL at 750 rpm, and a response time of 10 seconds at 25.00000 ± 0.00012 ºC.
3. Results and Discussion
3.1. Synthesis and the Total Solid Content of Polymeric Nanoparticles with Different Ratios of Chelatings Agents
The synthesis of particles was made in two stages (Figure 3), where in the first stage, a core of poly(methyl methacrylate) was prepared as shown in Figure 3 (a), while the second stage, a shell with functional groups was formed as seen in Figure 3 (b). In this way, four series of methyl methacrylate (MMA)-based polymeric particles functionalized with different proportions of acrylic acid (AA), fumaramide (FA), and curcumin (CUR) as functional agents were carried out by emulsion polymerization.
The total solid contentof latex was determined using gravimetric techniques and the results are shown in Table 3. It is observed that the obtained latex had average values of 4.28 ± 0.00046 wt.% for all ratios of chelating agents, except for those materials of Poly(AA:CUR) and Poly(FA:CUR) that had average solids values close to 3.48 ± 0.000187 wt.%. This is attributed to low solubility of curcumin. This contributes to a decrease in the polymerization rate and a low monomer–to–polymer conversion efficiency, thus reducing the solids content in the polymer [48]. On the contrary, those materials with a low content of curcumin or monomers with greater affinity to water (hydrophilicity) such as acrylic acid (AA) and fumaramide (FA), promote high performance in the polymerization process and therefore a higher solids content.
3.2. Dynamic Light Scattering (DLS) and Zeta Potential (ζ) of Polymeric Nanoparticles with Different Ratios of Chelatings Agents
The dynamic light scattering and electrophoretic mobility methods were used to determine the distribution of particle size and zeta potential (ζ) of polymers at 25 ºC. The average particle diametersand polydispersity index (PDI) values were calculated and summarized in Table 4. The results show that the particle sizes are over the range 101.2 ± 0.522 </nm < 151.8 ± 1.80. In general, these variations in are due to the synthesis process, the formulation, concentration and physico-chemical properties of chelating agents on the particles. For this, there is a wide range of particle size for each series. In particular, Poly(AA:FA) particles with a 5 wt.% of functional groups have an average size of 121.1 ± 1.82 nm, larger than those with 1 wt.% and 3 wt.% of functional groups. This is because, the carboxylic (–COOH) and amide (–CONH2) are highly soluble in water and therefore, promote dissolution, polymerization and anchoring of these functional groups to the shell. This means, as the number of hydrophilic groups inside the polymer is higher, bigger particles are obtained. In contrast, as the proportion of hydrophobic segments rises, particle sizes decrease [49,50]. The biggest particle sizes were observed for polymeric systems Poly(AA:CUR) and Poly(FA:CUR) with 1 wt.% of chelating agents, while polymers with 3 wt.% and 5 wt.% of functional groups had a smaller average size. This behavior is explained by the hydrophobic character and low solubility of curcumin (CUR). However, the presence of carboxylic and amide groups contributes to obtain bigger particles. This corroborates the results obtained by gravimetry, where the materials with high concentrations of curcumin (3 wt.% and 5 wt. %) showed the lowest solids content (Table 3). Finally, particles of Poly(AA:FA:CUR) present slight changes in the average particle diameter, caused by the balance generated between hydrophilic and hydrophobic properties of the chelating agents. In addition, these particles showed a polydispersity index (PDI) of 1.113 ± 0.004. It indicates a narrow and homogeneous size distribution attributed to the polymerization process and concentration of chelating groups utilized [51].
Zeta potential (ζ) is a physical parameter to evaluate the stability of colloidal dispersions that measures the difference between a particle electrokinetic potential and dispersion medium. This parameter is commonly used to improve and optimize the formulations of emulsions, suspensions, films, coatings, paints and, predicts particle surface interactions [52]. Nanoparticles with a zeta potential between −10 mV and +10 mV are considered neutral or unstable since the attraction strengths becomes greater than repulsion forces, which leads to the disrupt of the dispersion, while those particles with values greater than +30 mV or less than −30 mV are more stables promoting strong electrostatic repulsions and thus prevent aggregation, flocculation and/or precipitation [52]. In addition, some factors such as pH, temperature, concentration, morphology, changes in surface charge during synthesis and conductivity of the dispersing medium affect the interparticle interactions [53]. The zeta potential measurements of the obtained polymers revealed values ranging from –27.0 ± 0.224 mV up to –43.8 ± 0.296 mV, indicating a negative surface charge on the particles (Table 5). This behavior results in high colloidal stability because to the strong electrostatic repulsions between particles. Initially, negative ζ values are attributed to the ionization process of acid groups anchored on the particle surface. In an aqueous medium, carboxyl groups (–COOH) corresponding to acrylic acid (AA) are partially ionized to the carboxylate anion (COO–) attributed to the resonance effect by the π–electron of oxygen atom shifting, so hydrogen protons (H+) get ionized easily. [46,53,54] This phenomenon generates negative repulsive forces among particles leading to a decrement of zeta potential (ζ) and therefore, an increment in the materials stability. Otherwise, the amide (–CONH2) and phenolic (Ar-OH) groups from fumaramide (FA) and curcumin (CUR), respectively are in a non-ionized state, because the –OH groups (from CUR) and –NH2 groups (from FA) are not sufficiently acidic to undergo protonation [46,54]. This suggests that basic functional groups do not have a significant impact on ζ response. Additionally, the anionic surfactant used as stabilizer during polymerization also contributes to the negative surface charge of the particles.
3.3. Interaction of Polymeric Nanoparticles with Different Ratios of Chelatings Agents and Calcium (Ca2+) and Magnesium (Mg2+) Ions
3.3.1. Zeta Potential (ζ) of Polymeric Nanoparticles with Different Ratios of Chelatings Agents
The interaction of copolymers with electrolytes was measured by means of zeta potential (ζ). The latex samples were titrated with calcium chloride (CaCl2) and magnesium chloride (MgCl2) solutions The results of ζ values as afunction of electrolite concentrations to the materials of Poly (AA:FA) with 1 wt.%, 3 wt.% and 5 wt.% of functional groups are shown in Figure 4, as example, because all materials had the same behaviour. In general way, all curves present a decrement of colloidal stability over the range –48.1 ± 0.832 < ζ /mV < –23.1 ± 0.953 for Poly(AA:FA), while for other materials, the zeta potential values are between –53.6 ± 3.15 < ζ /mV < –22.8 ± 0.702. This is attributed to the interaction of cationic species (Ca2+ or Mg2+) of electrolyte solutions with the negatively ionized carboxylate groups (COO–) from AA, leading to the adsorption of cations on the surface of particles [55]. This is a result of increasing attractive forces between particles by the screen effect of cations and the stretching of molecular chains, for this reason ζ is increased [53]. This caused that the polymeric structural conformation changed abruptly, when the cations divalent were attracted by anions of particles. Finally, after the amount of salt ions was high enough, zeta potential (ζ) values of samples were constant caused by the saturation of the negatively charges of active centers.
In addition, the polymers stability also depends on the pH of dispersion medium and the acid dissociation constant (Ka) related to the degree of ionization of functional groups in the polymeric chains. The values of pH of polymeric particles before and after of electrolyte interaction are shown in Table 6. The values of average initial and final pH for the functional polymeric particles are close to 2.59 ± 0.09 and 4.0 ± 0.33, respectively. This pH increment for polymeric systems is attributed to the formed products by the complete dissociation of the electrolyte when interacting with water molecules. For example, acrylic acid (AA) typically has a pKa of 4.1 [56], however after of titration process, the pH of medium remains below of this value (pH < pKa), meaning that the carboxylic groups (–COOH) are in a protonated state, avoiding drastic changes in the pH of the solution. Thereby, non-covalent bonds between polymeric chains predominate and repulsion forces are weak. This behavior is also confirmed by the increment of zeta potential (ζ). On the other hand, fumaramide has a pKa close to 14.1, while curcumin shows a broad range of pKa between 8–10 [54,57]. Below these values, they show a stable non-ionized structure and do not contribute to modifying the pH of the environment. Accordingly, zeta potential (ζ) and stability of polymeric nanoparticles are parameters clearly dependent on the concentration of ionizable acid groups and ionic strength of salts [23,53].
3.3.2. Fourier Transform Infrared (FT-IR) and Ultraviolet–Visible (UV-VIS) Spectra of Polymeric Nanoparticles with Different Ratios of Chelatings Agents
The presence of functional groups from methyl methacrylate (MMA), acrylic acid (AA) fumaramide (FA) and curcumin (CUR) in the particles were analyzed by Fourier transform infrared spectroscopy (FT-IR).
The spectra of the copolymers with 5 wt.% of functional groups before the titration process are shown in Figure 5, as example. In general, diverse absorption bands of chemical groups are evidenced and confirms the formation of polymers. The spectra of AA:FA and AA:CUR copolymers revealed a characteristic peak at 3600 cm-1 corresponding to the stretching vibration of hydroxyl groups v(OH)COOH of hydrogen bonding of acrylic acid (AA). Besides, bands at 2996 and 2950 cm-1 are associated to the stretching oscillation of methyl groups v(C–H)CH3 from PMMA. Signals at 2160 cm-1, 2035 cm-1 and1982 cm-1 are assigned to a Fermi resonance effect of the carbonyl group (–C=O) of PMMA [58]. This behavior is a combination of fundamental stretching vibration of the C=O bond along with the symmetric deformation of the C–H group. An extended band at 1724 cm-1 is also attributed to the carbonyl group v(C=O) from PMMA [59]. The carbonyl v(C=O) binding of pure PMMA typically appears around 1721 cm-1, but in these spectra, it is shifted by the copolymerization process with the AA, FA, and CUR monomers [60]. Further, signals at 1475 cm-1 and 1435 cm-1 are associated with the bending of the methylene group δ(C–H)CH2, peaks at 1270 cm-1 and 1240 cm-1 correspond to the stretching motion of ester group v(O=C–O) and, absorption bands ranging 1190 cm-1 to 1142 cm-1 are attributed to the stretching of C–O–C bond, v(C–O–C) [61]. All these signals are consistent with the methyl methacrylate structure. For the amide and phenolic groups of FA and CUR do not appear in the spectra due to that the polymerization process was completed and, the signals are possibly overlapped with the broad PMMA bands. Nevertheless, the normal absorptions for primary amides v(N–H)NH2 and stretches of carbonyl groups δ(C=O)CONH2 in the fumaramide could appear at 3330 cm-1 and 1650 cm-1, respectively [62,63]. Meanwhile, curcumin (CUR) signals such as the vibration of hydroxyl group v(OH) is detected at 3500 cm-1, and a characteristic peak at 3020 cm-1 indicates the oscillation of methylene group v(C–H) referred to the aromatic ring. Finally, the carbonyl group δ(C=O) along with the vibration of the aromatic ring v(C=C) are observed at 1628 cm-1 [64].
The materials after of titration process were also analyzed by FT-IR. The spectra of Poly(AA:FA) were titrated with CaCl2 and MgCl2 solutions are shown in Figure 6, as example. The results present a decrement in the intensity of –OH band (3600 cm-1) caused by the disruption of hydrogen bonds coming from the chelation formed among polymers with the metal ions. Additionally, signals from 2160 cm-1 to 1982 cm-1 region increased by the Fermi resonance phenomena of carbonyl groups (–C=O) that became more intense, especially, when magnesium chloride was used. This could be explained by the coordination bond formed between the free electron pairs of carbonyl groups of AA, FA and MMA with Ca2+ and Mg2+ ions [65,66,67]. In addition, the Mg2+ ion has a smaller solvation radius compared to the Ca2+ ion. This allows greater interactions in complex formation by its larger surface charge density [68]. This is reflected in the increment of the zeta potential (less stability) (Figure 4) along with more pronounced FT-IR bands. As a complementary technique, functional groups from methyl methacrylate (MMA), acrylic acid (AA), fumaramide (FA) and curcumin (CUR) located on the polymeric nanoparticles with 5 wt.%, were analyzed by ultraviolet–visible (UV-Vis) spectroscopy. The collected data were normalized and they are presented in Figure 7. A chromophore is a molecule responsible for determining the color of materials that absorb certain wavelengths of visible light, while an auxochromes group modifies the energy bands by increasing the absorption intensity and the maximum wavelength () [69,70]. The polymeric particles before titration, Figure 7 (a) shows the spectrum of Poly(AA:FA) with an initial signal at 223 nm, corresponding to the conjugation of chromophore groups of PMMA (O=C–O), and auxochromes species from AA (carboxyl, –COOH) and FA (amide, –CONH2). According to the literature, pure PMMA exhibits a typical broad band absorption at 205 nm [71]. It could be attributed to copolymerization process was successfully carried out. After the titration process, slight wavelength shifts were observed for all systems. This is attributed to changes in polarity of polymeric solutions by the variations in coordination ligands. For instance, displacements to longer and lower energy wavelengths are referred to bathochromic effect (decrease of polarity), while short wavelength shift and high frequencies are known as a hypsochromic phenomenon (increase of polarity). In agreement with the results, bathochromic wavelengths shifts are observed from 223 nm to 226 nm, and 231 nm when Ca2+ and Mg2+ ions were used. This behavior results from conjugation of divalent cations with the carbonyl (–C=O), carboxylic (–COOH) and amide (–CONH2) groups [69]. The spectrum for the copolymer (AA:CUR) is presented in Figure 7 (b). It is noted, an absorbance band at = 231 nm attributed to the non-covalent bonds generated between the MMA and AA. Also, a = 417 nm is assigned to the phenolic group of CUR. Following interaction with electrolytes, the polymeric materials present a hypsochromic behavior from 231 nm to 223 nm and 222 nm for polymer-Ca2+ and -Mg2+, respectively. However, bands at 417 nm and 418 nm corresponding to the aromatic group of CUR showed a decrement in absorption by a charge transfer by the complex formation effect, resulting from the electronic transitions in the CUR structure, corresponding to the chromophore groups such as the carbonyl (–C=O) and the double bonds in the phenolic group (C=C, Ar-OH), where electrons transition from a bonding π (pi) molecular orbital to an antibonding π* molecular orbital [72,73].
The absorption bands of polymer (FA:CUR) are presented in Figure 7 (c). A peak at 223 nm is observed, corresponding to the combination of the interaction of chromophore species (O=C–O) of MMA with the auxochromes groups (CONH2) of fumaramide. After titration with Ca2+ and Mg2+ ions, bathochromic shifts are marked at wavelengths of 231 nm and 226 nm by the interactions with the carbonyl groups. A signal at = 417 nm corresponding to the phenolic group of CUR exhibits hypsochromic effects at 413 nm and 416 nm. For the series of nanoparticles Poly(AA:FA:CUR), chromophores of PMMA (–C=O) and the auxochromes of AA:FA (COOH:CONH2) were identified at 231 nm (Figure 7 (d)). The phenolic (Ar-OH) groups from curcumin are seen at 418 nm. After calcium electrolyte titration, hypsochromic responses from at 231 nm to 222 nm, and from 418 nm to 408 nm were observed, while for magnesium solution, displacements of the maximum wavelength () decreased from 228 nm and 412 nm. These shifts occur by the chelation of the chemical groups with calcium (Ca2+) and magnesium (Mg2+) ions, modifying the polymeric structure (Figure 8). The UV-Vis spectra corresponding to the polymers with 3 wt.% and 5 wt.% showed the same behavior.
3.3.3. Scanning Electron Microscopy (SEM) of Polymeric Nanoparticles with Different Ratios of Chelatings Agents
Polymeric particles with 5 wt.% of functional groups were analyzed by SEM to study their morphology, shape, surface and distribution of size (Figure 9). Obtained micrographs show well-defined and spherical particles with an average diameter estimated around 102.92 ± 7.6909 nm for all combination of chelating agents. These SEM images present a homogeneous distribution of particles. For all cases, they had no significant changes in morphologies, indicating that the polymers were sufficiently stable. Furthermore, it is clear that the effect of different types of monomers and distribution of functional groups on the nanoparticles shape is negligible. In the other hand, these particles size are very close to data obtained by the DLS.
Polymeric nanoparticles with 5 wt. % of chelating agents were titrated separately with calcium chloride (CaCl2) and magnesium chloride (MgCl2) to observe the conformational changes related to their morphology and chemical structure. Both CaCl2 and MgCl2 have been used as physical crosslinking agents for the preparation of hydrogels through electrostatic interactions, driven by the attraction between oppositely charged molecules. In an aqueous solution, both salts are dissociated into Ca2+ and Mg2+ ions [74,75]. SEM images in Figure 10 (a–d) revealed a significantly different size distribution, morphology and structure of titrated nanoparticles for all functional groups ratio. As shown in Figure 10 (a): Poly(AA:FA) and Figure 10 (b): Poly(AA:CUR) polymer particles evidenced agglomerates with an irregular surface and non-uniformly distribution. This is because, particles lost their configuration as the titration progress. Likewise, the polymers response is caused by the strong interactions between the hydrophilic groups present (–COOH, AA; –CONH2, FA; C=O, MMA; and/or C=O/Ar–OH, CUR) on the particle surface with Ca2+ ions. This means, the agglomeration process is a consequence of the reduction of repulsive forces between particles, decreasing the negative surface charges of particles [76,77]. These interaction effects are corroborated by the stability evaluation along the titration sequence, where zeta potential (ζ) values increased to about –20 mV by reducing the negatively charged segments of polymeric chains (Figure 4). The Figure 10 (c) of Poly(FA:CUR) shows the formation of a three-dimensional porous structure, likely by the functional groups acting as connection points for physical crosslinking with the Ca2+ ion through coordination effects with the carbonyl, amide and phenolic groups located on the particle surface [78]. This metallic ion induces polymeric network rearrangement, by reducing their stiffness, increasing the mobility and flexibility of polymeric chains [79]. Copolymer Poly(AA:FA:CUR) revealed important changes from spherical particles to flat and smooth surfaces (Figure 10 (d)), similar to the behavior exhibited by the particles Poly(FA:CUR). Additionally, the spherical particles can have a film effect during sample preparation for microscopy. This is, when a drop of the diluted latex was deposited onto the sample holder and after, the water was evaporated. The distance between particles decreased, resulting in a closed package arrangement of material and formation into a solid film [80]. This arrangement is more prone to fragmentation, and it has been observed in SEM images for the copolymers (c) Poly(FA:CUR) and (d) Poly(AA:FA:CUR).
SEM micrographs of the polymeric materials titrated with the MgCl2 are shown in Figure 11. The observed conformational changes are more noticeable in these systems, because of Mg2+ ion is smaller than the Ca2+ ion and thus has a larger contact surface, resulting in stronger non-covalent associations, as is evidenced in the copolymer of Poly(AA:FA) (Figure 11 (a)) [68]. This polymeric material displays a fully interconnected porous structure in which spherical particles are no longer observed by the physical crosslinking through electrostatic interactions between the negative sites of polymer chains and the positive charges of magnesium ions [81]. The images of particles with the AA:CUR and AA:FA:CUR ratio are shown in Figure 11 (b,d), respectively. The materials appear with a disintegrated and agglomerated structure attributed to the strong interaction with the Mg2+ ion, causing a restructuration of the chains and leading to a flat and porous structure. Furthermore, the particle size increment could be to the hygroscopic nature of MgCl2 this is, the capacity to absorb or attract water, which enhance the swelling degree of materials [82]. However, Poly(FA:CUR) shows aggregations of several spherical particles together with polymeric chains. In this case, the repulsive forces between particles decreased by the presence of a counterion, leading to particle agglomeration through electrostatic attraction. This was confirmed by the zeta potential behavior of materials [74]. The structural changes in the polymer and their interactions with the Mg2+ ions were even more evident than those obtained with the calcium solution, which could be attributed to the Fermi resonance effect observed in the FT-IR results (Figure 6) and through bathochromic and hypsochromic shifts in UV-Vis (Figure 7).
3.3.4. Photoluminescence (PL) Spectra of Polymeric Nanoparticles with Different Ratios of Chelatings Agents
The materials were analyzed by photolumnisce technique. Photoluminescence (PL) is a process in which a molecule absorbs a photon in the visible region, exciting one of its electrons to a higher electronic excited state, and then radiates a photon as the electron returns to a lower energy state [83]. If the molecule undergoes internal energy redistribution after the initial photon absorption, the radiated photon is of longer wavelength (lower energy) than the absorbed photon [83]. PL is an emission of ultraviolet visible, or infrared photons from an electronically excited species [84]. The materials Poly(AA:FA) and Poly(FA:CUR) with 5 wt.% of chelating agents were analyzed by photoluminescence spectroscopy before tittration process are shown in Figure 12 (a,b), as example. It is observed that the experimental emission wavelengths (λem) are 332 nm and 473 nm, respectively. This means, that the polymers emit below to their corresponding excitation wavelength (λexc). In addition, Figure 13 shows the PL spectra of Poly(AA:FA:CUR) with 5 wt.% of chelating agents before and after the electrolyte solution was added. It is observed that the systems show signals with the same emission and excitation wavelength but different intensities, attributing to chelation process [46]. These results confirm the interactions between the functional groups with the calcium or magnesium ions.
3.3.5. X-Ray Diffraction (XRD) Spectra of Polymeric Nanoparticles with Different Ratios of Chelatings Agents
X-ray diffraction (XRD) was used to evaluate the semicrystalline structure of polymeric nanoparticles with 5 wt.% of functional groups before and after of titration with electrolytes and the XRD diffractograms are shown in Figure 14 (a,b).
To analyze the diffractograms, it was considered as reference the peaks of CaCl2, which show a face-centered cubic (FCC) structure, and the peaks of MgCl2 that exhibits a hexagonal close-packed (HCP) arrangement. For FCC, the Miller indices (hkl) are either all even or odd (unmixed h, k, l). In contrast, for HCP structures, the indices (hkl) can take any value except, when h + 2k = 3n and l is odd [85]. It is important to mention that all peaks (diffraction patterns) that coincided in the three systems (AA:FA, FA:CUR and AA:FA:CUR) titrated with CaCl2 and MgCl2 were taken into account for the calculations. To calculate the interplanar spacing (d-spacing, in Armstrong Å), equation (2) was used [86]:
Where is the angle between the incoming and outgoing beam directions (diffraction) and is the wavelength of the incident X-ray beam. The spacing, expressed as 1/d2 (Å) for cubic crystal systems was determined using equation (3) [86]:
Finally, for polymer–CaCl2 systems, the interpretation of basic structure and the calculated indices (hkl) are shown in Table 7.
Meanwhile, the spacing in HCP crystal systems, is given by equation (4) [86]:.
As example and assuming that the first peak is attributed to the (100) plane, the substitution in equation (4), , and if the second peak corresponds to the (001) plane, . Thus, a and c are the crystal lattice parameters. After calculating a and c, the interplanar spacing (dhkl) values are agreement with the peaks obtained from the HCP crystal structure [87]. The dhkl parameters were calculated separately from the 2θ data and by equation (4) to corroborate each of the data. For polymer–MgCl2 systems, the interpretation of basic structure and (hkl) indexing are tabulated in Table 8, as example.
Initially, the polymer diffractograms reveal an amorphous region attributed to the non-crystalline nature of PMMA [88]. Additionally, the corresponding peaks to the complexes formed by the particles with CaCl2: 2θ = 27.26°, 31.56°, 45.36°, 54.06°, 56.38°, 66.14°, and 75.16° can be assigned to the (111), (200), (220), (311), (222), (400), and (420) diffraction planes, respectively. These confirm an FCC structure in the systems. Furthermore, when XRD patterns of the titrated polymers are compared with the CaCl2 pattern, a decrement in the intensity of the peaks is observed, where no-covalent bonds are formed and the interaction by the sharing of electron pairs between calcium ions and the functional groups present in the structure. Finally, the cubic structure of CaCl2 is not intact, some peaks, such as 2θ = 27.26°, 31.56°, and 45.36°, are slightly shifted, indicating a deformation in the physical structure of the CaCl2 by the interactions between the functional groups and Ca2+ ions. The diffractograms for the complexes formed between polymeric particles and MgCl2 show peaks at 2θ = 31.78°, 45.52°, 56.56°, 66.24°, and 75.34°, corresponding to the diffraction planes (100), (001), (110), (200), and (111), respectively. It is also observed intensity of peaks decreased at 15.18°, 21.86°, and 30.54°, combined with a shift in peaks at 31.78°, 45.52°, 56.56°, 66.24°, and 75.34°. These effects are caused by the associations between polymeric particles and Mg ions [89]. The electrolyte-titrated materials exhibit a semicrystalline structure. That is, the amorphous region is attributed to the copolymer, while the crystalline regions are characteristic of the MgCl2. XRD patterns indicate that magnesium does not retain its hexagonal close-packed (HCP) structure, shifts in 2θ values suggest distortions in the crystalline lattice of the electrolyte.
3.3.6. Isothermal Titration Calorimetry (ITC) of Polymeric Nanoparticles with Different Ratios of Chelatings Agents
The intermolecular interactions between the functional groups of AA, FA and CUR and the electrolytes were evaluated by isothermal titration calorimetry (ITC) using the MicroCal PEAQ-ITC Automated software version 1.22 provided by Malvern Instruments Ltd. Thermograms for the (a) AA–CaCl2, (b) FA–CaCl2, (c) CUR–CaCl2, (d) AA–MgCl2, (e) FA–MgCl2, and (f) CUR–MgCl2 systems are shown in Figure 15 (a–f). In all cases, the peak height decreases as electrolyte concentration increases, indicating that the chelating groups begin to saturate as calcium or magnesium ions bind. Negative values of the differential power (DP) indicate that the intermolecular interactions occur exothermically.
Furthermore, the heats of titration (Q) were obtained by integrating the area under each peak using the MicroCal PEAQ-ITC Analysis Software. Figure 16 (a–f) shows the normalized heats (Q n-1), where n represents the moles of chelating agent for the following systems: (a) AA–CaCl2, (b) FA–CaCl2, (c) CUR–CaCl2, (d) AA–MgCl2, (e) FA–MgCl2, and (f) CUR–MgCl2. Plots of normalized heats (Q n-1) as a function of the ratio of electrolyte to chelating agent concentrations were fitted to a one–site binding model using the MicroCal PEAQ-ITC Analysis Software. The results are presented in Table 9, Figure 17 (a–d), and Figure 18 (a–d).
In general, the binding constant (Kb) for all complex ranges from 22.7 M-1 (for FA–MgCl2) to 390 M-1 (for CUR–CaCl2), indicating a relatively low binding affinity compared to other systems. For example, typical binding constant for drug–receptor and enzyme–inhibitor interactions are in the range of 104 to 1011 M-1. Furthermore, the Gibbs free energy (ΔG) of binding for systems containing CaCl2 is lower than for complexes with MgCl2. This suggests that the binding of the Ca+2 ion is more stable compared to the binding of Mg+2 ion, indicating that the chelating groups studied are preferentially selective for Ca+2 than for Mg+2.
Specifically, for the Ca2+ ion, the free energy is negative, indicating the spontaneity of the interaction with the chelating groups as seen in Figure17 (a). Hence, the binding is ordered as follows AA > FA > CUR. In Figure 17 (b), it is observed that all enthalpic contributions are negative. The largest enthalpic contribution to the free energy was observed for CUR, while the smallest was observed for FA. Figure 17 (c) presents the entropic changes (TΔS) that occurred during titrations. The interaction of the FA–CaCl2 system is positive, providing a favorable contribution to the total free energy, whereas this contribution is unfavorable for the AA–CaCl2 and CUR–CaCl2 systems. Figure 17 (d) shows the enthalpy–entropy plot for the interaction with CaCl2. In this plot, the correlation coefficient (R²) is 0.9999, indicating an excellent degree of linearity between the enthalpic and entropic contributions. Also, the slope is 1.008 ± 0.009. This linear behavior suggests a balance between the enthalpy and entropic contributions, which can be attributed to the unique structure of water [90,91], and the structural complementarity and chemical properties of the binding partners [92]. For this reason, it is likely that the interactions occurring in AA–CaCl2, FA–CaCl2, and CUR–CaCl2 are structurally related.
For polymer–MgCl2 systems shown in Figure 18 (a–d), the free energies (ΔG) are all negative, and the order of magnitude is AA > FA > CUR (Figure 18 (a)). Besides, the enthalpic contributions (ΔH) are also negative, indicating favorable bindings, and follow the same order: AA > FA > CUR as illustrated in Figure 18 (b). The entropic contribution (TΔS) is favorable for the AA–MgCl2 interaction, but unfavorable for FA–MgCl2 and CUR–MgCl2 complexes (Figure 18 (c)). Consequently, in the latter two cases, the interactions are clearly enthalpically driven. Finally, Figure 18 (d) shows the enthalpy–entropy plot for the interactions involving MgCl2. Notably, the data points for the AA–MgCl2, FA–MgCl2, and CUR–MgCl2 interactions do not exhibit linear behavior when considered together. In a more detailed analysis, the slope of the linear enthalpy–entropy compensation effect for the AA–MgCl2 and FA–MgCl2 systems is 1.062, which is very close to the slope observed for systems involving CaCl2 (1.008 ± 0.009). However, the CUR–MgCl2 complex exhibits a different behavior.
On the other hand, Figure 19 presents a comparison of the enthalpy–entropy compensation effects across all systems studied. It is noteworthy that the range of variation in the contributions to the Gibbs free energy is more pronounced in the systems titrated with CaCl2 compared to those involving MgCl2 as analyzed in Figure 17 and Figure 18. For clarity, only the data from systems containing MgCl2 are displayed in Figure 19. The black line represents the linear fit considering both the CaCl2, and the CUR–MgCl2 system. Incorporating the data of complex CUR–MgCl2 results in a minimal change in the slope from 1.008 to 1.006, which falls within the experimental error, with the linear correlation coefficient remaining unchanged at 0.9999. This finding suggests that the role of water and structural characteristics is consistent across the AA–CaCl2, FA–CaCl2, CUR–CaCl2, and CUR–MgCl2 systems. In particular, the AA–MgCl2 and FA–MgCl2 complexes exhibit a parallel linear compensation behavior, indicating a distinct structural difference in the interactions. In addition to this, the enthalpy–entropy compensation analysis underscores the critical role of water in the studied interactions.
Figure 20 (a–c) illustrates the proposed reaction stoichiometry between the polymers and calcium ions. For AA, one calcium ion (Ca2+) is required to form a single interaction site. In the case of FA, an arrangement may exist in which ten amide groups molecules interact with ten metal ions. This behavior is consistent with the structures observed by SEM. For CUR, two of their molecules are necessary per metal ion to achieve one site of interaction. The thermodynamic findings analyzed above correlate with the proposed interaction mechanisms in Figure 20. Specifically, the stoichiometric ratios derived from these intermolecular interactions highlight differences in spatial arrangement and binding site accessibility, which likely contribute to the observed variation in enthalpy and entropy contributions. Furthermore, the predominance of non–covalent interactions aligns with the compensation trends, suggesting that hydration and structural organization of the complexes govern the binding energetics [93,94].
4. Conclusions
This research, synthesized polymeric nanoparticles with various functional group compositions for potential use as drug delivery systems in breast cancer treatments. The total solids content () and particle size were closely related to the concentration, hydrophobicity, and hydrophilicity of the monomers. The zeta potential (ζ) of the nanoparticles indicated colloidal stability, but this stability decreased when electrolytes were introduced because the chelation effect with calcium (Ca2+) or magnesium (Mg2+) ions, which reduced repulsive forces and interaction sites. pH changes also affected the ionization of functional groups, influencing nanoparticle dispersion or agglomeration as shown in SEM images. UV-Vis analysis revealed bathochromic and hypsochromic shifts, linked to structural changes in the polymeric networks caused by non-covalent interactions between metal ions and the oxygen and nitrogen atoms in the monomers. XRD analysis showed increased crystallinity of the polymer, with Miller indices (hkl) calculated after titration. Further, X-ray patterns indicated modifications in the polymeric network. PL and ITC analyses confirmed spontaneous chelation between the functional groups and metal ions. In conclusion, the materials demonstrated metal-chelating properties, suggesting their potential application in breast cancer treatments, particularly in regulating and transporting calcium and magnesium within the body.
Author Contributions
Conceptualization, J.L.S.G., LR.V., J.M.d.R. and M.C.; Methodology, J.L.S.G., LR.V., J.M.d.R. and M.C.; Software, J.L.S.G., LR.V., J.M.d.R. and M.C.; Validation, J.L.S.G., LR.V., J.M.d.R. and M.C.; Formal Analysis, J.L.S.G., LR.V., I.A.G.W., M.R.L., G.M.M., R.C.B., J.M.d.R. and M.C.; Investigation, J.L.S.G., LR.V., I.A.G.W., M.R.L., G.M.M., R.C.B., J.M.d.R. and M.C.; Resources, J.L.S.G., LR.V., I.A.G.W., M.R.L., G.M.M., R.C.B., J.M.d.R. and M.C.; Data Curation, J.L.S.G., LR.V., I.A.G.W., M.R.L., G.M.M., R.C.B., J.M.d.R. and M.C.; Writing – Original Draft Preparation, J.L.S.G., LR.V., J.M.d.R. and M.C.; Writing – Review & Editing, J.L.S.G., LR.V., J.M.d.R. and M.C.; Visualization, X.X.; Supervision, J.M.d.R. and M.C.; Project Administration, J.M.d.R. and M.C.; Funding Acquisition, J.M.d.R. and M.C. All authors have read and agreed to the published version of the manuscript.
Funding
This research did not receive any specific grant from funding agencies in the public, commercial, or non-profit sectors.
Acknowledgments
CENTRO DE NANOCIENCIAS Y MICRONANOTECNOLOGÍAS (CNMN–IPN), CONSEJO NACIOANL DE HUMANIDADES, CIENCIAS Y TECNOLOGÍAS (CONACHYT), AND TO PROJECT 871 DE CÁTEDRAS (2017).
Conflicts of Interest
The authors declare that they have no known competing financial interests or personal relationships that could have appeared to influence the work reported in this paper.
References
- Brown, J.S; Amend, S.R.; Austin, R.H.; Gatenby, R.A.; Hammarlund, E.U.; Pienta, K.J. Updating the Definition of Cancer, Mol. Cancer. Res. 2023, 21, 1142–1147. [Google Scholar] [CrossRef]
- Hnamte, M.; Pulikkal, A. K. Biocompatible polymeric nanoparticles as carriers for anticancer phytochemicals. Eur. Polym. J. 2024, 202, 112637. [Google Scholar] [CrossRef]
- Cancer, World Health Organization. Available online: https://www.who.int/health-topics/cancer#tab=tab_1 (accessed on 16 July 2024).
- Yang, F.; He, Q.; Dai, X.; Zhang, X.; Song, D. The potential role of nanomedicine in the treatment of breast cancer to overcome the obstacles of current therapies. Front. Pharmacol. 2023, 14, 1143102. [Google Scholar] [CrossRef]
- Harbeck, N.; Gnant, M. Breast cancer. Lancet. 2017, 389, 1134–1150. [Google Scholar] [CrossRef]
- Li, X.; Zhang, X.; Yin, S.; Nie, J. Challenges and prospects in HER2-positive breast cancer-targeted therapy. Crit. Rev. Oncol. Hematol. 2025, 207, 104624. [Google Scholar] [CrossRef]
- Chen, C.; Xue, L.; Han, C.; Wu, W.; Lu, N.; Lu, X. GnRHR inhibits the malignant progression of triple-negative breast cancer by upregulating FOS and IFI44L. Genomics 2025, 117, 111021. [Google Scholar] [CrossRef] [PubMed]
- Granados-Garcia, M.; Herrera-Gómez, A. Manual de oncología. Procedimientos médico quirúrgicos, 4th ed.; Mc Graw Hill interamericana editores, S.A. de C.V: CDMX, México, 2010; pp. 1–1315. [Google Scholar]
- Guanghui, R.; Xiaoyan, H.; Shuyi, Y.; Jun, C.; Guobin, Q. An efficient or methodical review of immunotherapy against breast cancer. J. Biochem. Mol. Toxicol. 2019, 33, e22339. [Google Scholar] [CrossRef] [PubMed]
- Barzaman, K.; Karami, J.; Zarei, Z.; Aysooda, H.; Kazemi, M.H.; Moradi-Kalbolandi, S.; Safari, E.; Farahmand, L. Breast cancer: Biology, biomarkers, and treatments. Int. Immunopharmacol. 2020, 84, 106535. [Google Scholar] [CrossRef]
- Wuerstlein, R.; Harbeck, N. Neoadjuvant Therapy for HER2-positive Breast Cancer, Rev. Recent. Clin. Trials. 2017, 12, 81–92. [Google Scholar] [CrossRef] [PubMed]
- Uttpal, A.; Abhijit, D.; Arvind, K.S.C.; Rupa, S.; Amarnath, M.; Devendra, K.P.; Valentina, F.; Arun, U.; Ramesh, K.; Anupama, C.; Jaspreet, K. D.; Saikat, D.; Jayalakshmi, V.; José, M.P.L. Cancer chemotherapy and beyond: Current status, drug candidates, associated risks and progress in targeted therapeutics. Genes Dis. 2023, 10, 1367–1401. [Google Scholar] [CrossRef]
- Mariam, A.; Peter, K.; Martin, C.; Elizabeth, V.; Barbora, Z.; Pavol, Z.; Radka, O.; Peter, K.; Patrik, S.; Dietrich, B. Chemotherapeutic agents for the treatment of metastatic breast cancer: An update. Biomed. Pharmacother. 2018, 101, 458–477. [Google Scholar] [CrossRef] [PubMed]
- Johnsson, A.; Fugl-Meyer, K.; Bordas, P.; Åhman, J.; Von Wachenfeldt, A. Side Effects and Its Management in Adjuvant Endocrine Therapy for Breast Cancer: A Matter of Communication and Counseling. Breast Cancer: Basic and Clinical Research. 2023, 17, 117822342211454. [Google Scholar] [CrossRef]
- Jackson, C.; Finikarides, L.; Freeman, A.L.J. The adverse effects of trastuzumab-containing regimes as a therapy in breast cancer: A piggy-back systematic review and meta-analysis. PLoS ONE 2022, 17, e0275321. [Google Scholar] [CrossRef]
- García-Domínguez, D.J.; López-Enríquez, S.; Alba, G.; Garnacho, C.; Jiménez-Cortegana, C.; Flores-Campos, R.; de la Cruz-Merino, L.; Hajji, N.; Sánchez-Margalet, V.; Hontecillas-Prieto, L. Cancer Nano-Immunotherapy: The Novel and Promising Weapon to Fight Cancer. Int. J. Mol. Sci. 2024, 25, 1195. [Google Scholar] [CrossRef]
- Cazzaniga, M.E.; Capici, S.; Cordani, N.; Cogliati, V.; Pepe, F.F.; Riva, F.; Cerrito, M.G. Metronomic Chemotherapy for Metastatic Breast Cancer Treatment: Clinical and Preclinical Data between Lights and Shadows. J. Clin. Med. 2022, 11, 4710. [Google Scholar] [CrossRef] [PubMed]
- Panthi, V.K.; Dua, K.; Singh, S.K.; Gupta, G.; Hansbro, P.M.; Paudel, K.R. Nanoformulations-Based Metronomic Chemotherapy: Mechanism, Challenges, Recent Advances, and Future Perspectives. Pharmaceutics 2023, 15, 1192. [Google Scholar] [CrossRef] [PubMed]
- Ahire, S.A.; Bachhav, A.A.; Pawar, T.B.; Jagdale, B.S.; Patil, A.V.; Koli, P.B. The Augmentation of nanotechnology era: A concise review on fundamental concepts of nanotechnology and applications in material science and technology. Results Chem. 2022, 4, 100633. [Google Scholar] [CrossRef]
- Majhi, K.C.; Yadav, M. Synthesis of inorganic nanomaterials using carbohydrates. In Green Sustainable Process for Chemical and Environmental Engineering and Science, 1st. ed.; Inamuddin, Boddula, R., Ahamed, M.I., Asiri, A.M., Eds.; Elsevier: Amsterdam, Netherlands, 2021; Volume 1, pp. 109–135. [Google Scholar] [CrossRef]
- Datta, D.; Das, K.P.; Deepak, K.S.; Das, B. Candidates of functionalized nanomaterial-based membranes, In Membranes with Functionalized Nanomaterials, 1st. ed.; Dutta, S., Hussain, C.M., Eds.; Elsevier: Amsterdam, Netherlands, 2022; pp. 81–127. [Google Scholar] [CrossRef]
- Adil, L.R.; Parui, R.; Khatun, M.N.; Chanu, M.A.; Li, L.; Wang, S.; Iyer, P.K. Nanomaterials for sensors: Synthesis and applications, In Advanced Nanomaterials for Point of Care Diagnosis and Therapy. 1st. ed.; Dave, S., Das, J., Ghosh, S., Eds.; Elsevier: Amsterdam, Netherlands, 2022; pp. 121–168. [Google Scholar]
- Ruiz-Virgen, L.; Hernandez-Martinez, M.A.; Martínez-Mejía, G.; Caro-Briones, R.; Herbert-Pucheta, E.; Del Río, J.M.; Corea, M. Analysis of Structural Changes of pH–Thermo-Responsive Nanoparticles in Polymeric Hydrogels. Gels 2024, 10, 541. [Google Scholar] [CrossRef]
- He, H.; Shen, X.; Nie, Z. Engineering interactions between nanoparticles using polymers. Prog. Polym. Sci. 2023, 143, 101710. [Google Scholar] [CrossRef]
- Solangi, N.H.; Karri, R.R.; Mubarak, N.M.; Mazari, S.A. Mechanism of polymer composite-based nanomaterial for biomedical applications. Adv. Ind. Eng. Polym. Res. 2024, 7, 1–19. [Google Scholar] [CrossRef]
- Fernandes, D.A. Review on Metal-Based Theranostic Nanoparticles for Cancer Therapy and Imaging. TCRT 2023, 22, 15330338231191493. [Google Scholar] [CrossRef]
- Delfi, M.; Ghomi, M.; Zarrabi, A.; Mohammadinejad, R.; Taraghdari, Z.B.; Ashrafizadeh, M.; Zare, E.N.; Agarwal, T.; Padil, V.V.T.; Mokhtari, B. Functionalization of Polymers and Nanomaterials for Biomedical Applications: Antimicrobial Platforms and Drug Carriers. Prosthesis 2020, 2, 117–139. [Google Scholar] [CrossRef]
- Jia, H.; Titmuss, S. Polymer-functionalized nanoparticles: from stealth viruses to biocompatible quantum dots. Nanomedicine 2009, 4, 951–966. [Google Scholar] [CrossRef] [PubMed]
- Santillán, R.; Nieves, E.; Alejandre, P.; Pérez, E.; Del Río, J.M.; Corea, M. Comparative thermodynamic study of functional polymeric latex particles with different morphologies. Colloids Surf. A: Physicochem. Eng. Asp. 2014, 444, 189–208. [Google Scholar] [CrossRef]
- Vatankhah, Z.; Dehghani, E.; Salami-Kalajahi, M.; Roghani-Mamaqani, H. 2020. Seed’s morphology-induced core-shell composite particles by seeded emulsion polymerization for drug delivery. Colloids Surf B Biointerfaces. 2020, 191, 111008. [Google Scholar] [CrossRef]
- Kabogo, I.T.; Nyamato, G.S.; Ogunah, J.; Maqinana, S.; Ojwach, S.O. Extraction of heavy metals from water using chelating agents: a comprehensive review. Int. J. Environ. Sci. Technol. 2024, 21, 8749–8792. [Google Scholar] [CrossRef]
- Sredojević, D.N.; Tomić, Z.D.; Zarić, S.D. Evidence of Chelate−Chelate Stacking Interactions in Crystal Structures of Transition-Metal Complexes. Cryst. Growth Des. 2010, 10, 3901–3908. [Google Scholar] [CrossRef]
- Li, W.; Zhao, H.; Teasdale, P. R.; John, R.; Zhang, S. Synthesis and characterization of a polyacrylamide–polyacrylic acid copolymer hydrogel for environmental analysis of Cu and Cd. React. Funct. Polym. 2002, 52, 31–41. [Google Scholar] [CrossRef]
- Tomida, T.; Hamaguchi, K.; Tunashima, S.; Katoh, M.; Masuda, S. Binding Properties of a Water-Soluble Chelating Polymer with Divalent Metal Ions Measured by Ultrafiltration. Poly(acrylic acid). Ind. Eng. Chem. Res. 2001, 40, 3557–3562. [Google Scholar] [CrossRef]
- Malla, J.A.; Roy, A.; Talukdar, P. Anion Selective Ion Channel Constructed from a Self-Assembly of Bis(cholate)-Substituted Fumaramide. Org. Lett. 2018, 20, 5991–5994. [Google Scholar] [CrossRef]
- Joe, B.; Vijaykumar, M.; Lokesh, B.R. Biological Properties of Curcumin-Cellular and Molecular Mechanisms of Action. Crit. Rev. Food Sci. Nutr. 2004, 44, 97–111. [Google Scholar] [CrossRef]
- Amram, A.; Sukanta, D.; Ashish, P.; Kamia, P.; Sara, R. G.; William, L.; Kun-lun, H.; Krishnaswami, R. Green anchors: Chelating properties of ATRP-click curcumin-polymer conjugates. React. Funct. Polym. 2016, 102, 47–52. [Google Scholar] [CrossRef]
- Hepler, P.K. The role of calcium in cell division. Cell Calcium. 1994, 16, 322–330. [Google Scholar] [CrossRef]
- Wolfa, F. I.; Cittadinia, A.R.M.; Maier, J.A.M. Magnesium and tumors: Ally or foe? Cancer. Treat. Rev. 2009, 35, 378–382. [Google Scholar] [CrossRef]
- National library of Medicine. Magnesium and cancer: more questions than answers. Magnesium in the Central Nervous System [Internet]. Available online: https://www.ncbi.nlm.nih.gov/books/NBK507261/ (accessed on day month year).
- Kim, B.J.; Jeon, J.H.; Kim, S.J.; So, I.; Kim, K.W. Regulation of Transient Receptor Potential Melastatin 7 (TRPM7) Currents by Mitochondria. Mol. Cells. 2007, 23, 363–369. [Google Scholar] [CrossRef] [PubMed]
- Zhang, C.; Wu, G. Recent advances in fluorescent probes for ATP imaging. Talanta 2024, 279, 126622. [Google Scholar] [CrossRef]
- Klaudia, J.; Marianna, M.; Suliman, Y.A.; Saleh, H.A.; Eugenie, N.; Kamil, K.; Christopher, J.R.; Marian, V. Essential metals in health and disease. Chem.-Biol. Interact. 2022, 367, 110173. [Google Scholar] [CrossRef]
- Kumari, N.; Pullaguri, N.; Rath, S.N.; Bajaj, A.; Sahu, V.; Ealla, K.K.R. Dysregulation of calcium homeostasis in cancer and its role in chemoresistance. Cancer Drug Resist. 2024, 7, 11. [Google Scholar] [CrossRef] [PubMed]
- Ruiz-Virgen, L.; Hernandez-Martinez, M.A.; Martínez-Mejía, G.; Caro-Briones, R.; Del Río, J.M.; Corea, M. Study of Thermodynamic and Rheological Properties of Sensitive Polymeric Nanoparticles as a Possible Application in the Oil Industry. J. Solution Chem. 2024, 53, 5–27. [Google Scholar] [CrossRef]
- Martínez-Montoya, P.A.; Del Río, J.M.; Morales-Ramirez, A.J.; Corea, M. Europium recovery process by means of polymeric nanoparticles functionalized with acrylic acid, curcumin and fumaramide. J. Rare Earth. 2024, 42, 1950–1959. [Google Scholar] [CrossRef]
- Malvern Instruments (Malvern, UK). Zetasizer Nano User Manual. Preprint 2017. (Phase: Unpublished work).
- Schork, F.J. Monomer Equilibrium and Transport in Emulsion and Miniemulsion Polymerization. Biomacromolecules 2024, 25, 3249–3260. [Google Scholar] [CrossRef]
- Choi, M.J.; Woo, M.R.; Choi, H.G.; Jin, S.G. Effects of Polymers on the Drug Solubility and Dissolution Enhancement of Poorly Water-Soluble Rivaroxaban. Int. J. Mol. Sci. 2022, 22, 9491. [Google Scholar] [CrossRef] [PubMed]
- Gasztych, M.; Malamis-Stanowska, A.; Trafalski, M.; Musiał, W. Influence of Composition on the Patterns of Electrokinetic Potential of Thermosensitive N-(Isopropyl)Acrylamide Derivatives with Poly(Ethylene Glycol) Dimethacrylate and N-(2-Hydroxyethyl)Acrylamide. Int. J. Mol. Sci. 2024, 25, 13554. [Google Scholar] [CrossRef] [PubMed]
- Bhanvase, B.A.; Pinjari, D.V.; Sonawane, S.H.; Gogate, P.R.; Pandit, A.B. Analysis of Semibatch Emulsion Polymerization: Role of Ultrasound and Initiator. Ultrason. Sonochem. 2012, 19, 97–103. [Google Scholar] [CrossRef] [PubMed]
- Montes, C.; Villaseñor, M.J.; Ríos, A. Analytical control of nanodelivery lipid-based systems for encapsulation of nutraceuticals: Achievements and challenges. Trends Food Sci. Technol. 2019, 90, 47–62. [Google Scholar] [CrossRef]
- Biriukov, D.; Fibich, P.; Předota, M. Zeta Potential Determination from Molecular Simulations. J. Phys. Chem. C. 2020, 124, 3159–3170. [Google Scholar] [CrossRef]
- Priyadarsini, K.I. The Chemistry of Curcumin: From Extraction to Therapeutic Agent. Molecules. 2014, 19, 20091–20112. [Google Scholar] [CrossRef]
- Tyagi, R.; Jacob, J. Design and synthesis of water-soluble chelating polymeric materials for heavy metal ion sequestration from aqueous waste. React. Funct. Polym. 2020, 154, 104687. [Google Scholar] [CrossRef]
- Ibarra-Montaño, E.L.; Rodríguez-Laguna, N.; Sánchez-Hernández, A.; Rojas-Hernández, A. Determination of pKa Values for Acrylic, Methacrylic and Itaconic Acids by 1H and 13C NMR in Deuterated Water. J. Appl. Sol. Chem. Model. 2015, 4, 7–18. [Google Scholar] [CrossRef]
- ChemicalBook. Available online: https://www.chemicalbook.com/ChemicalProductProperty_EN_CB9402245.htm (accessed on 25 February 2025).
- Painter, P.; Zhao, H.; Park, Y. Infrared spectroscopic study of thermal transitions in poly(methyl methacrylate). Vib. Spectrosc. 2011, 55, 224–234. [Google Scholar] [CrossRef]
- Willis, H.A.; Zichy, V.J.I.; Hendra, P.J. The laser-Raman and infra-red spectra of poly(methyl methacrylate). Polymer. 1969, 10, 737–746. [Google Scholar] [CrossRef]
- Lee, B.S.; Chen, Y.J.; Wei, T.C.; Ma, T.L.; Chang, C.C. Comparison of Antibacterial Adhesion When Salivary Pellicle Is Coated on Both Poly(2-hydroxyethyl-methacrylate)- and Polyethylene-glycol-methacrylate-grafted Poly(methyl methacrylate). Int. J. Mol. Sci. 2018, 19, 2764. [Google Scholar] [CrossRef] [PubMed]
- Sayyah, S.M.; El-Shafiey, Z.A.; Barsoum, B.N.; Khaliel, A.B. Infrared spectroscopic studies of poly(methyl methacrylate) doped with a new sulfur-containing ligand and its cobalt(II) complex during γ-radiolysis. Int. J. Polym. Mater. 2005, 54, 1937–1950. [Google Scholar] [CrossRef]
- Whelan, C.M.; Gatti, F.; Leigh, D.A.; Rapino, S.; Zerbetto, F.; Rudolf, P. Adsorption of Fumaramide Rotaxane and Its Components on a Solid Substrate: A Coverage-Dependent Study. J. Phys. Chem. B. 2006, 110, 17076–17081. [Google Scholar] [CrossRef]
- Chatterley, A.S.; Laity, P.; Holland, C.; Weidner, T.; Woutersen, S.; Giubertoni, G. Broadband Multidimensional Spectroscopy Identifies the Amide II Vibrations in Silkworm Films. Molecules 2022, 27, 6275. [Google Scholar] [CrossRef]
- Perera, K.D.C.; Weragoda, G.K.; Haputhanthri, R.; Rodrigo, S.K. Study of concentration dependent curcumin interaction with serum biomolecules using ATR-FTIR spectroscopy combined with Principal Component Analysis (PCA) and Partial Least Square Regression (PLS-R). Vib. Spectrosc. 2021, 116, 103288. [Google Scholar] [CrossRef]
- Zhang, S.; Lin, Z.; Jiang, G.; Wang, J.; Wang, D.Y. Construction of chelation structure between Ca2+ and starch via reactive extrusion for improving the performances of thermoplastic starch. Compos. Sci. Technol. 2018, 159, 59–69. [Google Scholar] [CrossRef]
- Wei, X.; Chen, S.; Rong, J.; Sui, Z.; Wang, S.; Lin, Y.; Xiao, J.; Huang, D. Improving the Ca(II) adsorption of chitosan via physical and chemical modifications and charactering the structures of the calcified complexes. Polym. Test 2021, 98, 107192. [Google Scholar] [CrossRef]
- Kafle, B.P. Infrared (IR) spectroscopy. In Chemical Analysis and Material Characterization by Spectrophotometry, 1st ed.; Eryilmaz, K., Ed.; Elsevier: Amsterdam, Netherlands, 2020. [Google Scholar]
- Xu, H.T.; Zhang, N.; Li, M.R.; Zhang, F.S. Comparison of the ionic effects of Ca2+ and Mg2+ on nucleic acids in liquids. J. Mol. Liq. 2021, 344, 117781. [Google Scholar] [CrossRef]
- Chakraborty, J.N. Colouring materials. In Fundamentals and Practices in Colouration of Textiles, 1st ed.; Chakraborty, J.N., Ed.; Woodhead Publishing India Pvt. Ltd: New Delhi, India, 2010. [Google Scholar] [CrossRef]
- Ahmouda, K.; Boudiafac, M.; Benhaouad, B. A novel study on the preferential attachment of chromophore and auxochrome groups in azo dye adsorption on different greenly synthesized magnetite nanoparticles: investigation of the influence of the mediating plant extract's acidity. Nanoscale Adv. 2022, 4, 3250–3271. [Google Scholar] [CrossRef]
- Workman, J. Handbook of Organic Compounds: NIR, IR, Raman, and UV-Vis Spectra Featuring Polymers and Surfactants. 1st. ed.; Academic Press: San Diego, USA, 2001; pp. 3–421. [Google Scholar]
- Hieu, T.Q.; Thao, D.T.T. Enhancing the Solubility of Curcumin Metal Complexes and Investigating Some of Their Biological Activities. J. Chem. 2019, 1, 8082195. [Google Scholar] [CrossRef]
- Subhan, M.A.; Alam, K.; Rahaman, M.S; Rahman, M.A.; Awal, R. Synthesis and Characterization of Metal Complexes Containing Curcumin (C21H20O6) and Study of their Anti-microbial Activities and DNA-binding Properties. J. Sci. Res. 2014, 6, 97–109. [Google Scholar] [CrossRef]
- Hu, W.; Wang, Z.; Xiao, Y.; Zhanga, S.; Wang, J. Advances in crosslinking strategies of biomedical hydrogels. Biomater. Sci. 2019, 7, 843–855. [Google Scholar] [CrossRef]
- Hussein, M.; El-Husseiny, E.A.; Mady, L.H.; Amira, A.; Kazumi, S.; Tomohiko, Y.; Takashi, T.; Aimi, Y.; Mohamed, E.; Ryou, T. Smart/stimuli-responsive hydrogels: Cutting-edge platforms for tissue engineering and other biomedical applications. Mater. Today Bio. 2022, 13, 100186. [Google Scholar] [CrossRef]
- Collini, H.; Jackson, M.D. Zeta potential of crude oil in aqueous solution. Adv. Colloid Interface Sci. 2023, 320, 102962. [Google Scholar] [CrossRef]
- Serrano-Lotina, A.; Portela, R.; Baeza, P.; Alcolea-Rodriguez, V.; Villarroel, M.; Ávila, P. Zeta potential as a tool for functional materials development. Catal. Today. 2023, 423, 113862. [Google Scholar] [CrossRef]
- Shen, J.; Dai, Y.; Xia, F.; Zhang, X. Role of divalent metal ions in the function and application of hydrogels. Prog. Polym. Sci. 2022, 135, 101622. [Google Scholar] [CrossRef]
- Hu, J.; Huang, G.; Li, L.; Zhan, X.; Zhang, J.; Shao, J.; Hong, S.; Pan, S.T. A Mg2+-light double crosslinked injectable alginate hydrogel promotes vascularized osteogenesis by establishing a Mg2+-enriched microenvironment. Mater. Today Commun. 2024, 41, 110303. [Google Scholar] [CrossRef]
- Ribeiro, T.; Baleizão, C.; Farinha, J.P.S. Functional Films from Silica/Polymer Nanoparticles. Materials 2014, 7, 3881–3900. [Google Scholar] [CrossRef] [PubMed]
- Du, W.; Jiang, L.; Shi, M.; Yangab, Z.; Zhang, X. The modification mechanism and the effect of magnesium chloride on poly(vinyl alcohol) films. RSC Adv. 2019, 9, 1602–1612. [Google Scholar] [CrossRef]
- Wang, Y.; Fan, L.R. Preparation and Hygroscopic Property of the Polyacrylamide/MgCl2 Hybrid Hydrogel. Adv. Mater. Res. 2012, 550, 904–907. [Google Scholar] [CrossRef]
- Munson, C.A.; Gottfried, J.L.; De Lucia, F.C.; McNesby, K.L.; Miziolek, A.W. Laser-based detection methods of explosives. In Counterterrorist Detection Techniques of Explosives, 1st ed.; Yinon, J., Ed.; Elsevier Science B.V.: Amsterdam, Netherlands, 2007. [Google Scholar]
- Yang, K.; Venkataraman, M.; Wiener, J.; Militky, J. Photoluminescence PCMs and Their Potential for Thermal Adaptive Textiles. In Multifunctional Phase Change Materials; Pielichowska, K., Pielichowski, K., Eds.; Woodhead Publishing: Cambridge, UK, 2023; pp. 255–277. [Google Scholar]
- Kunghatkar, R.G.; Barai, V.L.; Dhoble, S.J. Synthesis route dependent characterizations of CaMgP2O7: Gd3+ phosphor. Results Phys. 2019, 13, 102295. [Google Scholar] [CrossRef]
- Drenth, J. Principles of Protein X-ray Crystallography, 3er ed.; Springer Science & Business Media: Groningen, Netherlands, 2007; pp. 1–326. [Google Scholar]
- Abazari, M.; Jamjah, R.; Bahri-Laleh, N.; Hanifpour, A. Synthesis and evaluation of a new three-metallic high-performance Ziegler–Natta catalyst for ethylene polymerization: Experimental and computational studies. Polym. Bull. 2022, 79, 7265–7280. [Google Scholar] [CrossRef]
- Abasi, C.Y.; Wankasi, D.; Dikio, E.D. Adsorption study of Lead(II) ions on poly(methyl methacrylate) waste material. Asian J. Chem. 2018, 30, 859–867. [Google Scholar] [CrossRef]
- Jayalakshmi, K.; Ismayil; Hegde, S.; Ravindrachary, V.; Sanjeev, G.; Mazumdar, N.; Sindhoora, K.M.; Masti, S.P.; Murari, M.S. Methyl cellulose-based solid polymer electrolytes with dispersed zinc oxide nanoparticles: A promising candidate for battery applications. J. Phys. Chem. Solids 2023, 173, 111119. [Google Scholar] [CrossRef]
- Lumry, R.; Rajender, S. Enthalpy–entropy compensation phenomena in water solutions of proteins and small molecules: A ubiquitous property of water. Biopolymers 1970, 9, 1125–1227. [Google Scholar] [CrossRef]
- Mancini, F.; Graziano, G. On enthalpy–entropy compensation characterizing processes in aqueous solution. Entropy 2025, 27, 716. [Google Scholar] [CrossRef]
- Georgelin, R.; Colin, J.J. Entropy, enthalpy, and evolution: Adaptive trade-offs in protein binding thermodynamics. Curr. Opin. Struct. Biol. 2025, 94, 103080. [Google Scholar] [CrossRef]
- Malvern Panalytical. Dissociation constant. Accurate kinetic measurement of binding events. Available online: https://www.malvernpanalytical.com/en/products/measurement-type/dissociation-constant (accessed on 12 May 2025).
- Astolfi-Rosado, L.; Bordin-Vasconcelos, I.; Palma, M.S.; Frappier, V.; Josef-Najmanovich, R.; Santiago-Santos, D.; Augusto-Basso, L. The mode of action of recombinant Mycobacterium tuberculosis shikimate kinase: Kinetics and thermodynamics analyses. PLoS ONE 2013, 8, e61918. [Google Scholar] [CrossRef]
Figure 1.
Scheme of the synthesis process of polymeric nanoparticles.
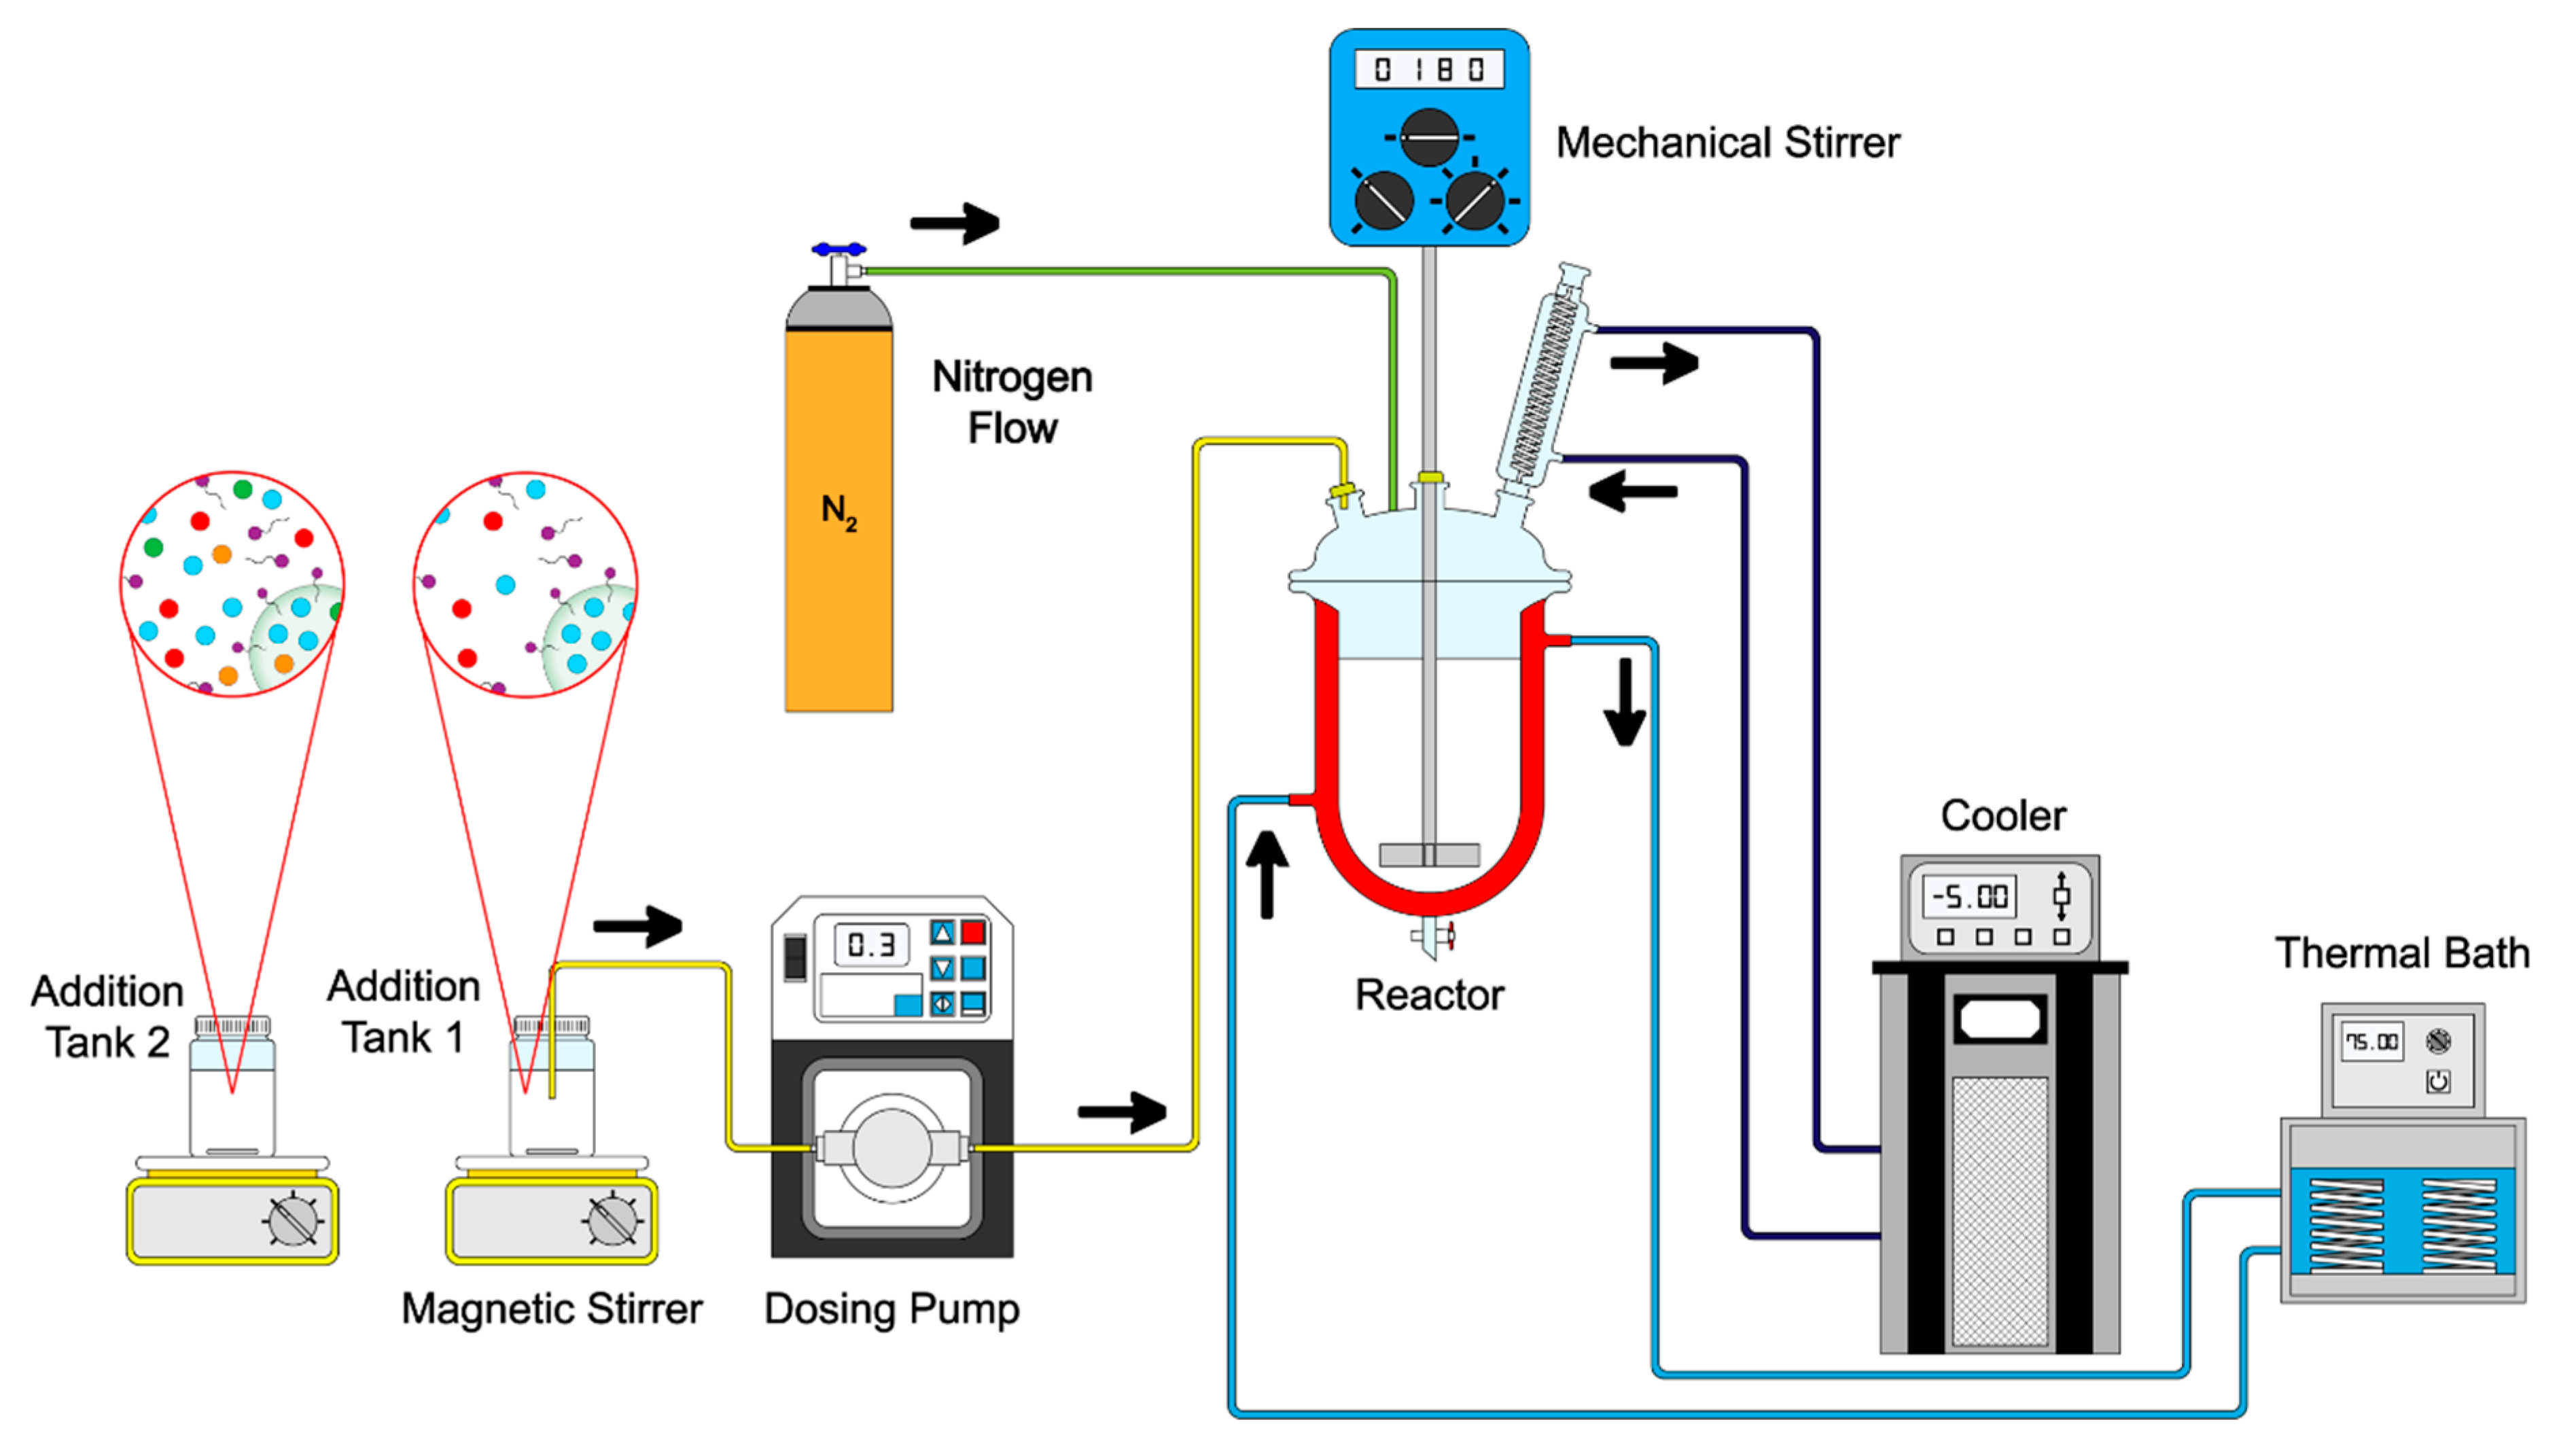
Figure 2.
Scheme of the chemical structure of synthesized nanoparticles with a ( ) methyl methacrylate MMA core and a shell of (
 ) acrylic acid, AA; (
 ) fumaramide, FA and/or (
 ) curcumin, CUR; respectively; where (
 ) is the surfactant molecules in the polymer chains.
) methyl methacrylate MMA core and a shell of () acrylic acid, AA; () fumaramide, FA and/or () curcumin, CUR; respectively; where () is the surfactant molecules in the polymer chains.
Figure 2.
Scheme of the chemical structure of synthesized nanoparticles with a () methyl methacrylate MMA core and a shell of () acrylic acid, AA; () fumaramide, FA and/or () curcumin, CUR; respectively; where () is the surfactant molecules in the polymer chains.
) methyl methacrylate MMA core and a shell of () acrylic acid, AA; () fumaramide, FA and/or () curcumin, CUR; respectively; where () is the surfactant molecules in the polymer chains.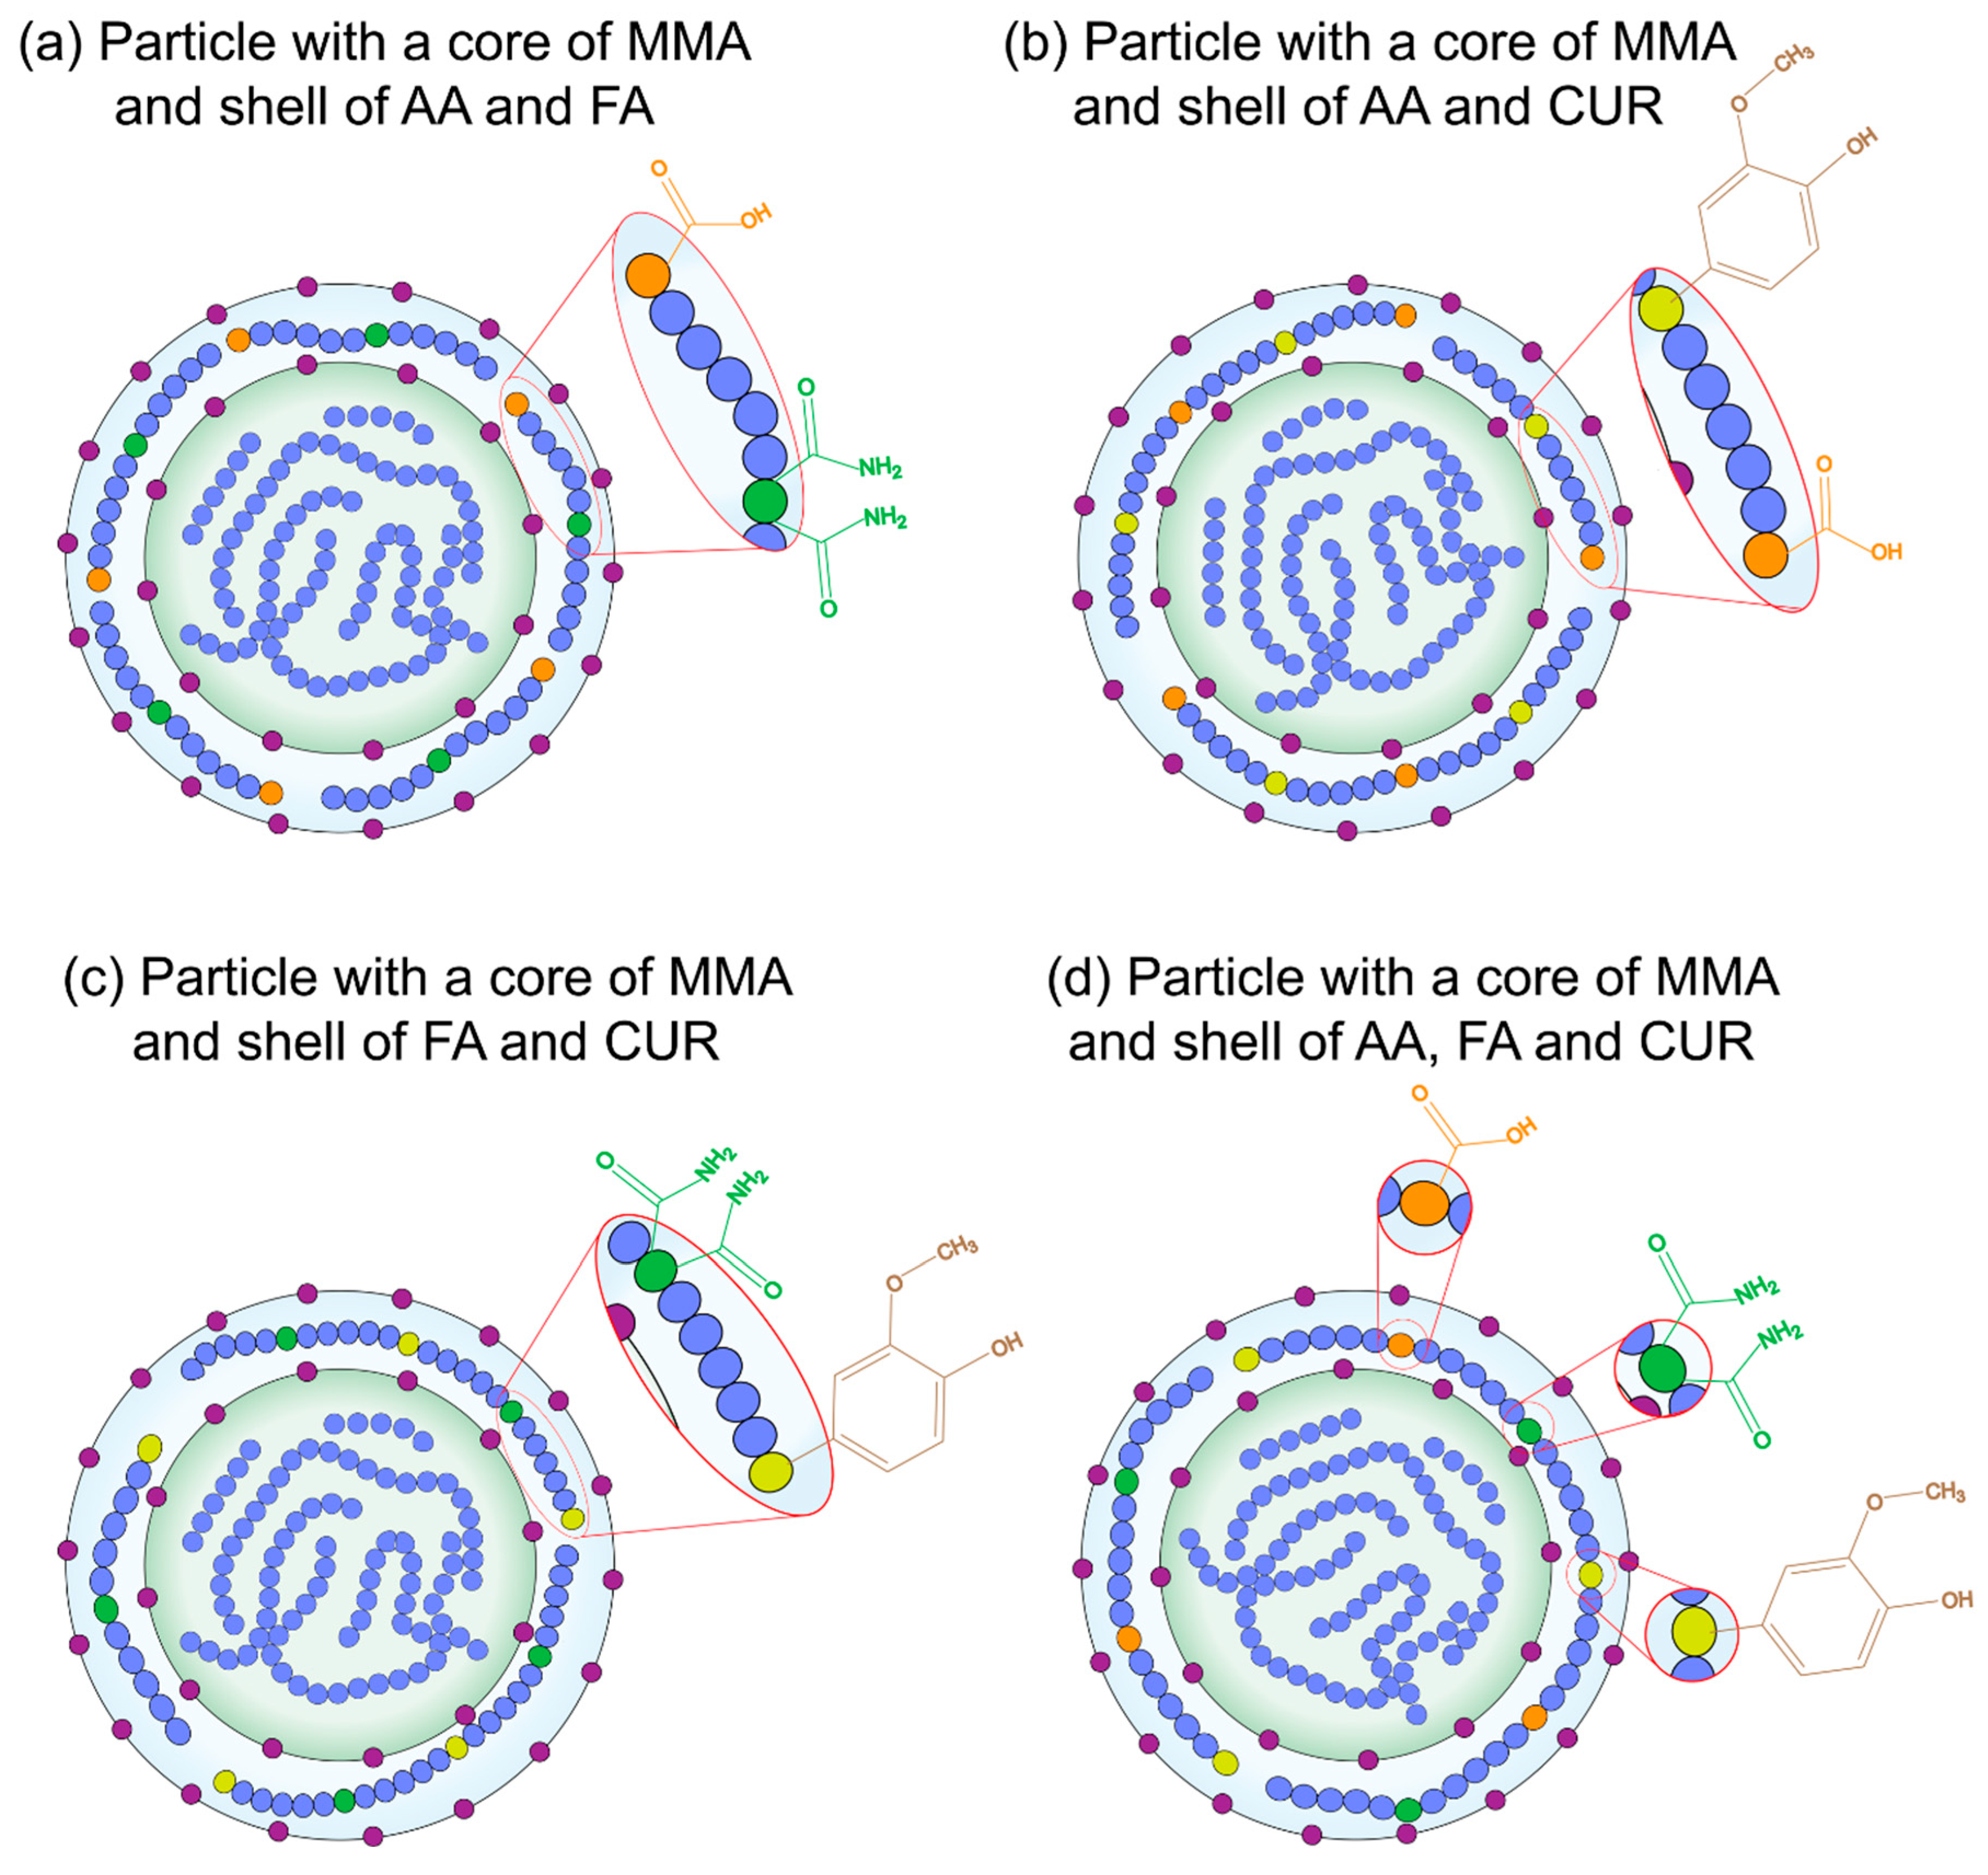
Figure 3.
Illustration of the polymerization process of nanoparticles poly(AA:FA:CUR).
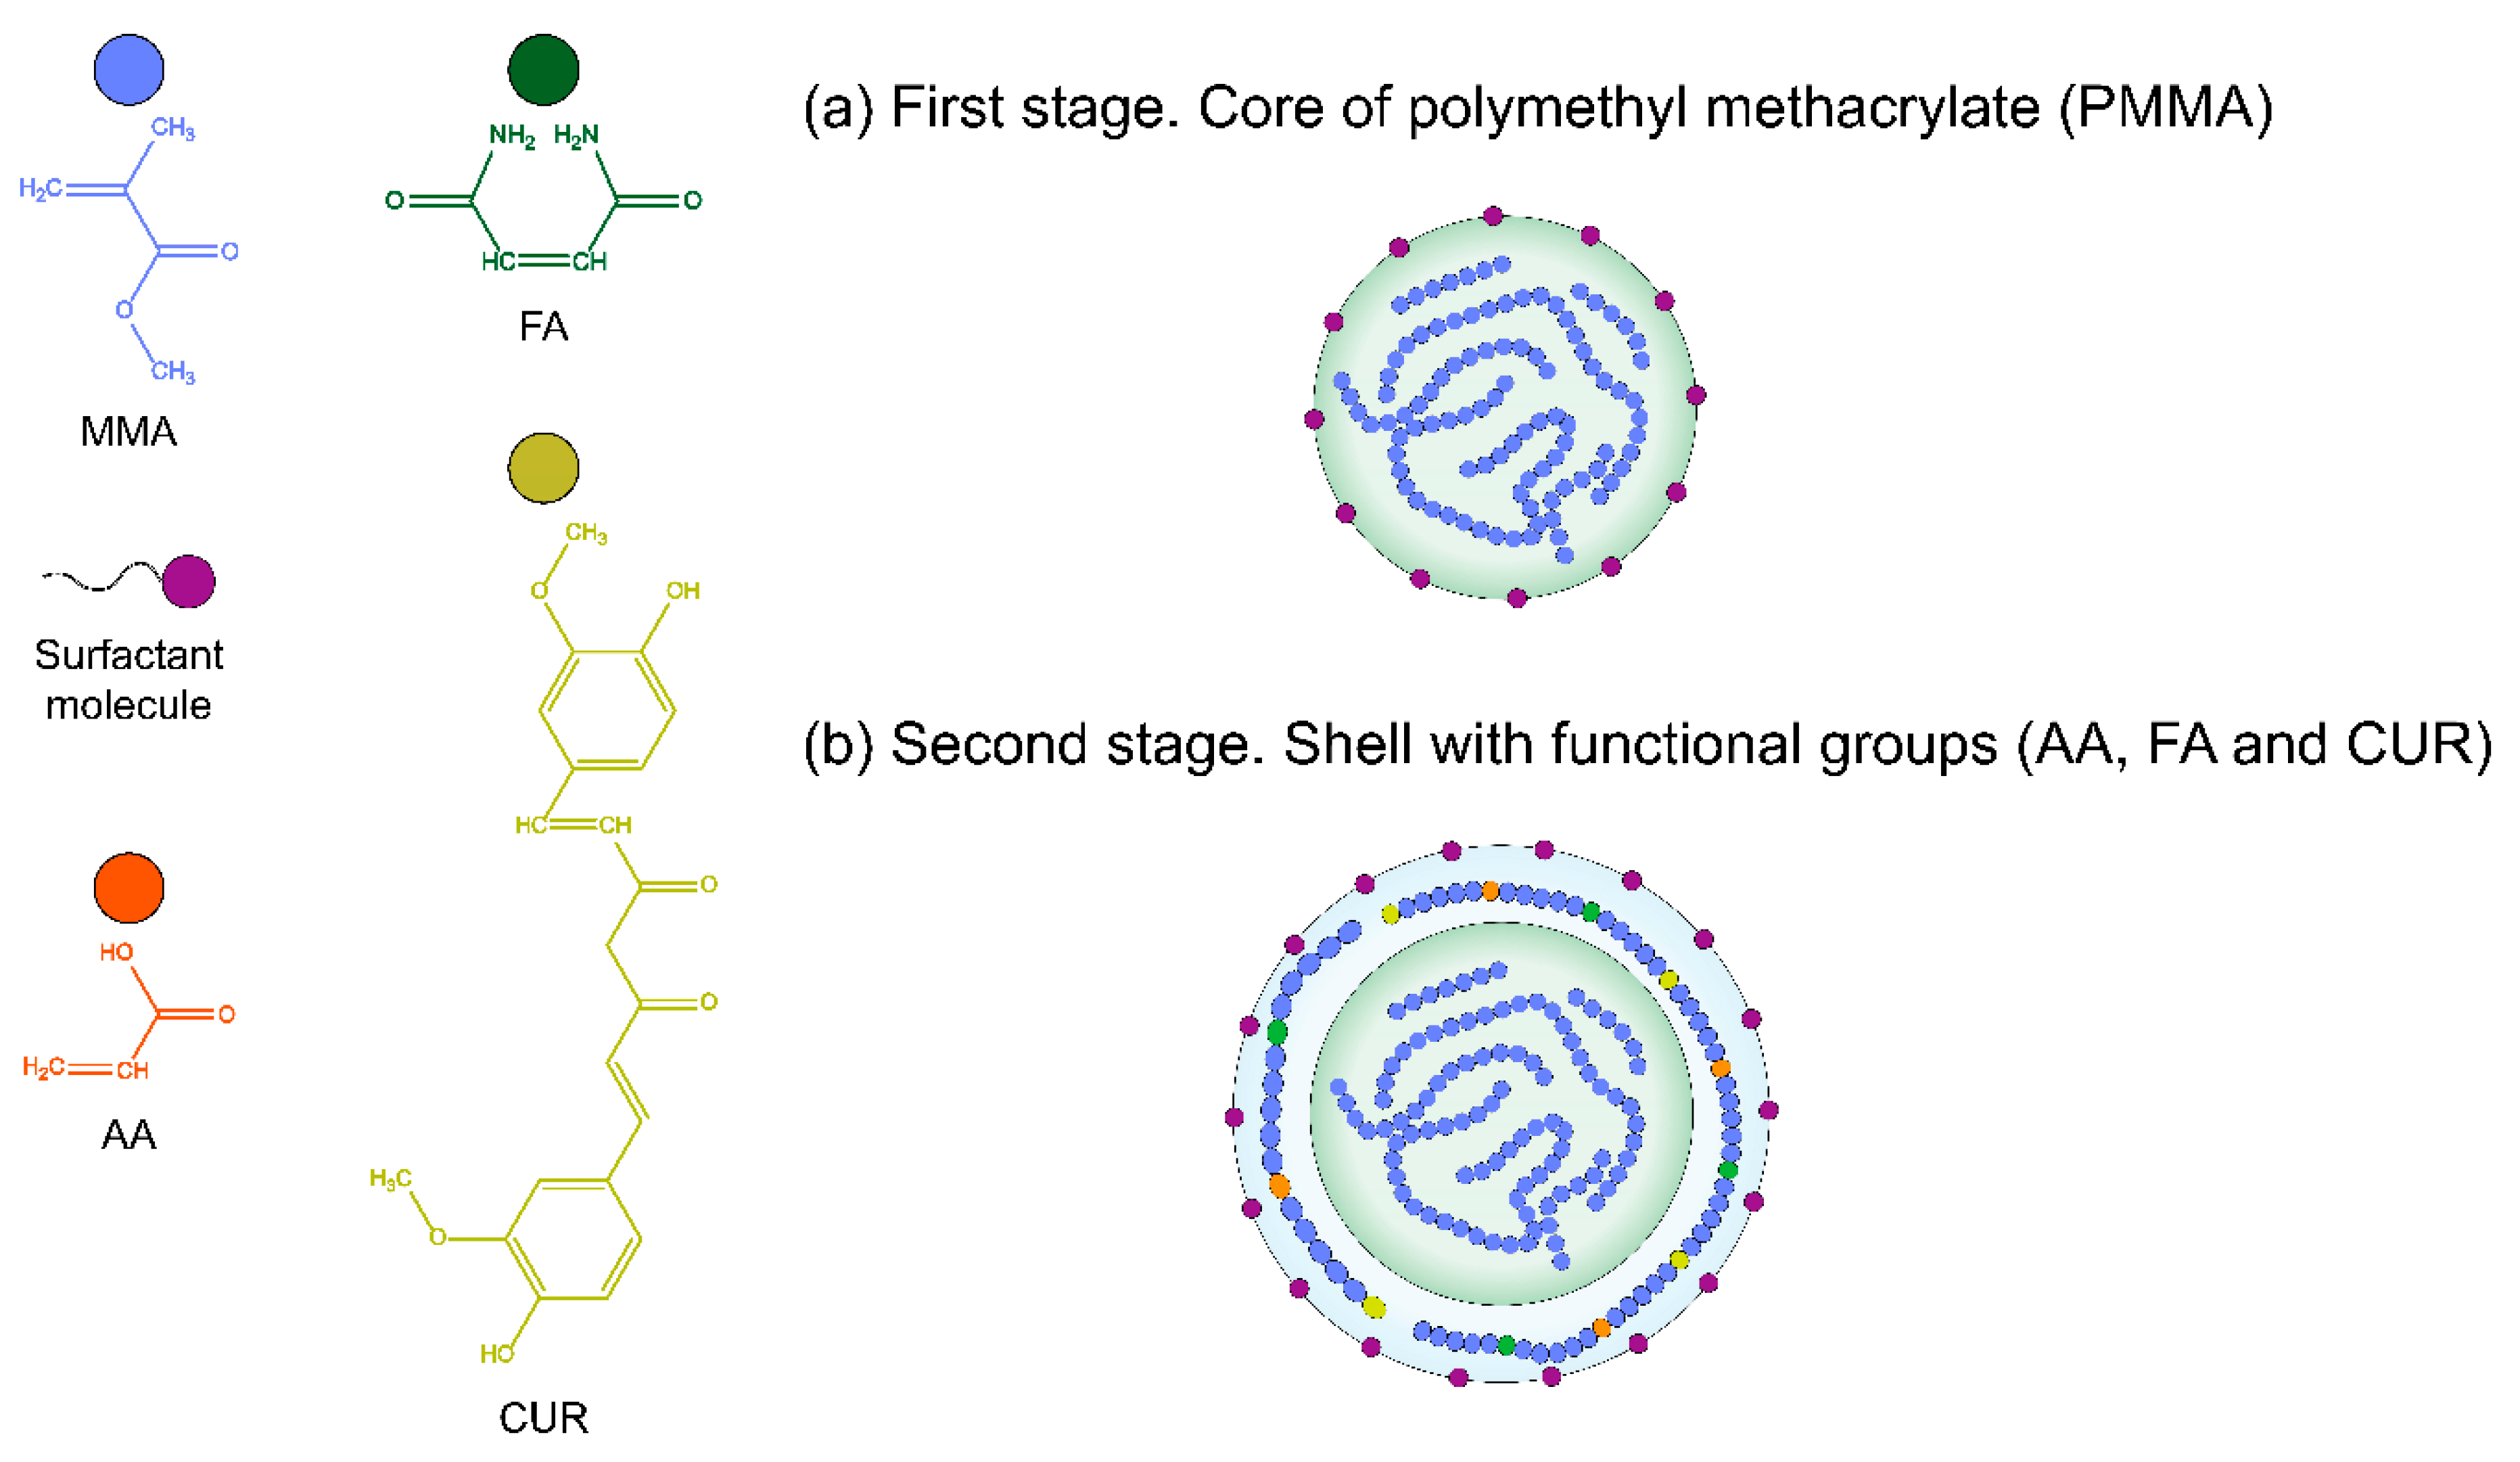
Figure 4.
Zeta potential (ζ) of materials Poly(AA:FA) for (a, b): 1 wt.%, (c, d): 3 wt.% and (e, f): 5 wt.% of chelating agents as function of concentration of calcium chloride (CaCl2) and magnesium chloride (MgCl2).
Figure 4.
Zeta potential (ζ) of materials Poly(AA:FA) for (a, b): 1 wt.%, (c, d): 3 wt.% and (e, f): 5 wt.% of chelating agents as function of concentration of calcium chloride (CaCl2) and magnesium chloride (MgCl2).
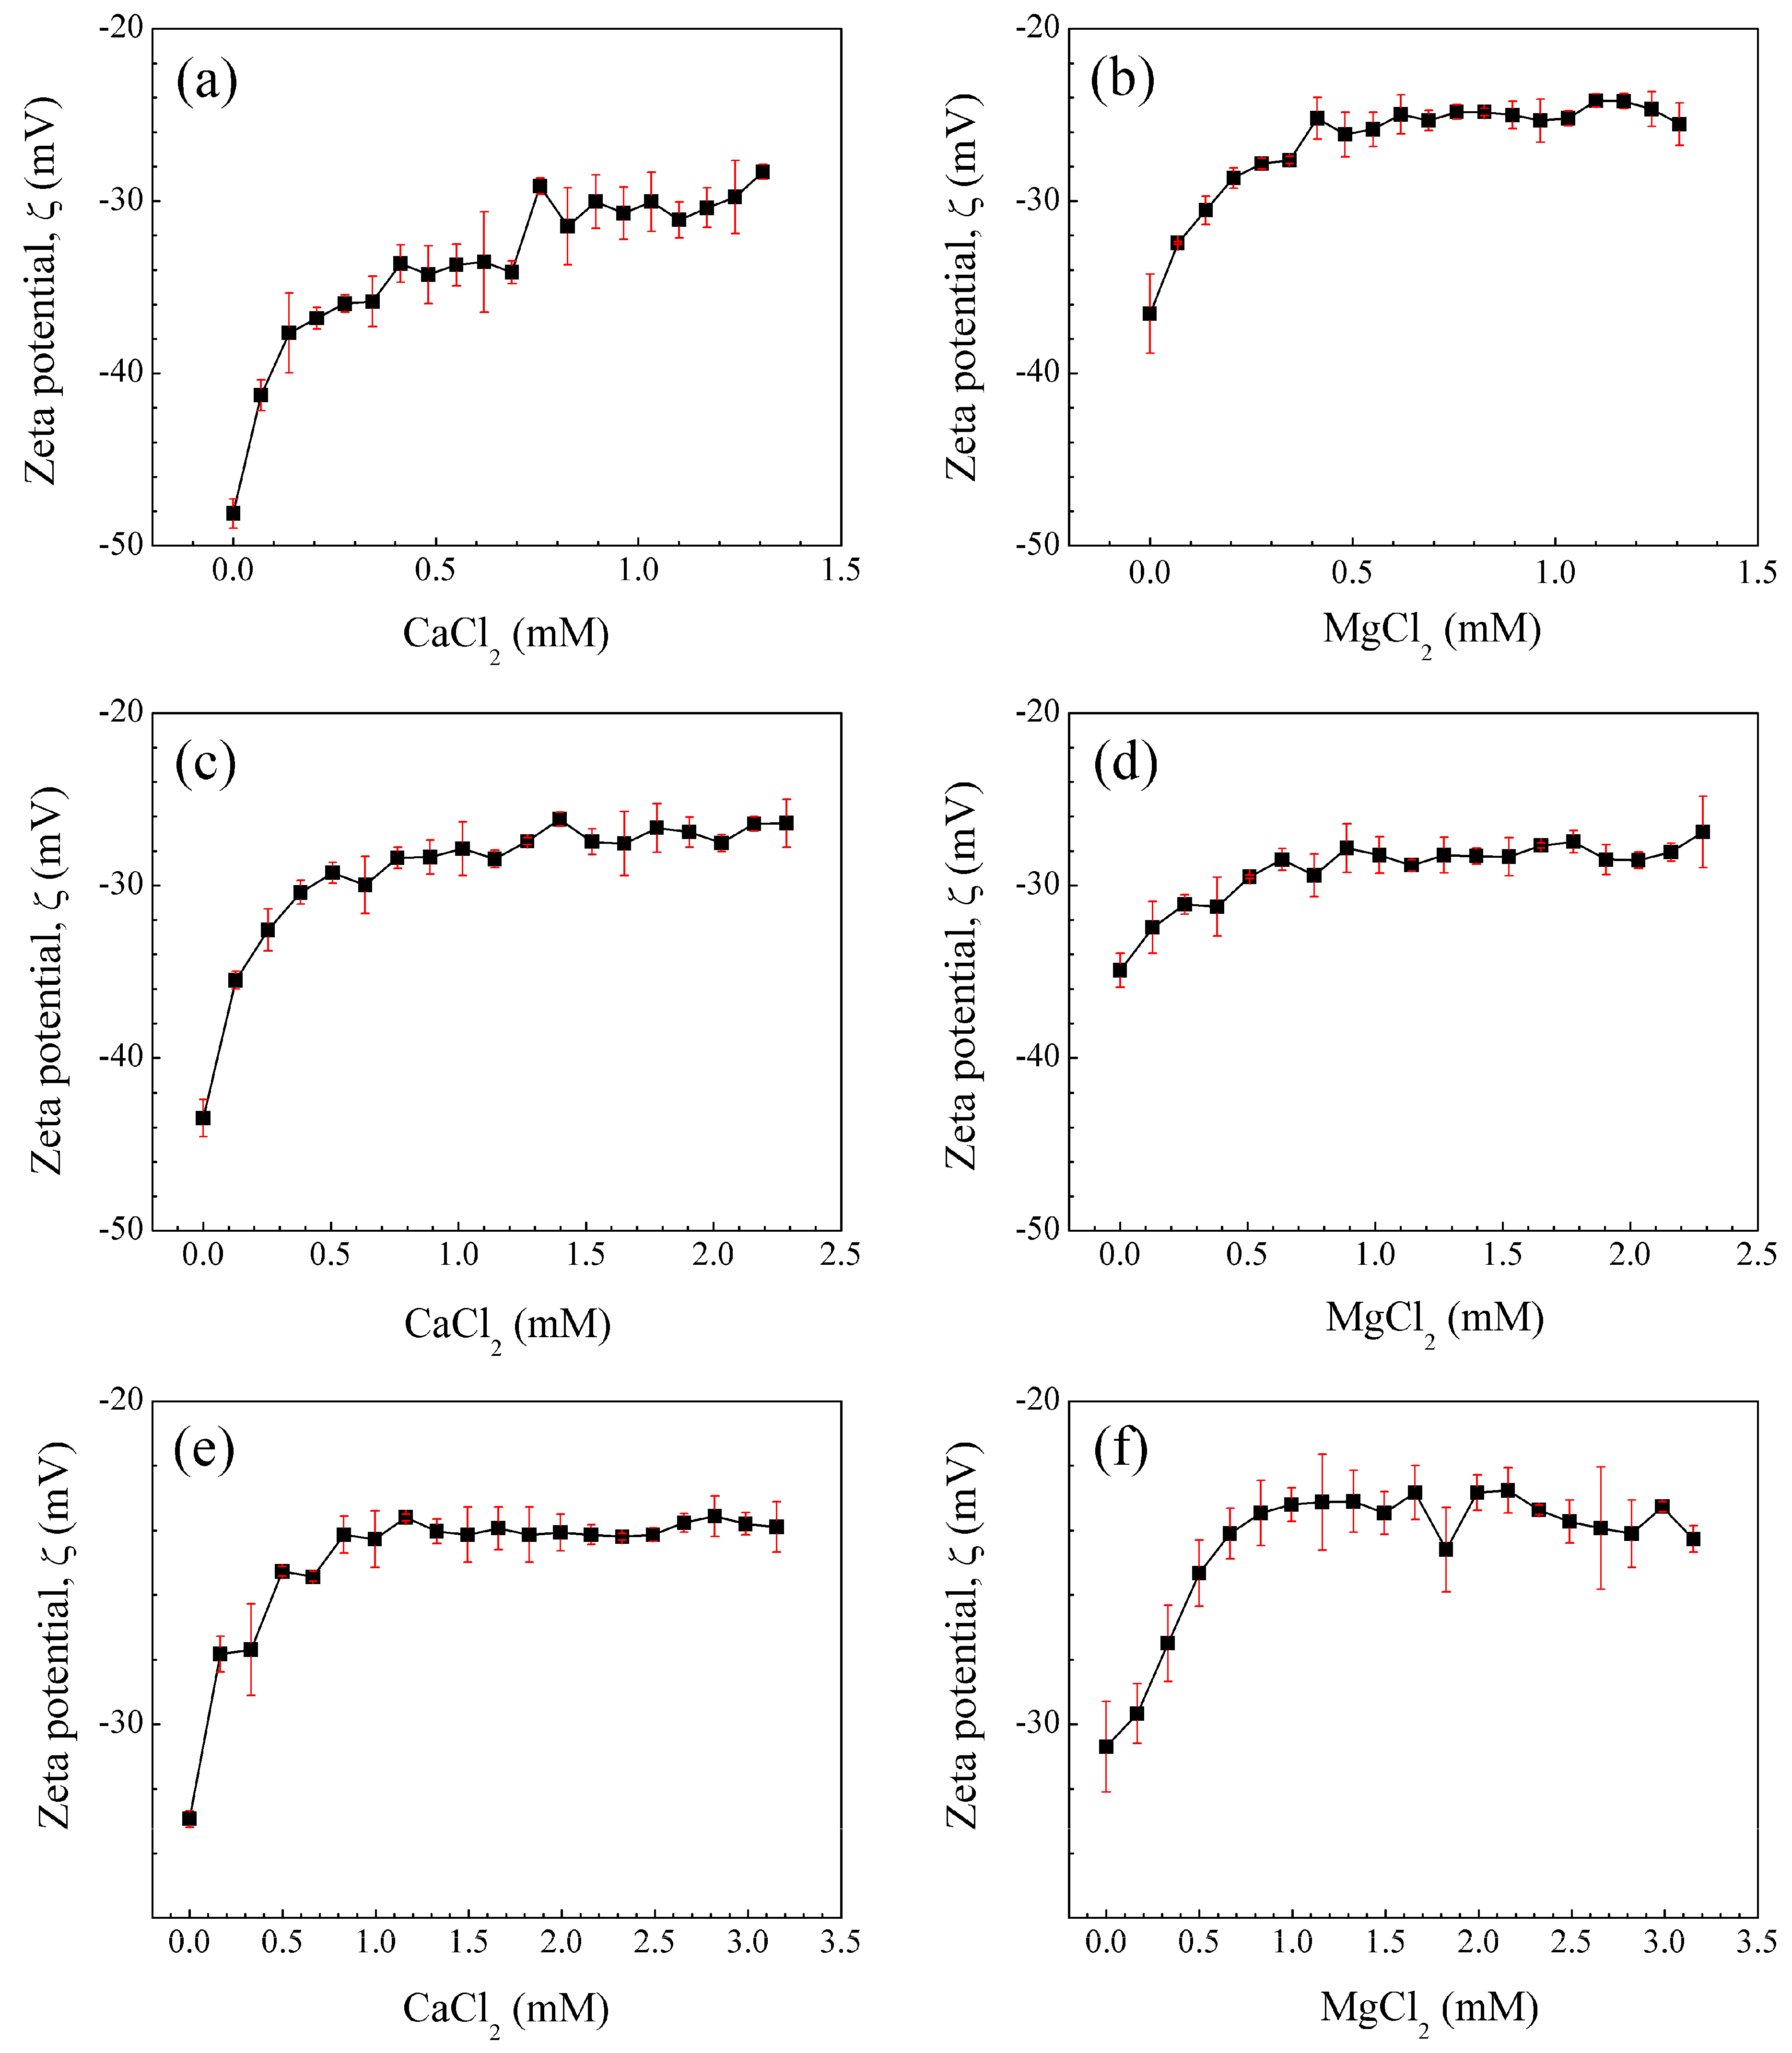
Figure 5.
FT-IR spectra of copolymers with 5 wt.% of chelating agents: (—) Poly(AA:FA), (—) Poly(AA:CUR), (—) Poly(FA:CUR) and (—) Poly(AA:FA:CUR).
Figure 5.
FT-IR spectra of copolymers with 5 wt.% of chelating agents: (—) Poly(AA:FA), (—) Poly(AA:CUR), (—) Poly(FA:CUR) and (—) Poly(AA:FA:CUR).
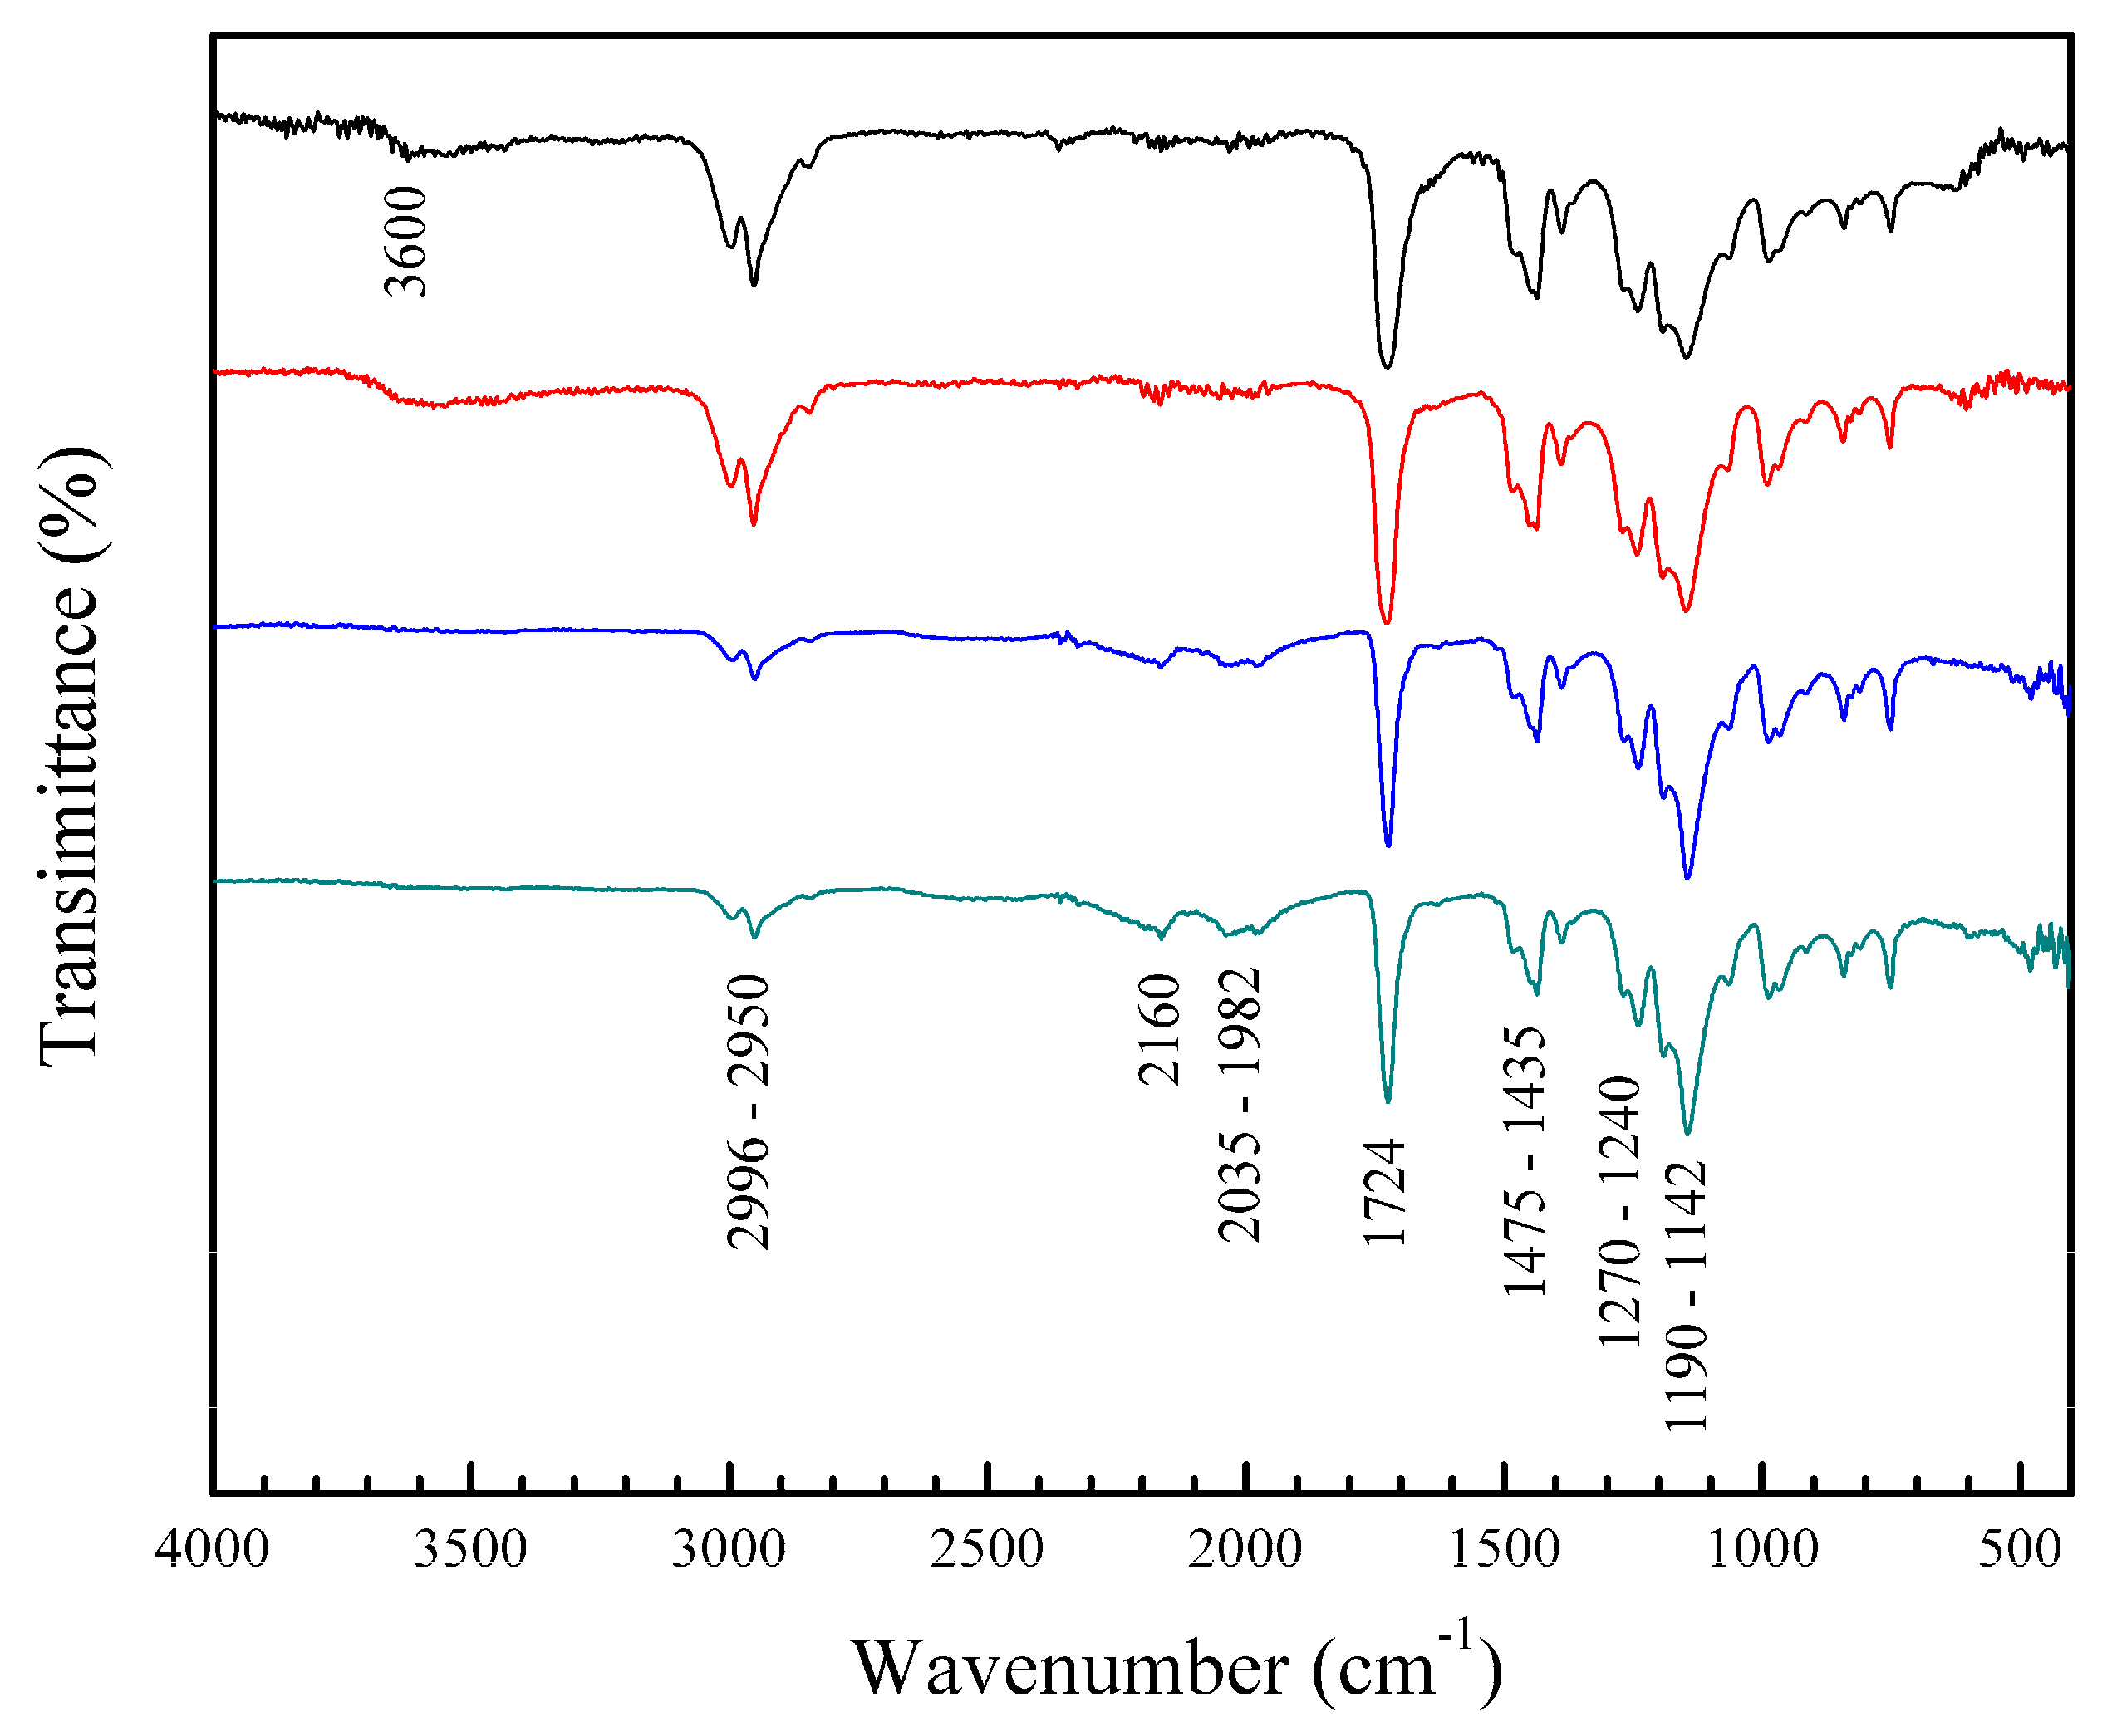
Figure 6.
FT-IR spectra of copolymers Poly(AA–co–FA) with 5 wt.% of chelating agents non-titrated and titrated with the calcium chloride (CaCl2) and magnesium chloride (MgCl2) solutions: (—) Poly(AA:FA), (—) Poly(AA:FA)–Ca2+ and (—) Poly(AA:FA)–Mg2+.
Figure 6.
FT-IR spectra of copolymers Poly(AA–co–FA) with 5 wt.% of chelating agents non-titrated and titrated with the calcium chloride (CaCl2) and magnesium chloride (MgCl2) solutions: (—) Poly(AA:FA), (—) Poly(AA:FA)–Ca2+ and (—) Poly(AA:FA)–Mg2+.
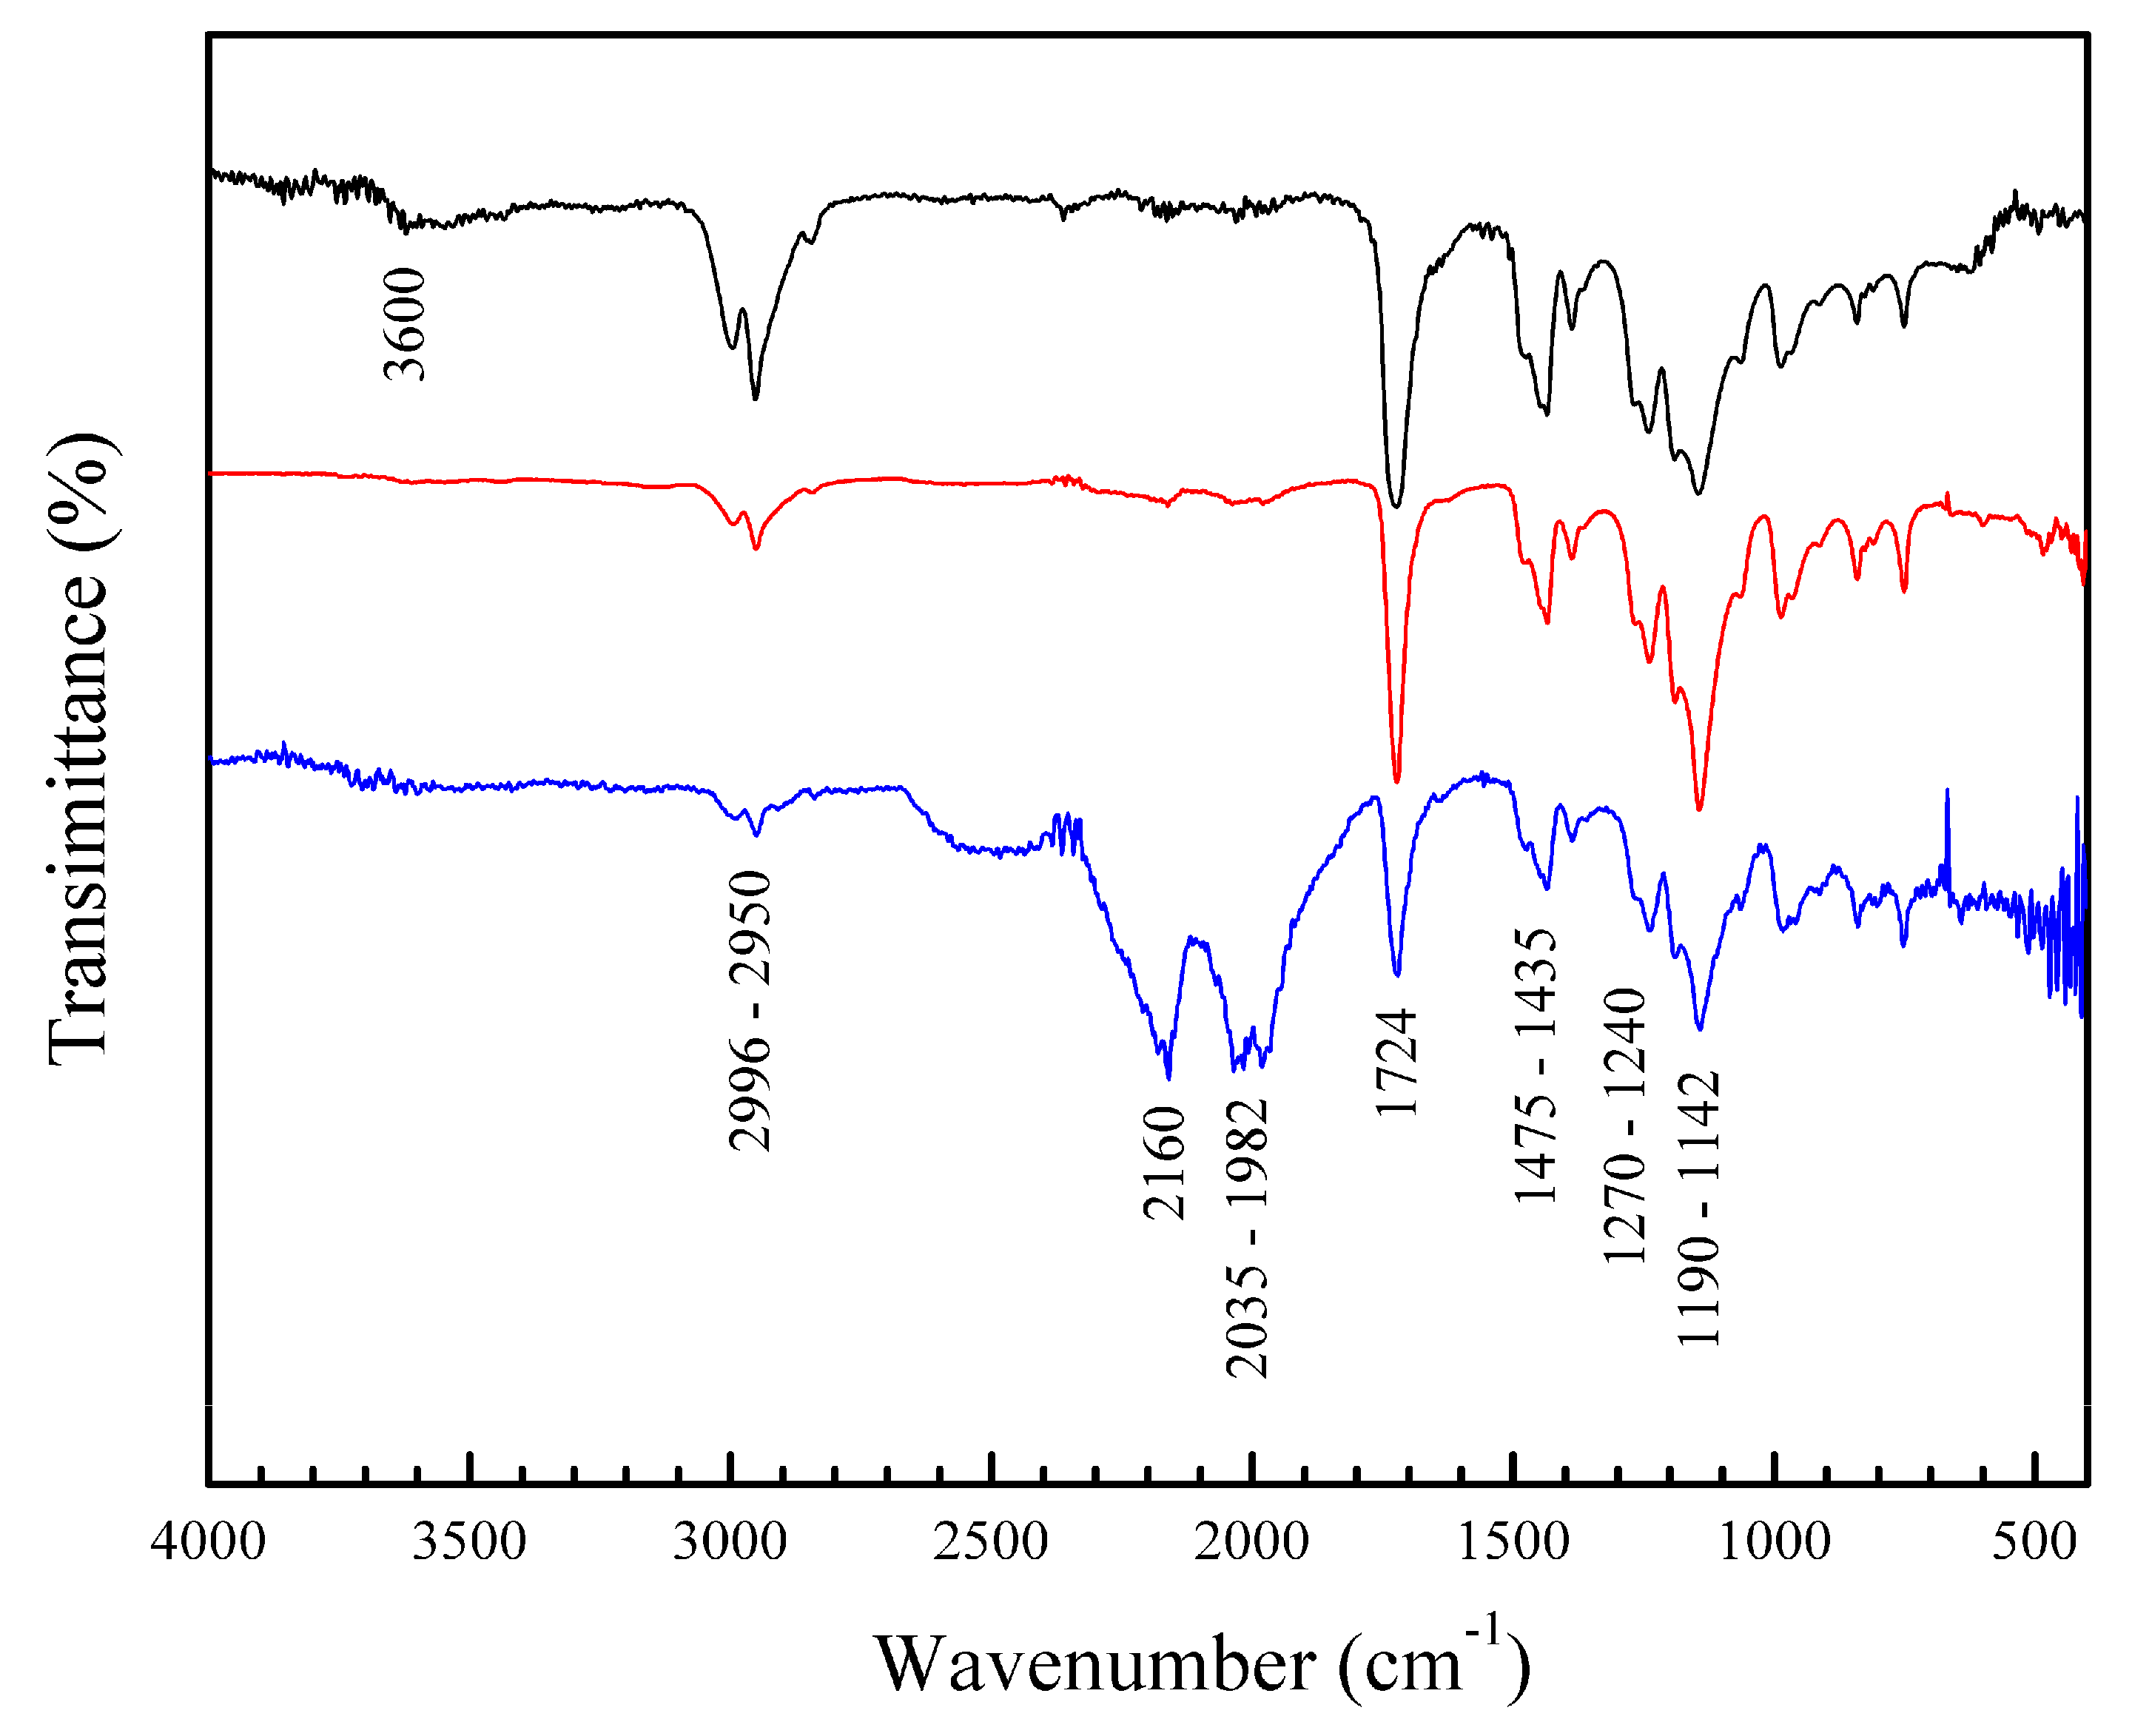
Figure 7.
UV-Vis spectra of copolymers with 5 wt.% of chelating agents: (a) Poly(AA:FA), (b) Poly(AA:CUR), (c) Poly(FA:CUR) and (d) Poly(AA:FA:CUR) before and after the titration assessment. Where: (---) -CaCl2 and (---) -MgCl2.
Figure 7.
UV-Vis spectra of copolymers with 5 wt.% of chelating agents: (a) Poly(AA:FA), (b) Poly(AA:CUR), (c) Poly(FA:CUR) and (d) Poly(AA:FA:CUR) before and after the titration assessment. Where: (---) -CaCl2 and (---) -MgCl2.
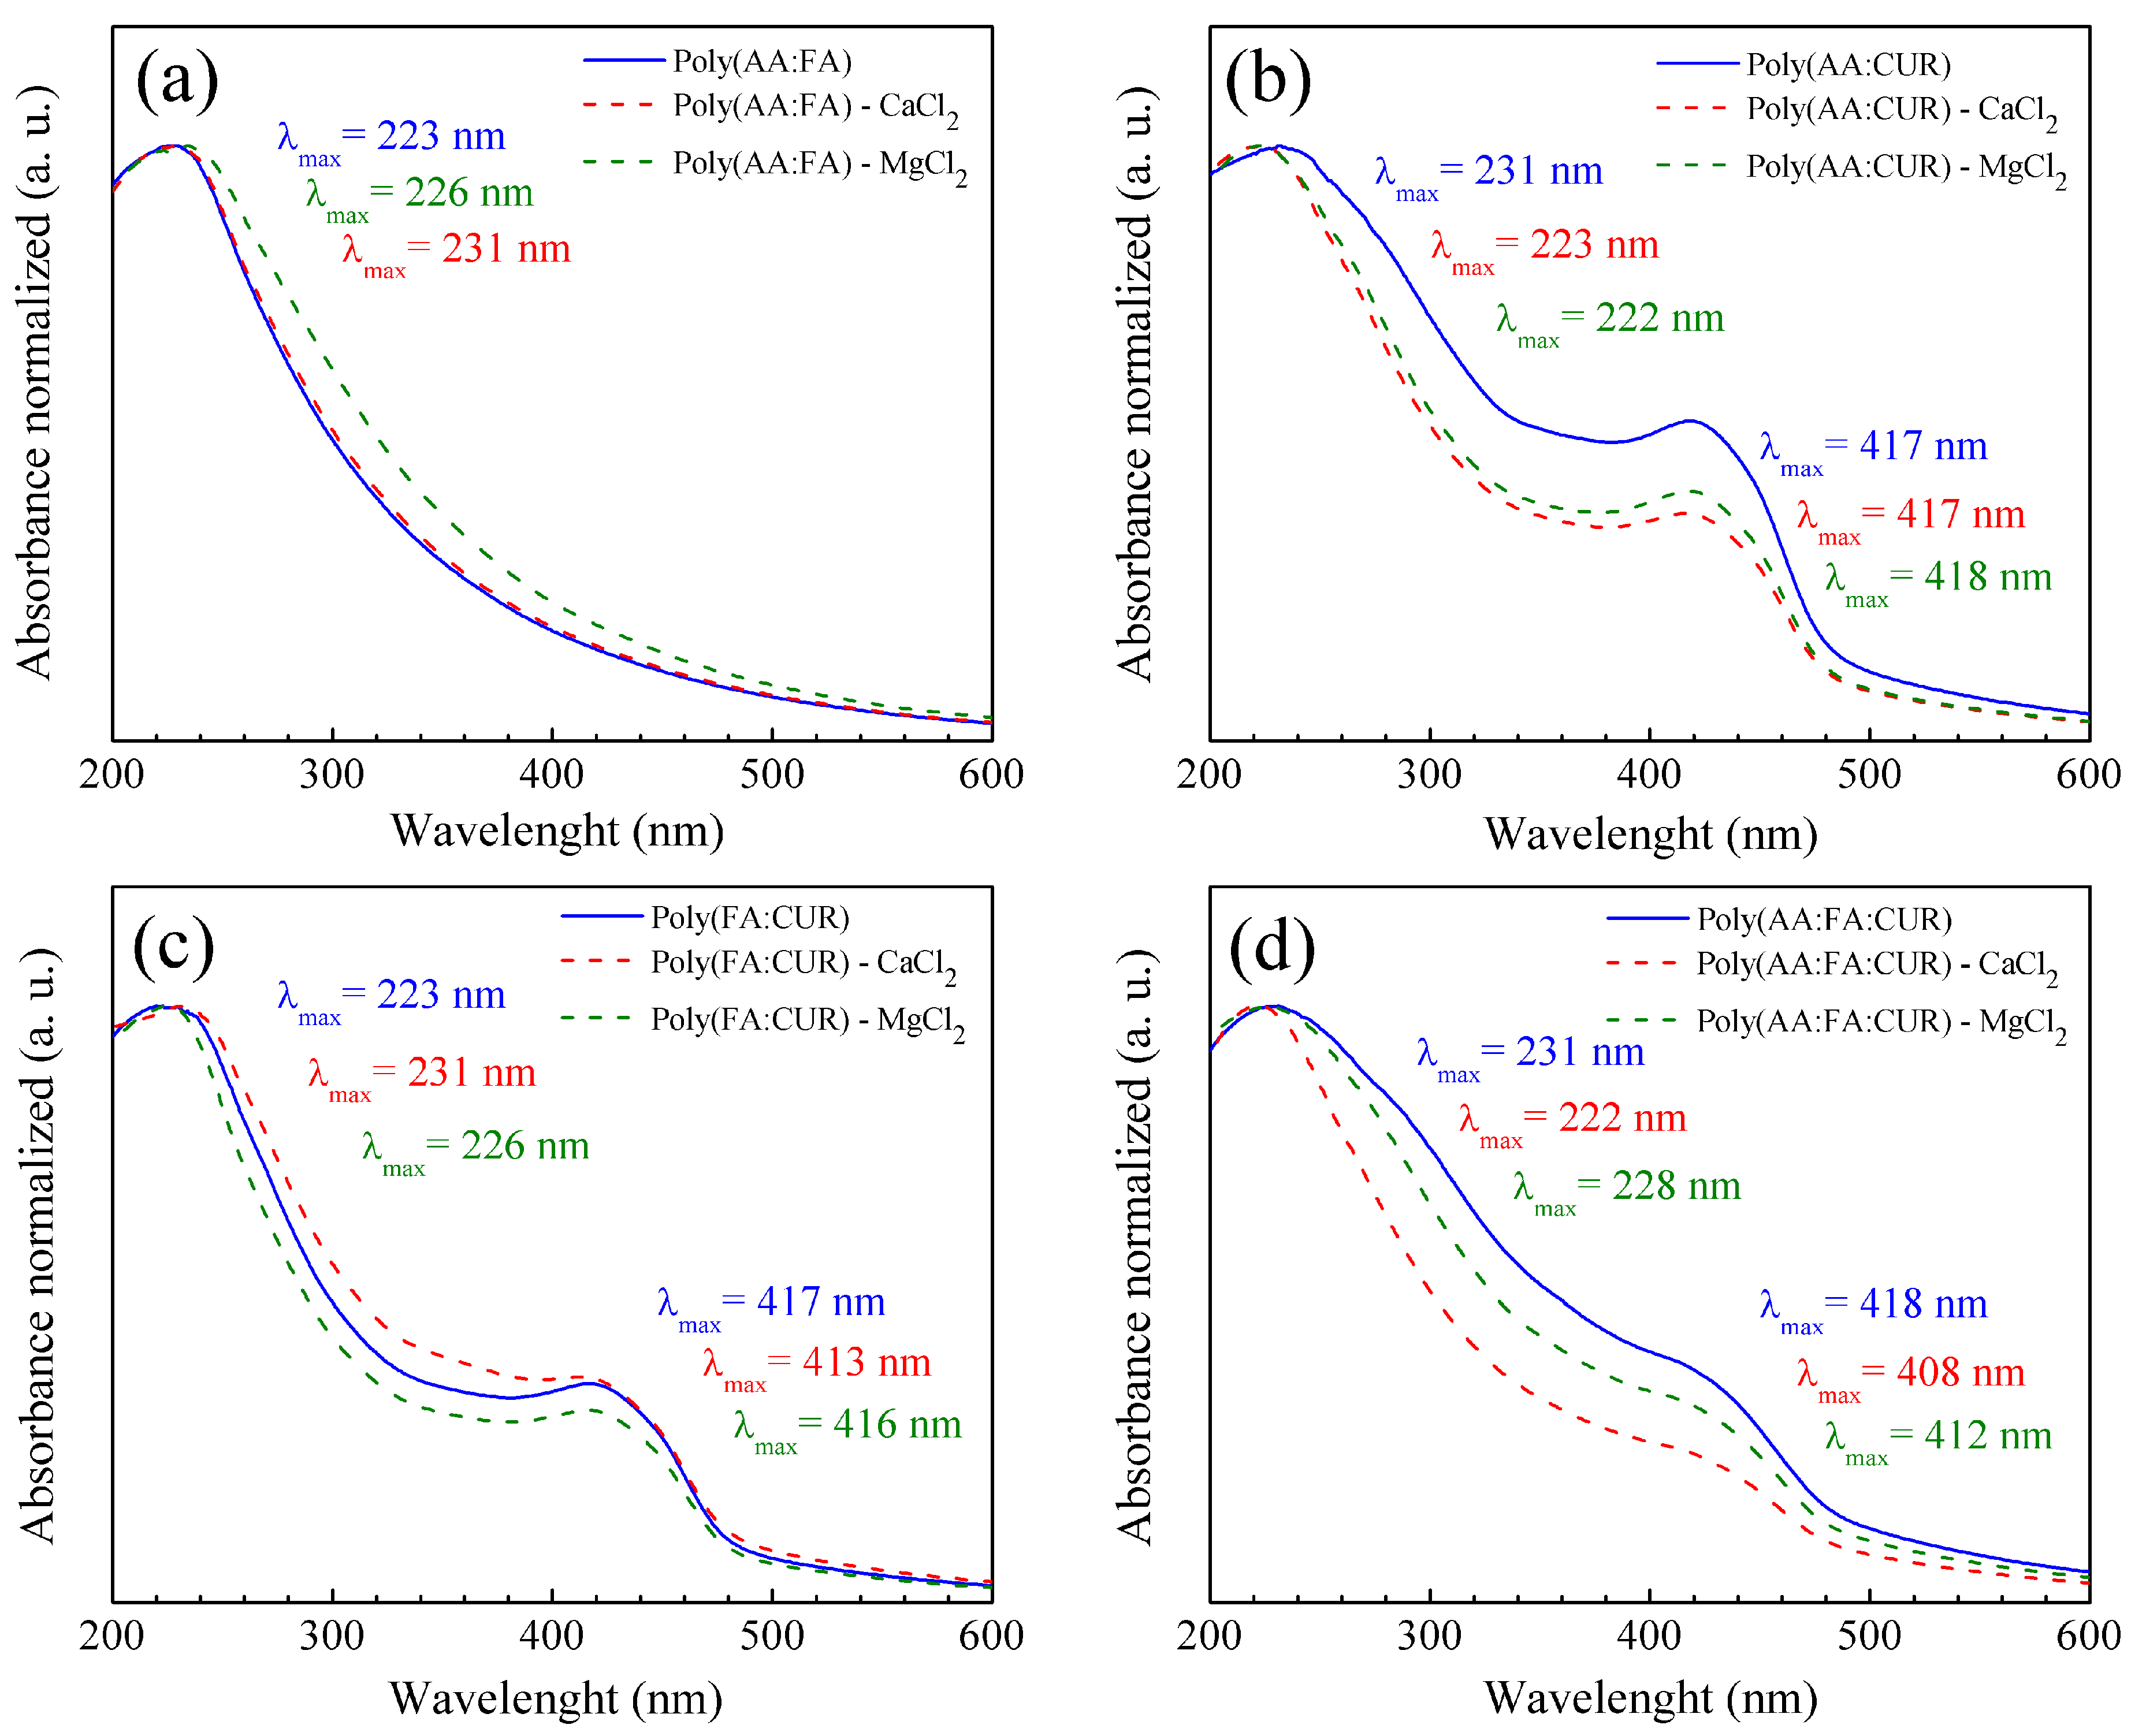
Figure 8.
Scheme of interactions bonding between Poly(AA:FA) and calcium (Ca2+) ions.
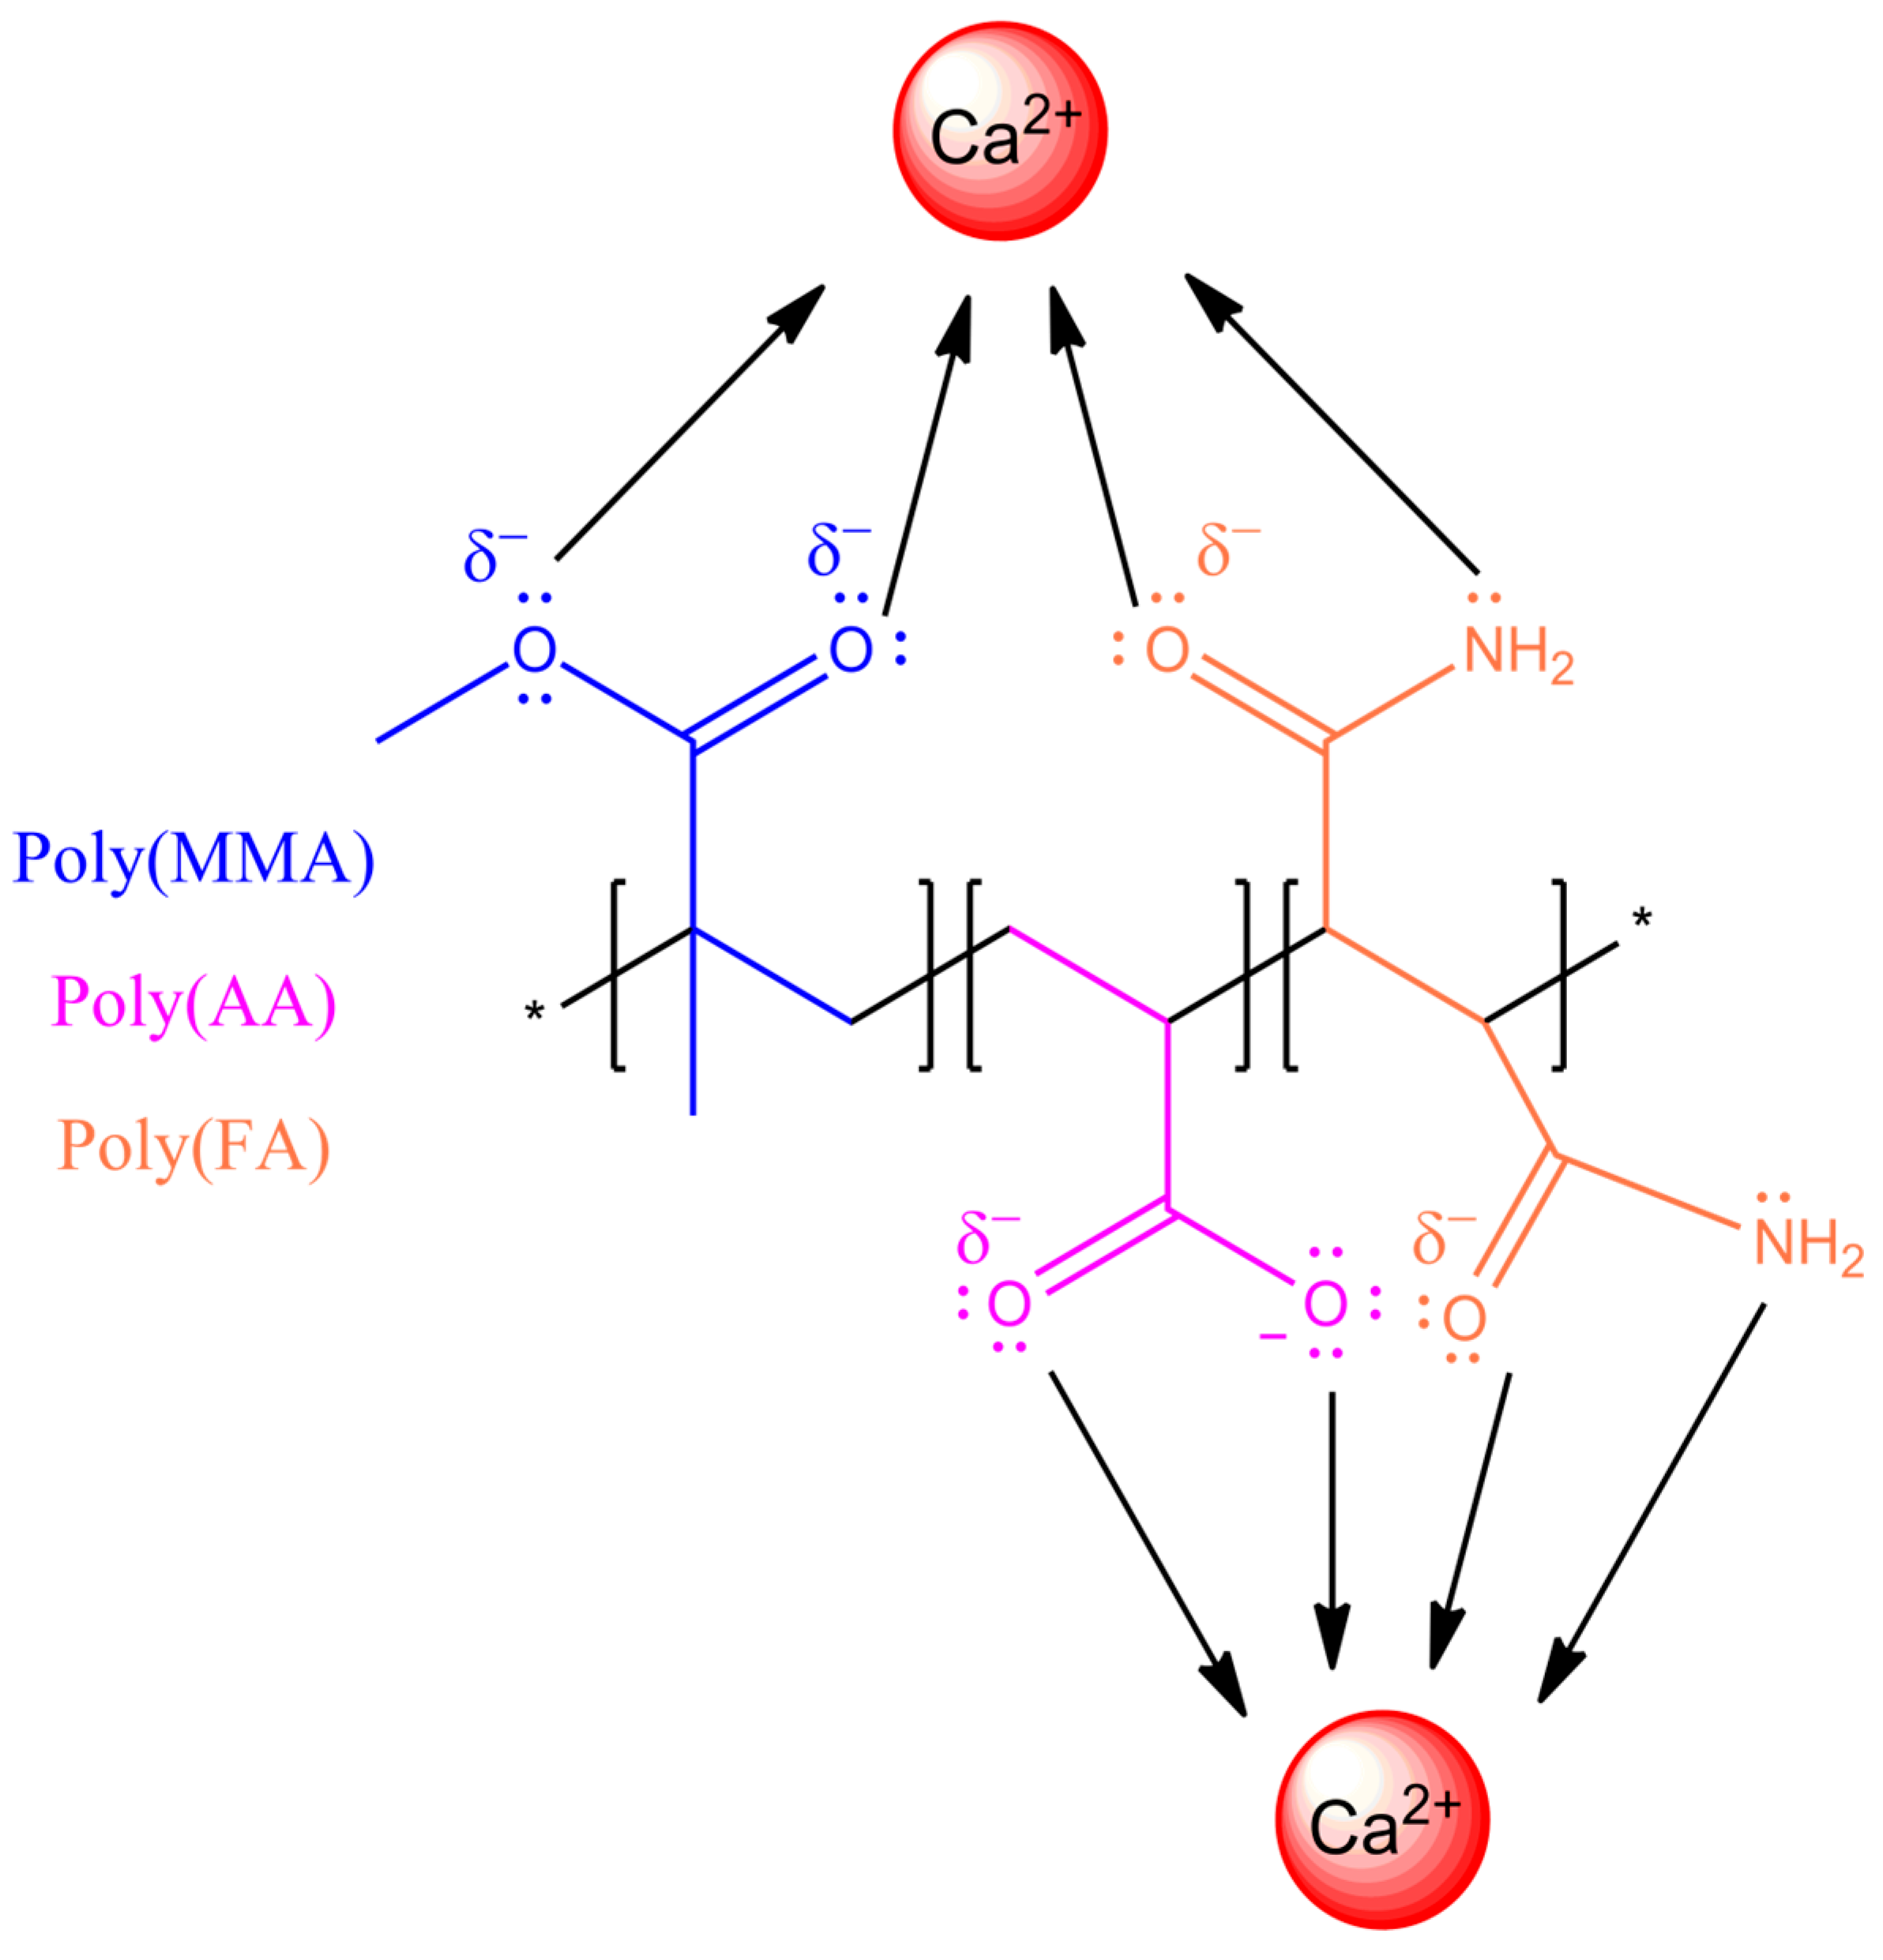
Figure 9.
Micrographs of copolymeric nanoparticles with 5 wt.% of chelating agents: (a) Poly(AA:FA), (b) Poly(AA:CUR), (c) Poly(FA:CUR), and (d) Poly(AA:FA:CUR).
Figure 9.
Micrographs of copolymeric nanoparticles with 5 wt.% of chelating agents: (a) Poly(AA:FA), (b) Poly(AA:CUR), (c) Poly(FA:CUR), and (d) Poly(AA:FA:CUR).
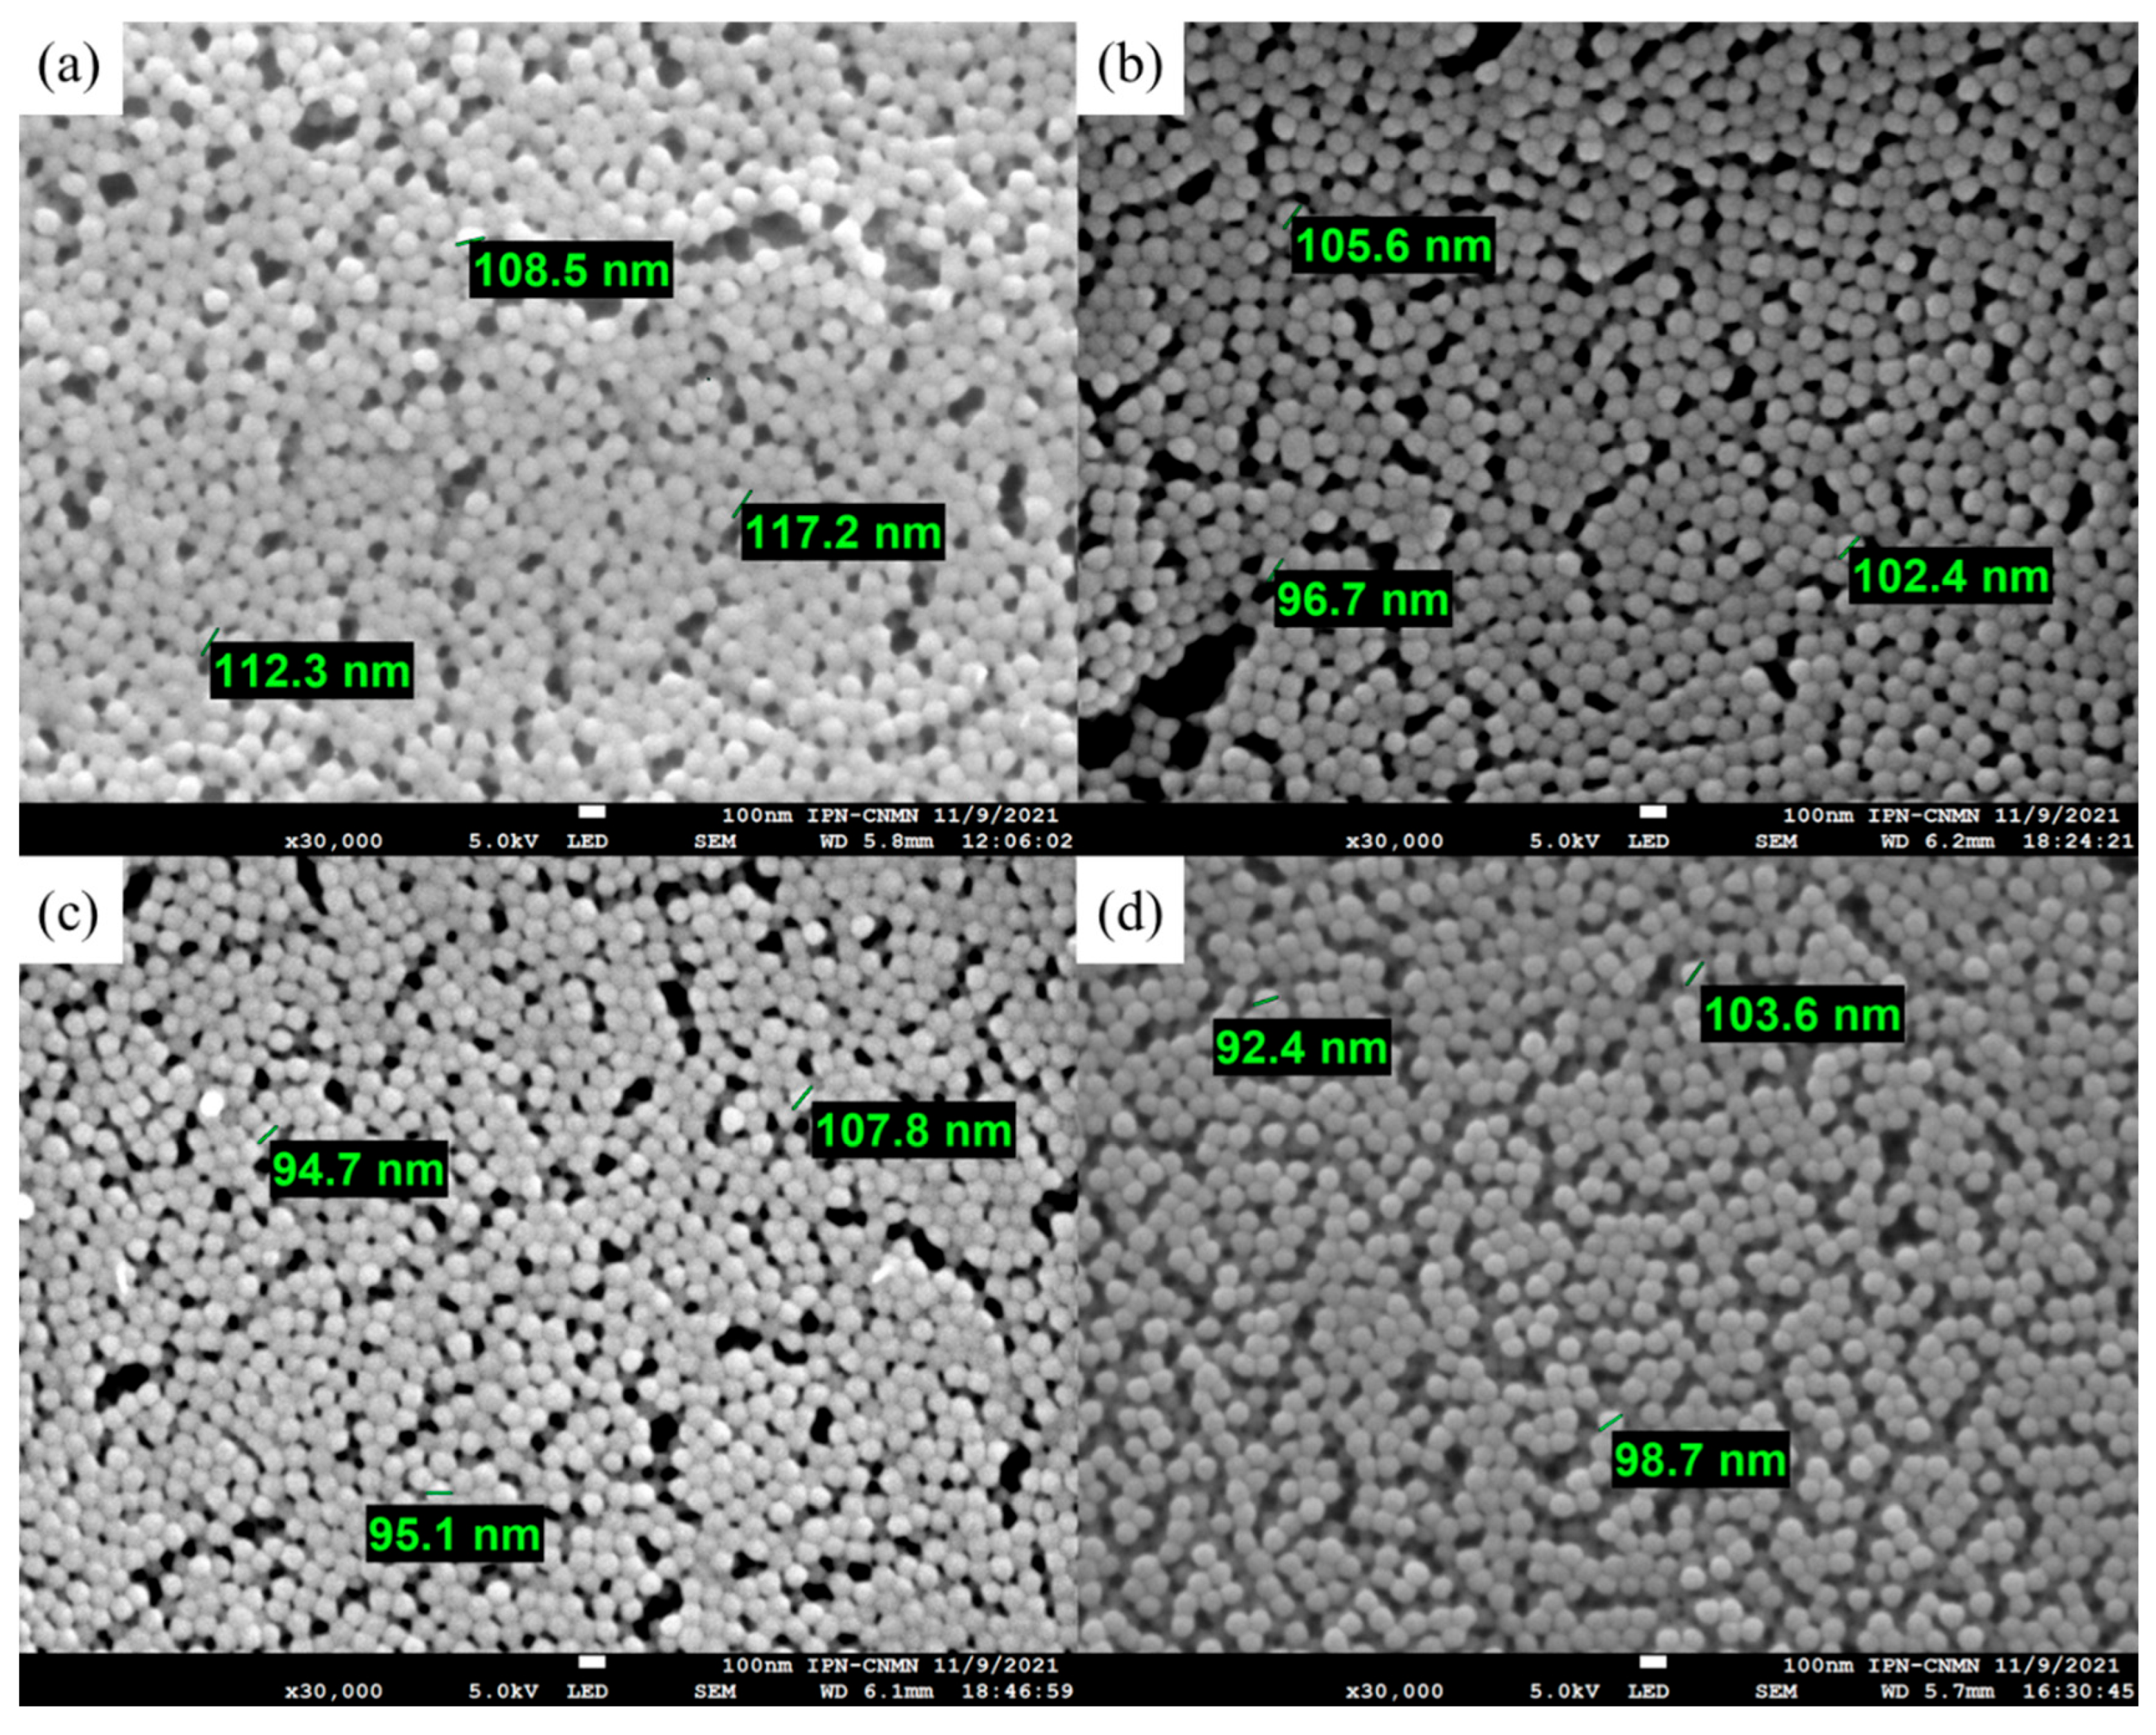
Figure 10.
Micrographs of copolymeric nanoparticles with 5 wt.% of chelating agents: (a) Poly(AA:FA), (b) Poly(AA:CUR), (c) Poly(FA:CUR), and (d) Poly(AA:FA:CUR) titrated with CaCl2.
Figure 10.
Micrographs of copolymeric nanoparticles with 5 wt.% of chelating agents: (a) Poly(AA:FA), (b) Poly(AA:CUR), (c) Poly(FA:CUR), and (d) Poly(AA:FA:CUR) titrated with CaCl2.
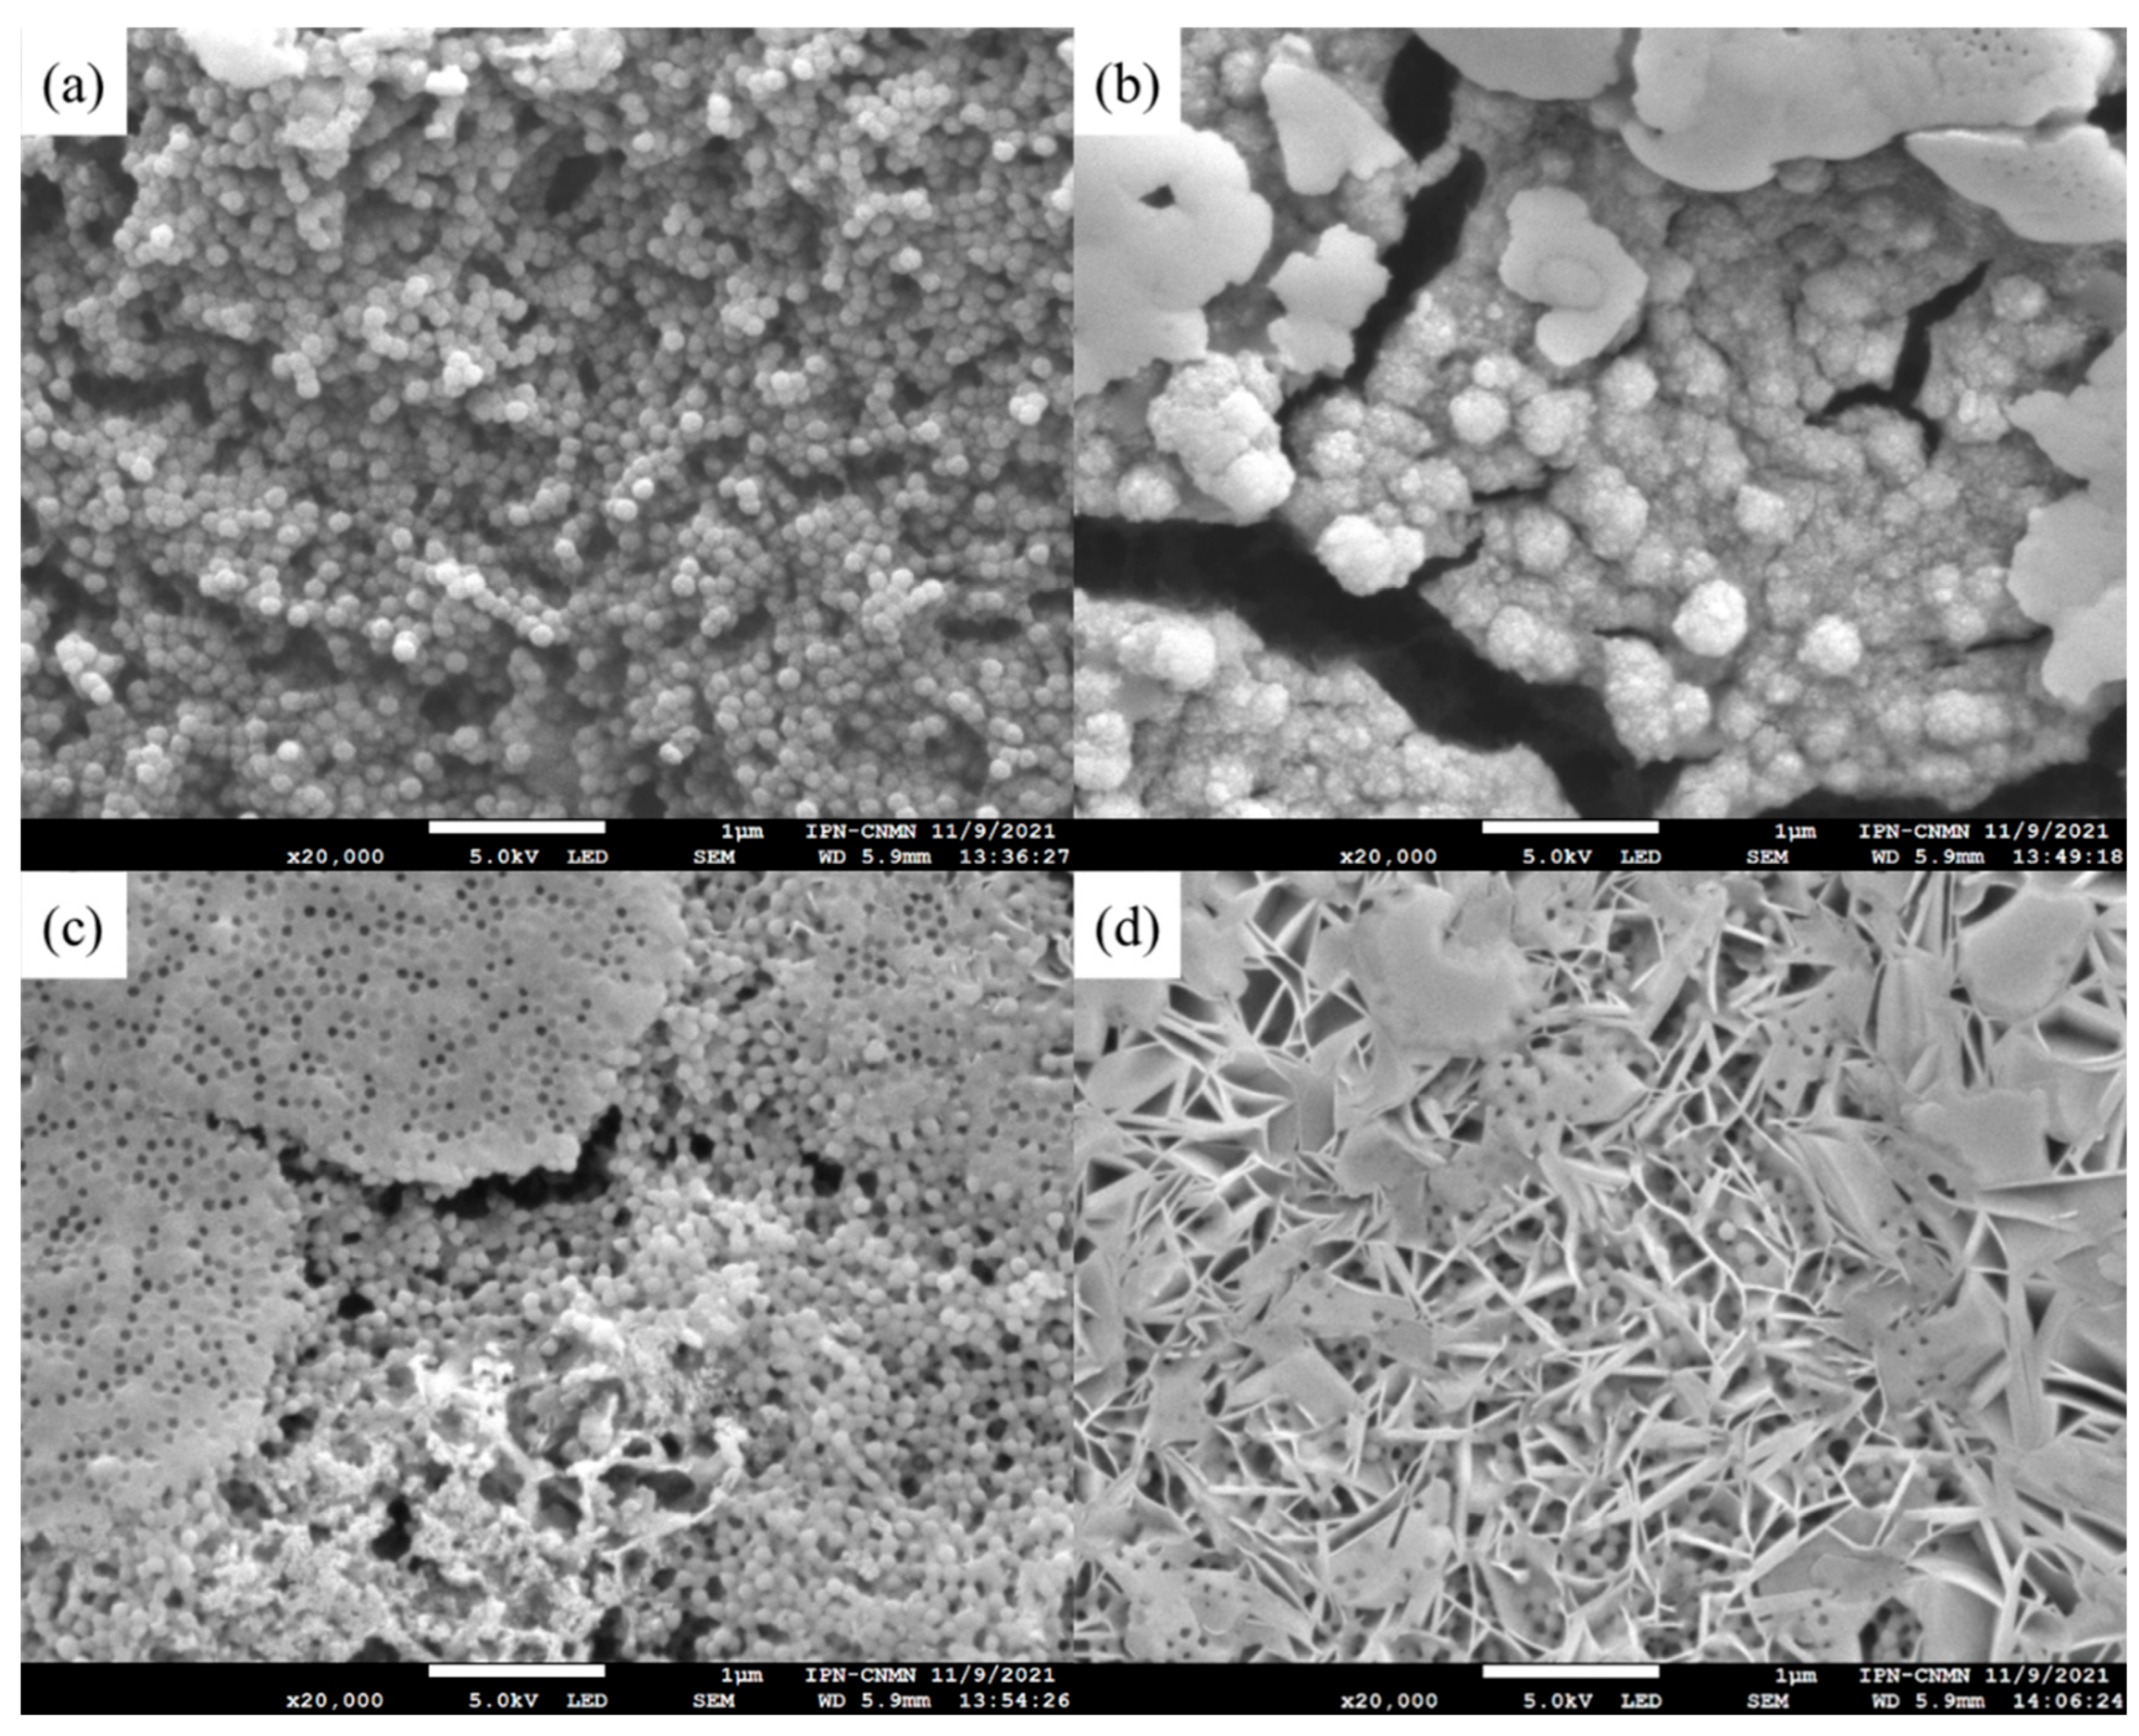
Figure 11.
Micrograph of copolymeric nanoparticles with 5 wt.% of chelating agents: (a) Poly(AA:FA), (b) Poly(AA:CUR), (c) Poly(FA:CUR), and (d) Poly(AA:FA:CUR) titrated with MgCl2.
Figure 11.
Micrograph of copolymeric nanoparticles with 5 wt.% of chelating agents: (a) Poly(AA:FA), (b) Poly(AA:CUR), (c) Poly(FA:CUR), and (d) Poly(AA:FA:CUR) titrated with MgCl2.
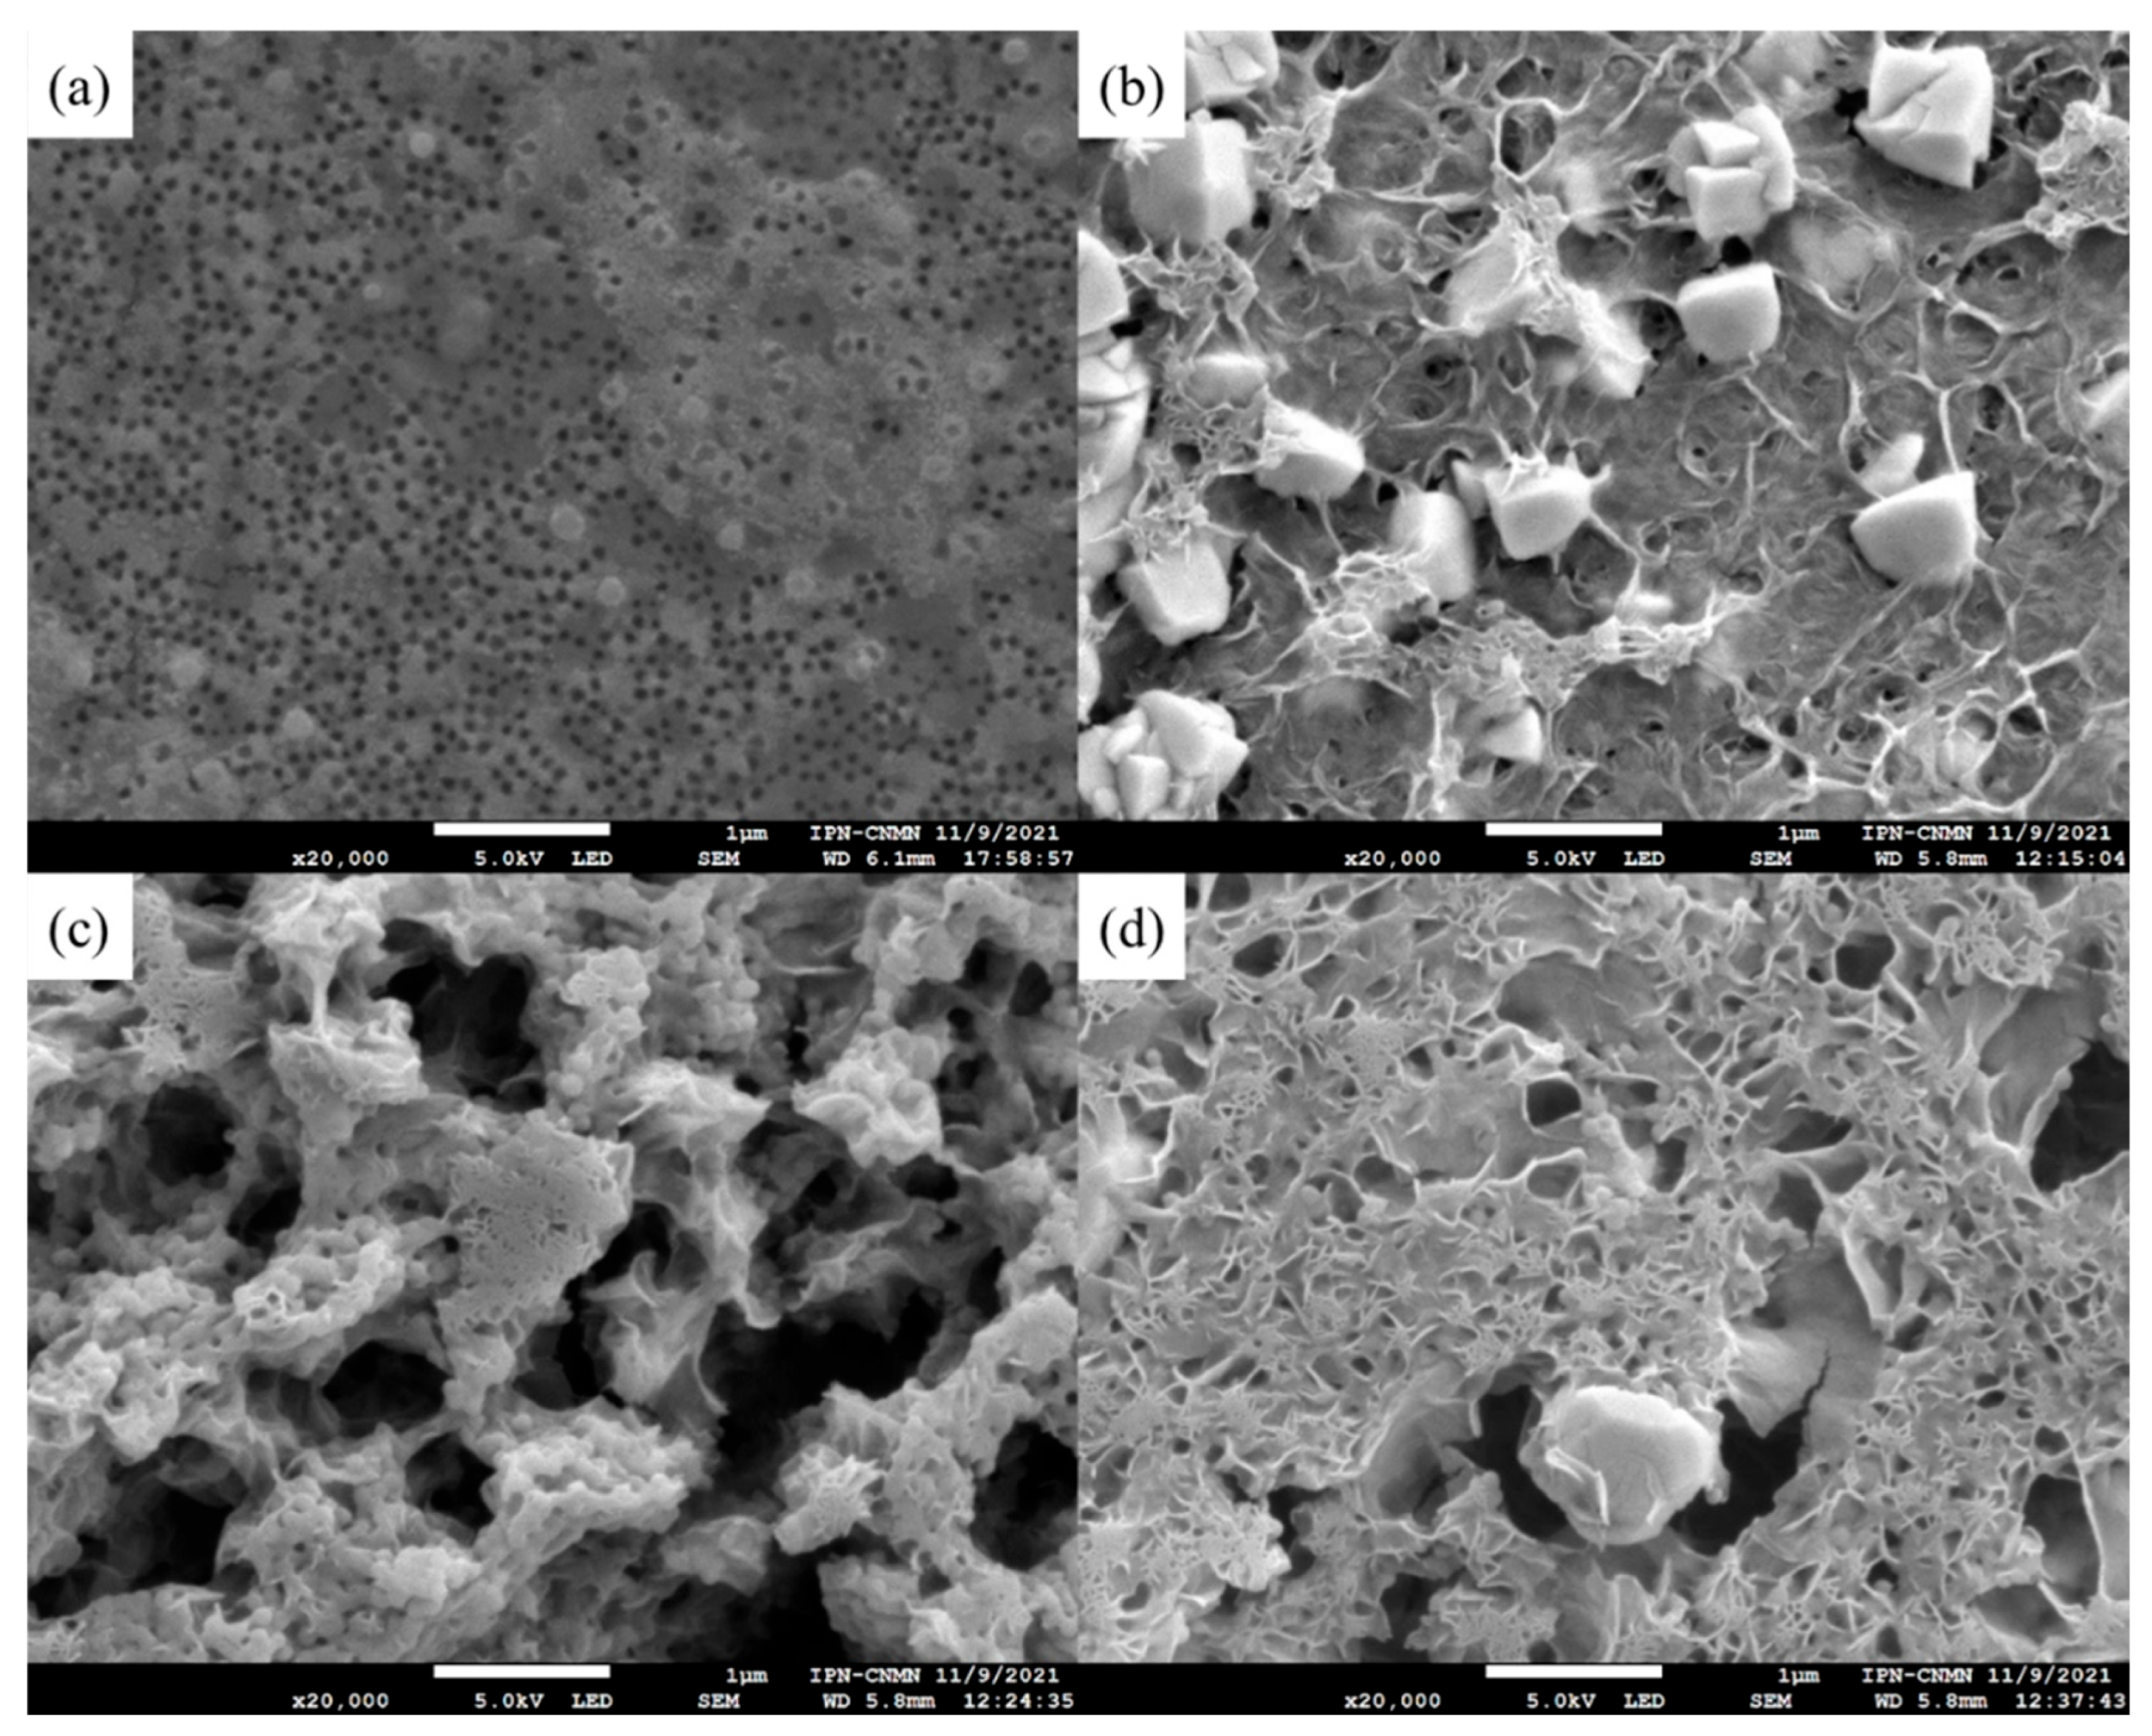
Figure 12.
PL spectra of copolymers with 5 wt.% of chelating agents: (a) Poly(AA:FA) and (b) Poly(FA:CUR).
Figure 12.
PL spectra of copolymers with 5 wt.% of chelating agents: (a) Poly(AA:FA) and (b) Poly(FA:CUR).
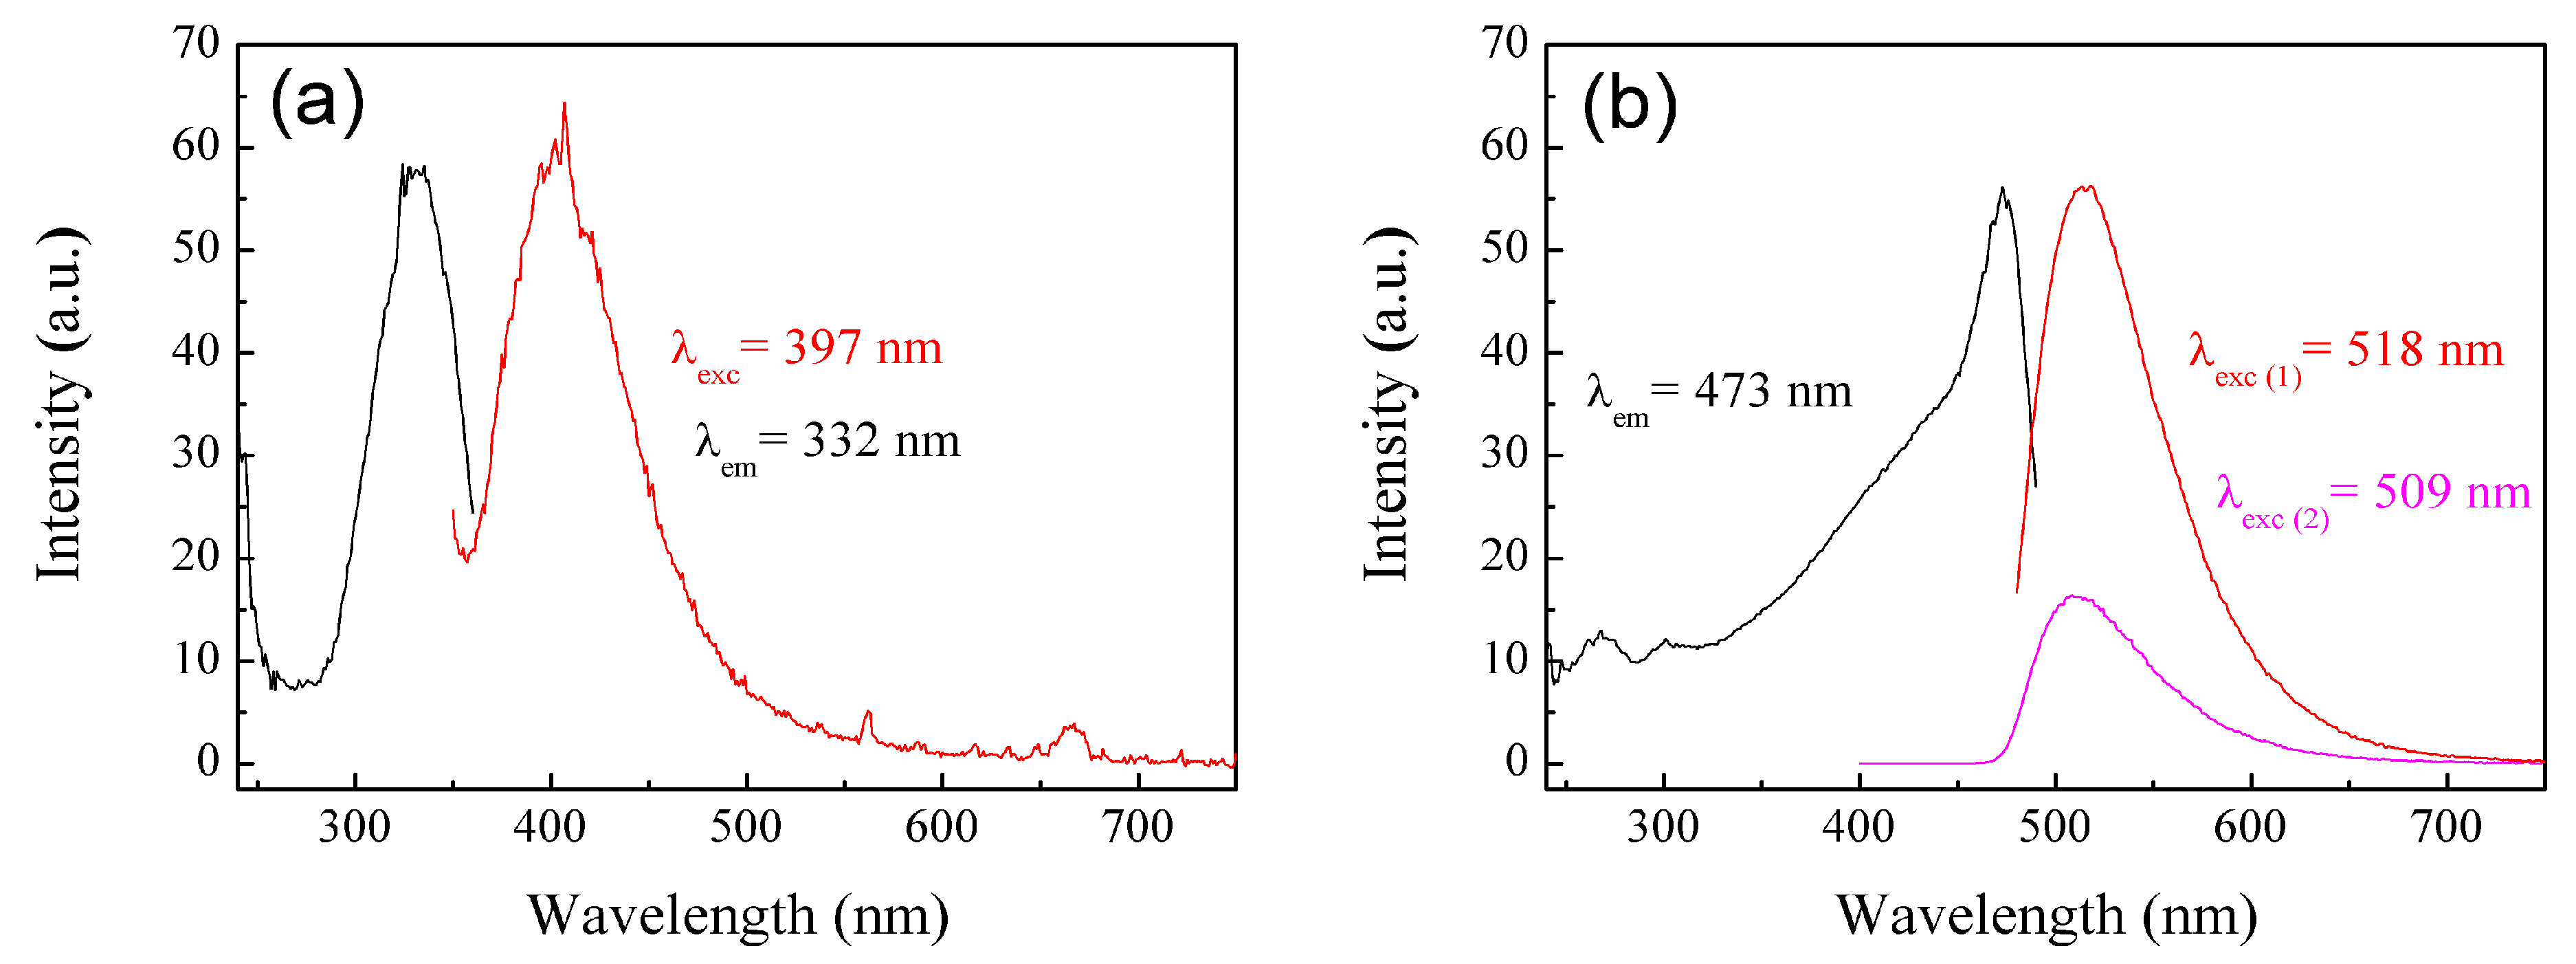
Figure 13.
PL spectra of Poly(AA:FA:CUR) with 5 wt.% of chelating agents (—) non-titrated and titrated with (—) CaCl2 and (—) MgCl2 solutions.
Figure 13.
PL spectra of Poly(AA:FA:CUR) with 5 wt.% of chelating agents (—) non-titrated and titrated with (—) CaCl2 and (—) MgCl2 solutions.
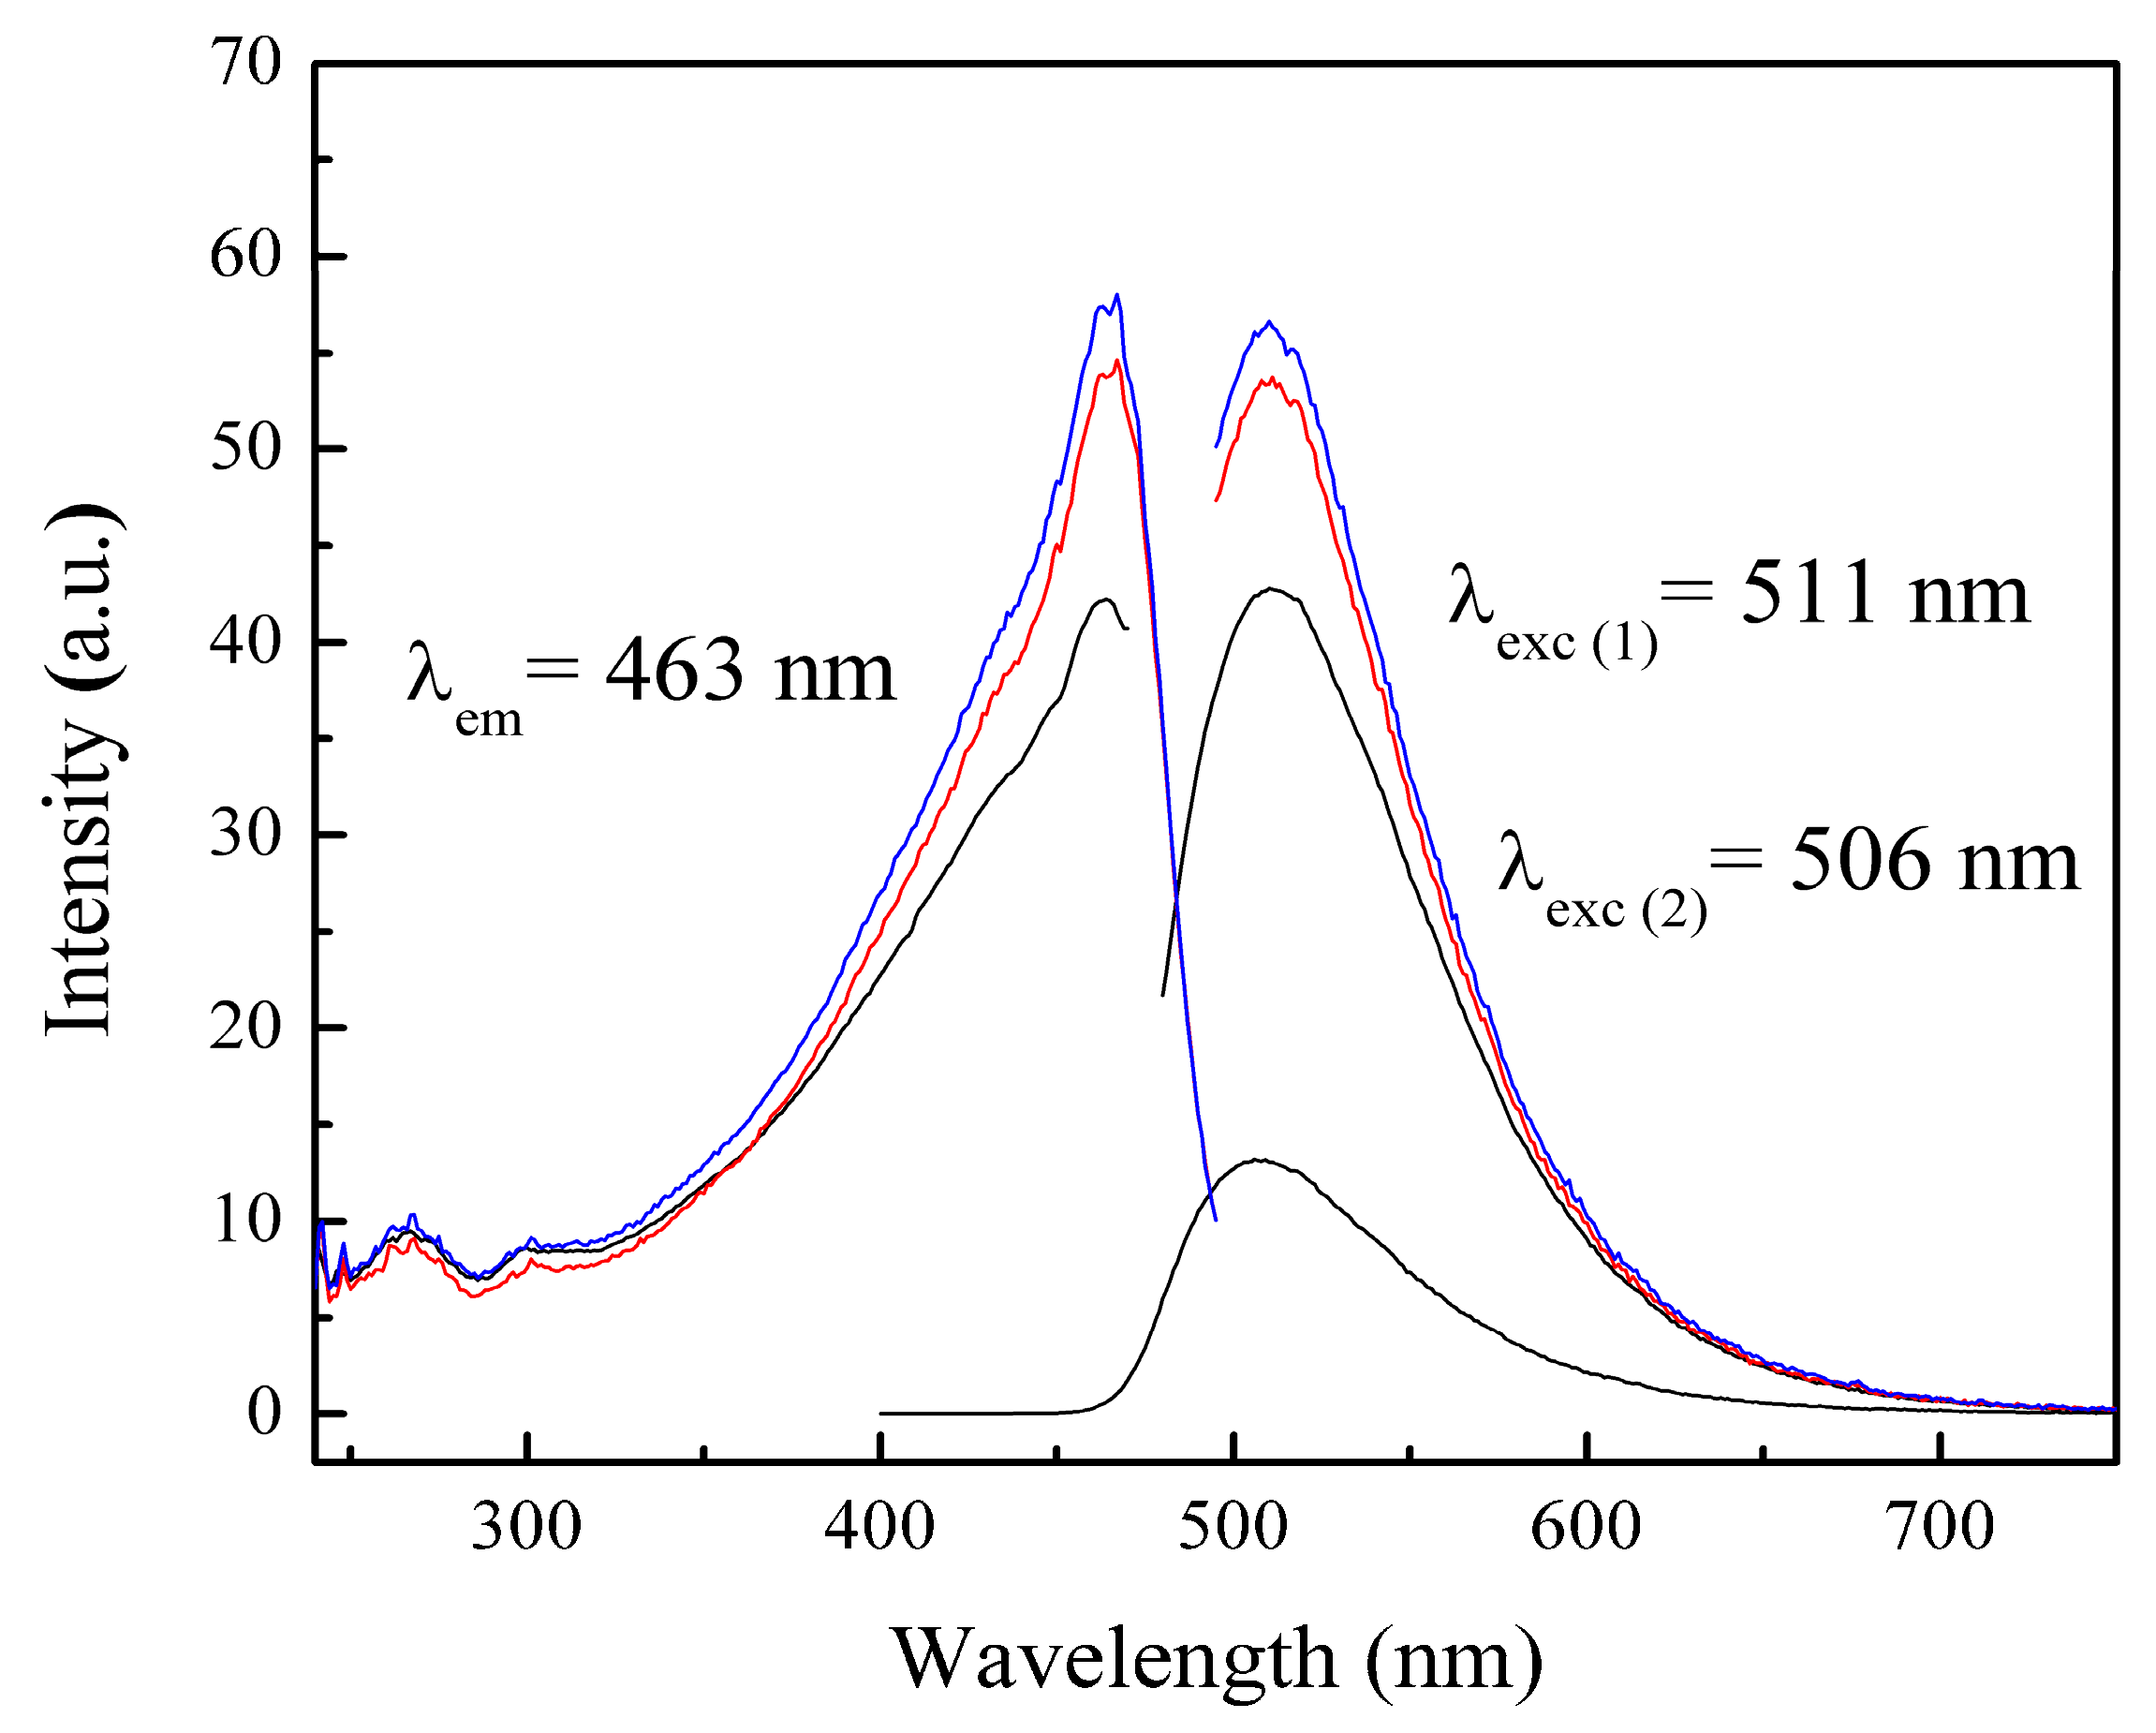
Figure 14.
Diffractograms of copolymers with 5 wt.% of chelating agents titrated with (a) CaCl2 (—) and (b) MgCl2 (—) solutions: (—) Poly(AA:FA), (—) Poly(FA:CUR) and (—) Poly(AA:FA:CUR).
Figure 14.
Diffractograms of copolymers with 5 wt.% of chelating agents titrated with (a) CaCl2 (—) and (b) MgCl2 (—) solutions: (—) Poly(AA:FA), (—) Poly(FA:CUR) and (—) Poly(AA:FA:CUR).
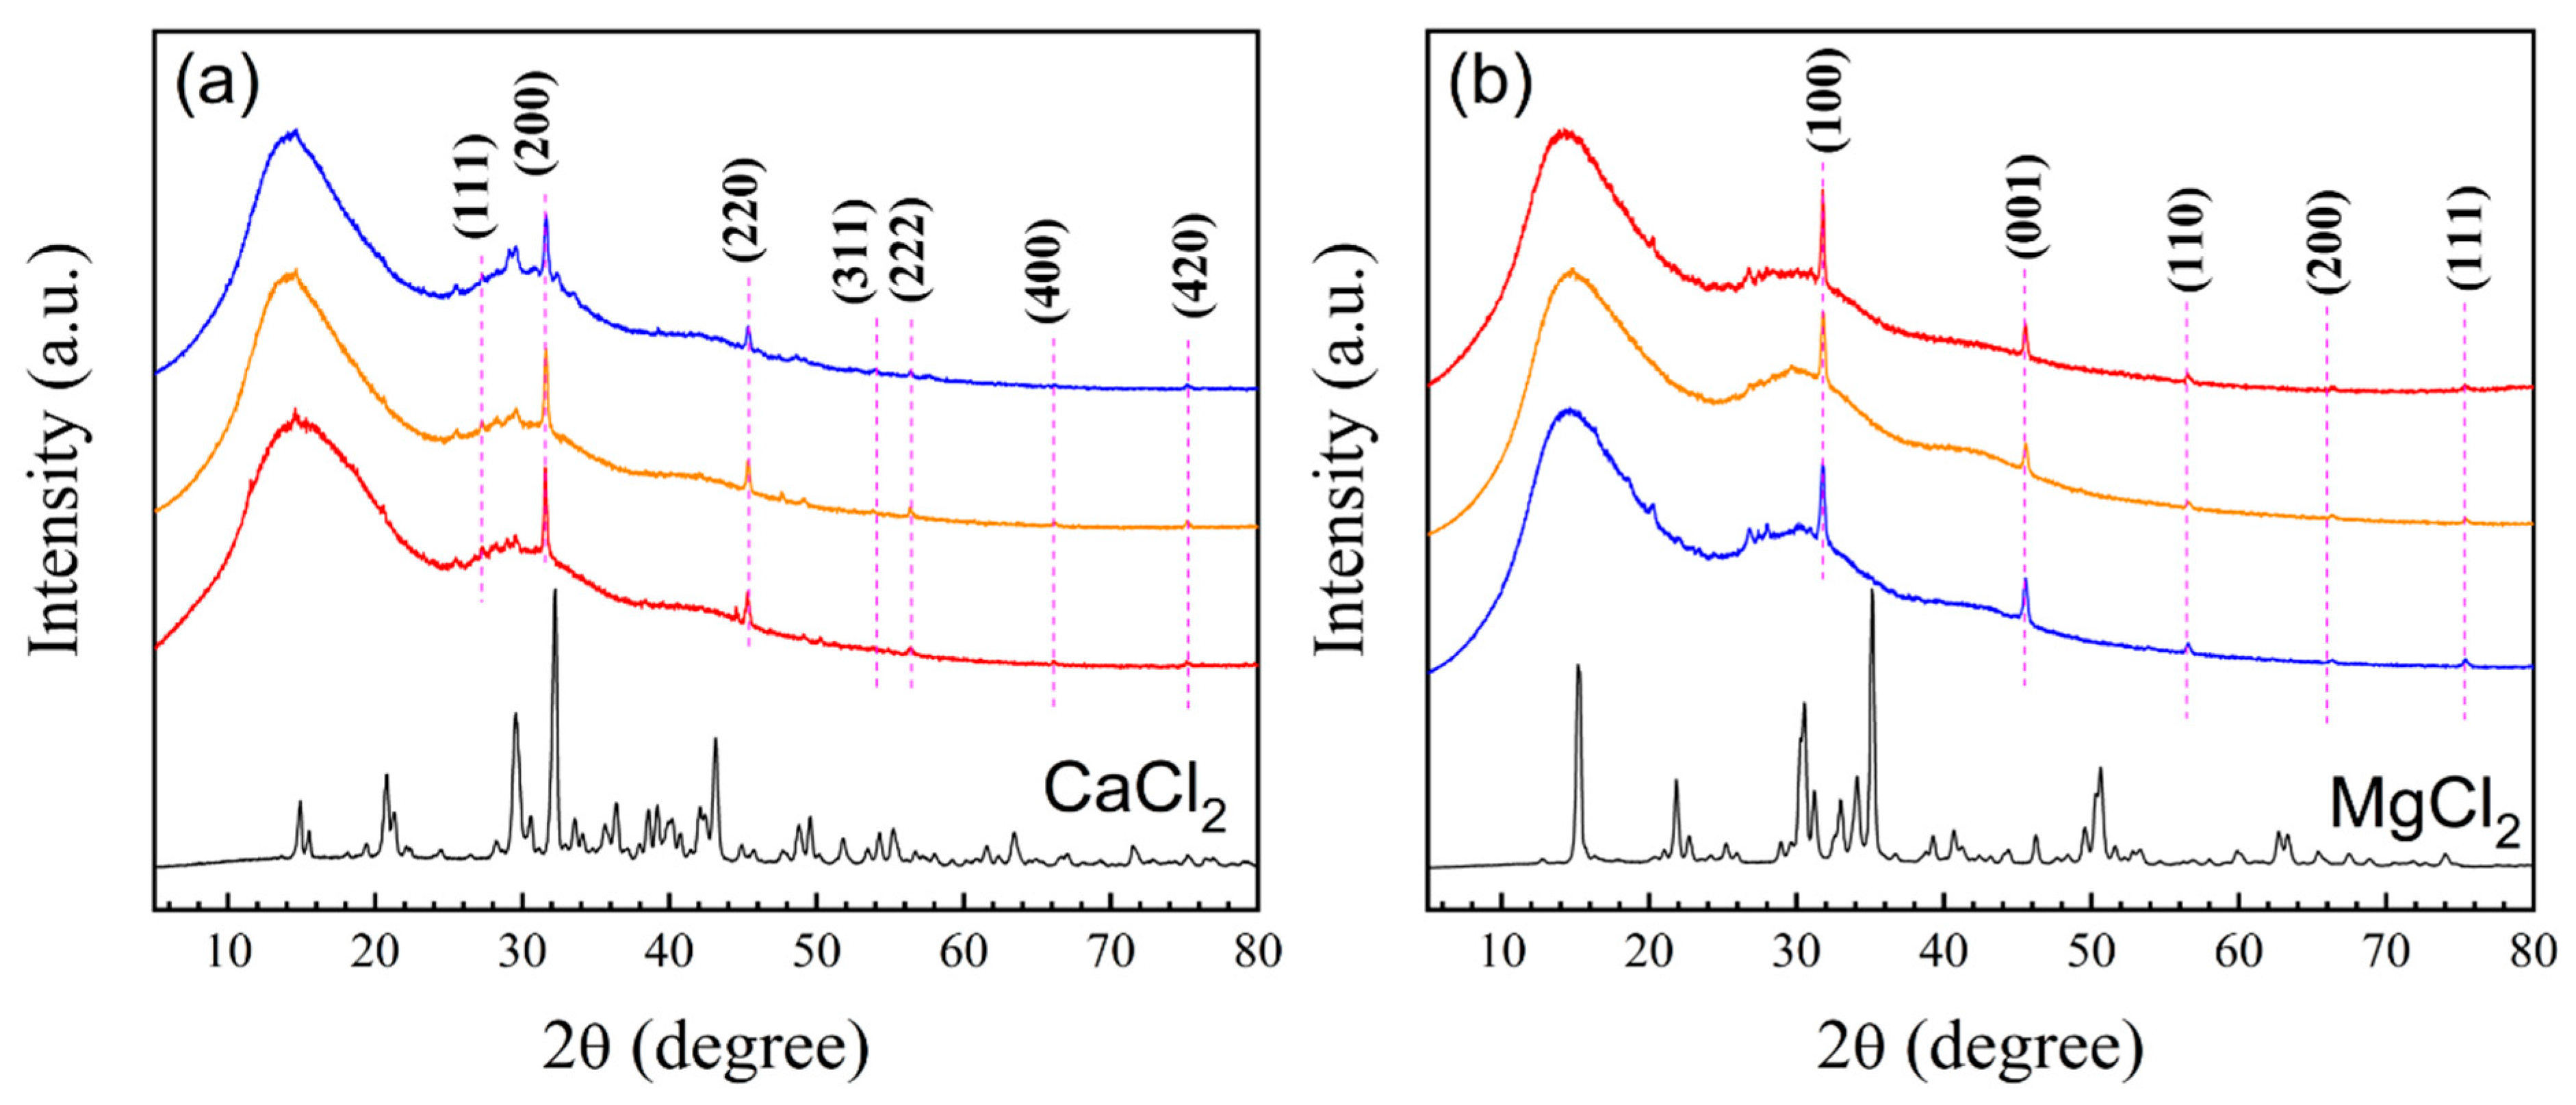
Figure 15.
ITC thermograms of (a) AA–CaCl2, (b) FA–CaCl2, (c) CUR–CaCl2, (d) AA–MgCl2, (e) FA–MgCl2, and (f) CUR–MgCl2 systems.
Figure 15.
ITC thermograms of (a) AA–CaCl2, (b) FA–CaCl2, (c) CUR–CaCl2, (d) AA–MgCl2, (e) FA–MgCl2, and (f) CUR–MgCl2 systems.
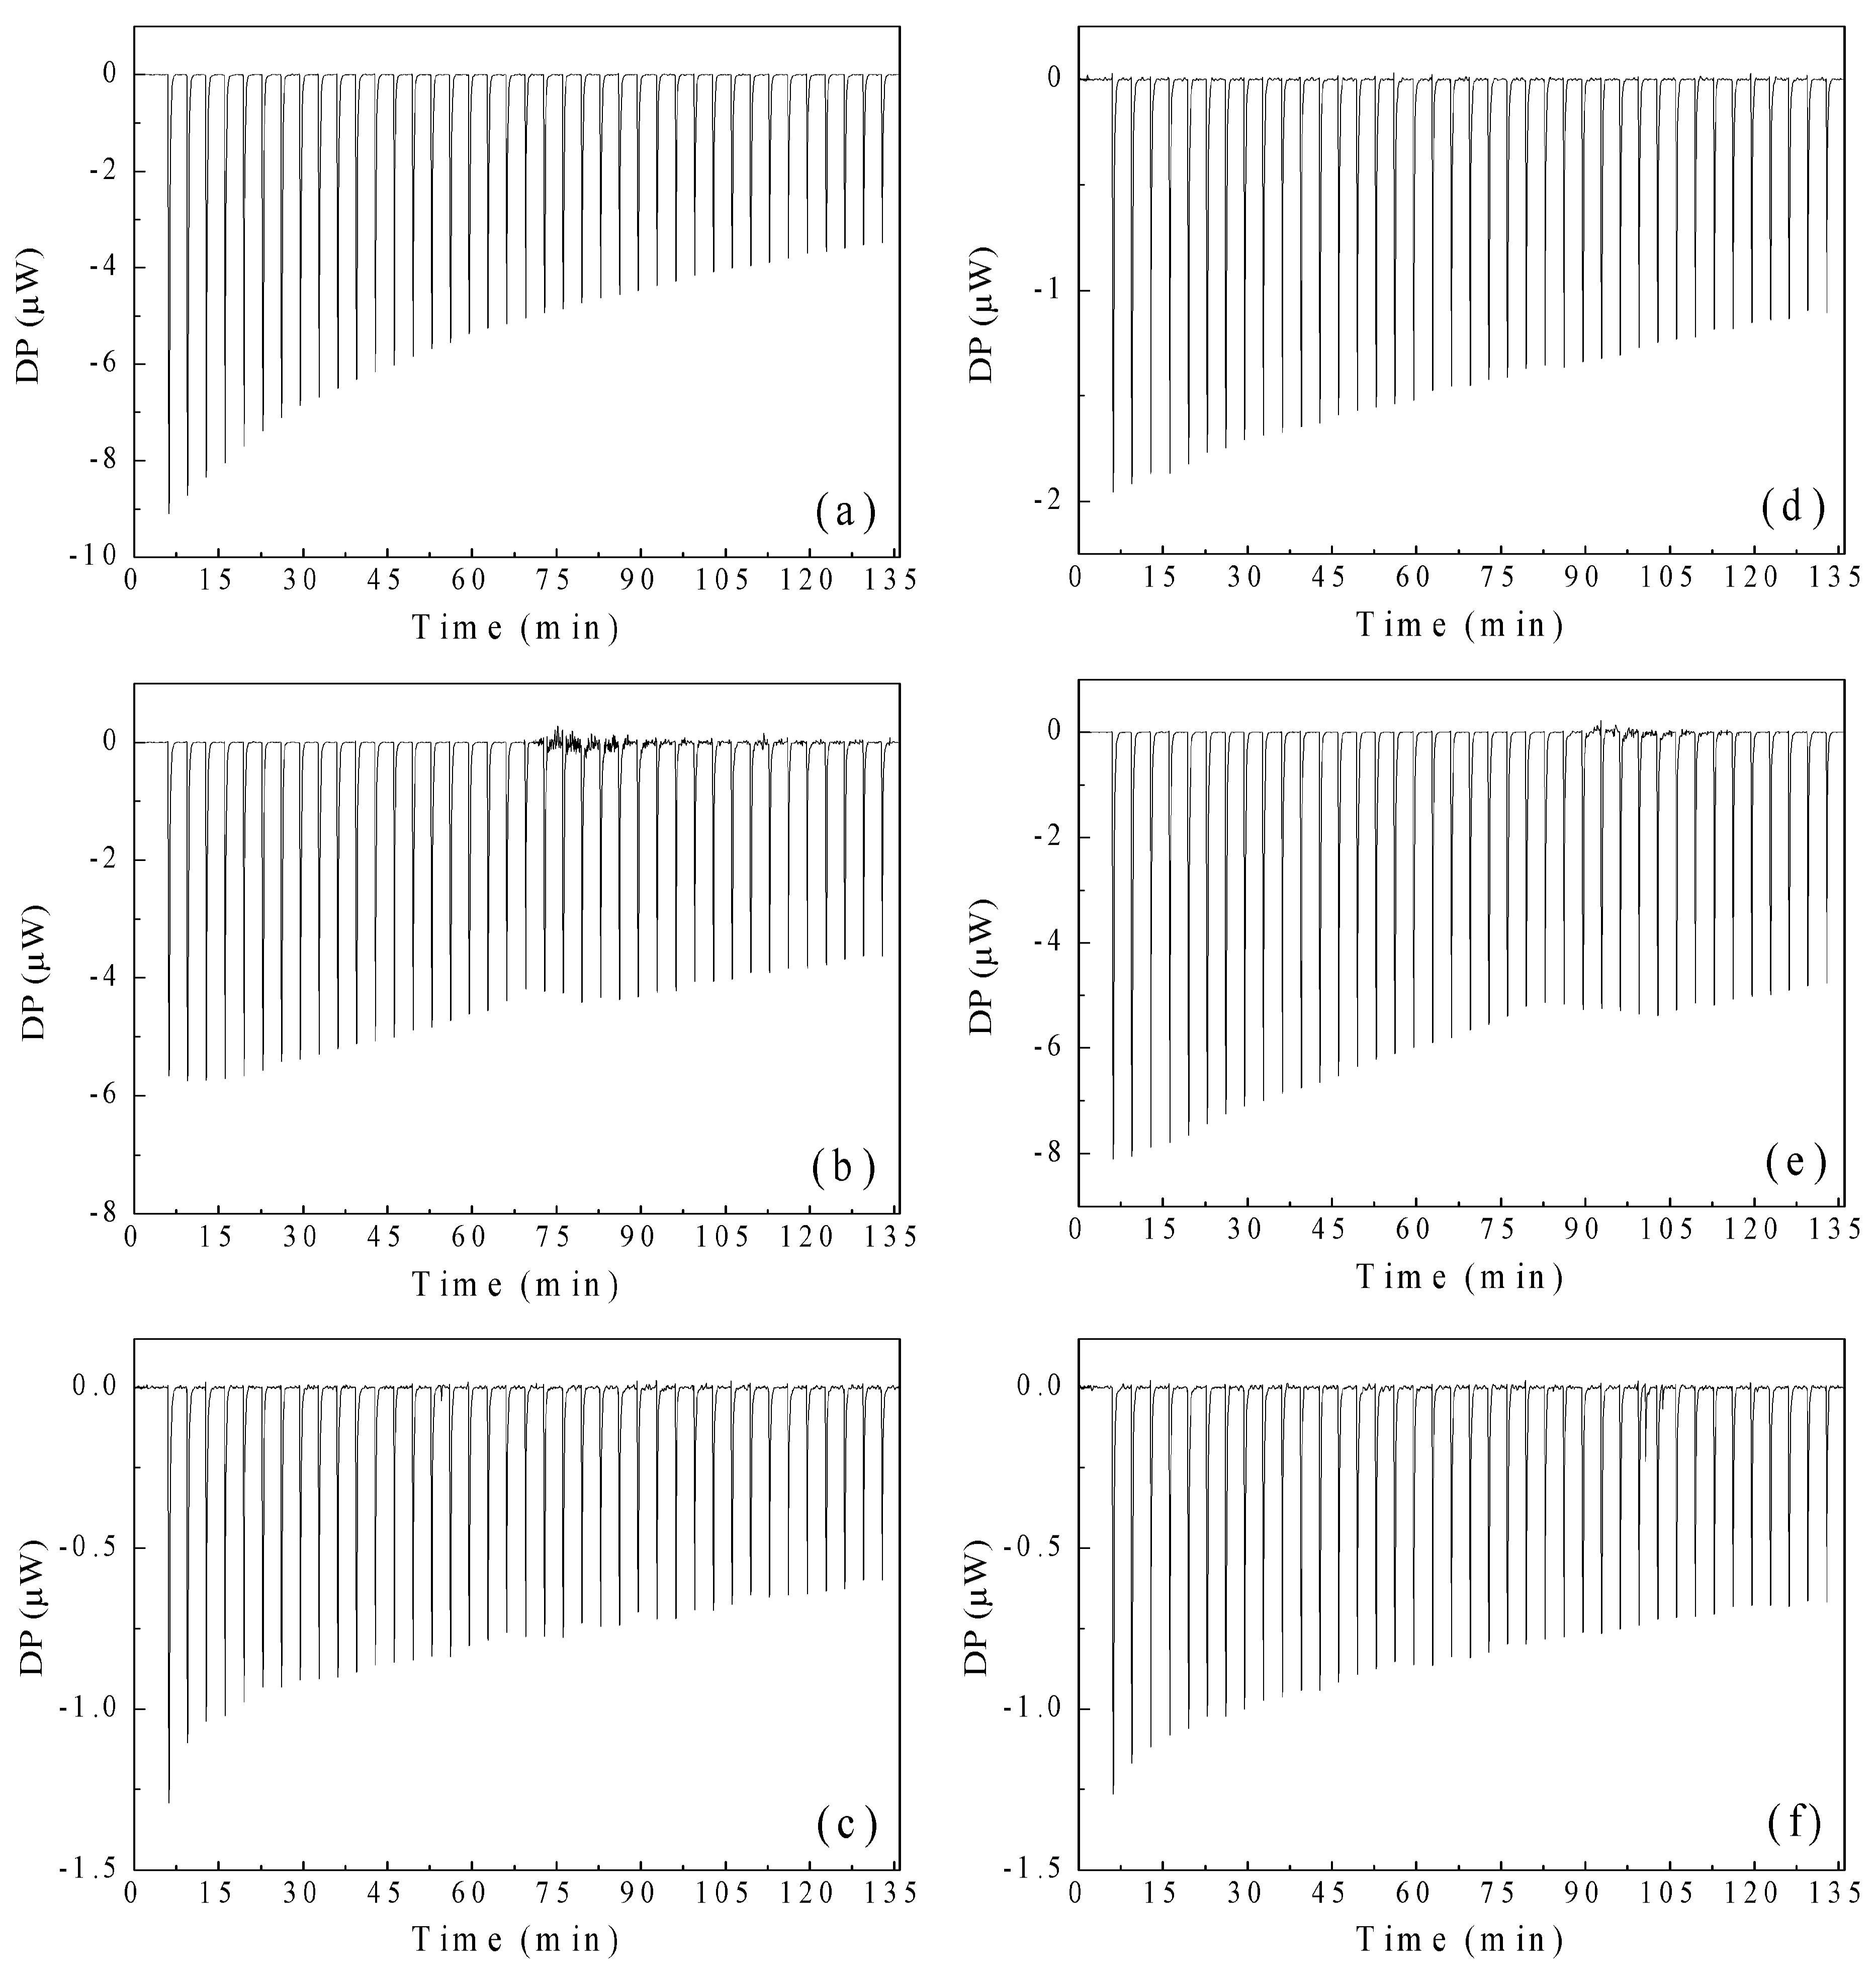
Figure 16.
Normalized heats (Q n-1) as a function of molar ratio between metal ion and functional group of (a) AA–CaCl2, (b) FA–CaCl2, (c) CUR–CaCl2, (d) AA–MgCl2, (e) FA–MgCl2, and (f) CUR–MgCl2 systems.
Figure 16.
Normalized heats (Q n-1) as a function of molar ratio between metal ion and functional group of (a) AA–CaCl2, (b) FA–CaCl2, (c) CUR–CaCl2, (d) AA–MgCl2, (e) FA–MgCl2, and (f) CUR–MgCl2 systems.
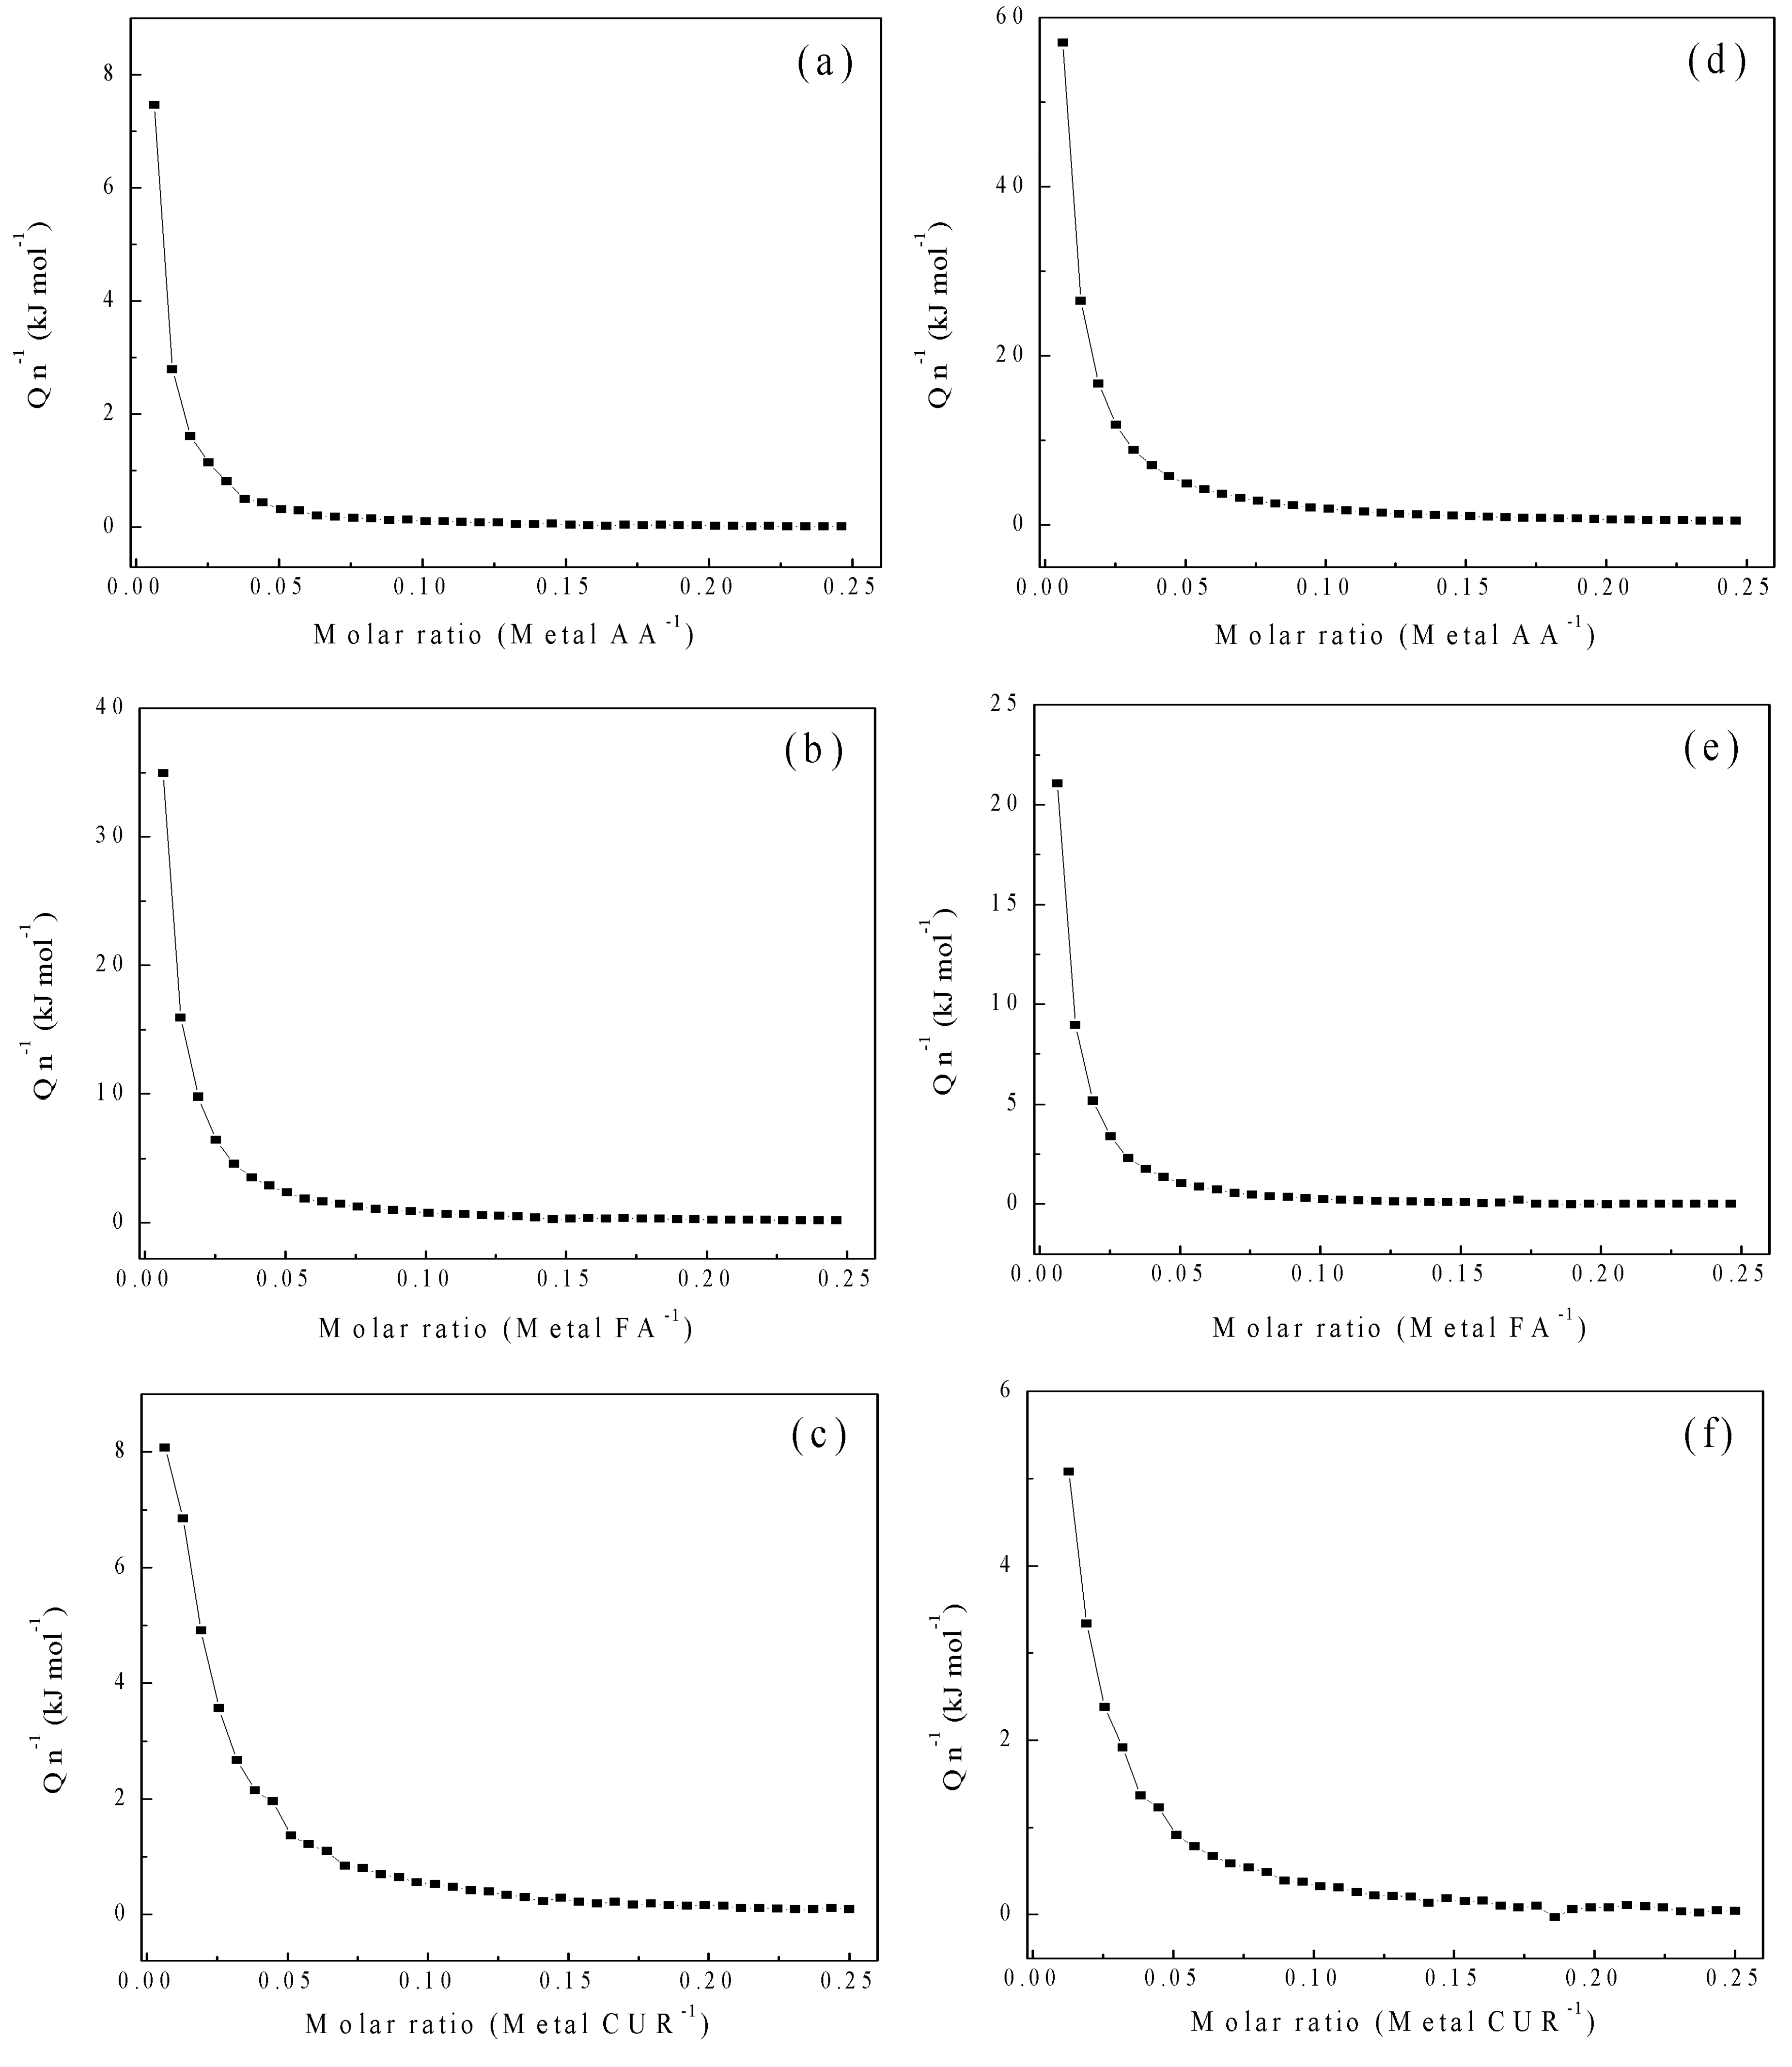
Figure 17.
Thermodynamic parameters of the interaction of the AA–CaCl2, FA–CaCl2 and CUR–CaCl2 systems: (a) Gibbs free energy, (b) enthalpy, (c) entropic contribution, and (d) enthalpy–entropy plot.
Figure 17.
Thermodynamic parameters of the interaction of the AA–CaCl2, FA–CaCl2 and CUR–CaCl2 systems: (a) Gibbs free energy, (b) enthalpy, (c) entropic contribution, and (d) enthalpy–entropy plot.
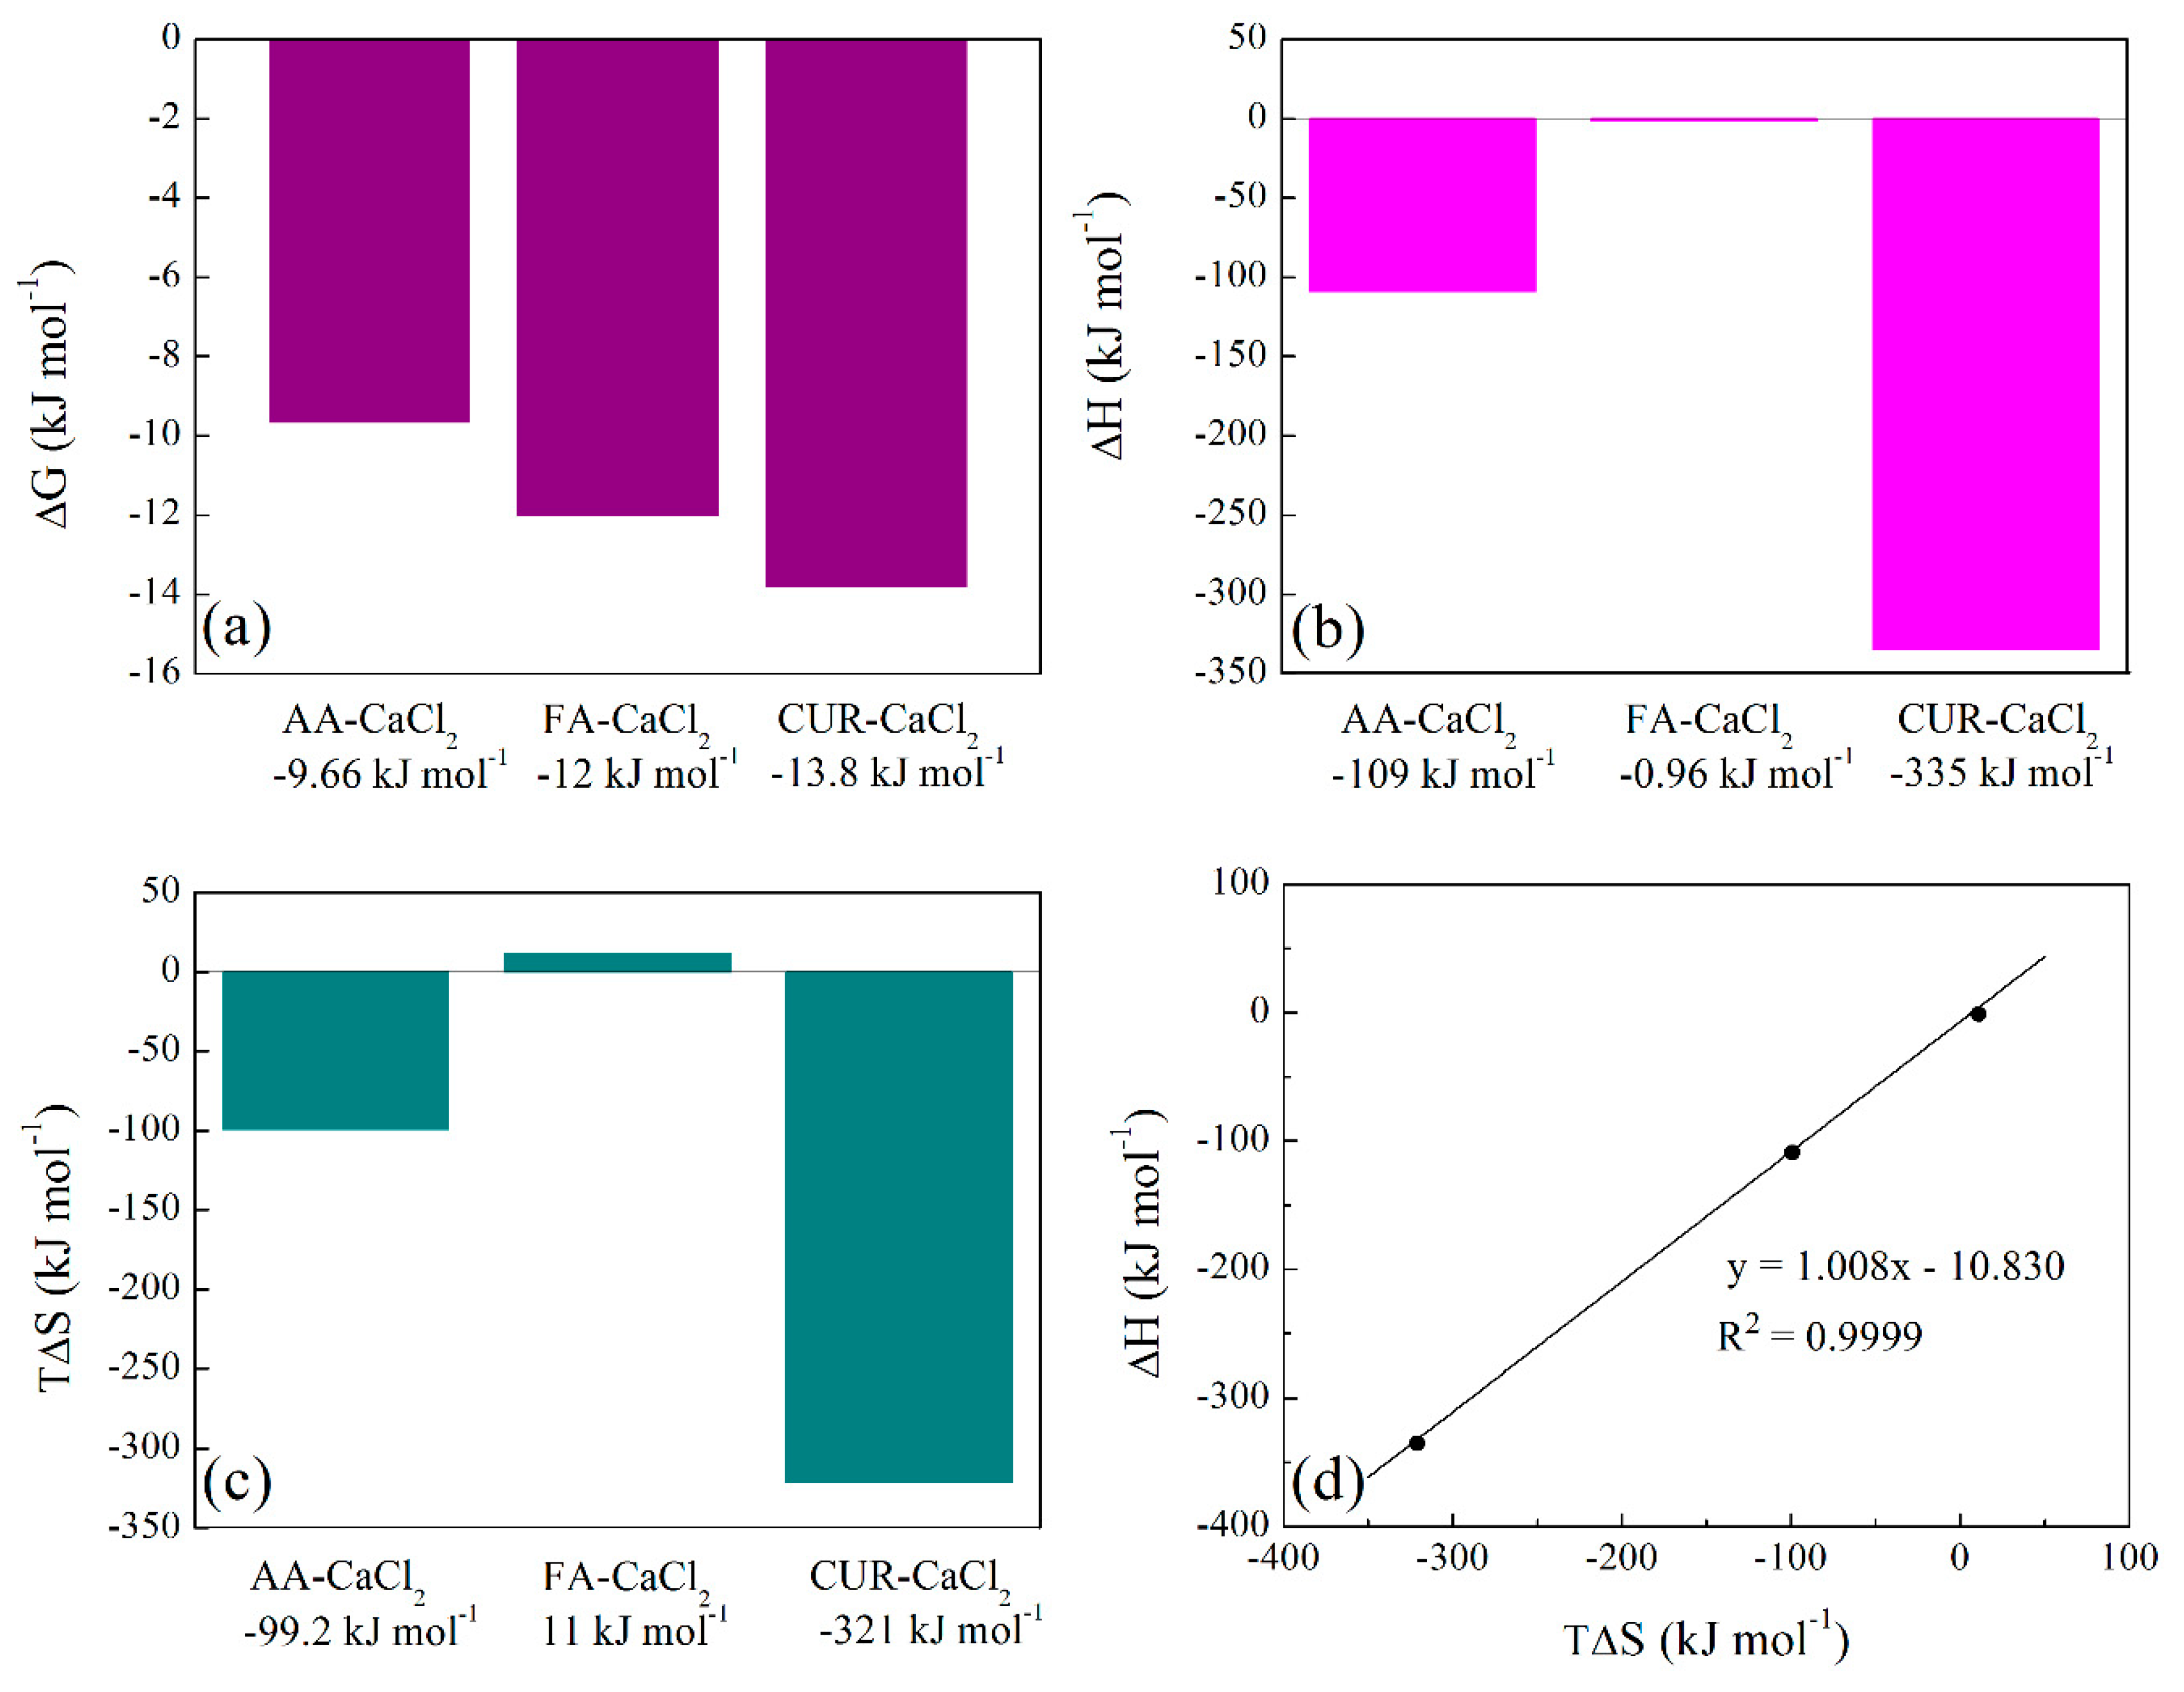
Figure 18.
Thermodynamic parameters of the interaction of the AA–MgCl2, FA–MgCl2 and Mg–CaCl2 systems: (a) Gibbs free energy, (b) enthalpy, (c) entropic contribution, and (d) enthalpy–entropy plot.
Figure 18.
Thermodynamic parameters of the interaction of the AA–MgCl2, FA–MgCl2 and Mg–CaCl2 systems: (a) Gibbs free energy, (b) enthalpy, (c) entropic contribution, and (d) enthalpy–entropy plot.
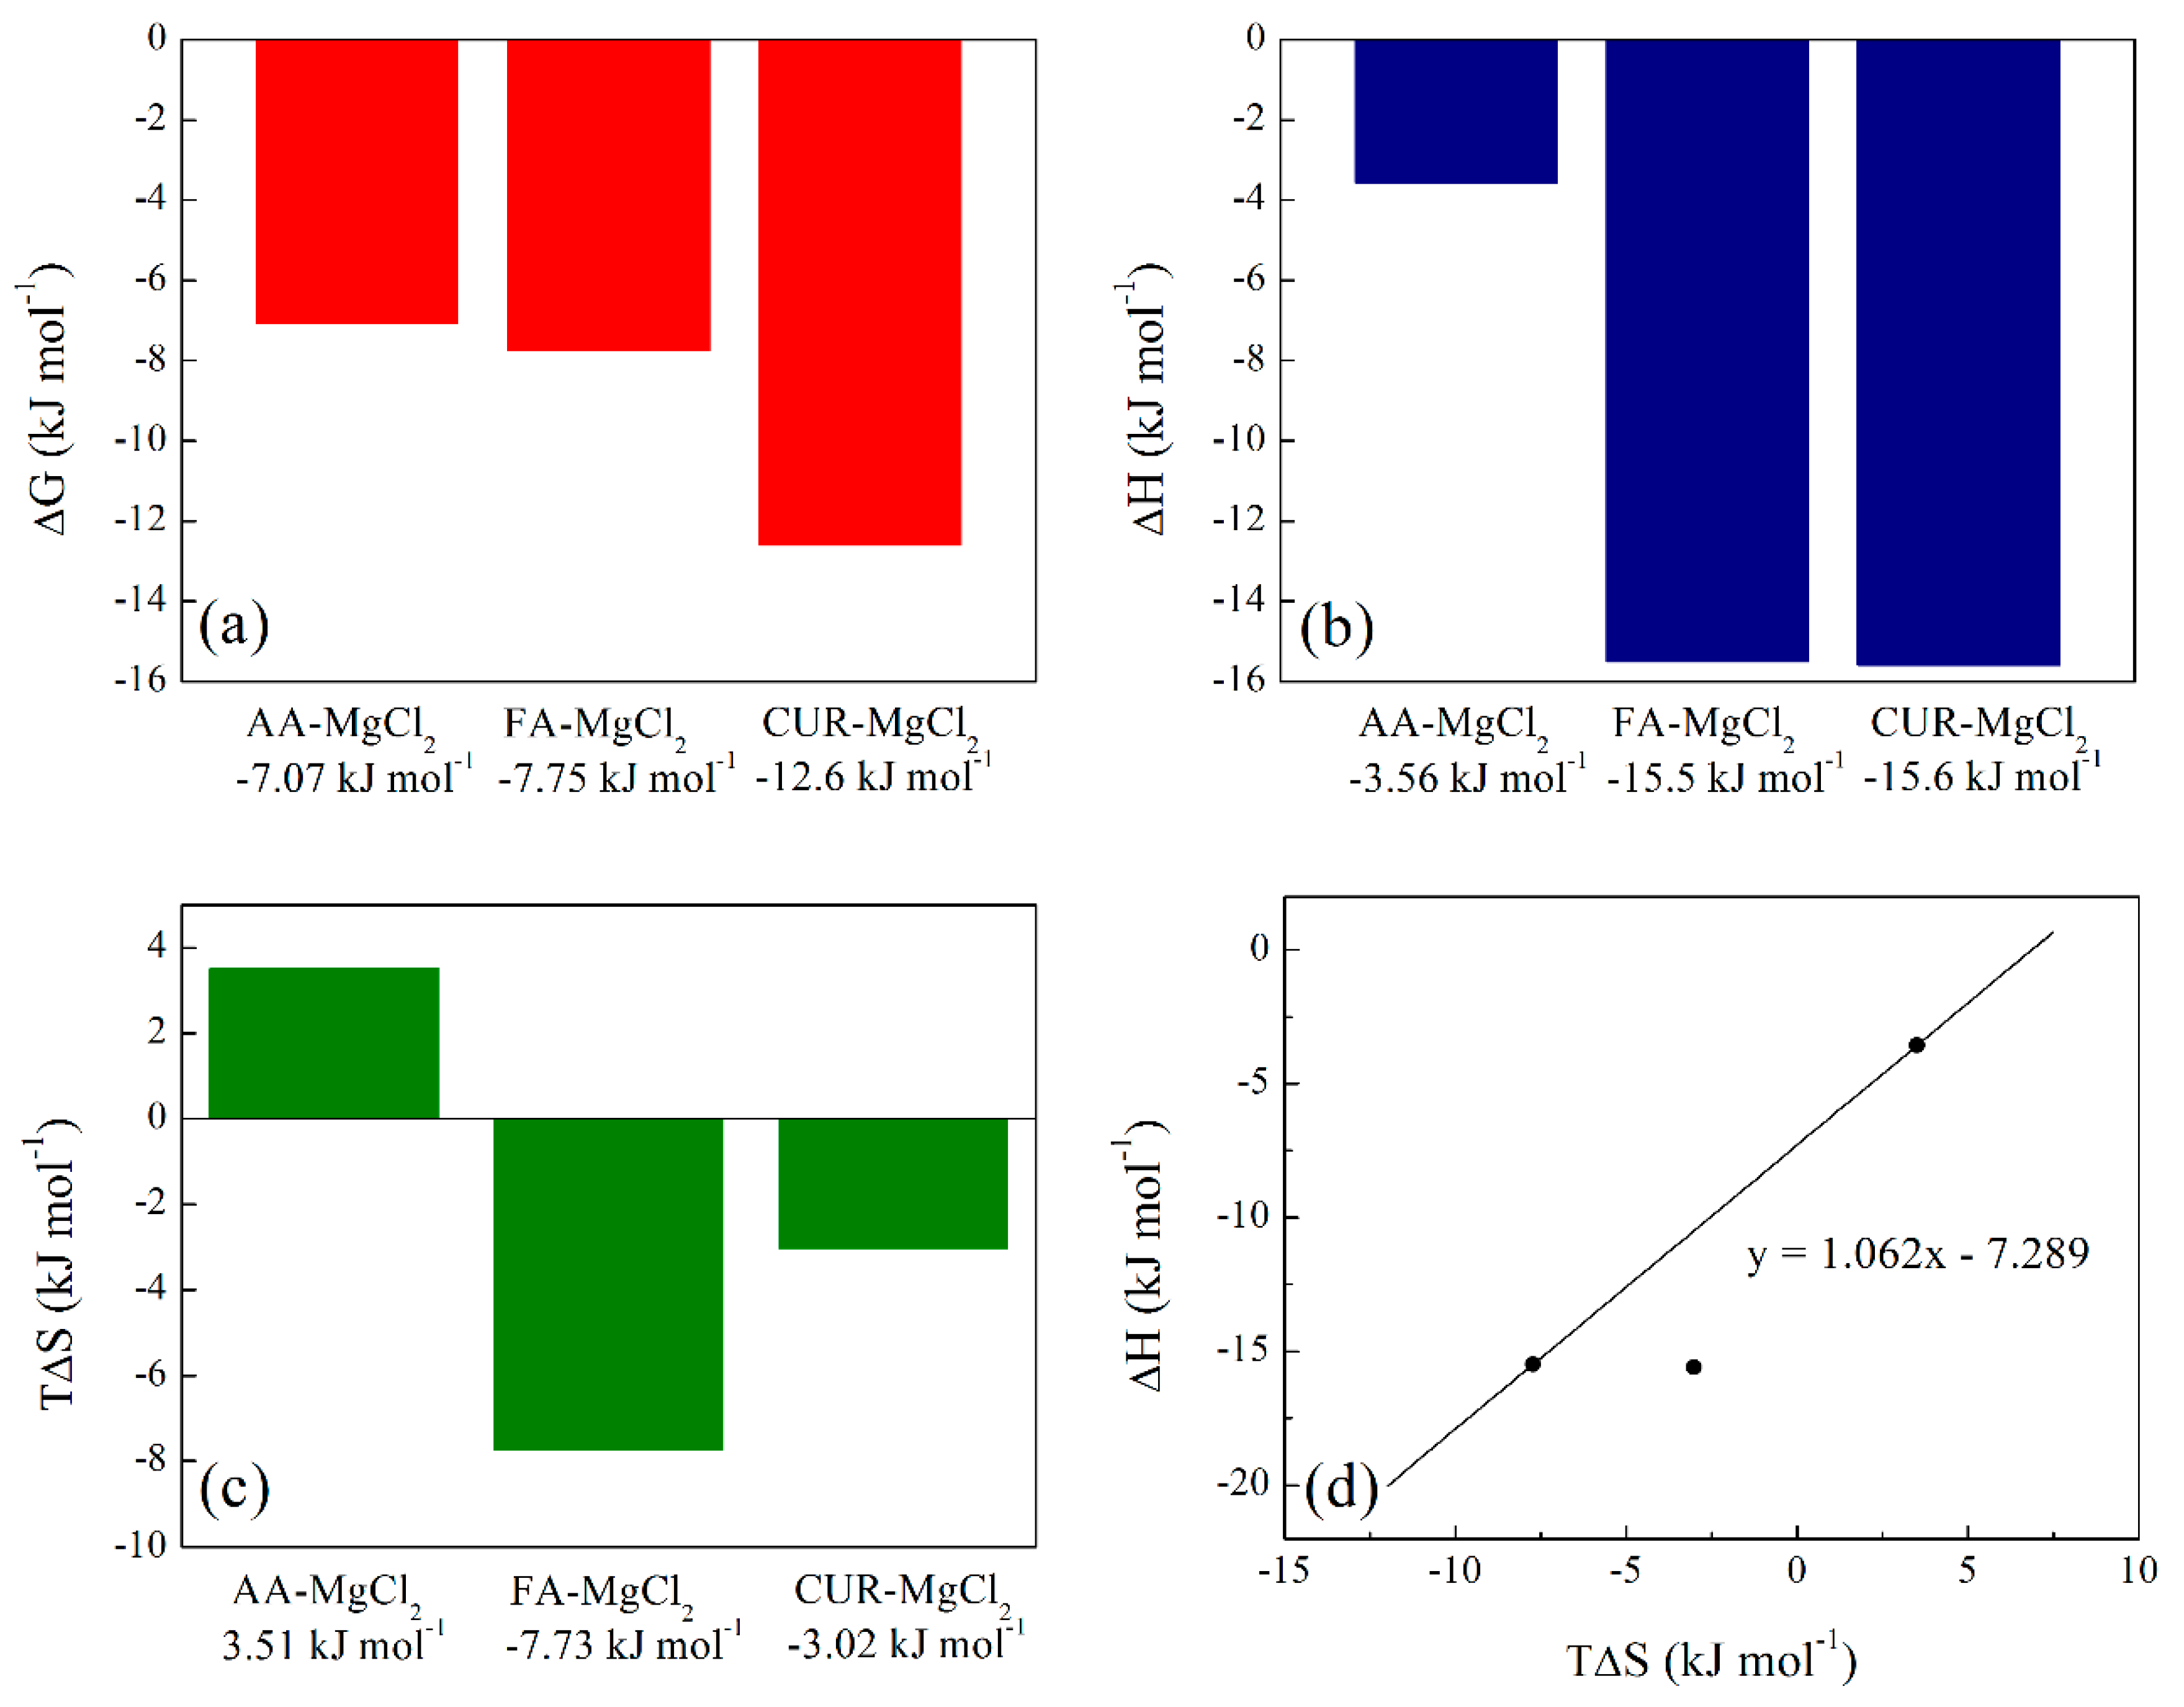
Figure 19.
Enthalpy–Entropy plot. The linear fit (black lines) was performed using all CaCl2–systems, including the CUR–MgCl2 system. The dotted line (---) indicates the AA–MgCl2 and FA–MgCl2 systems with magnesium chloride.
Figure 19.
Enthalpy–Entropy plot. The linear fit (black lines) was performed using all CaCl2–systems, including the CUR–MgCl2 system. The dotted line (---) indicates the AA–MgCl2 and FA–MgCl2 systems with magnesium chloride.
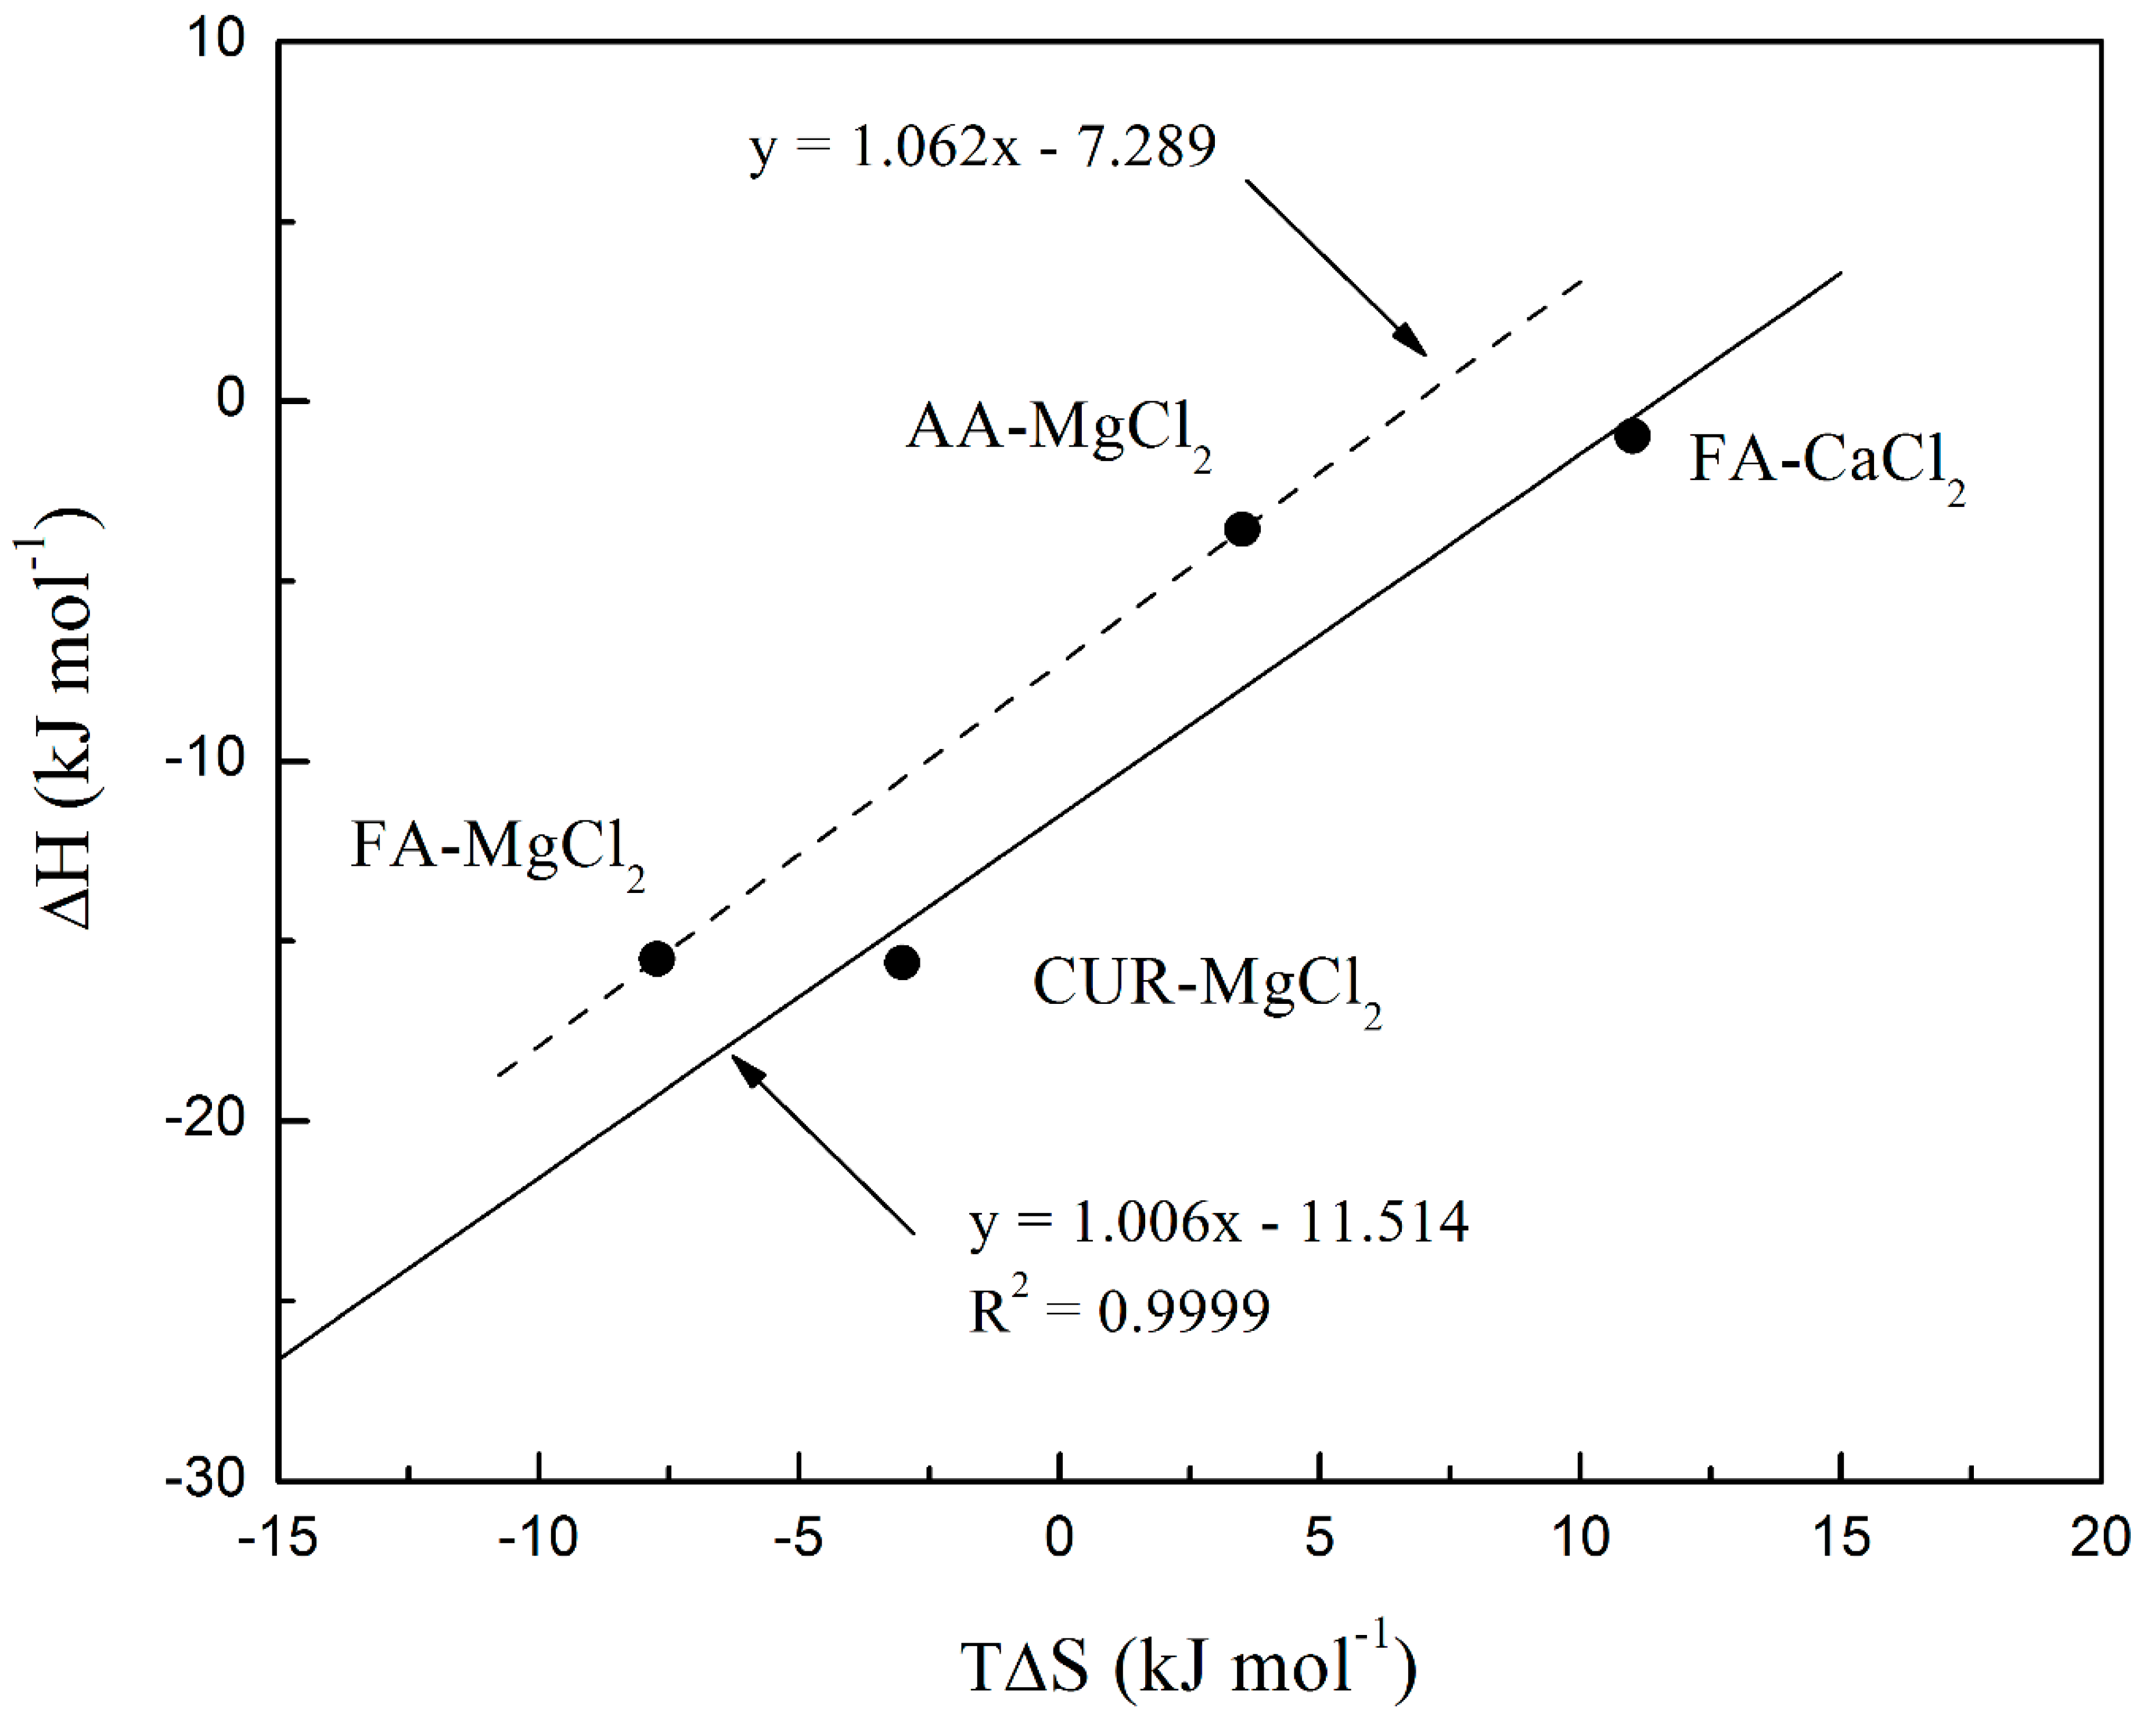
Figure 20.
Structural arrangement of the interaction between functional groups: (a) AA, (b) CUR, and (c) FA with calcium ions (Ca2+).
Figure 20.
Structural arrangement of the interaction between functional groups: (a) AA, (b) CUR, and (c) FA with calcium ions (Ca2+).
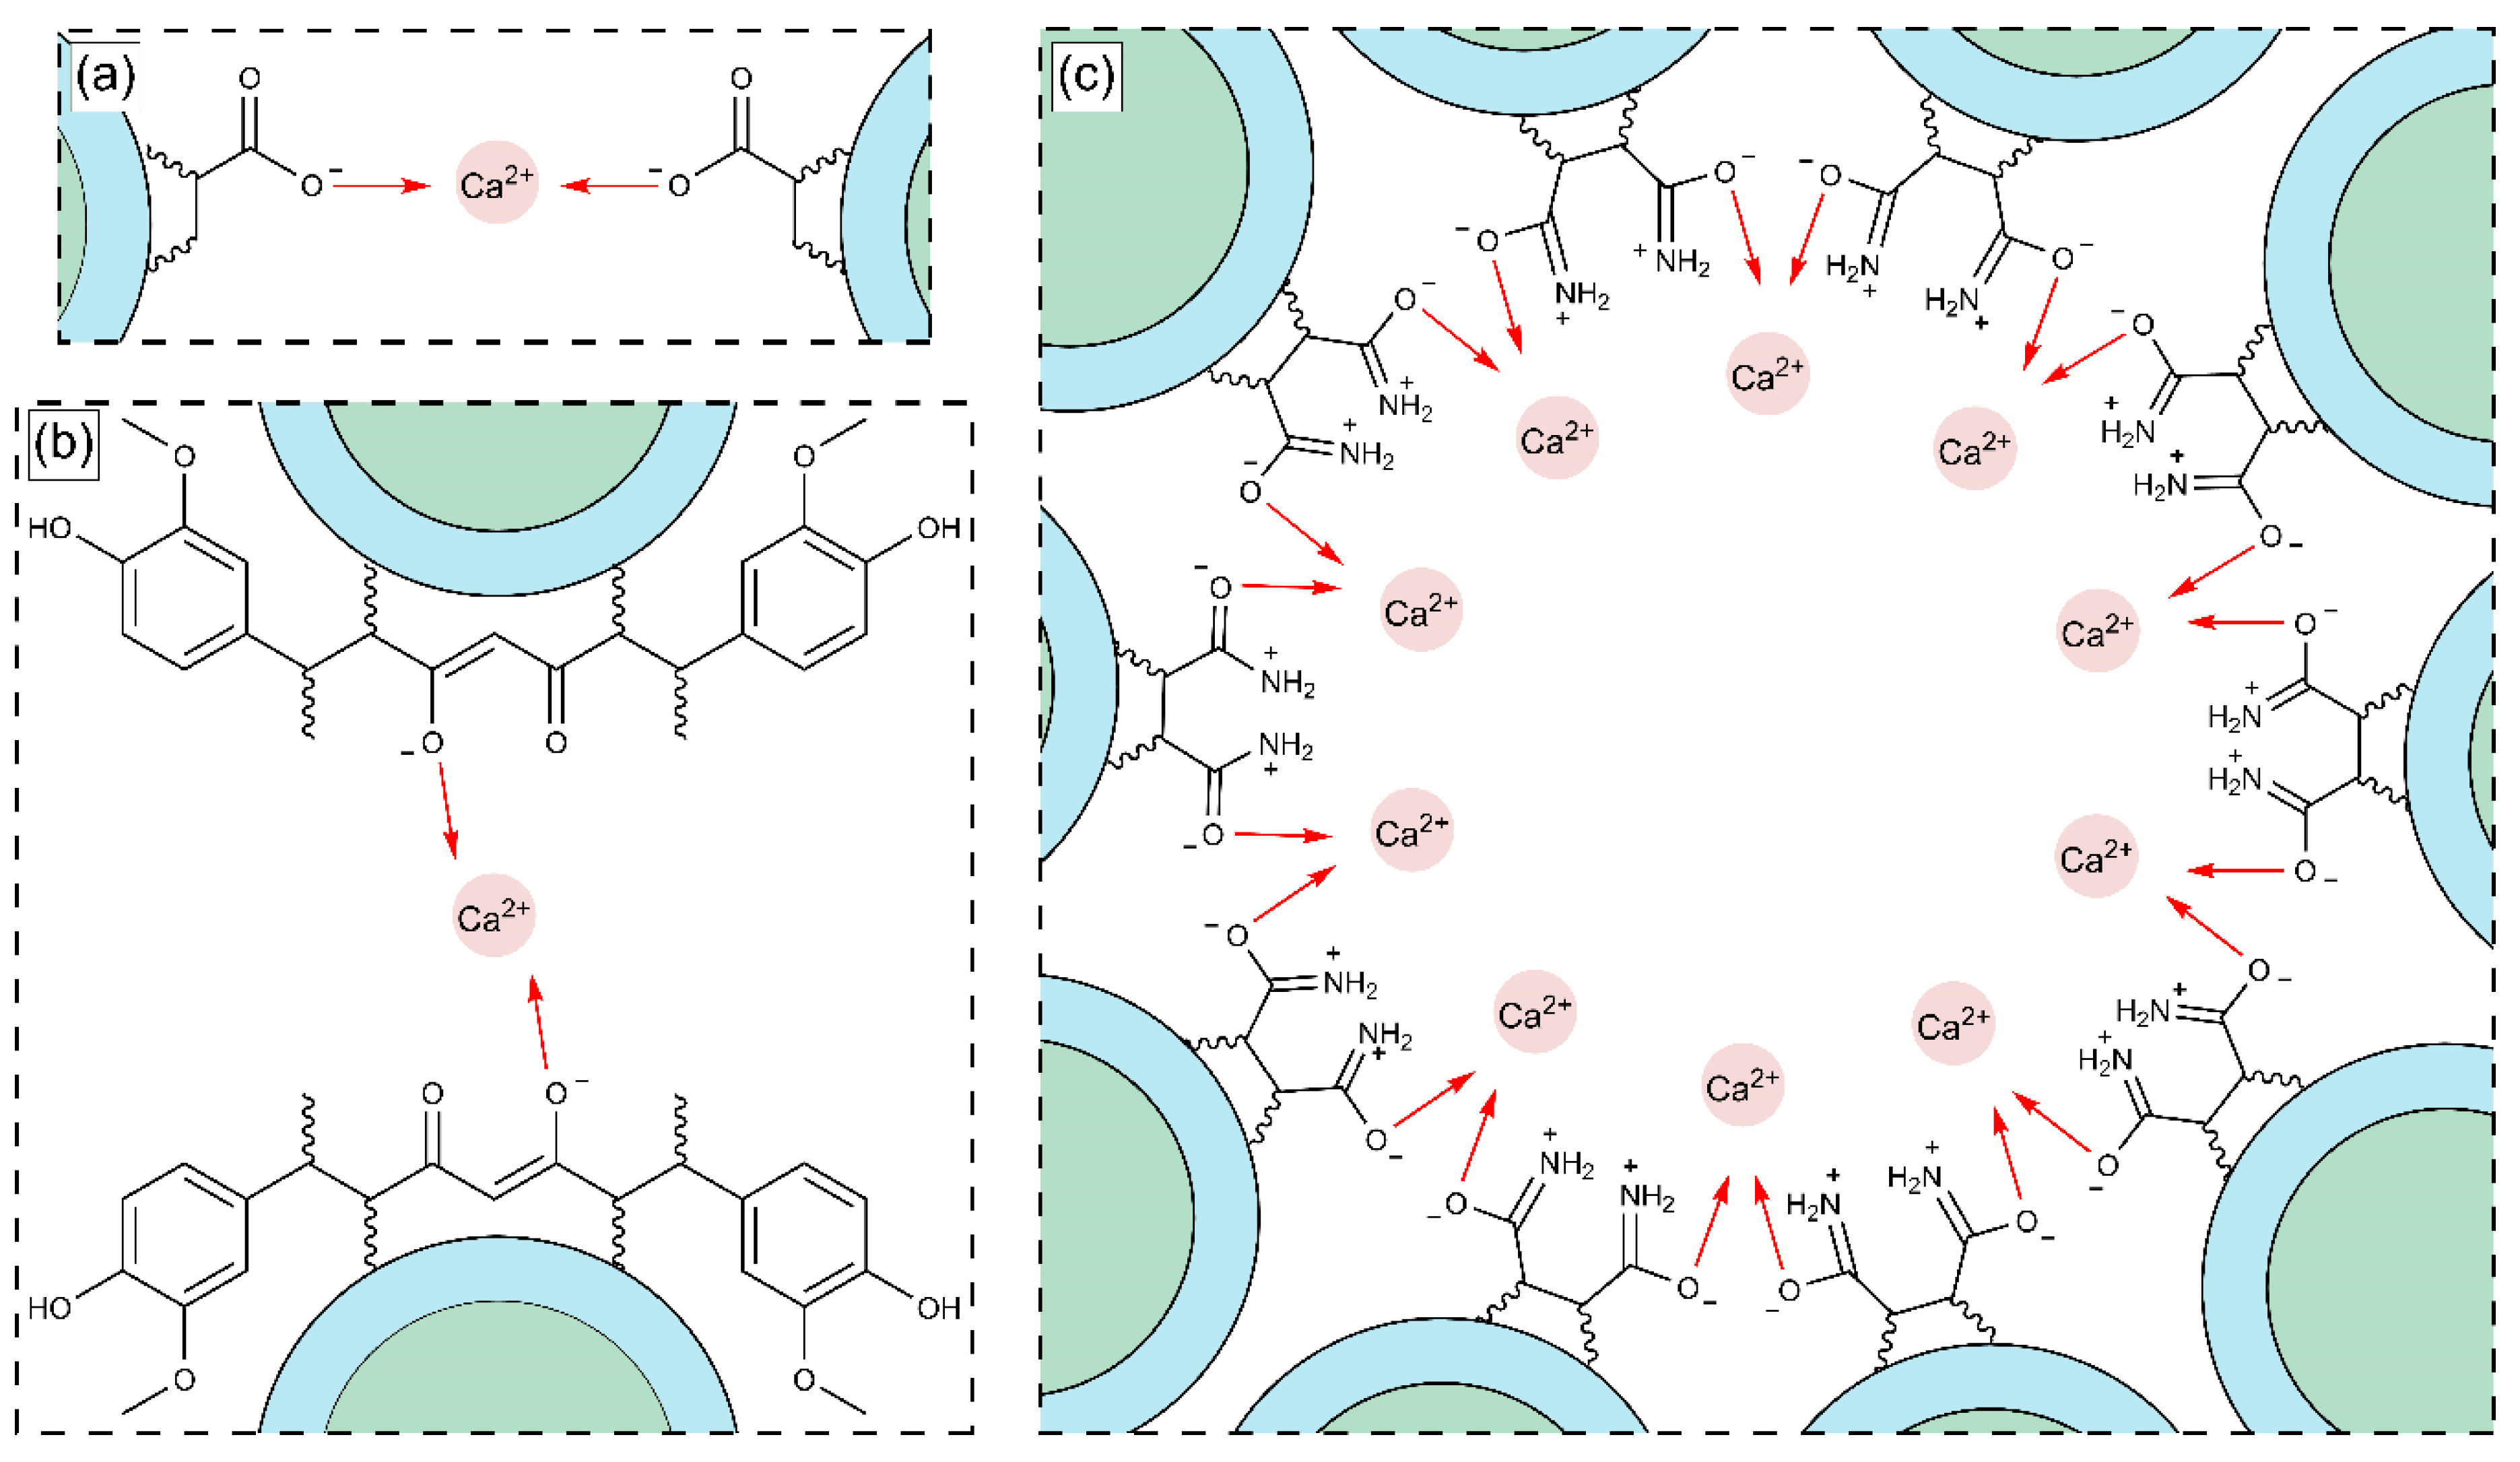

Table 1.
Reagents specifications.
| Chemical name | CASRN | Source | Mass fraction purity |
| Methyl methacrylate (MMA) | 80-62-6 | Sigma–Aldrich, USA | ≥ 0.99a |
| Acrylic acid (AA) | 79-10-7 | Sigma–Aldrich, USA | ≥ 0.99a |
| Fumaramide (FA) | 627-64-5 | ChemCruz, USA | ≥ 0.96a |
| Curcumin (CUR) | 458-37-7 | Sigma–Aldrich, USA | ≥ 0.65b |
| Calcium chloride (CaCl2) | 10043-52-4 | Sigma–Aldrich, USA | ≥ 0.97a |
| Magnesium chloride (MgCl2) | 676-58-4 | Sigma–Aldrich, USA | ≥ 0.98a |
| Sodium persulfate (Na2S2O8) | 7775-27-1 | Sigma–Aldrich, USA | ≥ 0.98a |
| Nonylphenol ethoxylate ammonium sulfate (Abex® EP 120) | 7732-18-5 | Solvay, USA | —b |
| Double-distilled water (H2O) | — | Mizu Técnica, Mexico | —b |
a Reactive grade and b analytical grade.
Table 2.
Formulation of polymer particles of different acrylic acid (AA) and fumaramide (FA) ratio.
| Reagents | Reactor (g) | Tank 1 (g) | Tank 2 (g) | ||
| 1 wt.% | 3 wt.% | 5 wt.% | |||
| Surfactant solution, 0.5 wt.% | 0.15 | - | - | - | - |
| Surfactant solution, 3.73 wt.% | - | 2.8 | 1.2 | 1.2 | 1.2 |
| Methyl methacrylate (MMA) | - | 6.9 | 3 | 2.8 | 2.6 |
| Acrylic acid (AA) | - | - | 0.05 | 0.15 | 0.25 |
| Fumaramide (FA) | - | - | 0.05 | 0.15 | 0.25 |
| Curcumin (CUR) | - | - | - | - | - |
| Initiator solution, 2 wt.% | 0.3 | 1 | 0.4 | 0.4 | 0.4 |
| Distilled water | 85 | 70 | 30 | 30 | 30 |
Table 3.
Average total solids content, (wt.%) of the polymeric materials with 1 wt.%, 3 wt.% and 5 wt.% of chelating agents.
Table 3.
Average total solids content, (wt.%) of the polymeric materials with 1 wt.%, 3 wt.% and 5 wt.% of chelating agents.
| Total solids content, (wt.%) | |||
| Material | 1 wt.% | 3 wt.% | 5 wt.% |
| Poly(AA:FA) | 4.16 ± 0.0002 | 4.58 ± 0.0006 | 4.38 ± 0.0002 |
| Poly(AA:CUR) | 4.46 ± 0.0006 | 4.27 ± 0.00008 | 3.31 ± 0.00003 |
| Poly(FA:CUR) | 4.45 ± 0.0006 | 5.15 ± 0.002 | 3.64 ± 0.0003 |
| Poly(AA:FA:CUR) | 4.48 ± 0.0002 | 4.25 ± 0.00005 | 4.26 ± 0.0001 |
Table 4.
Average diameters and polydispersity index (PDI) of the polymeric particles with 1 wt.%, 3 wt.% and 5 wt.% of chelating agents.
Table 4.
Average diameters and polydispersity index (PDI) of the polymeric particles with 1 wt.%, 3 wt.% and 5 wt.% of chelating agents.
| Average particle diameter, (nm) and polydispersity index, PDI | ||||||
| Material | 1 wt.% | 3 wt.% | 5 wt.% | |||
| (nm) | PDI | (nm) | PDI | (nm) | PDI | |
| Poly(AA:FA) | 108.9 ± 3.30 | 1.15 | 101.2 ± 0.522 | 1.10 | 121.1 ± 1.82 | 1.10 |
| Poly(AA:CUR) | 151.8 ± 1.80 | 1.12 | 133.0 ± 1.93 | 1.13 | 124.8 ± 0.817 | 1.11 |
| Poly(FA:CUR) | 151.4 ± 1.89 | 1.12 | 112.8 ± 1.63 | 1.11 | 121.1 ± 1.44 | 1.11 |
| Poly(AA:FA:CUR) | 128.2 ± 1.21 | 1.11 | 132.2 ± 1.53 | 1.12 | 123.3 ± 0.825 | 1.11 |
Table 6.
Variation of pH values of polymeric particles with 1 wt.%, 3 wt.% and 5 wt.% of chelating agents.
Table 6.
Variation of pH values of polymeric particles with 1 wt.%, 3 wt.% and 5 wt.% of chelating agents.
| pH | ||||||
| Material | 1 wt.% | 3 wt.% | 5 wt.% | |||
| Initial | Final | Initial | Final | Initial | Final | |
| Poly(AA:FA) | 2.6 ± 0.014 | 4.9 ± 1.1 | 2.5 ± 0.035 | 4.1 ± 0.19 | 2.6 ± 0.0071 | 4.3 ± 0.28 |
| Poly(AA:CUR) | 2.6 ± 0.000 | 3.8 ± 0.21 | 2.6 ± 0.000 | 3.8 ± 0.000 | 2.7 ± 0.0071 | 3.9 ± 0.11 |
| Poly(FA:CUR) | 2.5 ± 0.0071 | 3.8 ± 0.064 | 2.5 ± 0.0071 | 3.8 ± 0.18 | 2.7 ± 0.0071 | 4.2 ± 0.099 |
| Poly(AA:FA:CUR) | 2.7 ± 0.014 | 3.8 ± 0.078 | 2.4 ± 0.049 | 3.7 ± 0.021 | 2.7 ± 0.014 | 3.9 ± 0.078 |
Table 7.
Miller indices (hkl) corresponding to the diffraction peaks of polymeric particles of AA:FA, FA:CUR, and AA:FA:CUR with 5 wt.% of chelating agents titrated with CaCl2.
Table 7.
Miller indices (hkl) corresponding to the diffraction peaks of polymeric particles of AA:FA, FA:CUR, and AA:FA:CUR with 5 wt.% of chelating agents titrated with CaCl2.
| Miller indices (hkl) associated with 2θ values in cubic crystal systems | |||||
| 2θ (°) |
Calculated dhkl (Å) |
1 / d2 (Å-2) |
1/d2/0.09366 (Å-2) |
Common Factor (CF) divided by 0.03122 |
Calculated (hkl) |
| 27.26 | 3.268 | 0.09366 | 1.000 | 3.000 | 111 |
| 31.56 | 2.831 | 0.1247 | 1.332 | 3.995 | 200 |
| 45.36 | 1.997 | 0.2508 | 2.677 | 8.032 | 220 |
| 54.06 | 1.694 | 0.3483 | 3.719 | 11.16 | 311 |
| 56.38 | 1.630 | 0.3764 | 4.019 | 12.06 | 222 |
| 66.14 | 1.411 | 0.5022 | 5.362 | 16.09 | 400 |
| 75.16 | 1.263 | 0.6273 | 6.698 | 20.09 | 420 |
Table 8.
Miller indices (hkl) corresponding to the diffraction peaks of polymeric particles of AA:FA, FA:CUR, and AA:FA:CUR with 5 wt.% of chelating agents titrated with MgCl2.
Table 8.
Miller indices (hkl) corresponding to the diffraction peaks of polymeric particles of AA:FA, FA:CUR, and AA:FA:CUR with 5 wt.% of chelating agents titrated with MgCl2.
| Miller indices (hkl) associated with 2θ values in hexagonal close-packed systems | |||||
| 2θ (°) |
Calculated dhkl (Å) |
1 / d2 (Å-2) |
1/d2/0.1264 (Å-2) |
(h k l) |
Calculated dhkl (Å) |
| 31.78 | 2.812 | 0.1264 | 1.000 | 100 | 2.812 |
| 45.52 | 1.990 | 0.2524 | 1.997 | 001 | 1.990 |
| 56.56 | 1.625 | 0.3786 | 2.994 | 110 | 1.624 |
| 66.24 | 1.409 | 0.5035 | 3.983 | 200 | 1.406 |
| 75.34 | 1.260 | 0.6299 | 4.982 | 111 | 1.258 |
Table 9.
Thermodynamic interaction parameters for the binding of chelating groups with calcium chloride (CaCl2) and magnesium chloride (MgCl2).
Table 9.
Thermodynamic interaction parameters for the binding of chelating groups with calcium chloride (CaCl2) and magnesium chloride (MgCl2).
| System | n |
Kb (M-1) |
ΔG (kJ mol-1) |
ΔH (kJ mol-1) |
TΔS (kJ mol-1) |
| AA – CaCl2 | 0.1× 10⁻¹ | 4.9 × 10 | -9.66 | -109 | -99.2 |
| FA – CaCl2 | 1.0 × 101 | 1.25 × 10² | -12.0 | -0.96 | 11.0 |
| CUR – CaCl2 | 8.7 × 10⁻³ | 3.9 × 10² | -13.8 | -335 | -321 |
| AA – MgCl2 | 18.7 × 10⁻¹ | 1.73 × 10² | -7.07 | -3.56 | 3.51 |
| FA – MgCl2 | 14.1 × 10⁻¹ | 2.27 × 10 | -7.75 | -15.5 | -7.73 |
| CUR – MgCl2 | 3.39 × 10⁻¹ | 2.98 × 10² | -12.6 | -15.6 | -3.02 |
Table 5.
Zeta potential (ζ) values of polymeric particles with 1 wt.%, 3 wt.% and 5 wt.% of chelating agents.
Table 5.
Zeta potential (ζ) values of polymeric particles with 1 wt.%, 3 wt.% and 5 wt.% of chelating agents.
| Zeta potential,ζ (mV) | |||
| Material | 1 wt.% | 3 wt.% | 5 wt.% |
| Poly(AA:FA) | – 38.7 ± 0.606 | – 33.7 ± 0.130 | – 43.8 ± 0.296 |
| Poly(AA:CUR) | – 35.5 ± 0.435 | – 30.1 ± 0.730 | – 27.0 ± 0.224 |
| Poly(FA:CUR) | – 34.0 ± 1.00 | – 32.4 ± 1.38 | – 33.3 ± 0.482 |
| Poly(AA:FA:CUR) | – 35.1 ± 0.820 | – 41.5 ± 2.41 | – 32.9 ± 1.52 |
Disclaimer/Publisher’s Note: The statements, opinions and data contained in all publications are solely those of the individual author(s) and contributor(s) and not of MDPI and/or the editor(s). MDPI and/or the editor(s) disclaim responsibility for any injury to people or property resulting from any ideas, methods, instructions or products referred to in the content. |
© 2025 by the authors. Licensee MDPI, Basel, Switzerland. This article is an open access article distributed under the terms and conditions of the Creative Commons Attribution (CC BY) license (http://creativecommons.org/licenses/by/4.0/).
Copyright: This open access article is published under a Creative Commons CC BY 4.0 license, which permit the free download, distribution, and reuse, provided that the author and preprint are cited in any reuse.


