
Submitted:
03 September 2025
Posted:
04 September 2025
You are already at the latest version
Abstract
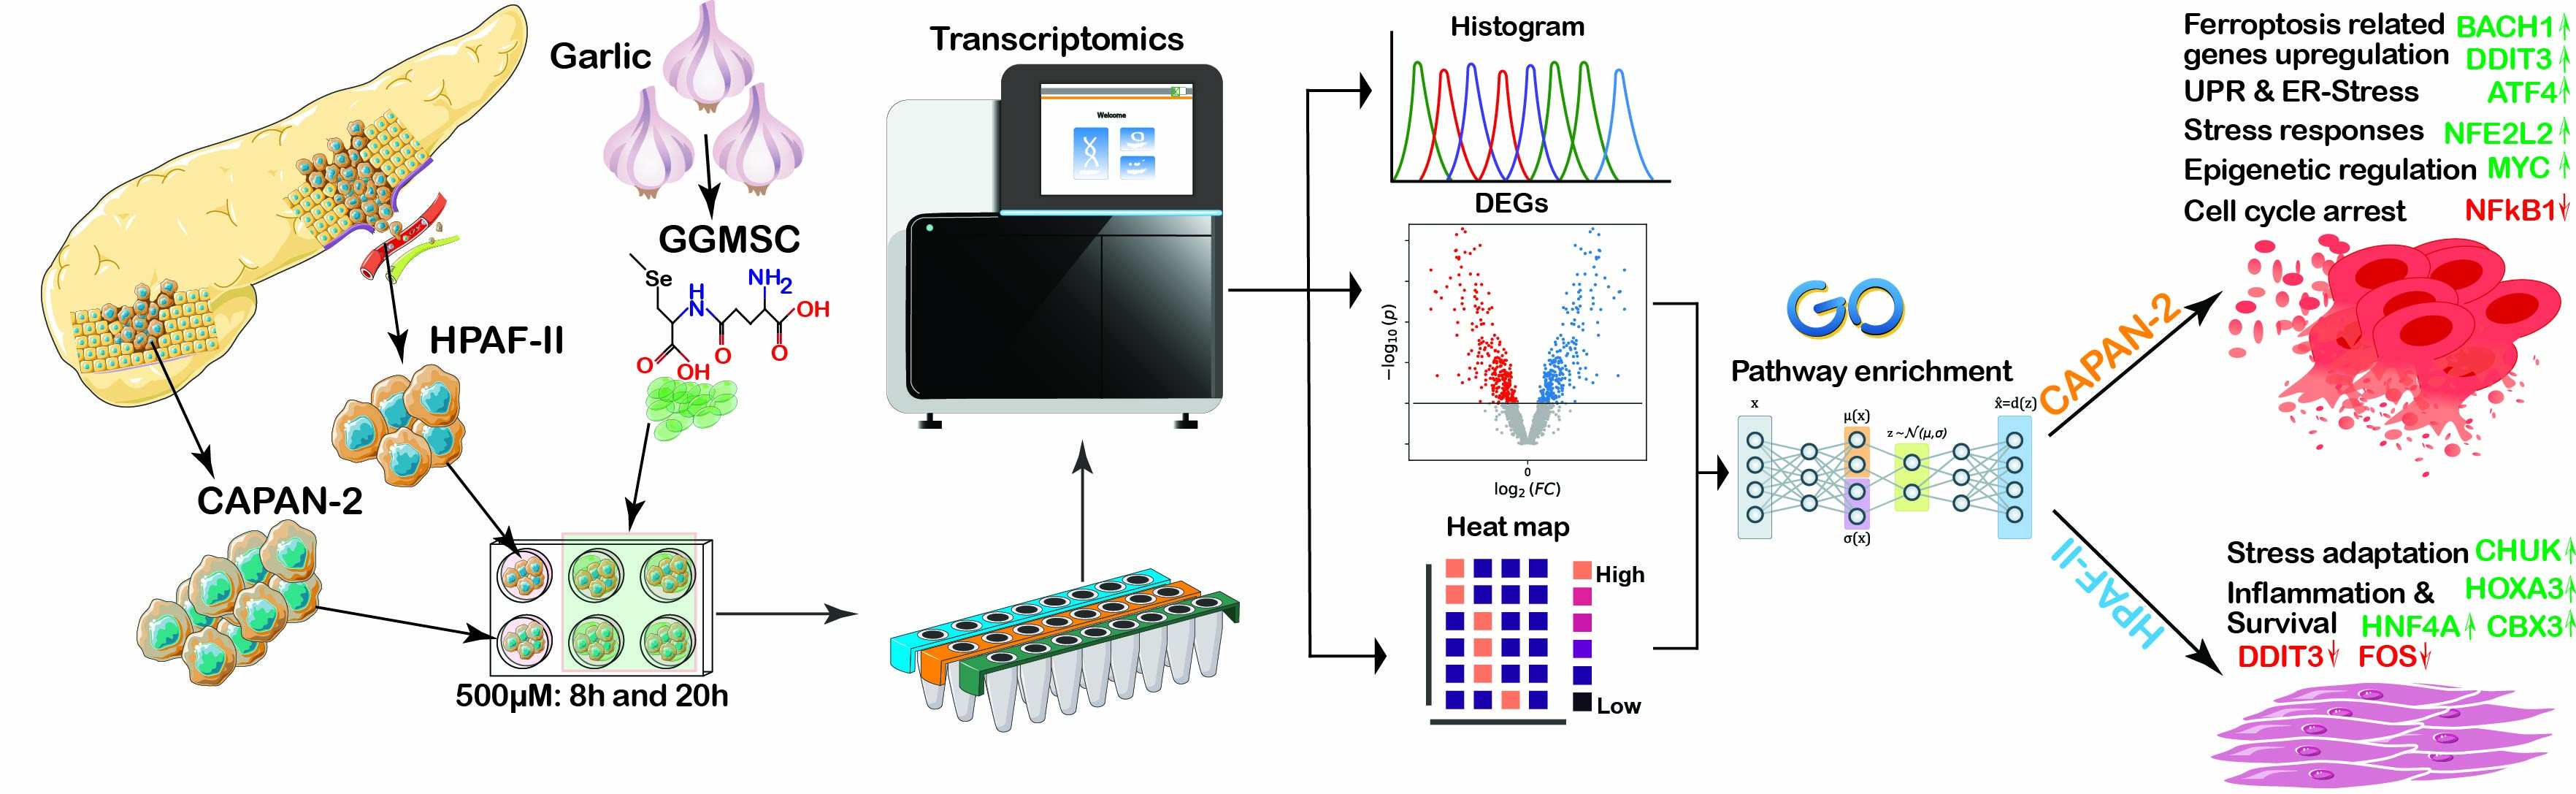
Pancreatic ductal adenocarcinoma (PDAC) remains a highly aggressive malignancy with limited treatment options. Targeting metabolic vulnerabilities and disrupting redox stress pathways has gained increasing attention as a potential therapeutic strategy. γ-Glutamyl-selenomethylselenocysteine (GGMSC) is a selenium-containing compound structurally related to seleno-L-methylselenocysteine (MSC), has shown anticancer potential in preclinical models, although its molecular effects in PDAC are not well defined. In this study, we investigated the transcriptomic response to high-dose GGMSC in two PDAC cell lines, CAPAN-2 and HPAF-II. RNA sequencing and cytotoxicity assays revealed marked sensitivity to GGMSC in CAPAN-2 cells, associated with activation of oxidative stress and ferroptosis-related pathways, alongside downregulation of metabolic and cell cycle genes. Conversely, HPAF-II cells displayed limited transcriptional alterations and maintained proliferative and metabolic programs. These findings offer insights into the molecular mechanisms underlying GGMSC-induced transcriptional responses in PDAC and suggest potential avenues for future investigations of selenium-based therapies in pancreatic cancer.
Keywords:
Gamma-Glutamyl-selenomethylselenocysteine
; Pancreatic ductal adenocarcinoma
; Selenium cytotoxicity
; Redox regulation
; Ferroptosis
; Epigenetic modification
Introduction
Pancreatic ductal adenocarcinoma (PDAC) is among the most aggressive and lethal malignancies, characterized by late diagnosis, high metastatic potential, and resistance to conventional therapies. Despite advances in surgical techniques and chemotherapeutic regimens, the five-year survival rate for PDAC remains below 10% [1,2,3]. The dense stromal environment, metabolic plasticity, and redox imbalances within PDAC tumors contribute to their poor therapeutic responsiveness and highlight the need for novel treatment approaches [4]. Targeting metabolic vulnerabilities and oxidative stress has emerged as a promising strategy in PDAC therapy. Recent studies have shown that pathways regulating redox homeostasis, like the KEAP1-NRF2 axis, and cell death mechanisms like ferroptosis, play critical roles in PDAC progression and therapeutic resistance [5]. Agents capable of simultaneously modulating redox homeostasis and inducing ferroptosis may offer therapeutic benefits by selectively impairing tumor cell survival mechanisms while sparing normal cells.
Selenium-based compounds have gained significant interest due to their ability to modulate oxidative stress, inhibit histone deacetylases (HDACs), and trigger multiple forms of cell death, including apoptosis and ferroptosis [6]. Among these, seleno-L-methylselenocysteine (MSC) has demonstrated promising anticancer efficacy in multiple preclinical models by inducing apoptosis, ferroptosis, and ER stress, and by inhibiting HDAC activity [7,8]. A structurally related analog, γ-glutamyl-selenomethylselenocysteine (GGMSC), has also shown anticancer potential [9]. GGMSC is a naturally occurring organoselenium compound predominantly found in selenium-enriched garlic, where it represents a major selenium species [10]. It has also been identified in selenium-accumulator plants such as Astragalus bisulcatus [11]. The natural occurrence of GGMSC and related selenoamino acids supports their biological relevance and highlights their potential in chemopreventive applications. GGMSC, a γ-glutamylated analog of MSC, is proposed to act as a prodrug, releasing bioactive selenium metabolites upon enzymatic cleavage. Although studies on GGMSC remain limited, available evidence suggests that it shares many mechanistic properties with MSC [10]. In rodent models, GGMSC has demonstrated comparable tumor-suppressive activity and gene expression profiles to MSC, including inhibition of tumor growth and modulation of redox pathways [10,12,13]. In vitro studies have further shown that GGMSC suppresses cancer cell growth via oxidative stress–related mechanisms, although higher doses and prolonged exposures may be necessary relative to MSC, possibly due to differences in enzymatic activation.
Given these observations, we aimed to investigate the transcriptomic effects of GGMSC in PDAC cells, with a focus on redox signaling, ferroptosis, metabolic remodeling, and cell cycle regulation. By comparing the transcriptional responses of CAPAN-2 and HPAF-II cell lines to high-dose GGMSC treatment, we sought to elucidate the molecular mechanisms underlying its cytotoxic effects and to identify potential factors contributing to differential sensitivity. This study also provides insight into the therapeutic potential of GGMSC as a redox-modulating agent in PDAC and its relation to MSC-based selenium therapies.
Materials and Methods
Cell Culture and Growth Conditions
The human pancreatic cancer cell lines HPAF-II and CAPAN-2 were obtained from the American Type Culture Collection (ATCC; CRL-1997, Wesel, Germany) and the German Collection of Microorganisms and Cell Cultures (DSMZ; ACC-245, Braunschweig, Germany), respectively. Cells were maintained in Eagle’s Minimum Essential Medium (EMEM; ATCC) supplemented with 10% heat-inactivated fetal bovine serum (FBS; Gibco, Paisley, UK) and incubated at 37 °C in a humidified atmosphere containing 5% CO₂. Antibiotics were not included in the culture medium. Mycoplasma contamination was routinely assessed. Cell numbers were determined using a TC20™ automated cell counter (Bio-Rad, Portland, ME, USA).
Prior to RNA sequencing experiments, a stepwise serum re-adaptation protocol was employed to minimize biological variability due to asynchronous cell cycling. Cells were initially cultured in EMEM without fetal bovine serum (0% FBS) to induce a transient quiescent (G0) state. Subsequently, FBS concentration was gradually increased (2%, 5%, and finally 10%), with each condition maintained for 72 hours to allow controlled re-entry into the cell cycle. Following complete re-adaptation to 10% FBS, cells were cultured for three additional passages under standard conditions before GGMSC treatment and RNA isolation. This approach helped synchronize the cellular population and ensured that most cells were in a comparable growth phase at the time of treatment, thereby reducing transcriptional noise and improving the robustness of downstream RNA-seq analysis.
GGMSC Treatment and Cytotoxicity Assay
γ-Glutamyl-selenomethylselenocysteine (GGMSC) was supplied by Sabinsa Corporation (Batch no. 129, East Windsor, NJ, USA). A 250 mM stock solution was prepared by dissolving GGMSC in sterile distilled water. For RNA sequencing experiments, CAPAN-2 and HPAF-II cells were treated with 500 µM GGMSC for either 8 or 20 hours. Control cells were cultured under identical conditions without treatment. Each treatment group was performed in three independent biological replicates to ensure experimental consistency. After treatment, cells were harvested and stored at −80 °C for subsequent RNA extraction.
Cytotoxicity assays were performed to determine the half-maximal inhibitory concentration (IC₅₀) of GGMSC. Cells were seeded in 96-well plates (BD Falcon, Durham, NC, USA) at a density of 400 cells/mm² for both cell lines. After 24 hours, cells were exposed to serial dilutions of GGMSC, with concentrations ranging up to 10 mM. Cell viability was measured at 24, 48, and 72 hours using the CellTiter-Glo® 2.0 Luminescent Cell Viability Assay (Promega, Madison, WI, USA), which quantifies intracellular ATP as an indicator of metabolic activity. Luminescence readings were collected using a CLARIOstar® Luminometer (BMG Labtech, Ortenberg, Germany). Each assay was performed in triplicate, with five independent experiments conducted for each cell line. IC₅₀ values were calculated using GraphPad Prism version 10.1.2 (GraphPad Software Inc., San Diego, CA, USA).
RNA Isolation and mRNA Library Construction
Total RNA was extracted from CAPAN-2, and HPAF-II cell lines using the Maxwell® RSC simplyRNA Cells Kit (Promega, Madison, WI, USA), which employs paramagnetic bead-based purification. RNA concentration and purity were evaluated using a NanoDrop ND-1000 Spectrophotometer (Thermo Fisher Scientific, Waltham, MA, USA). cDNA libraries were prepared according to the SMART™-seq2 protocol, which utilizes a template-switching oligonucleotide (TSO_II) for full-length cDNA synthesis [14]. In brief, 200 ng of total RNA was reverse transcribed using 1 mM dNTP mix and 1 µM VN30 Poly-T oligonucleotide tagged at the 5' end with a specific adaptor sequence (Table 1). The reaction mixture was incubated at 72 °C for 3 minutes and then cooled to 4 °C. Next, a second reaction mix was prepared containing 1× Template Switching RT Buffer, 3.75 µM Template Switching Oligo II (Integrated DNA Technologies, Leuven, Belgium), and 1× Template Switching RT Enzyme Mix (New England Biolabs, Ipswich, MA, USA). Both mixtures were combined and incubated at 42 °C for 90 minutes, followed by inactivation at 85 °C for 5 minutes. The resulting double-stranded cDNA was subjected to limited amplification using PCR_Oligo_II primers (Supplementary Table 1) and 1× Platinum SuperFi™ PCR Master Mix (Thermo Fisher Scientific, Waltham, MA, USA) in a 15 µL reaction. Amplification conditions are provided in Supplementary Table 2. Purification of amplified cDNA was performed using SPRIselect™ Bead-Based Reagent (Beckman Coulter Life Sciences, Indianapolis, IN, USA), and cDNA concentration was measured with a Qubit™ 4.0 Fluorometer (Thermo Fisher Scientific, Rockford, IL, USA).
Illumina Library Preparation and Sequencing
RNA-seq libraries were prepared using 50 ng of purified cDNA with the Illumina DNA Prep Kit (Illumina, San Diego, CA, USA) according to the manufacturer’s instructions. The protocol included tagmentation, post-tagmentation cleanup, PCR amplification, and pooling of indexed libraries. Library concentrations were determined using the Qubit™ 4.0 Fluorometer (Thermo Fisher Scientific, Rockford, IL, USA), and fragment sizes along with molarity were assessed using a Bioanalyzer™ 2100 equipped with the High Sensitivity DNA Kit (Agilent Technologies, Santa Clara, CA, USA). Final libraries were then normalized to 4 nM. Library denaturation and dilution were performed following the Illumina NextSeq System Denature and Dilute Libraries Guide (Illumina, San Diego, CA, USA). Sequencing was conducted on the Illumina NextSeq™ 500 platform, utilizing mid-output flow cells, generating approximately 130 million clusters per run in line with the manufacturer’s standard workflow.
Bioinformatics and Data Analysis
Transcriptome data were processed and analyzed using the Chipster virtual platform provided by the IT Center for Science (CSC), Finland [15]. Adapter sequences were trimmed, and sequencing read quality was assessed with FastQC. High-quality paired-end reads (15 to 20 million per sample) were aligned to the human reference genome (GRCh38.95) using the STAR aligner. Aligned reads (BAM files) were subsequently quantified at the gene level using HTSeq. Differential gene expression analysis was performed with the DESeq2 package from Bioconductor. Normalized count matrices from treated and control groups were combined for the calculation of log₂ fold changes. Genes with an adjusted p-value (padj) ≤ 0.01 and absolute log₂ fold change ≥ 1 were considered significantly differentially expressed.
Hierarchical clustering, heatmaps, and dendrograms were generated from raw gene counts normalized via DESeq2. Overrepresentation analysis of differentially expressed genes was performed using ConsensusPathDB, integrating pathways from over 30 publicly available databases. Venn diagrams illustrating overlaps in differentially expressed genes between conditions were created using Venny 2.1 (https://bioinfogp.cnb.csic.es/tools/venny/). For pathway enrichment and functional annotation, significantly differentially expressed genes (padj < 0.01) were analyzed using Enrichr (https://maayanlab.cloud/Enrichr/) to identify enriched terms from Gene Ontology (Biological Process, Cellular Component, and Molecular Function), KEGG, Reactome, and FerrDb databases [16,17,18,19]. Additional pathway resources, including Pathway Commons and STRING, were also used for functional clustering and interaction analysis [20]. Transcription factor enrichment and regulatory network analyses were conducted using ChEA3, JASPAR, EPD-TALDO1, and ChIP-Atlas databases. These tools enabled the identification of potential upstream transcriptional regulators and binding motifs associated with the differentially expressed gene sets.
Statistical Analysis
Statistical analyses were conducted using GraphPad Prism version 10.1.2 (GraphPad Software, San Diego, CA, USA) where appropriate. Differential gene expression from RNA-seq data was evaluated using the DESeq2 package within the Chipster platform, with statistical significance set at an adjusted p-value (padj) < 0.01. Cytotoxicity (IC₅₀) values were calculated from dose-response curves, and results are presented as mean ± SD from at least five biologically independent experiments, each performed in triplicate.
Results
Global Transcriptomic Profiling Reveals Distinct Gene Expression Changes upon GGMSC Treatment in PDAC Cell Lines
To investigate the global transcriptional response to GGMSC, we performed RNA sequencing on CAPAN-2, and HPAF-II pancreatic cancer cell lines treated with 500 µM GGMSC for 20 hours. Principal component analysis (PCA) demonstrated clear separation between treated and control samples in both cell lines, indicating robust transcriptional shifts following GGMSC exposure (Figure 1A–B). In CAPAN-2, the first principal component (PC1) accounted for 89% of the variance (Figure 1A), while in HPAF-II, PC1 explained 82% of the variance (Figure 1B). PCA plots for the 8-hour treatment also showed distinct clustering between conditions, albeit with lower variance explained, and are provided in Supplementary Figure 1. Differential gene expression analysis revealed a substantial number of significantly altered genes (adjusted p-value < 0.01) (Supplementary File 1). In CAPAN-2 cells, volcano plots highlighted upregulation of genes including GDF15, HERPUD1, HSPA5, NNMT, and CORO1A, while PHF19, PMF1, and HMGN2 were among the most downregulated transcripts (Figure 1C). In HPAF-II cells, GGMSC treatment led to strong upregulation of HOXA3, RASSF3, HNRNPH1, EGR1, and BROX, while IDH2, RPUSD3, VGLL4, and MDK were markedly downregulated (Figure 1D). Quantitative comparison of differentially expressed genes at both 8h and 20h timepoints revealed a time-dependent increase in transcriptional alterations in both cell lines (Figure 1E–F). Cells exhibited a greater number of DEGs at 20 hours compared to 8 hours (Figure 1E), a pattern similarly observed in HPAF-II (Figure 1F).
Common and Cell Line-Specific Gene Expression Profiles Induced by GGMSC
To assess shared versus unique responses to GGMSC, we identified differentially expressed genes (DEGs) at both 8-hour and 20-hour timepoints using a stringent cutoff of adjusted p-value < 0.01. A summary of DEG counts for CAPAN-2 and HPAF-II is presented in Table 1. We then focused on representative genes consistently altered in both cell lines after 20 hours of treatment. Bar plots of selected transcripts showed clear cell line–specific expression patterns, with genes like ASF1A, LRPAP1, and S100A16 upregulated in both cell lines, and others, including IDH2, CFD, GALK1, and TMED1 showing distinct regulation (Supplementary Figure 2A–B). We identified 392 commonly regulated genes across both cell lines (14.7% overlap), including ASF1A, LRPAP1, ERRFI1, and LENG8, suggesting these may represent core components of the GGMSC response (Figure 2A). Applying an additional log2 fold change cutoff (|log2FC| > 1) refined this list to high-confidence DEGs involved in mitochondrial metabolism, RNA processing, and chromatin remodelling, including IDH2, RPUSD3, VGLL4, MDK, and RAMP1 (Figure 2B). A subset of twelve genes, including ERRFI1, IDH2, ASF1A, GALK1, S100A16, TMED1, TUBA1B, and CFD, showed coordinated expression between the two cell lines, reflecting a conserved transcriptional module triggered by GGMSC (Figure 2C).
GGMSC Modulates Functional Pathways Associated with Oxidative Stress, Metabolic Rewiring, and Chromatin Regulation
To uncover functional mechanisms underlying the transcriptional changes, we performed pathway enrichment analysis using DEGs from CAPAN-2 and HPAF-II at 20 hours. Significantly enriched pathways were grouped into stress responses, redox regulation, mitochondrial function, and chromatin dynamics (Table 2). CAPAN-2 cells showed strong activation of the unfolded protein response (UPR), ER stress, and oxidative stress signalling, with upregulation of KEAP1-NFE2L2 and nuclear NRF2 target pathways. These effects were accompanied by enhanced expression of mitochondrial metabolism and ferroptosis-associated genes. In contrast, HPAF-II exhibited milder stress induction and downregulation of ferroptosis and glutathione metabolism genes, reflecting partial resistance. GGMSC also repressed cell cycle and DNA replication programs in CAPAN-2, consistent with the action of its active metabolite β-methylselenopyruvate (MSP), known to inhibit histone deacetylases (HDACs). Downregulation of genes involved in chromosome condensation and histone acetylation supports epigenetic repression. CAPAN-2 cells further showed enrichment of autophagy and ferroptosis programs, while HPAF-II downregulated apoptotic regulators, indicating a survival-oriented phenotype (Table 2).
Significantly enriched pathways (adjusted p-value < 0.01) were identified in CAPAN-2 and HPAF-II cells treated with 500 µM GGMSC for 20 hours. Pathways are organized into five major biological themes: (1) Oxidative stress and NRF2 signaling, (2) ER stress and proteostasis, (3) Mitochondrial and metabolic regulation, (4) Cell cycle and DNA repair, and (5) Cell death and survival. Adjusted p-values for each cell line are shown individually when available. Direction of regulation indicates whether genes contributing to the pathway were predominantly upregulated or downregulated. Notably, the observed downregulation of cell cycle- and chromatin-related pathways is consistent with GGMSC's function as a methylselenol prodrug (MSP), potentially acting through HDAC inhibition and epigenetic modulation.
Transcription Factor Responses Mirror Stress Sensitivity and Resistance
We next profiled differentially expressed transcription factors (TFs) to understand cell line–specific regulatory shifts. CAPAN-2 upregulated stress-associated TFs, including DDIT3 (CHOP), ATF4, NFE2L2 (NRF2), and BACH1, while suppressing NFKB1, suggesting a shift toward a pro-death, oxidative stress-driven program (Table 3). In contrast, HPAF-II upregulated HOXA3, HNF4A, CBX3, and CHUK, consistent with epithelial identity and sustained NF-κB signalling. Downregulation of DDIT3 in HPAF-II further indicates attenuation of the ER stress–induced apoptotic pathway (Table 3). These contrasting TF signatures are presented in Supplementary Figure 2C and support a model where CAPAN-2 activates transcriptional repression and death, while HPAF-II maintains survival pathways.
GGMSC Induces Metabolic Stress and Ferroptosis in CAPAN-2 Cells
We categorized DEGs by pathway to explore GGMSC’s effects on metabolism, stress, and regulated cell death. HPAF-II showed strong downregulation of metabolic genes across glycolysis, PPP, TCA cycle, and OXPHOS, consistent with suppressed energy metabolism (Figure 2D). CAPAN-2 retained metabolic gene expression, suggesting mitochondrial engagement (Figure 2D). Stress-related transcripts including DDIT3, HIF1A, and SLC2A1 were highly enriched in CAPAN-2 (Figure 3A). Supplementary Figure 2D shows additional oxidative stress genes (TXNRD1, GLRX, HMOX1) selectively upregulated in CAPAN-2. CAPAN-2 also upregulated ferroptosis inducers (ACSL4, ALOX5, CHAC1, ATF4, HMOX1), while HPAF-II did not (Figure 3B). A broader analysis of cell death and survival genes revealed repression of ferroptosis inhibitors (IDH2, ACSL3, HSPA5) and upregulation of apoptosis and pro-death signals in CAPAN-2 (Figure 3C). HPAF-II instead upregulated survival-promoting transcripts. GGMSC also influenced lipid, iron, and amino acid metabolism (Supplementary Figure 3A–C), with CAPAN-2 again showing stronger transcriptional activation. These results highlight broader metabolic vulnerability in CAPAN-2.
GGMSC Suppresses Epigenetic and Antioxidant Programs While Enhancing Stress Signalling
To assess how GGMSC affects chromatin and transcriptional regulation, we evaluated genes involved in epigenetic remodelling, cell cycle control, and NRF2/ATF4 signalling (Figure 4). CAPAN-2 cells showed downregulation of chromatin remodelers (SMARCC2, EZH2, DNMT1), histone modifiers (ING5, HMGN2, SETD7, KAT6B), and nucleosome assembly genes (ATRX, HZAZ1, ANP32B) (Figure 4A). Cell cycle regulators, including cyclins (CCNA2, CCNB2, CCND1), and PSMCs (PSMC1 to PSMC5), and DNA replication machinery (MCM3, MCM4, MCM6, MCM10, PLK2), were suppressed in CAPAN-2 (Figure 4B), consistent with growth arrest. CAPAN-2 also strongly upregulated NRF2 and ATF4 target genes involved in redox balance, ER stress, and amino acid metabolism (HMOX1, GCLC, TXNRD1, SLC7A11, CHAC1, SLC1A5, DDIT3, HERPUD1, and PSAT1) (Figure 4C–D). These genes are central to the unfolded protein response, amino acid metabolism, and ferroptosis, supporting a transcriptional program shaped by ER stress and metabolic adaptation. In contrast, HPAF-II showed minimal induction of these programs. Cytotoxicity assays confirmed that CAPAN-2 was more sensitive to GGMSC than HPAF-II, consistent with its transcriptional profile of stress and death activation (Supplementary Figure 3D). These findings demonstrate that GGMSC induces profound metabolic, transcriptional, and epigenetic stress in CAPAN-2, while HPAF-II maintains resistance through retained antioxidant and proliferative signalling.
Discussion:
Pancreatic ductal adenocarcinoma (PDAC) remains one of the most lethal malignancies, with a 5-year survival rate of less than 10%, posing a major clinical challenge and highlighting the urgent need for new therapeutic strategies [1,3]. The aggressive nature of PDAC, combined with its dense stromal environment and metabolic plasticity, contributes to poor drug penetration and therapeutic resistance [4,21]. Given these barriers, there is growing interest in agents targeting metabolic vulnerabilities and redox imbalances unique to PDAC.
Selenium-based compounds, including seleno-L-methylselenocysteine (MSC) and its structural analogues, have emerged as promising anticancer agents due to their ability to modulate redox balance and epigenetic regulation. MSC has been shown to induce apoptosis, inhibit histone deacetylases (HDACs), and sensitize cancer cells to ferroptosis and ER stress [7,22,23]. GGMSC, a glutamyl-conjugated derivative of MSC, retains similar biological activity but requires higher doses for activation, suggesting differential metabolic processing [10]. Despite limited literature specifically on GGMSC, its structural similarity to MSC and preliminary reports of redox activity and growth inhibition in various cancers make it a strong candidate for further investigation [24]. Supporting this, GGMSC has demonstrated anticancer efficacy in rat models, where it produced gene expression changes like MSC and inhibited tumour progression similar to MSC [12,13].
In this study, we investigated the transcriptomic response to high-dose GGMSC (500 µM) in two PDAC cell lines, CAPAN-2 and HPAF-II, and uncovered distinct mechanisms underlying their differential sensitivity. Our results demonstrate that GGMSC induces widespread gene expression changes in both cell lines, with CAPAN-2 exhibiting a robust stress response and cell death signature, while HPAF-II maintained metabolic and proliferative programs, indicative of resistance.
Oxidative stress, ferroptosis, and ER stress emerged as key themes in CAPAN-2 cells following GGMSC treatment. Ferroptosis-related genes were selected based on FerrDb and Enrichr pathway enrichment. Notably, genes regulated by the ATF4–CHOP (DDIT3) and NRF2 (NFE2L2) pathways were strongly upregulated, including HMOX1, GCLC, TXNRD1, and CHAC1. This dual activation of ATF4 and NRF2 suggests a coordinated response to redox and proteotoxic stress, consistent with studies demonstrating their synergistic role in promoting ferroptosis and apoptotic responses [9,25,26]. In addition, CAPAN-2 cells showed upregulation of ferroptosis inducers (e.g., ACSL4, ALOX5, CHAC1) and repression of ferroptosis suppressors, suggesting engagement of ferroptotic cell death pathways [27,28,29]. Mechanistically, the gene clusters induced by GGMSC in CAPAN-2 align with known regulators of ferroptosis, ER stress, and metabolic reprogramming. The upregulation of ATF4-DDIT3-CHAC1 and NRF2-HMOX1-SLC7A11 modules mirrors ferroptosis execution pathways, while suppression of TCA cycle and oxidative phosphorylation components suggests mitochondrial dysfunction. These patterns distinguish GGMSC from other selenium compounds that mainly drive apoptosis or cell cycle arrest, positioning GGMSC as a dual modulator of ferroptosis and metabolic shutdown [30]. In addition, GGMSC-induced metabolic reprogramming in CAPAN-2 was marked by downregulation of glycolytic enzymes, suppression of TCA cycle components, and reduced oxidative phosphorylation gene expression, suggesting energetic and biosynthetic constraints that heighten redox vulnerability.
In contrast, HPAF-II cells exhibited limited induction of redox stress response genes and maintained expression of core metabolic and cell cycle regulators. Upregulation of transcription factors, including HOXA3, HNF4A, and CBX3, along with NF-κB pathway component CHUK, suggests a more epithelial and proliferative phenotype. Downregulation of DDIT3 (CHOP) and limited NRF2/ATF4 activation in HPAF-II may reflect protective transcriptional programs that buffer against oxidative and proteotoxic stress. Although direct evidence in PDAC is limited, low CHOP expression has been associated with poor clinical outcomes, implying resistance to ER stress-induced apoptosis and restrained NRF2 activity can foster adaptive stress responses without initiating cell death [31,32]. These mechanisms may partially explain HPAF-II’s reduced sensitivity to GGMSC.
Many of the transcriptional signatures observed with GGMSC resemble those previously reported for MSC, including NRF2 and ATF4 activation, HDAC inhibition, and ferroptosis induction [33]. In our prior study, MSC at lower concentrations (250 µM) triggered similar gene expression patterns in CAPAN-2 and PANC1 cells, implicating hKYAT1-mediated bioactivation as a key step [33]. GGMSC appears to require higher concentrations and longer treatment durations for similar effects, likely due to lower enzymatic cleavage efficiency, suggesting involvement of alternative enzymes in its activation.
GGMSC is thought to be a prodrug, cleaved by γ-glutamyl transpeptidase (GGT) to release MSC, subsequently metabolized to methylselenol (CH₃SeH) and β-methylselenopyruvate (MSP) by hKYAT1 [10,34]. Although this enzymatic cascade has not been directly confirmed for GGMSC, it is supported by analogies to other γ-glutamyl selenium compounds. GGTs are well-known to catalyze the hydrolysis of γ-glutamyl bonds in xenobiotics and endogenous compounds (including glutathione and GPNA), releasing cysteinylglycine derivatives further processed by dipeptidases to yield active metabolites [35,36,37]. GGT-mediated cleavage thus remains a plausible activation route for GGMSC. Differential GGT activity between CAPAN-2 and HPAF-II could contribute to their distinct cytotoxic responses. Moreover, GGMSC may exhibit selective toxicity toward tumours due to elevated GGT expression in many cancers, with lower GGT expression in normal tissues potentially sparing non-tumour cells [38,39]. GGT is frequently overexpressed in cancers and is linked to tumour progression, chemoresistance, and poor prognosis [38,39,40,41]. This supports the hypothesis that GGMSC activation may be enhanced in tumours with elevated GGT activity, potentially explaining the higher sensitivity of CAPAN-2.
The therapeutic implications of these findings are significant. Key proliferation markers, including PCNA, MKI67, TOP2A, CHEK1, and UBE2C, were markedly downregulated in CAPAN-2 following GGMSC treatment [42,43]. This highlights a robust cell cycle arrest, reinforcing GGMSC's potential to suppress proliferation in aggressive PDAC. CAPAN-2’s vulnerability suggests that biomarkers like high ATF4/NRF2 expression or ferroptosis sensitivity may guide patient stratification. In contrast, HPAF-II’s resistance underscores the potential benefit of combining GGMSC with NF-κB inhibitors, ferroptosis enhancers, or chromatin modulators. The broad transcriptional reprogramming induced by GGMSC—including suppression of cell cycle genes, epigenetic regulators, and mitochondrial metabolism—supports its utility as a multi-targeted anticancer agent.
In conclusion, our transcriptomic profiling reveals that GGMSC exerts potent cytotoxic effects in PDAC cells through coordinated activation of redox and stress-responsive pathways, particularly in CAPAN-2. The differential responses highlight the importance of understanding cellular context for therapeutic optimization and provide a rationale for exploring GGMSC in combination therapies for PDAC.
Supplementary Materials
The following supporting information can be downloaded at the website of this paper posted on Preprints.org.
Author Contributions
Conceptualization: A.K.S., and M.B. Data curation: A.K.S., and M.G. Formal analysis: A.K.S., and M.G. Funding acquisition: M.B., and J.D. Investigation: A.K.S., and M.G. Methodology: A.K.S., and M.G. Project administration: A.K.S., and M.G. Software: A.K.S., and M.G. Resources: M.B., and J.D. Supervision: A.K.S., and M.B. Validation: A.K.S., and M.G. Visualization: A.K.S., and M.G. Writing-original draft: A.K.S. Writing-review & editing: A.K.S., J.D., M.B., S.M., and M.G. All authors have read and agreed to the published version of the manuscript.
Funding
Cancerfonden (23 2796Pj 01 H), Radiumhemmets Forskningsfounder (231082), CIMED (FoUI-976014), Cancer och Allergifonden (2025), and Karolinska Institutet to M.B. ALF (RS2020-0731) to J.D. The authors declare that no financial support for the research, authorship or publication of this article was received from Sabinsa Corporation.
Data availability statement
The datasets generated and/or analyzed during the current study, including RNA-sequencing data are available from the corresponding author upon request.
Acknowledgment
We gratefully acknowledge Dr. Kalyanam Nagabhushanam (1950–2024) for initiating our collaboration and providing the GGMSC compound used in this study. This work is dedicated to his memory in recognition of his contributions to selenium-based research. The graphical abstract was partly created using icons from Bioicons.com (Xi-Chen, Simon Dürr, Lucas Diedrich, Marcel Tisch, Umasstr, Servier, Chenxin Li, and Helicase), and Servier Medical Art (https://smart.servier.com), provided by Servier, licensed under Creative Commons Attribution CC0, CC BY 3.0 and CC BY 4.0. The authors gratefully acknowledge the contributors for making these resources freely available.
Conflicts of Interest
M.B. is listed as an inventor in a patent application for i.v. use of inorganic selenium in cancer patients and holds shares in SELEQ OY, a company involved in the development of Se-based formulations for prevention and treatment. S.M. is the CEO of Sabinsa Corporation. The research was conducted independently and in the absence of any commercial or financial relationships that could be construed as a potential conflict of interest.
Abbreviation
| GGMSC | Gamma-Glutamyl-selenomethylselenocysteine |
| MSC | Selenomethylselenocysteine |
| PDAC | Pancreatic ductal adenocarcinoma |
| hKYAT1 | Human kynurenine aminotransferase 1 |
| HDAC | Histone deacetylases |
| ER | Endoplasmic reticulum |
| TCA | Tricarboxylic acid |
| GGT | Gamma-glutamyl transpeptidase |
References
- Rahib L, Smith BD, Aizenberg R, Rosenzweig AB, Fleshman JM, Matrisian LM. Projecting cancer incidence and deaths to 2030: the unexpected burden of thyroid, liver, and pancreas cancers in the United States. Cancer Res. Yea;74(11):2913-21. [CrossRef]
- Kleeff J, Korc M, Apte M, La Vecchia C, Johnson CD, Biankin AV, et al. Pancreatic cancer. Nature Reviews Disease Primers. Yea;2(1):16022. [CrossRef]
- Vincent A, Herman J, Schulick R, Hruban RH, Goggins M. Pancreatic cancer. Lancet. Yea;378(9791):607-20. [CrossRef]
- Hidalgo M. Pancreatic Cancer. New England Journal of Medicine. Yea;362(17):1605-17. [CrossRef]
- Badgley MA, Kremer DM, Maurer HC, DelGiorno KE, Lee HJ, Purohit V, et al. Cysteine depletion induces pancreatic tumor ferroptosis in mice. Science. Yea;368(6486):85-9. [CrossRef]
- Misra S, Boylan M, Selvam A, Spallholz JE, Bjornstedt M. Redox-active selenium compounds--from toxicity and cell death to cancer treatment. Nutrients. Yea;7(5):3536-56. [CrossRef]
- Ip C, Thompson HJ, Zhu Z, Ganther HE. In vitro and in vivo studies of methylseleninic acid: evidence that a monomethylated selenium metabolite is critical for cancer chemoprevention. Cancer Res. Yea;60(11):2882-6.doi:.
- Chen W, Hao P, Song Q, Feng X, Zhao X, Wu J, et al. Methylseleninic acid inhibits human glioma growth in vitro and in vivo by triggering ROS-dependent oxidative damage and apoptosis. Metab Brain Dis. Yea;39(4):625-33. [CrossRef]
- Tung YC, Tsai ML, Kuo FL, Lai CS, Badmaev V, Ho CT, et al. Se-Methyl-L-selenocysteine Induces Apoptosis via Endoplasmic Reticulum Stress and the Death Receptor Pathway in Human Colon Adenocarcinoma COLO 205 Cells. J Agric Food Chem. Yea;63(20):5008-16. [CrossRef]
- Dong Y, Lisk D, Block E, Ip C. Characterization of the biological activity of gamma-glutamyl-Se-methylselenocysteine: a novel, naturally occurring anticancer agent from garlic. Cancer Res. Yea;61(7):2923-8.doi:.
- Nigam SN, McConnell WB. Seleno amino compounds from Astragalus bisculcatus. Isolation and identification of gamma-L-glutamyl-Se-methyl-seleno-L-cysteine and Se-methylseleno-L-cysteine. Biochim Biophys Acta. Yea;192(2):185-90. [CrossRef]
- Chun JY, Nadiminty N, Lee SO, Onate SA, Lou W, Gao AC. Mechanisms of selenium down-regulation of androgen receptor signaling in prostate cancer. Mol Cancer Ther. Yea;5(4):913-8. [CrossRef]
- Dong Y, Lee SO, Zhang H, Marshall J, Gao AC, Ip C. Prostate specific antigen expression is down-regulated by selenium through disruption of androgen receptor signaling. Cancer Res. Yea;64(1):19-22. [CrossRef]
- Picelli S, Björklund ÅK, Faridani OR, Sagasser S, Winberg G, Sandberg R. Smart-seq2 for sensitive full-length transcriptome profiling in single cells. Nature Methods. Yea;10(11):1096-8. [CrossRef]
- Kallio MA, Tuimala JT, Hupponen T, Klemelä P, Gentile M, Scheinin I, et al. Chipster: user-friendly analysis software for microarray and other high-throughput data. BMC Genomics. Yea;12(1):507. [CrossRef]
- Zhou N, Yuan X, Du Q, Zhang Z, Shi X, Bao J, et al. FerrDb V2: update of the manually curated database of ferroptosis regulators and ferroptosis-disease associations. Nucleic Acids Research. Yea;51(D1):D571-D82. [CrossRef]
- Chen EY, Tan CM, Kou Y, Duan Q, Wang Z, Meirelles GV, et al. Enrichr: interactive and collaborative HTML5 gene list enrichment analysis tool. BMC Bioinformatics. Yea;14(128. [CrossRef]
- Kuleshov MV, Jones MR, Rouillard AD, Fernandez NF, Duan Q, Wang Z, et al. Enrichr: a comprehensive gene set enrichment analysis web server 2016 update. Nucleic Acids Res. Yea;44(W1):W90-7. [CrossRef]
- Xie Z, Bailey A, Kuleshov MV, Clarke DJB, Evangelista JE, Jenkins SL, et al. Gene Set Knowledge Discovery with Enrichr. Curr Protoc. Yea;1(3):e90. [CrossRef]
- Wong JV, Franz M, Siper MC, Fong D, Durupinar F, Dallago C, et al. Author-sourced capture of pathway knowledge in computable form using Biofactoid. eLife. Yea;10(e68292. [CrossRef]
- Zhao Z, Liu W. Pancreatic Cancer: A Review of Risk Factors, Diagnosis, and Treatment. Technol Cancer Res Treat. Yea;19(1533033820962117. [CrossRef]
- Hu H, Jiang C, Ip C, Rustum YM, Lü J. Methylseleninic acid potentiates apoptosis induced by chemotherapeutic drugs in androgen-independent prostate cancer cells. Clin Cancer Res. Yea;11(6):2379-88. [CrossRef]
- Selvam AK, Jawad R, Gramignoli R, Achour A, Salter H, Bjornstedt M. A Novel mRNA-Mediated and MicroRNA-Guided Approach to Specifically Eradicate Drug-Resistant Hepatocellular Carcinoma Cell Lines by Se-Methylselenocysteine. Antioxidants (Basel). Yea;10(7). [CrossRef]
- Cao S, Durrani FA, Rustum YM. Selective modulation of the therapeutic efficacy of anticancer drugs by selenium containing compounds against human tumor xenografts. Clin Cancer Res. Yea;10(7):2561-9. [CrossRef]
- Zong WX, Rabinowitz JD, White E. Mitochondria and Cancer. Mol Cell. Yea;61(5):667-76. [CrossRef]
- Dodson M, Castro-Portuguez R, Zhang DD. NRF2 plays a critical role in mitigating lipid peroxidation and ferroptosis. Redox Biol. Yea;23(101107. [CrossRef]
- Jiang X, Stockwell BR, Conrad M. Ferroptosis: mechanisms, biology and role in disease. Nat Rev Mol Cell Biol. Yea;22(4):266-82. [CrossRef]
- Li J, Cao F, Yin HL, Huang ZJ, Lin ZT, Mao N, et al. Ferroptosis: past, present and future. Cell Death Dis. Yea;11(2):88. [CrossRef]
- Liang D, Minikes AM, Jiang X. Ferroptosis at the intersection of lipid metabolism and cellular signaling. Mol Cell. Yea;82(12):2215-27. [CrossRef]
- Alim I, Caulfield JT, Chen Y, Swarup V, Geschwind DH, Ivanova E, et al. Selenium Drives a Transcriptional Adaptive Program to Block Ferroptosis and Treat Stroke. Cell. Yea;177(5):1262-79.e25. [CrossRef]
- Liu Y, Liang X, Zhang H, Dong J, Zhang Y, Wang J, et al. ER Stress–Related Genes EIF2AK3, HSPA5, and DDIT3 Polymorphisms are Associated With Risk of Lung Cancer. Frontiers in Genetics. Yea;Volume 13 - 2022. [CrossRef]
- He F, Ru X, Wen T. NRF2, a Transcription Factor for Stress Response and Beyond. Int J Mol Sci. Yea;21(13). [CrossRef]
- Mehran Ghaderi1, Joakim Dillner1,2, Mikael Björnstedt2,3 and Arun Kumar Selvam3†*. Selenomethylselenocystine Induces Phenotype-Dependent Ferroptosis and Stress-Responses via the NFE2L2–ATF4 Axis in Pancreatic Cancer. SSRN. Yea. [CrossRef]
- Nigam SN, McConnell WB. Seleno amino compounds from Astragalus bisulcatus isolation and identification of γ-L-glutamyl-Se-methyl-seleno-L-cysteine and Se-methylseleno-L-cysteine. Biochimica et Biophysica Acta (BBA) - General Subjects. Yea;192(2):185-90. [CrossRef]
- Ganther HE. Selenotrisulfides. Formation by the reaction of thiols with selenious acid. Biochemistry. Yea;7(8):2898-905. [CrossRef]
- Rooseboom M, Commandeur JN, Vermeulen NP. Enzyme-catalyzed activation of anticancer prodrugs. Pharmacol Rev. Yea;56(1):53-102. [CrossRef]
- West MB, Wickham S, Quinalty LM, Pavlovicz RE, Li C, Hanigan MH. Autocatalytic cleavage of human gamma-glutamyl transpeptidase is highly dependent on N-glycosylation at asparagine 95. J Biol Chem. Yea;286(33):28876-88. [CrossRef]
- Hanigan MH. Gamma-glutamyl transpeptidase: redox regulation and drug resistance. Adv Cancer Res. Yea;122(103-41. [CrossRef]
- Corti A, Franzini M, Paolicchi A, Pompella A. Gamma-glutamyltransferase of cancer cells at the crossroads of tumor progression, drug resistance and drug targeting. Anticancer Res. Yea;30(4):1169-81.doi:.
- Wang Q, Shu X, Dong Y, Zhou J, Teng R, Shen J, et al. Tumor and serum gamma-glutamyl transpeptidase, new prognostic and molecular interpretation of an old biomarker in gastric cancer. Oncotarget. Yea;8(22):36171-84. [CrossRef]
- Takemura K, Board PG, Koga F. A Systematic Review of Serum γ-Glutamyltransferase as a Prognostic Biomarker in Patients with Genitourinary Cancer. Antioxidants (Basel). Yea;10(4). [CrossRef]
- Whitfield ML, Sherlock G, Saldanha AJ, Murray JI, Ball CA, Alexander KE, et al. Identification of genes periodically expressed in the human cell cycle and their expression in tumors. Mol Biol Cell. Yea;13(6):1977-2000. [CrossRef]
- Fadaka AO, Bakare OO, Sibuyi NRS, Klein A. Gene Expression Alterations and Molecular Analysis of CHEK1 in Solid Tumors. Cancers (Basel). Yea;12(3). [CrossRef]
Figure 1.
GGMSC induces distinct transcriptional responses in CAPAN-2 and HPAF-II pancreatic cancer cells. (A–B) Principal component analysis (PCA) of RNA-seq data showing clear separation between control and GGMSC-treated (500 µM, 20 h) samples in CAPAN-2 (A) and HPAF-II (B) cells, indicating robust treatment-induced transcriptomic shifts. (C–D) Volcano plots illustrating differentially expressed genes (padj < 0.01) in CAPAN-2 (C) and HPAF-II (D) cells after GGMSC treatment. Blue dots represent significantly up- or downregulated genes. Selected genes of interest are labelled. (E–F) Bar plots showing the number of differentially expressed genes (padj < 0.01) in CAPAN-2 (E) and HPAF-II (F) cells following GGMSC treatment for 8 and 20 hours, indicating a time-dependent increase in transcriptional alterations.
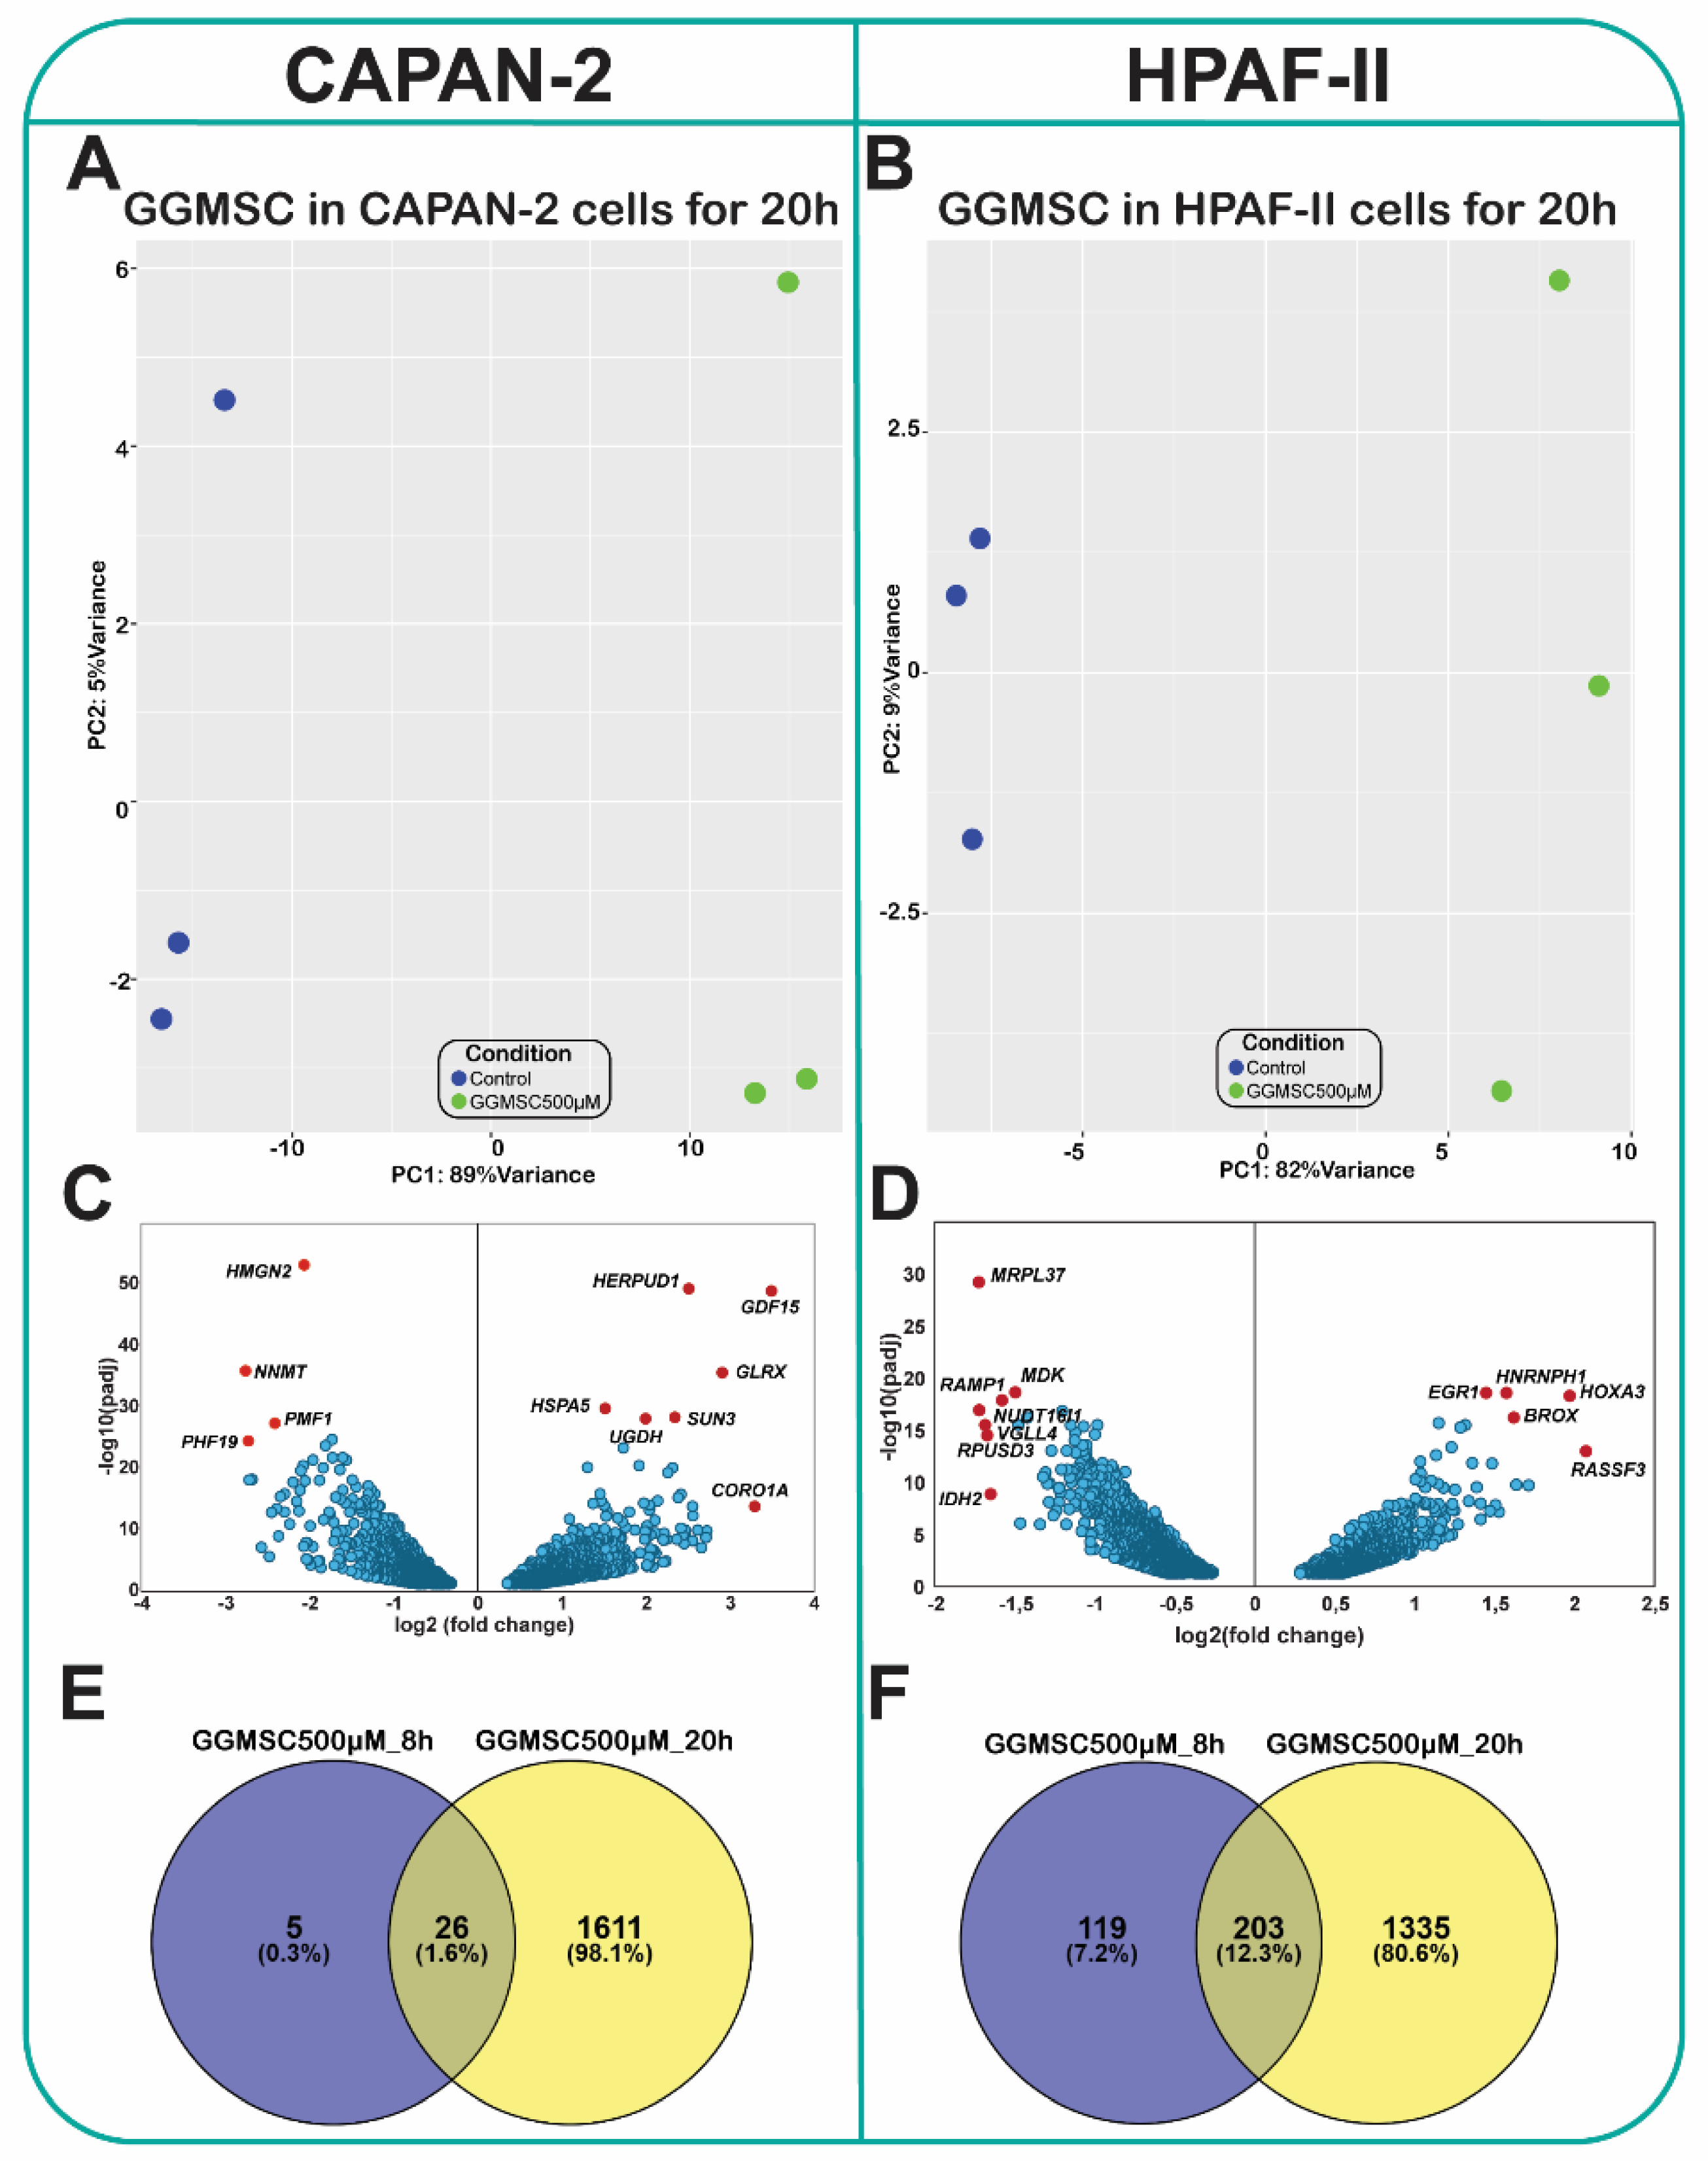
Figure 2.
Overlapping and distinct transcriptional responses to GGMSC in CAPAN-2 and HPAF-II cells. (A) Venn diagram showing overlap of significantly regulated genes in both CAPAN-2 and HPAF-II, highlighting common targets (padj < 0.01). (B) Genes significantly upregulated in both cell lines at 20 hours under a stringent threshold (padj < 0.01 and log₂FC > 1). (C) Log₂ fold changes of the 12 most significantly and commonly regulated genes across both cell lines. GGMSC reprograms metabolic pathways in CAPAN-2 and HPAF-II cells. (D) Heatmaps of differentially expressed metabolic genes related to glycolysis, the pentose phosphate pathway (PPP), the tricarboxylic acid (TCA) cycle, and oxidative phosphorylation (OXPHOS), show broad suppression in HPAF-II and maintenance in CAPAN-2.
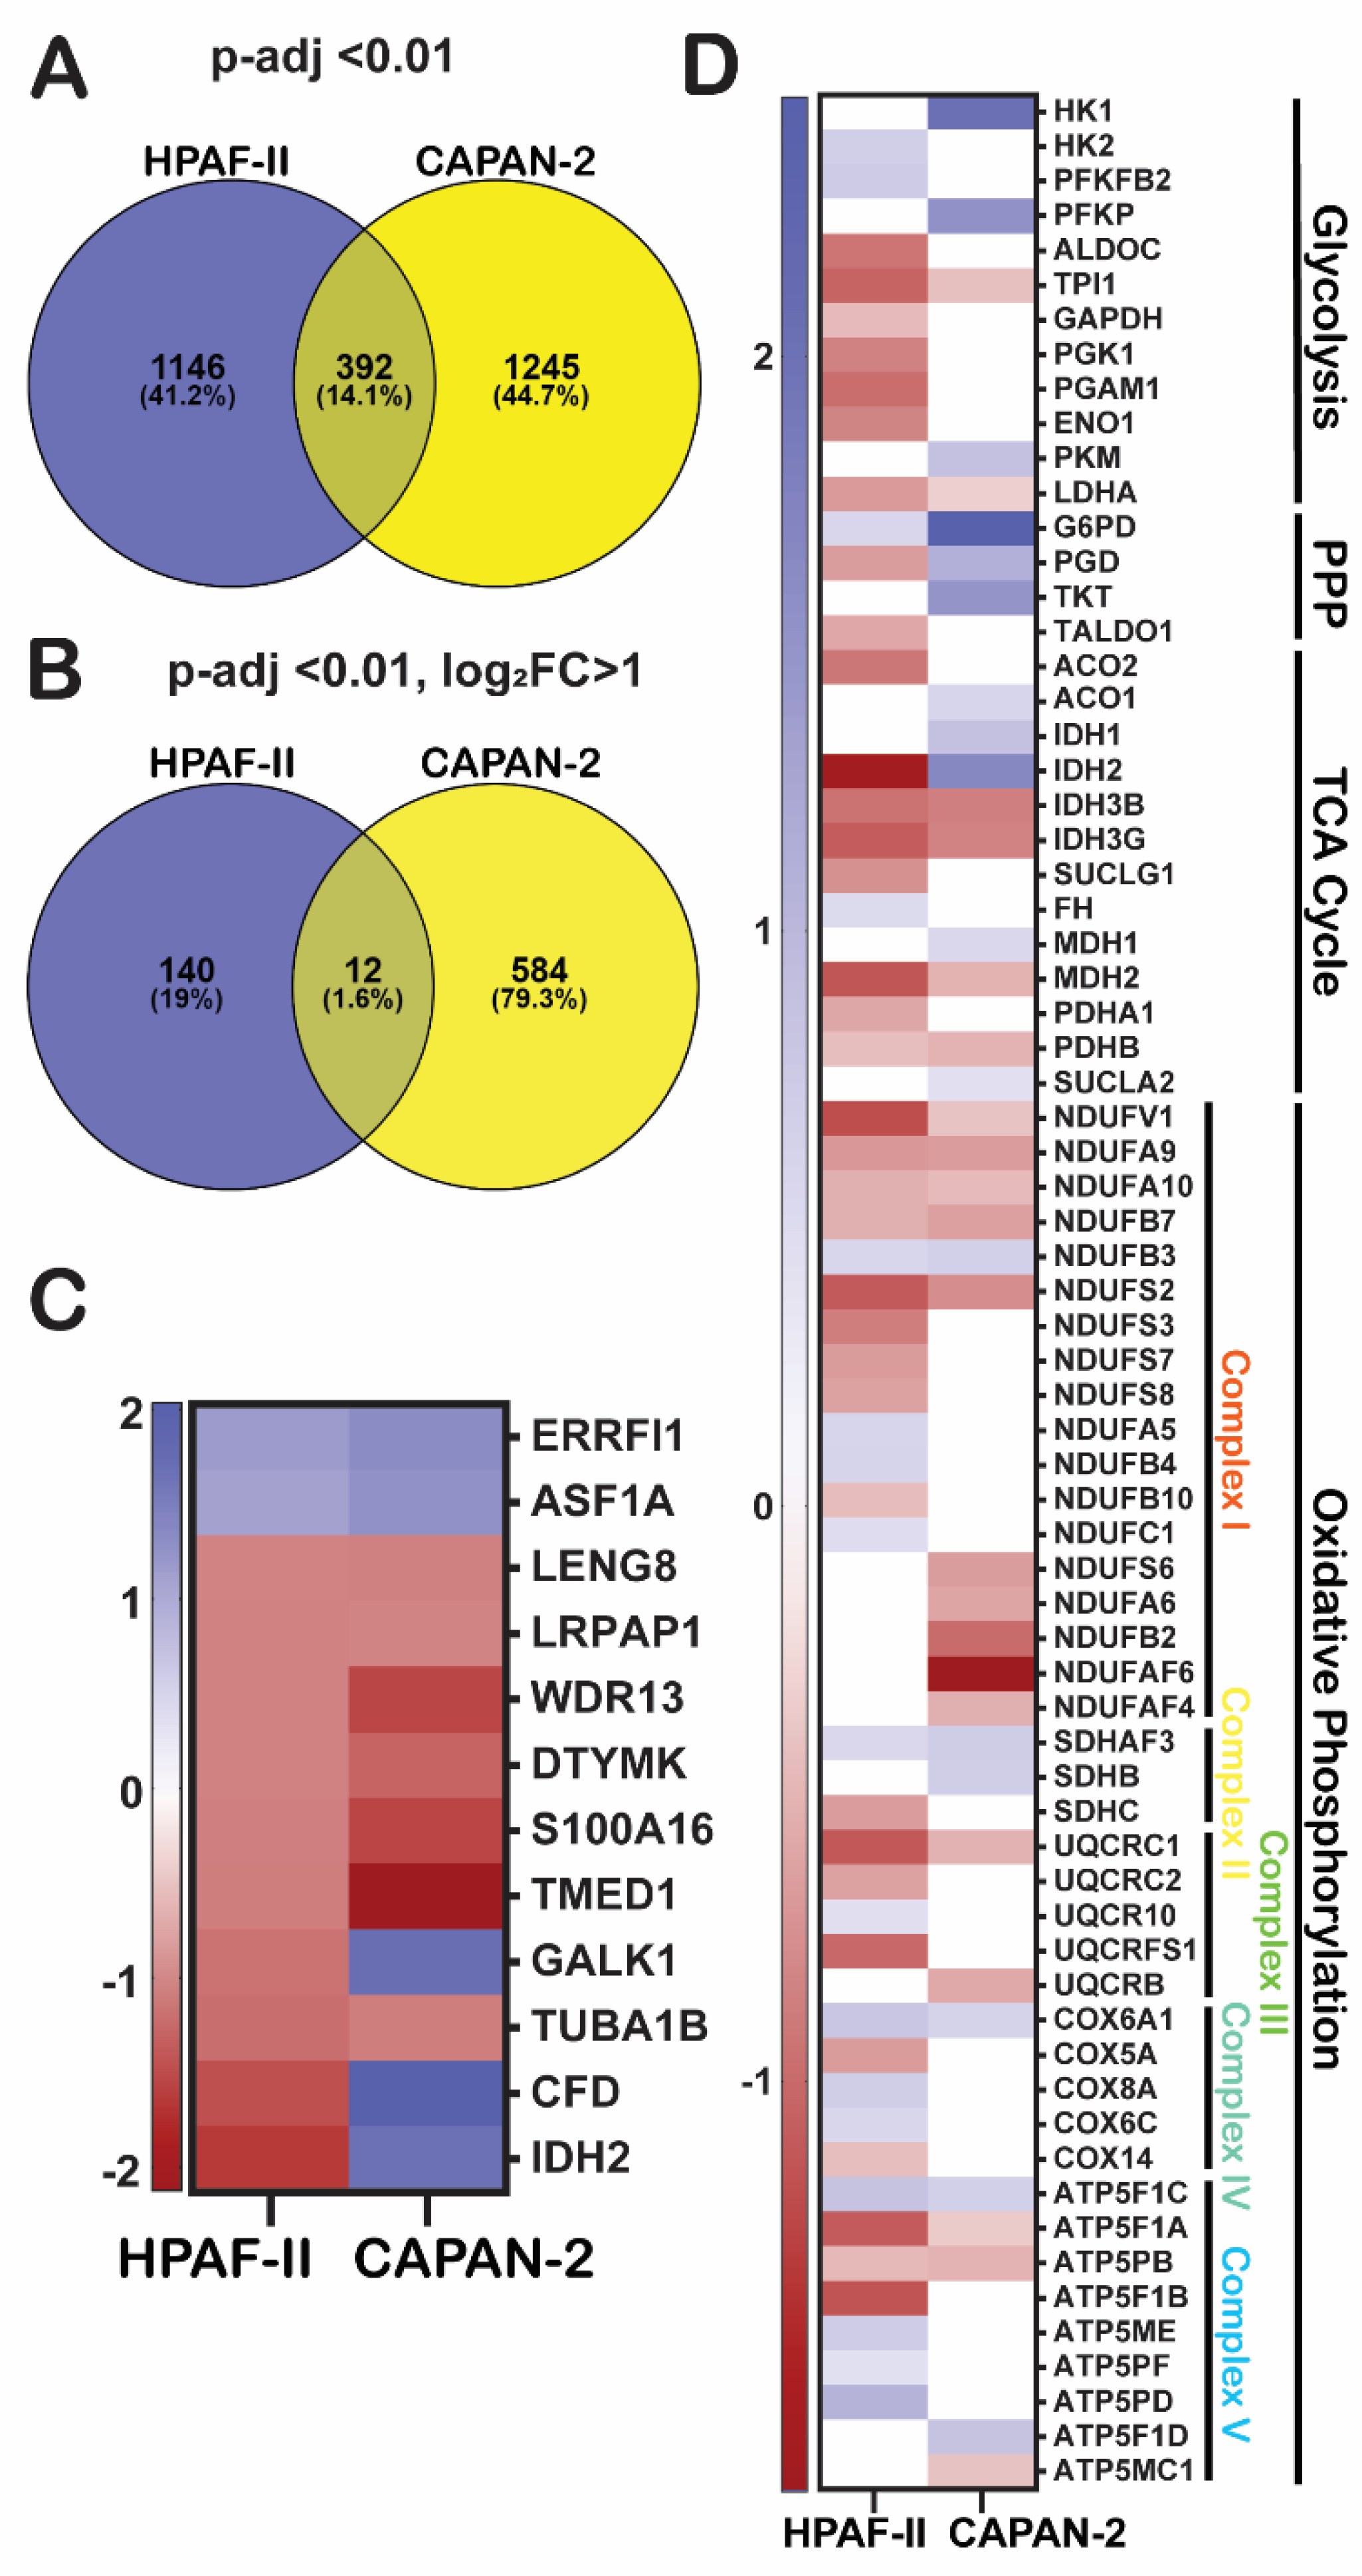
Figure 3.
GGMSC reprograms cell death pathways in CAPAN-2 and HPAF-II cells. Heatmaps of differentially expressed genes (padj < 0.01), categorized by functional pathways. (A) Stress response genes linked to ER stress, hypoxia, and lipid peroxidation are highly upregulated in CAPAN-2. (B) Ferroptosis-inducing genes are selectively induced in CAPAN-2. (C) Genes related to ferroptosis suppression, apoptosis, autophagy, and senescence reveal a death-prone profile in CAPAN-2 and a survival-oriented transcriptional state in HPAF-II.
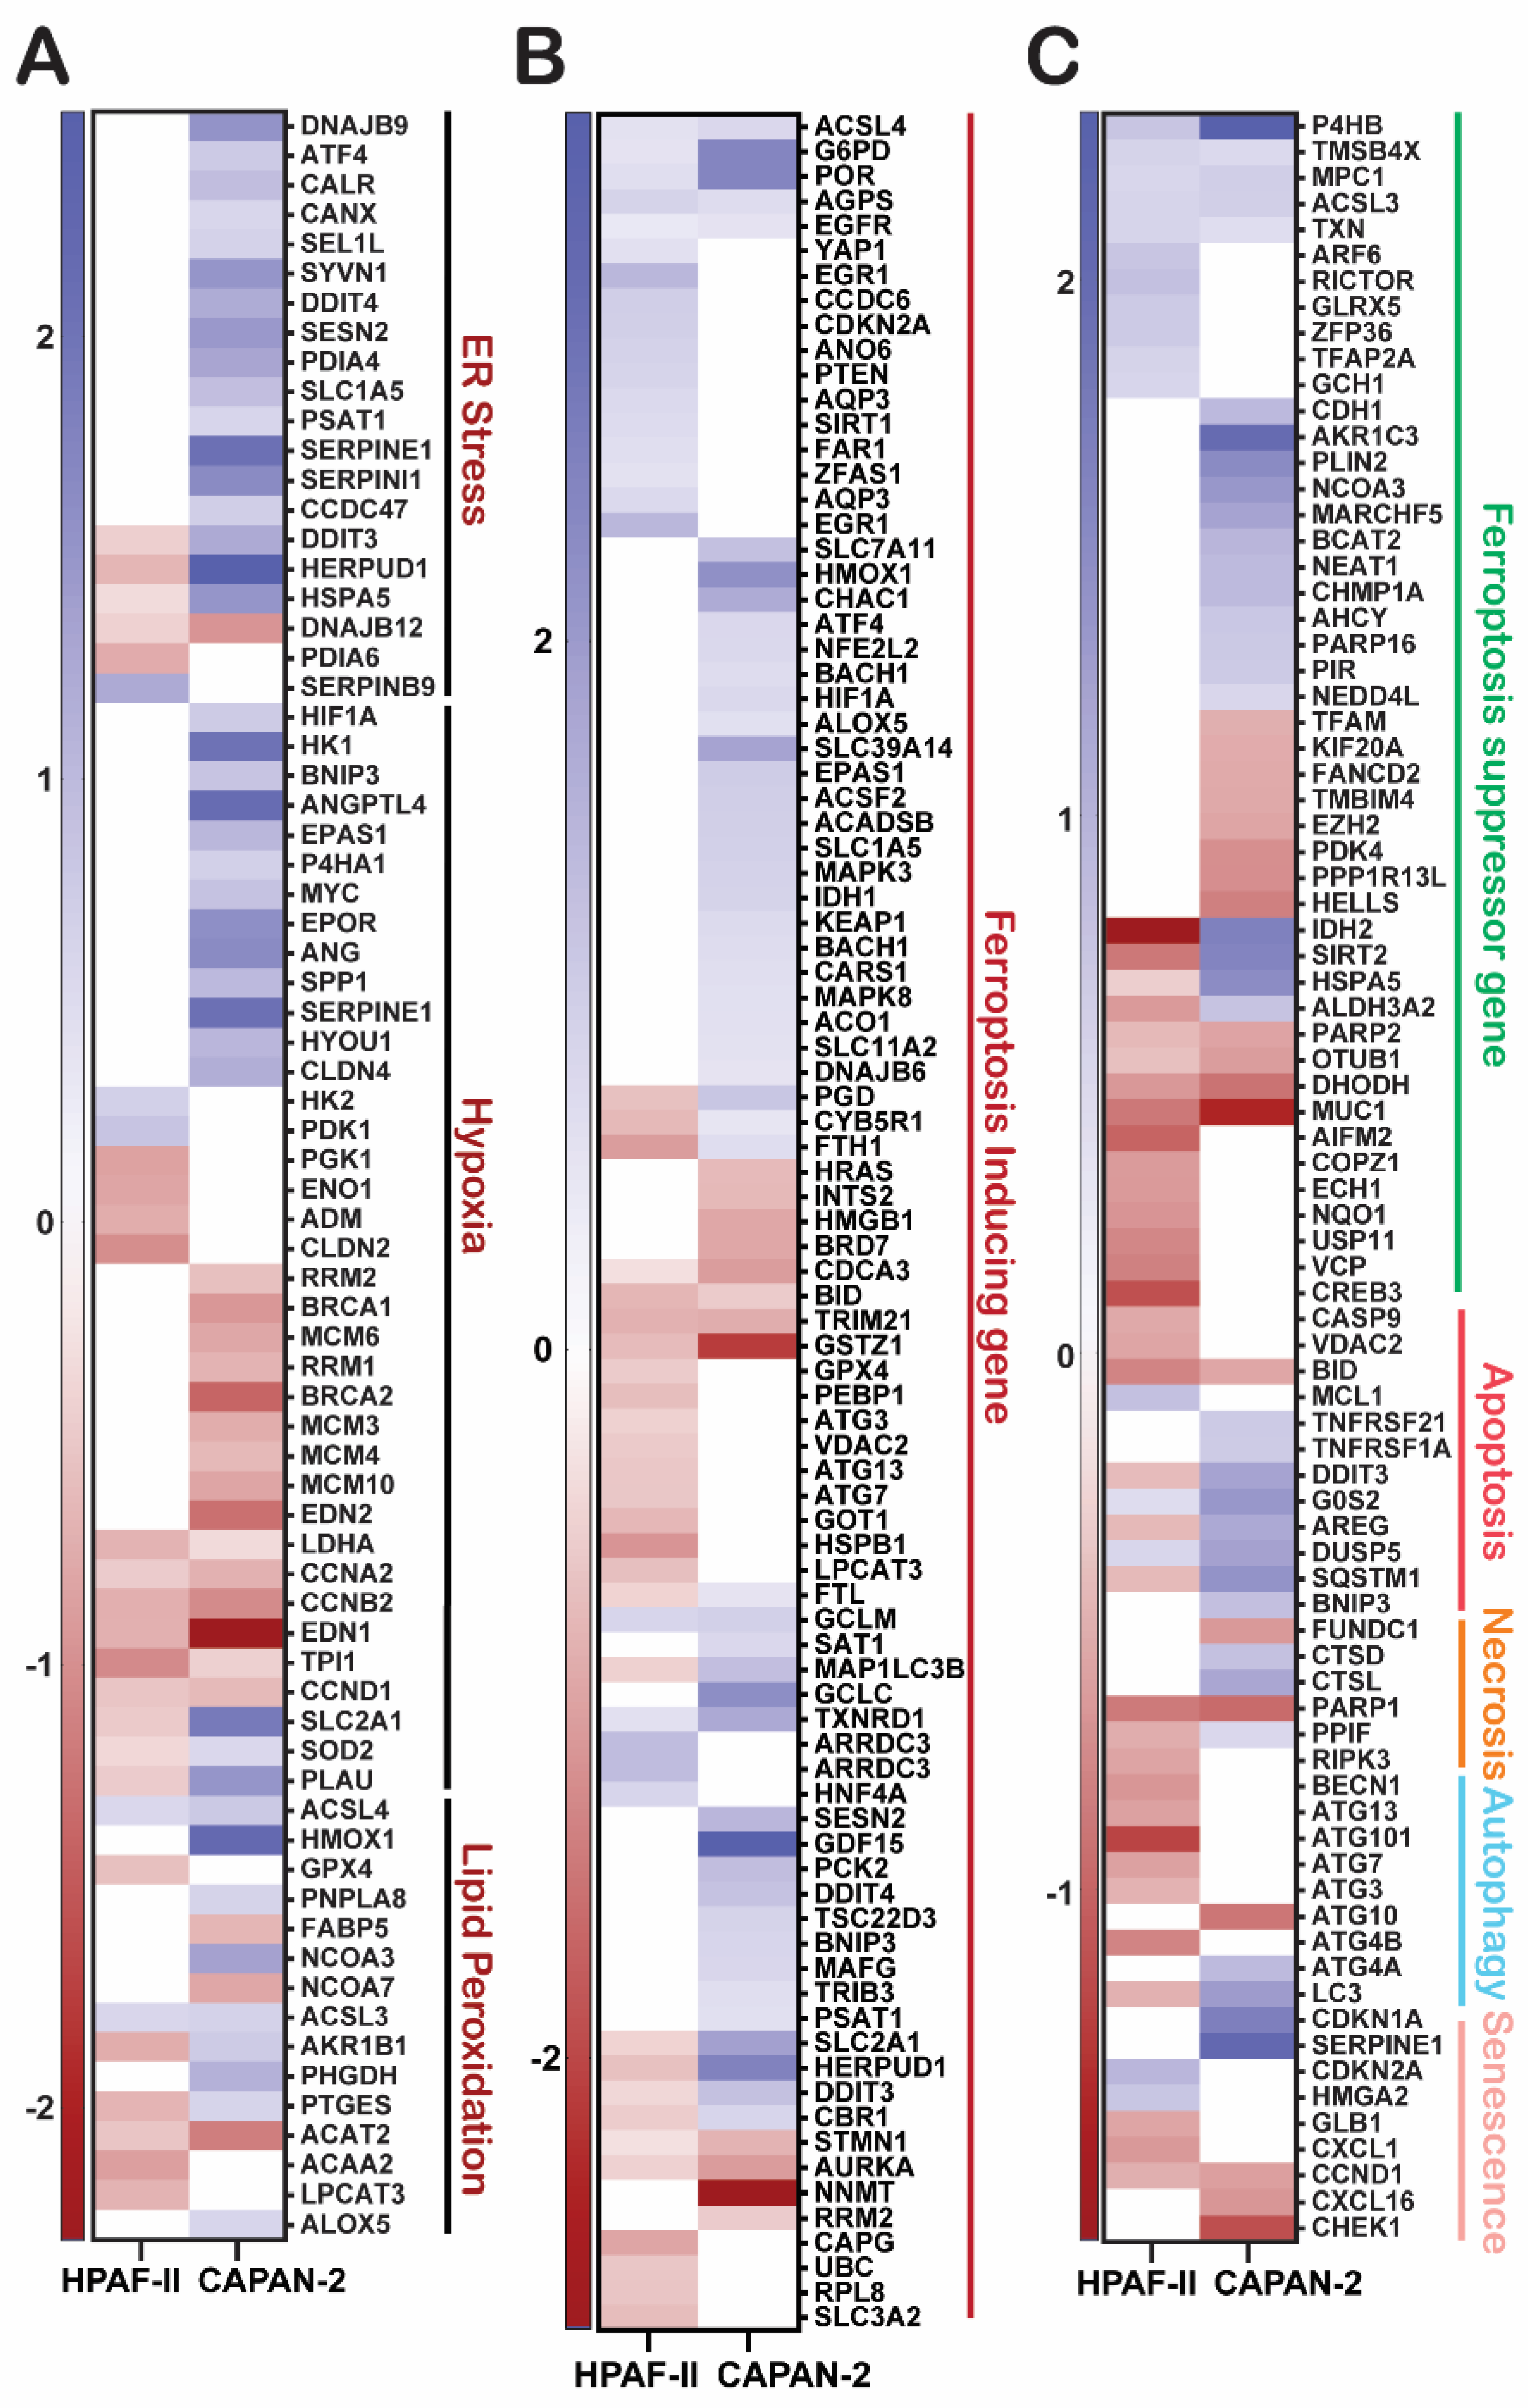
Figure 4.
GGMSC disrupts chromatin remodeling, cell cycle, and stress-responsive transcriptional programs. (A) Epigenetic regulatory genes, including chromatin remodelling, histone modifiers, and DNA repair mechanism, are downregulated in CAPAN-2. (B) Expression of cell cycle and DNA replication genes are suppressed in CAPAN-2. (C) NRF2 target genes are upregulated in CAPAN-2 but not in HPAF-II. (D) ATF4-regulated genes follow a similar pattern, reflecting a CAPAN-2–specific stress response.
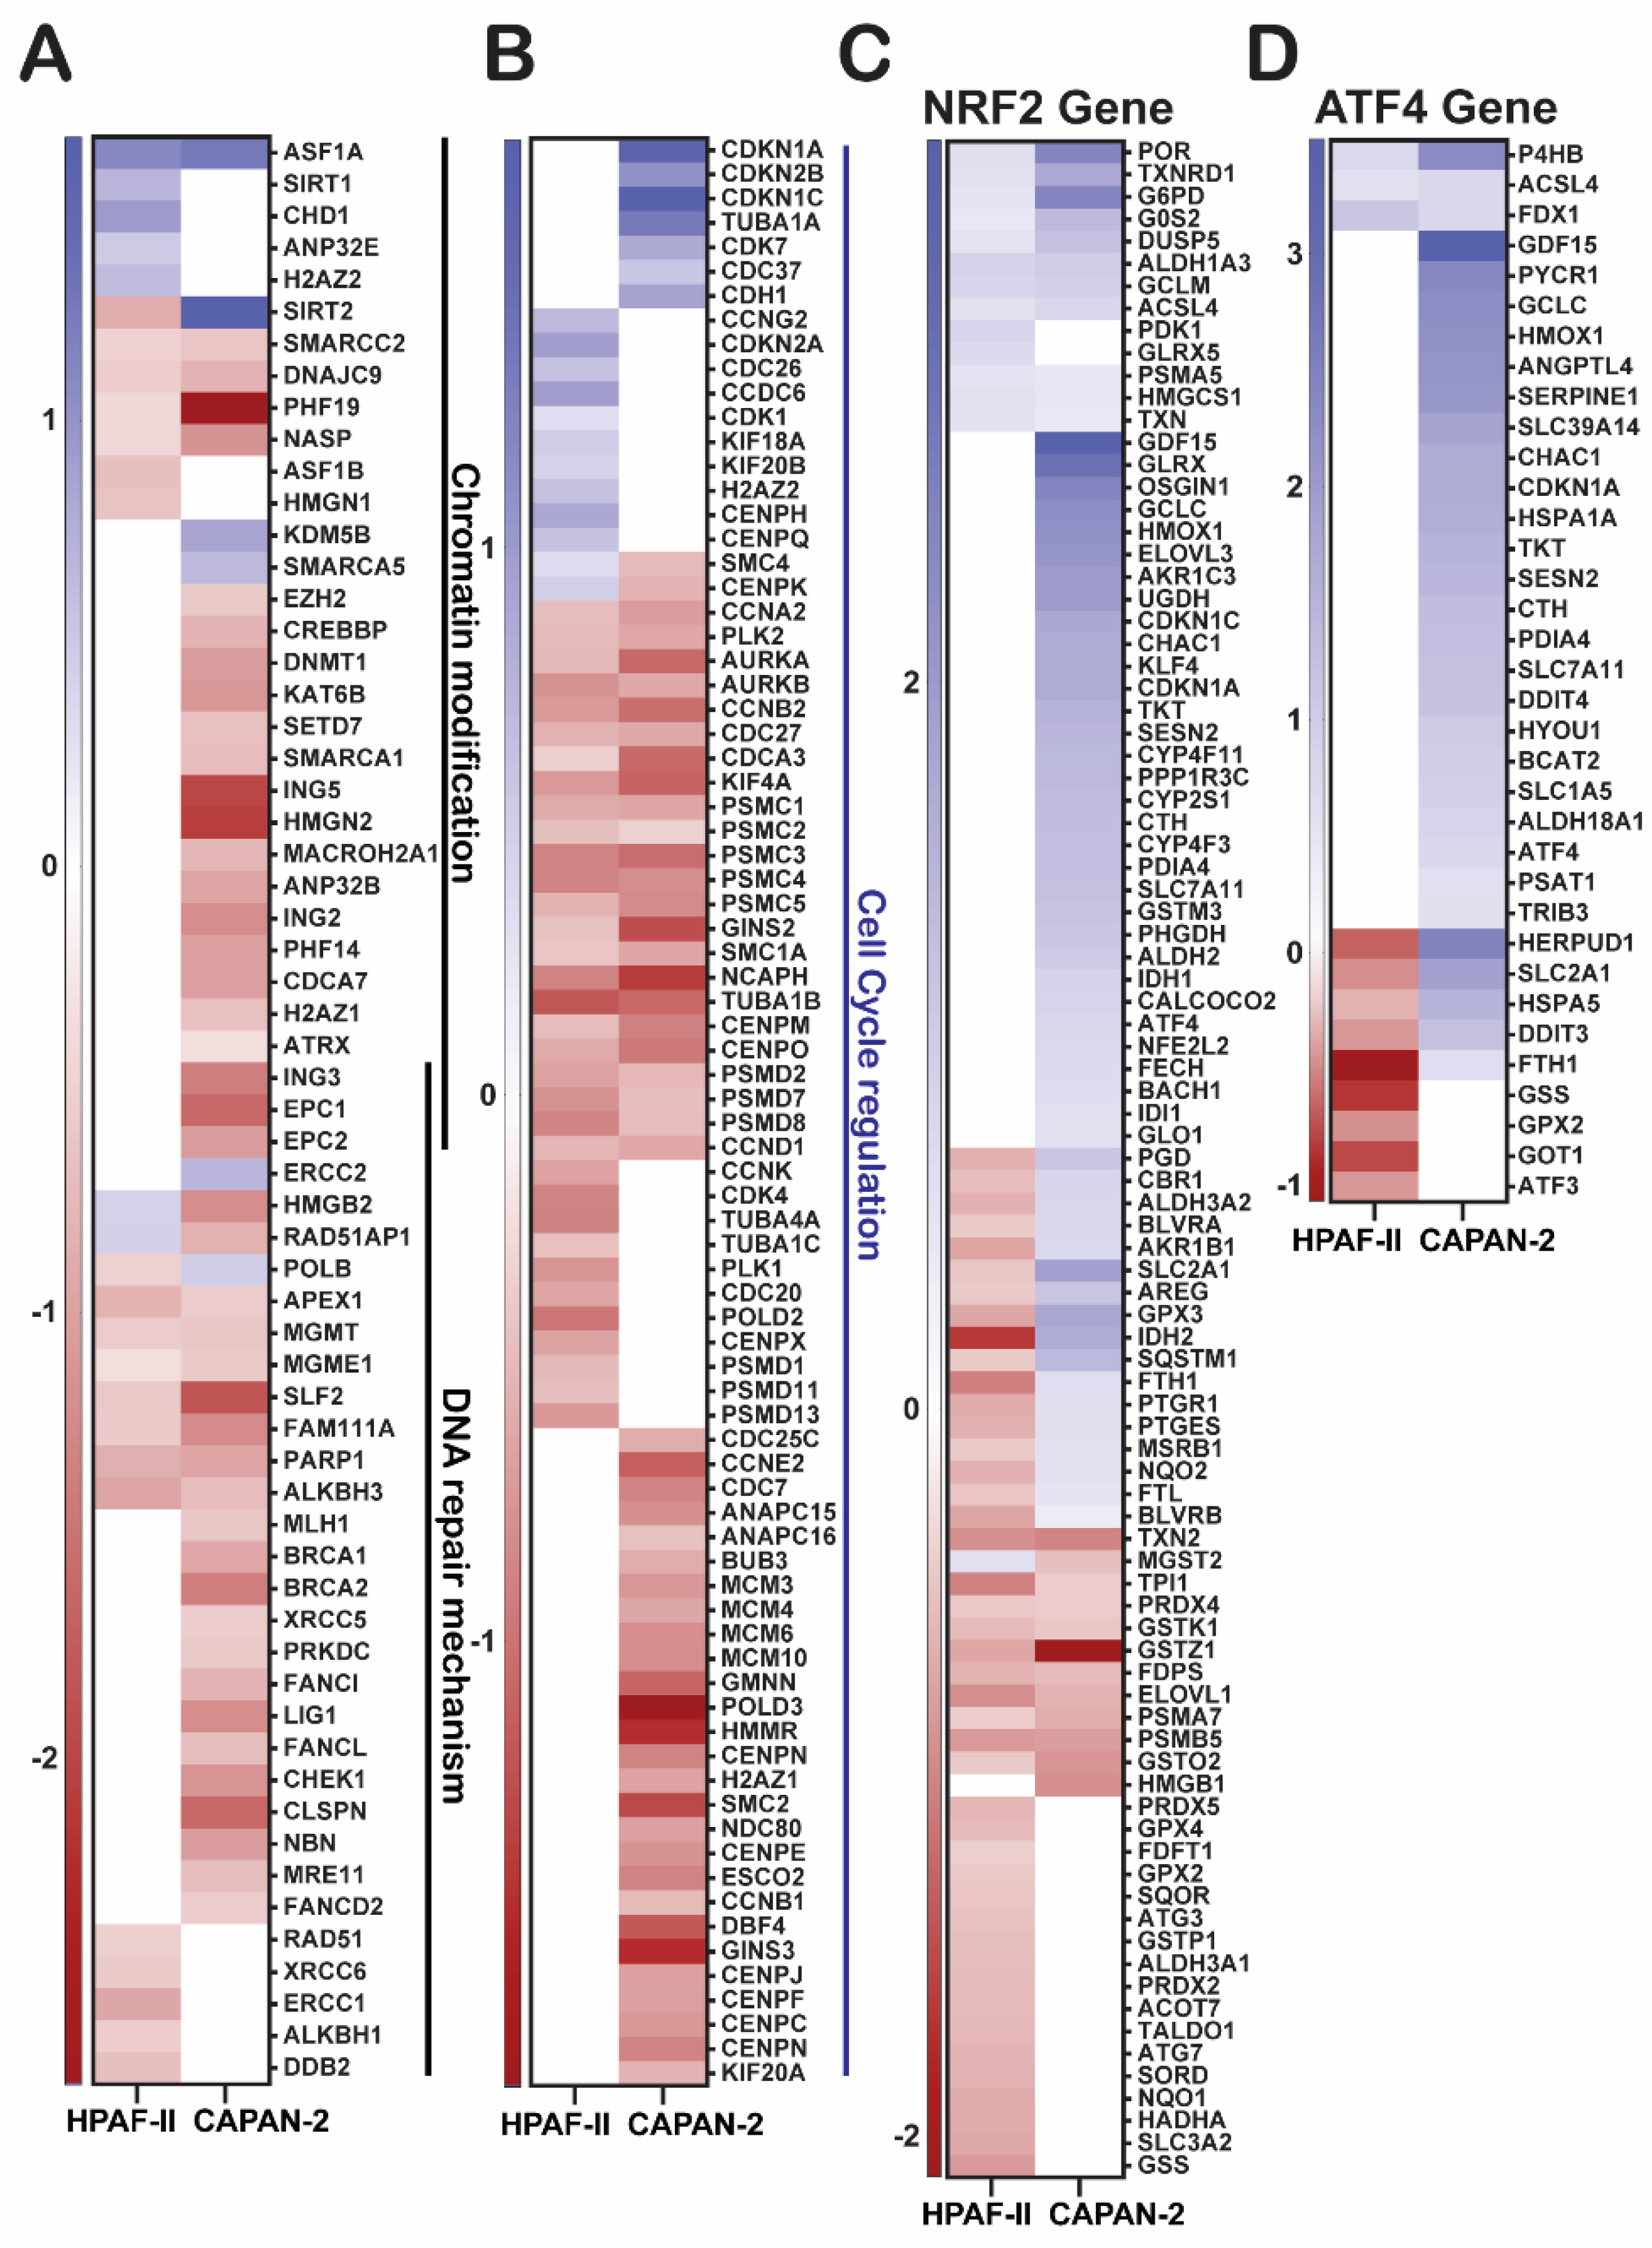

Table 1.
Summary count of total DEGs per condition.
| Cell line | Condition | Total DEGs | Upregulation | Downregulation |
|---|---|---|---|---|
| CAPAN-2 | GGMSC 500 µM-8h | 31 | 19 | 12 |
| CAPAN-2 | GGMSC 500 µM-20h | 1637 | 738 | 899 |
| HPAF-II | GGMSC 500 µM-8h | 322 | 214 | 108 |
| HPAF-II | GGMSC 500 µM-20h | 1538 | 557 | 981 |
Table 2.
Functionally enriched pathways grouped by functional category in GGMSC-treated PDAC cell lines.
Table 2.
Functionally enriched pathways grouped by functional category in GGMSC-treated PDAC cell lines.
| Biological Theme | Pathway | Source | Adjusted p-value | Cell Line | Direction |
|---|---|---|---|---|---|
| Oxidative stress / NRF2 | KEAP1-NFE2L2 pathway | Reactome | 7.2E-08 | CAPAN-2 | Up |
| Nuclear events mediated by NFE2L2 | Reactome | 1.0E-07 | CAPAN-2 | Up | |
| Glutathione metabolism | KEGG | 0.0011 | HPAF-II | Down | |
| UPR / ER stress signaling | Protein processing in ER | KEGG | 2.3E-05 | CAPAN-2 | Up |
| Response to ER stress (GO:0034976) | GO | 3.9E-04 | CAPAN-2 | Up | |
| Mitochondrial / metabolic | Mitochondrial matrix (GO:0005759) | GO | 3.9E-05 | CAPAN-2 | Up |
| Aerobic respiration and ETC | Reactome | 3.3E-05 | HPAF-II | Up | |
| Glycolysis / gluconeogenesis | KEGG | 1.8E-05 | HPAF-II | Down | |
| Cell cycle / DNA repair | Cell cycle | Reactome | CAPAN-2: 1.2E-30; HPAF-II: 6.4E-12 | CAPAN-2, HPAF-II | Down |
| DNA replication | Reactome | 1.5E-14 | CAPAN-2 | Down | |
| Chromosome condensation | GO | 1.3E-05 | CAPAN-2 | Down | |
| Chromosome organization | GO | 3.6E-10 | CAPAN-2 | Down | |
| DNA repair | GO | 1.2E-09 | CAPAN-2 | Down | |
| Cell death & survival | Ferroptosis | KEGG | CAPAN-2:0.00013; HPAF-II: 0.0015 | CAPAN-2 (Up), HPAF-II (Down) | Mixed |
| Autophagy | KEGG | 0.00405 | CAPAN-2 | Up | |
| Regulation of apoptosis | Reactome | 6.4E-11 | HPAF-II | Down |
Table 3.
Comparative analysis of transcription factor regulation in CAPAN-2 and HPAF-II cells following GGMSC treatment.
Table 3.
Comparative analysis of transcription factor regulation in CAPAN-2 and HPAF-II cells following GGMSC treatment.
| Transcription Factor | log₂FC (CAPAN-2) | log₂FC (HPAF-II) | Function | Interpretation | |
|---|---|---|---|---|---|
| ATF4 | +0.77 ↑ | ↔ | Unfolded protein response | Activated only in CAPAN-2 | |
| NFE2L2 | +0.77 ↑ | ↔ | Oxidative stress (NRF2) | Activated in CAPAN-2 | |
| BACH1 | +0.68 ↑ | ↔ | Ferroptosis regulation | May balance NRF2; ferroptosis involvement | |
| MYC | +0.88 ↑ | ↔ | Proliferation / oncogene | Unexpected; could reflect transient response | |
| NFKB1 | -1.35 ↓ | ↔ | NF-κB (survival) | Suppressed in CAPAN-2 | |
| DDIT3 | +1.23 ↑ | -0.44 ↓ | ER stress / apoptosis | Pro-death activation in CAPAN-2; suppressed in HPAF-II | |
| FOS | ↔ | -0.56 ↓ | stress/proliferation | Suppressed in HPAF-II | |
| HOXA3 | ↔ | +1.97 ↑ | Epithelial identity | Upregulated in HPAF-II | |
| HNF4A | ↔ | +0.84 ↑ | Metabolism / differentiation | Supports resistance and metabolic balance | |
| CBX3 | ↔ | +1.01 ↑ | Chromatin regulation | May contribute to epigenetic resistance | |
| CHUK | ↔ | +1.47 ↑ | NF-κB signaling | Pro-survival signaling retained in HPAF-II | |
Disclaimer/Publisher’s Note: The statements, opinions and data contained in all publications are solely those of the individual author(s) and contributor(s) and not of MDPI and/or the editor(s). MDPI and/or the editor(s) disclaim responsibility for any injury to people or property resulting from any ideas, methods, instructions or products referred to in the content. |
© 2025 by the authors. Licensee MDPI, Basel, Switzerland. This article is an open access article distributed under the terms and conditions of the Creative Commons Attribution (CC BY) license (http://creativecommons.org/licenses/by/4.0/).
Copyright: This open access article is published under a Creative Commons CC BY 4.0 license, which permit the free download, distribution, and reuse, provided that the author and preprint are cited in any reuse.


