
Submitted:
03 September 2025
Posted:
04 September 2025
You are already at the latest version
Abstract
Urban transportation is one of the largest sources of greenhouse gas emissions, responsible for almost a quarter of global CO2 output. Reducing these emissions requires tools that can capture how people actually travel across cities with fine spatial and temporal detail. In this paper, we apply a data-driven framework for Montreal that integrates an existing synthetic population dataset with multimodal routing using OpenTripPlanner and segment-level emissions estimation. Using more than 4.1 million weekday person trips, we evaluate six intervention scenarios ranging from the electrification of SUVs and pickups to ride-pooling and short-distance shifts to walking or cycling. The results show that targeting the most polluting vehicle categories can cut over 90% of their emissions, while behavioral strategies, although less impactful per trip, deliver meaningful reductions when scaled across the system. The framework is designed to balance detail, privacy, and scalability, making it transferable to other cities with limited access to high-resolution mobility data. By combining synthetic travel data, routing models, and emissions factors, it provides practical insights into both technological and behavioral pathways for decarbonizing urban mobility and supports the development of effective, evidence-based climate policies.
Keywords:
CO2 emissions
; urban transportation
; multimodal routing
; electric vehicles
; active transportation
1. Introduction
The urgent need to mitigate greenhouse gas (GHG) emissions from urban transportation systems has made cities critical actors in climate action and sustainability planning. Urban mobility, primarily driven by the use of internal combustion engine (ICE) vehicles, contributes significantly to global CO2 emissions. This is further intensified by inefficient land use patterns and rising travel demand. In response, cities worldwide are increasingly turning to data driven strategies to measure, monitor, and reduce the environmental footprint of transportation systems. However, existing efforts often rely on macro level estimations such as modal share statistics, fuel sales data, or vehicle registration figures which, while useful for broad policy planning, lack the spatial and behavioral detail required for localized intervention [1,2]. As highlighted by Creutzig et al. [1], transportation remains one of the most persistent barriers to achieving climate goals due to its complex systemic nature. Gouldson et al. [3] further argue that targeted, city level strategies are essential to accelerate low carbon development, especially when grounded in more granular, trip level data. These findings collectively reinforce the need for bottom up carbon accounting methods capable of capturing emissions with greater spatial, temporal, and modal resolution. Achieving such high resolution emissions assessments requires access to integrated and dynamic mobility datasets. However, most urban areas, including Montreal, face challenges in acquiring comprehensive travel behavior data. Although emerging data sources such as GPS traces, mobile phone signals, smartcard transactions, and vehicle trajectory offer promise, they remain fragmented, proprietary, or limited in scope. This lack of coordination across data streams, combined with privacy concerns and institutional silos, impedes the development of detailed and actionable emissions models [4,5,6]. As a result, urban transportation studies in North America still largely rely on traditional travel surveys or isolated data sources, which often lack the granularity required to support real time emissions modeling and spatially targeted interventions [7]. Bridging this gap demands innovative methodologies that are scalable, privacy preserving, and capable of capturing multimodal travel dynamics.
In this context, synthetic data offers a compelling solution. By statistically mimicking the characteristics of real world populations without exposing personal data, synthetic datasets support detailed analysis while enhancing reproducibility and safeguarding privacy. Recent research has demonstrated the potential of synthetic population models to facilitate microsimulation of urban mobility systems. For example, Hörl and Balac developed a reproducible, open data based synthetic travel demand model for the Paris region [8], while Liu et al. introduced a multi scale emissions platform integrating synthetic travel behavior to support smart mobility management [6]. These studies underscore the growing value of synthetic data in enabling fine grained, scalable, and ethical transport modeling frameworks [9,10].
To support detailed urban emissions modeling, this study uses a synthetic travel dataset representing weekday mobility patterns across the Island of Montreal. The dataset is generated through a spatialized population synthesis framework that integrates survey and spatial data to simulate realistic travel behaviors [11].
To estimate CO2 emissions, the study applies a mode specific framework that assigns emission values based on standard factors. This allows for meaningful aggregation and segmentation by travel mode, vehicle type, geography, and user profile. By focusing on trips that originate and end within the Island of Montreal, the analysis ensures consistency and relevance to local mobility and infrastructure conditions.
Overall, this research introduces an integrated, privacy preserving approach to urban emissions modeling, combining synthetic population data, multimodal routing, and scalable emissions estimation. It offers a replicable framework for cities with limited access to high resolution mobility data and supports evidence based climate planning and sustainable transportation strategies.
This study contributes to the urban transportation and sustainability literature by presenting a fully integrated, open-source-based framework for CO2 emissions estimation at high spatial granularity using synthetic population data. It further demonstrates the application of this framework through the operationalization and evaluation of six decarbonization scenarios, encompassing both technological and behavioural strategies. This combination of synthetic data, multimodal modeling, and scenario-driven analysis offers a novel and transferable approach for cities aiming to reduce transport-sector emissions through evidence-based planning.
The remainder of this paper is structured as follows. Section 2 presents the Literature Review, which examines existing approaches to modeling carbon emissions from urban transportation, highlighting both traditional and data driven methods while identifying key research gaps. Section 3 outlines the Methodology, detailing the emissions estimation framework, including the use of synthetic population data, multimodal routing, and trip level CO2 calculations. Section 4 introduces the Case Study focused on the Island of Montreal, describing how the proposed methodology is applied within this urban context. Section 5 provides a Scenario Analysis, demonstrating how the model responds to different urban mobility scenarios, such as increased adoption of electric vehicles or shifts toward public transit. The final sections of this paper examine the broader implications of these strategies. Section 7 summarizes the study’s main contributions, emphasizing the effectiveness of targeted interventions and the adaptability of the proposed framework. This is followed by Section 8, which outlines potential methodological enhancements and future research directions, including the integration of congestion-aware routing, behavioral response modeling, and life-cycle emissions accounting.
2. Literature Review
The transportation sector is among the largest contributors to global greenhouse gas (GHG) emissions, responsible for nearly one quarter of energy-related CO2 emissions [12]. Of this, road transport, particularly private cars and freight trucks account for the largest portion. Without decisive policy and technological interventions, emissions from road-based transportation alone are projected to increase by up to 305% by 2050 [13,14]. The environmental burden of car centric systems is intensified by fuel inefficiency, vehicle age, engine type, and traffic congestion, which can elevate CO2 output by over 50% during peak periods [15]. These issues underscore the urgent need for high resolution localised strategies to model, monitor and mitigate transportation related emissions. Urban transport emissions have typically been quantified using two distinct approaches: the top down approach, which relies on aggregate fuel consumption or sales data, and the bottom up approach, which estimates emissions using detailed traffic, vehicle, and travel behavior data [16,17]. Top down models are cost effective and scalable but lack the granularity needed for urban planning. Bottom up methods while data intensive allow for spatially and temporally resolved modeling, supporting finer policy levers.
Various tools and models have operationalized these methods. Average speed models such as COPERT, and cycle specific simulators like HBEFA, MOVES, and PHEM have been widely used for fleet level and corridor specific emission analysis [18,19,20]. MOVES, for instance, now includes electric vehicle (EV) energy consumption factors and can accommodate link specific traffic dynamics [21]. Similarly, COPERT has evolved to account for grid based CO2 emissions from EVs and rail transit, linking emissions directly to electricity mix [22]. However, these models typically rely on static activity patterns and lack behavioral realism unless paired with detailed mobility inputs. In light of these data limitations, the emergence of synthetic travel data has significantly reshaped emissions modeling. Generated using population synthesis and machine learning, synthetic datasets can replicate realistic travel behavior while overcoming challenges related to privacy, data availability, and collection costs [8,23]. These datasets offer full spatial and temporal coverage of population level mobility and have been shown to enhance predictive model performance. For instance, Albrecht et al. [24] demonstrated that augmenting real training data with synthetic samples improved the prediction accuracy of upcoming trips by up to 4.63% in the context of emerging carsharing programs. Given their scalability and transferability across regions, synthetic data are increasingly being leveraged in policy evaluation and scenario modeling.
Recent advancements in urban mobility modeling have increasingly relied on synthetic populations to simulate fine grained travel behaviors, enabling high resolution emissions modeling without the privacy and coverage limitations of survey based data. Vallet et al. [25] proposed a novel framework for matching synthetic populations with mobility personas, illustrating how agent level design and behavior modeling can support the development of decarbonization scenarios. Agent based models (ABMs), which represent individuals as autonomous agents with behavior rules, have further enhanced the realism of synthetic mobility simulations and allowed for scenario testing under dynamic travel conditions [26]. These agents can be assigned routes using multimodal network engines such as the Open Source Routing Machine (OSRM) and OpenTripPlanner (OTP), which compute time- and mode-specific paths across real-world street and transit networks [27,28].
By integrating synthetic populations with dynamic routing, researchers are now able to capture the spatial temporal complexity of urban trips, evaluate targeted interventions, and conduct bottom up emissions accounting with a much higher degree of behavioral fidelity than previously possible.
Additionally, deep learning and AI methods have enhanced emissions modeling using GPS, ride hailing, and mobile sensing data. Lu et al. [29] and Liu et al. [30] demonstrated how real time emissions estimation at the street and city level can be achieved using neural networks trained on dynamic spatio temporal data. When integrated with synthetic travel simulations, these AI-driven models offer a powerful framework for virtually evaluating urban decarbonization strategies, enabling detailed assessments without requiring real-world implementation.
A wide range of interventions has been proposed in the literature to reduce transport-related emissions, broadly categorized into technological and behavioral shifts. Technological strategies include the electrification of private vehicles while behavioral strategies involve shifting to public transit, increasing ride-sharing, and promoting walking or cycling. For instance, Wang et al. [31] explored the potential of electric vehicles (EVs) in China, highlighting their promise in reducing greenhouse gas emissions, depending on the energy mix used for electricity generation. In European contexts, Brand et al. [32] found that cycling one additional trip per day could reduce personal CO2 emissions by approximately 0.5 tonnes annually. Ride-sharing has also been shown to offer significant reductions in vehicle kilometers traveled (VKT); for example, a study by [33] demonstrated that ride pooling could reduce aggregate VKT by 8.21% compared to standard ride hailing modes in a mid sized city.
However, most existing studies tend to evaluate these intervention strategies in isolation, focusing on either technological transitions (e.g., electrification) or behavioral shifts (e.g., mode choice) without integrating them within a unified analytical framework. There remains a noticeable gap in comprehensive, scenario driven platforms that incorporate synthetic mobility data, spatially detailed routing, and multimodal emissions estimation. Farnood et al. [34] addressed a similar gap by integrating GIS-based spatial metrics with System Dynamics modeling to explore how transit accessibility, parking policies, and active transportation investments interact over time to influence mode choice, vehicle ownership, and greenhouse gas emissions. Moreover, evaluating the real world feasibility of targeted interventions such as prioritizing high emitting vehicles for electrification or encouraging modal shifts for short distance trips requires high resolution spatial and behavioral data that are often unavailable through conventional data collection methods.
Addressing these limitations, the present study introduces a comprehensive modeling framework for estimating urban transportation related CO2 emissions using synthetic travel data, high resolution routing, and mode specific emission factors. The framework leverages agent-level activity data to simulate realistic, multimodal travel patterns across a full synthetic population. This approach is increasingly supported in the literature as it preserves behavioral fidelity while remaining scalable across urban contexts [8,23,35]. Building on this foundation, the study implements six intervention scenarios that reflect a range of technological and behavioral strategies, including electric vehicle (EV) adoption, proximity based modal shifts to public transit, short distance shifts to active transportation, and ride pooling. This integrative approach aligns with recent calls for hybrid modeling platforms that combine emissions accounting with fine grained mobility simulations to evaluate policy impacts across spatial and behavioral dimensions [30,32,36]. Furthermore, by employing open source routing engines and disaggregated emission factors for both conventional and alternative modes, the framework provides the flexibility to assess the potential decarbonisation under various urban planning and energy scenarios. Such a system level evaluation is crucial for understanding trade offs, synergies, and policy design implications across interventions, and for supporting evidence based strategies in urban sustainability transitions.
3. Methodology
This study proposes a bottom-up emissions estimation framework that integrates synthetic origin–destination (OD) data, open-source multimodal routing, and mode-specific emissions modeling. The methodology combines multimodal travel simulation and CO2 estimation within a scalable data processing pipeline. All components are designed to provide high spatial and temporal resolution while maintaining extensibility and preserving data privacy.
The travel data used in this framework are derived from a spatialized population synthesis model developed by Khachman et al. [11]. This machine learning–based approach integrates high-resolution spatial and household survey data to construct a detailed synthetic population for the Island of Montreal, assigning households at the building level. Each individual is allocated a sequence of daily activities, which are subsequently transformed into multimodal OD trips, providing a comprehensive representation of weekday travel behavior. The dataset has been validated against representative OD survey data to ensure alignment in trip distance, departure time, and mode choice distributions, as shown in Figure 1.
The first panel compares the distribution of trip distances, showing a close alignment between synthetic and observed trips with respect to short- and mid-range distances. The second panel illustrates departure hour distributions, where the synthetic data successfully capture both morning and evening peak periods. The third panel compares mode choice proportions, demonstrating that synthetic estimates align closely with survey-reported shares for car, public transit, and active travel modes.
Each trip in the synthetic dataset was routed using OpenTripPlanner (OTP), a multimodal trip planning engine that supports walking, cycling, driving, and public transit. OTP was deployed locally and queried through its API with trip specific parameters including origin and destination coordinates, departure time, and allowed travel modes. The output for each trip consists of a detailed itinerary, segmented into legs, each with its associated mode, distance, and geometry.
This approach ensures that routing reflects realistic travel behavior by accounting for multimodal connectivity, time dependent transit schedules, and network constraints. Leg level data extracted from OTP forms the basis for trip emissions estimation.
CO2 emissions are calculated for each trip leg using standardized mode specific emissions factors. Emissions are expressed in grams per person kilometer. The general formula for each leg i is:
where:
- is the emissions for leg i,
- is the leg distance in meters,
- is the emissions factor for transport mode m, in gCO2/km.
To conduct this analysis, we used fleet data for Montreal originally categorized into ten emission groups based on average CO2 emissions per kilometer (gCO2/km), following the methodology in Laffont et al. [37]. Category 0 represents fully electric vehicles (6.9 gCO2/km), while Category 1 primarily consists of plug-in hybrid and hybrid electric vehicles (47.6 gCO2/km). The remaining categories (2–9) include conventional internal combustion engine (ICE) vehicles with emissions ranging from 170.2 to 375.9 gCO2/km.
For this study, these ten categories were consolidated into six broader groups to simplify analysis. This regrouping preserved the emission gradient across the fleet while reducing complexity, enabling a clearer comparison of electrification scenarios across major vehicle types. Table 1 summarizes these consolidated categories, their typical fuel types, and their representation in the fleet.
To convert vehicle kilometer emissions into per person estimates, an occupancy adjustment is applied:
To capture the effects of congestion on fuel consumption and emissions, travel times were adjusted using time-of-day–specific correction factors. These factors account for reduced speeds and increased idling during peak periods, reflecting observed temporal variability in urban traffic conditions. Two congestion periods were defined based on regional travel demand profiles: morning peak (07:00–10:00) and evening peak (16:00–19:00). Empirically derived multiplicative factors of 1.1 and 1.3, respectively, were applied to base travel times to represent the expected increase in trip duration during these periods. The adjusted travel time () is calculated as:
where is the uncongested travel time, D is the trip distance, and the Congestion Factor represents the additional time per kilometer during peak periods.
The impact of these adjusted travel times on emissions is incorporated by scaling the base emissions in proportion to the increase in travel time. This ensures that trips affected by congestion reflect higher emissions due to longer engine operation times and less efficient driving conditions.
Once trip-level emissions are estimated, spatial allocation is performed by aligning each trip’s polyline to the actual road network using Valhalla, an open-source routing engine chosen for its robust shape-matching capabilities and support for multimodal network attributes [38,39]. This process aligns trip geometries to the most probable network paths, breaking them down into individual road segments.
Segment-level emissions are then distributed proportionally based on the segment’s share of the total trip distance:
where is the emissions for segment i, is the segment length, is the total trip length, and is the trip-level emissions.
4. Case Study
To evaluate the performance and applicability of the proposed framework, a case study was conducted for the Island of Montreal, one of Canada’s most densely populated and transit rich regions (Figure 2). This urban environment is characterized by a complex multimodal transportation system that includes private automobiles, public transit (bus and metro), cycling infrastructure, and an extensive pedestrian network. The diversity and scale of transportation activity make Montreal a suitable setting for testing high-resolution carbon accounting.
The geographic scope of this case study is limited to the Island of Montreal, covering all 19 boroughs. The region is home to approximately 1.9 million residents and exhibits a mix of high-density urban cores and low-density residential areas. The transportation infrastructure includes:
- A road network composed of local streets, arterials, and highways, derived from OpenStreetMap (OSM).
- A comprehensive public transit system operated by the Société de transport de Montréal (STM), including over 200 bus lines and 4 metro lines.
- Active transport facilities such as bike lanes and pedestrian paths.
For this study, the OpenTripPlanner (OTP) engine was configured using GTFS data from STM and an OSM derived road network. OTP was hosted locally to enable real time API queries and multimodal trip routing across the full extent of the island.
The input travel dataset comprises over 4.1 million synthetic origin destination (OD) trips derived from a spatialized population synthesis model developed by [11], as described in Section 3. Each trip is associated with a specific individual from the synthetic population and includes detailed attributes such as origin and destination coordinates, departure time, and primary mode of transport.
Each trip was routed using the OTP engine, which was configured to support multimodal routing across public transit, cycling, walking, and private vehicle networks. The routing process was based on trip specific parameters, including the coordinates of origin and destination, departure time, and permitted travel modes. Routes were generated to reflect realistic travel behavior by considering network connectivity and scheduled transit services, with OTP returning the fastest feasible itinerary based on the provided departure time.
Trip-level emissions were calculated for all travel modes using the methodology outlined in Section 3. For motorized modes (car, bus, and metro), emissions were estimated in grams per person-kilometer using standardized emissions factors and adjusted for travel distance and time. Emissions for private vehicles were further disaggregated by vehicle category. Category assignment for each trip was based on probabilistic distributions derived from the observed composition of the Greater Montreal vehicle fleet, as detailed in Laffont et al. [37] and summarized in Table 1. This ensured that the modeled trips reflect the actual heterogeneity of vehicle types in the region.
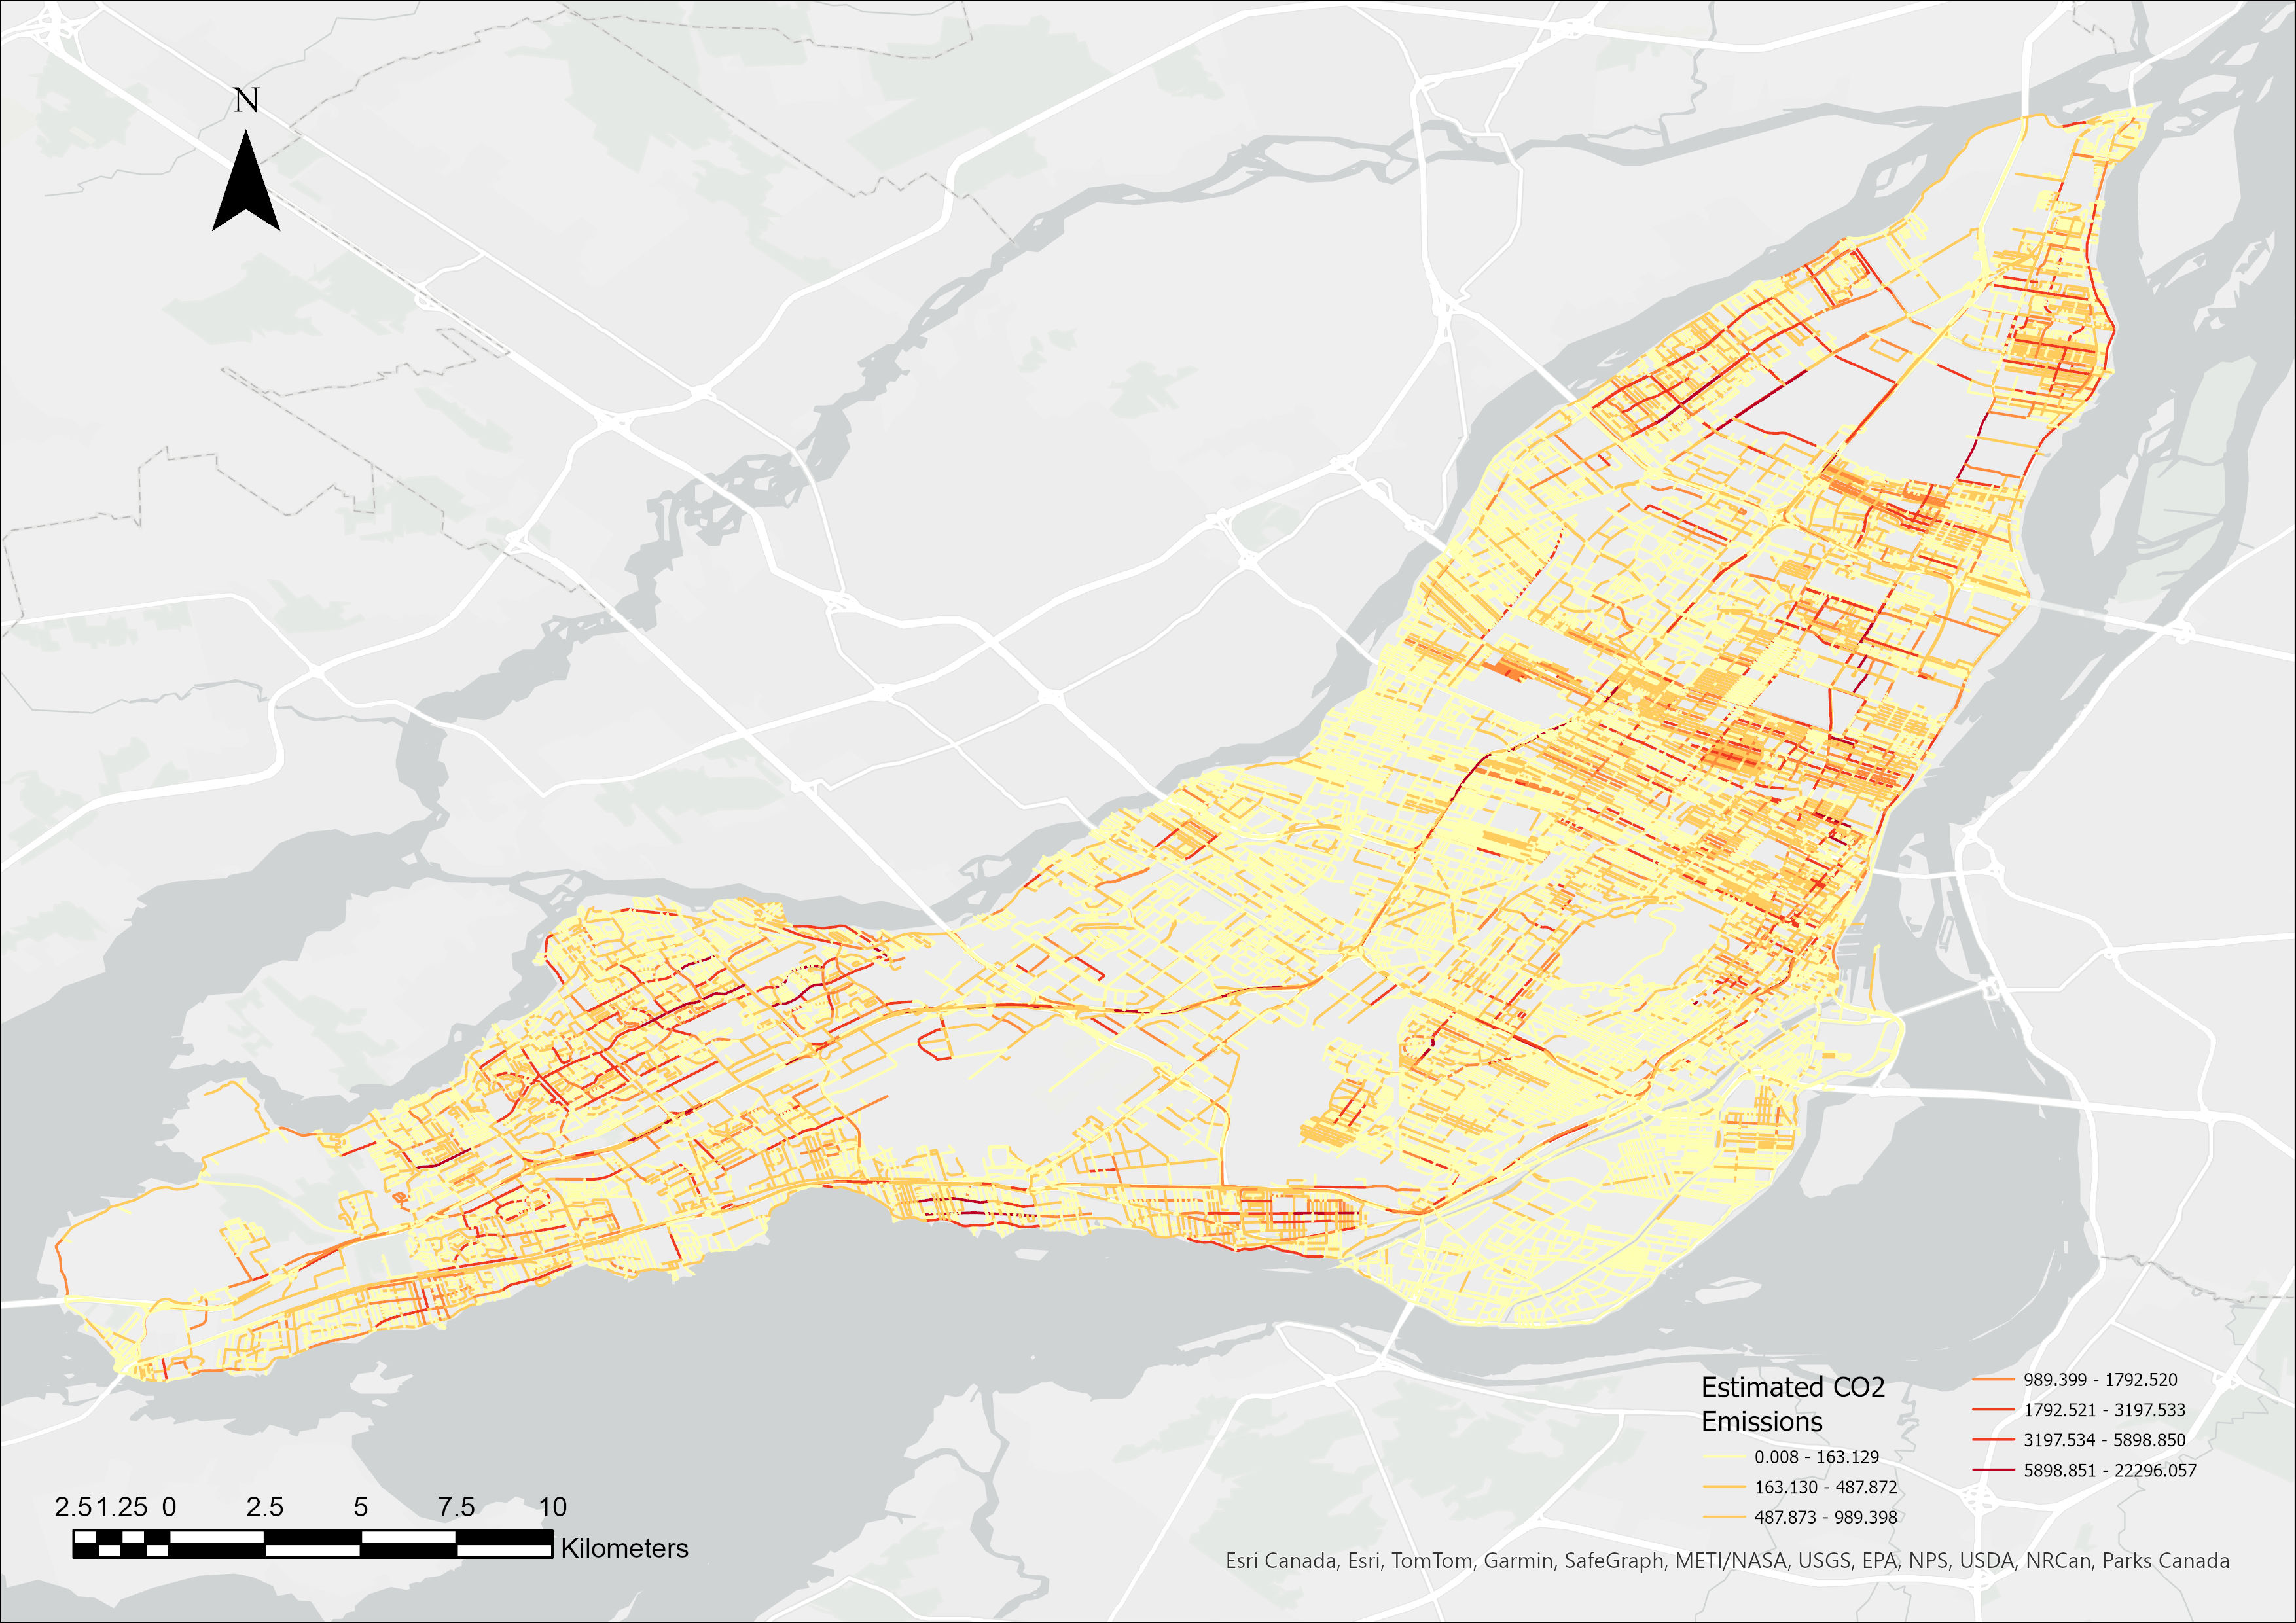
Using the routing geometries generated by OTP, emissions were spatially mapped to the road network using the Valhalla tool. Each trip’s path was decomposed into road segments, and emissions were proportionally allocated based on segment length. The resulting dataset includes over 350,000 road segments, each with an associated CO2 emissions value.
A geospatial heatmap was created to visualize emissions intensity across the network. As shown in Figure 3, the highest emitting segments are clustered in urban centers, major roadways and highway access zones. This spatial pattern reflects both the intensity of travel demand and the dominance of car-based modes in these areas.
5. Scenario Analysis
This section synthesizes six strategically distinct interventions (S1–S6), each designed to assess the mitigation potential of urban transportation emissions on the Island of Montreal. The interventions are grouped into technological (e.g., electric vehicle uptake), behavioral (e.g., modal shift, active travel), and hybrid strategies. This comparative assessment reveals not only a ranking of scenarios by CO2 impact, but also insights into how targeted urban policies can yield disproportionate environmental gains.
S1: Baseline Scenario (No Intervention)
The baseline scenario assumes no changes in mobility patterns, fuel technologies, or behavior. Emissions are calculated for each trip leg using mode-specific emission factors and travel distance, following a probabilistic classification of vehicle types. This scenario serves as the benchmark with total estimated emissions of 1,288.23tCO2.
where:
- : Total emissions
- N: Total number of trips (across all modes)
- : Adjusted emission for trip i
S2: EV Replacement Scenarios
Two sub-scenarios (S2A and S2B) were developed to evaluate the electrification of the private vehicle fleet using the consolidated categories presented in Table 1.
In the first scenario (S2A), electrification focuses on the highest-emitting vehicle segments, namely Categories 3 to 6, which comprise compact gasoline cars, mid-size gasoline cars, SUVs and crossovers, as well as pickups and large SUVs. Together, these categories account for roughly 98.6% of the fleet and produce the vast majority of on-road transportation emissions in the city. Replacing them entirely with battery electric vehicles (BEVs) yields substantial benefits, with each category achieving a reduction of about 96–97% in its own emissions, as shown in Table 2.
In contrast, S2B applies a uniform approach, simulating proportional electrification across all vehicle categories, with adoption levels ranging from 50% to 100%. A complete transition delivers a 96.3% emissions reduction, while even a 50% adoption level already achieves nearly half of the potential emissions savings (Table 3). These results highlight the nonlinear nature of emissions reductions, with steep gains occurring once electrification passes a critical adoption threshold, providing useful insights for pacing future policy implementation.
The advantages of targeting high-emitting categories are further emphasized by analyzing the progressive electrification of individual and combined categories. As demonstrated in Table 4, electrifying only Category 6, which consists of pickups and large SUVs, reduces total emissions by 11.16%. Combining Categories 4, 5, and 6 achieves over a 60% reduction, while fully electrifying Categories 3 through 6 yields a 91.02% reduction. These findings clearly indicate that substantial emissions reductions can be achieved without full fleet electrification when strategies prioritize the most polluting vehicles.
S3: Modal Shift to Public Transit
This scenario explores how much CO2 could be reduced if a portion of car trips were shifted to public transit. The baseline total emissions from all trips in the dataset amount to 1,443.44 tCO2. To identify trips that could realistically make this shift, we considered those that both start and end within walking distance of a transit station. We used an 800-meter walking distance threshold, which is widely recognized in the literature as a practical upper limit for pedestrian access to high-capacity transit systems [40]. Two variations of this scenario were examined, each representing a different level of access to the public transit network.
-
S3-A: Trips Both Starting and Ending Near Metro StationsIn this case, we only considered trips where both the origin and destination are within 800 meters of a metro station (Figure 4a). Out of the 2,098,549 total trips in the dataset, 266,072 (about 12.7%) met this condition. When focusing only on car trips, this amounted to 49,601 trips. Switching these trips to the fully electric metro reduced their combined emissions from 59.05 tCO2 to 10.51 tCO2. Compared to the baseline of 1,443.44 tCO2, this represents a 3.36% reduction in total emissions, and a 68.8% decrease for the trips affected.
-
S3-B: Trips Both Starting and Ending Near Metro or Bus StationsHere, we expanded the definition of accessibility to include bus stations as well as metro stations within the 800-meter walking distance (Figure 4b). This wider coverage captured 1,830,755 trips, or about 87.2% of all trips. For car trips, that meant 914,047 were eligible. In this scenario, shifting those trips to public transit reduced emissions from 1,274.54 tCO2 to 406.43 tCO2. Compared to the baseline of 1,443.44 tCO2, this equals a 60.14% reduction in total emissions, and a 69.0% reduction for the affected trips (Figure 5).
Although S3-B includes many more trips than S3-A, the extra emissions savings are not as large as the increase in coverage might suggest. This is because metro and bus service areas overlap in many parts of the city, and a large share of the most emission-intensive trips are already within metro catchment areas. In addition, our model assumes buses use diesel or hybrid engines, which produce higher emissions per passenger than Montreal’s electric metro system. As a result, shifting trips to buses offers smaller per-trip savings. If the city’s bus fleet were fully electric, the emissions savings from S3-B would be substantially higher, showing how combining mode shift policies with low-carbon transit technologies could greatly increase the climate benefits.
S4: Active Transportation Scenario
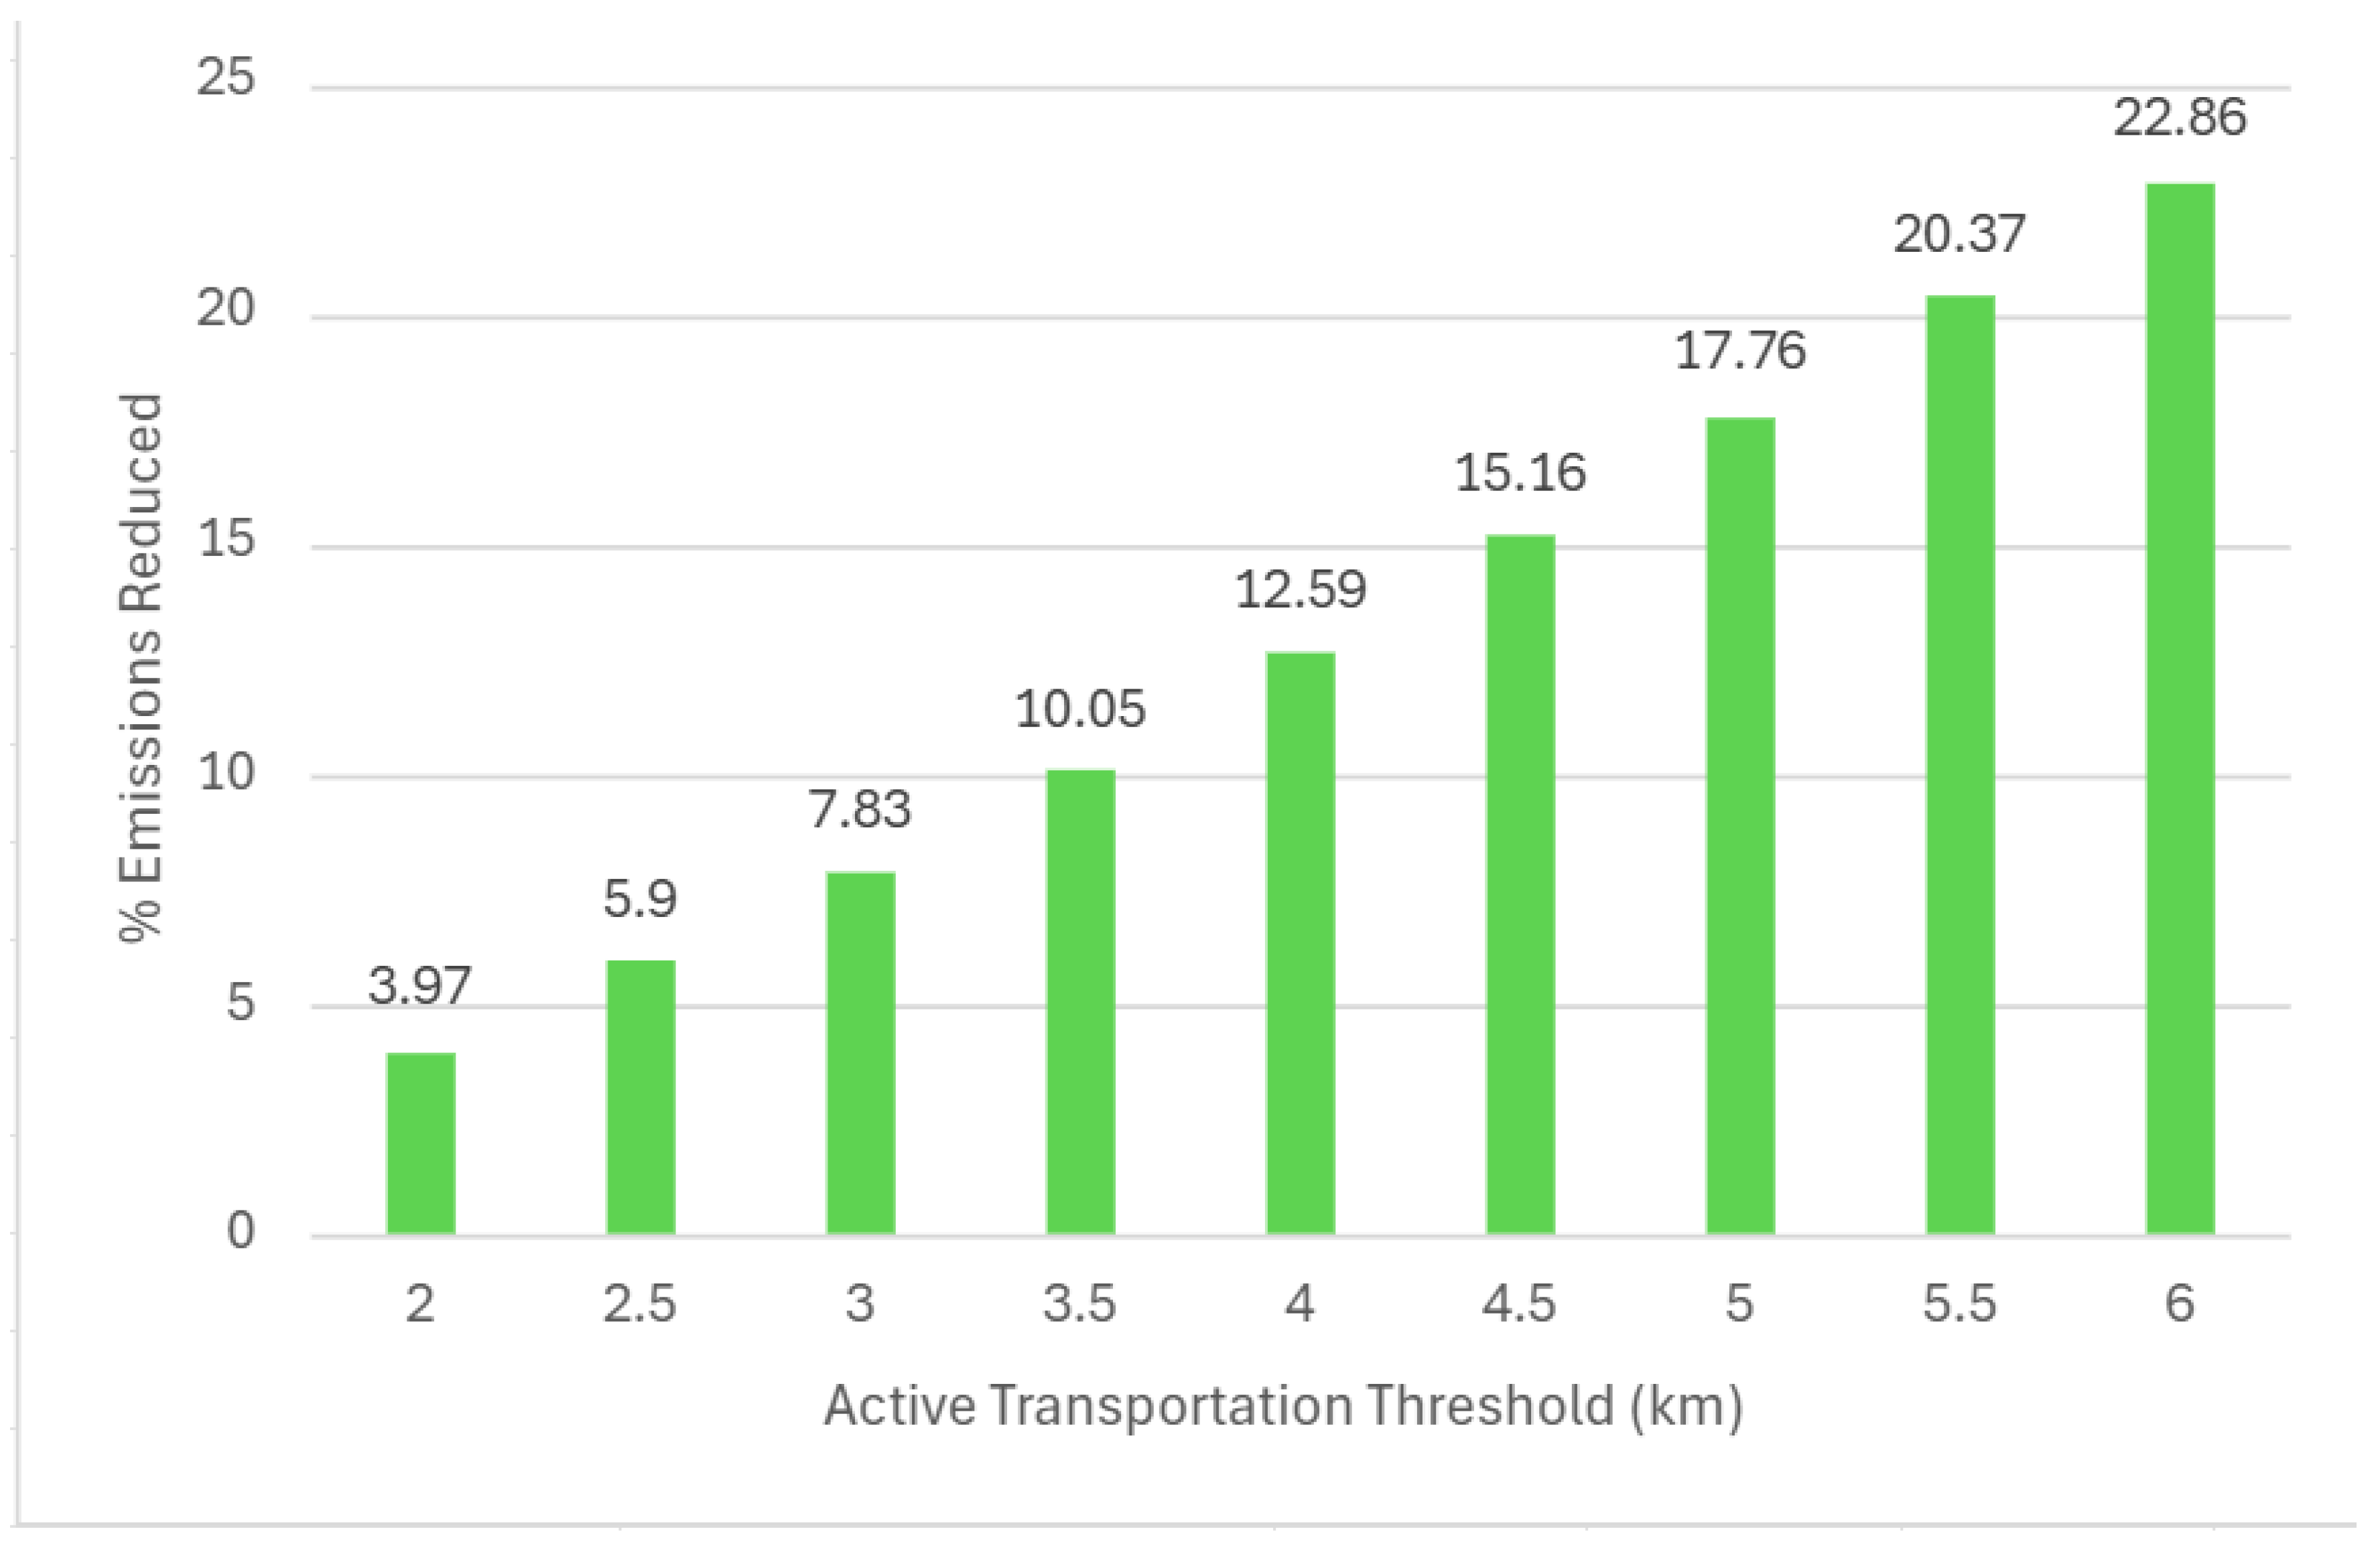
This scenario models the substitution of short car trips with active transportation modes such as walking and cycling. Focusing on a 2 km threshold, the analysis assesses the environmental potential of reallocating car travel within this walkable distance.
The results show that implementing a 2 km threshold leads to a 3.97% reduction in total transportation-related CO2 emissions. This reduction corresponds to shifting approximately 25.06% of all car trips to active modes. The findings highlight the significant number of short-distance mode shifts, especially in dense urban areas where walking and cycling infrastructure can support such transitions. Encouraging active travel for short trips not only reduces emissions but also promotes healthier and more sustainable urban mobility patterns [41]. The emission reduction impact may seem modest, but in terms of trips affected, it is transformative: over a quarter of vehicular activity is eliminated with zero infrastructure emissions. Importantly, gains scale with distance, reaching over 20% reduction at 6 km.
Figure 6.
Relationship between distance thresholds for active mode substitution and the resulting emissions reduction and trip shift rates.
Figure 6.
Relationship between distance thresholds for active mode substitution and the resulting emissions reduction and trip shift rates.
S5: Ridesharing Potential
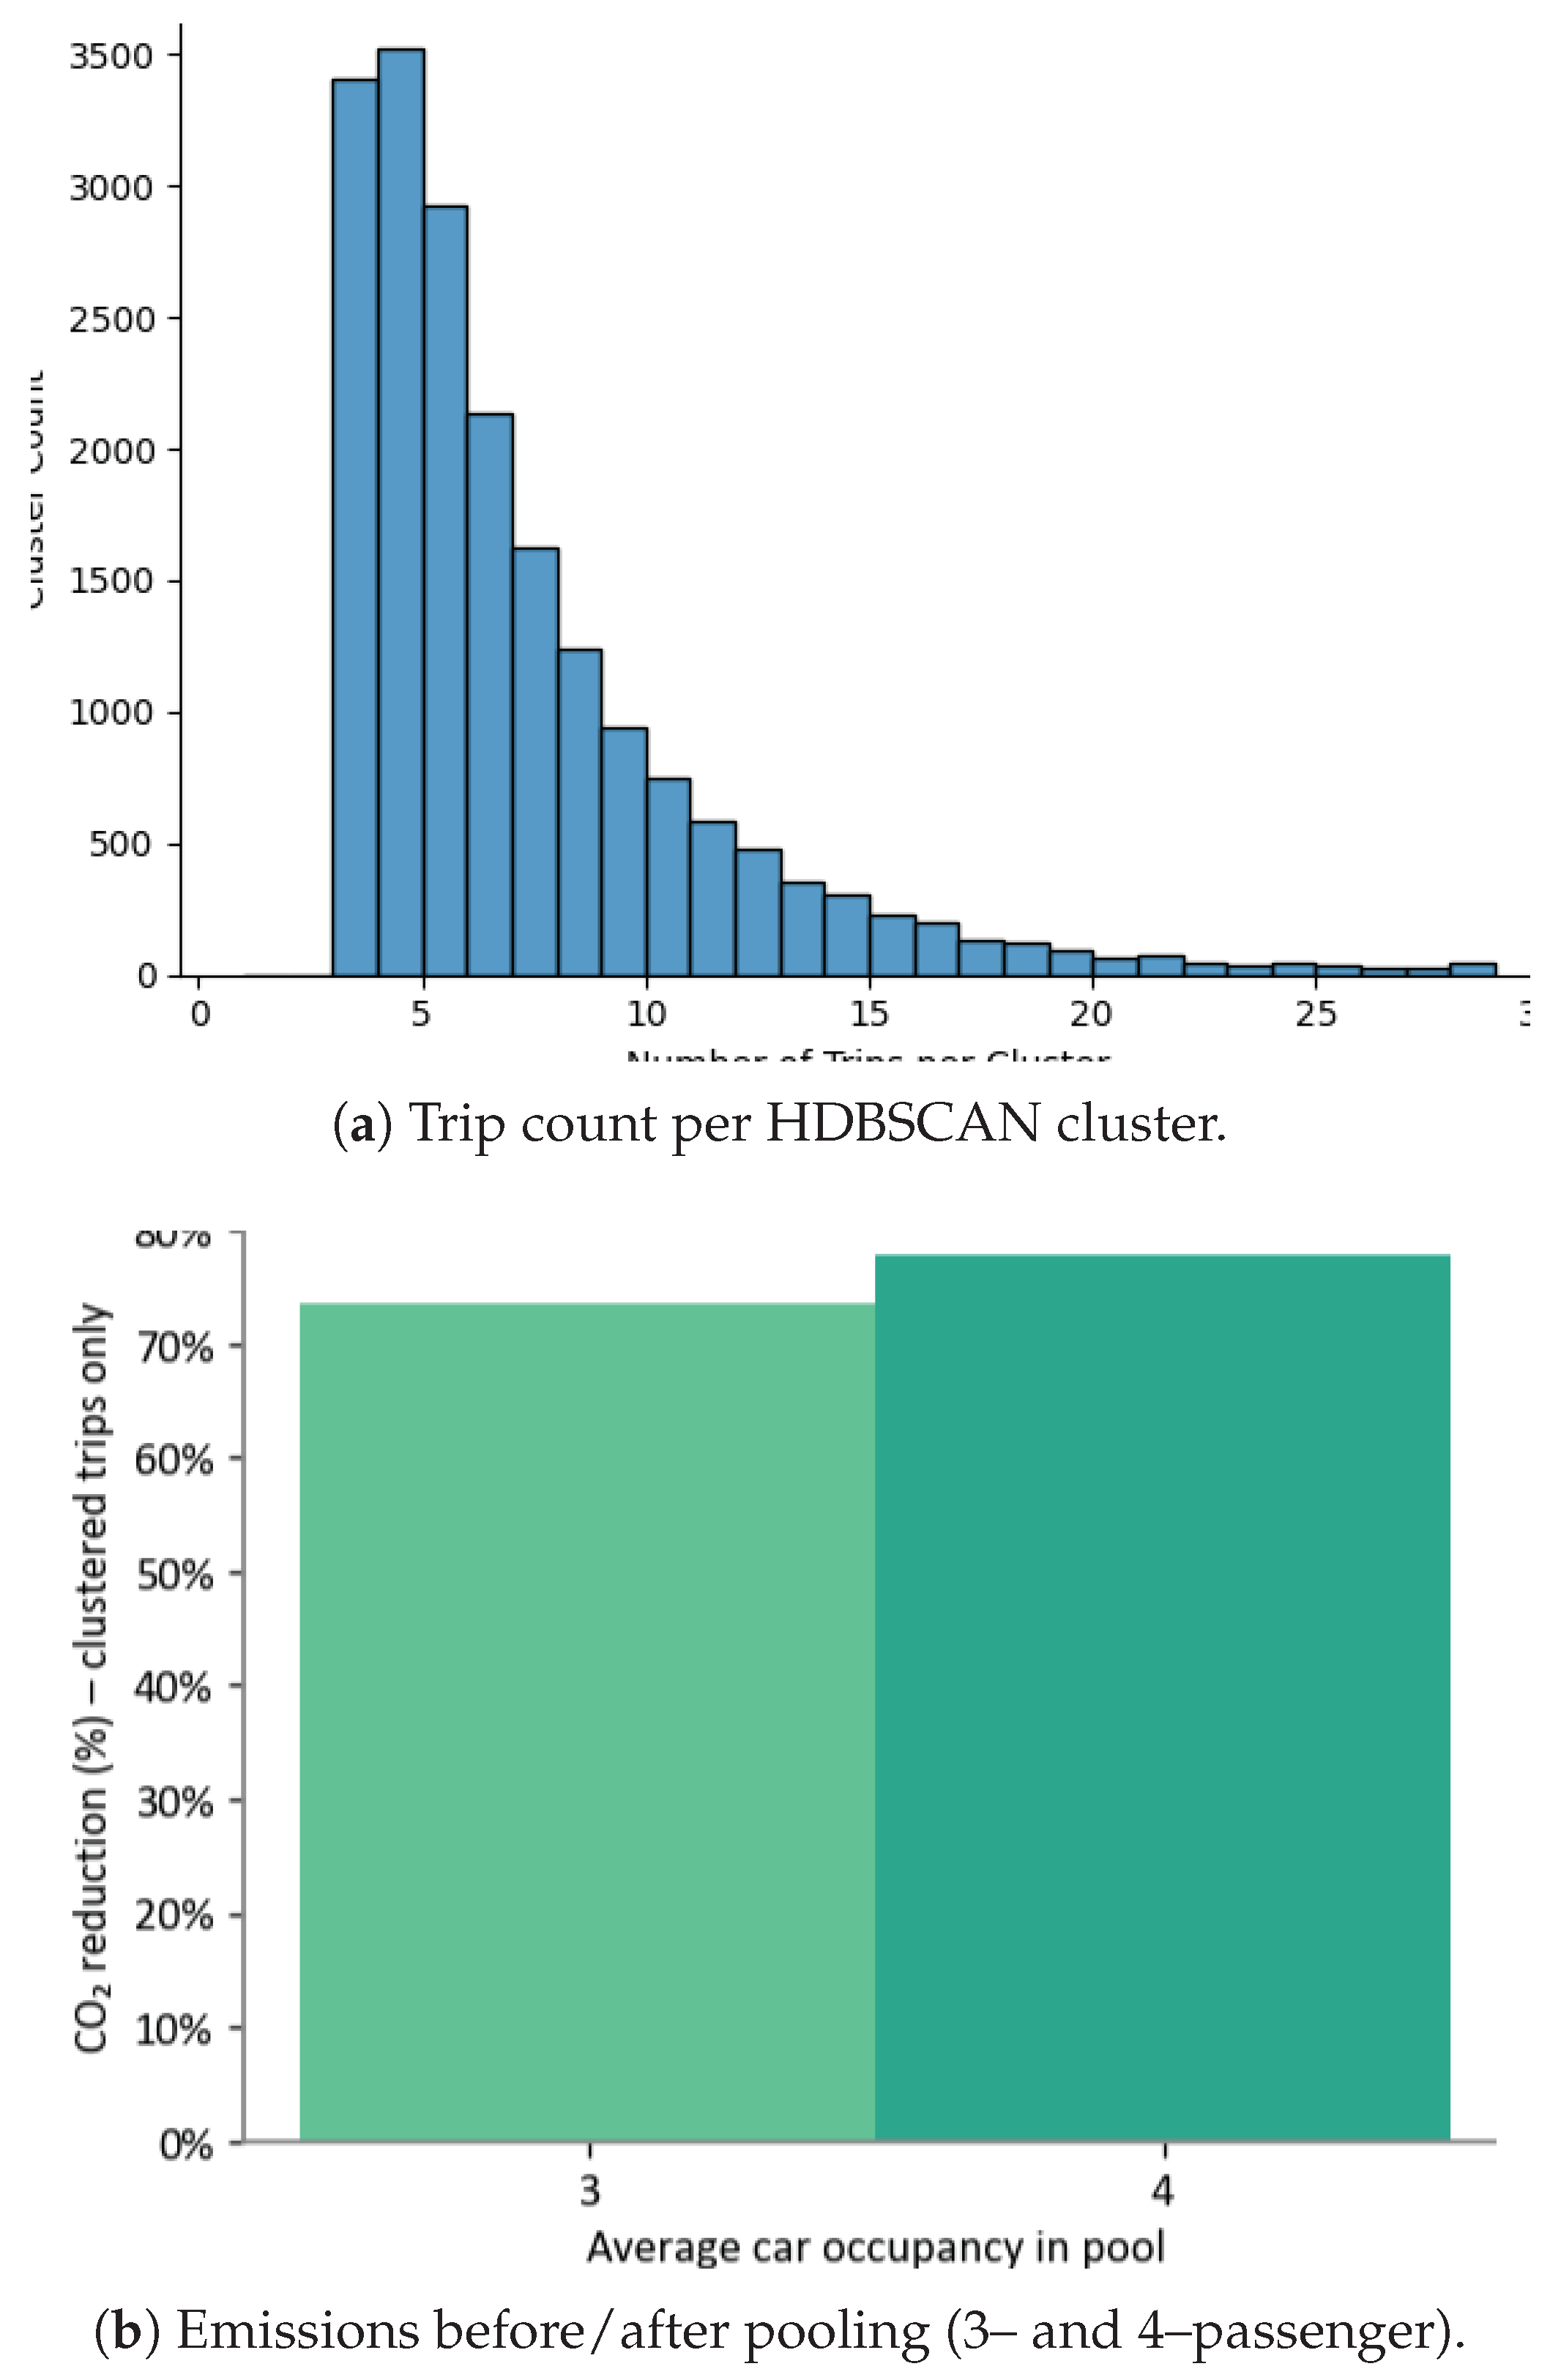
This scenario examines the potential for reducing emissions by combining trips through ride pooling during peak hours. We applied the HDBSCAN (Hierarchical Density Based Spatial Clustering of Applications with Noise) algorithm, which is well regarded for its ability to handle noise and identify meaningful patterns in complex datasets [42,43]. Unlike simpler clustering methods, HDBSCAN can adapt to areas with different trip densities and cluster sizes, making it particularly effective for detecting groups of trips that share similar origins, destinations, and departure times. These groups form realistic opportunities for ride pooling, which we then used to estimate how much CO2 could be saved by sharing rides.
To evaluate the spatial–temporal compactness of ride-pooling groups, we computed a cohesion score for each cluster returned by HDBSCAN. This measure corresponds to the average pairwise Euclidean distance between all trips in the same cluster, calculated in the standardized feature space of origin coordinates, destination coordinates, and departure time. For a cluster with trips, the cohesion is:
where and are the standardized feature vectors of trips i and j. Smaller cohesion values indicate tighter clusters, meaning trips are more closely aligned in both space and time, and thus better candidates for pooling. This formulation follows common practice in cluster validation, where the average intra-cluster distance is used to assess compactness [44,45].
When allowing up to three passengers per vehicle, 10,215 trips were grouped into 3,405 clusters. This reduced total emissions from 16.18 tCO2 to 4.30 tCO2, a 73.41% decrease. Increasing the capacity to four passengers expanded pooling to 24,319 trips across 6,931 clusters, lowering emissions from 40.20 tCO2 to 8.93 tCO2, a 77.79% reduction.
To assess the quality of the clusters, we calculated cohesion as the average distance between trips in the same group within a standardized feature space. Low cohesion values indicate strong alignment in both location and time, which is ideal for ride sharing with minimal detours.
Even under conservative assumptions, these results show that large numbers of car trips can be combined without major inconvenience. This highlights ride sharing as a practical and scalable strategy for lowering urban transport emissions through better use of existing travel patterns.
Figure 7.
HDBSCAN cluster sizes and pooling emissions.
6. Discussion
The scenario analysis, based on the synthetic travel dataset developed by Khachman et al. [11], shows how each intervention, when applied on its own, can help reduce transportation-related CO2 emissions on the Island of Montreal. Each case is considered as an independent policy pathway, giving planners the flexibility to weigh them individually according to local priorities and resources.
In the targeted electrification scenario (S2A), replacing the most polluting vehicle categories, including large pickups, SUVs, and mid-size gasoline cars, delivers the largest single-strategy reduction. This approach cuts more than 90% of emissions from the affected fleet, aligning with Laffont et al. [37], who highlight the importance of prioritizing high-emission classes in regions with low-carbon electricity.
The modal shift to public transit scenario (S3) examines the impact of switching eligible car trips to the fully electric metro system in S3-A, and extending eligibility to include diesel- or hybrid-bus corridors in S3-B. The metro offers greater per-trip reductions, while the broader bus–metro network covers more trips, particularly in areas outside metro catchment zones.
The active transportation scenario (S4) focuses on replacing short car trips with walking or cycling. A 2 km threshold shifts over one-quarter of all car trips to active modes, leading to a 3.54% reduction in total daily transportation emissions, while requiring minimal infrastructure investment.
The ridesharing scenario (S5) explores peak-hour ride-pooling based on spatial–temporal trip clustering. For participating trips, this approach can cut emissions by up to 77%. While the total citywide reduction depends on adoption rates, ridesharing offers scalable benefits, particularly when combined with high-occupancy vehicle incentives and intelligent trip-matching systems.
Overall, the results indicate that each intervention can function as a stand-alone policy measure, allowing decision-makers to select strategies that best match the city’s mobility patterns, budget, and infrastructure readiness.
7. Conclusions
This study presented a high-resolution, synthetic data–driven framework for estimating and analyzing CO2 emissions from urban passenger transportation. Developed and applied to the Island of Montreal, the methodology integrated spatialized synthetic population data, multimodal routing via OpenTripPlanner, and mode-specific emission modeling at the trip-leg level. The resulting system captures travel behavior with fine-grained spatial and temporal fidelity, while remaining scalable and privacy-preserving.
The framework was used to simulate and evaluate six strategic decarbonization scenarios, encompassing targeted electrification, uniform EV adoption, mode shifts to public transit, active transportation substitution, and dynamic ridesharing. Among these, targeted electrification (S2A) demonstrated the greatest standalone impact, achieving over 90% reduction in emissions by converting only the highest-emitting vehicle categories. Active transportation for short trips also proved effective: shifting just 2 km of travel distance per trip eliminated over a quarter of all car trips, yielding a modest emission reduction with low infrastructure demands. Modal shift scenarios revealed that much of the emission reduction potential is already captured by metro-accessible zones, though future electrification of buses could amplify gains. Ride-pooling strategies, based on spatial-temporal clustering, offered substantial efficiency within specific trip clusters, highlighting the promise of intelligent, data-driven mobility matching.
These findings underscore that no single intervention is sufficient in isolation. Instead, deep decarbonization of urban mobility systems depends on combining high-impact technological upgrades such as electrification of polluting vehicle classes, with broad behavioral and operational shifts that reduce the need for private car use. The framework developed in this study offers a transferable, evidence-based approach for supporting urban climate action, particularly in contexts where detailed real-world travel data are unavailable or sensitive. Future extensions will integrate congestion-aware routing, life-cycle vehicle emissions, and adaptive behavioral responses to better inform robust, long-term planning under uncertainty.
8. Future Directions
Emerging research in urban mobility emphasizes the need for dynamic, multi-source, and behaviorally responsive modeling approaches. Future extensions of this framework could integrate real-time traffic data and congestion-aware routing to better capture emissions from stop-and-go conditions, particularly in dense urban cores. This would also support peak-period policy evaluation, including congestion pricing and adaptive transit incentives.
Recent literature on life-cycle assessment (LCA) in transportation stresses the need to evaluate not only operational emissions but also upstream and downstream impacts. Incorporating vehicle production, energy supply chains, and infrastructure-related emissions would yield a more comprehensive view of carbon reduction strategies.
Behavioral elasticity is another key refinement area. Studies show that responses to pricing, infrastructure, and awareness campaigns can significantly shape travel demand. Incorporating adaptive behavior through elastic mode choice models or agent-based simulations would improve scenario robustness and help capture rebound effects.
Additionally, commercial freight and service vehicles, though fewer in number, contribute disproportionately to urban emissions. Integrating freight routing and vehicle classification would expand the model’s relevance to mixed-use mobility systems.
Finally, advances in synthetic population methods and privacy-preserving modeling make this framework adaptable to data-scarce or privacy-sensitive regions. Its modular, open-source design supports scalable, localized emissions planning across diverse urban contexts.
Author Contributions
Conceptualization, A.A., S.K., and U.E.; methodology, A.A.; software, A.A.; validation, A.A., S.K., and U.E.; formal analysis, A.A.; investigation, A.A. and S.K; resources, U.E.; data curation, A.A.; writing—original draft preparation, A.A.; writing—review and editing, A.A., S.K., and U.E.; visualization, A.A. and S.K; supervision, U.E.; project administration, U.E.; funding acquisition, U.E. All authors have read and agreed to the published version of the manuscript.
Funding
This research was funded by the Natural Sciences and Engineering Research Council of Canada (NSERC).
Institutional Review Board Statement
Not applicable.
Informed Consent Statement
Not applicable.
Data Availability Statement
ARTM 2018 OD microdata were accessed under a data-use agreement and are not publicly available. Aggregated outputs and code are available on request.
Acknowledgments
The authors thank the Autorité régionale de transport métropolitain (ARTM) for access to the 2018 Origin–Destination Survey under a data-use agreement. During the preparation of this manuscript, the authors used ChatGPT (OpenAI, accessed in April 2025) for grammar and LaTeX formatting. The authors reviewed and edited the content and take full responsibility for the publication.
Conflicts of Interest
The authors declare no conflict of interest.
Abbreviations
| GHG | Greenhouse gas(es) |
| VKT | Vehicle-kilometers traveled |
| OD | Origin–Destination |
| GTFS | General Transit Feed Specification |
| OTP | OpenTripPlanner |
| HDBSCAN | Hierarchical Density-based Spatial Clustering of Applications with Noise |
| tCO2 | Metric tonnes of CO2 |
References
- Creutzig, F.; Jochem, P.; Edelenbosch, O.Y.; Mattauch, L.; Vuuren, D.P.v.; McCollum, D.; Minx, J. Transport: A roadblock to climate change mitigation? Science 2015, 350, 911–912.
- Moran, D.; Kanemoto, K.; Jiborn, M.; Wood, R.; Többen, J.; Seto, K.C. Carbon footprints of 13 000 cities. Environmental Research Letters 2018, 13, 064041.
- Gouldson, A.; Colenbrander, S.; Sudmant, A.; Godfrey, N.; Millward-Hopkins, J.; Fang, W.; Zhao, X. Accelerating low carbon development in the World’s cities 2015.
- Ma, X.; Li, J.; Guo, Z.; Wan, Z. Role of big data and technological advancements in monitoring and development of smart cities. Heliyon 2024, 10.
- Giest, S. Big data analytics for mitigating carbon emissions in smart cities: opportunities and challenges. European Planning Studies 2017, 25, 941–957.
- Liu, J.; Li, J.; Chen, Y.; Lian, S.; Zeng, J.; Geng, M.; Zheng, S.; Dong, Y.; He, Y.; Huang, P.; et al. Multi-scale urban passenger transportation CO2 emission calculation platform for smart mobility management. Applied Energy 2023, 331, 120407.
- Schläpfer, M.; Dong, L.; O’Keeffe, K.; Santi, P.; Szell, M.; Salat, H.; Anklesaria, S.; Vazifeh, M.; Ratti, C.; West, G.B. The universal visitation law of human mobility. Nature 2021, 593, 522–527.
- Hörl, S.; Balac, M. Synthetic population and travel demand for Paris and Île-de-France based on open and publicly available data. Transportation Research Part C: Emerging Technologies 2021, 130, 103291.
- Johnsen, M.; Brandt, O.; Garrido, S.; Pereira, F. Population synthesis for urban resident modeling using deep generative models. Neural Computing and Applications 2022, pp. 1–16.
- Agriesti, S.; Roncoli, C.; Nahmias-Biran, B.h. Assignment of a synthetic population for activity-based modeling employing publicly available data. ISPRS International Journal of Geo-Information 2022, 11, 148.
- Khachman, M.; Morency, C.; Ciari, F. A novel machine learning-based spatialized population synthesis framework. Transportation 2024, pp. 1–29.
- Rodrigue, J.P. Greenhouse Gas Emissions from Transportation. The Geography of Transport Systems, 2023. Available online: https://transportgeography.org/contents/chapter4/transportation-and-environment/greenhouse-gas-emissions-transportation/ (accessed on 2025-09-02).
- Masson-Delmotte, V.; Zhai, P.; Pörtner, H.O.; Roberts, D.; Skea, J.; Shukla, P.; Pirani, A.; Moufouma-Okia, W.; Péan, C.; Pidcock, R.; et al. Global Warming of 1.5°C, 2018. Accessed: 2024-12-10.
- Olivier, J.G.; Schure, K.; Peters, J.; et al. Trends in global CO2 and total greenhouse gas emissions. PBL Netherlands Environmental Assessment Agency 2017, 5, 1–11.
- Bharadwaj, S.; Ballare, S.; Chandel, M.K.; et al. Impact of congestion on greenhouse gas emissions for road transport in Mumbai metropolitan region. Transportation research procedia 2017, 25, 3538–3551.
- Arioli, M.S.; Márcio de Almeida, D.; Amaral, F.G.; Cybis, H.B.B. The evolution of city-scale GHG emissions inventory methods: A systematic review. Environmental Impact Assessment Review 2020, 80, 106316.
- Vieweg, M. Bottom-Up GHG Inventory and MRV of Measures, 2017. Available at: https://changing-transport.org/wp-content/uploads/2017_ViewegMersman_Bottom-Up_GHG_Inventory.pdf.
- Smit, R.; Ntziachristos, L.; Boulter, P. Validation of road vehicle and traffic emission models–A review and meta-analysis. Atmospheric environment 2010, 44, 2943–2953.
- Sun, S.; Jiang, W.; Gao, W. Vehicle emission trends and spatial distribution in Shandong province, China, from 2000 to 2014. Atmospheric Environment 2016, 147, 190–199.
- Xia, C.; Xiang, M.; Fang, K.; Li, Y.; Ye, Y.; Shi, Z.; Liu, J. Spatial-temporal distribution of carbon emissions by daily travel and its response to urban form: A case study of Hangzhou, China. Journal of Cleaner Production 2020, 257, 120797.
- U.S. Environmental Protection Agency. EPA MOVES Guidance. U.S. Environmental Protection Agency, 2023. Accessed: 2025-08-12.
- Wang, Z.; Chen, F.; Fujiyama, T. Carbon emission from urban passenger transportation in Beijing. Transportation Research Part D: Transport and Environment 2015, 41, 217–227.
- Wills, W.; Meirelles, J.; Baptista, V.G.; Cury, G.; Cerdeira, P. A Simple Sinuosity-Based Method using GPS data to Support Mitigation Policies for Public Buses GHG Emissions. arXiv preprint arXiv:1907.09335 2019.
- Albrecht, T.; et al. Fake it till you make it: Synthetic data for emerging carsharing programs. Transportation Research Part D: Transport and Environment 2024, 127, 104067. [CrossRef]
- Vallet, F.; Hörl, S.; Gall, T. Matching Synthetic Populations with Personas: A Test Application for Urban Mobility. In Proceedings of the Proceedings of the Design Society. Cambridge University Press, 2022, Vol. 2, pp. 1795–1804. [CrossRef]
- Saval, A.; Minh, D.P.; Chapuis, K.; Tranouez, P.; Caron, C.; Daudé, É.; Taillandier, P. Dealing with mixed and non-normative traffic. An agent-based simulation with the GAMA platform. Plos one 2023, 18, e0281658.
- de Oliveira Faria, E. OPEN SOURCE ROUTING MACHINE COMO ALTERNATIVA AO GOOGLE MAPS: ESTUDO EXPLORATÓRIO SOBRE AS POTENCIALIDADES DO OSRM PARA CÁLCULOS DE DISTÂNCIAS ENTRE MUNICÍPIOS. Boletim Geográfico do Rio Grande do Sul 2020, pp. 116–124.
- Morgan, M.; Young, M.; Lovelace, R.; Hama, L. OpenTripPlanner for R. Journal of Open Source Software 2019, 4, 1926.
- Lu, X.; Ota, K.; Dong, M.; Yu, C.; Jin, H. Predicting transportation carbon emission with urban big data. IEEE Transactions on Sustainable Computing 2017, 2, 333–344.
- Liu, Y.H.; Ma, J.L.; Li, L.; Lin, X.F.; Xu, W.J.; Ding, H. A high temporal-spatial vehicle emission inventory based on detailed hourly traffic data in a medium-sized city of China. Environmental Pollution 2018, 236, 324–333.
- Wang, Y.; et al. Electric vehicles for greenhouse gas reduction in China: A review. Transportation Research Part D: Transport and Environment 2016, 51, 129–140. [CrossRef]
- Brand, C.; et al. The climate change mitigation effects of daily active travel in cities. Transportation Research Part D: Transport and Environment 2021, 93, 102764. [CrossRef]
- Zhu, P.; et al. The potential of ride-pooling in VKT reduction and its environmental implications. Transportation Research Part D: Transport and Environment 2021, 97, 102917. [CrossRef]
- Farnood, A.; Eicker, U.; Cucuzzella, C.; Gopakumar, G.; Khorramisarvestani, S. Sustainability Assessment Framework for Urban Transportation Combining System Dynamics Modeling and GIS; A TOD and Parking Policy Approach. Smart Cities 2025, 8, 107.
- Gonzalez, P.A.; de Nazelle, A. Mobility-based carbon footprint analysis of urban transportation modes using synthetic travel data. Transportation Research Part D: Transport and Environment 2019, 67, 1–14.
- Gurney, K.R.; Razlivanov, I.; Song, Y.; Zhou, Y.; Benes, B.; Abdul-Massih, M. Quantification of fossil fuel CO2 emissions on the building/street scale for a large US city. Environmental science & technology 2012, 46, 12194–12202.
- Laffont, P.; Waygood, E.O.D.; Patterson, Z. How Many Electric Vehicles Are Needed to Reach CO2 Emissions Goals? A Case Study from Montreal, Canada. Environmental Research Letters 2024, 29, 014401.
- Mapzen/Valhalla Project. Valhalla Routing Engine Documentation. https://valhalla.readthedocs.io/, 2020. Accessed: 2025-08-06.
- Bergman, L. Using Timestamped GPS Data for Travel Time Estimation and Route Optimization in an Open-Source Routing Engine, 2025.
- Cervero, R. Transit-Oriented Development in the United States: Experiences, Challenges, and Prospects; Number 102 in TCRP Report, Transportation Research Board: Washington, D.C., 2004.
- Glazener, A.; Khreis, H. Transforming our cities: best practices towards clean air and active transportation. Current environmental health reports 2019, 6, 22–37.
- Stewart, G.; Al-Khassaweneh, M. An implementation of the HDBSCAN* clustering algorithm. Applied Sciences 2022, 12, 2405.
- Munguía Mondragón, J.C.; Rendón Lara, E.; Alejo Eleuterio, R.; Granda Gutirrez, E.E.; Del Razo López, F. Density-based clustering to deal with highly imbalanced data in multi-class problems. Mathematics 2023, 11, 4008.
- Rousseeuw, P.J.; Kaufman, L. Finding groups in data: An introduction to cluster analysis; John Wiley & Sons Hoboken, New Jersey, 2009.
- Halkidi, M.; Batistakis, Y.; Vazirgiannis, M. On clustering validation techniques. Journal of intelligent information systems 2001, 17, 107–145.
Figure 1.
Validation of the synthetic travel dataset against observed OD survey distributions.
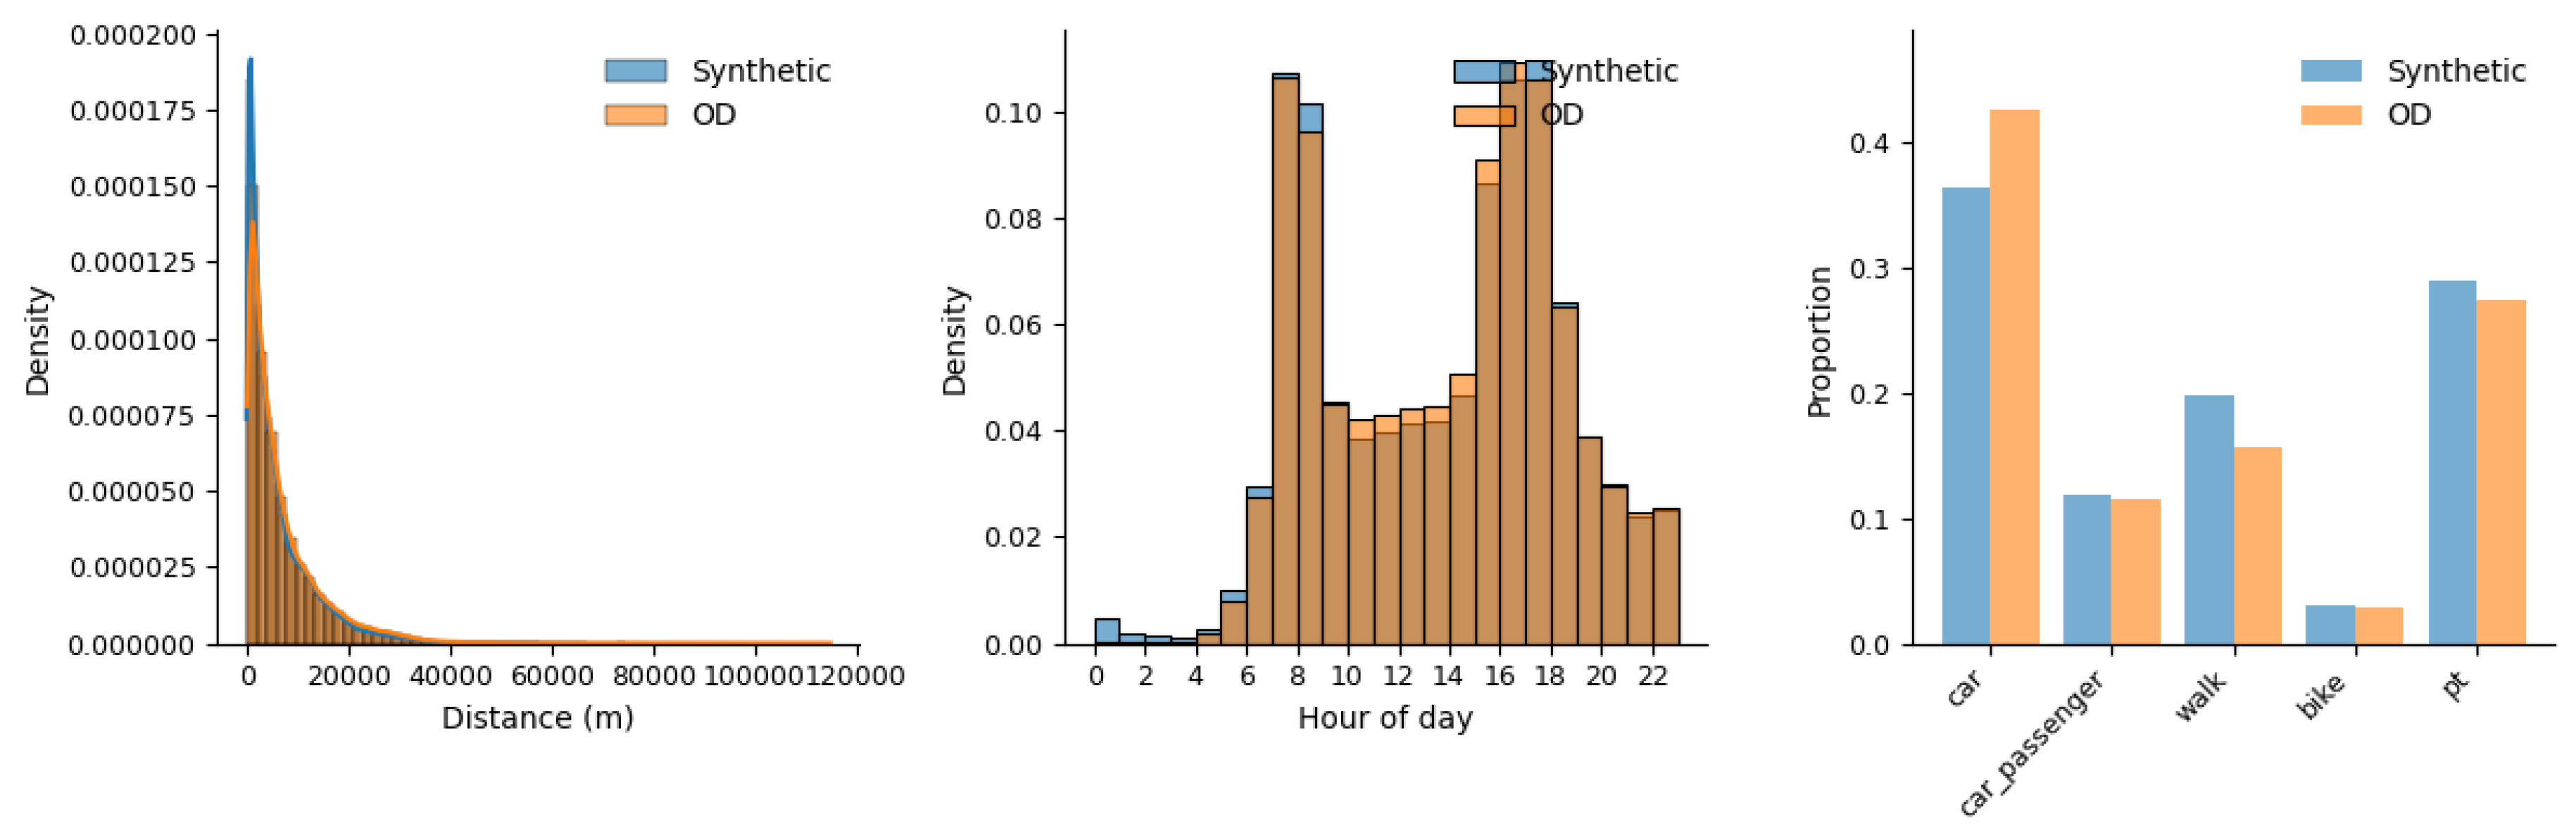
Figure 2.
Road network of the Island of Montreal.
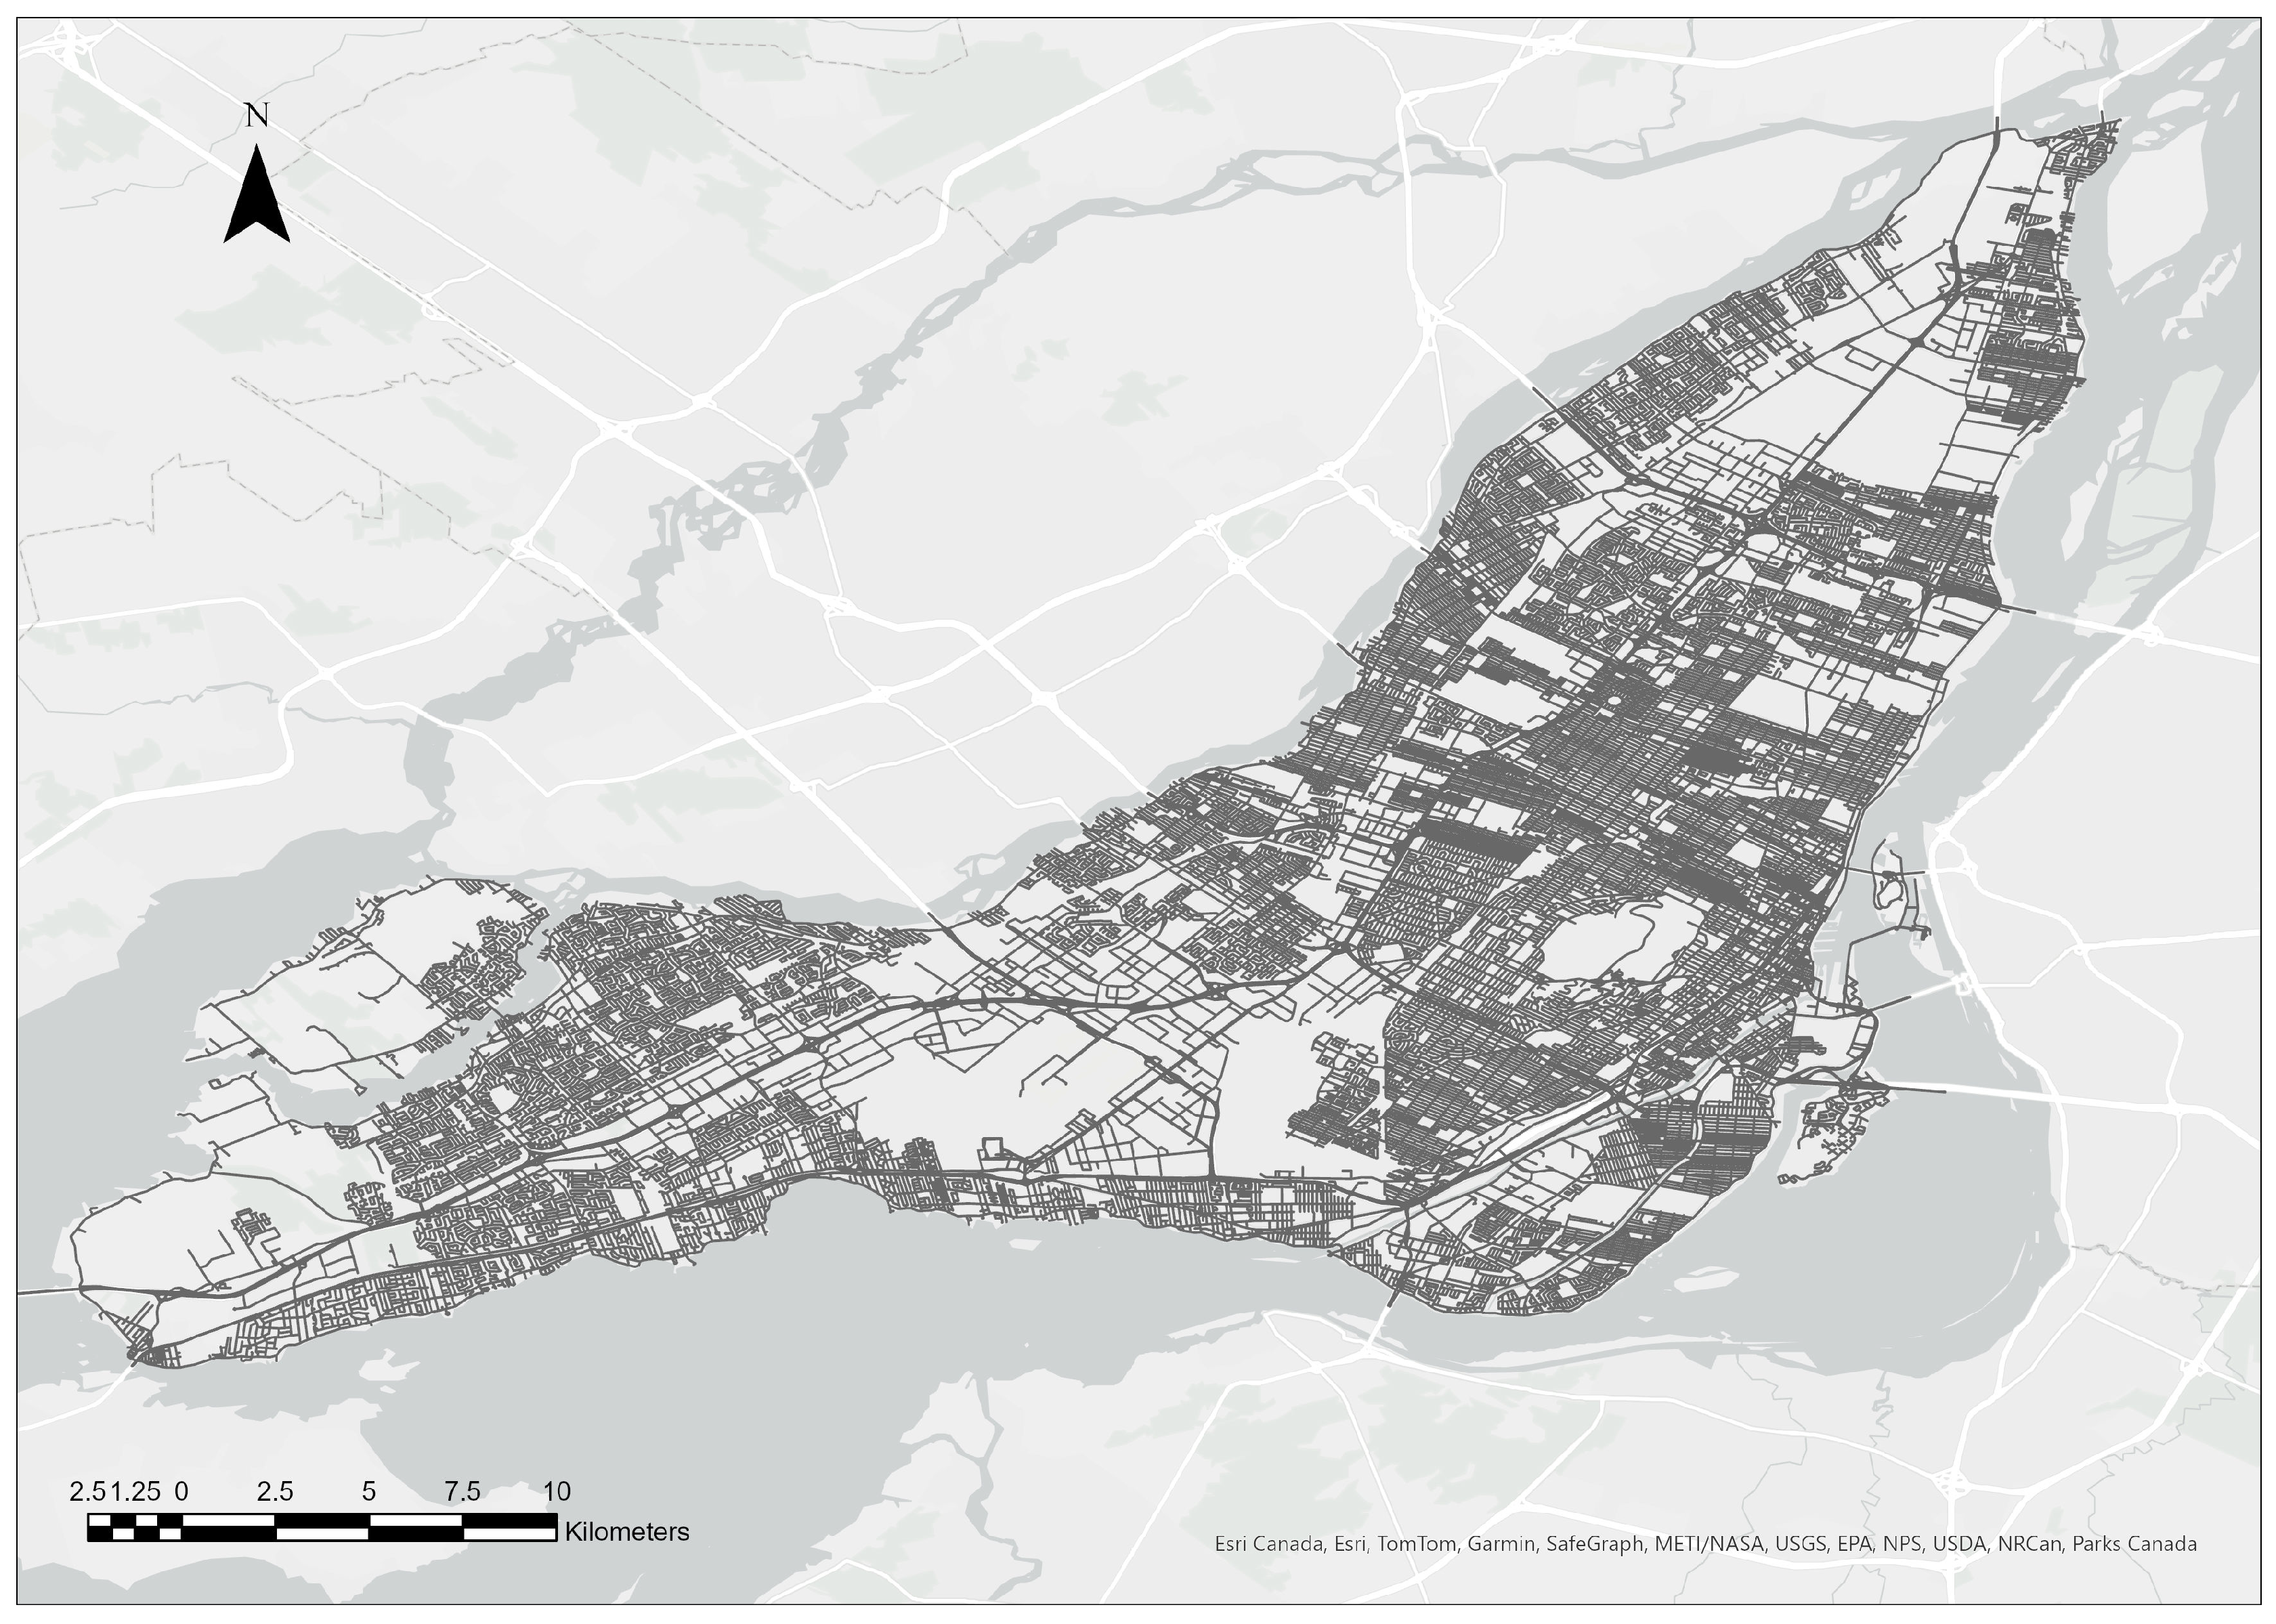
Figure 3.
Spatial distribution of estimated CO2 emissions across the Montreal road network.
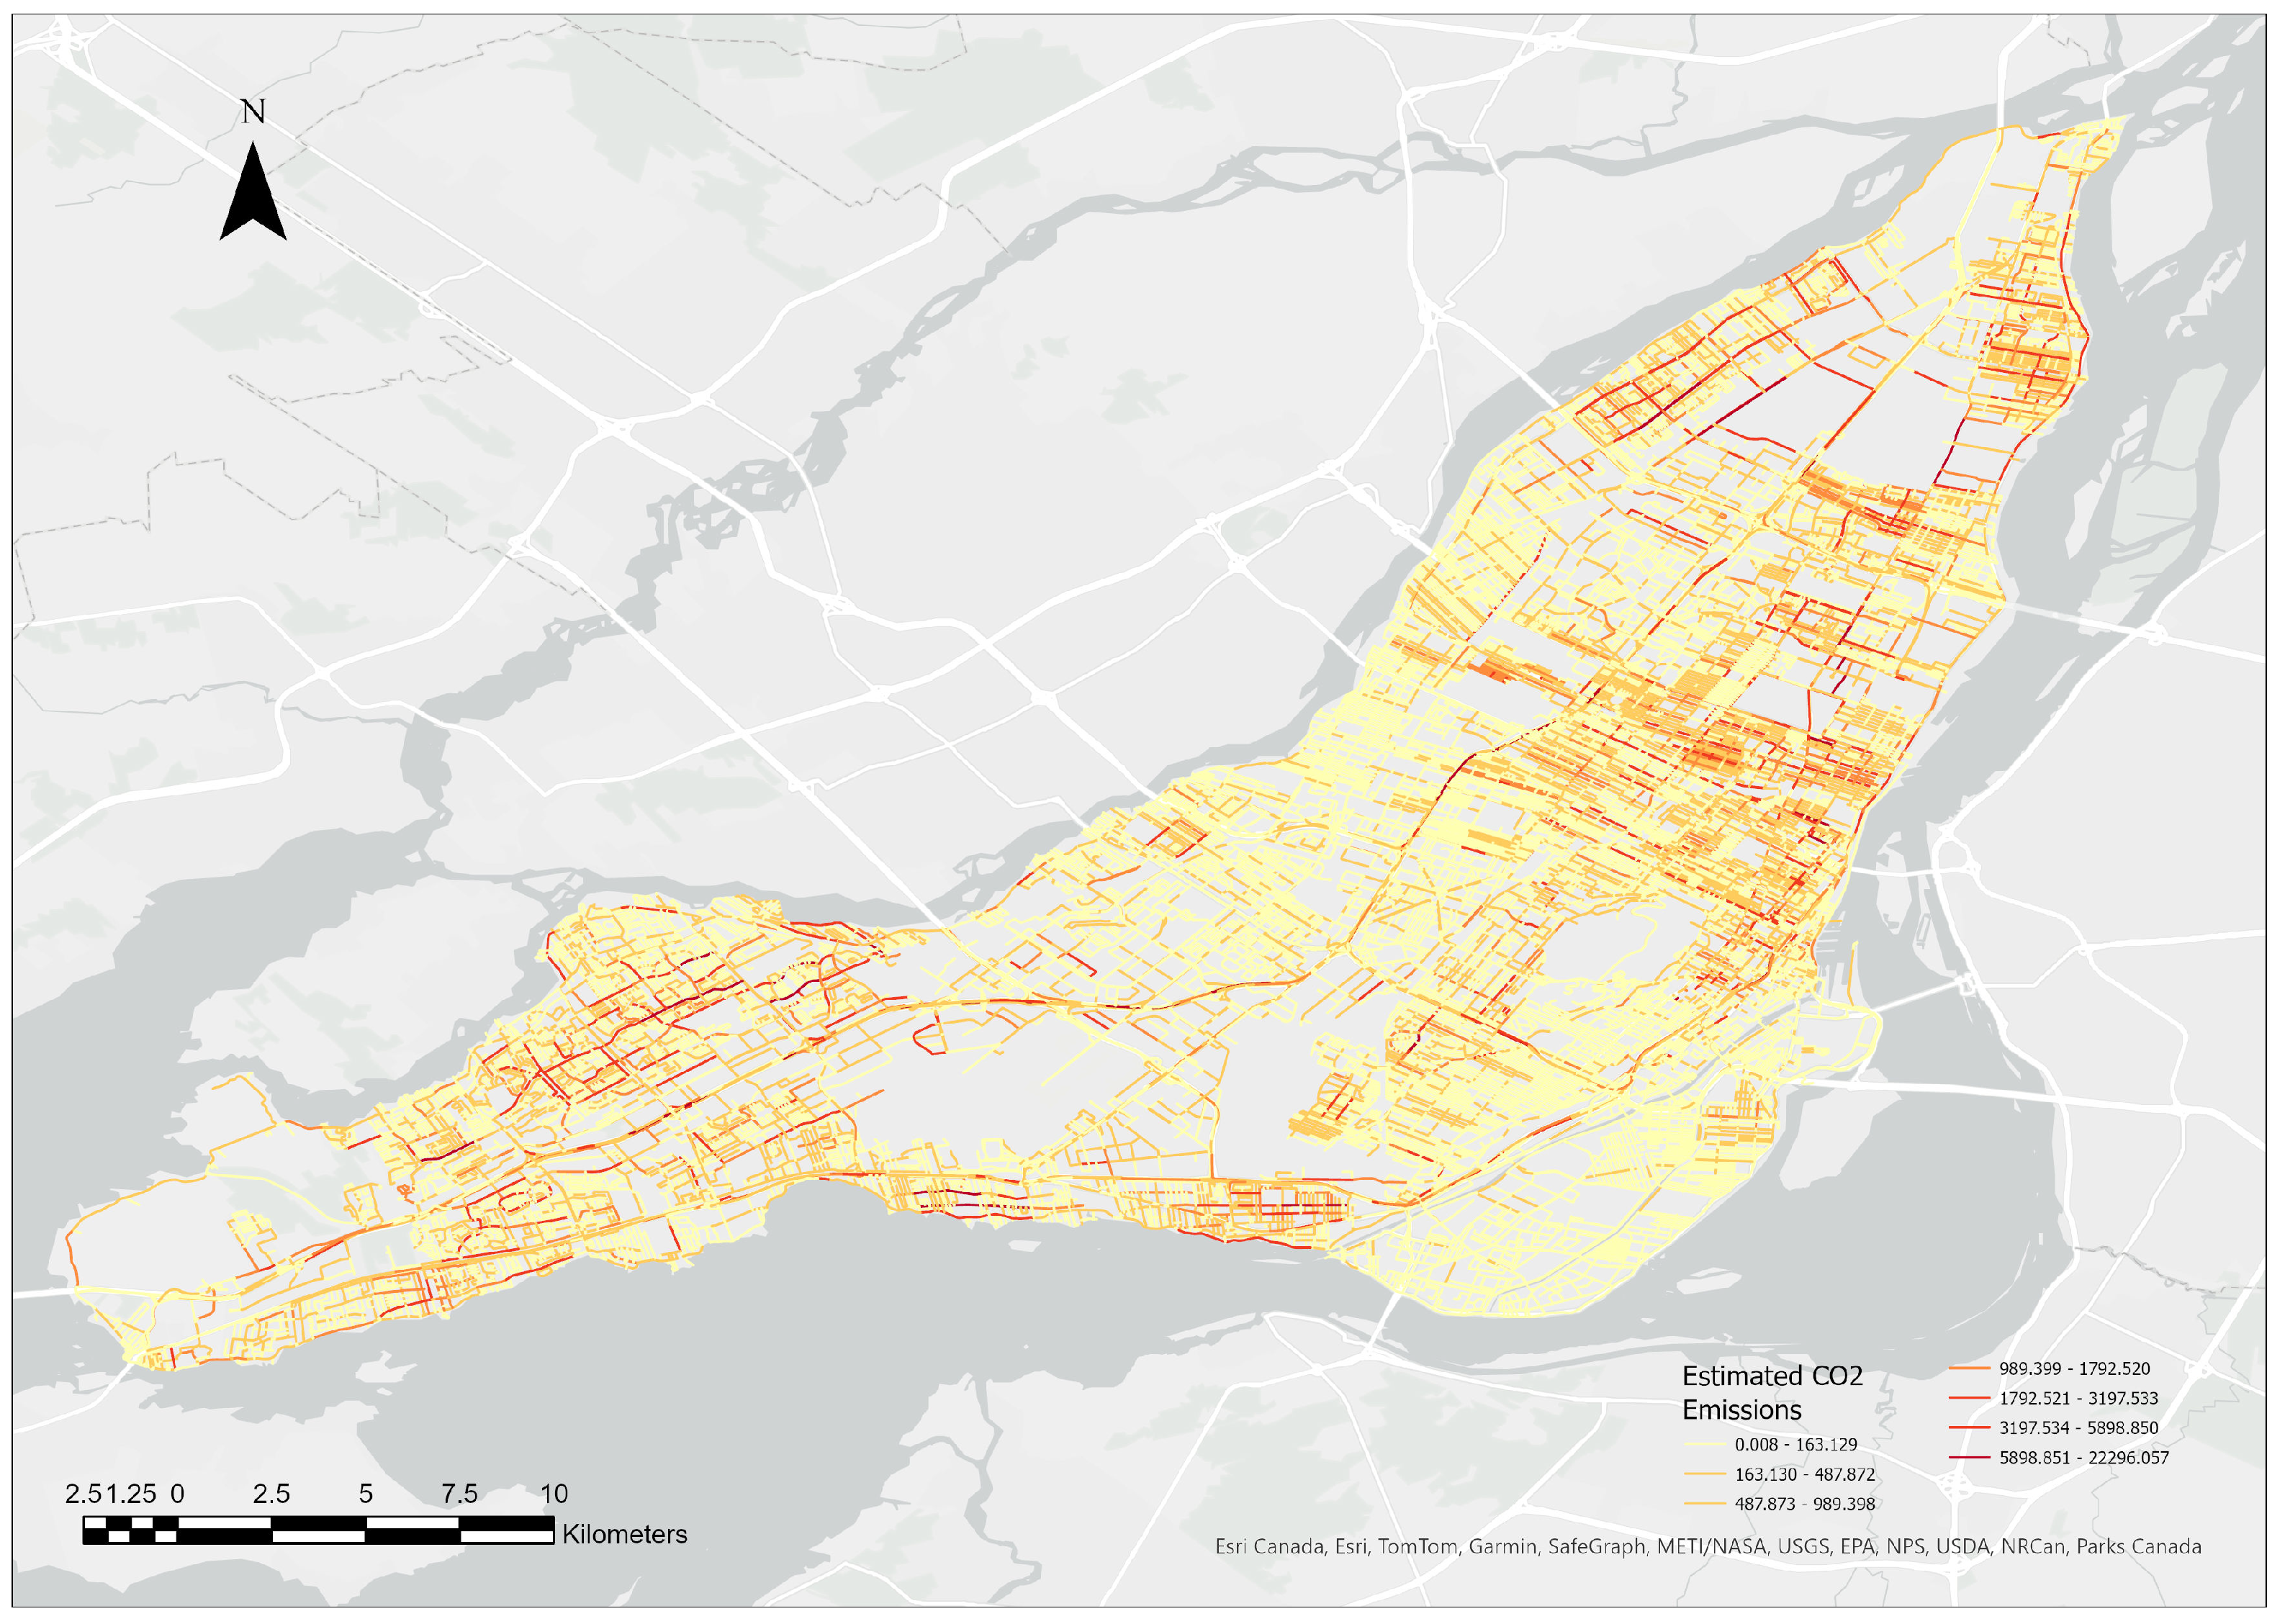
Figure 4.
Transit accessibility maps for modal shift scenarios.
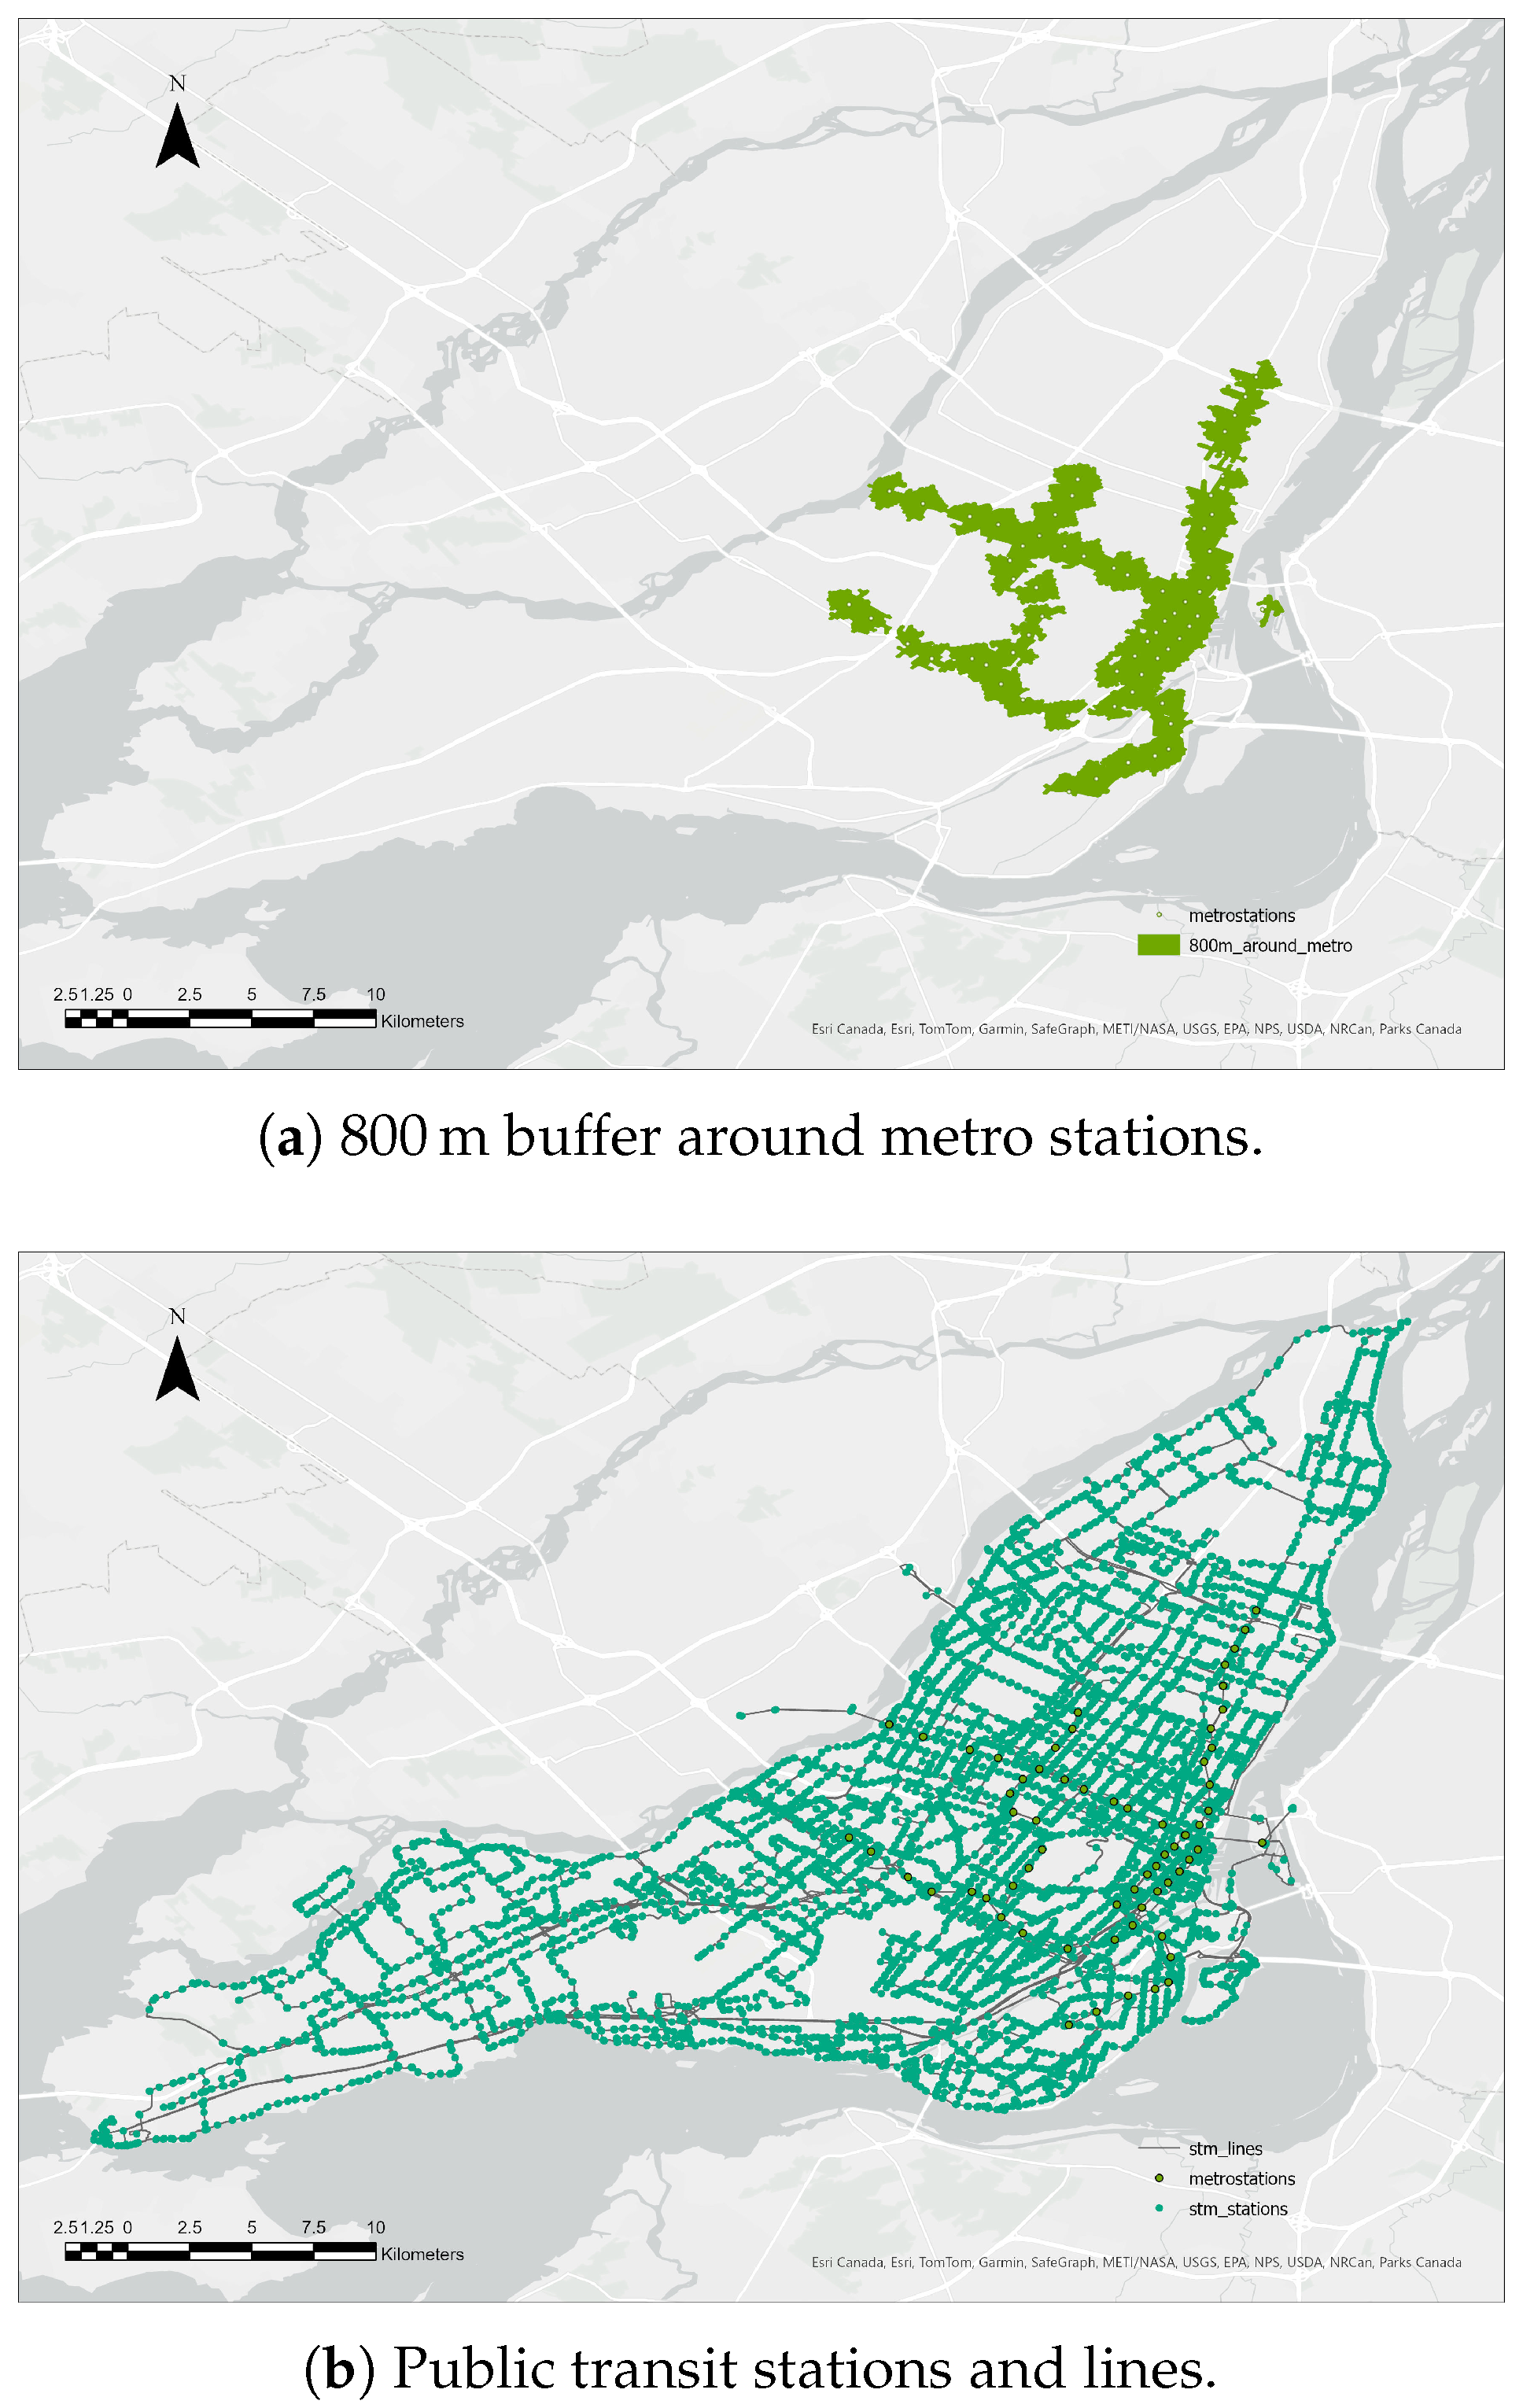
Figure 5.
Total CO2 emissions (tCO2) for baseline, S3-A (metro-only), and S3-B (metro+bus). Percentages show reduction from baseline.
Figure 5.
Total CO2 emissions (tCO2) for baseline, S3-A (metro-only), and S3-B (metro+bus). Percentages show reduction from baseline.
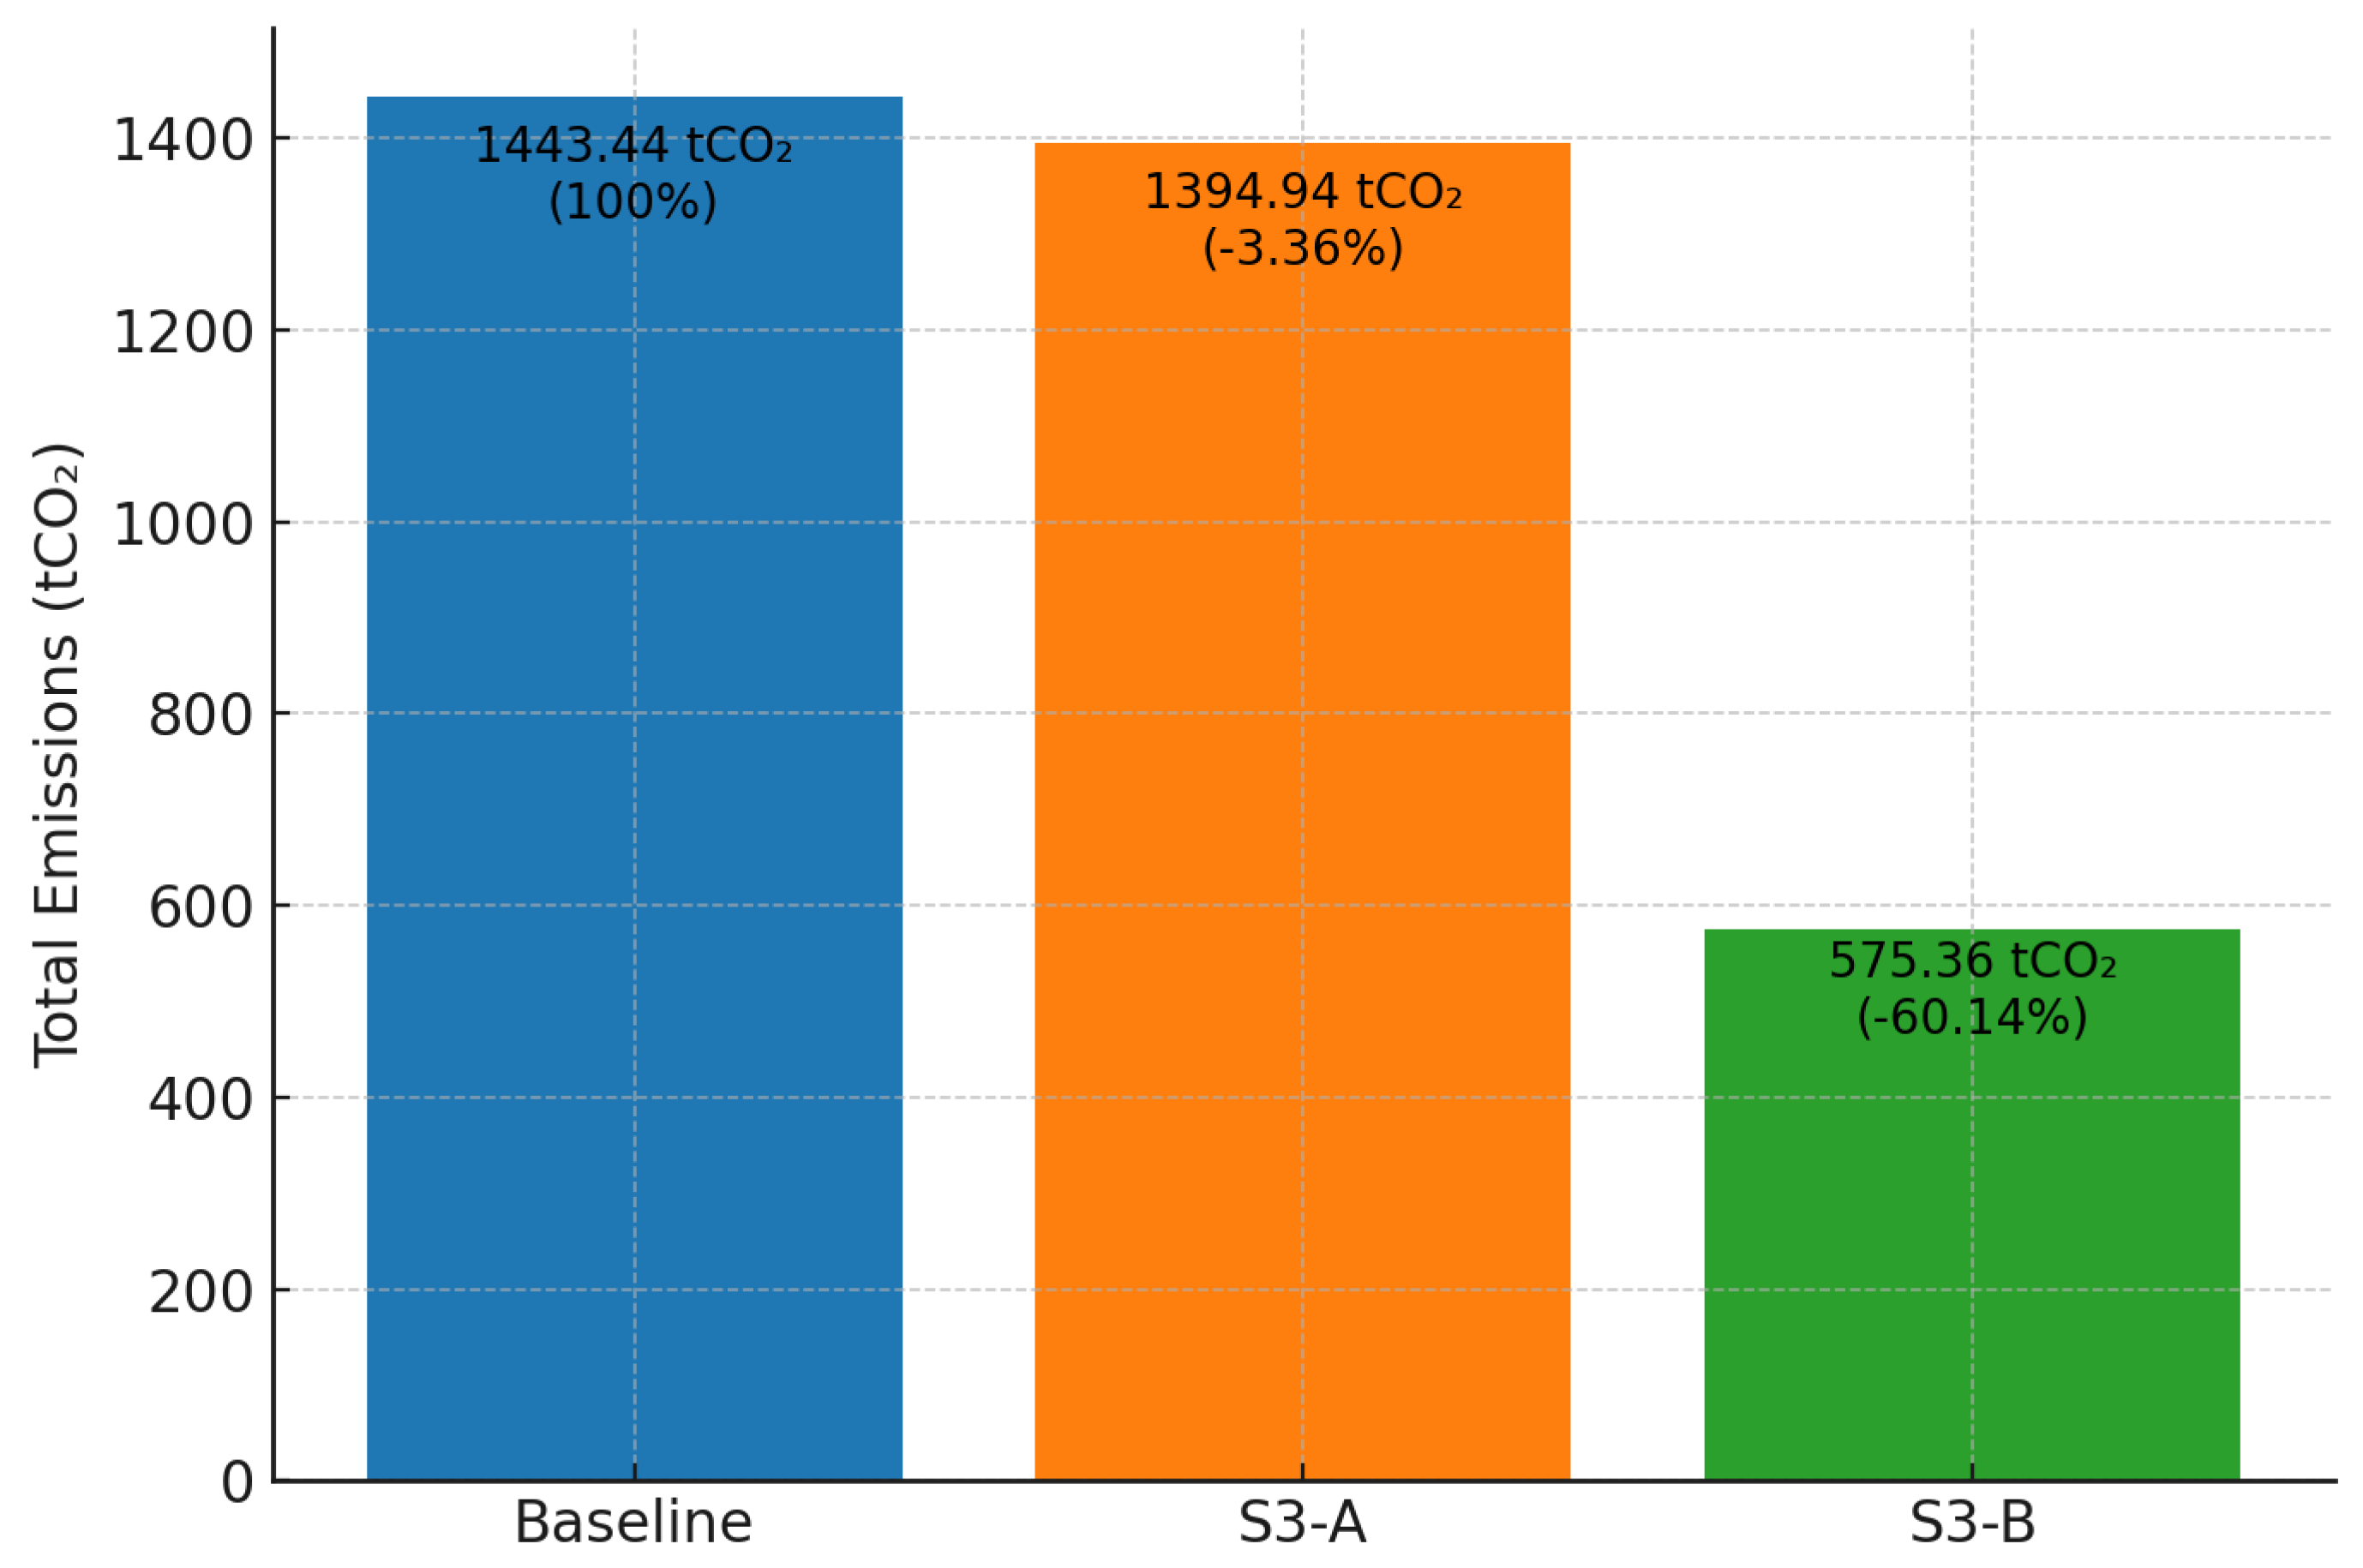

Table 1.
Consolidated vehicle categories with fleet share and average emissions.
| Cat. | Vehicle Type (Fuel) | Vehicles | % Fleet | gCO2/km |
|---|---|---|---|---|
| 1 | Battery Electric Vehicles (BEVs) | 12,576 | 0.26% | 6.9 |
| 2 | Hybrid Electric Vehicles (HEVs/PHEVs) | 55,843 | 1.17% | 47.6 |
| 3 | Compact Gasoline Cars (small–mid size) | 1,932,577 | 40.35% | 180.5 |
| 4 | Mid-size Gasoline Cars | 1,385,468 | 28.94% | 222.5 |
| 5 | SUVs and Crossovers | 1,047,767 | 21.89% | 277.5 |
| 6 | Pickups and Large SUVs (Gasoline/Diesel) | 344,959 | 7.20% | 353.6 |
Table 2.
Impact of Targeted EV Replacement by Vehicle Category (S2A).
| Vehicle Category | Total Vehicles | Fleet Share (%) | Original Emissions (tCO2) | New Emissions (tCO2) | Category Reduction % |
|---|---|---|---|---|---|
| 3 | 1,932,577 | 40.4% | 888.98 | 30.00 | 96.6% |
| 4 | 1,385,468 | 28.9% | 931.67 | 28.00 | 97.0% |
| 5 | 1,047,767 | 21.9% | 949.53 | 27.00 | 97.2% |
| 6 | 344,959 | 7.2% | 1,144.61 | 41.00 | 96.4% |
Table 3.
Impact of Partial Fleet Electrification (S2B).
| EV Adoption % | New Emissions (tCO2) | Reduction % |
|---|---|---|
| 10% | 1,164.16 | 9.6% |
| 25% | 978.05 | 24.1% |
| 50% | 667.87 | 48.2% |
| 75% | 357.69 | 72.2% |
| 100% | 47.51 | 96.3% |
Table 4.
Impact of Gradual Electrification of Vehicle Categories on CO2 Emissions.
| Electrified Categories | Fleet % Affected | New Emissions (tCO2) | Reduction % |
|---|---|---|---|
| None (Baseline) | 0% | 1,288.23 | 0.0% |
| Category 6 only | 7.2% | 1,144.61 | 11.2% |
| Category 5 only | 21.9% | 949.53 | 26.3% |
| Category 4 only | 28.9% | 931.67 | 27.7% |
| Category 3 only | 40.4% | 888.98 | 31.0% |
| Categories 5 + 6 | 29.1% | 857.40 | 33.5% |
| Categories 4 + 5 + 6 | 58.0% | 486.80 | 62.2% |
| Categories 3 + 4 + 5 + 6 | 98.6% | 115.70 | 91.0% |
Disclaimer/Publisher’s Note: The statements, opinions and data contained in all publications are solely those of the individual author(s) and contributor(s) and not of MDPI and/or the editor(s). MDPI and/or the editor(s) disclaim responsibility for any injury to people or property resulting from any ideas, methods, instructions or products referred to in the content. |
© 2025 by the authors. Licensee MDPI, Basel, Switzerland. This article is an open access article distributed under the terms and conditions of the Creative Commons Attribution (CC BY) license (http://creativecommons.org/licenses/by/4.0/).
Copyright: This open access article is published under a Creative Commons CC BY 4.0 license, which permit the free download, distribution, and reuse, provided that the author and preprint are cited in any reuse.


