Submitted:
03 September 2025
Posted:
04 September 2025
You are already at the latest version
Abstract
The efficiency of in vitro regeneration in litchi (Litchi chinensis Sonn.) is highly influenced by the type and concentration of plant growth regulators (PGRs), particularly auxins. Although the effects of various growth regulators on the in vitro regeneration have been studied, more types of auxins need to be investigated for their influence on somatic embryogenesis and plantlet regeneration of litchi. In this study, the effects of phenylacetic acid (PAA) and its derivatives—4-chlorophenylacetic acid (CPA) and 4-iodophenylacetic acid (IPA)—were assessed in relation to callus proliferation, somatic embryogenesis (SE), and plantlet regeneration in ‘Feizixiao’ litchi. The inclusion of CPA or IPA in callus proliferation medium significantly enhanced the proliferation rate, with 20 mg·L−1 CPA the most effective treatment. Embryonic calli following CPA and IPA treatments exhibited a deeper yellow color, smaller cell clusters, and thicker cytoplasm compared to the control and PAA-treated calli. The highest number of somatic embryos per gram of fresh embryonic callus weight (gFW−1) (1131 embryos·gFW−1) was observed when 40 mg·L−1 PAA was added to the proliferation medium. The addition of 10 mg·L−1 IPA to the proliferation medium yielded the highest plantlet regeneration rate (50 plantlets·gFW−1). The optimal supplementation of the somatic embryo induction medium was 5 mg·L−1 PAA, which resulted in 460 somatic embryos·gFW−1 and 86 regenerated plantlets·gFW−1. These findings indicate that PAA and its derivatives are effective PGRs in the in vitro regeneration of litchi, and provide a valuable protocol for the propagation of elite cultivars.
Keywords:
auxin
; litchi (Litchi chinensis Sonn.)
; somatic embryogenesis
; in vitro regeneration
; plant growth regulators
1. Introduction
Litchi (Litchi chinensis Sonn.) is an economically important fruit tree native to southern China and widely cultivated in tropical and subtropical regions, including China, Vietnam, India, and Thailand [1]. It belongs to the Sapindaceae family, and specifically the Nepheleae subfamily. Traditional breeding methods, such as hybridization and seed selection, are hindered by the highly heterozygous genetic background and long juvenile period of litchi [2,3], limiting the development of elite cultivars [4]. In vitro regeneration techniques, particularly somatic embryogenesis (SE), offer a promising alternative means of rapid propagation and genetic improvement [5,6,7,8]. However, the application of SE in litchi is constrained by several challenges, including low embryonic efficiency, genotype dependency, poor germination of somatic embryos, and a high frequency of abnormal embryos [9,10,11]. Therefore, optimizing SE protocols remains a critical research objective.
Plant growth regulators (PGRs), particularly auxins, are pivotal in SE. Commonly used synthetic auxins such as 2,4-dichlorophenoxyacetic acid (2,4-D) and 1-naphthylacetic acid (NAA), along with cytokinins such as kinetin (KT) and thidiazuron (TDZ), have been extensively studied in litchi SE [12,13,14,15]. Among these, 2,4-D is the most frequently used synthetic auxin for inducing embryonic callus (EC) and SE [16,17]. However, prolonged exposure to 2,4-D was shown to cause genetic instability and reduce regeneration efficiency [11,18], highlighting the need for safer alternatives.
Phenylacetic acid (PAA), a naturally occurring auxin found in various plant species, has been shown to promote shoot regeneration, root formation, and somatic embryogenesis in plants such as Vanilla planifolia [19] and Decalepis hamiltonii [20]. PAA also influences auxin transport, enzyme activity, and defense responses [21,22,23,24]. Despite these promising effects, the potential of PAA and its derivatives in litchi SE remains unexplored.
This study evaluates the effects of PAA and its halogenated derivatives—4-chlorophenylacetic acid (CPA) and 4-iodophenylacetic acid (IPA)—on callus proliferation, somatic embryogenesis, and plantlet regeneration in ‘Feizixiao’ litchi. The specific objectives of the study were as follows: (1) identify the optimal type and concentration of PAA derivatives for callus proliferation; (2) improve the morphology and development of somatic embryos; and (3) establish an efficient regeneration system. The findings provide a robust protocol for high-frequency regeneration and contribute to the biotechnological breeding of litchi.
2. Materials and Methods
2.1. Plant Materials and Callus Culture
ECs were induced from anthers of ‘Feizixiao’ litchi collected from trees at the Institute of Tropical Fruits, Hainan Academy of Agricultural Sciences, Hainan Province, China. The anthers were cultured on callus-induction medium [Murashige and Skoog (MS) medium (Phyto Technology Laboratories, Shawnee Mission, KS, USA) [25] supplemented with 2 mg·L−1 benzylaminopurine (BA), 0.5 mg·L−1 NAA, and 3 mg·L−1 2,4-D]. Cultures were maintained at 25 ± 2°C in the dark, and calli were subcultured every 40 days [9]. For callus proliferation, two types of media were used, alternating every 30 days: MS medium with 1 mg·L−1 2,4-D, and MS medium with 1 mg·L−1 2,4-D, 0.5 mg·L−1 KT, and 5 mg·L−1 AgNO3. All media contained 30 g·L−1 sucrose and 7 g·L−1 agar.
2.2. Addition of Regulators to the Proliferation Medium
In the first experiment, 0.2 g of 25-day-old EC was transferred to proliferation medium (MS basal medium supplemented with 1, 5, 10, 20, 40, or 80 mg·L−1 PAA, CPA, or IPA dissolved in distilled water). Each treatment consisted of five Petri dishes per replicate, with three replicates per experimental run, and the experiment was repeated six times. Callus was weighed on days 0 and 21, and the proliferation rate was calculated over a 3-week incubation period. The control medium contained 1 mg·L−1 2,4-D. All media were supplemented with 30 g·L−1 sucrose and 7 mg·L−1 agar.
The EC proliferation index was calculated as follows: EC proliferation index = (callus mass on day 21 − callus mass on day 0)/callus mass on day 0.
Subsequently, the ECs were subcultured on somatic embryo induction medium [MS medium with 0.1 mg·L−1 NAA, 5 mg·L−1 KT, 0.4 g·L−1 lactalbumin hydrolysate (LH), 0.1 g·L−1 inositol, 60 g·L−1 sucrose, and 10 g·L−1 agar] for 7 weeks. The embryo yield was determined by counting the number of somatic embryos per gram of fresh EC weight (gFW−1).
Somatic embryos were then transferred to maturation medium [MS medium with 0.5 mg·L−1 IAA, 1 mg·L−1 ABA, 100 mL·L−1 coconut water, 60 g·L−1 sucrose, and 10 g·L−1 agar] for 8 weeks. Mature somatic embryos were germinated on regeneration medium (1/2 MS medium with 0.5 mg·L−1 GA3). The number of regenerated plantlets per gram of fresh EC weight after 6 weeks under a 16-h photoperiod with a light intensity of 50 μmol−1 m2·s−1 was recorded.
2.3. Addition of Regulators to the Somatic Embryo Induction Medium
In a separate experiment, 20-day-old ECs pre-cultured on MS medium with 1 mg·L−1 2,4-D were transferred to MS medium supplemented with 0.1 mg·L−1 NAA, 0.4 g·L−1 LH, 0.1 g·L−1 inositol, 60 g·L−1 sucrose, 10 g·L−1 agar, 5 g·L−1 KT or TDZ, and 1, 5, 10, or 20 mg·L−1 PAA, CPA, or IPA. The cytokine concentrations were selected based on previous studies [9]. The control medium contained all components except PAA, CPA, and IPA. Somatic embryo maturation and regeneration conditions were the same as those described in Section 2.2. For somatic embryo induction, 60 Petri dishes were used per treatment, with 10 dishes per replicate. For regeneration, 90 mature somatic embryos (0.5–1.0 mm) were transferred to regeneration medium, with 30 embryos per replicate. All experiments were independently repeated twice.
The PGRs (2,4-D, KT, BA, NAA, LH, IAA, ABA, and GA3) were purchased from Sangon Biotech Co., Ltd. (Shanghai, China). PAA, CPA, and IPA were obtained from Macklin Biochemical Co., Ltd. (Shanghai, China). Sucrose and agar were sourced from Solarbio (Beijing, China), and silver nitrate was from Yindian Chemical Co., Ltd. (Shanghai, China).
2.4. Data Analysis
Data were analyzed using one-way analysis of variance (ANOVA). Significant differences among means were determined by Duncan’s new multiple range test at p < 0.05 using DPS Data Processing System software [26].
3. Results
3.1. Effects of Regulators on Callus Proliferation and Morphology
Callus proliferation was significantly enhanced on media supplemented with CPA or IPA compared to control media (Table 1). In contrast, the use of PAA resulted in lower proliferation rates relative to the control. Calli grown on CPA- or IPA-containing media exhibited darker yellow and coarser particles than those on control or PAA-supplemented media. Proliferation decreased as the PAA concentration increased. At lower PAA concentrations (1–20 mg·L−1), calli appeared light yellow, loose, and fine-grained (Figure 1, red arrow), with abundant oval cells (Figure 2, red arrow) and small cell clusters (Figure 2, pink arrow). Transparent embryos were observed only at 40 mg·L−1 PAA (Figure 1, black arrow).
Callus proliferation and the number of transparent embryos increased as the CPA concentration increased, peaking at 20 mg·L−1 CPA (Table 1). At this concentration, the callus edges were predominantly differentiated into transparent embryos (Figure 1, black arrow), while the inner callus was compact and coarse (Figure 1, green arrow). Lower CPA concentrations (1–10 mg·L−1) promoted the formation of free single cells (Figure 2, red arrow) and small cell clusters (Figure 2, green arrow), whereas higher concentrations (20–80 mg·L−1) led to larger cell clusters (Figure 2, blue arrow).
Low concentrations of IPA (1 and 5 mg·L−1) also enhanced proliferation, producing creamy yellow, hard, and fine-grained calli (Figure 1, red arrow) with numerous free, small, round single cells (Figure 2, purple arrow). At 10 mg·L−1 IPA, calli became light yellow, compact, and coarse, with an increase in transparent embryos (Figure 1, black arrow) and cell clusters (Figure 2, pink arrow). At 20 mg·L−1 IPA, calli ceased proliferation, with extensive cytoplasmic shrinkage and cell death (Figure 2, yellow and white arrows). Based on these observations, 5 mg·L−1 IPA was selected for further experiments due to its favorable callus morphology and high embryonic potential.
3.2. Somatic Embryogenesis and Regeneration
The number of somatic embryos increased as the concentration of PAA, CPA, and IPA increased, with PAA showing the most pronounced effect (Table 1). The highest embryo yields were observed using 40 mg·L−1 PAA, 20 mg·L−1 CPA, and 5 mg·L−1 IPA. Somatic embryos induced by PAA or CPA were primarily spherical (Figure 3, black border), clustered (Figure 3, green border), or trumpet-like (Figure 3, blue border), with few cotyledon embryos (Figure 3, red border). The clustered embryos reached diameters of up to 5 mm, while other embryos were smaller (≈3 mm). In contrast, IPA-induced embryos were predominantly cotyledon, particularly at 5 and 10 mg·L−1, with diameters of approximately 3 mm. However, both spherical and clustered embryos on CPA- and IPA-containing media often turned milky white or brown during maturation (Figure 3, white border).
The regeneration efficiency varied significantly among treatments. IPA-supplemented media yielded the highest number of regenerated plantlets, while PAA and CPA treatments produced lower regeneration rates. The regeneration increased as the PAA concentration increased, but it decreased at higher CPA and IPA concentrations. Somatic embryos on PGR-supplemented media exhibited delayed greening and germination. Some embryos developed a red coloration (Figure 4C, red border), produced secondary embryos (Figure 4B, D, black arrow), or formed calli (Figure 4D, white arrow). Plantlets often had short, dark green internodes (Figure 4C, D, yellow border).
3.3. Effects of PAA/CPA/IPA Combined with KT or TDZ on Somatic Embryogenesis and Regeneration
3.3.1. PAA Combined with KT or TDZ
The combination of PAA with either KT or TDZ significantly influenced SE and regeneration (Table 2). Low PAA concentrations with KT or high PAA concentrations with TDZ enhanced embryo induction and regeneration, outperforming the CPA and IPA combinations. With PAA and KT combined, embryo and plantlet numbers peaked at 5 mg·L−1 PAA. With PAA and TDZ combined, the optimal response was observed at 20 mg·L−1 PAA. Somatic embryos arising from PAA treatments were primarily dicotyledonous (Figure 5A) or multicotyledonous (Figure 5B). Regenerated plantlets had shortened internodes (Figure 4E, yellow border), thicker stems (Figure 4F, pink arrow), and occasionally a deep red color (Figure 4E, red border).
3.3.2. CPA Combined with KT or TDZ
CPA combined with KT yielded higher SE and regeneration efficiencies than CPA with TDZ. The best results were achieved with 1 mg·L−1 CPA and KT, which produced small, uniform dicotyledonous embryos with high regeneration rates. Regenerated plantlets had longer roots (≈7 cm; Figure 4G, H, blue arrow) and stems (≈3 cm; Figure 4G, yellow arrow). Higher CPA concentrations reduced embryo and plantlet numbers, resulting in globular (Figure 5C) or cup-shaped (Figure 5D) embryos with shorter stems and thinner roots. CPA with TDZ produced clustered globular embryos (Figure 5E) with low germination rates and increased callus formation (Figure 4G, F, white arrow).
3.3.3. IPA Combined with KT or TDZ
IPA with KT also outperformed IPA with TDZ. The combination of 1 mg·L−1
IPA and KT yielded the highest number of somatic embryos, which were dark green and swollen (Figure 4H, purple border), primarily cotyledon, with stems exceeding 1.5 cm. Higher IPA concentrations reduced the embryo numbers and germination rates, and led to clustered embryos (Figure 5F) with slender leaves (Figure 4G, red arrow). IPA with TDZ produced small, clustered embryos that remained milky white (Figure 4J, black border) and yielded weak plants (Figure 4J, purple arrow) with long roots (Figure 4J, blue arrow). The optimal combination was 5 mg·L−1 IPA and 5 mg·L−1 KT, which achieved the highest SE and regeneration efficiency.
4. Discussion
The in vitro regeneration of many plant species, including litchi, represents a promising means of improving the quality of planting materials [6,7,27]. In established litchi regeneration systems, calli derived from different varieties exhibit variations in growth rate, morphology, color, and texture [13,18,28]. For example, in media containing 2,4-D and biotin, callus of Litchi chinensis cv. 'Zili' achieved a regeneration rate of 42.6% [11], while regeneration rates on media supplemented with other regulators, such as indole-3-butyric acid, zeatin (ZT), KT, NAA, or BA, ranged from 7.0% to 33.1% [9,10,12,28]. In the present study, supplementation of the callus proliferation or SE medium with various concentrations of PAA, CPA, and IPA enhanced somatic embryo induction to varying degrees. The highest number of somatic embryos per gFW−1 (1131 embryos·gFW−1) was observed with 40 mg·L−1 PAA added to the proliferation medium, while the highest germination rate (50 plantlets·gFW−1) was achieved with 10 mg·L−1 IPA (Table 1). These results aligned with findings in geranium, in which PAA was shown to accelerate somatic embryo induction [29]. The promoting effect of PAA on rapid somatic embryo formation may be attributed to its auxin-like activity, which regulates auxin transport [30] and enhances the morphogenesis of early somatic embryos, thereby improving SE efficiency. Previous studies demonstrated that PAA exhibited auxin-like activity in wheat and Avena coleoptiles and in other auxin-mediated physiological processes [31]. The high regeneration rates observed with PAA and its derivatives in this study may have also been influenced by the exogenous auxin concentration; excessively high levels may inhibit further development of somatic embryos, leading to reduced germination. Because IPA exhibits weaker auxin activity compared to PAA and CPA [32,33], the highest germination rates were achieved at lower concentrations (5–10 mg·L−1). This was consistent with reports that low concentrations of 2,4-D (1–2 mg·L−1) promoted somatic embryo differentiation but inhibited subsequent development [16,34,35].
PAA biosynthesis from phenylalanine shares similarities with IAA biosynthesis pathways, and recent evidence suggests that PAA metabolism and signaling mechanisms are analogous to those of IAA [30,32]. As an auxin, PAA appears to directly participate in somatic embryo formation during SE. Consequently, the frequency of bud regeneration from somatic embryos was notably high in PAA-treated cultures. With the exception of the proliferation medium supplemented with 5 mg·L−1 PAA, supplementation with PAA or its derivatives at the somatic embryo induction stage resulted in higher SE and regeneration efficiencies compared to supplementation during the callus proliferation stage.
Cytokinins such as KT and TDZ are widely used to induce SE in numerous plant species [36,37,38]. Combining cytokinins and auxins is a common means of regulating in vitro plant regeneration. In this study, Regeneration efficiencies were higher when PAA, CPA, or IPA was combined with KT than when combined with TDZ.Moreover, PAA treatments consistently outperformed CPA and IPA treatments, irrespective of whether TDZ or KT was used. A balanced ratio between cytokinins and auxins is generally required to initiate growth and differentiation in tissue culture systems. Thus, an optimal cytokine-to-auxin ratio may enhance bud formation [39].
The interactions between concentrated PGRs observed in this study affected both SE and germination, corroborating the results of earlier studies on Nerium odorum leaf explants, in which various concentrations of PAA and BA (0.5–10 mg·L−1) were tested [40]. PGRs are known to interact with endogenous hormones in explants to stimulate cell differentiation, a phenomenon also reported in chickpea and sunflower [21,41]. For example, Qiao et al. [22] achieved a maximum shoot differentiation rate of 28.3 ± 4.29% in bamboo using medium supplemented with 0.5 mg·L−1 KT, 2 mg·L−1 BA, 0.2 mg·L−1 NAA, and 0.15 mg·L−1 PAA. While the current findings are promising, further physiological and biochemical studies are needed to characterize the regulatory relationship between PAA and SE in litchi.
5. Conclusions
In this study, we established an efficient somatic embryogenesis system for ‘Feizixiao’ litchi using PAA and its derivatives. CPA significantly enhanced callus proliferation, with an optimal concentration of 20 mg·L−1. PAA at 40 mg·L−1 yielded the highest number of somatic embryos, while IPA at 10 mg·L−1 promoted the highest regeneration rate. The combination of 5 mg·L−1 PAA and 5 mg·L−1 KT proved most effective for simultaneous embryo induction and plant regeneration. These findings demonstrated that PAA and its derivatives can serve as potent alternatives to synthetic auxins in litchi tissue culture, therefore providing a robust protocol for the micro-propagation of elite cultivars. Future studies should focus on describing the molecular mechanisms underlying PAA-induced somatic embryogenesis to further optimize regeneration protocols.
Author Contributions
Conceptualization, J.W.; methodology, H.L.; validation, G.W. and Y.L.; formal analysis, G.W.; investigation, L.Z.; resources, Z.L.; data curation and writing—original draft preparation, G.W.; writing—review and editing, J.W.; supervision, H.L.; project administration and funding acquisition, J.W.. All authors have read and agreed to the published version of the manuscript.
Funding
This research was funded by the National Natural Science Foundation (32402522), the Science and Technology Special Fund of Hainan Province (Grant No. ZDYF2023XDNY052), and the Earmarked Fund for CARS (Grant No. CARS-32). The APC was funded by CARS (Grant No. CARS-32).
Institutional Review Board Statement
This study did not include any experiments with human participants or animals performed by any of the authors.
Data Availability Statement
The original contributions presented in the study are included in the article. Further inquiries can be directed to the corresponding author.
Acknowledgments
We thank our pre-submission expert reviewer. We thank LetPub (www.letpub.com.cn) for linguistic assistance and pre-submission expert review.
Conflicts of Interest
The authors declare no conflicts of interest.
References
- Hussain, S.Z.; Naseer, B.; Qadri, T.; Fatima, T.; Bhat, T.A. Litchi (Litchi chinensis): Morphology, taxonomy, composition and health beneffts. In Fruits grown in Highland regions of the himalayas: Nutritional and Health beneffts; Hussain, S.Z., Naseer, B., Qadri, T., Fatima, T., Bhat, T.A., Eds.; Springer International Publishing: Cham, 2021; pp. 181–191. [Google Scholar]
- Litz, R.E. Somatic embryogenesis from cultured leaf explants of the tropical tree Euphoria longan Stend. J Plant Physiol. 1988, 132, 190–193. [Google Scholar] [CrossRef]
- Litz, R.E.; Raharjo, S. Dimocarpus longan longan and Litchi chinensis litchi. In Biotechnology of Fruit And Nut Crops; Litz, R.E., Ed.; CABI: Wallingford, 2005; pp. 628–636. [Google Scholar] [CrossRef]
- Chapman, K.R. Lychae. In Tropical Tree Fruits for Australia; Page, P.E., Ed.; Queensland Department of Primary Industries: Brisbane, 1984; pp. 179–191. [Google Scholar]
- Qin, Y.Q.; Wang, D.; Fu, J.X.; Zhang, Z.K.; Qin, Y.H.; Hu, G.B.; Zhao, J.T. Agrobacterium rhizogenes-mediated hairy root transformation as an efficient system for gene function analysis in Litchi chinensis. Plant Methods. 2021, 17, 103. [Google Scholar] [CrossRef]
- Qin, Y.Q.; Zhang, B.; Wang, S.Q.; Guo, W.Y.; Zhang, Z.K.; Qin, Y.H.; Zhao, J.T.; Hu, G.B. Establishment of somatic embryogenesis regeneration system and transcriptome analysis of early somatic embryogenesis in Litchi chinensis. Hort. Plant J. 2023. [Google Scholar] [CrossRef]
- Qin, Y.Q.; Zhang, B.; Luo, X.L.; Wang, S.Q.; Fu, J.X.; Zhang, Z.K.; Qin, Y.H.; Zhao, J.T.; Hu, G.B. Development of an Agrobacterium tumefaciens-mediate transformation system for somatic embryos and transcriptome analysis of LcMYB1’s inhibitory effect on somatic embryogenesis in Litchi chinensis. J. Integr. Agric. 2024. [Google Scholar] [CrossRef]
- Wang, S.J.; Wang, G.; Li, H.L.; Li, F.; Wang, J.B. Agrobacterium tumefaciens-mediated transformation of embryogenic callus and CRISPR/Cas9-mediated genome editing in 'Feizixiao' litchi. Hort. Plant J. 2023, 9, 947–957. [Google Scholar] [CrossRef]
- Wang, G.; Li, H.L.; Wang, S.J.; Sun, J.H.; Zhang, X.C.; Wang, J.B. In vitro regeneration of litchi (Litchi chinensis Sonn.). Afr. J. Biotechnol. 2016, 15, 1026–1034. [Google Scholar] [CrossRef]
- Das, D.K.; Rahman, A.; Kumari, D.; Kumari, N. Synthetic seed preparation, germination and plantlet regeneration of Litchi (Litchi chinensis Sonn.). Am. J. Plant Sci. 2016, 7, 1395–1406. [Google Scholar] [CrossRef]
- Huang, M.Q.; Guo, W.Y.; Wu, X.Y.; Qin, Y.Q.; Sabir, I.A.; Zhang, Z.K.; Qin, Y.H.; Hu, G.B.; Zhao, J.T. Somatic embryogenesis and plant regeneration of Litchi chinensis Sonn. cv. 'Zili' from immature zygotic embryos. Plant Cell Tissue Organ. Cult. 2024, 156, 39. [Google Scholar] [CrossRef]
- Yu, C.H.; Chen, Z.G.; Lu, L.X.; Lin, J.W. Somatic embryogenesis and plant regeneration from litchi protoplasts isolated from embryogenic suspensions. Plant Cell Tissue Organ. Cult. 2000, 61, 51–58. [Google Scholar] [CrossRef]
- Raharjo, S.H.T.; Litz, R.E. Somatic embryogenesis and plant regeneration of litchi (Litchi chinensis Sonn.) from leaves of mature phase trees. Plant Cell Tissue Organ. Cult. 2007, 89, 113–119. [Google Scholar] [CrossRef]
- Deng, C.J.; Yi, G.J.; Zeng, J.W.; Zhang, Q.M.; Liu, W.G. Application of orthogonal experiment on induction of somatic embryogenesis in Litchi. Fujian Fruit. 2007, 141, 9–11. [Google Scholar] [CrossRef]
- Wang, G.; Li, H.L.; Wang, S.J.; Li, F.; Wang, J.B. Effects of different plant growth regulators on somatic embryogenesis of Litchi 'Xinqiumili' and the histological observation of the somatic embryos. Chinese J. Trop. Agricul. 2020, 40, 46–53. [Google Scholar]
- Ma, X.Y.; Yi, G.J.; Huang, X.L. Leaf callus induction and suspension culture establishment in litchi (Litchi chinensis Sonn.) cv. Huaizhi. Acta Physiol. Plant. 2009, 31, 401–405. [Google Scholar] [CrossRef]
- Li, S.; Feng, J.; Xiang, X. Induction of embryogenic callus and subculture proliferation of Litchi chinensis leaves. Guangdong Agricultural Sciences 2021, 48, 41–49. [Google Scholar] [CrossRef]
- Wang, G.; Liu, Y.T.; Gao, Z.Y.; Li, H.L.; Wang, J.B. Effects of amino acids on callus proliferation and somatic embryogenesis in Litchi chinensis cv. ‘Feizixiao’. Horticulturae. 2023, 9, 1311. [Google Scholar] [CrossRef]
- Giridhar, P.; Ramu, G.D.V.; Ravishankar, G.A. Phenyl acetic acidinduced in vitro shoot multiplication of Vanilla planifolia. Trop Sci. 2003, 43, 92–95. [Google Scholar] [CrossRef]
- Giridhar, P.; Vijayaramu, D.; Obulreddy, B.; Rajasekaran, T.; Ravashankar, G.A. Influence phenylacetic acid on clonal propagation of Decalepis hamiltonii Wight and Arn: An endangered shrub. In Vitro Cell Dev. Biol-Plant. 2003, 39, 463. [Google Scholar] [CrossRef]
- Ghanti, S.K.; Sujata, K.G.; Rao, M.S. The effect of phenylacetic acid on bud induction, elongation and rooting of chickpea. Biol. Plant. 2009, 53, 779–783. [Google Scholar] [CrossRef]
- Qiao, G.R.; Li, H.Y.; Liu, M.Y.; Jiang, J.; Yin, Y.F.; Zhang, L.; Zhuo, R.Y. Callus induction and plant regeneration from anthers of Dendrocalamus latiflorus Munro. In Vitro Cell Dev. Biol-Plant. 2013, 49, 375–382. [Google Scholar] [CrossRef]
- Sugawara, S.; Mashiguchi, K.; Tanaka, K.; Hishiyam, H. Distinct characteristics of indole-3-acetic acid and phenylacetic acid, two common auxins in plants. Plant Cell Physiol. 2015, 56, 1641–1654. [Google Scholar] [CrossRef]
- Sumayo, M.S.; Son, J.S.; Ghim, S.Y. Exogenous application of phenylacetic acid promotes root hair growth and induces the systemic resistance of tobacco against bacterial soft-rot pathogen Pectobacterium carotovorum subsp. Carotovorum. Funct. Plant Biol. 2018, 45, 1119–1127. [Google Scholar] [CrossRef]
- Murashige, T.; Skoog, F. A revised medium for rapid growth and bioassays with tobacco tissue cultures. Physiol. Plant. 1962, 15, 473–497. [Google Scholar] [CrossRef]
- Tang, Q.Y. Data processing system-experimental design, statistical analysis and data mining (second edition). 2010. Available online: www.sciencep.com.
- Das, D.K.; Rahman, A. Expression of a bacterial chitinase (ChinB) gene enhances antifungal potential in transgenic Litchi Chinensis Sonn. (Bedana). Curr. Trends Biotechnol. Pharm. 2010, 4, 820–833. [Google Scholar] [CrossRef]
- Fu, L.F.; Tang, D.Y. Induction pollen plants of litchi tree (Litchi chinensis Sonn.). Acta Genet. Sin. 1983, 10, 369–374. [Google Scholar] [CrossRef]
- Slimmon, T.; Qureshi, J.A.; Saxena, P.K. Phenylacetic acid induced somatic embryogenesis in cultured hypocotyl explants of Geranium (Pelargonium × hortorum Bailey). Plant Cell Rep. 1991, 10, 587–589. [Google Scholar] [CrossRef]
- Johnson, C.F.; Morris, D.A. Regulation of auxin transport in the pea (Pisum sativum L.) by phenylacetic acid: Effects on the components of transmembrane transport of indol-3yl-acetic acid. Planta 1987, 172, 400–407. [Google Scholar] [CrossRef]
- Bregitzer, P.; Campbell, R.D.; Wu, Y. Plant regeneration from barley callus: Effects of 2,4-dichlorophenoxyacetic acid and phenylacetic acid. Plant Cell Tissue Organ. Cult 1995, 3, 229–235. [Google Scholar]
- Cook, S.D. An historical review of phenylacetic acid. Plant Cell Physiol. 2019, 60, 243–254. [Google Scholar] [CrossRef] [PubMed]
- Iwase, A.; Takebayashi, A.; Aoi, Y.; Favero, D.S.; Watanabe, S.; Seo, M.; Kasahara, H.; Sugimoto, K. 4-Phenylbutyric acid promotes plant regeneration as an auxin by being converted to phenylacetic acid via an IBR3-independent pathway. J. Plant Biotechnol. 2022, 39, 51–58. [Google Scholar] [CrossRef] [PubMed]
- Puchooa, D. In vitro regeneration of litchi (Litchi chinensis Sonn. ). Afr. J. Biotechnol. 2004, 3, 576–584. [Google Scholar] [CrossRef]
- Tanida, K.; Shiota, H. Anise-cultured cells abolish 2,4-dichlorophenoxyacetic acid in culture medium. Plant Biotechnol. 2019, 36, 209–212. [Google Scholar] [CrossRef]
- Narayani, M.; Varsha, M.K.N.S.; Potunuru, U.R.; Beaula, W.S.; Rayala, S.K.; Dixit, M.; Chadha, A.; Srivastava, S. Production of bioactive cyclotides in somatic embryos of Viola odorata. Phytochemistry 2018, 156, 135–141. [Google Scholar] [CrossRef]
- Mikuła, A.; Tomaszewicz, W.; Dziurka, M.; Kaźmierczak, A.; Grzyb, M.; Sobczak, M.; Zdańkowski, P.; Rybczyński, J. The origin of the Cyathea delgadii Sternb. somatic embryos is determined by the developmental state of donor tissue and mutual balance of selected metabolites. Cells 2021, 10, 1388. [Google Scholar] [CrossRef] [PubMed]
- Gao, Y.R.; Fan, F.F.; Xu, Y.W.; Peng, Z.; Yu, C.X.; Liu, Z.Y.; Wang, Y.; Li, R.Z.; Duan, L.S. Effects of plant growth regulators on somatic embryo regeneration of Liriope spicata. J. Plant Growth Regul. 2024, 43. [Google Scholar] [CrossRef]
- Al-Mayahi, A.M.W. The Efect of Phenyl Acetic Acid (PAA) on Micropropagation of Date Palm Followed by Genetic Stability Assessment. J. Plant Growth Regul. 2022, 41, 3127–3137. [Google Scholar] [CrossRef]
- Rashmi, R.; Trivedi, M. Effect of various growth hormone concentration and combination on callus induction, nature of callus and callogenic response of Nerium odorum. Appl. Biochem. Biotech. 2014, 172, 2562–2570. [Google Scholar] [CrossRef]
- Dhaka, N.; Kothari, S.L. Phenylacetic acid improves bud elongation and in vitro plant regeneration efficiency in Helianthus annuus L. Plant Cell Rep. 2002, 21, 29–34. [Google Scholar] [CrossRef]
Figure 1.
Phenotypic responses of litchi callus to different plant growth regulator treatments. CK, control (1 mg·L−1 2,4-D). P1–P6, PAA treatments: 1 (P1), 5 (P2), 10 (P3), 20 (P4), 40 (P5), and 80 (P6) mg·L−1. C1–C6, CPA treatments: 1 (C1), 5 (C2), 10 (C3), 20 (C4), 40 (C5), and 80 (C6) mg·L−1. I1–I6, IPA treatments: 1 (I1), 5 (I2), 10 (I3), 20 (I4), 40 (I5), and 80 (I6) mg·L−1. Key morphological features are as follows: red arrow, embryonic callus; black arrow, proembryo; green arrow, granular and hard calli. Scale bar = 1000 μm.
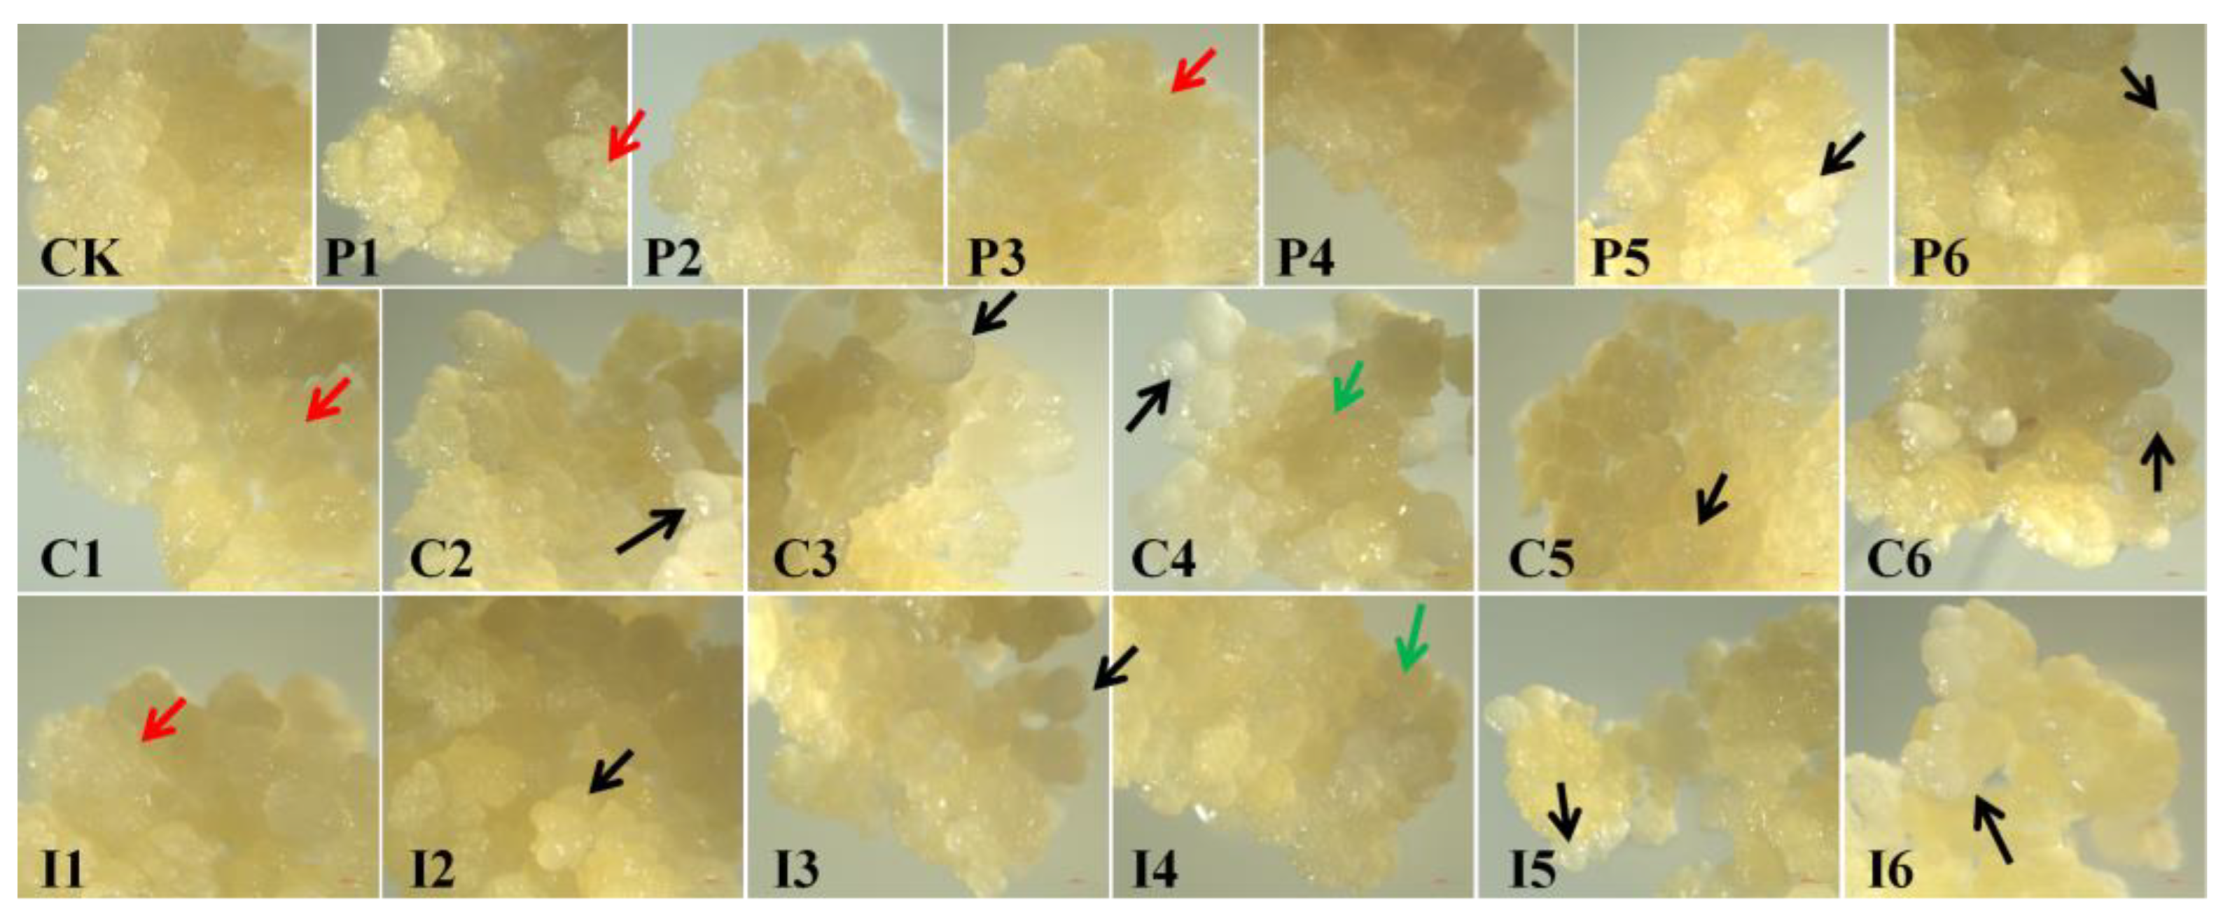
Figure 2.
Cellular morphology of litchi calli under various plant growth regulator treatments. CK, control (1 mg·L−1 2,4-D). P1–P6, PAA at 1 (P1), 5 (P2), 10 (P3), 20 (P4), 40 (P5), and 80 (P6) mg·L−1. C1–C6, CPA at 1 (C1), 5 (C2), 10 (C3), 20 (C4), 40 (C5), and 80 (C6) mg·L−1. I1–I6, IPA at 1 (I1), 5 (I2), 10 (I3), 20 (I4), 40 (I5), and 80 (I6) mg·L−1. Arrows indicate the following: red, embryonic cells; pink, embryonic cell clusters; green, small cell clusters; blue, large cell clusters; purple, small round single cells; yellow, cytoplasmic clumping; white, apoptotic cells. Scale bar = 100 μm.
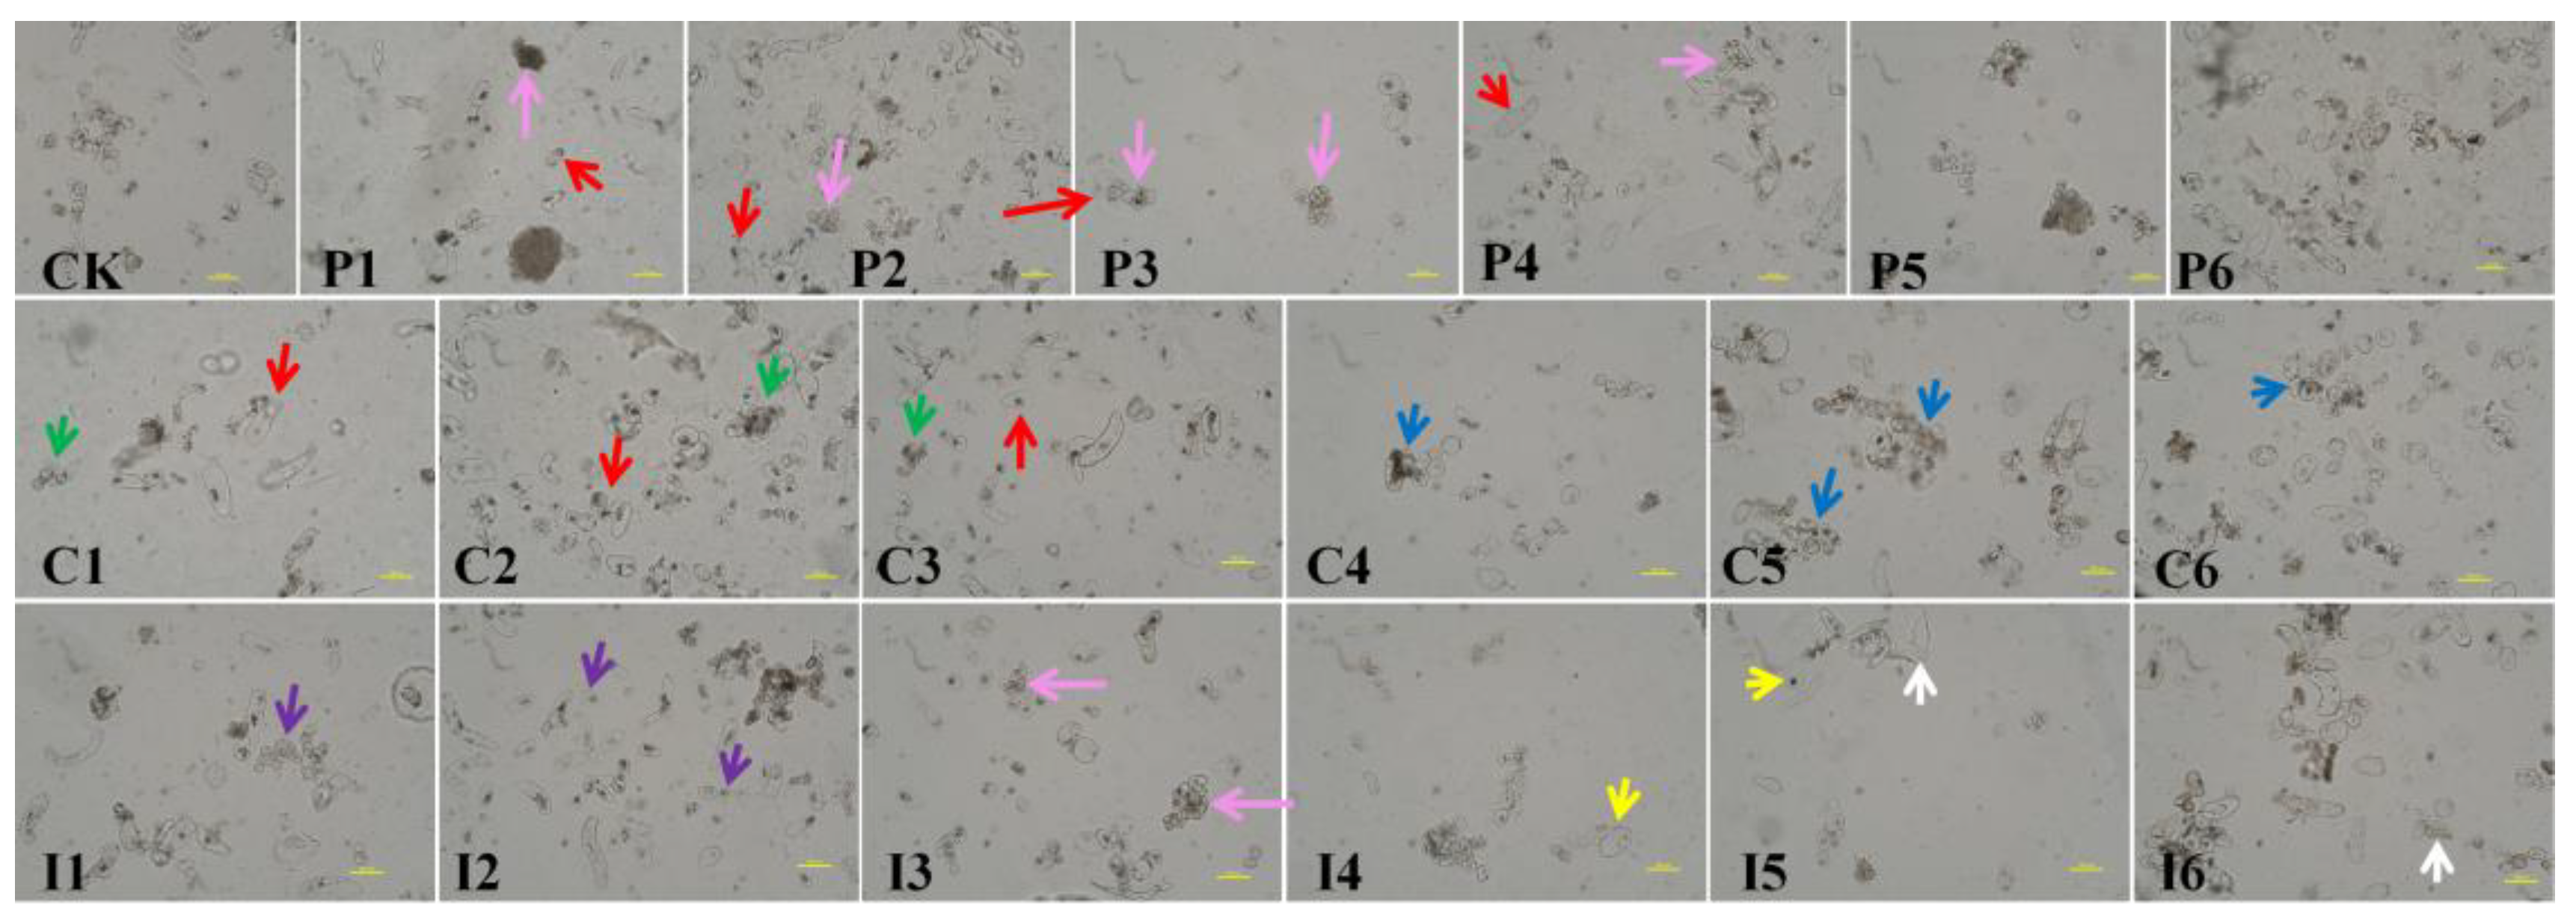
Figure 3.
Somatic embryogenesis of litchi under different plant growth regulator treatments. CK, control (1 mg·L−1 2,4-D). P1–P6, PAA at 1 (P1), 5 (P2), 10 (P3), 20 (P4), 40 (P5), and 80 (P6) mg·L−1. C1–C6, CPA at 1 (C1), 5 (C2), 10 (C3), 20 (C4), 40 (C5), and 80 (C6) mg·L−1. I1–I2, IPA at 1 (I1), 5 (I2), 10 (I3), 20 (I4), 40 (I5), and 80 (I6) mg·L−1. Borders indicate the following: black, spherical embryos; blue, trumpet-like embryos; red, cotyledonary embryos; green, clustered embryos; white, cotyledon embryos. Scale bar = 90 mm.
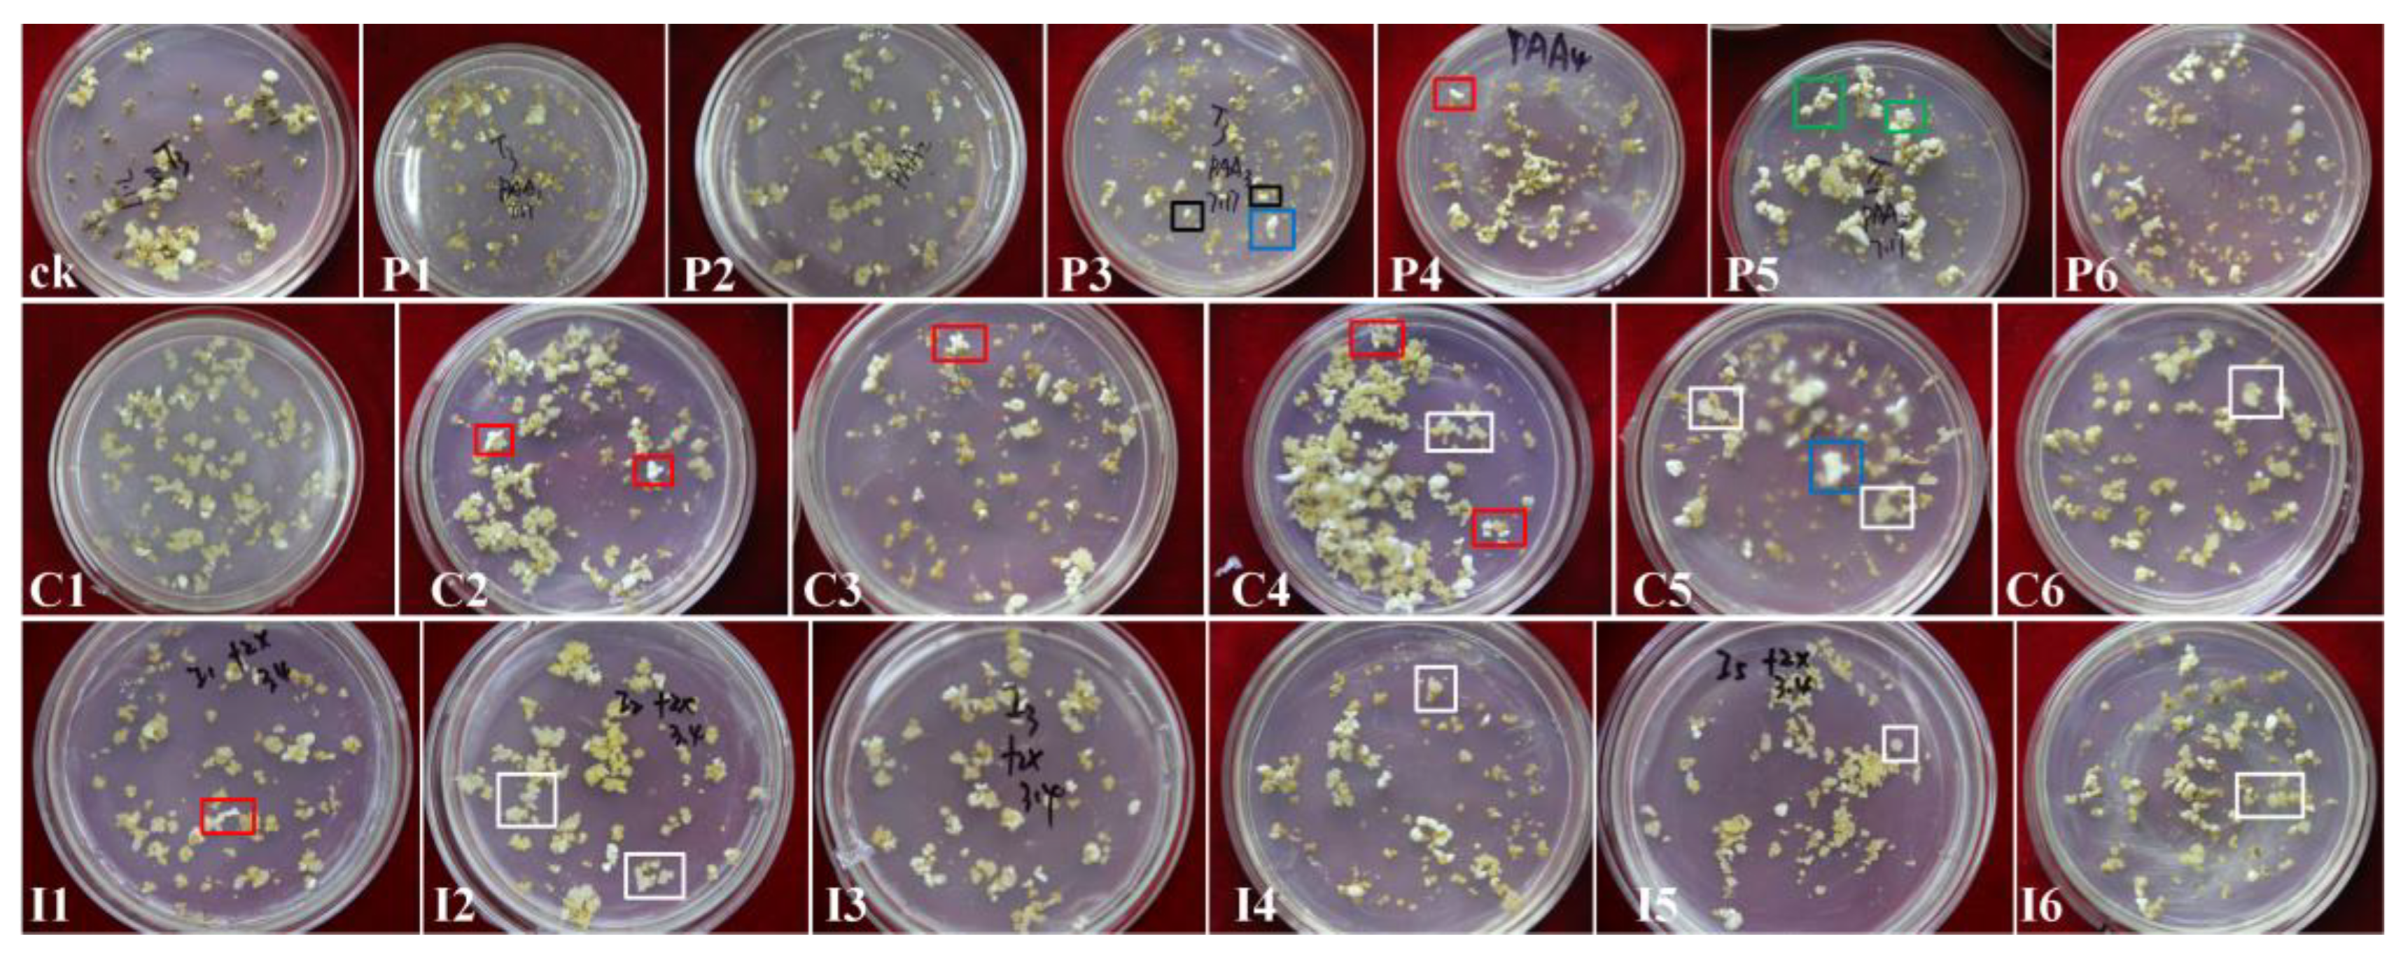
Figure 4.
Regeneration of litchi plantlets influenced by plant growth regulators. (A) Control (CK; 1 mg·L−1 2,4-D). (B–D) Plantlets regenerated from callus proliferation media supplemented with PAA (B), CPA (C), and IPA (D). (E–J) Plantlets from somatic embryogenesis media supplemented with PAA (E, F), CPA (G, H), and IPA (I, J). Borders indicate the following: red, red embryos; yellow, short dark-green stems; blue, light-green somatic embryos; white, new calli; purple, dark-green swollen embryos; black, secondary milky embryos. Arrows indicate the following: white, new calli; pink, thick stems; yellow, elongated stems; blue, long roots; purple, thin weak plants.
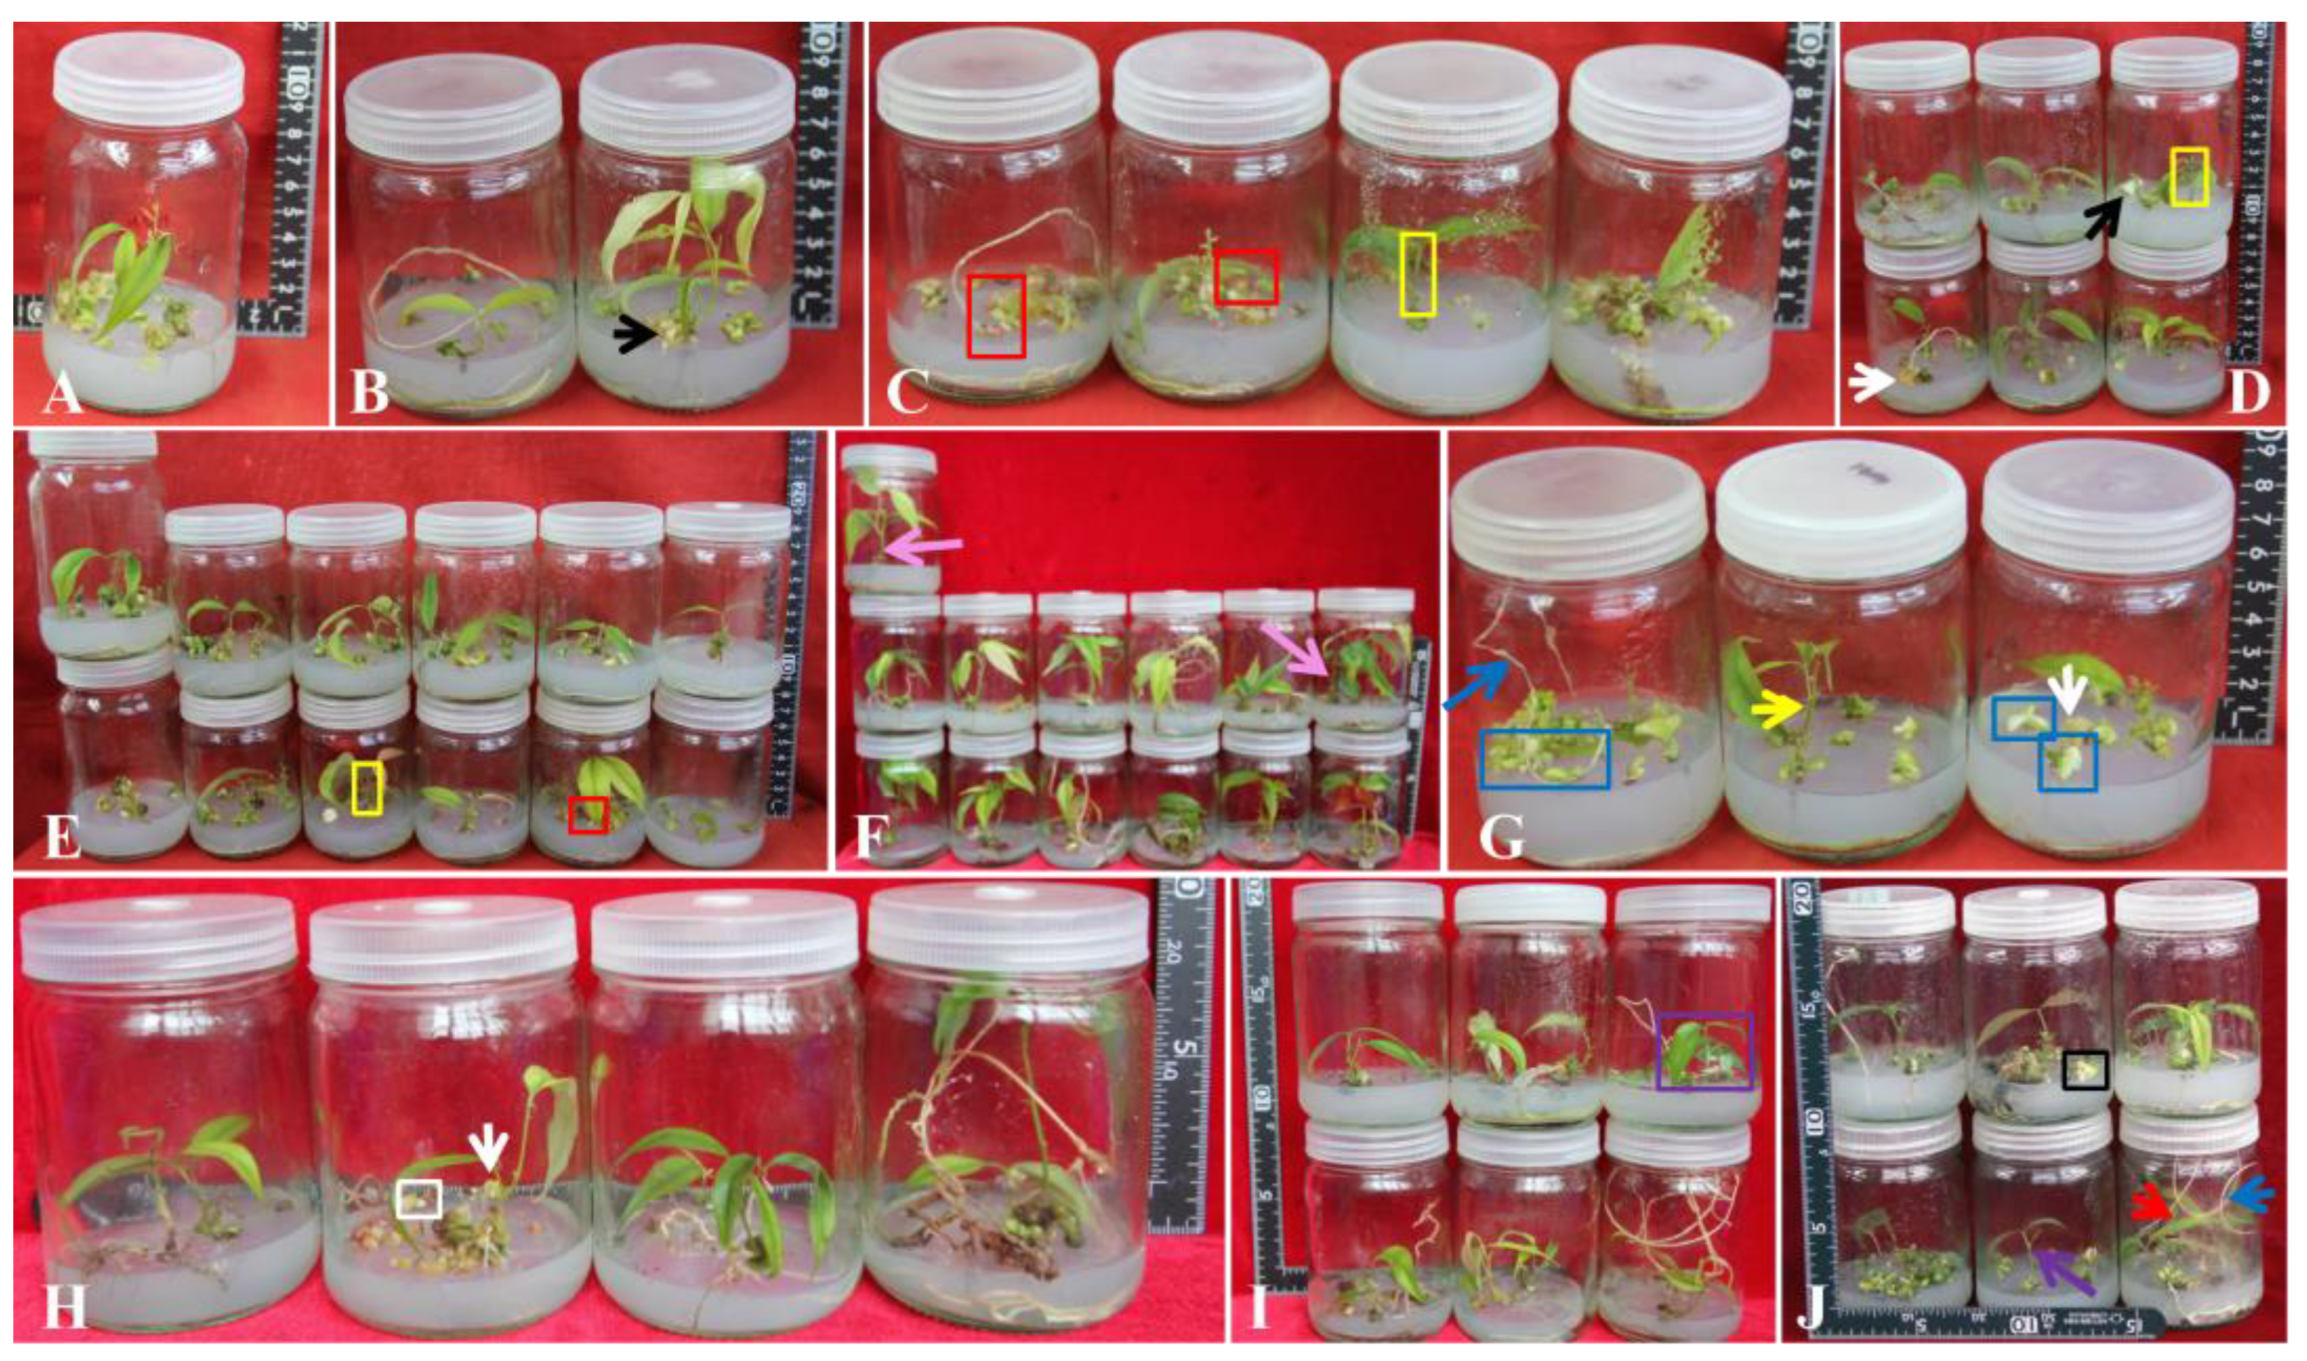
Figure 5.
Morphological diversity of mature somatic litchi embryos. (A) Dicotyledonous. (B) Multicotyledonous. (C) Globular. (D) Cup-shaped. (E) Globular mass. (F) Agglomerate. Scale bar = 2500 μm.
Figure 5.
Morphological diversity of mature somatic litchi embryos. (A) Dicotyledonous. (B) Multicotyledonous. (C) Globular. (D) Cup-shaped. (E) Globular mass. (F) Agglomerate. Scale bar = 2500 μm.
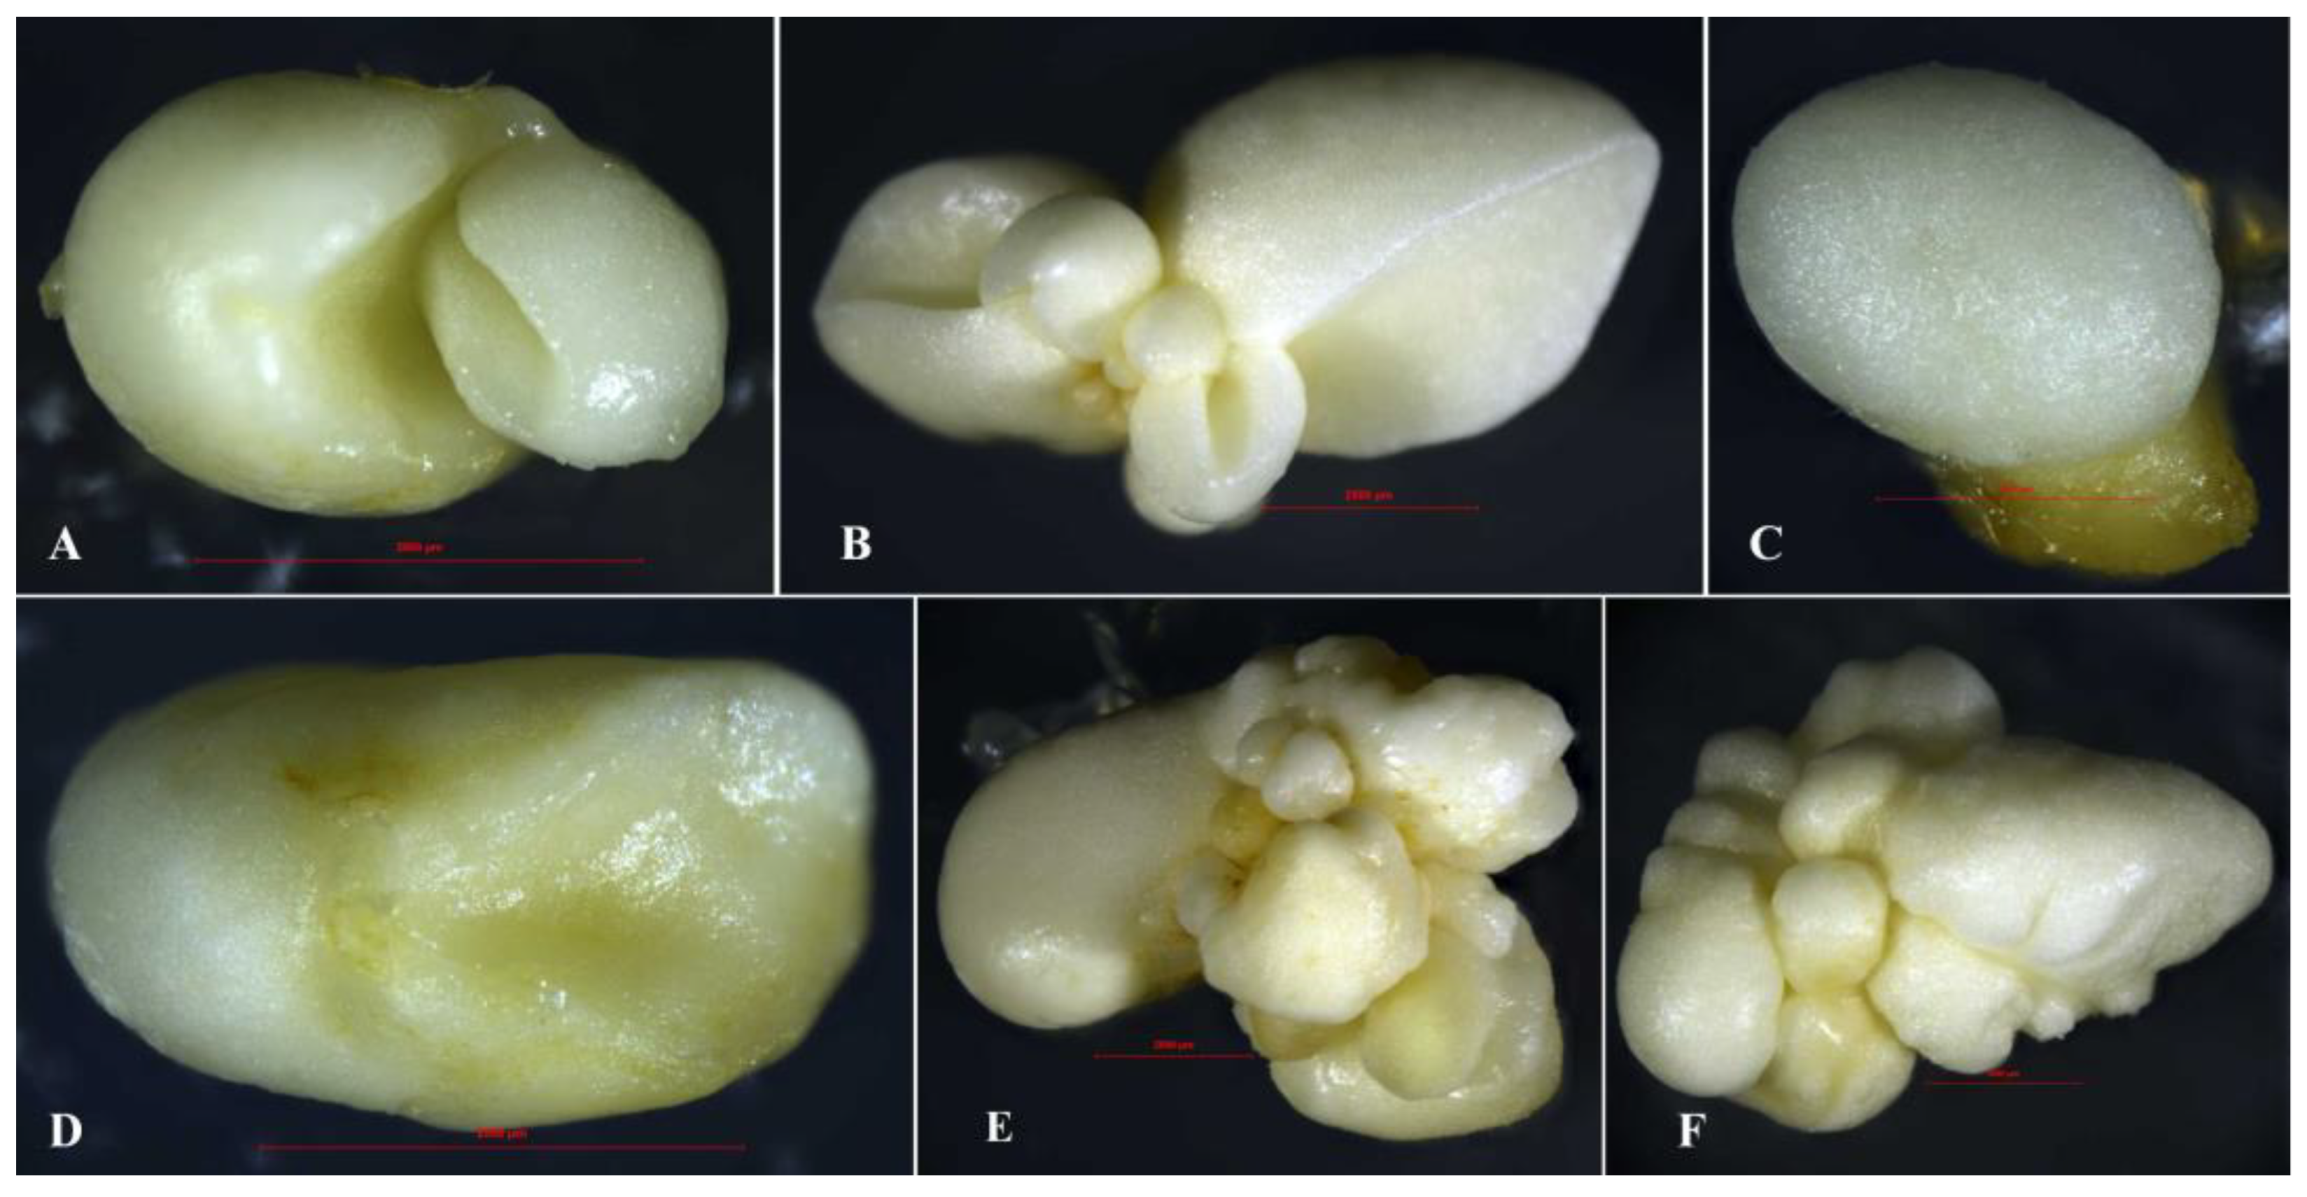

Table 1.
Effects of phenylacetic acid (PAA), 4-chlorophenylacetic acid (CPA), and 4-iodophenylacetic acid (IPA) on litchi callus proliferation, somatic embryogenesis, and plant regeneration.
Table 1.
Effects of phenylacetic acid (PAA), 4-chlorophenylacetic acid (CPA), and 4-iodophenylacetic acid (IPA) on litchi callus proliferation, somatic embryogenesis, and plant regeneration.
| Treatment | PGR concentration (mg·L−1) |
Callus proliferation (fold) |
No. somatic embryos (gFW−1) |
No. regenerated plantlets (gFW−1) |
|||
|---|---|---|---|---|---|---|---|
| 2,4-D | PAA | CPA | IPA | ||||
| CK | 1 | 8.12 ± 0.19 f | 232 ± 9.61 f | 13 ± 4.50 b | |||
| P1 | 1 | 8.21 ± 0.18 f | 144 ± 11.93 i | 4 ± 0.39 ef | |||
| P2 | 5 | 8.09 ± 0.25 f | 225 ± 8.083 f | 2 ± 0.07 ef | |||
| P3 | 10 | 6.99 ± 0.18 f | 285 ± 5.86 de | 3 ± 0.73 ef | |||
| P4 | 20 | 6.18 ± 0.17 h | 366 ± 11.06 c | 3 ± 0.10 ef | |||
| P5 | 40 | 4.61 ± 0.18 j | 1131 ± 8.89 a | 11 ± 0.53 bc | |||
| P6 | 80 | 3.43 ± 0.22 k | 1028 ± 20.53 b | 13 ± 1.03 bc | |||
| C1 | 1 | 11.23 ± 0.00 c | 164 ± 1.00 h | 0 f | |||
| C2 | 5 | 10.94 ± 1.27 cd | 273 ± 6.08 e | 9 ± 0.20 cd | |||
| C3 | 10 | 12.24 ± 0.93 b | 131 ± 6.08 i | 6 ± 2.64 de | |||
| C4 | 20 | 13.25 ± 0.41 a | 289 ± 6.56 d | 0 f | |||
| C5 | 40 | 10.31 ± 0.12 d | 193 ± 1.73 g | 0 f | |||
| C6 | 80 | 3.94 ± 0.31 jk | 73 ± 4.58 k | 0 f | |||
| I1 | 1 | 9.38 ± 0.49 e | 238 ± 3.61 f | 6 ± 1.89 de | |||
| I2 | 5 | 9.46 ± 0.92 e | 293 ± 6.08 d | 46 ± 7.05 a | |||
| I3 | 10 | 6.45 ± 0.44 gh | 271 ± 6.25 e | 50 ± 5.11 a | |||
| I4 | 20 | 5.39 ± 0.67 i | 194 ± 8.72 g | 14 ± 0.88 b | |||
| I5 | 40 | 3.93 ± 0.59 jk | 106 ± 3.61 j | 5 ± 1.29 de | |||
| I6 | 80 | 1.90 ± 0.45 l | 70 ± 7.37 k | 0 f | |||
1 Data are presented as mean ± SD (n = 3). Different lowercase letters indicate significant differences among treatments based on Duncan’s multiple range test (p < 0.05). The control (CK) contained 1 mg·L−1 2,4-dichlorophenoxyacetic acid (2,4-D).
Table 2.
Effects of PAA, CPA, and IPA on somatic embryogenesis in litchi.
| PGR | PGR concentration (mg·L−1) |
No. somatic embryos (gFW−1) |
No. regeneration plantlets (gFW−1) |
|||||
|---|---|---|---|---|---|---|---|---|
| NAA | KT | TDZ | PAA | CPA | IPA | |||
| CK (T3) | 0.1 | 5 | - | - | - | - | 227 ± 6.08 gh | 13 ± 2.37 e |
| PAA-KT1 | - | 5 | - | 1 | - | - | 320 ± 5.00 c | 53 ± 3.61 b |
| PAA-KT2 | - | 5 | - | 5 | - | - | 460 ± 4.00 a | 86 ± 3.61 a |
| PAA-KT3 | - | 5 | - | 10 | - | - | 215 ± 2.00 i | 29 ± 4.62 c |
| PAA-KT4 | - | 5 | - | 20 | - | - | 0 n | 0 g |
| PAA-TDZ1 | - | - | 0.5 | 1 | - | - | 0 n | 0 g |
| PAA-TDZ2 | - | - | 0.5 | 5 | - | - | 83 ± 1.00 m | 9 ± 1.53 ef |
| PAA-TDZ3 | - | - | 0.5 | 10 | - | - | 140 ± 2.00 l | 28 ± 3.46 c |
| PAA-TDZ4 | - | - | 0.5 | 20 | - | - | 340 ± 2.00 b | 85 ± 5.03 a |
| CPA-KT1 | - | 5 | - | - | - | 1 | 346 ± 15.62 b | 49 ± 7.12 b |
| CPA-KT2 | - | 5 | - | - | - | 5 | 307 ± 8.19 d | 19 ± 1.28 d |
| CPA-KT3 | - | 5 | - | - | - | 10 | 203 ± 11.27 j | 3 ± 4.99 fg |
| CPA-KT4 | - | 5 | - | - | - | 20 | 136 ± 9.54 l | 2 ± 2.71 g |
| CPA-TDZ1 | - | - | 0.5 | - | - | 1 | 227 ± 7.00 gh | 2 ± 3.34 g |
| CPA-TDZ2 | - | - | 0.5 | - | - | 5 | 215 ± 6.24 i | 2 ± 3.06 g |
| CPA-TDZ3 | - | - | 0.5 | - | - | 10 | 166 ± 5.29 k | 0 g |
| CPA-TDZ4 | - | - | 0.5 | - | - | 20 | 134 ±5.57 l | 0 g |
| IPA-KT1 | - | 5 | - | - | 1 | - | 291 ± 4.58 e | 31 ± 4.06 c |
| IPA-KT2 | - | 5 | - | - | 5 | - | 264 ± 7.00 f | 11 ± 3.80 e |
| IPA-KT3 | - | 5 | - | - | 10 | - | 217 ± 2.65 hi | 5 ± 4.17 fg |
| IPA-KT4 | - | 5 | - | - | 20 | - | 194 ± 7.00 j | 2 ± 3.33 g |
| IPA-TDZ1 | - | - | 0.5 | - | 1 | - | 231 ± 5.29 g | 3 ± 5.24 fg |
| IPA-TDZ2 | - | - | 0.5 | - | 5 | - | 195 ± 5.57 j | 2 ± 3.40 g |
| IPA-TDZ3 | - | - | 0.5 | - | 10 | - | 162 ± 5.29 k | 1 ± 2.43 g |
| IPA-TDZ4 | - | - | 0.5 | - | 20 | - | 138 ± 3.61 l | 1 ± 2.06 g |
* Data are presented as mean ± SD (n = 3). Different lowercase letters indicate significant differences among treatments (Duncan’s test, p < 0.05). Abbreviations: 2,4-D, 2,4-dichlorophenoxyacetic acid; NAA, 1-naphthylacetic acid; KT, kinetin; TDZ, thidiazuron.
Disclaimer/Publisher’s Note: The statements, opinions and data contained in all publications are solely those of the individual author(s) and contributor(s) and not of MDPI and/or the editor(s). MDPI and/or the editor(s) disclaim responsibility for any injury to people or property resulting from any ideas, methods, instructions or products referred to in the content. |
© 2025 by the authors. Licensee MDPI, Basel, Switzerland. This article is an open access article distributed under the terms and conditions of the Creative Commons Attribution (CC BY) license (http://creativecommons.org/licenses/by/4.0/).
Copyright: This open access article is published under a Creative Commons CC BY 4.0 license, which permit the free download, distribution, and reuse, provided that the author and preprint are cited in any reuse.


