
Submitted:
02 September 2025
Posted:
03 September 2025
You are already at the latest version
Abstract
The European Union emphasizes sustainable development on farm level as a basis for future agriculture. This requires a simultaneous focus on economic, social and environmental issues and thus presents a major interdisciplinary challenge to the research community. The case study presented in this paper explores a possible approach linking activities to selected UN-Sustainable Development Goals (SDGs), focusing on indicators and thresholds for corresponding ecosystem services. The case study shows that methods are available to measure and judge production of healthy food, water quality, greenhouse-gas emissions, biodiversity and soil health, also considering the realization of an adequate income for the farmer. When indicators satisfy their corresponding thresholds, a farm being studied as a Living Lab becomes a Lighthouse that can inspire other farmers working on similar soils. When certain ecosystem services don’t meet their threshold, research can be focused on such services. Framing the work in a SDG context provides an important link to society at large and to the policy arena and can present a quantitative basis for subsidy payments based on provided ecosystem services. Currently, 85% of Dutch farmers apply field testing of soil fertility and this service can be expanded by testing ecosystem services in line with selected SDGs, as explored in the case study. Once all ecosystem services are satisfied, the farmer is free to follow their own unique management practices—an approach that not only respects individual expertise but also stimulates entrepreneurship, as each farmer can pursue the goals in a way that best aligns with his own vision, context, and creativity But such a sustainability-focused program can only be successful when embraced by farmers and methods and procedures should therefore be as simple and transparent as possible while costs should be in line with expected advantages to be obtained.
Keywords:
environmental thresholds
; land use
; living lab
; sustainable development goals (SDGs)
; outcome-based policy
; soil health
Introduction
Two recent high-level reports published by the European Union [1,2], define future scenarios for European agriculture. The strategic dialogue [1] was written by leading members of various agricultural stakeholder organizations (11), -NGO’s (8), -industry (9) and two scientists. The dialogue thus expresses a strong stakeholder and industry perspective covering the entire production chain: “from Farm to Fork”!. When addressing knowledge in the dialogue, emphasis is on better access and sharing, not necessarily on generating new knowledge, thus presenting an intriguing signal for the scientific community. The research community is challenged in a positive manner when the dialogue emphasizes: “the need for sustainable farm management and harmonization of methodologies for on-farm sustainability assessment” with: “common metrics and indicators” aiming at the objective: “to determine where each farm stands”. Also: “provide quantifiable ecosystem services using robust indicators”.
The European Commission presented a follow-up vision for the future of agriculture and food [2] also embracing :“on-farm sustainability assessment”, in the context of: “an agro-food system that is economically, socially and environmentally sustainable”. This involves:’ contributions to climate mitigation, providing clean water and air, soil health and biodiversity preservation”.
Though focused on 27 EU countries, these two documents can have worldwide implications. Considering the focus on sustainable development in both documents it would be pragmatic to frame future activities in terms of the UN Sustainable Development Goals (SDGs) approved by 193 governments in 2015 thus providing a legal foundation for efforts to be made. It also provides a pro-active signal to society at large that agriculture contributes to sustainable development [3,4,5,6,7]. Emphasis on SDG’s to be characterized by ecosystem services rather than by meeting various requirements for management as in current regulations [8] provides a clear: “Point-at-the-horizon” with general societal significance. Ecosystem services, defined as; “contributions by ecosystems to mankind” [9], are characterized by indicators and thresholds. Such SDG indicators correspond with Key Performance Indicators (KPI’s) that are widely used in the business world [10].
Emphasis on studies at farm level by the European Union is not new. They have promoted research in Living Labs [11], defined as: “spaces for co-innovation, through participatory, transdisciplinary systemic research”. “Living Labs” reflect the need for researchers to work closely with stakeholders that contribute their tacit knowledge, thereby jointly developing practical solutions to overcome barriers to sustainable development. This bottom-up procedure is in contrast with current top down rules and regulations. When successful, “Living Labs” become “lighthouses”, defined as “single sites, like a farm or a park, where to showcase good practices. These are places for demonstration and peer-to-peer learning.” Every farm is a living lab and every farm is different even in the same region and on similar soils, as each individual farmer cherishes his own particular practices of adaptive management. This represents his basic strength and identity. When this is not recognized and mobilized, sustainable development in agriculture may remain a distant dream.
Numerous scientific methods have been developed to separately measure the status and quality of soil, water, air and nature, as addressed by corresponding SDGs. But when assessing sustainability applied at farm level, as suggested by [1,2], such a set of different methods will have to be combined into a comprehensive package that is both operational and cost effective. To be feasible in practice, the system has to be relatively simple and straightforward and not too expensive. Some existing studies use modeling and focus on regions or entire countries [12,13,14]. These approaches provide valuable insights, but the next step is to downscale them to the farm level—treating farms as Living Labs—to enable practical application and direct contributions future EU agricultural objectives.
The objective of this article is therefore to: (i) test field application on a farm, acting as a Living Lab, of an operational package of different methods to determine indicators for ecosystem services associated with relevant SDGs; (ii) define the role of soils when contributing to ecosystem services and: (iii) define topics that require additional research. A previous study [6] tested methodology on one field, while this study covers additional operational procedures applied to a complete farm also considering costs involved.
Materials and Methods
Ecosystem Services in Line with Relevant SDGs
A limited number of the seventeen SDGs is of primary interest for arable farming systems in the Netherlands. Seven of such goals are shown in Table 1 and Figure 1.
How about the remaining ten SDGs? Quality education (SDG4) is important and can be supported by providing clear examples of sustainable farming systems as proposed in this study. Gender equality (SDG5) and reduced inequalities (SDG 10) are less relevant for Dutch Conditions although promoting equality remains a critical pillar of sustainability and should be actively safeguarded to ensure fairness, inclusivity, and long-term resilience. Peace, Justice and Strong Institutions (SDG16) and partnerships for the Goals (SDG17) are important but beyond control of individual farmers. Industrial innovation (SDG9), sustainable cities (SDG11) and life below water (SDG14) have a different focus. Affordable and clean energy (SDG7) can be considered by the proportionality principle: agriculture uses only 7% of national energy and many farms have now sun collectors or windmills generating electricity. Conserving energy at national level will require prime attention for industry, building and traffic. Decent work and economic growth (SDG8), is indirectly reflected by SDGs 1, 2 and 3: a good income, based on producing sufficient healthy foods. Responsible consumption and production (SDG12) is represented by the focus on SDGs 2 and 3, while individual farmers can contribute to responsible consumption by producing healthy food (SDGs 2 and 3). Ecosystem services are defined as: “services the ecosystem provides to man” [9]. Provisioning ecosystem services relate to healthy food (SDG’s 1,2 and 3) and clean water (SDG6); regulating services relate to climate action (SDG13) and supporting services relate to biodiversity. Soil health can be considered to be an ecosystem service by itself (part of SDG 15). Of course, economic and social conditions have a major if not dominant impact on all dimensions of the six SDGs mentioned in Table 1. But a systematic analysis of ecosystem services as proposed by the recent reports of the European Union, and as explored in this paper, can provide a quantitative basis for economic and social analyses and for future actions.
The Farm Being Studied
The Rodenburg farm covers 30 ha and consists of four fields where a medium textured clay soil (23% clay) (MN35A in the Dutch soil classification) is dominant and a heavy clay soil (32% clay) (Mn45A) occurs as a small strip in the southern part of the farm occupying 15% of the entire land area. The Mn35A is classified as a fine, mixed, mesic Typic Fluvaquent in the US Soil Taxonomy system [15] and as a Eutric Fluvisol in the FAO World Soil Reference base [16]. The Mn45A has the same classifications but is very fine, mixed, mesic. Potatoes, sugar beets and winter-wheat are grown and cover crops, are part of the management scheme. Because income from farming operations is not adequate, the farmer has remodeled one of his sheds as a conference center which is successful. Side activities by farmers are also increasing elsewhere and can consist of a shop selling local produce or of locations for meetings, conferences, weddings etc.
Methods Measuring Indicators and Selecting Thresholds for Ecosystem Services
Farmer’s income (SDG1) can be compared with national statistics but judging this remains highly personal and we followed the opinion of the farmer running the Living Lab being studied. Production levels (SDG2) can also be compared with regional yield levels reported in literature. A theoretical approach can be followed by running simulation models for crop growth allowing a judgement as to actual yield levels where a threshold of 80% of the water-limited yield (Yw) can be applied [17].
Healthy products (SDG 3) result from plants grown on healthy soils free from pollutants such as heavy metals and biocides. The presence of soil pollutants, an important aspect of soil health assessment discussed later, was investigated using standard chemical methods to determine heavy metal concentrations, with defined threshold values [18]. Additionally, pesticide residues were measured using the Quick Polar Pesticides (QuPPe) method [19] (https://eurl-pesticides.eu). Beyond pollutant analysis, the nutritional value of crops can be assessed through crop analysis to ensure food nutritional quality meets health standards and supports overall well-being.
Water quality (SDG6) was measured by following requirements of the EU Water Guideline [20]. The chemical indicator for groundwater is the nitrate concentration with a threshold of 50 mg/L NO3−/L. For surface waters, N-total and P-total are considered, with thresholds of 4 mg/L and 0.3 mg/L, respectively. Biological indicators use the EQR score (Ecological Quality Ratio): water flora, macrofauna, and fish, all with thresholds of 0.50. But this Living Lab was not connected with surface water as it is separated by a dike from an adjacent lake, and surface water quality will therefore not be further discussed here. Emissions of greenhouse gasses CH4 and N2O (SDG13) were estimated for this particular region [21]. CO2 emissions for this living lab were estimated by the Soil Health Indicator in terms C-sequestration [22] and were compared with regional values as presented by [21] and [12]. Biodiversity, one element of SDG 15, must be considered in a regional context, and no clear indicators—let alone thresholds—are currently defined that apply to individual farms acting as Living Labs. In the context of the European Natura 2000 program, 162 protected nature areas have been designated in the Netherlands (www.nature2000.nl). For the Living Lab under study, the nearest Natura 2000 site is the Voornse Duin, located 9 km away. The primary responsibility of any agricultural Living Lab is to prevent the release of pollutants into air and water that could affect nearby nature areas. The extent of such emissions can therefore serve as an indicator of the farm’s contribution to the preservation of regional biodiversity. In addition, soil health including soil biodiversity at the farm level has been assessed (see also below).
Methods Measuring Indicators and Thresholds for Soil Health
The second element of SDG15 is soil health consisting of three types of indicators: physical aspects of soil health (e.g., electrical conductivity, soil structure, and soil moisture regime); (ii) chemical aspects of soil health (soil fertility, pollutants); (iii) biological aspects of soil health (soil biodiversity); and in a central position: (iv) carbon (carbon content and various carbon compounds) [6; 22] (Figure 2).
This set of indicators for soil health shown on the Soil Health Indicator (SHI) [22] deviates from the OSI’s (Open Soil Indexes) presented by [14] although the soil characteristics of the SHI can be used as part of the OSI. For both SHI as well as the OSI, aggregate stability remains a complex and time-consuming parameter to measure, and lacks a standardized, universally accepted definition. The second, “available water,” is a static concept based on the traditional 1930s framework of field capacity and wilting point. Although this provides a useful initial indication, we opted in this study for a dynamic modeling approach to assess soil moisture supply capacity, as it aligns more closely with current understanding of soil–plant–water interactions. Specifically, innovative quantitative land evaluation was applied using a hydropedological classification of 368 Dutch soil types [23], resulting in 79 units that show comparable hydraulic conductivity and moisture retention properties [24]. These units facilitate dynamic modeling of soil moisture regimes using the SWAP-WOFOST model [25]. Soil structure was described using visual observations and supported by standard measurements of bulk density and penetration resistance [26]. Bulk density measurements were omitted due to the high spatial heterogeneity of the soils studied (Figure 3), which would have introduced excessive variability using standard small-core sampling methods. Instead, penetration resistance was measured with a 1 cm² cone penetrometer, providing an estimate of root growth potential. Empirical thresholds were used to interpret these measurements: <1000 kPa was considered good, 1000–2000 kPa moderate, and >2000 kPa poor for root development.
Chemical aspects of soil health, include pH and macronutrients such as nitrogen (N), phosphorus (P), and potassium (K) [22]. These nutrients are already monitored by 85% of Dutch farmers through professional fertilization advice based on soil testing. In our study, also bio-available heavy metals were determined using standard procedures [18;22] and pesticide residues were analyzed using the QuPPe method [19]. These data were also considered when evaluating crop health, as discussed earlier. The OSI currently does not include heavy metals and pesticide residues in its assessments, despite growing public interest and concern regarding these substances.
The biological component of the OSI includes “disease resistance” and general “soil life activity,”. In our study, biological soil health was assessed through phospholipid fatty acid (PLFA) analysis, which provides detailed information on microbial community composition. Threshold values for interpretation were derived from established literature [27,28,29,30,31].
The OSI also includes management practices as part of the assessment framework. While recognizing the value of linking indicators to management, we maintain that soil health should first and foremost be assessed based on physical, chemical, and biological indicators. These assessments can then inform targeted management responses.
As noted in the discussion of SDG 13, soil respiration—calculated via mineralization rates—is another important measure of soil biological activity. Soil organic carbon and soil inorganic contents were both assessed for CO2 sequestration because they represent distinct, complementary carbon pools [22,32].
Results
Ecosystem Services
The farmer (SDG1) considered his income from agriculture to be acceptable considering the size of his farm but revenues of his side activities were important to allow this positive conclusion. Production levels (SDG2) were: sugar beet: 74-99 tons/ha; potatoes: 51-55 tons/ha and wheat: 9.8-11.0 tons/ha. They compare favorably with average yields in the area that were 75-88 tons/ha for sugar beet, 40-42 tons/ha for potatoes and 7.0- 9.0 tons/ha for wheat ( www.CBS.nl). The thresholds were met.
When considering health and well-being (SDG3) healthy crops can only grow on healthy, unpolluted soils. The bio-available (heavy) metal analyses covered Al, Ti, V, Ar, Cd, Cr, Pb, Sn [22]. All results were below detection limit, except for one field where Cd levels just reached the threshold and this was reported to the farmer who will pay particular attention to this field in future. The biocide analyses covered more than 400 biocides! . All values were below the threshold of 0.01 mg/kg soil, except for the herbicide diflufenican and the fungicide fluxapyroxad in one of the fields, where values reached their threshold. Even though the threshold was not exceeded, the farmer was advised to critically watch future applications. Overall, thresholds were met.
The groundwater quality (SDG6) was measured at six locations and had a range of 6- 15 mg Nitrates/L which is well below the threshold of 50 mg/L. Biocide levels were below detection level. Average values for Nitrate levels in this region of 13 mg/L were reported [12]. The nearest surface water is the large „Brielse Meer”, separated from the farm by a dike. The water quality of this lake is affected by many sources and possible contributions by this particular farm are bound to be minor. Emission of greenhouse gasses (SDG13) was estimated through C-sequestration [22] (Table 2). Calculated mineralisation rates and the associated release of greenhouse gasses was relatively low, which is common for clay soils with a relatively low content of organic matter [12,21]. The routine soil test also recommends required application rates of organic materials to maintain current conditions (which is equal to the mineralization rate) and includes an estimate as to what would be needed to comply to the French 4per1000 proposal, aimed at defining additional carbon input to increase the %C by 4 promille in all soils of the world, demonstrating that soil adsorption of greenhouse gases thus defined could potentially equal the yearly increase of worldwide production of greenhouse gasses .
Biodiversity (SDG15) has to be considered in a regional context when described as an ecosystem service. As shown by our analyses, this farming system does not discharge pollutants to the environment which, as such, is a contribution to regional biodiversity. Also, as mentioned above, the nearest NATURA 2000 area is 9 km away.
Soil Health
When considering physical aspects, measured EC values were far below threshold levels of concern as there is no marine influence Soil structure was described and showed large next to small clods in the upper 30 cm of the soil and large soil prisms below that depth (Figure 1). Penetration resistances were generally below 1000kPa in the upper 30 cm of the soils but higher in the subsoils where values of up to 3000kPa were reached in soil Mn35,while Mn45 showed lower values of 1000kPa to 1600kPa. A major reason for assessing soil structure is to define the rooting environment and observing rooting patterns was therefore emphasized in this study, showing that roots could reach the subsoil in all soils bypassing dense clods (Figure 3). In the subsoil these roots follow the vertical faces of soil prisms where also free water moves downwards following bypass flow of water moving downwards along the walls of the cracks. This allows more water uptake than obtained by lateral diffusion from the prisms. Water flow in structured soils requires different approaches than flow in homogeneous, isotropic soils that is the basis for physical flow theory [33,34]. Prisms are dense and penetration resistances are therefore relatively high but this does not reflect rooting along the faces of the prisms. The observation of rooting patterns was therefore important in this study to show that roots reached the subsoil allowing water uptake that could result in crop yields as reported.
This analysis demonstrates that field research remains essential to obtain meaningful data.
To characterize soil moisture regimes, simulations were made for various crops, of which only results for winter wheat are shown (Figure 4). The model calculates actual yields, taking into account actual soil moisture regimes, while assuming optimal fertilization and lack of pests and diseases.
Potential yields also assume optimal availability of water. Calculations were made for a 30-year period showing major variabilities among the years due to weather differences, demonstrating that the soil moisture supply to plants is very much a function of weather conditions. In some years calculated actual yields were identical to potential values, particularly in Mn45A. But in dryer years major differences occur between actual and potential yields due to inadequate moisture supply. How to express these results in terms of an indicator for soil health? The analogy of soil health with human health is helpful here. A „thirsty” person is not necessarily unhealthy, nor is a “thirsty” soil. The simulation data show that even the Mn35A soil can achieve potential yields when weather conditions permit. A crucial element is the depth of rooting as the model assumes rooting to a depth of 80 cm. Quite different results would be obtained with shallow rooting, for example when a compact plough pan would be present. Our field observations have shown that roots reach the subsoil even though some of the water and nutrients may be less available in the cloddy topsoil. Still, calculated yields are of the same order of magnitude than the measured ones and 80% of the calculated water-limited yields are well below real measured yield values, satisfying the yield threshold criteria [17]. Because of deep rooting the indicator for the soil moisture supply for the two soils considered here is positive. Finally, the difference between actual and potential calculated yields provides an indication for irrigation needs.
Chemical aspects have been considered by the standard analysis of plant nutrients aimed at providing a recommendation for fertilization and bio available heavy metals (Figure 5) [22]. Also the low contents of biocides, reported above for SDG3, apply here.
Results of soil biological analyses are reported in Figure 5. The values are average to moderately high, but none are excessively elevated, which is considered positive. This balance supports the idea that diversity is important, and that no single group should dominate or be underrepresented
Discussion
Linking the two recent publications of the European Union on the future of agriculture to the UN-SDGs allowed a definition of ecosystems services in line with a limited number of SDGs that are particularly relevant for Dutch agriculture and for West European conditions. Defining indicators and thresholds for these ecosystem services allowed a judgement as to the degree of sustainability of the farm being studied (the Living Lab). The sustainability mark is obtained when all indicators meet their threshold. This result was obtained for the farm being investigated. When indicators don’t meet their respective thresholds, attention can be focused on the ones that need improvement, developing alternative forms of management based on literature, Lighthouses on similar soils, or newly focused research. At this farm, the advisors of the extension service TTW have been promoting the monitoring of soil health even before it became a central focus of EU and national government policy. This procedure has a number of advantages: (1) clarity about goals, rules and regulations is offered to the farmer which (s)he is very eager to receive. (2) transparent links can be made with subsidy payments, including farm support by the European Union [2] and (3) research can be focused on ecosystem services that don’t yet meet their threshold and on obtaining representative thresholds when thresholds are poorly defined. Obtaining operational thresholds for ecosystem indicators is a logical follow-up on many studies relating soils to ecosystem services [35].
Environmental research has been successful in the past but efforts often had a disciplinary character that has, no doubt, greatly contributed to our understanding of ecosystem functioning. But now we also need an integrated approach, as presented in this study, where all ecosystem services have to be served at the same time. This paper shows that techniques, including modern, innovative ones, are available now and they can be applied to assess whether or not sustainable development is being reached by a given Living Lab. Soil science contributes a soil health assessment to the overall testing of ecosystem services in line with the EU definition of soil health: “the continued capacity of soils to contribute to ecosystem services”. [11]. Soil science is important but so is hydrology, climatology, ecology, economy and sociology.
Soil health is not only considered separately in SDG15 but also contributes to the other ecosystem services such as production of healthy foods (SDG2 and 3) and climate mitigation by carbon capture (SDG13). Nitrate pollution of groundwater is not only a function of fertilizer applications but is also strongly affected by soil processes as water moves downwards through the soil (SDG6). Biodiversity is also strongly affected by soil health (SDG15). Soils are the most permanent part of the ecosystem and its preservation needs to have a high priority, the more so since a decrease of soil health is often difficult to reverse. Emphasizing these functions with clear examples is the best way to promote the profession. Yes, there is: “A Golden moment for Soils” [36] but the proof of the pudding is in the eating.
But there is one more crucial aspect. The scheme will only work when farmers embrace it and this requires any system to be relatively simple and transparent and not too costly. Our study has addressed this requirement by limiting the number of SDGs to be considered and by defining single indicators for ecosystem services with regionally valid thresholds that are relatively easy to measure. Soil testing for fertilization purposes is widely applied in the Netherlands. Costs are 26€/ha and include fertility, carbon and biological sampling. Analyses of heavy metals and the pesticides would cost an additional 45€/ha each. Water quality sampling would be 25€ per location. Farmers have to decide whether these costs fit within their management plans.
As is, farmers are highly critical about the actions of government and of the administrative burdens of environmental regulations [37]. Such valid concerns can be addressed by the proposed system: once all indicators for ecosystem services are positive, the farmer will be free to follow his own management expertise for a limited period of, for example, five years without regulatory interference.
Conclusions
- The European Union focuses on sustainability when defining future agriculture. Linking future research to ecosystem services in line with the UN Sustainable Development Goals (SDGs) can therefore provide a pro-active and positive signal about agriculture to both society-at-large, the policy arena and the farming community.
- Our study shows that methods are available to measure and judge ecosystem services associated with SDGs that address production of healthy crops, water quality, emission of greenhouse gasses, biodiversity preservation and soil health. Determining relevant regional threshold values for each of these ecosystem services still requires additional research.
- Soil is the most permanent component of ecosystems and soil health is an important ecosystem service by itself as part of SDG15 but it also plays a key role when assessing the other ecosystem services. Showing this role with specific examples is the best way to promote soil science in future.
- Any future measuring system needs to be relatively simple, transparent and low cost to allow acceptance in practice both from an operational and regulatory point of view. Applying the proportionality principle, attention should only be focused on ecosystem services that are of prima interest for the region where the Living Lab is located. In our study, a choice was made for six crucial SDGs while the nutrient status of soils, an important indicator for soil health, was derived from standard soil sampling for fertility advice, thereby avoiding separate, repetitive measurements.
Acknowledgements
We thank Nico Barendregt for his valuable assistance in soil sample collection. We also acknowledge the extension services of TTW for their contributions in supporting the farmer in working towards the Sustainable Development Goals (SDGs).
References
- EU. Strategic dialogue on the future of EU agriculture. A shared prospect for farming and food in Europe; European Union: Brussels, Belgium, 2023. [Google Scholar]
- EC. Communication from the Commission to the European Parliament, the Council, the European Economic and Social Committee and the Commission of the Regions. A vision for Agriculture and Food shaping together an attractive farming and agri-food sector for future generations. European Commission. 2025. Brussels COM/2025/75 final.
- Bouma, J. Soil science contributions towards Sustainable Development Goals and their implementation: Linking soil functions with ecosystem services. J.Plant Nutrition and Soil Science. 2014, 177, 111–120. [Google Scholar] [CrossRef]
- Lal, R.; Bouma, J.; Brevik, E.; Dawson, L.; Field, D.J.; Glaser, B.; et al. Soils and Sustainable Development Goals of the United Nations (New York, USA): An IUSS Perspective. Geoderma Regional 2021, 25. [Google Scholar] [CrossRef]
- Chapman, G.; Cully, A.; Kosiol, J.; Macht, S.A.; Chapman, R.L.; Fitzgerald, J.A.; Gertsen, F. The wicked problem of measuring real-world research impact: Using sustainable development goals (SDGs) and targets in academia. J. Manag. Organ. 2020, 26, 1030–1047. [Google Scholar] [CrossRef]
- Reijneveld, A.; Geling, M.; Geling, E.; Bouma, J. Transforming Agricultural Living Labs Into Lighthouses Contributing to Sustainable Development as defined by the UN-SDGs. Soil Systems. 2024. 8, 79. [CrossRef]
- Bouma, J. The increasing relevance of soil science and soil security in a changing agricultural policy environment. Soil Security 2025, 19. [Google Scholar] [CrossRef]
- Bouma, J.; Scrope, T. How to focus soil research when contributing to environmental agricultural regulations aimed at sustainable development. Eur. J. Soil Sci. 2024. [CrossRef]
- MEA, Millennium Ecosystem Assessment: Ecosystems and Human Well-being . Island Press Washington, DC. 2005.
- Dolence, M.G. Using Key Performance Indicators to drive strategic decision making. New Directives for Institutional Research 1994, 63–80. [Google Scholar] [CrossRef]
- EC—European Missions. A Soil Deal for Europe—100 Living Labs and Lighthouses to Lead to the Transition towards Healthy Soils by 2030; Implementation Plan; European Commission: Brussels, Belgium, 2023. [Google Scholar]
- Gies, E.; Cals, T.; Groenendijk, P.; et al. Scenario Studie naar Doelen en Doelrealisatie in het Kader van het Nationaal Programma Landelijk Gebied: Een Integrale Verkenning van Regionale Water-,Klimaat- en Stikstofdoelen en Maatregelen in de Landbouw.” Research report 3236. 2023. Wageningen Environmental Research.
- De Vries, W.; Kros, J.; Voogd, J.C.; Ross, G.H. Integrated assessment of agricultural practices on the loss of ammonia, greenhouse gasses,nutrients and heavy metals to air and water. Science of the Total Environment. 2023, 857, 159220. [Google Scholar] [CrossRef]
- Ros, G.H.; Verweij, S.E.; Sander, S.E.; Janssen, S.J.C.; De Haan, J.; Fujita, Y. An Open Soil Health Assessment Framework Facilitating Sustainable Soil Management. Environ. Sci. Technol. 2022, 56, 17375–17384. [Google Scholar] [CrossRef]
- Soil Survey Staff, USDA. Soil Taxonomy: A Basic System of Soil Classification for Making and Interpreting Soil Surveys, 2nd ed.; Agriculture Handbook, No. 436; USDA: Washington, DC, USA, 1999. [Google Scholar]
- FAO. World Reference Base for Soil Resources—International Soil Classification System for Naming Soils and Creating Legends for Soil Maps; Update 2015; World Resources Report 106; FAO: Rome, Italy, 2015. [Google Scholar]
- Van Ittersum, M.K.; Cassman, K.G.; Grassini, P.; Wolf, J.; Tittonell, P.; Hochman, Z. Yield gap analysis with local to global relevance—A review. Field Crop. Res. 2013, 143, 4–17. [Google Scholar] [CrossRef]
- Houba, V.J.G.; Lexmond, T.M.; Novasamsky, I.; Van der Lee, J.J. State of the art and future developments in soil analysis for bioavailability assessment. Sci. Total Environ. 2013, 178, 21–28. [Google Scholar] [CrossRef]
- DeCarlo, R.M.; Rivoira, L.; Ciofi, L.; Ancillotti, C.; Checchini, L.; DelBubba, M.; Brazzoniti, M.C. Evaluation of different QuEChERS procedures for the recovery of selected drugs and herbicides from soil using LC coupled with UV and pulsed amperometry for their detection. Anal. Bioanal. Chem. 2015, 407, 1217–1229. [Google Scholar] [CrossRef]
- EC (European Commission). Proposal for a Directive of the European Parliament and of the Council on Soil Monitoring and Resilience; COM/2023/416 Final; European Commission: Brussels, Belgium, 2023. [Google Scholar]
- Arets, E.J.M.M.; van Baren, S.A.; Hendriks, C.M.J.; Kramer, H.; Lesschen, J.P.; Schelhaas, M.J. Greenhouse Gas Reporting for the LULUCF Section in the Netherlands: Methodological Background; WOt Technical Report 238; Wageningen University and Research: Wageningen, The Netherlands, 2021. [Google Scholar]
- Reijneveld, J.A.; Oenema, O. Rapid soil tests for assessing soil health. Applied Sciences. 2025, 15, 8669. [Google Scholar] [CrossRef]
- Hack-ten Broeke, M.J.D.; Mulder, H.M.; Bartholomeus, R.P.; van Dam, J.C.; Hulshof, G.; Hoving, I.E.; Walvoort, D.J.J.; Heinen, M.; Kroes, J.G.; van Brakel, P.T.J.; et al. Quantitative land evaluation implemented in Dutch water management. Geoderma 2018, 338, 536–545. [Google Scholar] [CrossRef]
- Heinen, M.; Mulder, H.M.; Bakker, G.; Wösten, J.H.M.; Brouwer, F.; Teuling, K.; Walvoort, D.J.J. The Dutch soil physical units map: BOFEK. Geoderma 2022, 427, 116123. [Google Scholar] [CrossRef]
- Heinen, M.; Mulder, M.; van Dam, J.; et al. SWAP 50 Years: Advances in Modeling Soil-Water-Atmosphere-Plant Interactions. Agric. Water Management 2024, 298, 108883. [Google Scholar] [CrossRef]
- Soil Science Society of America (SSSA). Part 4, Physical Methods. Subchapter 2.1: Bulk Density; Subchapter 2.8: Penetrometers. In Methods of Soil Analysis; Dane, J.H., Top, G.C., Eds.; No 5 in SSSA Book Series; Soil Science Society of America: Madison, WI, USA, 2002. [Google Scholar]
- Frostegård, A.; Bååth, E. The use of phospholipid fatty acid analysis to estimate bacterial and fungal biomass in soil. Biol. Fertil. Soils 1996, 22, 59–65. [Google Scholar] [CrossRef]
- Ramsey, P.W.; Rillig, M.C.; Feris, K.P.; Holben, W.E.; Gannon, J.E. Choice of methods for soil microbial community analysis: PLFA maximizes power compared with CLPP and PCR-based approaches. Pedobiologica 2006, 50, 275–280. [Google Scholar] [CrossRef]
- Willers, C.; Jansen van Rensburg, P.J.; Claassens, S. Phospholipid Fatty Acid profiling of microbial communities—A review of interpretations and recent applications. J. Appl. Microbiol. 2015, 119, 1207–1218. [Google Scholar] [CrossRef]
- Kaur, A.; Choudhary, R.; Kaushik, R. Phospholipid Fatty Acid-A bioindicator of environmental monitoring and assessment in soil ecosystems. Curr. Sci. 2005, 89, 1103–1112. [Google Scholar]
- Halasz, J.; Kotroczo, Z.; Szabo, P.; Kocsis, T. Biomonitoring and assessment of dumpsites soil using Phospholipid Patty Acid Analysis (PLFA) method—Evaluation of possibilities and limitations. Chemosensors 2022, 10, 409. [Google Scholar] [CrossRef]
- Reijneveld, J.A.; van Oostrum, M.J.; Brolsma, K.M.; Fletcher, D.; Oenema, O. Empower innovations in routine soil testing. Agronomy 2022, 12, 191. [Google Scholar] [CrossRef]
- Bouma, J. Influence of soil macroporosity on environmental quality. Advances in Agronomy 1991, 46, 1–37, Academic Press Inc. Harcourt Brace Jovanovich, Publishers. D.L. Sparks (ed). Prepared in cooperation with the American Society of Agronomy Monographs Committee.. [Google Scholar]
- Bouma, J. Effect of soil structure, tillage and aggregation upon soil hydraulic properties. In Advances in Soil Science. Interacting Processes in Soil Science; Wagenet, R.S., Baveye, P., Stewart, B.A., Eds.; Lewis Publishers: Boca Raton-Ann Arbor-London-Tokyo, 1992; pp. 1–37. [Google Scholar]
- Adhikari, K.; Hartemink, A.E. Linking soils to ecosystem services. Geoderma 2016, 262, 101–111. [Google Scholar] [CrossRef]
- Groffman, P.M. A Golden Moment for soils and society presents challenges and opportunities for soil science. Eur. J. of Soil Science 2023. [CrossRef]
- Rust, N.A.; Stankovics, P.; Jarvis, R.M.; et al. Have Farmers Had Enough of Experts? Environmental Management 2021, 69, 3144. [Google Scholar] [CrossRef] [PubMed]
Figure 1.
Flow chart demonstrating the procedure to test whether ecosystem services, contributing to achieving SDGs and meet thresholds that apply to the living lab being studied [6].
Figure 1.
Flow chart demonstrating the procedure to test whether ecosystem services, contributing to achieving SDGs and meet thresholds that apply to the living lab being studied [6].
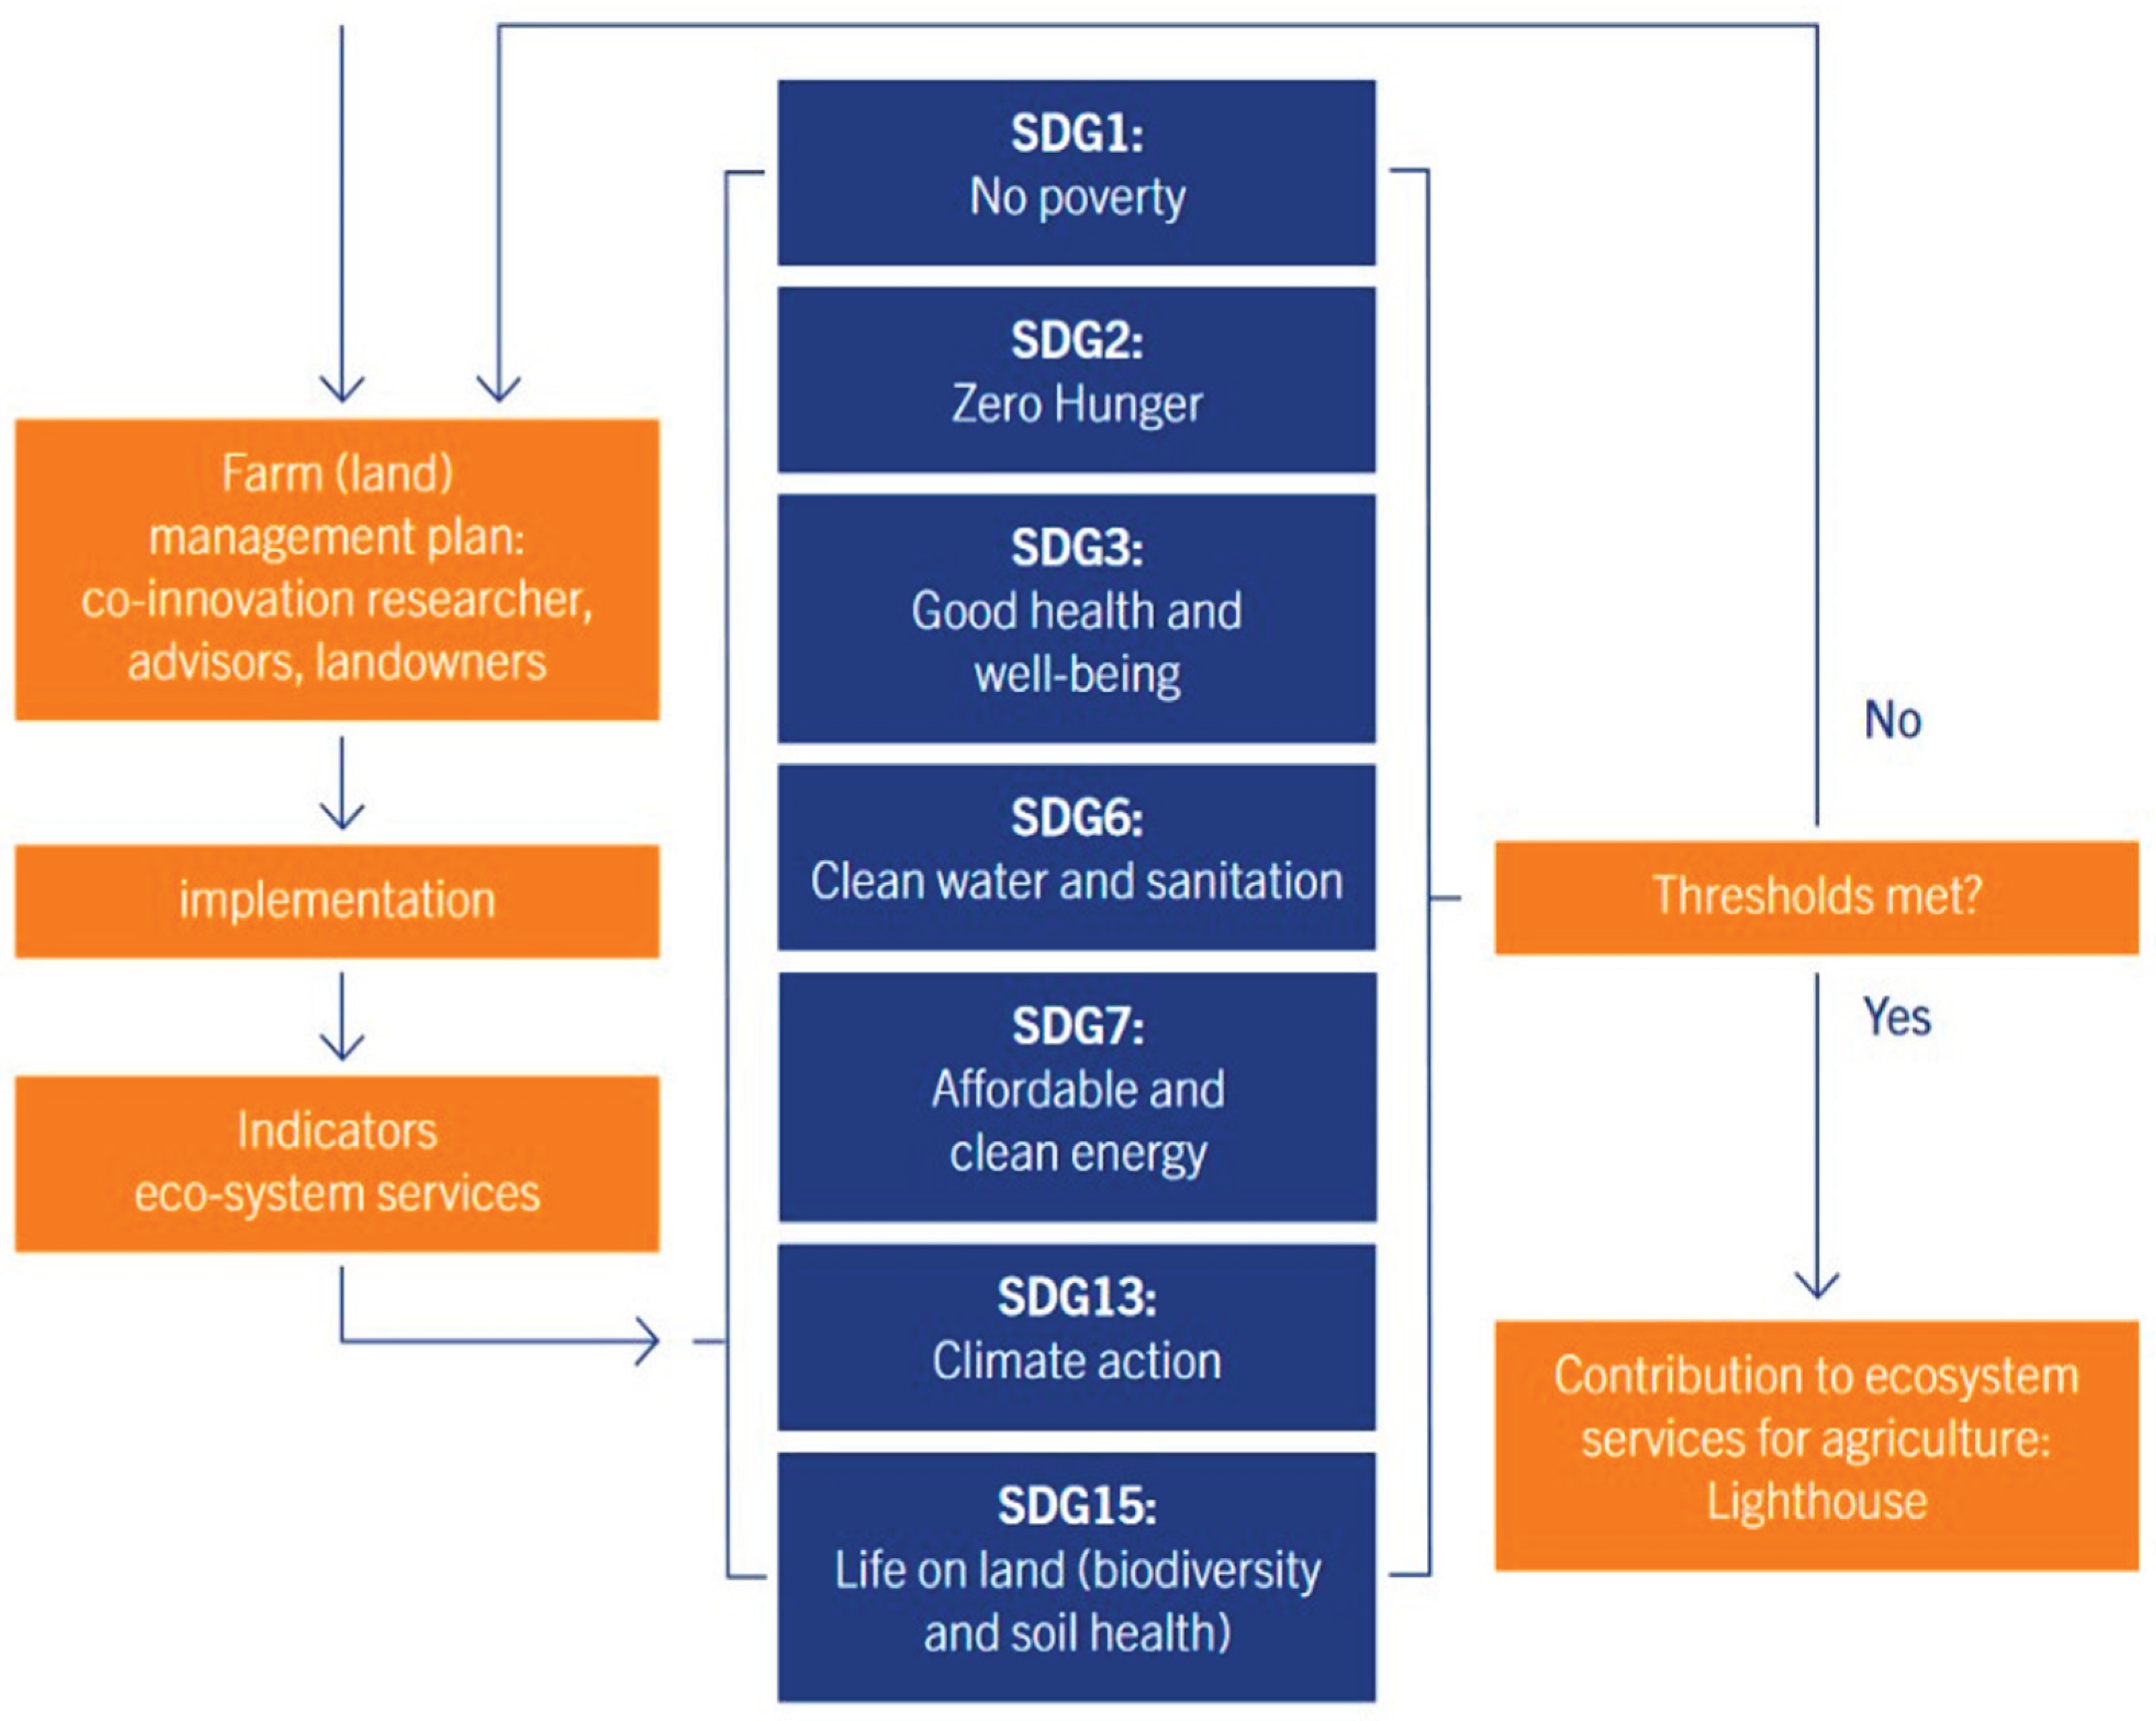
Figure 2.
Flow chart demonstrating the procedure to test whether soils are healthy with the objective to maximize soil contributions to ecosystem services, shown in Figure 1. Soil health is also a separate element of SDG15 [6].
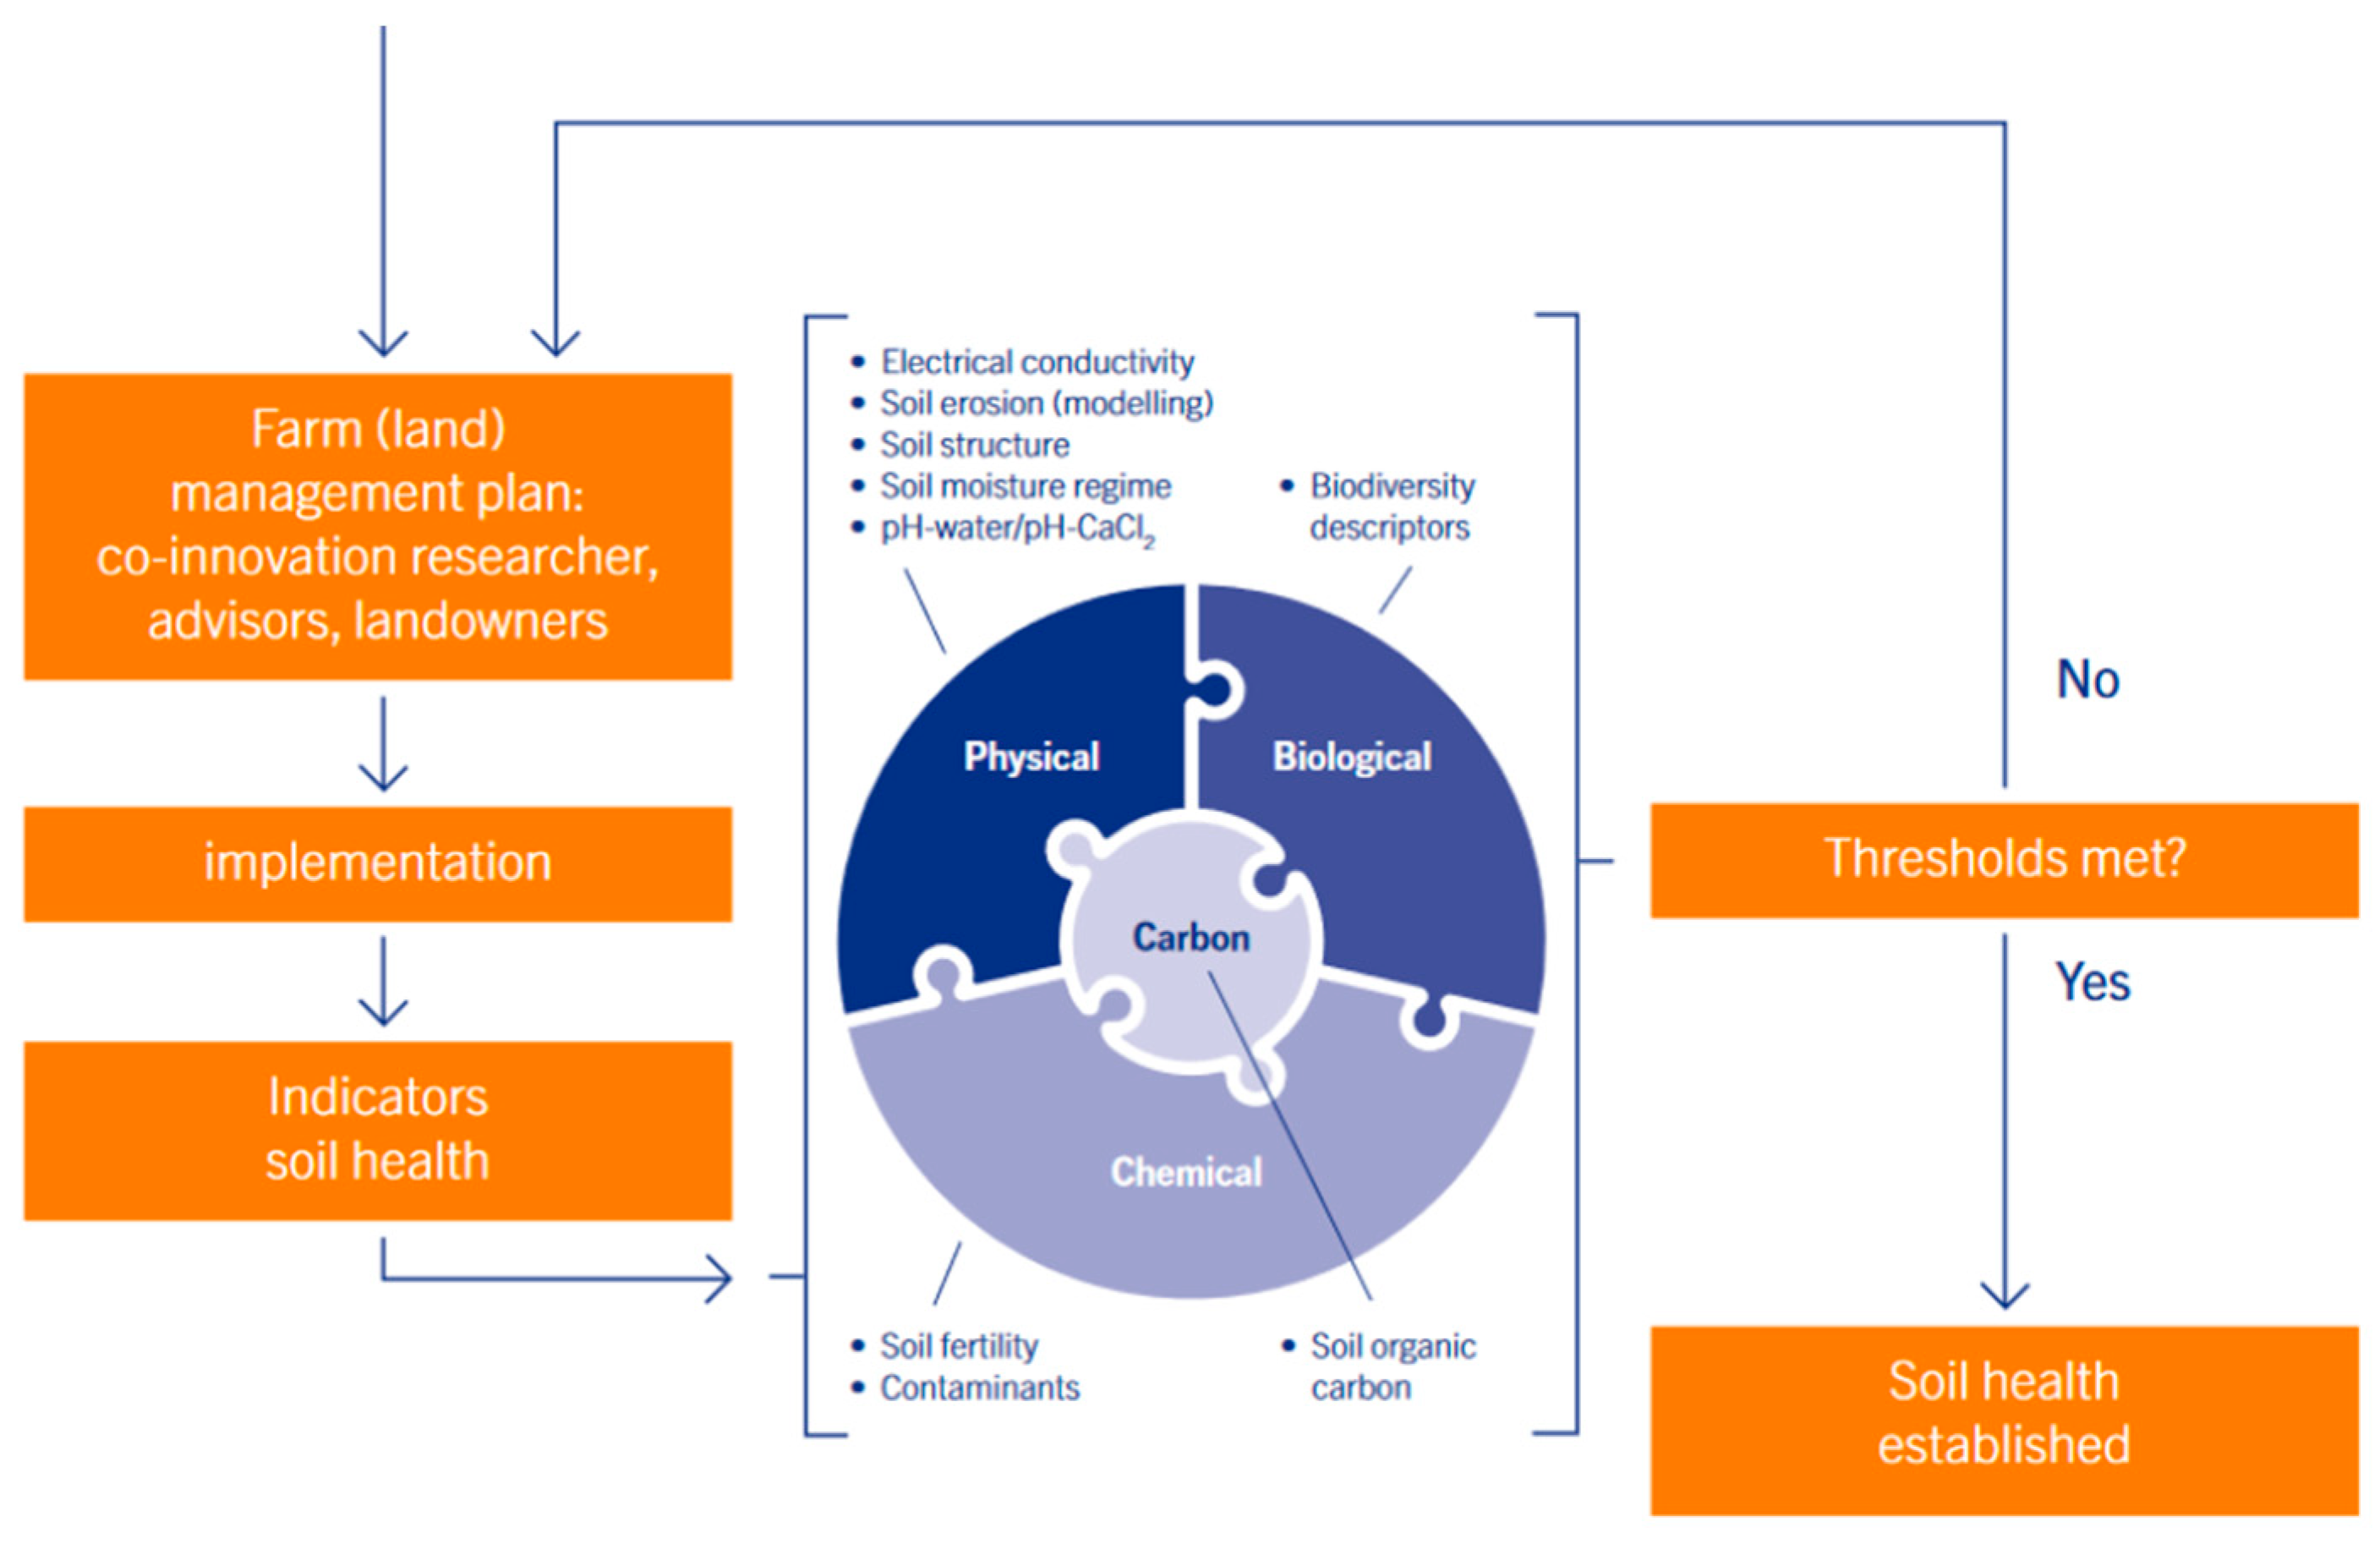
Figure 3.
Surface soil (0-30 cm) of the Mn35A covered by a wheat crop in May 2025, consisting of small and large clods and roots that reach the subsoil following pores between the surface clods into the cracks in the subsoil.
Figure 3.
Surface soil (0-30 cm) of the Mn35A covered by a wheat crop in May 2025, consisting of small and large clods and roots that reach the subsoil following pores between the surface clods into the cracks in the subsoil.
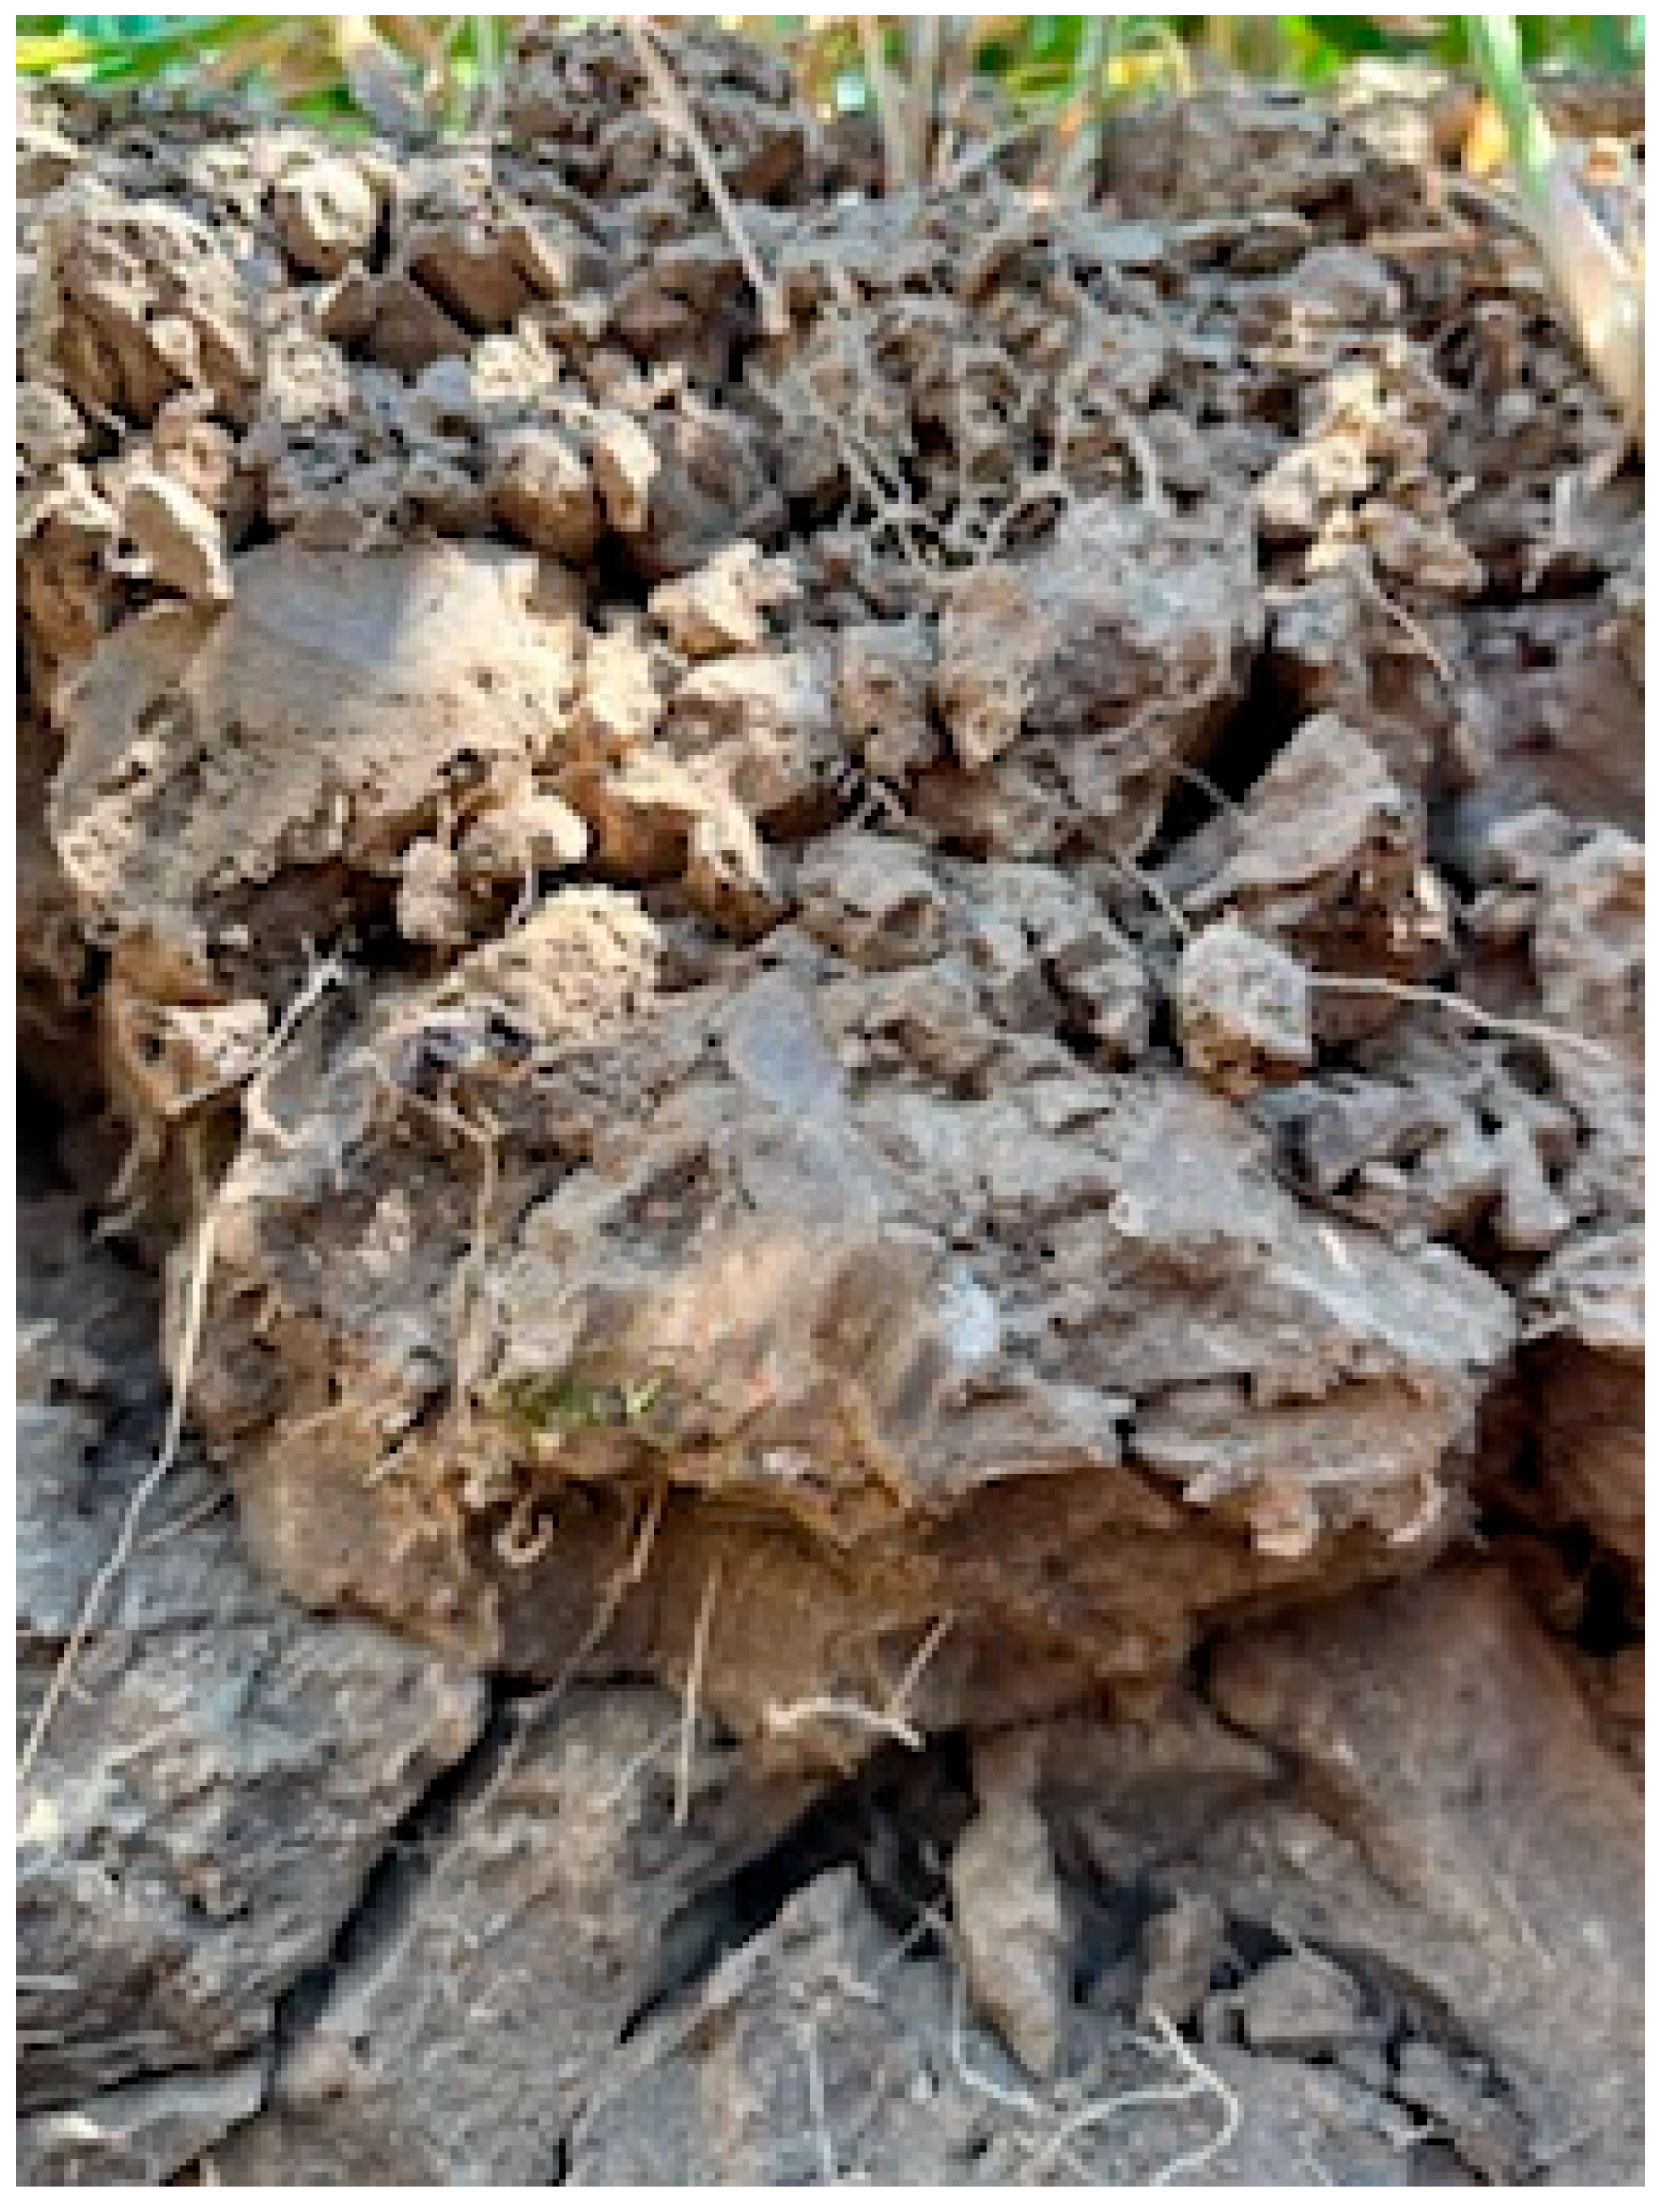
Figure 4.
Model calculations of water-limited and potential yields of winter wheat of the Mn35A soil (upper diagram) and the Mn45A soil.
Figure 4.
Model calculations of water-limited and potential yields of winter wheat of the Mn35A soil (upper diagram) and the Mn45A soil.
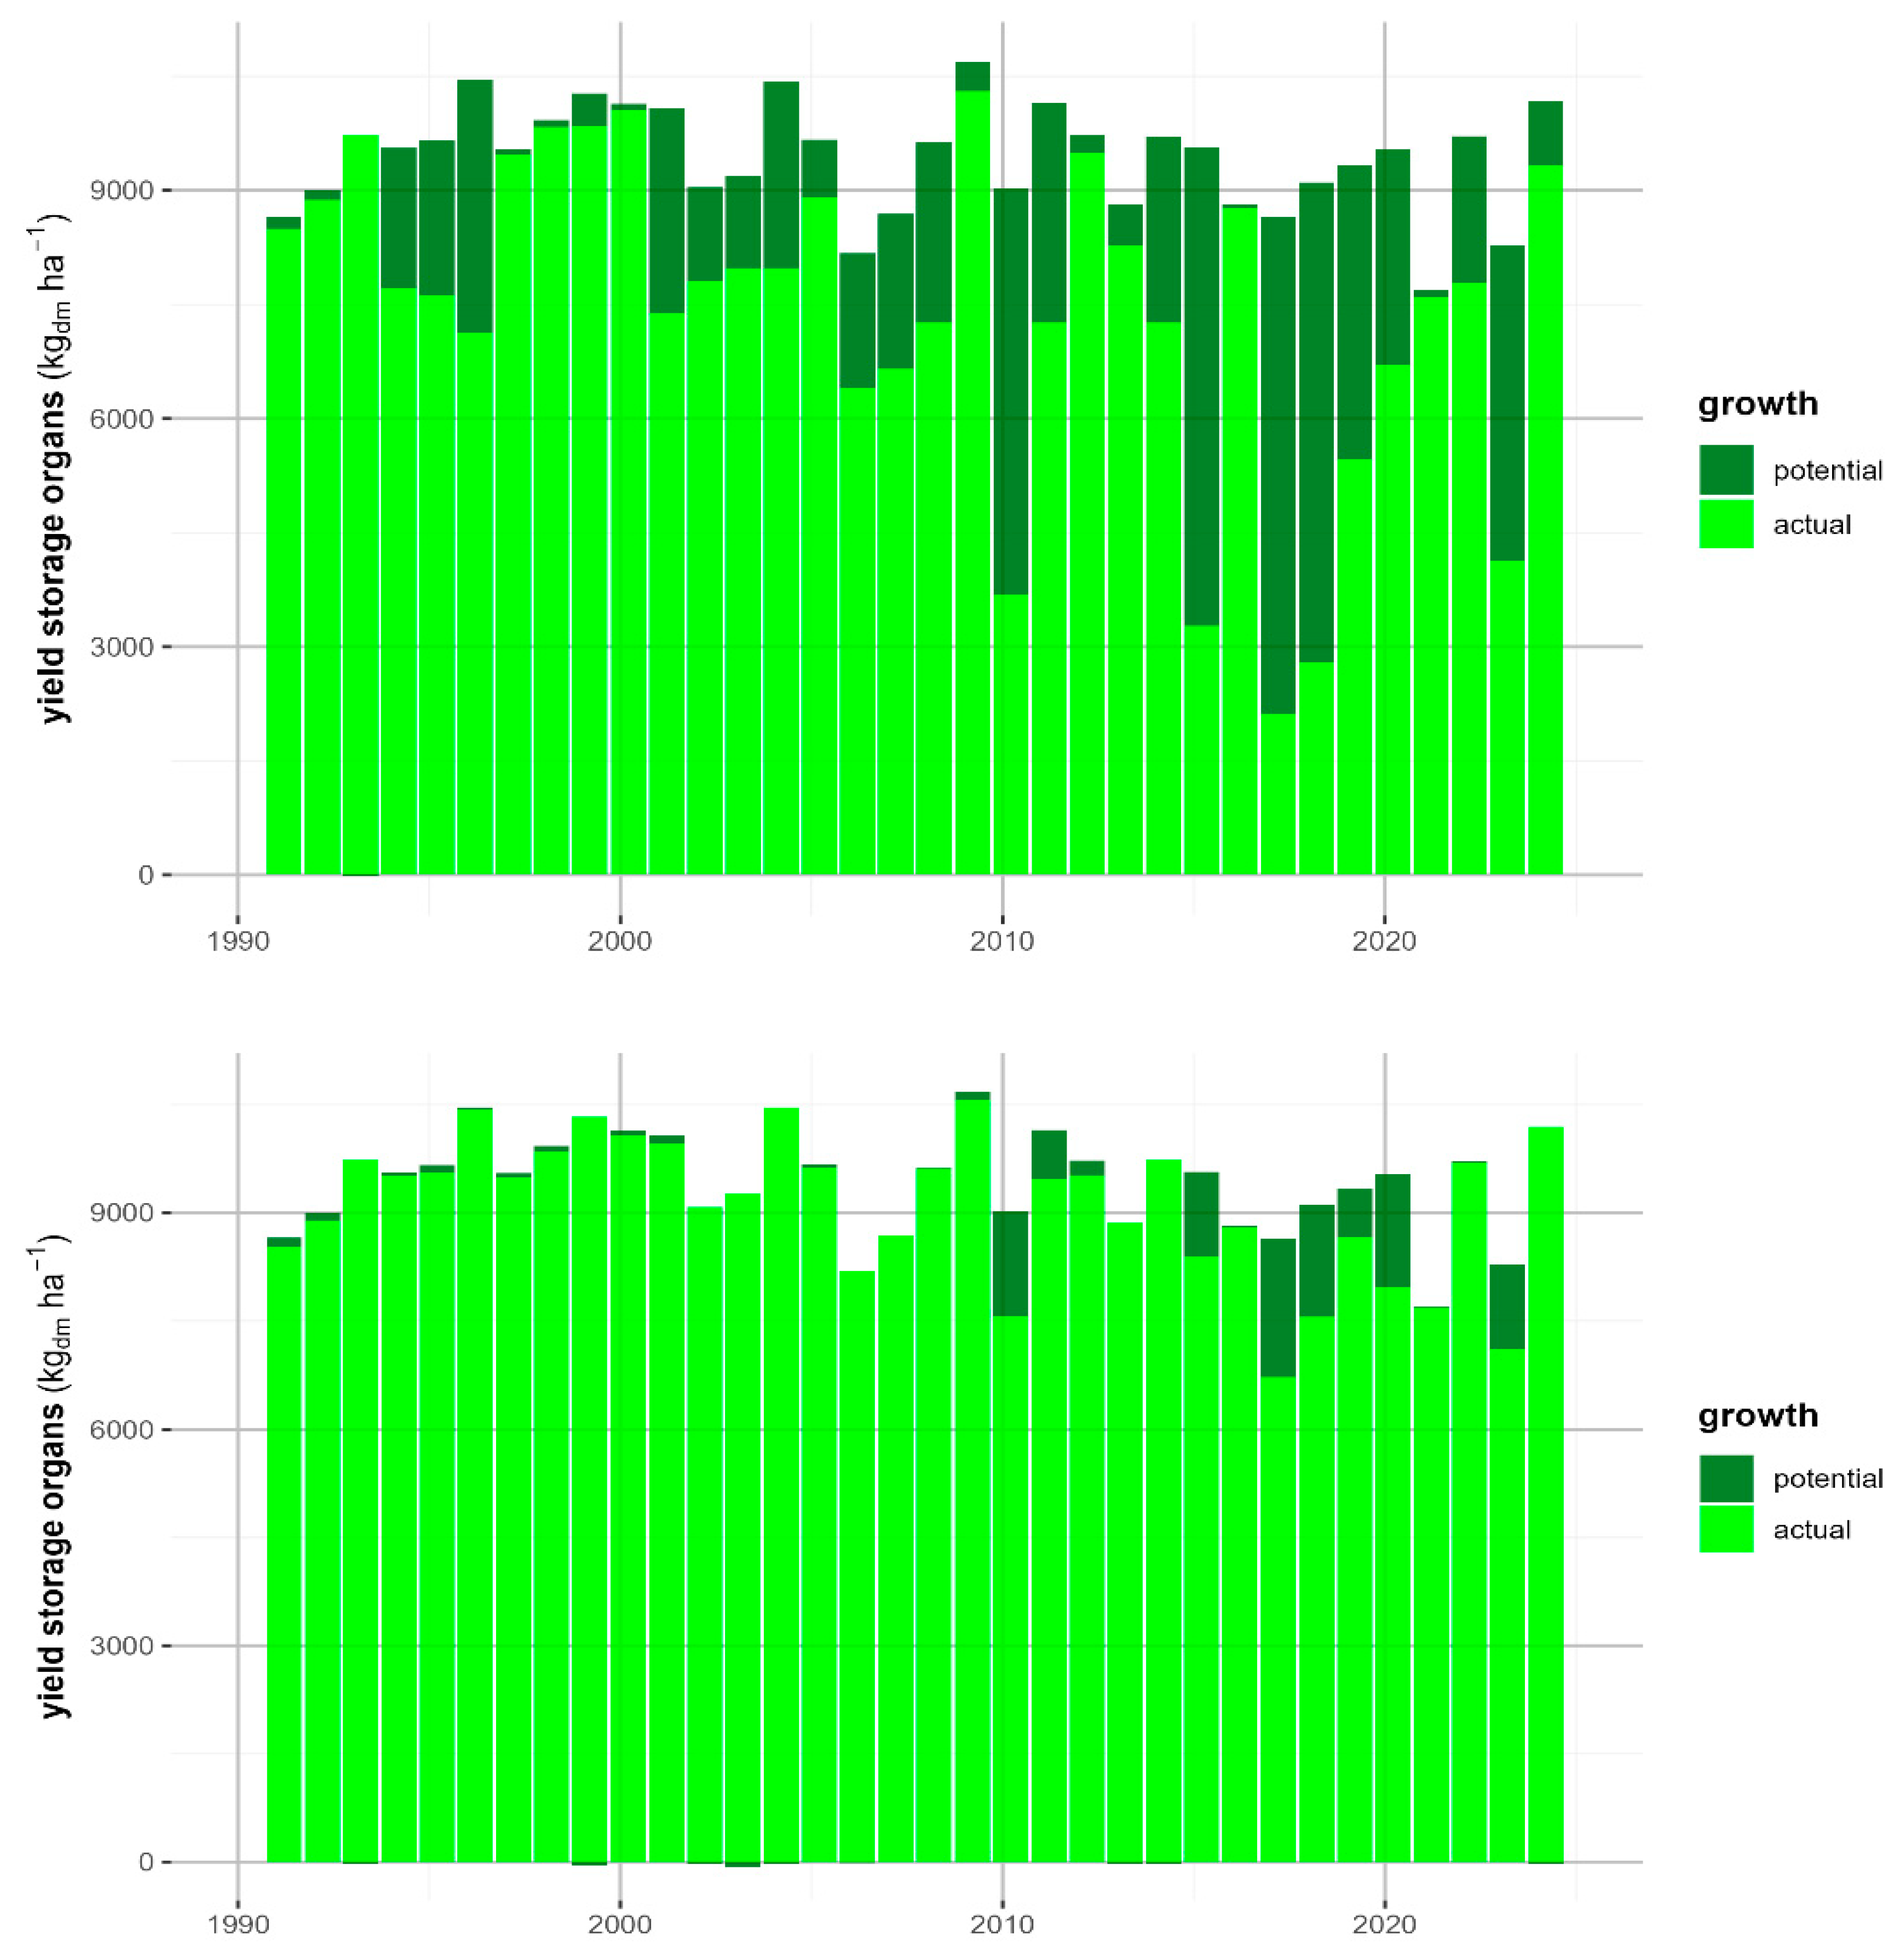
Figure 5.
The Soil Health Indicator report [22] has several sections, including soil nutrient status (above), a soil and crop based recommendation (middle), and biological indicators (below). Data were obtained for the four fields and this analysis of a Mn35A soil is representative for the other fields.
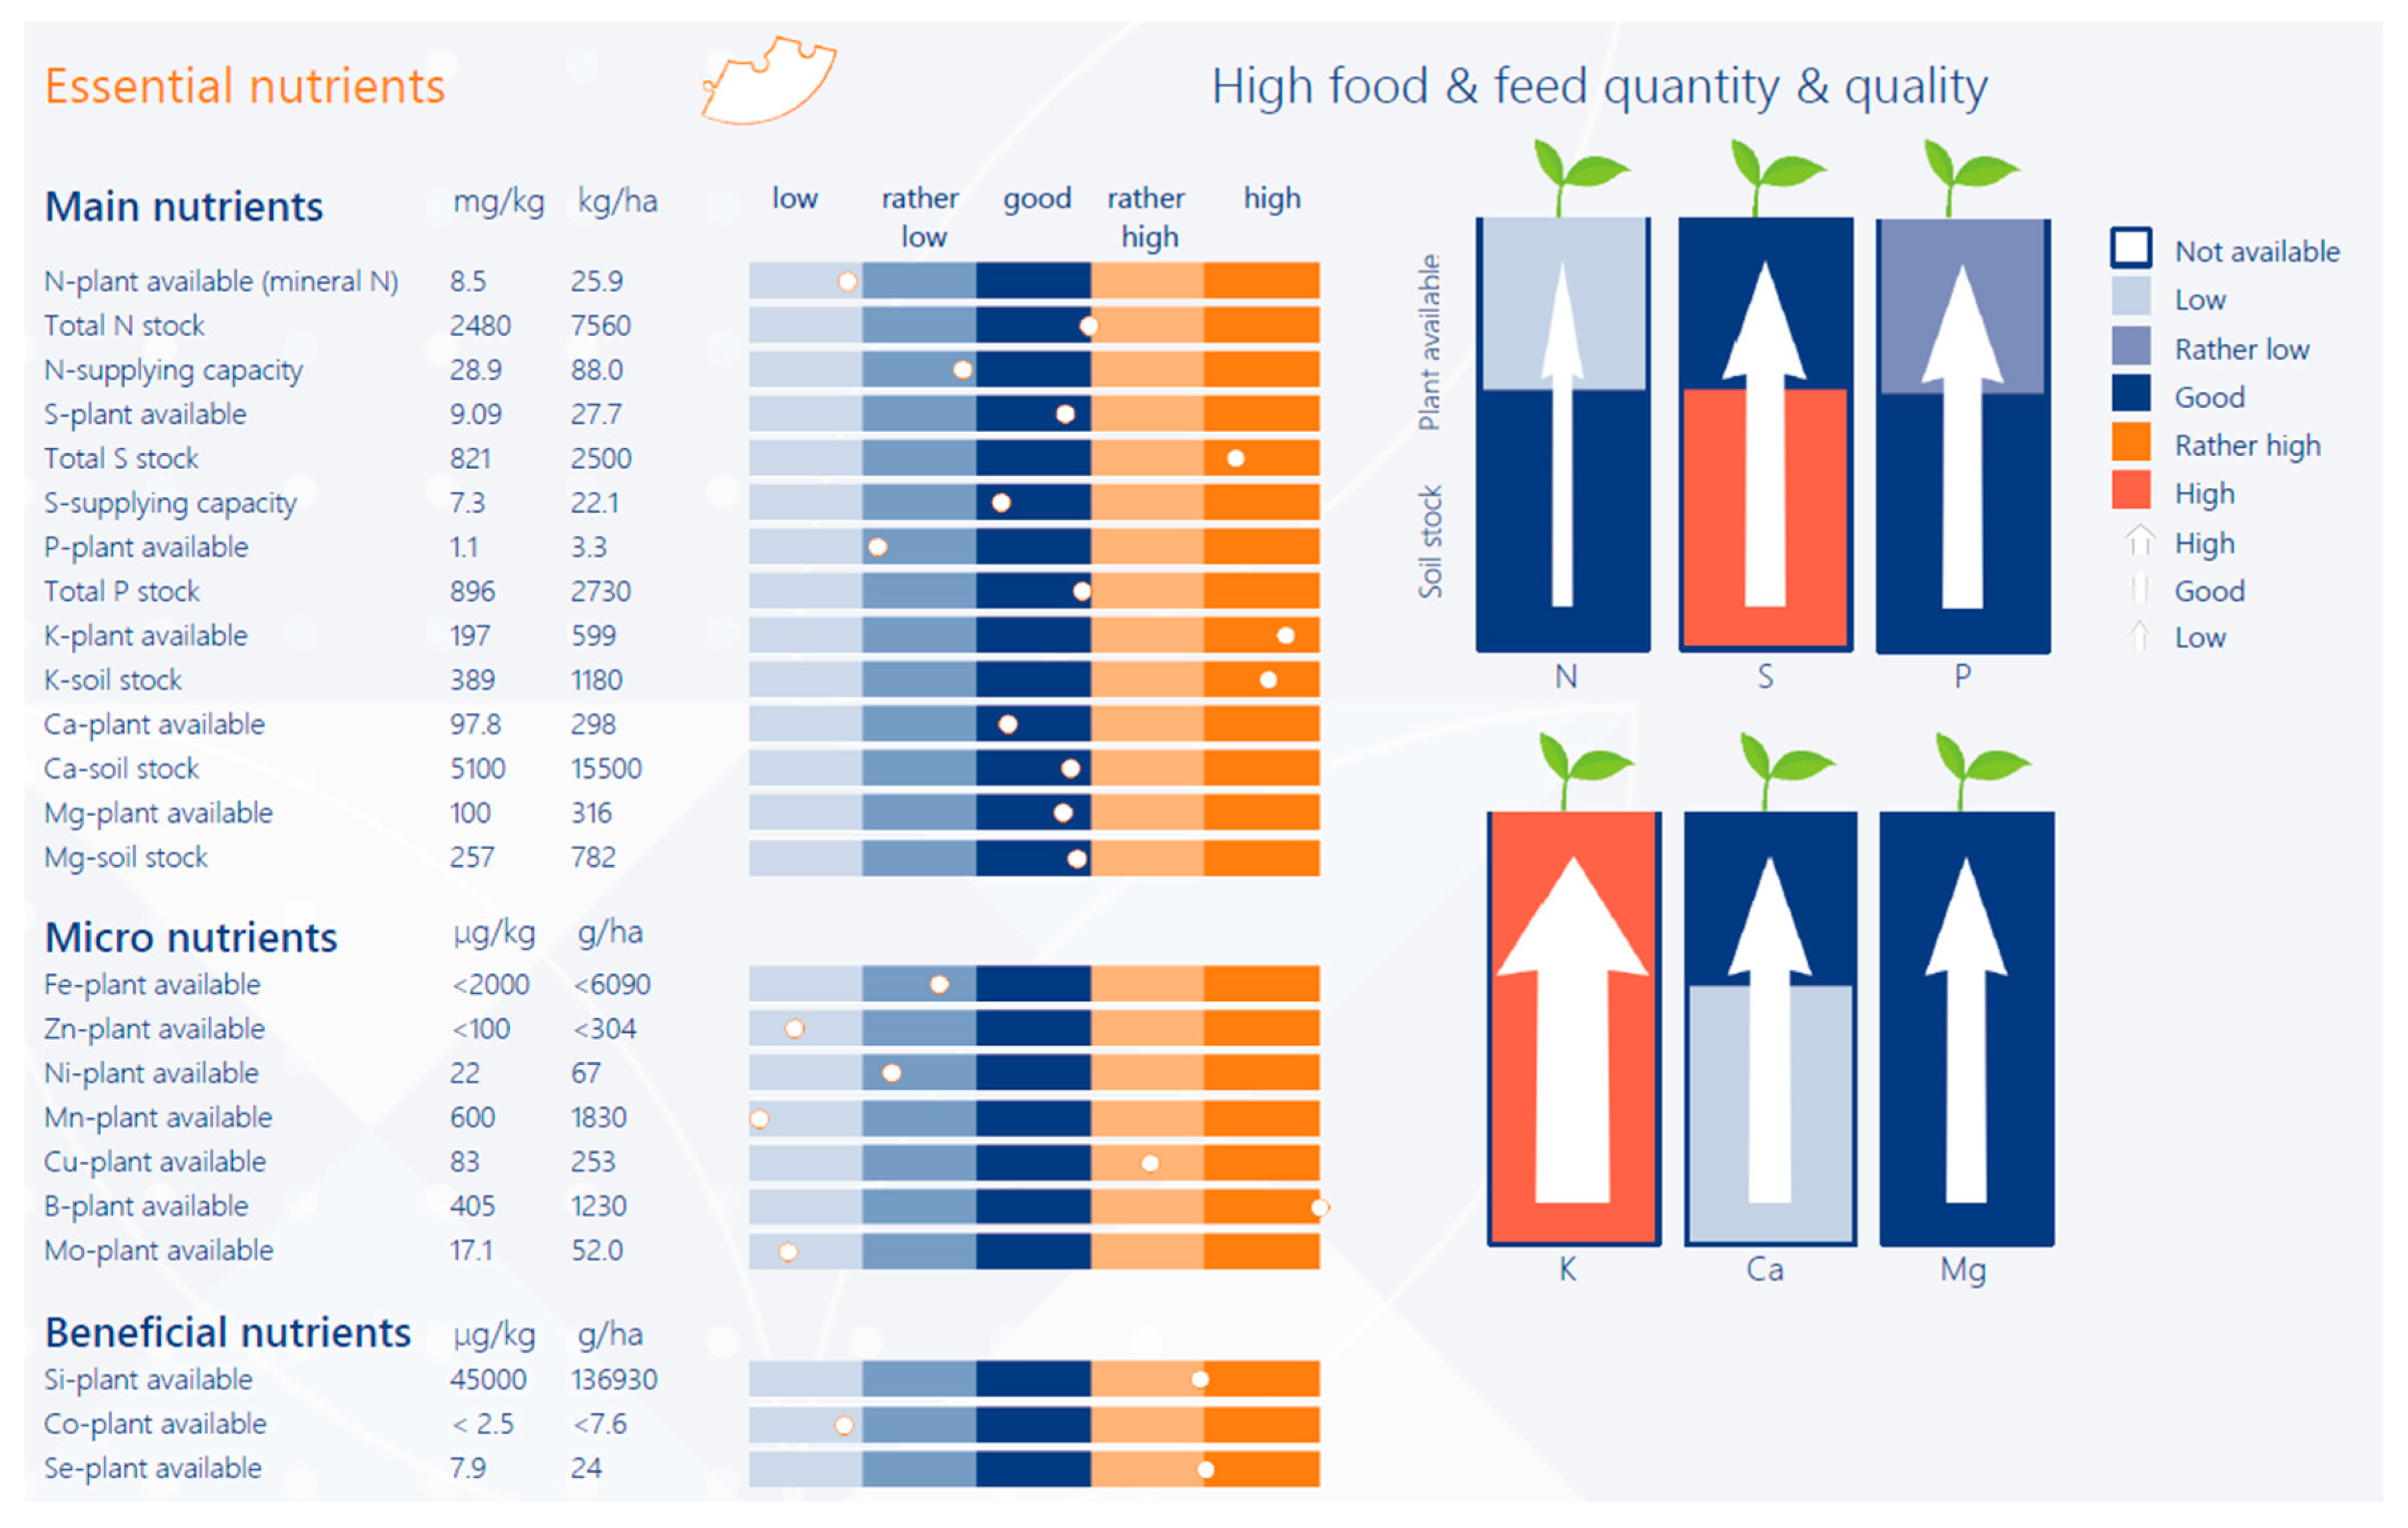
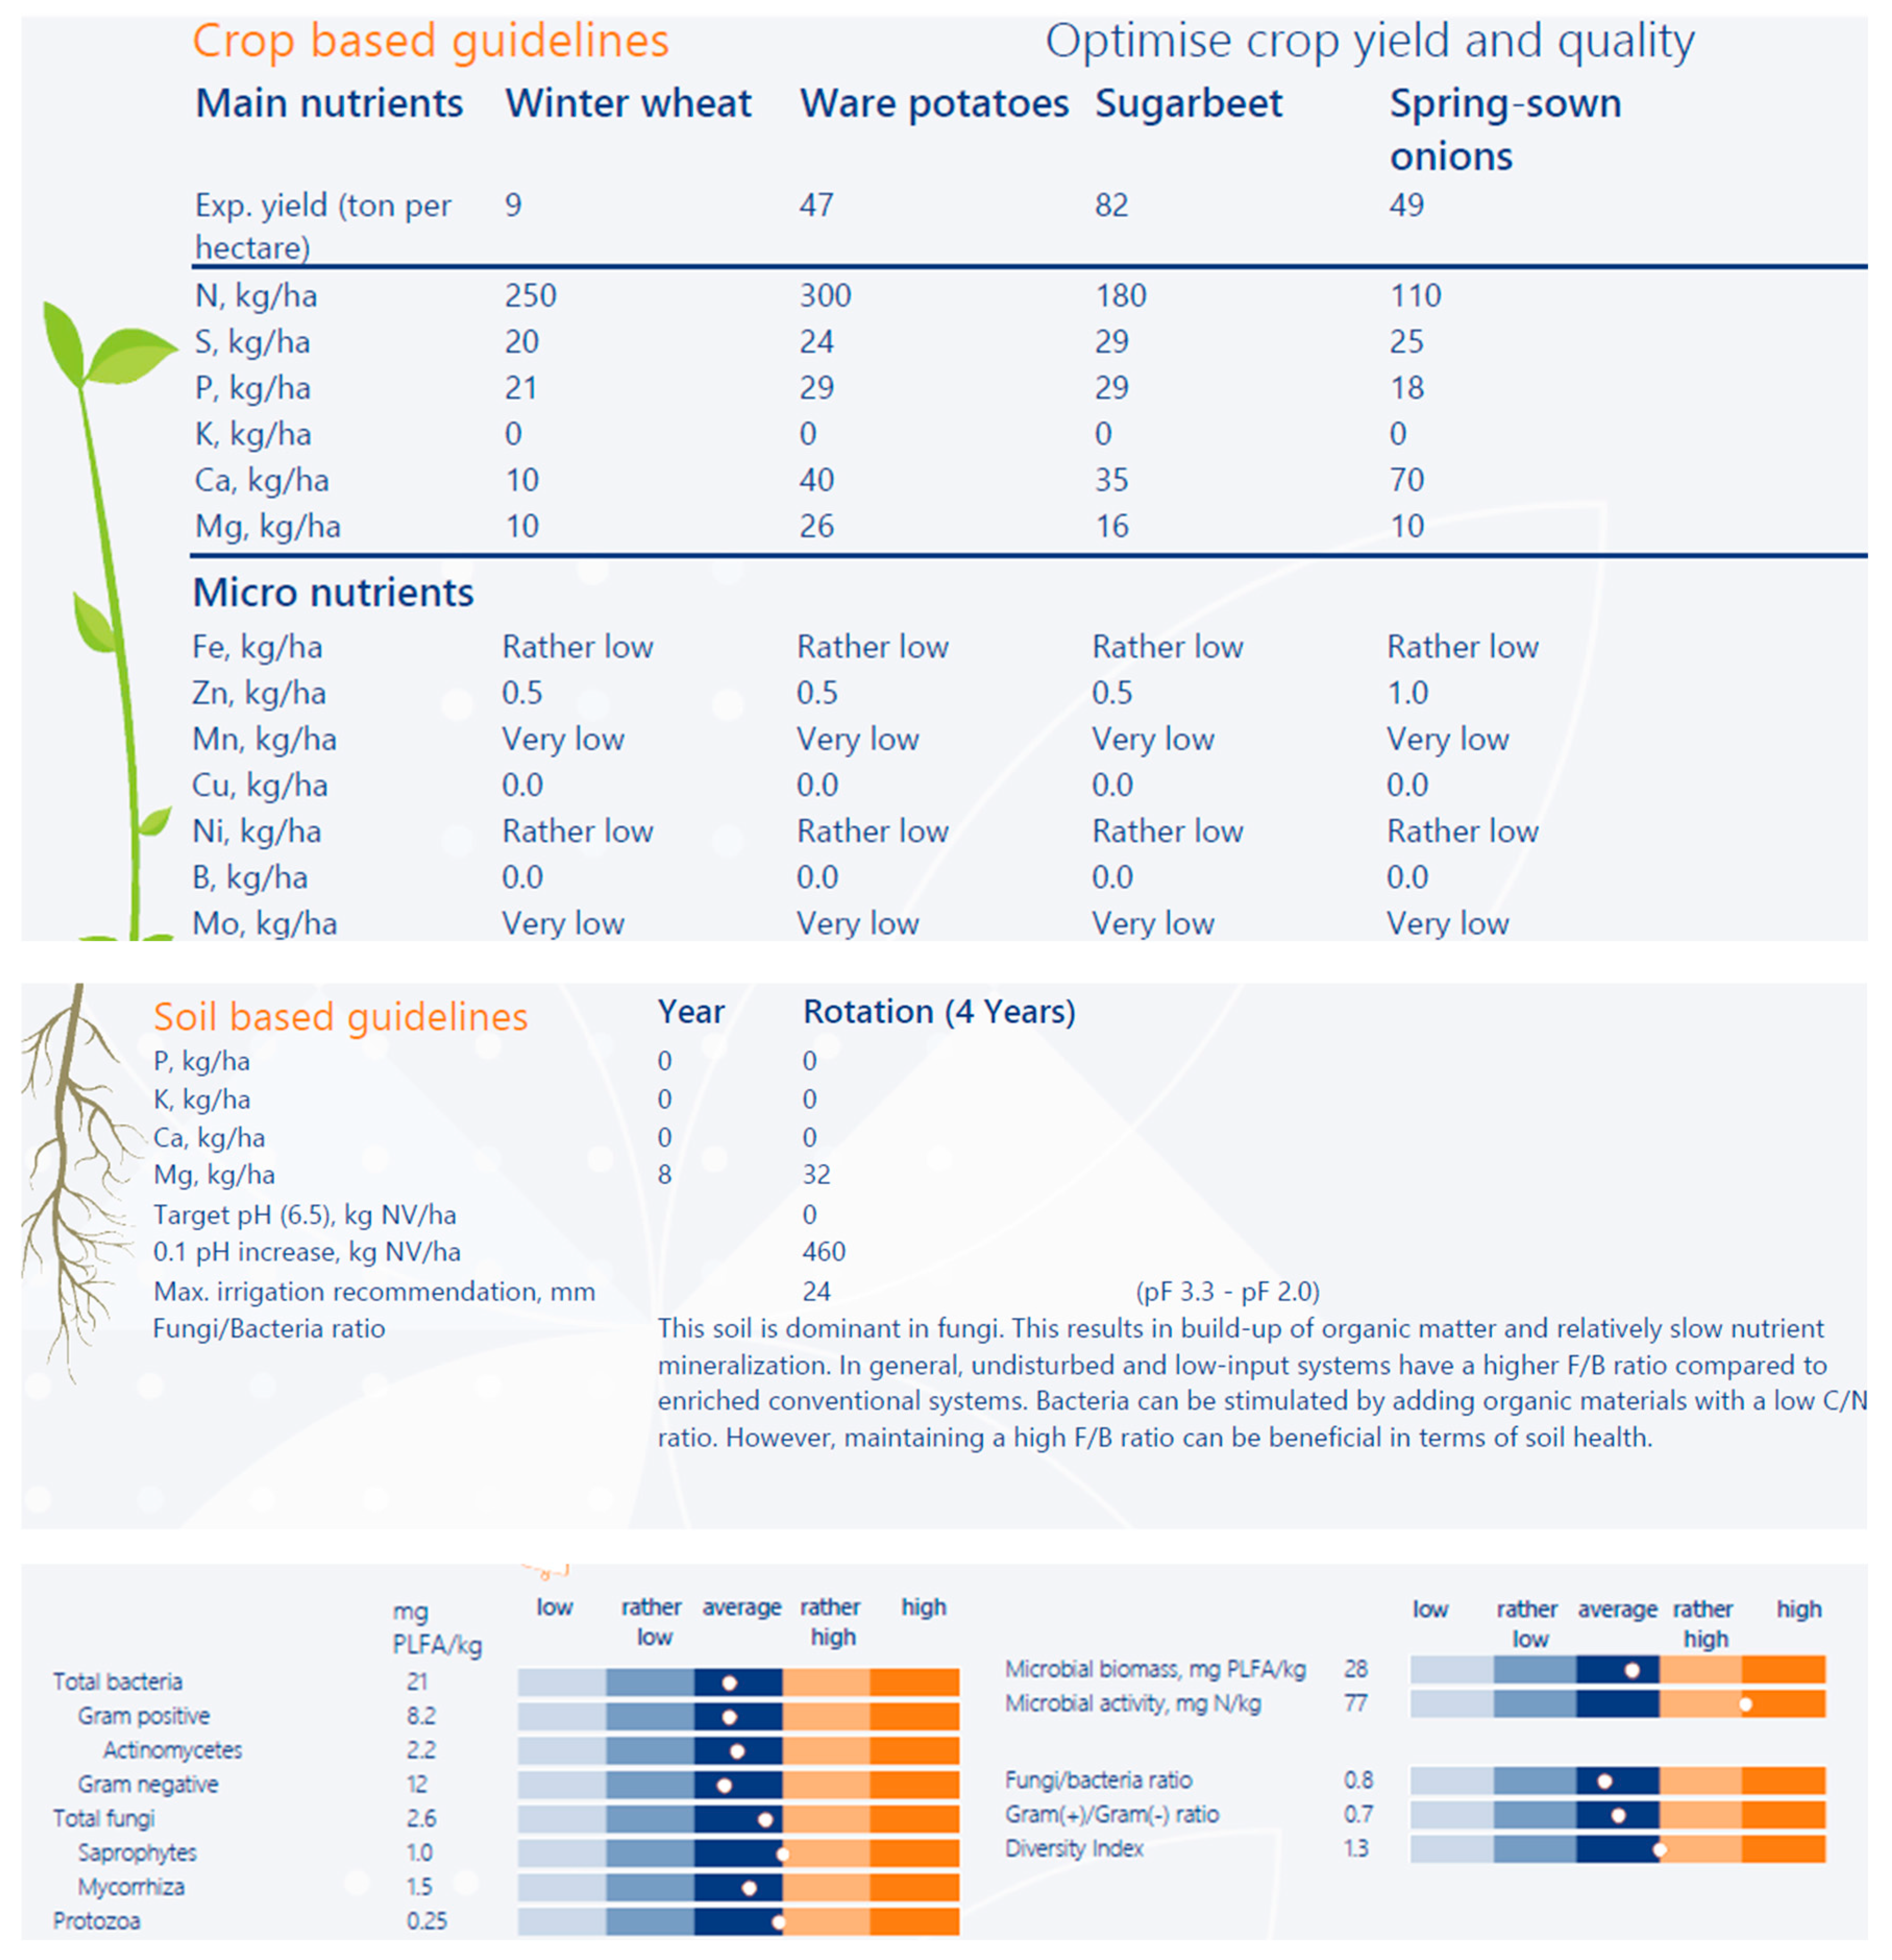

Table 1.
A selection of SDGs that are of prime significance for arable farming systems in the Netherlands and beyond in Western Europe. The corresponding ecosystem services can serve as Key Performance Indicators (KPI’s) as used in the business world.
Table 1.
A selection of SDGs that are of prime significance for arable farming systems in the Netherlands and beyond in Western Europe. The corresponding ecosystem services can serve as Key Performance Indicators (KPI’s) as used in the business world.
| SDG | Corresponding ecosystem service | |
| 1 | No poverty | Farmer income |
| 2 | Zero Hunger | Production levels |
| 3 | Good health and wellbeing | Healthy products |
| 6 | Clean water and sanitation | Clean ground- and surface water |
| 13 | Climate action | Emission greenhouse gasses |
| 15 | Life on land | Biodiversity/nature and soil health |
Table 2.
Representative results of the carbon section of the Soil Health Indicator [22], for the two soil types as applied in the four fields of the Living Lab.
Table 2.
Representative results of the carbon section of the Soil Health Indicator [22], for the two soil types as applied in the four fields of the Living Lab.
| Indicator | Mn35A | Mn45A |
| Organic carbon, % | 1.5 - 2.0 | 2.5 |
| Inorganic carbon, % | 1.31 - 1.34 | 0.98 |
| Total carbon content, ton C/ha | 53.2 - 61.4 | 155.5 |
| Mineralization, ton C/ha/year | 6.0 - 7.2 | 8.6 |
| 4 per 1000 requirement, ton C/ha/year | 0.2 - 0.3 | 0.3 |
Disclaimer/Publisher’s Note: The statements, opinions and data contained in all publications are solely those of the individual author(s) and contributor(s) and not of MDPI and/or the editor(s). MDPI and/or the editor(s) disclaim responsibility for any injury to people or property resulting from any ideas, methods, instructions or products referred to in the content. |
© 2025 by the authors. Licensee MDPI, Basel, Switzerland. This article is an open access article distributed under the terms and conditions of the Creative Commons Attribution (CC BY) license (http://creativecommons.org/licenses/by/4.0/).
Copyright: This open access article is published under a Creative Commons CC BY 4.0 license, which permit the free download, distribution, and reuse, provided that the author and preprint are cited in any reuse.


