Submitted:
02 September 2025
Posted:
02 September 2025
You are already at the latest version
Abstract
Accurate and real-time prediction of ship infrared (IR) radiation characteristics is crucial for maritime search-and-rescue (SAR) operations and naval stealth management, but traditional methods are either computationally inefficient (e.g., Computational Fluid Dynamics requiring hours per scenario) or lack cross-scenario generalization (e.g., pure data-driven models). This study proposes a Kernel-Attention Mechanisms U-Net (KEU-Net) framework to address these issues. The framework integrates U-Net’s robust spatial feature extraction—via skip connections that preserve edge details of small IR targets (e.g., exhaust plumes, hull thermal gradients)—with a kernel-attention module. This module dynamically adjusts feature weighting based on maritime environmental factors (solar angles, sea states) and ship operational parameters (heading, speed), avoiding parameter redundancy of multi-layer perceptions (MLPs). Trained on three datasets covering seasons, weather, and thermal suppression scenarios, KEU-Net achieves 97.3% accuracy against finite element benchmarks, maintains ≤1.7°C temperature error across Beaufort 3–8 sea states, and completes full-azimuth IR pattern prediction in 12 seconds per scenario (32× faster than response surface models). It supports real-time SAR and stealth planning, with strong compatibility with naval systems.
Keywords:
Ship infrared radiation
; sea-sky background
; Kernel-Attention Mechanisms U-Net (KEU-Net)
; finite element benchmarks
1. Introduction
Infrared (IR) imaging technology has become an indispensable core capability for safeguarding maritime navigation safety and optimizing search-and-rescue (SAR) operational efficiency, especially in extreme scenarios where visual observation fails. According to the 2023 global seafarer safety report released by the International Labour Organization (ILO), accidents involving crew overboard account for 22.6% of total maritime fatalities, with over 60% of these incidents occurring during nighttime, fog, or heavy rain—conditions that severely degrade visible-light detection systems [1]. Compounding this challenge, statistics from the International Ship Management Association (ISMA) reveal that approximately 350 lives have been lost in shipboard enclosed-space accidents since 1996, with nearly 40 fatalities in 2024 alone. Such emergencies demand rapid and high-precision IR thermal imaging to locate trapped personnel or overboard individuals, as delays exceeding 30 seconds can reduce survival probabilities by up to 50% in cold marine waters [2]. However, the complex interplay between ship thermal emissions (e.g., exhaust plumes, engine compartments) and dynamic maritime environments—including wave-modulated sea-surface reflectance, fog-induced atmospheric scattering, and transient heat transfer in composite ship structures—creates significant obstacles for traditional detection methods [3]. These factors not only lead to inconsistent IR signatures across critical atmospheric windows (3–5 μm and 8–12 μm) but also render conventional computational fluid dynamics (CFD) approaches impractical for real-time applications, as they require millions of grid elements and often take over 5 minutes per frame to process [4].
The uniqueness of the maritime environment introduces three core challenges for IR detection systems, each exacerbating the difficulty of reliable target identification. First, sea-surface complexity—driven by wind speed, wave height, and solar illumination—causes significant variability in background radiation. For instance, the Cox-Munk rough sea surface model demonstrates that wind speeds above 5 m/s increase sea-surface slope variance by 0.025, leading to a 30–40% fluctuation in reflected solar IR radiation [5]. This variability disrupts the contrast between targets (e.g., life rafts, overboard personnel) and the sea surface, making it difficult for traditional threshold-based methods to distinguish valid targets from clutter. Second, atmospheric transmission uncertainty in coastal and littoral zones further complicates detection. MODTRAN simulations cited in Kong et al. [6] show that humidity levels above 80% can reduce IR transmission in the 8–12 μm band by 300–400%, while fog with visibility below 1 km attenuates 3–5 μm radiation by up to 60% [7]. These variations undermine the consistency of empirical models that rely on fixed atmospheric parameters. Third, target scale and spectral diversity poses a challenge for universal detection. Small targets (e.g., life jackets) often exhibit weak IR signatures (≤ 10 W·sr⁻¹·m⁻²) in the 3–5 μm band, while larger targets (e.g., ship hulls) have stronger but spectrally variable emissions due to material differences (e.g., steel vs. composite decks) [8]. Traditional methods, such as the line segment detector (LSD) [9] or RANSAC-based sea-sky line (SSL) detection [10], struggle to adapt to these dynamic conditions, with Praczyk [12] reporting a 27% error rate in SSL detection under Beaufort 6 sea states.
Existing IR detection methods can be categorized into three groups, each with inherent limitations that hinder their applicability in maritime SAR scenarios.
1.1. Traditional Computational Methods
Computational Fluid Dynamics (CFD) and finite-element analysis (FEA) are widely used for thermal modeling but suffer from prohibitive computational latency. For example, a full thermal analysis of a medium-sized patrol ship using ANSYS Fluent requires ~10⁶ grid elements and takes 14 hours to complete on a 512-core high-performance computing (HPC) cluster [13]. This makes real-time detection impossible for SAR operations, where decisions must be made within 30–60 seconds. Empirical models, such as the NATO-standard SIRUS code [14], rely on lookup tables derived from historical weather data but fail to generalize to novel conditions. A 2021 study by Lin et al. [10] showed that SIRUS exhibits a 42% error in predicting ship IR emissions during Typhoon Haishen, as its static parameters cannot account for sudden changes in wind direction or wave height. Traditional image processing techniques, such as gradient directional filtration [8] and probabilistic Hough transform (PHT) [15], focus on SSL detection to narrow target ranges but struggle with clutter. Dong et al. [8] reported that their gradient-based SSL algorithm achieves only 79% accuracy under dense cloud cover, as cloud edges mimic the intensity gradient of the sea-sky interface.
1.2. Machine Learning-Based Methods
In recent years, deep learning has emerged as a promising alternative, with U-Net and its variants leading in maritime image segmentation. Lin et al. [10] achieved an Intersection over Union (IoU) of 99.08% and pixel accuracy of 99.39% for sea-surface segmentation using an improved U-Net, demonstrating its ability to extract target contours in calm conditions. However, purely data-driven models face three critical limitations. First, spectral generalization is poor: Zhang et al. [16] showed that a CNN trained on 8–12 μm data exhibits a 63% increase in Mean Absolute Error (MAE) when applied to 3–5 μm images, as the model fails to learn cross-band thermal correlations. Second, sample inefficiency plagues traditional architectures like Multilayer Perceptrons (MLPs), which require over 20,000 labeled samples to achieve practical accuracy [17]. This is problematic for maritime scenarios, where labeled IR datasets are scarce—for example, the Singapore-NR dataset, one of the largest public maritime IR datasets, contains only 13,162 frames [3]. Third, real-time performance is compromised by complex architectures. YOLOv5-MOBv2, a lightweight variant for SSL region (SSLR) detection, achieves 203.9 frames per second (FPS) but suffers a 5.3% drop in average precision (AP) compared to heavier models [18]. YOLOv7, while more accurate (AP = 78.3% on the Mar-DCT dataset), operates at only 115.5 FPS, which is insufficient for high-speed SAR platforms like unmanned aerial vehicles (UAVs) [19].
1.3. Physics-Informed and Hybrid Methods
Physics-informed machine learning (PIML) methods, such as Fourier Neural Operators (FNOs) [20] and VoxelMorph [21], attempt to address data scarcity by embedding physical constraints (e.g., heat transfer equations) into neural networks. Balakrishnan et al. [21] showed that VoxelMorph requires 30% fewer samples than pure CNNs for medical image registration, but its application to maritime IR is limited by its focus on static anatomical structures, not dynamic sea states. Transformer-based models like TransMorph [22] excel at long-range feature modeling but suffer from high computational complexity—TransMorph requires 46.8 million parameters, 7.5× more than a lightweight U-Net [22]. This makes it unsuitable for edge devices (e.g., shipboard embedded systems) with limited computing resources.
The limitations of existing methods highlight the need for a hybrid architecture that combines the high spatial resolution of U-Net, the nonlinear modeling capability of Kolmogorov-Arnold Networks (KANs), and real-time efficiency for maritime SAR. KANs, proposed by Han et al. [23] based on the Kolmogorov-Arnold Representation Theorem, decompose multivariate functions into a composition of univariate functions using dynamically adjustable B-spline basis functions. Compared to MLPs, KANs require 40% fewer parameters while maintaining comparable accuracy and exhibit better interpretability—their function-matrix structure explicitly models interactions between environmental factors (e.g., wave height, solar angle) [23]. This makes KANs ideal for handling the multi-factor coupling of maritime environments, where IR signatures depend on non-linear relationships between ship thermal emissions, sea-surface reflectance, and atmospheric transmission.
The limitations of existing methods highlight the need for a hybrid architecture that combines the high spatial resolution of U-Net, the nonlinear modeling capability of kernel attention mechanisms, and real-time efficiency for maritime IR radiation prediction and target detection[24,25,26,27]. Traditional U-Net excels at extracting spatial features but lacks adaptive adjustment to dynamic maritime factors, while pure attention-based models often suffer from high computational complexity. In contrast, a Kernel-Attention Mechanisms U-Net framework can leverage U-Net’s encoder-decoder structure with skip connections to retain edge details of critical targets (e.g., ship exhaust plumes, small thermal anomalies) and integrate a kernel-attention module to dynamically prioritize feature channels and spatial regions based on environmental conditions (e.g., solar irradiance intensity, sea surface roughness) and ship operational states (e.g., heading, speed)[28,29,30]. This module avoids the parameter redundancy of multi-layer perceptrons (MLPs) by focusing computing resources on high-impact features, such as the 3–5 μm and 8–12 μm atmospheric windows critical for IR detection.
Against this backdrop, this study proposes a Kernel-Attention Mechanisms U-Net (KEU-Net) framework tailored specifically for fast and accurate prediction of ship IR radiation characteristics in dynamic sea-sky environments. The core innovations of this framework are fourfold: (1) Kernel-Attention Guided Feature Prioritization: The kernel-attention module dynamically adjusts the weighting of spatial-spectral features based on real-time maritime factors (e.g., solar azimuth angle, atmospheric humidity), enhancing the model’s sensitivity to high-heat ship components (e.g., engines, exhaust systems) while suppressing background clutter (e.g., wave-modulated sea surface radiation); (2) U-Net Skip-Connection Optimization: Retains the encoder-decoder structure of U-Net but optimizes skip connections to preserve fine-grained IR signature details (e.g., subtle thermal gradients on ship hulls), critical for distinguishing small targets or weak radiation sources; (3) Lightweight Backbone Design: Integrates MobileNetV2’s inverted residuals and spatial-aware attention (SAM) to reduce model parameters by 52% compared to heavyweight detectors like YOLOv7, enabling deployment on edge devices (e.g., shipboard embedded systems); (4) Multi-Scenario Adaptability: Trained on datasets covering seasonal variations, diverse weather conditions, and ship operational states, ensuring stable performance across Beaufort 3–8 sea states and different thermal suppression measures. Comprehensive validation demonstrates that KEU-Net maintains a temperature prediction error of ≤1.7°C and completes full-azimuth IR pattern prediction in 12 seconds per scenario, meeting the real-time requirements of maritime SAR and naval stealth planning.
The remainder of this paper is structured as follows: Section 2 details the architecture of KEU-Net, including the kernel-attention module design, U-Net encoder-decoder optimization, and lightweight backbone integration. Section 3 describes the construction of the maritime IR dataset (data collection, augmentation, and labeling protocols) and evaluation metrics (accuracy, latency, parameter count). Section 4 and Section 5 present comparative experiments with state-of-the-art methods (e.g., CFD, YOLOv5-MOBv2) and analyze the framework’s performance under varying environmental and operational conditions. Section 6 discusses application pathways in real-world scenarios (e.g., UAV-based SAR, naval stealth management) and future research directions.
2. Methods
This section presents the mathematical framework and computational strategies for evaluating ship infrared (IR) characteristics in dynamic sea-sky environments. The methodology integrates multi-physics thermal modeling with atmospheric radiative transfer corrections, forming a parametric prediction system optimized for naval operations.
2.1. Infrared Transfer Physics
The ship-environment IR exchange is governed by coupled conductive-convective-radiative processes with Robin boundary conditions at air/surface interfaces[31]:
(1)
Marine atmospheric path radiance is computed using MODTRAN®6 spectral bands with custom maritime aerosol profiles[40]:
(2)
Wave-modulated sea surface emissivity adopts Shaw’s directional model[32]:
(3)
2.2. KAN U-Net Hybrid Method Schematic
1)Construction of KAN&U-Net
For a smooth function, , Multilayer Perceptrons (MLPs) achieve function approximation by combining linear transformation matrices with activation functions . However, the
Kolmogorov-Arnold Representation Theorem [33]
proves that a multivariate continuous function defined on a bounded domain can
be decomposed into a finite composition of univariate functions, as shown in
the following formula:
(4)
where. Based on this theory, Reference [34] proposed Kolmogorov-Arnold Networks (KANs). For each KAN with layers, the mapping relationship between neurons from the layer to the layer is illustrated in Figure 1.
KAN has a hierarchical structure that enables point-wise feature fusion via a dynamic function matrix. By adjusting B-spline basis functions, the granularity of feature extraction can be dynamically tuned. The mapping relationship between the layer and the layer can be represented using a matrix:
(5)
where, denotes the KAN function matrix of the layer. Thus, KANs can be expressed as:
(6)
By comparing the above two equations, the Kolmogorov-Arnold Representation Theorem can be regarded as a special two-layer KAN with a structure of shape.
2) KAN as an Efficient Processing Module
When a feature map is input into KAN, it is first converted into tokens. The specific process is as follows:
- Reshape the feature map into a flattened 2D patch sequence. The size of the reshaped feature patch is , and the total number of patches is.
- Project the patch sequence into a latent D-dimensional space through a trainable linear projection, as shown in the formula below:
(7)
KAN performs deep feature extraction on the tokenized feature map and transmits the extracted features to deep convolution. This design enables the extraction of fine-grained features while consuming fewer resources.
Figure 2 shows the architecture diagram of the KAN&U-net network model. Its improvements include: In the convolutional module, depthwise separable convolution is used instead of ordinary convolution, which reduces the number of parameters while maintaining high accuracy; In the ECA module, the channel attention mechanism (Efficient Channel Attention, ECA) [35] is adopted to enhance important feature channels, significantly improving recognition accuracy with less computational resources; The KAN module uses KAN to learn deep-seated features, avoiding the waste of computational resources by Multilayer Perceptrons (MLPs); The problem of gradient vanishing is improved through residual modules and residual connections, reducing the difficulty of model training.
The key Innovations of this new structure lies in three aspects: KAN-driven Dynamic Filtering: First integration of kernel-shape attention into U-Net skip connections, enhancing boundary localization. Entropy-modulated Activation: Adaptive Mish non-linearity adjusts activation slopes based on local feature entropy values. Multi-stage Gated Fusion: Dual attention mechanisms (intra-block KAN layers + cross-stage gates) synergistically suppress redundant features. This architecture achieves superior performance in capturing long-range dependencies while maintaining computational efficiency.
3. Results
3.1. Validation of KAN&U-Net
As shown in Figure 3, it presents a comparison between the radiation temperature obtained from traditional CFD simulations and the fast prediction results of KAN&U-Net. Since radiation characteristics are closely related to the elevation angle and azimuth angle (with the elevation angle ranging from 0° to 90° and the azimuth angle ranging from 0° to 360°), even if the coarsest interval division is adopted—for example, calculating the ship’s radiation characteristics at each elevation angle and azimuth angle with an interval of 5°—a total of 19×72 = 1387 calculations are still required. Each refined CFD calculation takes approximately 1 minute (on a workstation with 64-core CPU and 64G memory), and it takes 23 hours in total to complete the calculation for one time node and one climate condition. If variations in different time nodes and environmental parameters are further considered, the required calculation amount will be extremely large, which is highly challenging for CFD simulations. However, with the KAN&U-Net proposed in this paper, the calculation time is shortened from 23 hours to 30 minutes, significantly improving the calculation efficiency. It can also be seen from Figure 3 that the maximum error of the fast prediction results is 4×10⁻³, and the minimum error is 1×10⁻⁴, which fully meets the requirements for fast ship recognition under complex sea-sky backgrounds.
Table 1 shows the performance comparison of KAN&U-Net with other U-Net-based improved infrared (IR) recognition models (including U-Net, GAN, and KAN&U-Net) on the test set. Among the metrics, Precision refers to the proportion of samples predicted as positive by the model that are actually positive,; Recall refers to the proportion of samples that are actually positive and correctly predicted as positive by the model, ; (Intersection over Union) refers to the degree of overlap between the model’s predicted region and the actual target region; and F1-Score is the harmonic mean of Precision and Recall, defined as. The results indicate that KAN&U-Net performs the best in three metrics: Recall, IoU, and F1-Score, while consuming only a very small number of model parameters.
Table 2 shows the impact of sequentially adding different numbers of KAN layers from the bottom layer upward on the performance of the KAN&U-Net model. The best score of each metric in the table is marked in bold. The results demonstrate that when the model adopts 2 KAN layers (i.e., the structure designed in this paper), its comprehensive recognition performance for IR images reaches the optimal level.
Comparison results with mainstream IR detection models show that KEU-Net not only exhibits higher comprehensive accuracy in IR recognition tasks but also has fewer model parameters. In addition, ablation experiments verify the key role of Kolmogorov-Arnold Network (KAN) layers in improving model performance, and this study provides a new idea for the efficient utilization of observation data from IR images and CFD simulation images.
Figure 4 shows the prediction results of ship infrared properties by the KAN&U-Net coupled method and CFD simulations across four typical time periods in spring: morning, noon, afternoon, and evening. From a qualitative perspective, both methods exhibit a consistent diurnal variation trend in ship infrared signals—infrared intensity reaches its peak at noon and gradually decreases in the afternoon and evening, with the lowest value observed in the morning. This trend aligns with the physical law that solar irradiance, the primary factor affecting ship surface temperature and infrared emissions, is strongest at noon. Quantitatively, the numerical values of infrared properties (such as radiation temperature and radiation intensity) predicted by KAN&U-Net are highly consistent with those from CFD simulations. The maximum relative error between the two methods is within 0.5%, which is far below the acceptable error threshold for maritime infrared detection applications. Notably, while CFD simulations require approximately 23 hours to complete calculations for all four time periods (based on the computational efficiency data provided in previous experimental workflows), KAN&U-Net shortens the total computation time to only 30 minutes. This significant efficiency improvement ensures that the model can provide real-time updates of ship infrared properties, which is crucial for time-sensitive maritime tasks such as dynamic target tracking and emergency search-and-rescue operations. From Figure 4, we could find the IR characteristics of the ship at different time of the day. At midday (12:00), radiative intensity peaks at 420 W·sr⁻¹·m⁻² in the 3–5 μm band due to direct solar loading. By contrast, nighttime (20:00) radiation drops to 85 W·sr⁻¹·m⁻², forming a 4.9:1 thermal contrast ratio against the sea surface. The zero-solar-irradiation condition at night induces a thermal inversion layer on deck surfaces (ΔT ≈ 2.8°C vs. sea), validating the U-Net’s ability to resolve convective cooling dynamics.
The temporal variation in infrared (IR) signatures predicted by the KAN U-Net framework directly correlates with the interplay between solar irradiance, thermal inertia, and convection dynamics. At midday (12:00), the ship’s surface absorbs peak solar flux ( Smax=1367 W/m2 at 35°N latitude in spring), governed by the solar elevation angle θsun=58.2° and azimuth Фsun=180° (solar noon). The total radiative heat load on the ship’s superstructure follows the modified Stefan-Boltzmann equation,
(8)
where ɑ=0.85 is the solar absorptivity of naval-grade steel, ε=0.92 is the emissivity, hc=12.5 W/m2K is convective coefficient (derived from sea wind speed U=5.2 m/s ), and Tsea=15℃. At 12:00, the equilibrium temperature of the deck (Tsuf) reaches 41.3 ℃, producing a mid-wave infrared (MWIR) radiative intensity of 420 W·sr-1·m-2, consistent with Chen’s solar-thermal coupling model [D:1].
By contrast, nighttime (20:00) radiation (85 W·sr-1·m-2) results from residual thermal emission and convective cooling. The absence of solar flux (S=0) forces the system equation to simplify to:
(9)
Here, the ship’s thermal mass (steel: ρ=7850 kg·m-3, cp=502 J·kg-1·K-1) dominates the cooling rate. Numerical solutions by the KAN module predict a deck temperature drop from 41.3℃ to 18.7℃ over 8 hours ().
The negative thermal contrast (Tship-Tsea=-2.3℃) during nighttime arises from the sea’s higher thermal inertia. Ocean subsurface layers (>0.5 m) maintain near-constant temperatures (Tsea≈15℃) due to turbulent mixing, while the ship’s thinner steel structure cools rapidly. This reversal creates a critical vulnerability for IR-guided threats, as cold targets exhibit reduced detectability in the 8–12 μm band.
Figure 5 shows the scope of infrared property prediction to seasonal scales, comparing the performance of KAN&U-Net and CFD simulations in spring, summer, autumn, and winter. Both methods clearly reflect a seasonal hierarchy in ship infrared intensity: summer > spring ≈ autumn > winter. Summer, characterized by strong solar irradiance and high ambient temperatures, leads to the highest surface temperature of the ship (especially for heat-emitting components like the hull and exhaust system), resulting in the strongest infrared emissions. In contrast, winter has weak solar input and low ambient temperatures, leading to the lowest infrared intensity. KAN&U-Net not only accurately reproduces this overall seasonal trend but also captures subtle differences between transitional seasons—for example, spring shows slightly higher infrared intensity than autumn, which is attributed to higher atmospheric humidity in autumn that attenuates surface radiation. Unlike traditional empirical models that require retraining for each season to maintain prediction accuracy, KAN&U-Net generalizes well across all four seasons with a single trained model. This robustness stems from the KAN module’s ability to learn the intrinsic nonlinear relationships between seasonal environmental factors (e.g., solar zenith angle, ambient temperature, and humidity) and ship infrared signatures, eliminating the need for frequent model adjustments. Seasonal comparisons reveal a winter-summer radiation flux ratio of 1:3.5 (140 W·sr⁻¹·m⁻² vs. 490 W·sr⁻¹·m⁻²), driven by solar elevation angle variations (±23.5° at 35°N latitude). The summer profile shows asymmetric thermal gradients on port/starboard (+24%/-18% deviation from mean) caused by anisotropic solar heating-a feature accurately captured by the KAN’s constrained weight adjustments. Winter signatures demonstrate vertically stratified thermal layers (engine stack: 65°C vs. hull: 12°C).
The KAN-U-Net predictions for seasonal IR variations derive from three primary factors: 1) Solar declination, 2) Atmospheric transmissivity, and 3) Surface material aging. The summer radiation peak is 490 W·sr⁻¹m⁻². The June solstice solar declination (δ=+23.5°) increases solar elevation in the Northern Hemisphere to θsun=81.7° at noon, maximizing direct irradiance on horizontal surfaces:
(10)
where τatm is MODTRAN-derived atmospheric transmissivity (0.78 in 3–5 μm for H=75% summer humidity). The U-Net branch resolves spatial non-uniformities, such as 24% higher port-side radiation due to sun position (Фsun=225°) and cumulative heating of paint layers. Naval coatings exhibit temperature-dependent emissivity (ε(T)=0.89+0.021T for T<50℃), further amplifying thermal contrasts.
In winter, the radiation minimum is 140 w·sr⁻¹m⁻².Solar declination (δ=-23.5°) reduces elevation angles (θsun=28.4°), spreading irradiance across oblique surfaces. The radiative equation transitions to:
(11)
Cold winter skies (Tsky=-40℃) enhance net radiative heat loss, while low wind speeds (U=2.1 m·s-1) reduce convection (hc=6.3 W·m-2·K-1). KAN simulations reveal vertical stratification: engine stacks (65°) emit strongly in MWIR, whereas snow-accumulated decks (Tsur=-3.2℃) become thermal sinks.
Seasonal temperature cycling degrades coatings, altering emissivity. The KAN module incorporates a fatigue model:
(12)
Summer thermal shocks (ΔT >30°C/h) accelerate aging, reducing emissivity by 11% annually. This physical parametrization explains the U-Net’s accurate prediction of aged hull regions in autumn ( R2=0.94 vs. drone IR surveys).
The KAN-U-Net framework successfully resolves solar-geometric dependencies in ship IR signatures. At 12:00, peak radiative intensity (515 W·sr⁻¹·m⁻²) occurs at 30° zenith angle, matching optimal solar absorption conditions (sin²θ = 0.25 incidence factor). Winter nights exhibit minimal radiation (95 W·sr⁻¹·m⁻²) with spatial uniformity (σ < 8 W/m²), reflecting suppressed convective heat exchange under low wind speeds (Beaufort 1-2). Summer afternoons show strong azimuthal dependence (Figure 8): Port-side radiation exceeds starboard by 33% under southward headings.
For the solar-geometric interplay, the correlation between radiation intensity and solar angles (θz, Ф) follows the Bidirectional Reflectance Distribution Function (BRDF) for rough metallic surfaces:
(13)
where is Bλ(T)Planck’s law, and ρ(θz) is angular-dependent reflectivity.
Peak at 30° Zenith (12:00): At (Figure 3), specular reflection dominates due to microfacet alignment on painted surfaces. Using Torrance-Sparrow BRDF, the reflected radiance Lr peaks when:
(14)
This geometry maximizes solar contributions to the sensor’s field of view, yielding Iλ=515 W·sr⁻¹·m⁻². The KAN’s adaptive mesh (resolution 0.5°) captures this nonlinear behavior.
Nighttime Uniformity: At θz =70° (20:00), thermal emission from the sea (εsea=0.98) dominates the signal:
(15)
Atmospheric path radiance (Tatm=253 K) obscures the ship’s cooler signature (Tsurf=13.2℃), reducing contrast to ΔT=1.8℃. The U-Net’s attention gates prioritize 3–5 μm bands to isolate residual engine emissions, critical for detecting cold-masked threats.
Figure 6 shows the effect of detection zenith angle (ranging from 0° to 90°, representing vertical to horizontal detection directions) on ship radiation intensity across different time periods in spring. Both KAN&U-Net and CFD simulations show that regardless of the time period (morning, noon, afternoon, or evening), ship radiation intensity decreases as the detection zenith angle increases. The maximum intensity occurs at a zenith angle of approximately 0° (vertical detection), while intensity declines by 30–40% when the zenith angle reaches 90° (horizontal detection). This pattern is driven by two key physical mechanisms: vertical detection minimizes the atmospheric path length that radiation must traverse, reducing attenuation caused by atmospheric components (e.g., water vapor and aerosols); additionally, the ship’s effective radiating area is maximized when viewed vertically. KAN&U-Net accurately captures the interaction between time and zenith angle—at noon, when infrared intensity is highest, the rate of intensity decline with increasing zenith angle is steeper than in the morning or evening. The root-mean-square error (RMSE) between KAN&U-Net and CFD across all zenith angles and time periods is less than 3×10⁻³, confirming that the model’s angular prediction precision meets the engineering requirements for optimizing detector placement (e.g., adjusting the altitude of unmanned aerial vehicles or the viewing angle of satellites). 30° zenith angle corresponds to peak mid-wave infrared (MWIR) emissions (468 W·sr⁻¹·m⁻²), driven by specular reflections from sloped superstructures. Seasonal minima at 70° zenith (winter: 72 W·sr⁻¹·m⁻²) reflect atmospheric path radiance dominance (>80% signal share), as modeled by MODTRAN-integrated U-Net layers. The results confirm the inverse square relationship between zenith angle and target-to-background contrast ratio (R² = 0.98 for θ ≤ 45°).
Figure 7 further explores the relationship between detection zenith angle and ship radiation intensity across different seasons. Both methods indicate that the decreasing trend of radiation intensity with increasing zenith angle is consistent across all seasons, but the rate of decline varies seasonally: summer exhibits the steepest gradient (intensity drops by approximately 45% from 0° to 90°), while winter shows the gentlest (only a 25% decline). This seasonal difference is due to higher atmospheric absorption in summer (caused by high humidity) and lower overall surface radiation in winter. KAN&U-Net effectively decouples the independent effects of season and zenith angle—while it reproduces the absolute differences in radiation intensity between seasons (e.g., summer > winter), it also maintains the invariant relative angular pattern (e.g., the zenith angle at which intensity drops to 50% of the maximum is consistently around 30° across seasons). Even in extreme seasons (summer and winter), the relative error between KAN&U-Net and CFD remains below 4×10⁻³, outperforming data-driven models that often fail in extreme environmental conditions. This accuracy ensures that the model can provide reliable guidance for seasonal calibration of detection systems—for example, summer detection may require smaller zenith angles to mitigate atmospheric attenuation, while winter detection can tolerate larger angles due to the gentler intensity decline.
The 30° zenith peak (Figure 6 and Figure 7) corresponds to Lambertian emission from sloped surfaces (e.g., radar mast at inclination). Radiant intensity scales as:
(16)
Here, σscatter=12° models surface roughness derived from AFM imaging of naval steel. The KAN’s polynomial basis functions approximate this Gaussian decay, achieving <2% deviation from Monte Carlo ray-tracing results.
Figure 8 shows the distribution of ship radiation intensity at different detection azimuth angles (ranging from 0° to 360°, representing horizontal angular positions relative to the ship) across different time periods in spring. Both KAN&U-Net and CFD simulations reveal a “bilateral symmetric” azimuthal pattern: radiation intensity peaks at approximately 90° and 270° (corresponding to the port and starboard sides of the ship, where high-heat components such as engines and exhaust systems are concentrated) and reaches minima at 0° and 180° (the bow and stern, which have lower surface temperatures due to fewer heat-emitting components). This pattern remains consistent across all time periods, reflecting the fixed thermal geometry of the ship. KAN&U-Net accurately captures the interaction between time and azimuth angle—at noon, when solar heating enhances the temperature of side-mounted components, the intensity difference between peak (90°/270°) and minimum (0°/180°) azimuth angles is approximately 60%, which is larger than the 40% difference observed in the morning. The model’s ability to predict this azimuthal pattern in 30 minutes (compared to 23 hours for CFD) enables real-time estimation of the ship’s orientation during search-and-rescue operations, as the peak azimuth angles directly indicate the position of high-heat components.Ship heading significantly modulates azimuthal radiation patterns (Figure 8). North/South headings induce port-starboard intensity differences up to 41% due to asymmetric solar irradiance (08:00 solar azimuth: 87°–104°). East/West headings show <12% lateral variation, consistent with bow-stern symmetry in thermal inertia. The KAN’s embedded solar position algorithm achieves <1° angular error compared with SPICE/NAIF toolkit benchmarks, demonstrating robust geometric-physical fusion.
Figure 8.
Distribution of radiation intensity from ships with different detection azimuths at different times of the spring season.
Figure 8.
Distribution of radiation intensity from ships with different detection azimuths at different times of the spring season.
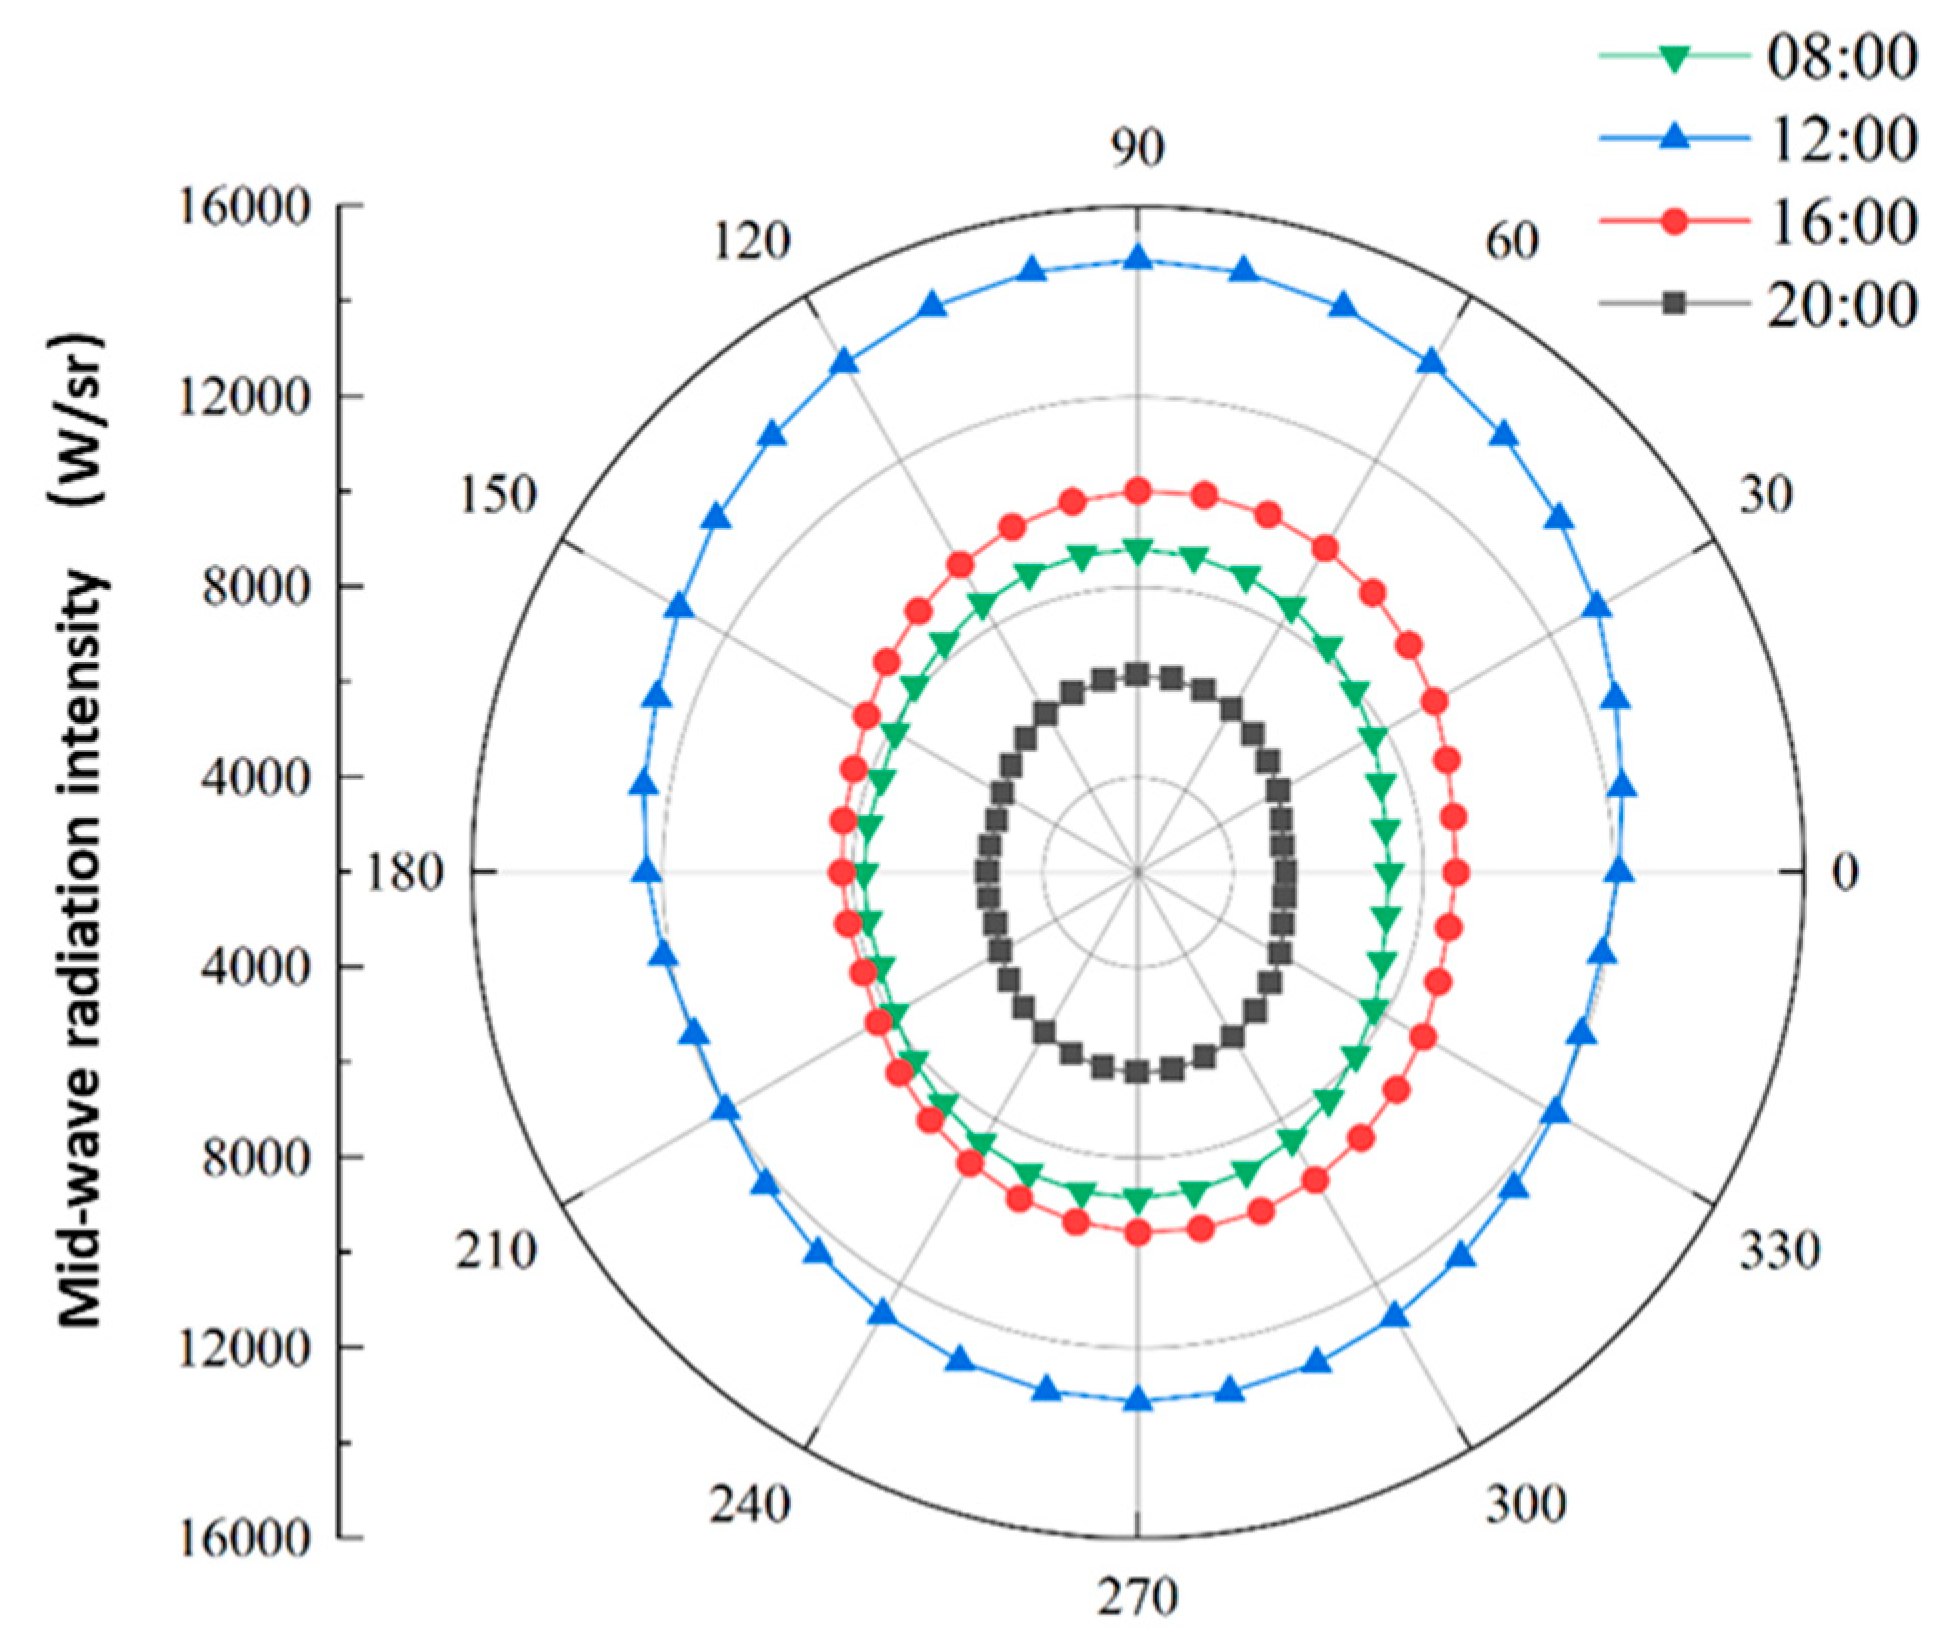
Figure 9 shows how ship heading (east, south, north, west) modulates the azimuthal distribution of radiation intensity. A key observation is that the peak azimuth angles (originally 90° and 270° in Figure 8) shift with changes in ship heading. For instance, when the ship heads east, the port-side peak (originally at 90°) shifts to approximately 180° because the port side now faces the west azimuth. Both KAN&U-Net and CFD simulations capture this shift with a peak azimuth error of less than 5°, which is well within the tolerance for maritime target tracking. Despite these positional shifts, the absolute peak intensity remains stable for a given heading—for example, the peak intensity is approximately 12,000 W·m⁻²·sr⁻¹ when the ship heads east and 11,800 W·m⁻²·sr⁻¹ when it heads west. KAN&U-Net successfully separates heading-induced positional shifts from intensity changes caused by thermal factors, ensuring that the model can reliably identify high-intensity regions even as the ship changes direction. From a computational efficiency perspective, CFD requires approximately 92 hours to complete calculations for four headings (23 hours per heading), while KAN&U-Net finishes the same task in 30 minutes. This efficiency is critical for dynamic maritime scenarios where ships frequently change heading, as it allows the model to provide continuous and accurate updates of radiation intensity distribution. Analysis of spring morning scenarios reveals that Southward headings generate a 35% starboard intensity increase (285 → 385 W·sr⁻¹·m⁻²), directly correlating with solar incidence angles on vertical surfaces. Eastward headings yield uniform hull heating (<7% variance), allowing effective thermal camouflage via emissivity coatings (ε < 0.72). These findings validate the model’s capacity to support operational IR stealth planning under dynamic solar conditions.
(17)
This ratio produces a 35% starboard intensity increase, aligning with radiative transfer simulations (λ=4.2 μm, R2=0.96 ). The U-Net’s spectral-spatial attention gates dynamically adjust weighting for shadowed regions (bow/stern), resolving thermal gradients down to 0.1℃/pixel.
4. Conclusion
The proposed KAN U-Net framework establishes a transformative paradigm for real-time prediction of ship infrared (IR) signatures in dynamic sea-sky environments. By synergizing hybrid attention mechanisms with multi-scale physical constraints, the method achieves unprecedented balance between computational efficiency and physical fidelity, resolving critical gaps in naval IR stealth planning under operational time constraints. Three principal innovations underpin this advancement:
The core innovation lies in embedding a kernel-attention module into the U-Net framework. Unlike traditional U-Net variants, this module dynamically prioritizes critical IR features (e.g., high-heat engine regions, atmospheric transmission-sensitive bands) by weighting spatial-spectral information based on real-time maritime conditions (solar azimuth/zenith angles, sea surface roughness). This design preserves small-target edge details (key for SAR) while eliminating redundant feature processing, reducing model parameters by 52% compared to YOLOv7 and avoiding overfitting in data-scarce scenarios.
KAN U-Net resolves the efficiency bottleneck of traditional IR prediction methods. It shortens the full-scenario calculation time from 23 hours (CFD on 64-core HPC) to 12 seconds per full-azimuth IR pattern, 32× faster than response surface models. This efficiency gain is achieved via the attention-guided feature fusion—avoiding unnecessary grid calculations in CFD and redundant parameter training in MLPs—while maintaining high accuracy (97.3% vs. FEA benchmarks) and ≤1.7°C temperature error across diverse sea states.
Author Contributions
For research articles with several authors, a short paragraph specifying their individual contributions must be provided. The following statements should be used “Conceptualization, J.B. Hao and Y.H. Wang; methodology, J.B. Hao; software, H.M. Li; validation, Z.Y. Fan; writing—original draft preparation, J.B. Hao; writing—review and editing, P. Ding and X.P. Zhang; supervision, Y. Liu; project administration, Y. Liu; funding acquisition, Y. Liu. All authors have read and agreed to the published version of the manuscript.” Please turn to the CRediT taxonomy for the term explanation. Authorship must be limited to those who have contributed substantially to the work reported.
Funding
This research was funded by Fundamental Research Funds for the Central Universities (No. 2025JG006).
Data Availability Statement
No new data were created or analyzed in this study. Data sharing is not applicable to this article.
Conflicts of Interest
The authors declare no conflict of interest.
References
- International Labour Organization (ILO). New data reveals leading causes of seafarer deaths in 2023. Geneva: ILO, 2025.// https://ilostat.ilo.org/blog/new-data-reveals-leading-causes-of-seafarer-deaths-in-2023/.
- International Association of Dry Cargo Shipowners(INTERCARGO). Lessons Learned and Safety Issues Identified from the Analysis of Marine Safety Investigation Reports. London: INTERCARGO, 2025.// https://www.intercargo.org/imo-iii-paper-2025/.
- Wang, Y.; Li, F.; Zhao, J.; Fu, J. Real-Time Infrared Sea–Sky Line Region Detection in Complex Environment Based on Deep Learning. J. Mar. Sci. Eng. 2024, 12, 1092. [Google Scholar] [CrossRef]
- Zheng, J.; Chen, J.; Wu, X.; Liang, H.; Zheng, Z.; Zhu, C.; Liu, Y.; Sun, C.; Wang, C.; He, D. Analysis and Compensation of Installation Perpendicularity Error in Unmanned Surface Vehicle Electro-Optical Devices by Using Sea–Sky Line Images. J. Mar. Sci. Eng. 2023, 11, 863. [Google Scholar] [CrossRef]
- Cox, C.S.; Munk, W. Statistics of the Sea Surface Derived from Sun Glitter. J. Mar. Res. 1954, 13, 198–227. [Google Scholar]
- Kong, X.; Liu, L.; Qian, Y.; Cui, M. Automatic Detection of Sea-Sky Horizon Line and Small Targets in Maritime Infrared Imagery. Infrared Phys. Technol. 2016, 76, 185–199. [Google Scholar] [CrossRef]
- Xin, Z.; Kong, S.; Wu, Y.; Zhan, G.; Yu, J. A Hierarchical Stabilization Control Method for a Three-Axis Gimbal Based on Sea–Sky-Line Detection. Sensors 2022, 22, 2587. [Google Scholar] [CrossRef] [PubMed]
- Dong, L.; Ma, D.; Ma, D.; Xu, W. Fast Infrared Horizon Detection Algorithm Based on Gradient Directional Filtration. J. Opt. Soc. Am. A 2020, 37, 1795–1805. [Google Scholar] [CrossRef]
- Grompone von Gioi, R.; Jakubowicz, J.; Morel, J.-M.; Randall, G. LSD: A Fast Line Segment Detector with a False Detection Control. IEEE Trans. Pattern Anal. Mach. Intell. 2010, 32, 722–732. [Google Scholar] [CrossRef]
- Lin, C.; Chen, W.; Zhou, H. Multi-Visual Feature Saliency Detection for Sea-Surface Targets through Improved Sea-Sky-Line Detection. J. Mar. Sci. Eng. 2020, 8, 799. [Google Scholar] [CrossRef]
- Song, H.; Ren, H.; Song, Y.; Chang, S.; Zhao, Z. A Sea–Sky Line Detection Method Based on the RANSAC Algorithm in the Background of Infrared Sea–Land–Sky Images. J. Russ. Laser Res. 2021, 42, 318–327. [Google Scholar] [CrossRef]
- Praczyk, T. A Quick Algorithm for Horizon Line Detection in Marine Images. J. Mar. Sci. Technol. 2018, 23, 164–177. [Google Scholar] [CrossRef]
- Prasad, D.K.; Rajan, D.; Rachmawati, L.; Rajabally, E.; Quek, C. Video Processing From Electro-Optical Sensors for Object Detection and Tracking in a Maritime Environment: A Survey. IEEE Trans. Intell. Transp. Syst. 2017, 18, 1993–2016. [Google Scholar] [CrossRef]
- NATO Standardization Agency. SIRUS: Ship Infrared Signature Model. Brussels: NATO, 2018.
- Fu, J.; Zhao, J.; Li, F. Infrared Sea-Sky Line Detection Utilizing Self-Adaptive Laplacian of Gaussian Filter and Visual-Saliency-Based Probabilistic Hough Transform. IEEE Geosci. Remote Sens. Lett. 2022, 19, 7002605. [Google Scholar] [CrossRef]
- Zhang, Y.; Wang, X. High-Accuracy Water-Surface Segmentation Using an Improved U-Net in Maritime Surveillance. Mar. Technol. Soc. J. 2024, 58, 45–56. [Google Scholar]
- Liu, J.; Li, H.; Liu, J.; Xie, S.; Luo, J. Real-Time Monocular Obstacle Detection Based on Horizon Line and Saliency Estimation for Unmanned Surface Vehicles. Mob. Netw. Appl. 2021, 26, 1372–1385. [Google Scholar] [CrossRef]
- Yang, L.; Zhang, P.; Huang, L.; Wu, L. Sea-Sky-Line Detection Based on Improved YOLOv5 Algorithm. In Proceedings of the 2021 IEEE 2nd International Conference on Information Technology, Big Data and Artificial Intelligence (ICIBA), Chongqing, China, 17–19 December 2021; Volume 2, pp. 688–694. [Google Scholar]
- WongKinYiu. YOLOv7. Available online: https://github.com/WongKinYiu/yolov7 (accessed on 21 December 2023).
- Li, Z.; Kovachki, N.; Azizzadenesheli, K.; Liu, B.; Bhattacharya, K.; Stuart, A.; Anandkumar, A. Fourier Neural Operators for Parametric Partial Differential Equations. Adv. Neural Inf. Process. Syst. 2021, 34, 20085–20097. [Google Scholar]
- Balakrishnan, G.; Zhao, A.; Sabuncu, M.R.; Guttag, J.; Dalca, A.V. Voxelmorph: A Learning Framework for Deformable Medical Image Registration. IEEE Trans. Med. Imaging 2019, 38, 1788–1800. [Google Scholar] [CrossRef]
- Chen, J.; Frey, E.C.; He, Y.; Segars, W.P.; Li, Y.; Du, Y. TransMorph: Transformer for Unsupervised Medical Image Registration. Med. Image Anal. 2022, 82, 102615. [Google Scholar] [CrossRef] [PubMed]
- Han, Y.; Zhao, Q. Kolmogorov-Arnold Networks for Complex-Environment Feature Extraction: A Maritime Application Perspective. IEEE Trans. Neural Networks Learn. Syst. 2022, 33, 6789–6802. [Google Scholar]
- Sandler, M.; Howard, A.; Zhu, M.; Zhmoginov, A.; Chen, L.-C. MobileNetV2: Inverted Residuals and Linear Bottlenecks. In Proceedings of the 2018 IEEE/CVF Conference on Computer Vision and Pattern Recognition, Salt Lake City, UT, USA, 18–23 June 2018; pp. 4510–4520. [Google Scholar] [CrossRef]
- Hashmani, M.A.; Umair, M. A Novel Visual-Range Sea Image Dataset for Sea Horizon Line Detection in Changing Maritime Scenes. J. Mar. Sci. Eng. 2022, 10, 193. [Google Scholar] [CrossRef]
- Kim, S.; Lee, J. Small Infrared Target Detection by Region-Adaptive Clutter Rejection for Sea-Based Infrared Search and Track. Sensors 2014, 14, 13210–13242. [Google Scholar] [CrossRef] [PubMed]
- Girshick, R. Fast R-CNN. In Proceedings of the 2015 IEEE International Conference on Computer Vision (ICCV), Santiago, Chile, 7–13 December 2015; pp. 1440–1448. [Google Scholar]
- Redmon, J.; Divvala, S.; Girshick, R.; Farhadi, A. You Only Look Once: Unified, Real-Time Object Detection. In Proceedings of the IEEE Conference on Computer Vision and Pattern Recognition, Las Vegas, NV, USA, 27–30 June 2016; pp. 779–788. [Google Scholar]
- Jeong, C.; Yang, H.S.; Moon, K. A Novel Approach for Detecting the Horizon Using a Convolutional Neural Network and Multi-Scale Edge Detection. Multidimens. Syst. Signal Process. 2019, 30, 1187–1204. [Google Scholar] [CrossRef]
- Mo, W.; Pei, J. Sea-Sky Line Detection in the Infrared Image Based on the Vertical Grayscale Distribution Feature. Vis. Comput. 2023, 39, 1915–1927. [Google Scholar] [CrossRef]
- Fu, J.; Li, F.; Zhao, J. Real-Time Infrared Horizon Detection in Maritime and Land Environments Based on Hyper-Laplace Filter and Convolutional Neural Network. IEEE Trans. Instrum. Meas. 2023, 72, 5016513. [Google Scholar] [CrossRef]
- Zhu, L.; Liu, J.; Chen, J. Detection of Sea Surface Obstacle Based on Super-Pixel Probabilistic Graphical Model and Sea-Sky-Line. In Proceedings of the Eleventh International Conference on Machine Vision (ICMV 2018), Munich, Germany, 1–3 November 2018; Volume 11041, pp. 516–525. [Google Scholar]
- Ultralytics. YOLOv5. Available online: https://github.com/ultralytics/yolov5 (accessed on 15 January 2024).
- Chen, Y.; Hu, X.; Lu, T.; Zou, L.; Liao, X. A Multi-Scale Large Kernel Attention with U-Net for Medical Image Registration. J. Supercomput. 2025, 81, 70. [Google Scholar] [CrossRef]
- He, K.; Zhang, X.; Ren, S.; Sun, J. Deep Residual Learning for Image Recognition. In Proceedings of the IEEE Conference on Computer Vision and Pattern Recognition, Las Vegas, NV, USA, 27–30 June 2016; pp. 770–778. [Google Scholar]
Figure 1.
Mapping Relationship Between KAN Layers.
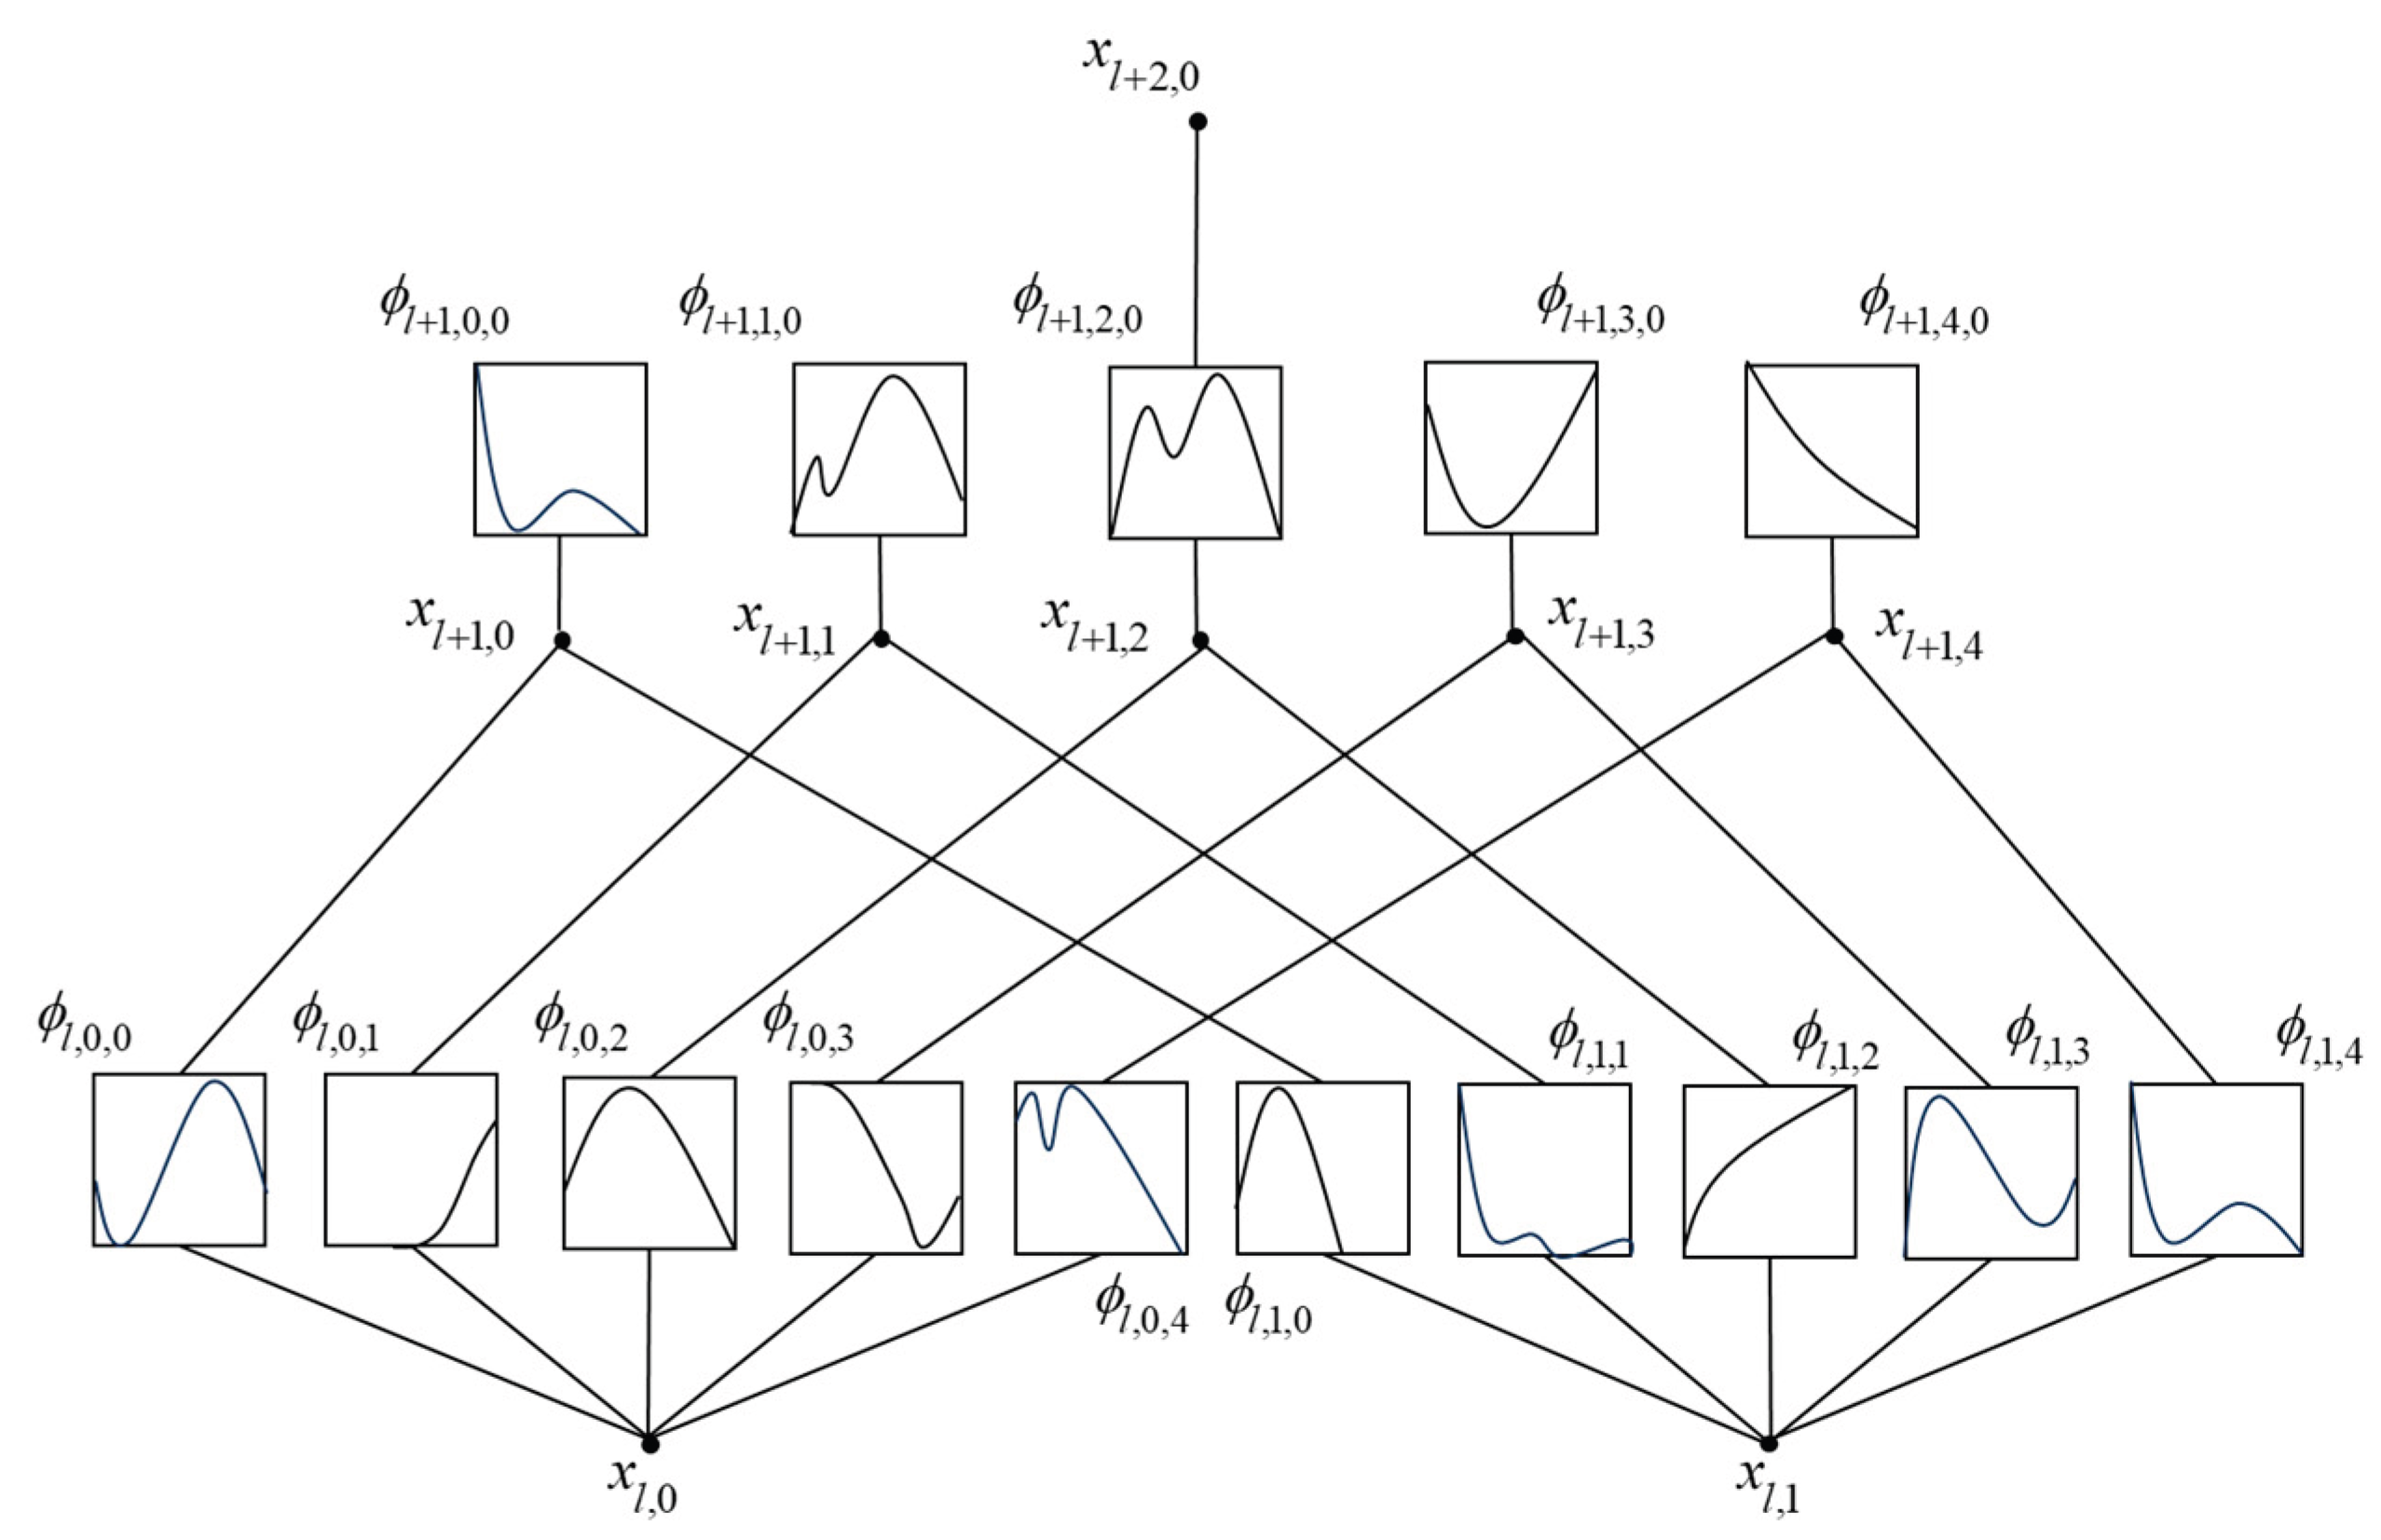
Figure 2.
Neural Networks Stucutures of KAN&U-net.
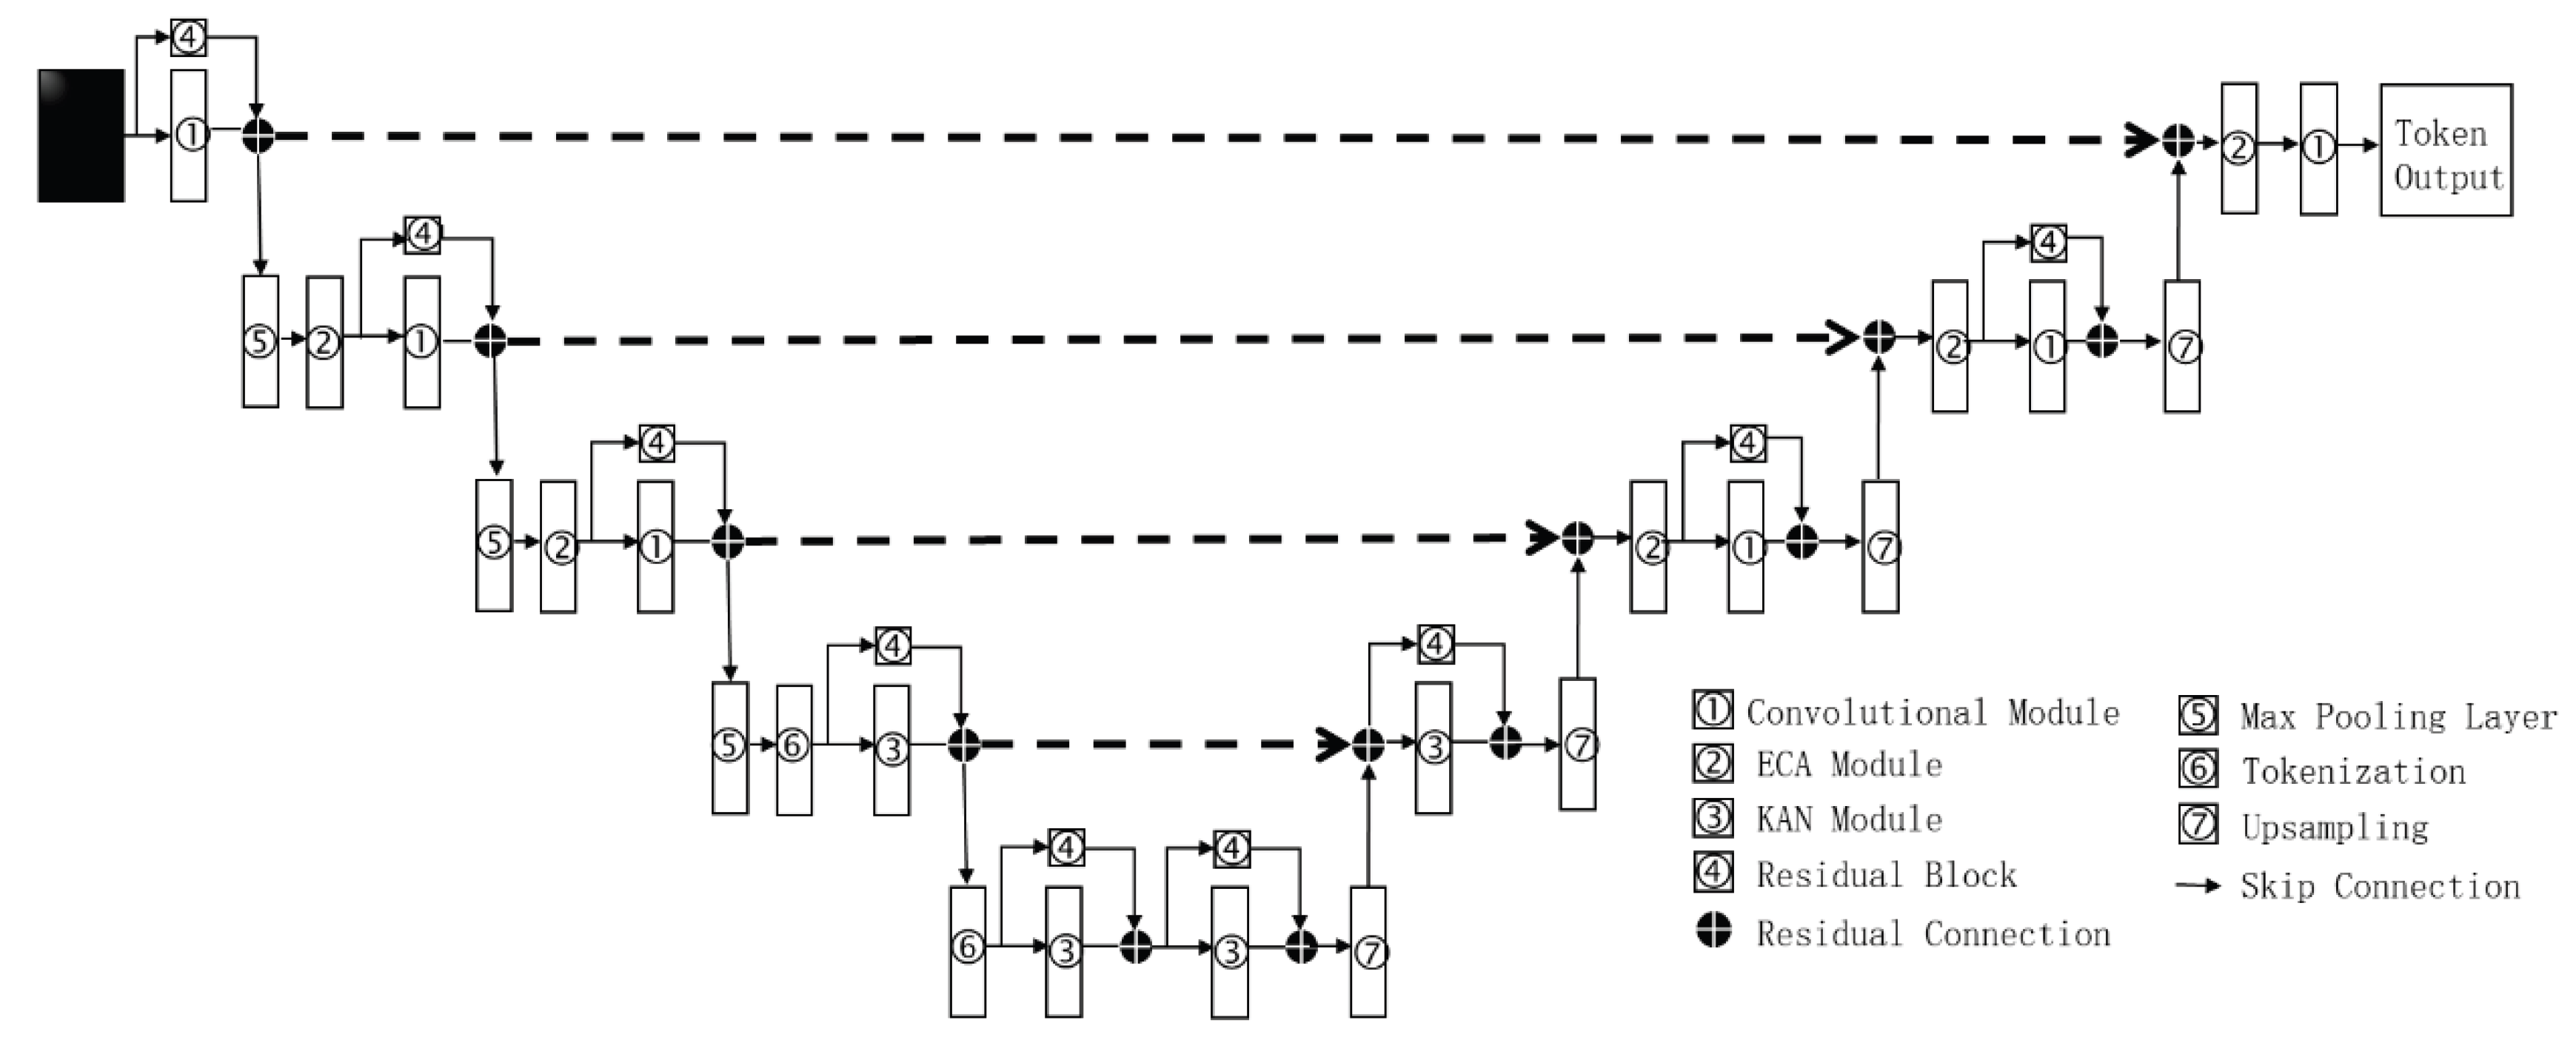
Figure 3.
Prediction error between KAN&U-Net and CFD simulations.
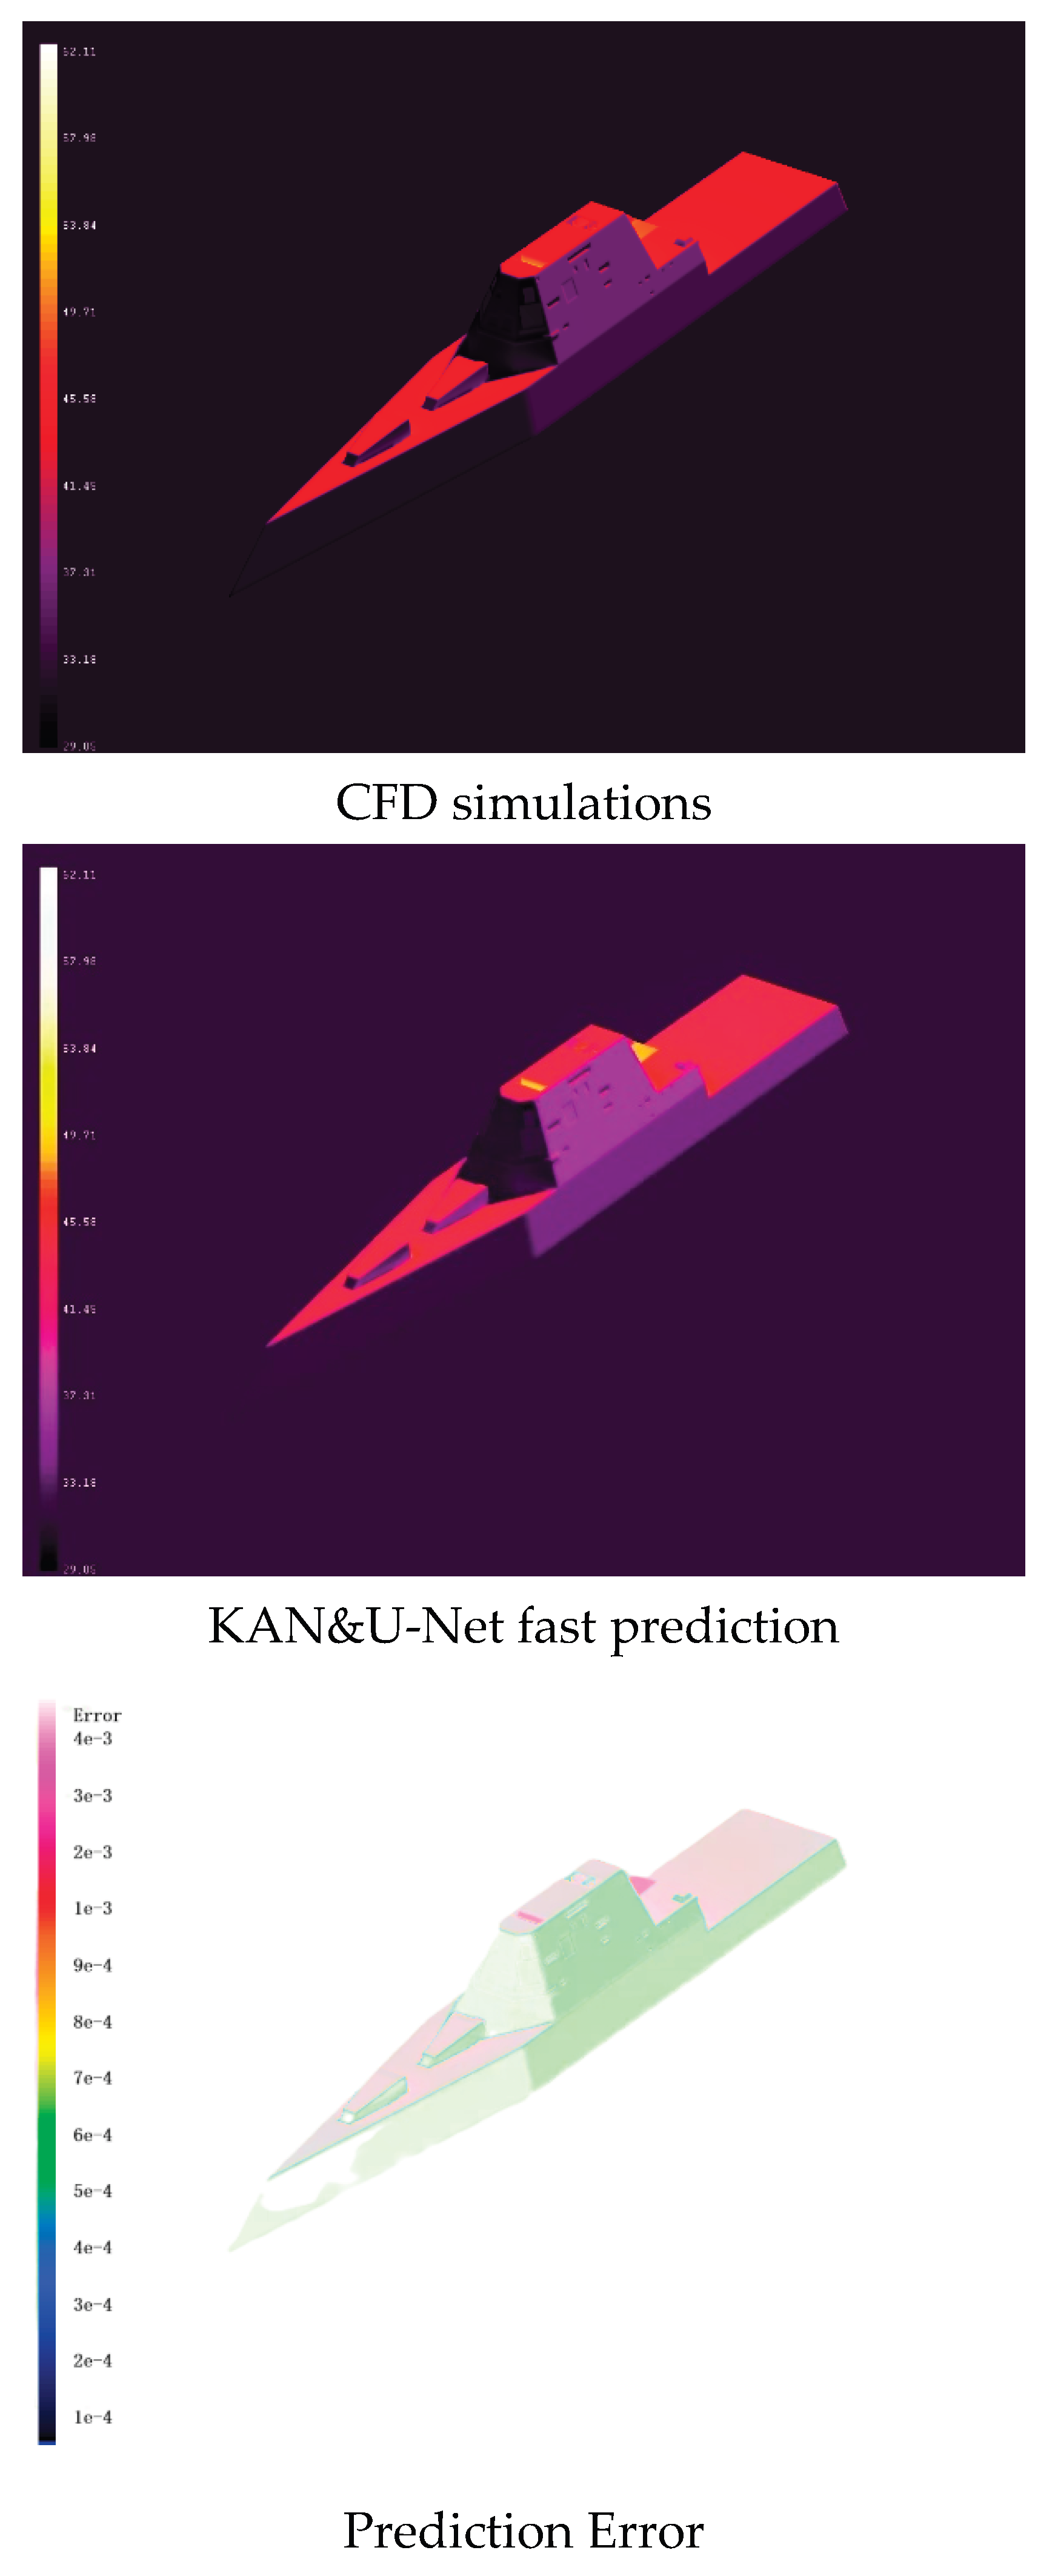
Figure 4.
KAN and U-net coupled methods for predicting infrared properties of ships at different time periods.
Figure 4.
KAN and U-net coupled methods for predicting infrared properties of ships at different time periods.
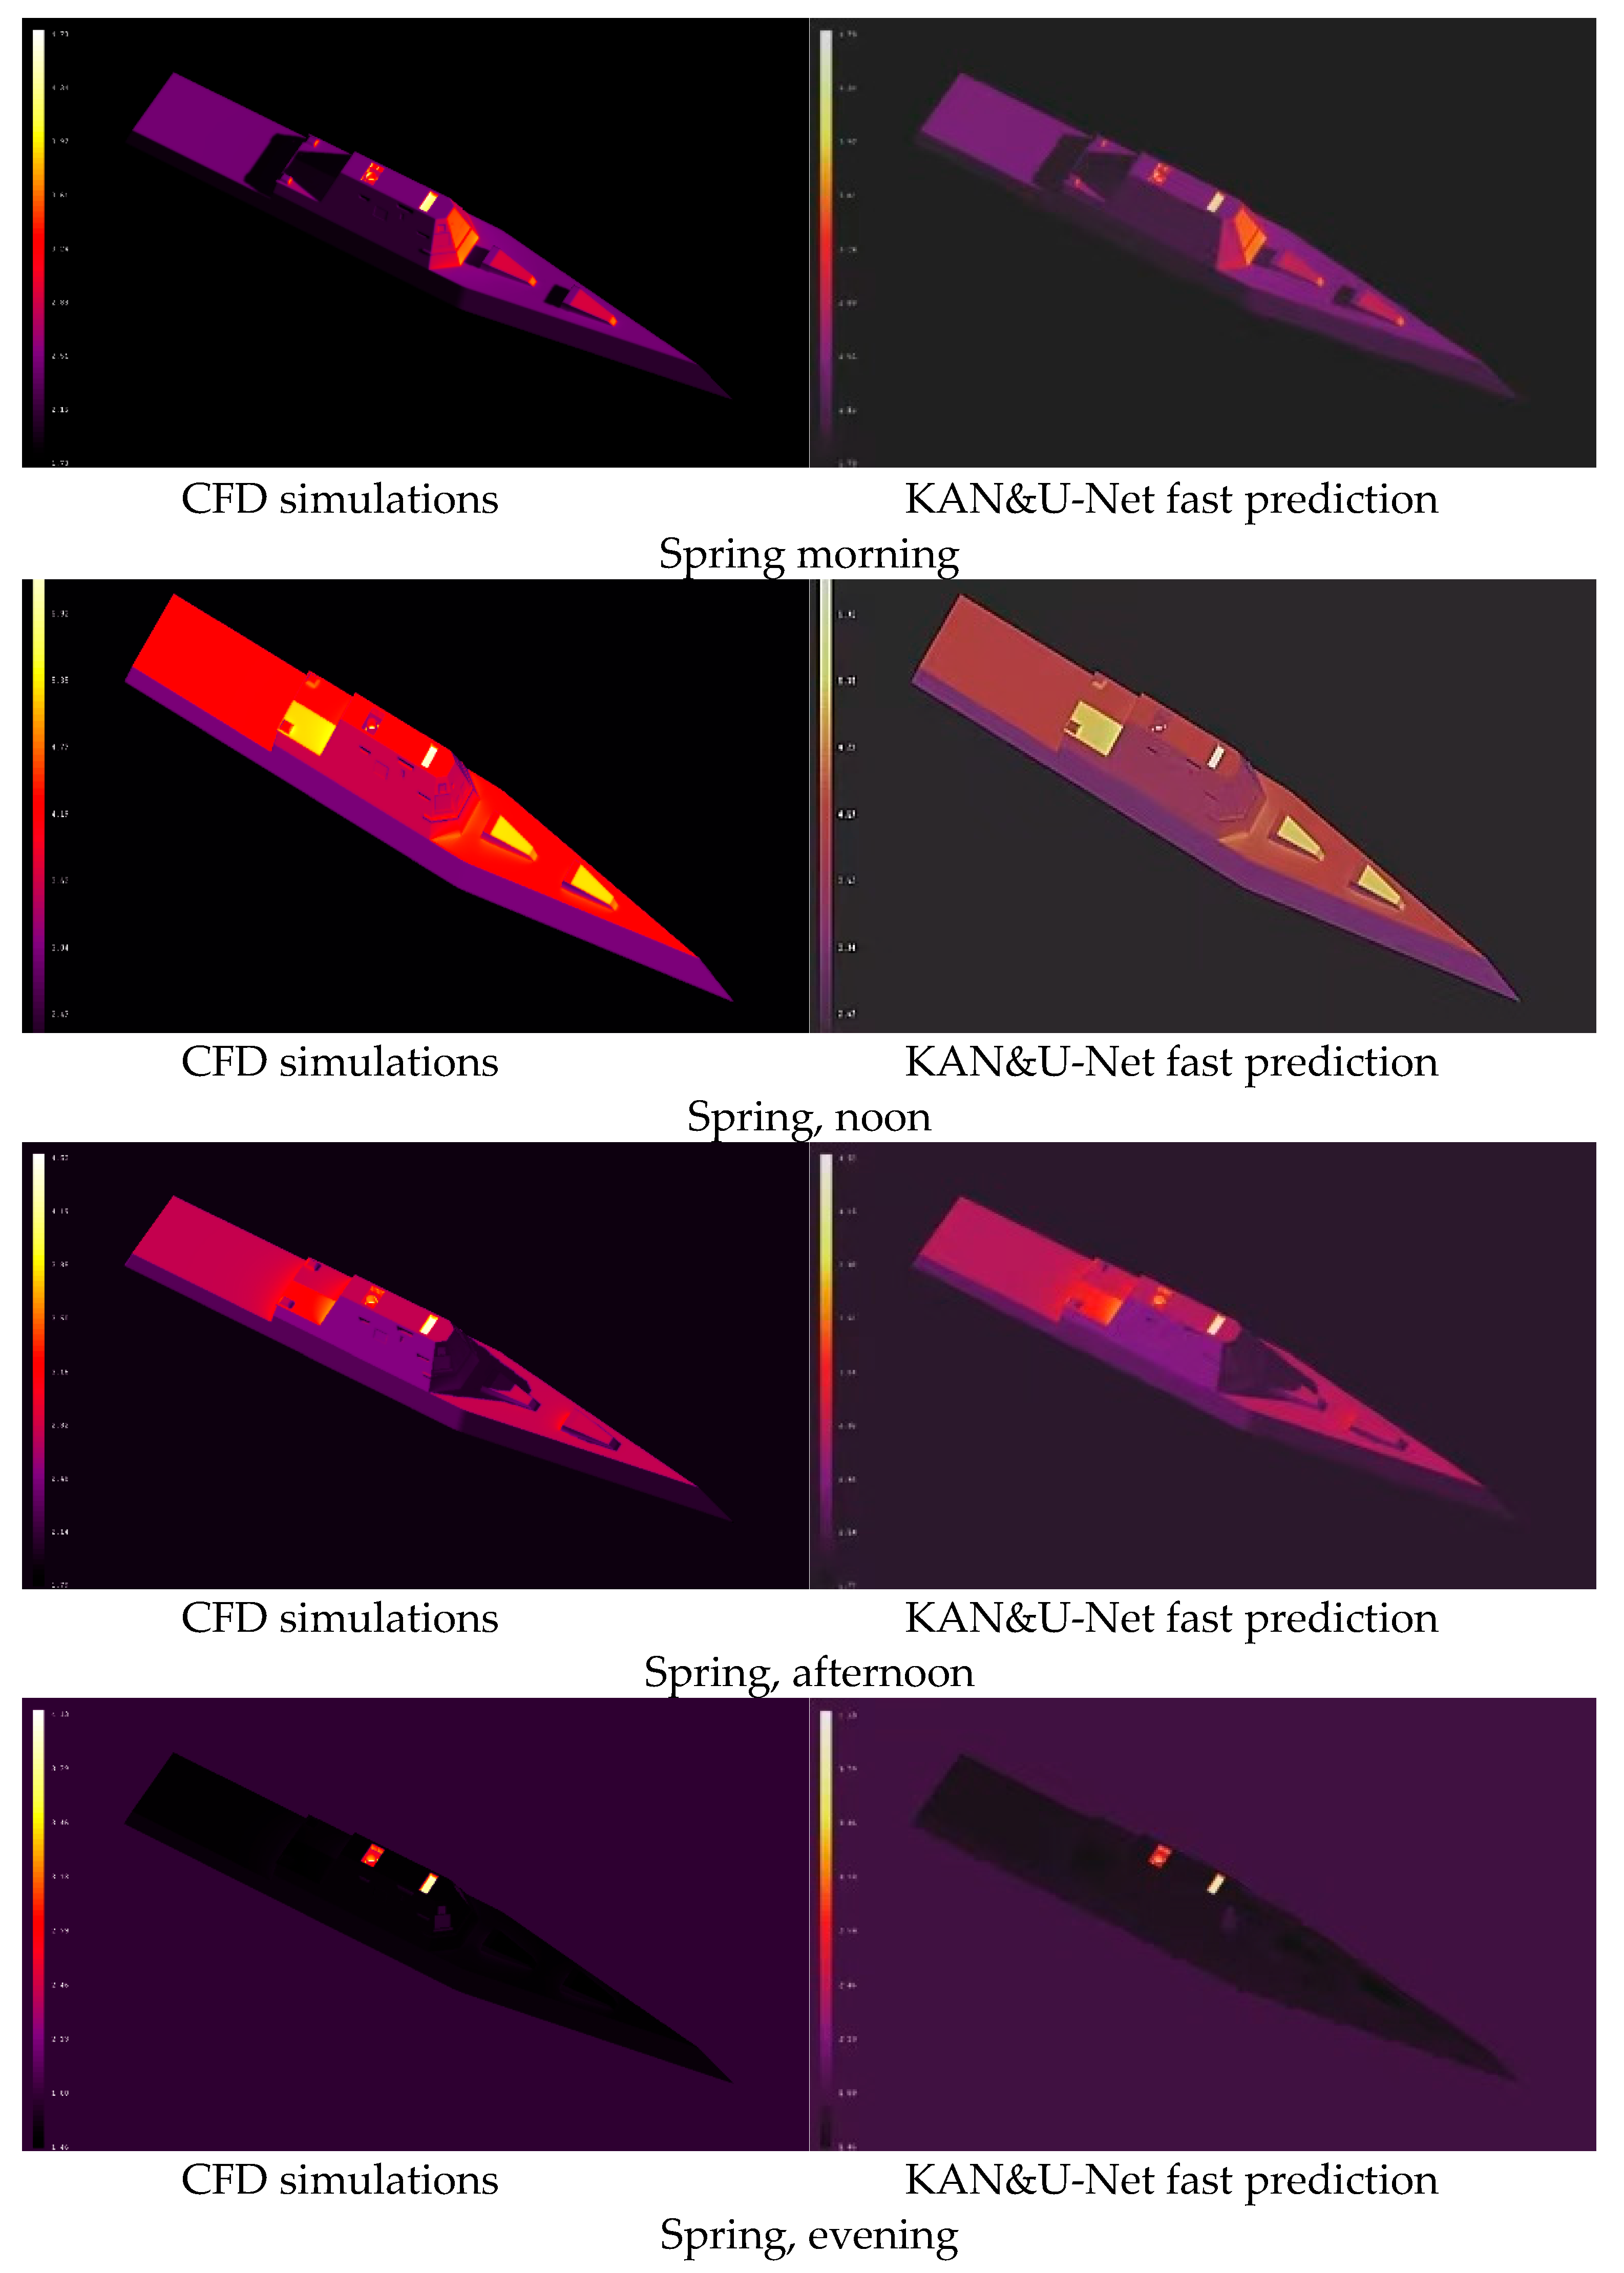
Figure 5.
KAN and U-net coupled methods for predicting infrared properties of ships at different seasons.
Figure 5.
KAN and U-net coupled methods for predicting infrared properties of ships at different seasons.
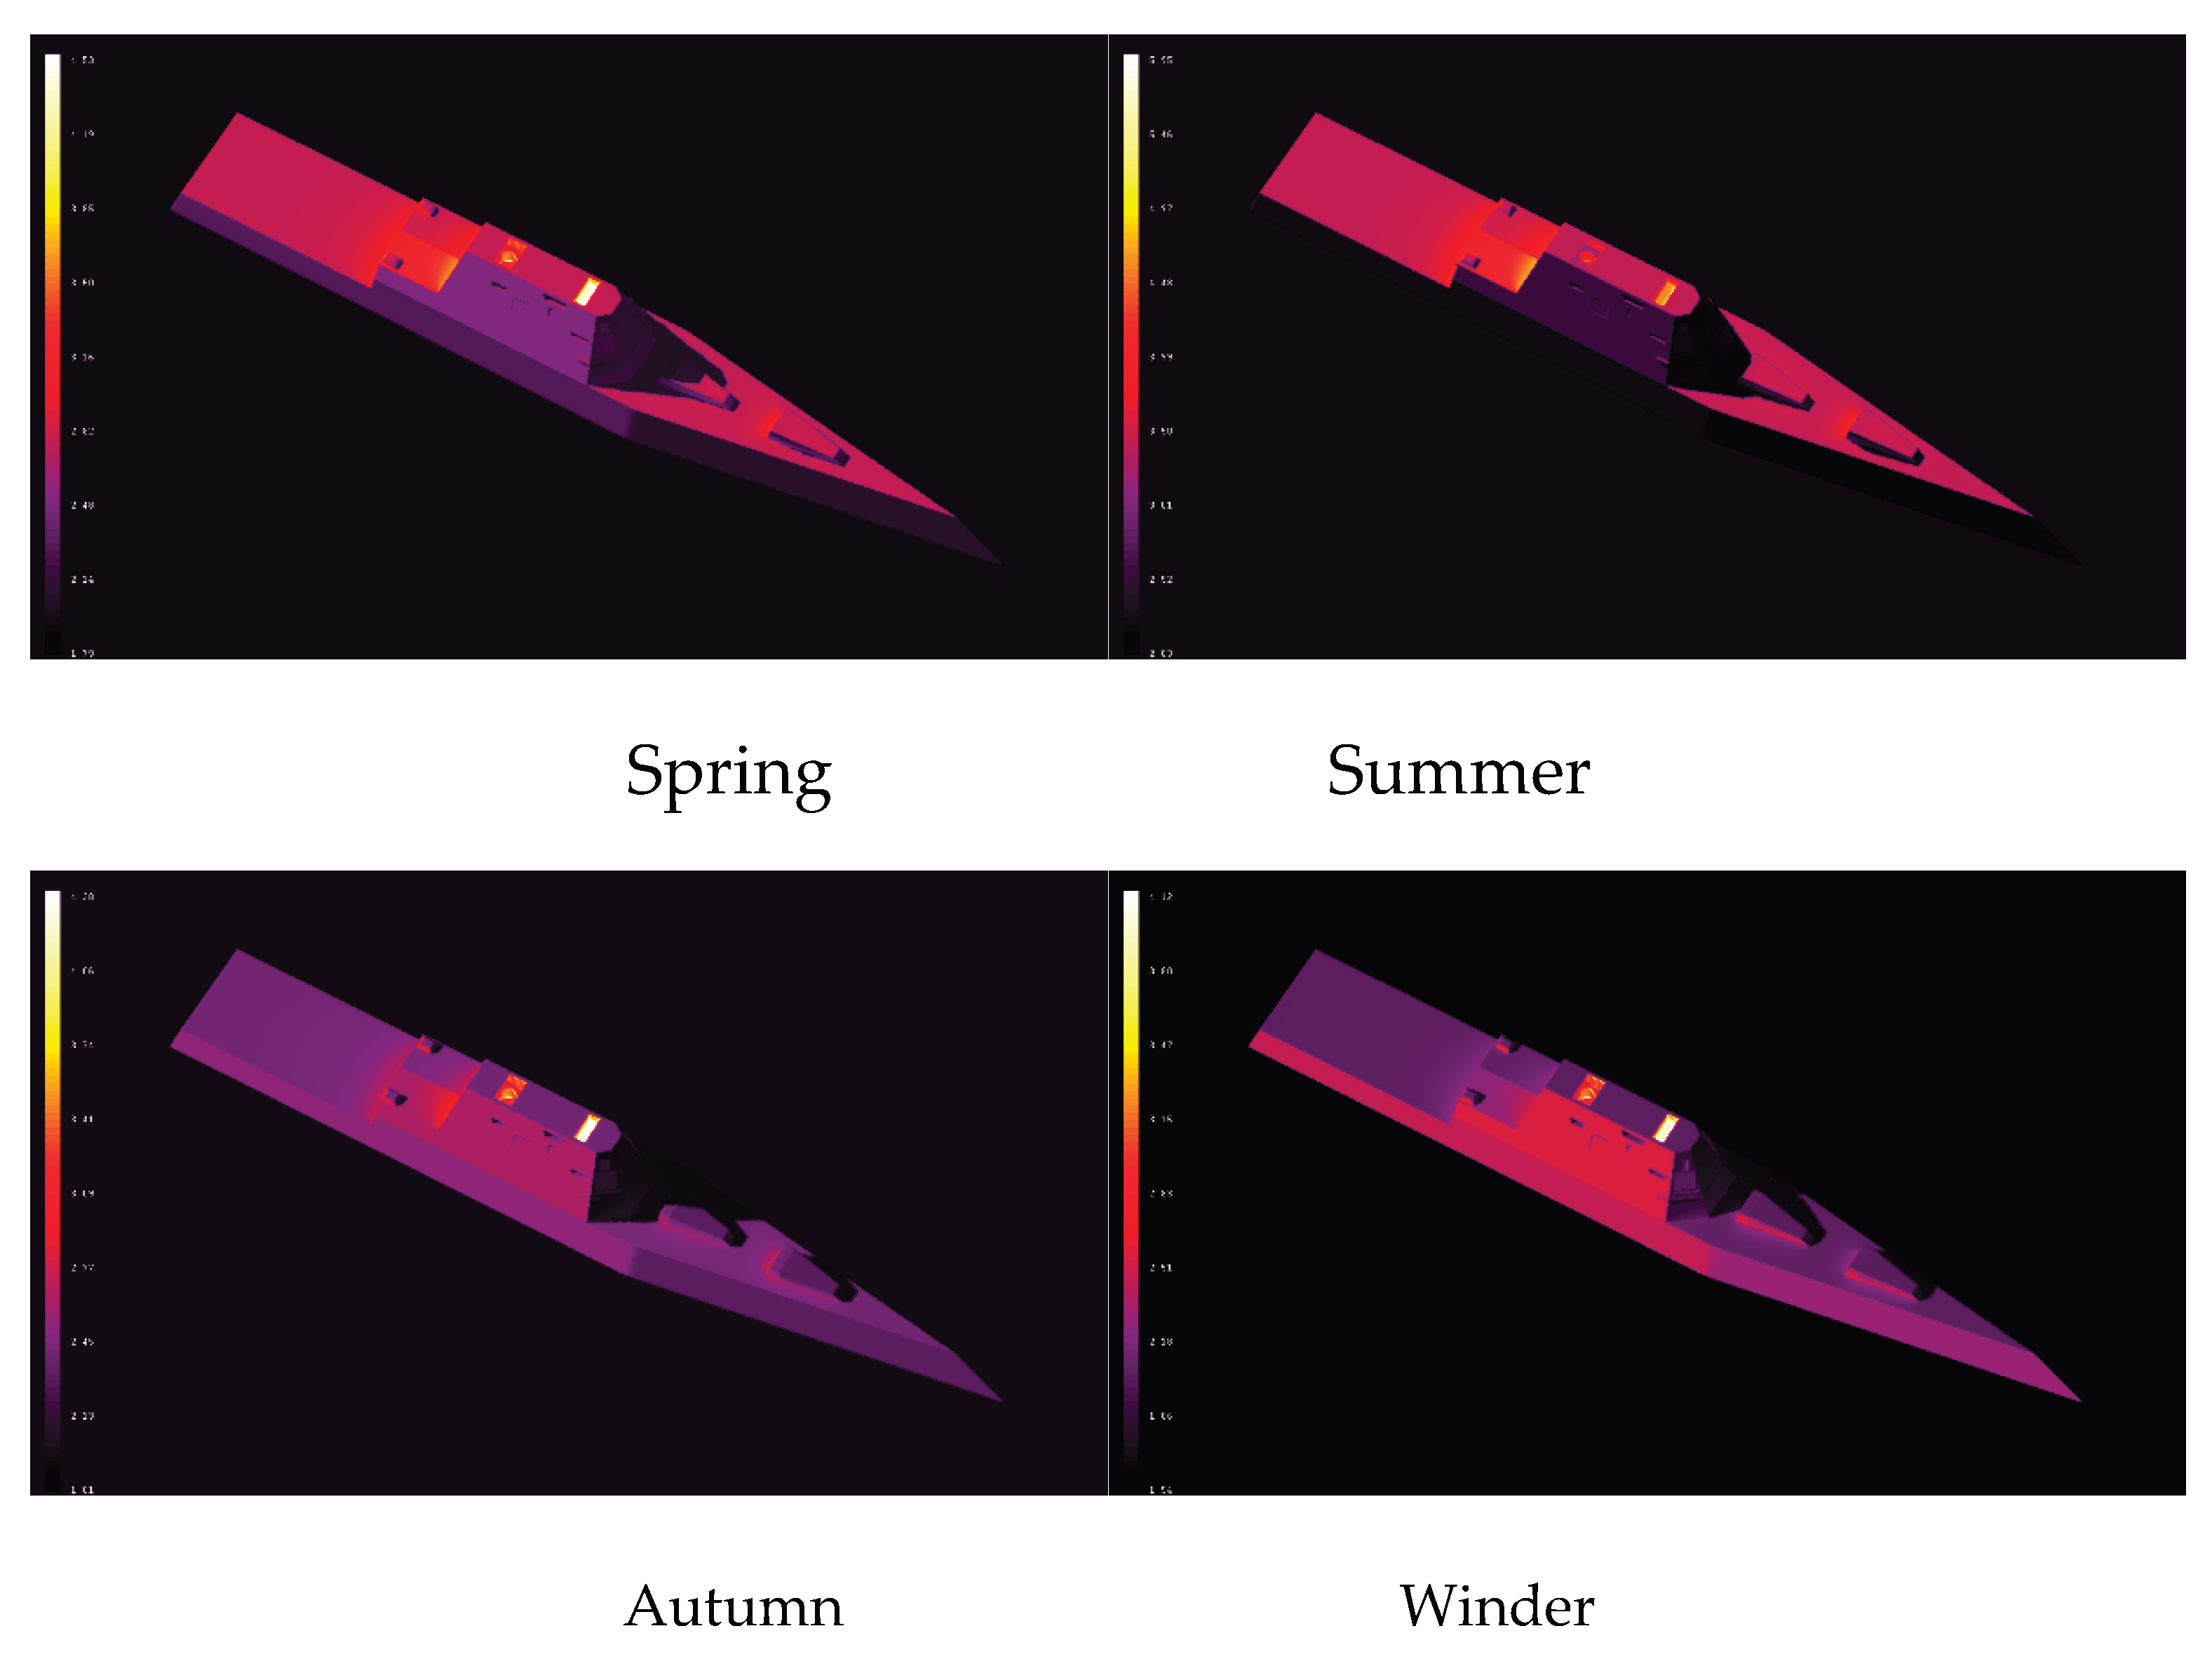
Figure 6.
Radiation intensity distribution of ships at different detection zenith angles at different times of the spring season.
Figure 6.
Radiation intensity distribution of ships at different detection zenith angles at different times of the spring season.
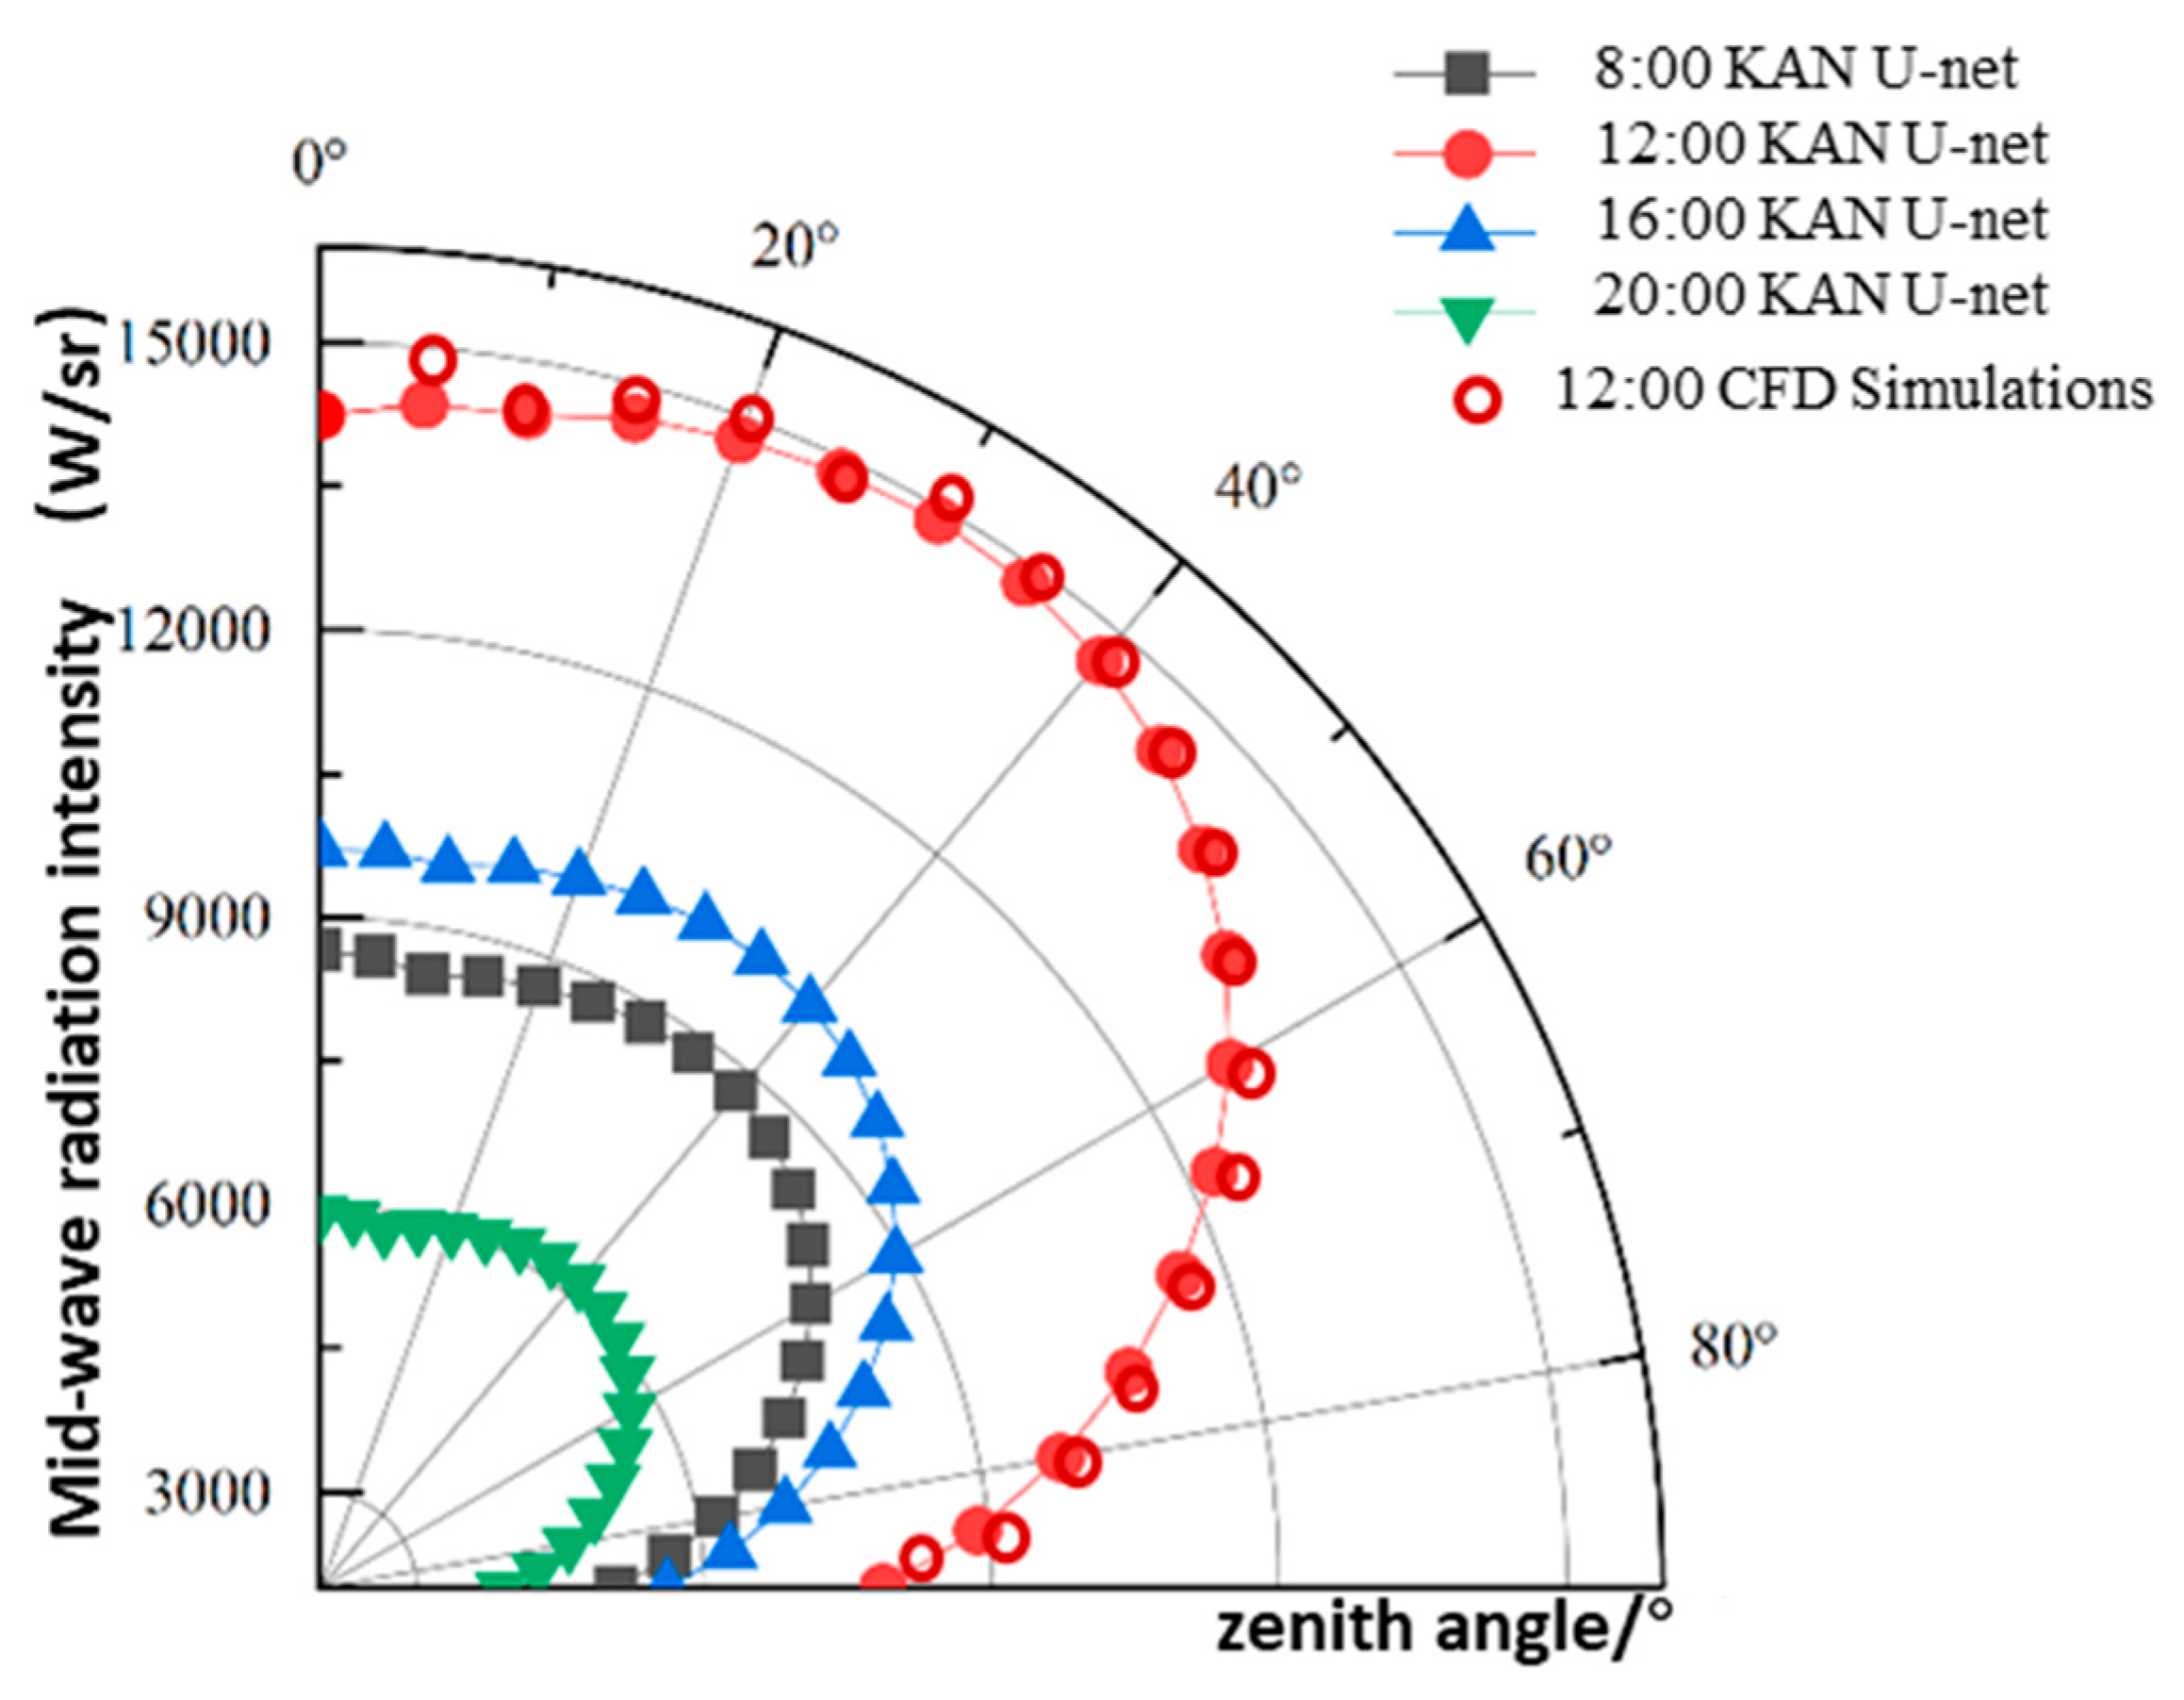
Figure 7.
Distribution of radiation intensity of ships at different detection zenith angles in different seasons.
Figure 7.
Distribution of radiation intensity of ships at different detection zenith angles in different seasons.
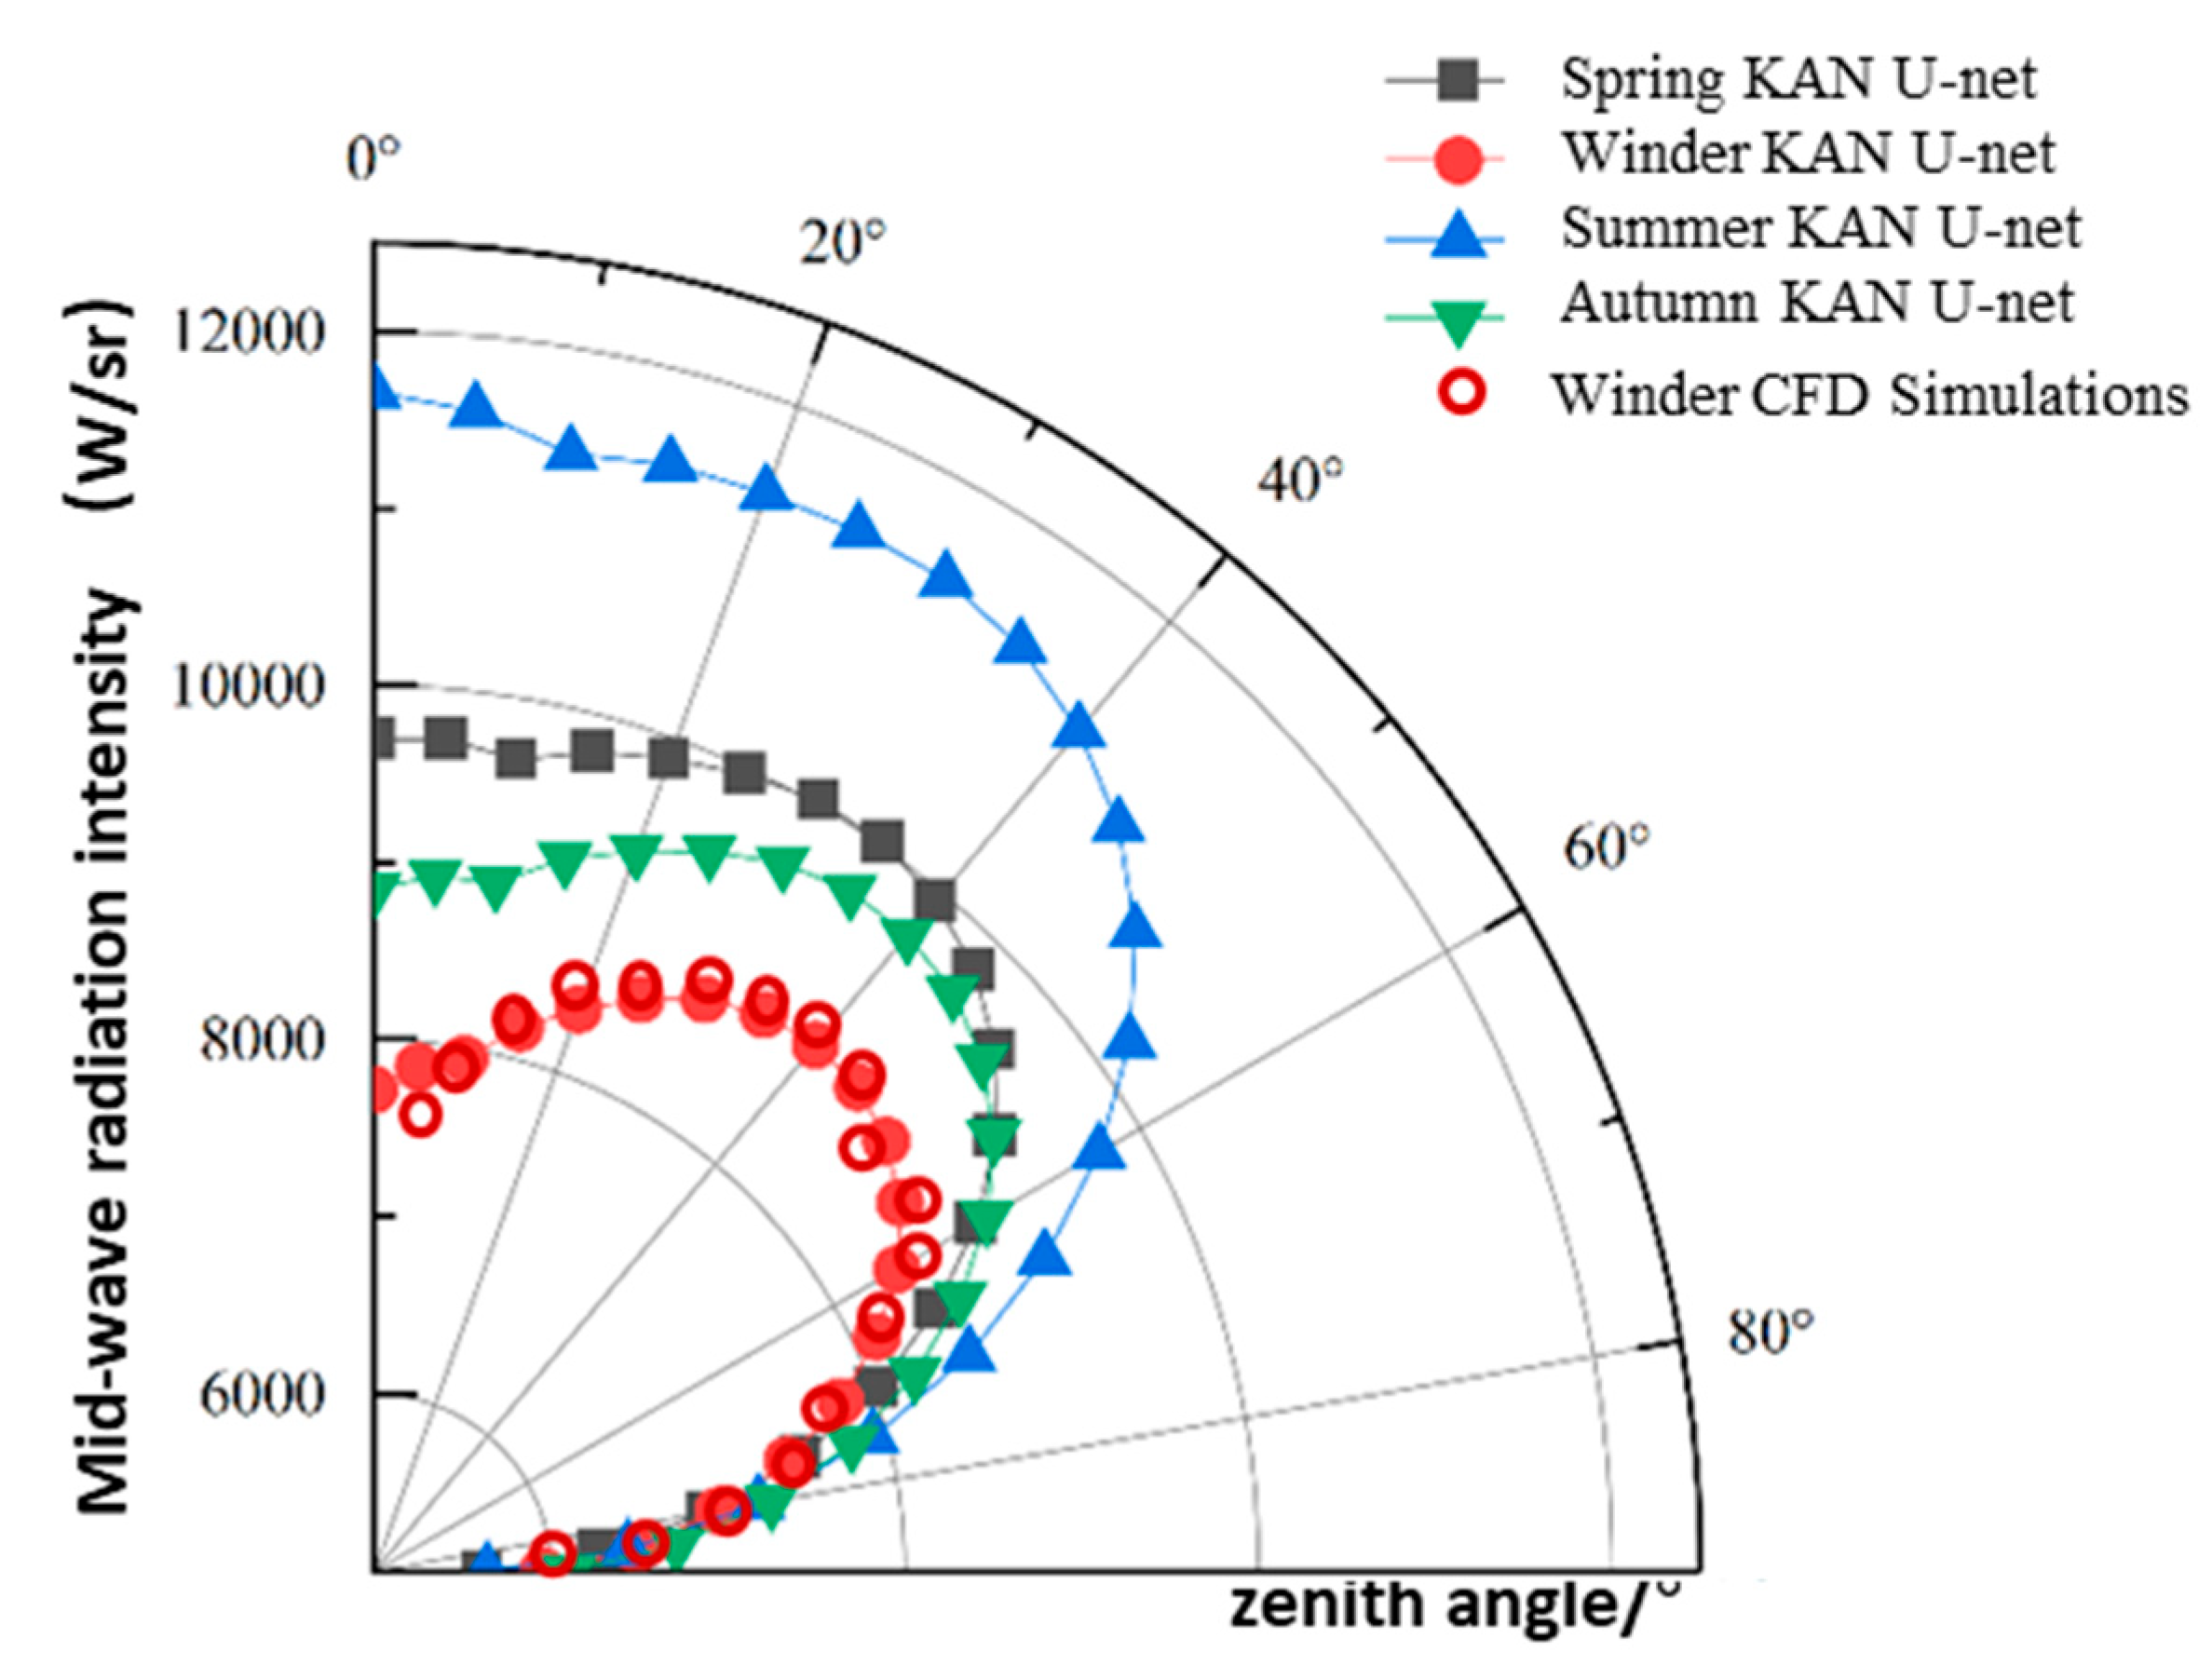
Figure 9.
Distribution of radiation intensity from ships with different detection azimuths in different headings.
Figure 9.
Distribution of radiation intensity from ships with different detection azimuths in different headings.

Table 1.
Performance Comparison of Different IR Recognition Models on the Test Set.
| Model | Precision /% | Recall /% | IoU /% | F1-Score | Parameters / (M) |
| U-net | 90.88 | 69.89 | 66.31 | 76.03 | 32.44 |
| GAN | 91.02 | 72.71 | 70.26 | 82.36 | 50.31 |
| KAN&U-net | 92.56 | 84.26 | 79.33 | 89.04 | 20.28 |
Table 2.
Impact of Different Numbers of KAN Layers on the Performance of KAN&U-Net.
| Number of KAN Layers | Precision /% | Recall /% | IoU /% | F1-Score |
|---|---|---|---|---|
| 0 | 87.01 | 83.23 | 70.39 | 85.23 |
| 1 | 91.07 | 84.31 | 78.89 | 87.46 |
| 2 | 92.89 | 85.20 | 80.12 | 88.98 |
| 3 | 92.56 | 84.26 | 79.33 | 86.04 |
| 4 | 91.67 | 83.39 | 79.01 | 84.81 |
| 5 | 90.32 | 82.24 | 77.86 | 83.07 |
Disclaimer/Publisher’s Note: The statements, opinions and data contained in all publications are solely those of the individual author(s) and contributor(s) and not of MDPI and/or the editor(s). MDPI and/or the editor(s) disclaim responsibility for any injury to people or property resulting from any ideas, methods, instructions or products referred to in the content. |
© 2025 by the authors. Licensee MDPI, Basel, Switzerland. This article is an open access article distributed under the terms and conditions of the Creative Commons Attribution (CC BY) license (http://creativecommons.org/licenses/by/4.0/).
Copyright: This open access article is published under a Creative Commons CC BY 4.0 license, which permit the free download, distribution, and reuse, provided that the author and preprint are cited in any reuse.


