
Submitted:
07 April 2025
Posted:
09 April 2025
You are already at the latest version
Abstract
To meet the requirements of the high spatiotemporal three-dimensional (3D) airflow field within the glide path corridor during carrier-based aircraft / unmanned aerial vehicle (UAV) landings, this paper proposes a prediction method for high spatiotemporal resolution 3D ship airwake along the glide path by integrating computational fluid dynamics (CFD), backpropagation (BP) neural network, and Doppler wind lidar (DWL). Firstly, taking the conceptual design aircraft carrier model as the research object, CFD numerical simulation of the ship airwake within the glide path region is carried out by using the Poly-Hexcore grid and the detached eddy simulation (DES) / the Reynolds-averaged Navier-Stokes (RANS) turbulence models. Then, using the high spatial resolution ship airwake along the glide path obtained from steady RANS computations under different headwind conditions as sample dataset, the BP neural network prediction models were trained and optimized. Along the ideal glide path within 200 m behind the stern, the correlation coefficients between the predicted results of the BP neural network and the headwind, crosswind, and vertical wind of the testing samples exceeded 0.95, 0.91, 0.82, respectively. Finally, using the inflow speed and direction with high temporal resolution from the bow direction obtained by the shipborne DWL as input, the BP prediction models can achieve accurate prediction of the 3D ship airwake along the glide path with high spatiotemporal resolution (3 m, 3 Hz).
Keywords:
ship airwake
; high spatiotemporal resolution
; BP neural network
; CFD
; DWL
1. Introduction
The accurate and real-time prediction of the high spatial resolution three-dimensional (3D) ship airwake behind the stern of an aircraft carrier is a prerequisite for addressing issues such as determining the optimal approach path and predicting landing risks for carrier-based aircraft and unmanned aerial vehicle (UAV). It is also one of the key factors in precisely maintaining the flight trajectory during aircraft / UAV approach and landing operations. In the event of abrupt changes in horizontal or vertical wind speed and direction within the glide path region, the high speed of the aircraft / UAV during landing poses a significant risk. If the pilot or automatic landing system fails to take corrective measures in time, large landing deviations may occur. Combined with insufficient aircraft power or altitude, such scenarios could easily lead to major flight incidents [1,2]. Therefore, there is an urgent need for a system capable of providing high spatiotemporal resolution 3D wind field information (with spatial resolution on the meter scale and temporal resolution on the second scale) covering the entire glide path region (typically a cylindrical space with a radius of 30m centered on the ideal glide path) during carrier-based aircraft / UAV landings. This data would offer meteorologists and commanders scientific support for emergency analysis and decision-making during critical situations.
The real-time acquisition of wind speed and direction around ships is typically achieved using wind measurement equipment installed on the vessel. However, traditional detection methods, such as cup anemometers, sonic anemometers, radiosondes, sodars, and wind profiling radars suffer from significant limitations, including low accuracy, small detection ranges, bulky equipment, and high costs [3]. These shortcomings make them inadequate for the comprehensive application requirements of high spatial resolution, high temporal resolution, and high accuracy 3D wind field remote sensing over the large glide path corridor during carrier-based aircraft / UAV landings. Doppler wind lidar (DWL) has emerged as the most effective remote sensing method for obtaining 3D wind field under clear-sky conditions. It has been widely applied in scenarios such as low-altitude wind shear, clear-air turbulence, aircraft wake vortices and other airflow fields [4,5,6]. DWL also shows considerable potential for application in detecting airflow field around naval ships. However, remote sensing of 3D ship airwake using DWL within the glide path corridor with meter spatial resolution and second temporal resolution is still a challenge now [7]. Under the existing technical frameworks, DWL faces the contradiction between high spatial resolution and high measurement accuracy due to limitations imposed by pulse width and window function width. At the same time, measures to reduce measurement blind zone also bring about a new problem of reducing the maximum detection range. The radial distance resolution of commercially DWL is typically on the order of tens of meters when the maximum detection range is fixed (e.g., the typical WindCube200s of Leosphere, has a maximum detection distance of 6km and a radial distance resolution of 25m) [8]. Although advanced wind lidar such as single-photon lidar and quantum lidar theoretically offer superior performance, these systems are still in the experimental stage [9]. Additionally, to meet the broad coverage requirements of the glide path corridor, volumetric scanning strategies of DWL (e.g., Plan Position Indicator (PPI) scanning at multiple elevation angles) are often adopted. However, the signal processing capacity of laser beams limits the temporal resolution of a complete volumetric scanning to several minutes. So, for the 3D fine ship airwake with meter spatial resolution and second temporal resolution required during carrier-based aircraft / UAV landings, relying solely on improving the performance of DWL remains challenging.
Another feasible method for obtaining the 3D airwake behind the stern of an aircraft carrier is through computational fluid dynamics (CFD) numerical simulation. Compared to full-scale ship measurements and wind tunnel experiments, CFD method offers significant advantages in efficiency and cost, and its validity has been supported by extensive experimental data [10]. Combined with the breakthrough of turbulence modeling and mesh division, it has effectively improved the scope of application and simulation accuracy, making CFD a primary tool for researching ship airwake. Polsky et al. [11,12] conducted a series of computations on amphibious assault ships (LHA-class) and nuclear-powered aircraft carriers (CVN-class). His research investigated the effects of grid structure, geometric configurations, atmospheric boundary layer velocity gradients, and turbulence models on ship airwake. Additionally, the independence of results from Reynolds numbers and Mach numbers was analyzed. The unsteady wake flow structures obtained from simulations were compared and analyzed against results from wind tunnel experiments and full-scale ship measurements. Similarly, Ben et al. [13] used the Nimitz-class aircraft carrier model as the research object to analyze the air flow characteristics along the landing trajectory under different wind speeds and directions. In addition to isolated ship airwake studies, experts have also employed CFD simulation to study the coupled airflow fields of carrier-based aircraft and aircraft carriers [14,15]. However, the high computational costs and time-consuming makes CFD unsuitable for the time-sensitive demands of carrier-based aircraft / UAV during landings (e.g., the dynamic monitoring of airwake along the glide path and the corresponding real-time handling).
In recent years, with the rapid development of artificial intelligence technology, especially neural network technology has increasingly become an effective prediction means of regression and classification, providing new possibilities for solving this problem [16,17]. Data driven artificial intelligence methods, such as backpropagation (BP) neural networks, convolutional neural networks (CNN), etc., show a strong predictive ability combined with different optimization strategies due to their powerful nonlinear modeling capabilities [18].
To address the trade-off between high spatial resolution and high temporal resolution in predicting ship airwake, this study explores an integrated prediction method combining CFD numerical simulations, BP neural networks, and DWL. A novel prediction framework is proposed that achieves both high spatial resolution and high temporal resolution prediction for the ship airwake along the glide path. The paper is structured as follows: Section 2 focuses on the CFD numerical simulation of the 3D ship airwake, Section 3 presents the BP neural networks prediction for the 3D airwake along the glide path, and Section 4 and 5 provides a discussion and conclusions.
2. Simulation of 3D Ship Airwake by CFD
2.1. Numerical Model of Aircraft Carrier
The conceptual design of the aircraft carrier model adopts a coordinate system with the x-axis along the stern direction, the y-axis along the starboard side, and the z-axis perpendicular to the deck pointing upward, as shown in Figure 1. The computational domain uses a cuboid solid region with a length of 952 m, approximately three times the length of the aircraft carrier (294 m). The width of domain is 398 m, about four times the width of the ship (96 m), and its height is 216m, about three times the height of the ship (65 m, above the waterline). The influence of ocean waves is neglected, assuming the ship moves steadily along a specific course with a constant draft, and the sea surface is treated as a horizontal solid wall. The inflow boundary of the domain adopts a velocity inlet, while the outflow boundary employs a pressure outlet. Global meshing employs Poly-Hexcore grids (a combination of polyhedral and Cartesian grids), which provide higher filling efficiency and higher grid quality, while grid refinement is applied to the adjacent region and the ship aft glide path region. The total cell count is approximately 16 million, with a minimum cell size about 0.88 m.
Considering the carrier speed and sea surface wind conditions, the typical wind speed over the deck ranges from 0 to 40 m/s. Due to the low Mach number, the ship airwake is treated as incompressible. The simulation excludes the effects of exhaust emissions from the shipboard engines and chimney, as well as heat exchange between the ship and the surrounding air. For steady Reynolds-averaged Navier-Stokes (RANS) calculations, the standard k-ε turbulence model is adopted, while the unsteady detached eddy simulation (DES) calculations use the k-ω SST turbulence model. In the DES-SST model, unsteady simulations are performed with a residual convergence threshold of 0.001, a total of 1,000 time-steps, and a time-step size of 0.05 s. The SIMPLE algorithm is used for pressure-velocity coupling term in the momentum equations, while the bounded central differencing scheme is applied for discretizing the momentum equations. Turbulent viscosity is discretized using a second-order upwind scheme, pressure equations are discretized with second-order spatial accuracy, and the temporal terms employ a bounded second-order implicit scheme.
2.2. Characteristics of the Airflow Along the Ideal Glide Path
During an ideal landing, the carrier-based aircraft follows a flight trajectory along the angled deck direction, maintaining a 4° approach angle with the horizontal plane. Upon a successful landing, the tailhook captures the second or third arresting wire, located approximately 70 – 90 m from the stern. In this study, the ideal touchdown point is defined as being 3 m above the flight deck and 70m from the stern. The ideal glide path is a trajectory extending backward for a distance of 500m from the ideal touchdown point, at a 4° elevation angle along the angled deck direction (which is at a 12° angle to the take-off deck). The glide path corridor is defined as a cylindrical space with a radius of 30m centered on the ideal glide path.
Along the ideal glide path, 3D wind velocity data were extracted at intervals of 3 m within 500 m behind the ideal touchdown point. Figure 2, Figure 3 and Figure 4 illustrate the transient, time-averaged, and steady 3D wind (headwind, crosswind, and vertical wind, respectively) velocity distributions along the ideal glide path, in which the inflow comes from the bow direction to the ship with a heading angle of 0° and wind speed 15 m/s, and unsteady DES-SST computations from 900 time-steps (45 s) to 1,000 time-steps (50 s).
It can be observed that the steady results from RANS simulations exhibit similar airflow structures to the time-averaged results of DES-SST calculations. Along the ideal glide path behind the ideal touchdown point, the airflow field displays significant complexity, particularly within 200 m behind the carrier stern. The headwind maintains a consistent direction from the bow to the stern, though the wind velocity exhibits fluctuations somewhat. However, crosswind velocity and direction exhibit more complex variations, with wind shear present over the rear deck and wake regions, as well as upwash and downwash components in the vertical direction.
The complexity of the ship airwake in the glide path corridor arises from the geometric configuration of the carrier stern, turbulent fluid dynamics, and multiple couplings with external environmental factors. While the steady RANS model offers faster computational speed, it struggles to capture the transient characteristics of complex turbulence. In contrast, the DES-SST model provides a more precise turbulent structures, revealing the unsteady characteristics of the ship airwake in the glide path corridor. The complex distributions characteristics of the ship airwake along the glide path, such as strong crosswind shear and vertical wind shear, pose significant risks to the take-off and landing control of carrier-based aircraft / UAV.
3. Prediction of 3D Ship Airwake by BP Neural Network
3.1. Training of the BP Neural Network
The BP neural network is a type of multilayer feedforward neural network with strong nonlinear mapping capabilities. The structure of a typical BP neural network consists of an input layer, one (or more) hidden layer, and an output layer, as shown in Figure 5.
In this structure:
- Xi represents the i-th (i = 1,2, ···, P) independent variable in the input vector (X1, X2, ···, XP);
- Hj denotes the output of the j-th (j = 1,2, ···, L) neuron in the hidden layer;
- represents the network output of the k-th (k = 1,2, ···, M) neuron in the output layer;
- Yk is the desired output of the k-th neuron in the output layer (i.e., the k-th value in the dependent variable vector (Y1, Y2, ···, YM) from the sample dataset);
- wij is the connection weight between the i-th input variable and the j-th neuron in the hidden layer;
- vjk is the connection weight between the j-th neuron in the hidden layer and the k-th neuron in the output layer;
- aj is the threshold of the j-th neuron in the hidden layer;
- bk is the threshold of the k-th neuron in the output layer.
This study establishes BP prediction models for the 3D ship airwake (headwind, crosswind, and vertical wind) along the glide path, respectively. The independent variables are the inflow speed and direction measured at the bow direction, while the dependent variables are the wind speeds at various distances along the ideal glide path.
The BP neural network is configured with two nodes in the input layer (representing the inflow speed and angle values from the bow direction), two hidden layers with 10 and 12 nodes, respectively, and 170 nodes in the output layer (representing wind speed values at 3 m intervals along the ideal glide path up to 500 m behind the touchdown point). The activation function for the hidden layer neurons is and for the output layer neurons. The learning rate η is set to 0.005, with the computational precision ε0 ≤ 1×10-15 and the maximum number of learning iterations N0 ≤ 7000.
The training sample data are derived from the steady RANS computations. These simulations provide a series of 3D wind speed values along the ideal glide path under various headwind conditions (the number of speed values is consistent with the 170 output nodes of the BP neural network). A total of 120 training samples, as summarized in Table 1, are selected from different headwind conditions. These samples are used to train and optimize the BP prediction models for headwind, crosswind, and vertical wind along the ideal glide path, respectively.
3.2. Predicting of the BP Neural Network
The prediction framework for the high spatiotemporal resolution 3D ship airwake along the glide path is established in this paper, and its application mode is shown in Figure 6. A DWL system, deployed on the ship island, performs PPI scanning (with scanning beam number and velocity configured based on the application requirements, e.g., the update rate of measurement data is set to 3 Hz) to provide real-time inflow speed and direction values at the bow direction. These measurements are then input into the optimized headwind BP prediction model, crosswind BP prediction model, and vertical wind BP prediction model, respectively. The BP neural networks output high spatial resolution (3 m) 3D wind speed values along the glide path, thus enabling accurate prediction of the high spatial and temporal resolution 3D ship airwake along the glide path.
To evaluate the performance and generalization ability of the BP prediction models, a testing dataset consisting of 20 samples under different headwind conditions (as summarized in Table 2) was selected. The predicted results of the headwind, crosswind, and vertical wind BP models were compared with the testing samples.
Figure 7, Figure 8 and Figure 9 show the prediction results of the BP models along the glide path at various distances behind the stern (0 m, 50 m, 100 m, 150 m, and 200 m). For the headwind BP prediction model, the correlation coefficients between predicted values and sample values at different distances are 0.9814, 0.9793, 0.9537, 0.9863, and 0.9572, respectively. For the crosswind BP prediction model, the correlation coefficients at different distances are 0.9131, 0.9701, 0.9348, 0.9872, and 0.9253, respectively. For the vertical wind BP prediction model, the correlation coefficients at different distances are 0.8620, 0.8650, 0.9245, 0.8163, and 0.9158, respectively.
Overall, for the prediction of the 3D ship airwake along glide path within 200m from the stern, although the prediction ability of the BP prediction model trained in this paper for the headwind, crosswind and vertical wind is gradually reduced. It is gratifying that the correlation coefficients between the predicted results of the three BP prediction models and the testing samples values are above 0.95, 0.91 and 0.82 respectively, which can meet the requirements for accurate and real-time prediction of the 3D ship airwake along the glide path.
4. Discussion
The accurate prediction of high spatiotemporal resolution 3D ship airwake field within the glide path corridor is a complex multidisciplinary problem. The main challenges of this research include computational resource limitations, data scarcity, and the nonlinear variability of dynamic environments. Existing studies have several limitations:
- Computational efficiency constraints: Sole reliance on CFD for ship airwake prediction results in high computational complexity, making it difficult to meet real-time requirements.
- High-resolution bottleneck: While DWL is used for ship airwake measurements, it faces trade-offs between distance resolution and measurement accuracy, as well as between temporal resolution and scanning coverage.
- Insufficient model integration: The deep integration of CFD simulation data, DWL measurement data, and data-driven artificial intelligence models is still in its early stages, and no efficient prediction framework has been established for complex ship airwake.
To address these issues, this study proposes a prediction model for high spatiotemporal resolution 3D ship airwake along the glide path, integrating CFD simulation, BP neural network, and DWL technologies. The main steps include:
Step1: Using CFD methods to generate high spatial resolution sample data of the 3D ship airwake along the glide path.
Step2: Constructing high precision BP neural network prediction models by using CFD sample data to guide the learning of the ship airwake characteristics.
Step3: Utilizing high temporal resolution inflow data from DWL as input to the BP prediction models, thereby enabling precise prediction of the high spatiotemporal resolution 3D ship airwake in the glide path.
The prediction framework proposed in this study offers an effective solution for predicting high spatiotemporal resolution (3 m, 3 Hz) 3D ship airflow fields within the glide path corridor. The integration of CFD, DWL, and BP neural networks provides a novel approach to addressing the trade-off between high resolution and high temporal requirement. This fusion of new technologies not only presents new opportunities for research on complex airflow field prediction but also lays a technical foundation for the future design and operational capability enhancement of naval vessels.
However, this integrated method still faces several challenges. For instance, the prediction accuracy of the proposed model heavily depends on the performance of CFD simulation models, BP neural networks, and DWL systems. Notably, discrepancies between CFD simulations and actual physical conditions may lead to significant errors. Future studies could incorporate CFD simulation data validated or corrected through wind tunnel experiments, full-scale ship measurements, or mesoscale simulations to improve the accuracy and reliability of this prediction model in practical applications.
5. Conclusions
The main conclusions are as follows:
- CFD methods, based on physical models, accurately capture the dynamic characteristics of the ship airwake along the glide path. High spatial resolution (3 m) ship airwake from both steady RANS and time-averaged DES simulations consistently show complex ship airwake distributions along the ideal glide path, particularly within 200m behind the stern of the aircraft carrier. Significant crosswind shear and vertical upwash / downwash flows in the glide path and rear deck region pose substantial risks to the take-off and landing control of carrier-based aircraft / UAV.
- BP neural networks, driven by data, efficiently extract features from large-scale datasets and enable accurate and rapid predictions of the ship airwake. By leveraging CFD sample data to train BP neural networks to learn ship airwake characteristics, the BP prediction results for headwind, crosswind, and vertical wind along the glide path within 200 m behind the stern achieved correlation coefficients of 0.95, 0.91, and 0.82, respectively, with the testing samples. With high temporal resolution (3 Hz) wind speed and direction input from DWL, this model achieves precise predictions of the high spatiotemporal resolution (3 m, 3 Hz) 3D ship airwake in the glide path.
Author Contributions
Conceptualization, methodology, writing—review and editing, Q.L.; software, writing—original draft preparation, G.R.; data curation, visualization, Z.L.; supervision, project administration, D.Z. and B.L.; funding acquisition, Q.L. and X.L. All authors have read and agreed to the published version of the manuscript
Funding
This research was funded by the National Nature Science Foundation of China (grant number 42406184, 12404374) and the Fundamental Research Funds for the Central Universities of China (grant number 24CAFUC04034).
Institutional Review Board Statement
Not applicable.
Informed Consent Statement
Not applicable.
Data Availability Statement
The data, models and codes that support the findings of this study are available from the corresponding author upon reasonable request.
Conflicts of Interest
The authors declare no conflicts of interest.
References
- Forrest, J.S., Owen, I. An investigation of ship airwakes using detached-eddy simulation. Comput. Fluids 2010, 39, 656-673. [CrossRef]
- Gao J., Sha E., Xie Z., Wang Z. Study on the air wake field of CVN-73 carrier using active control technology. Sci. Technol. Rev. 2109, 37, 47-52. (in Chinese). [CrossRef]
- Liu, Z., Barlow, J.F., Chan, P.W., Fung, J.C.H., Li, Y., Ren, C., Mak, H.W.L., Ng, E. A review of progress and application of pulsed Doppler wind LiDARs. Remote Sens. 2019, 11, 2522. [CrossRef]
- Fu, J., Li, J., Wu, Q. Application and prospect of Doppler lidar in the wind field observation. Acta Aerodyn. Sin. 2021, 39, 172-179. (in Chinese). [CrossRef]
- Chan, P.W.; Lai, K.K. Evidence of terrain-induced windshear due to Lantau Island over the third runway of the Hong Kong international airport—examples and numerical simulations. Appl. Sci. 2025, 15, 83. [Google Scholar] [CrossRef]
- Li, X., Qiu, Y., Feng, Y., Wang, Z. Wind turbine power prediction considering wake effects with dual laser beam LiDAR measured yaw misalignment. Appl. Energ. 2021, 299, 117308. [CrossRef]
- Wang, C., Xia, H., Liu, Y., Lin S., Dou, X. Spatial resolution enhancement of coherent Doppler wind lidar using joint time-frequency analysis. Opt. Commun. 2018, 424, 48-53. [CrossRef]
- Shen, C., Li, J., G, H., Yin, J., Wang, X. Precision detection of low-level complex wind field by Rader under all-weather conditions. Acta Electron. Sin. 2024, 52, 1189-1204. (in Chinese) https://www.ejournal.org.cn/CN/10.12263/DZXB.20230699.
- Wang, C., Yang, K., Qu, L., Li, Y., Zhao, R., Xue, X., Chen, T., Dou, X. Coherent two-photon atmospheric Lidar based on up-conversion quantum erasure. ACS Photonics 2024, 11, 3528-3535. [CrossRef]
- Sari, S., Dogrul, A., Bayraktar, S. Airwake characteristics of NATO-generic destroyer: a numerical study. J. Appl. Fluid Mech. 2025, 18, 112-130. [CrossRef]
- Polsky, S.A., Bruner, C.W.S. Time-accurate computational simulations of an LHA-1 ship airwake. 18th Applied Aerodynamics Conference, Denver, CO, USA: AIAA, 2000: AIAA 2000-4126. [CrossRef]
- Polsky, S., Naylor, S. CVN airwake modeling and integration: initial steps in the creation and implementation of a virtual burble for F-18 carrier landing simulations. AIAA Modeling and Simulation Technologies Conference and Exhibit, Reston, VA, USA: AIAA, 2005: AIAA 2005-6298. [CrossRef]
- Ben, L., Wei, X., Liu, C., Pu, Z., Yin, Q. Effects of air flow on the landing track of the carrier aircraft. Ship Sci. Technol. 2014, 36, 27-30. (in Chinese). [CrossRef]
- Shipman, J.D., Arunajatesan, S., Cavallo, P.A., Sinha, N. Dynamic CFD simulation of aircraft recovery to an aircraft carrier. 26th AIAA Applied Aerodynamics Conference, Honolulu, Hawaii, USA: AIAA, 2008: AIAA 2008-6227. [CrossRef]
- Li, X., Zhu, X., Zhou, Z., Xu, X. The numerical simulation of UAV’s landing in ship airwake. J. Northwestern Polytech. Univ. 2019, 37, 186-194. (in Chinese). [CrossRef]
- Aly, A.M. Deep learning-based eddy viscosity modeling for improved RANS simulations of wind pressures on bluff bodies. J. Appl. Fluid Mech. 2024, 17, 2514–2532. [Google Scholar] [CrossRef]
- Kouah, S., Fadla, F., Roudane, M. Intelligent Prediction of Separated Flow Dynamics using Machine Learning. J. Appl. Fluid Mech. 2025, 18, 399-418. [CrossRef]
- Fan, L., Ren, Y., Tan, M., Wu, B., Gao, L. GA-BP neural network-based nonlinear regression model for machining error of compressor blades. Aerosp. Sci. Technol. 2024, 151, 109256. https://doi.org/10.1016/j.ast.2024.109256. [CrossRef]
Figure 1.
Models of the aircraft carrier and computational domain.
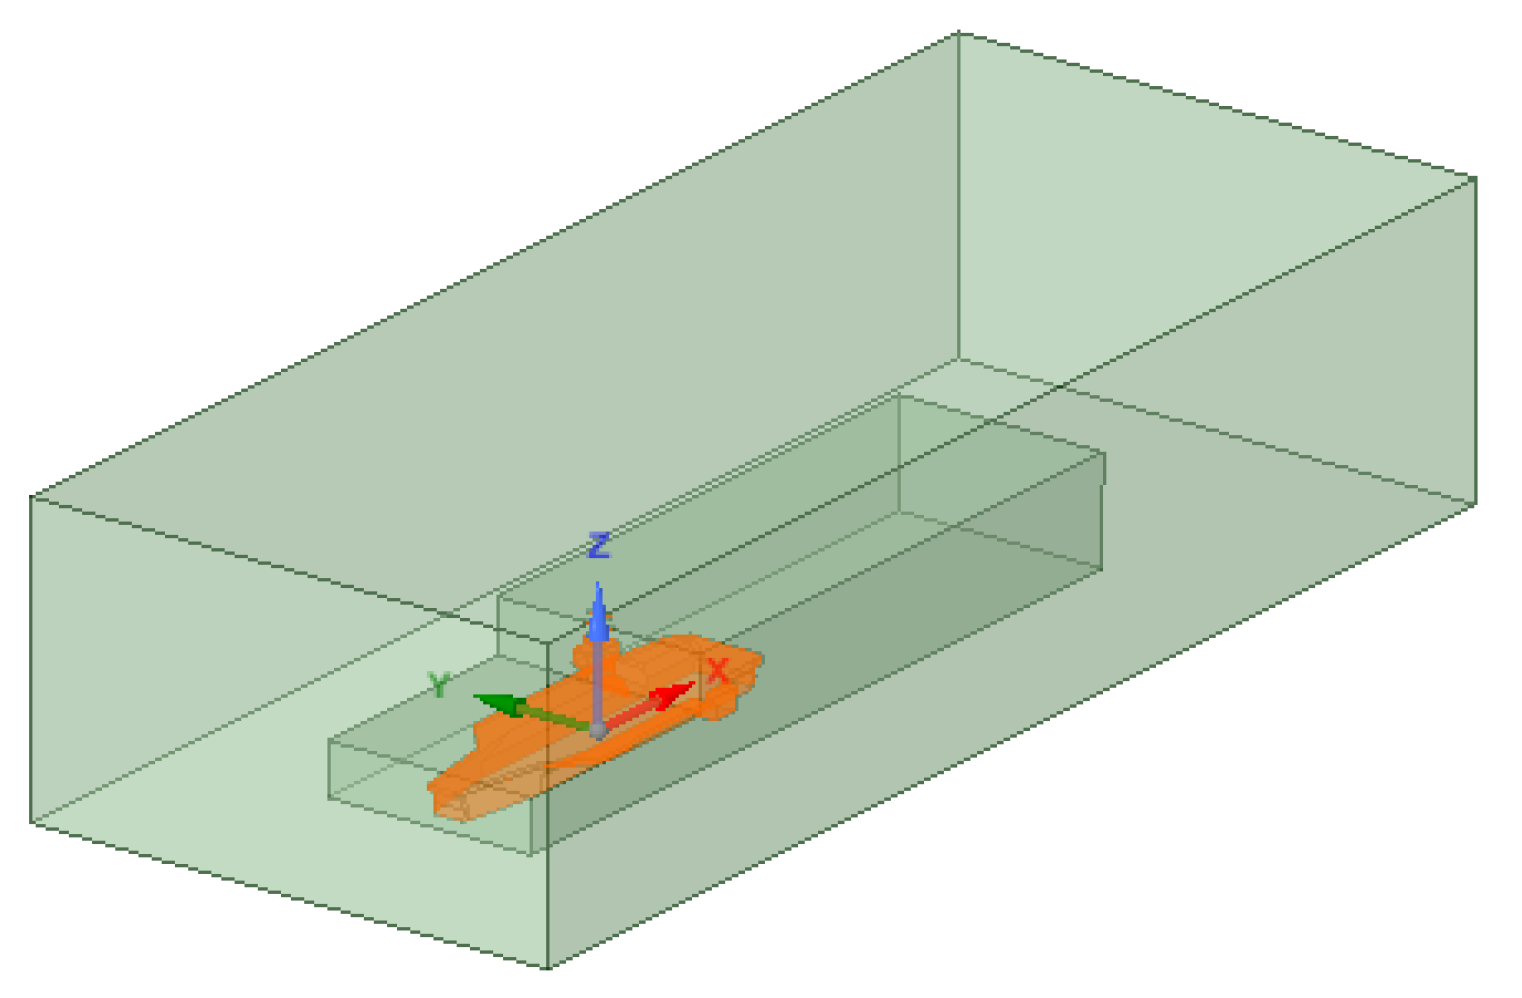
Figure 2.
Headwind distribution (transient, time-averaged, and steady) along the ideal glide path for inflow with 15 m/s wind speed and 0° wind direction.
Figure 2.
Headwind distribution (transient, time-averaged, and steady) along the ideal glide path for inflow with 15 m/s wind speed and 0° wind direction.
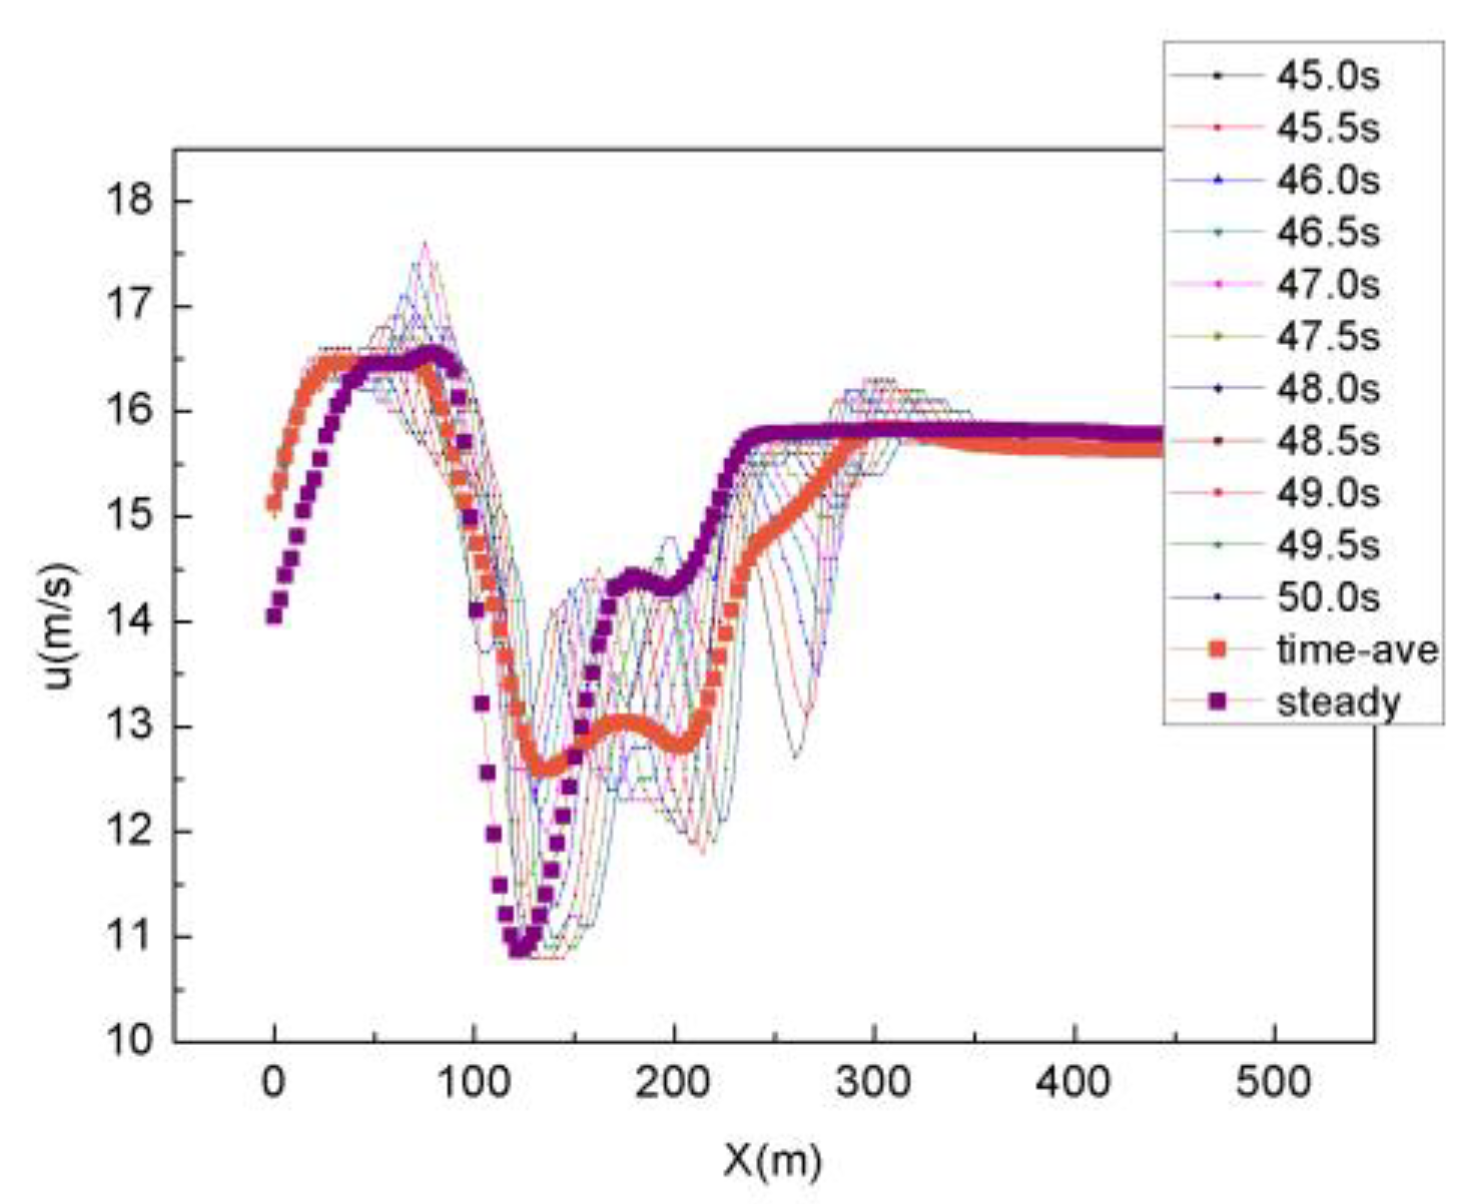
Figure 3.
Crosswind distribution (transient, time-averaged, and steady) along the ideal glide path for inflow with 15 m/s wind speed and 0° wind direction.
Figure 3.
Crosswind distribution (transient, time-averaged, and steady) along the ideal glide path for inflow with 15 m/s wind speed and 0° wind direction.
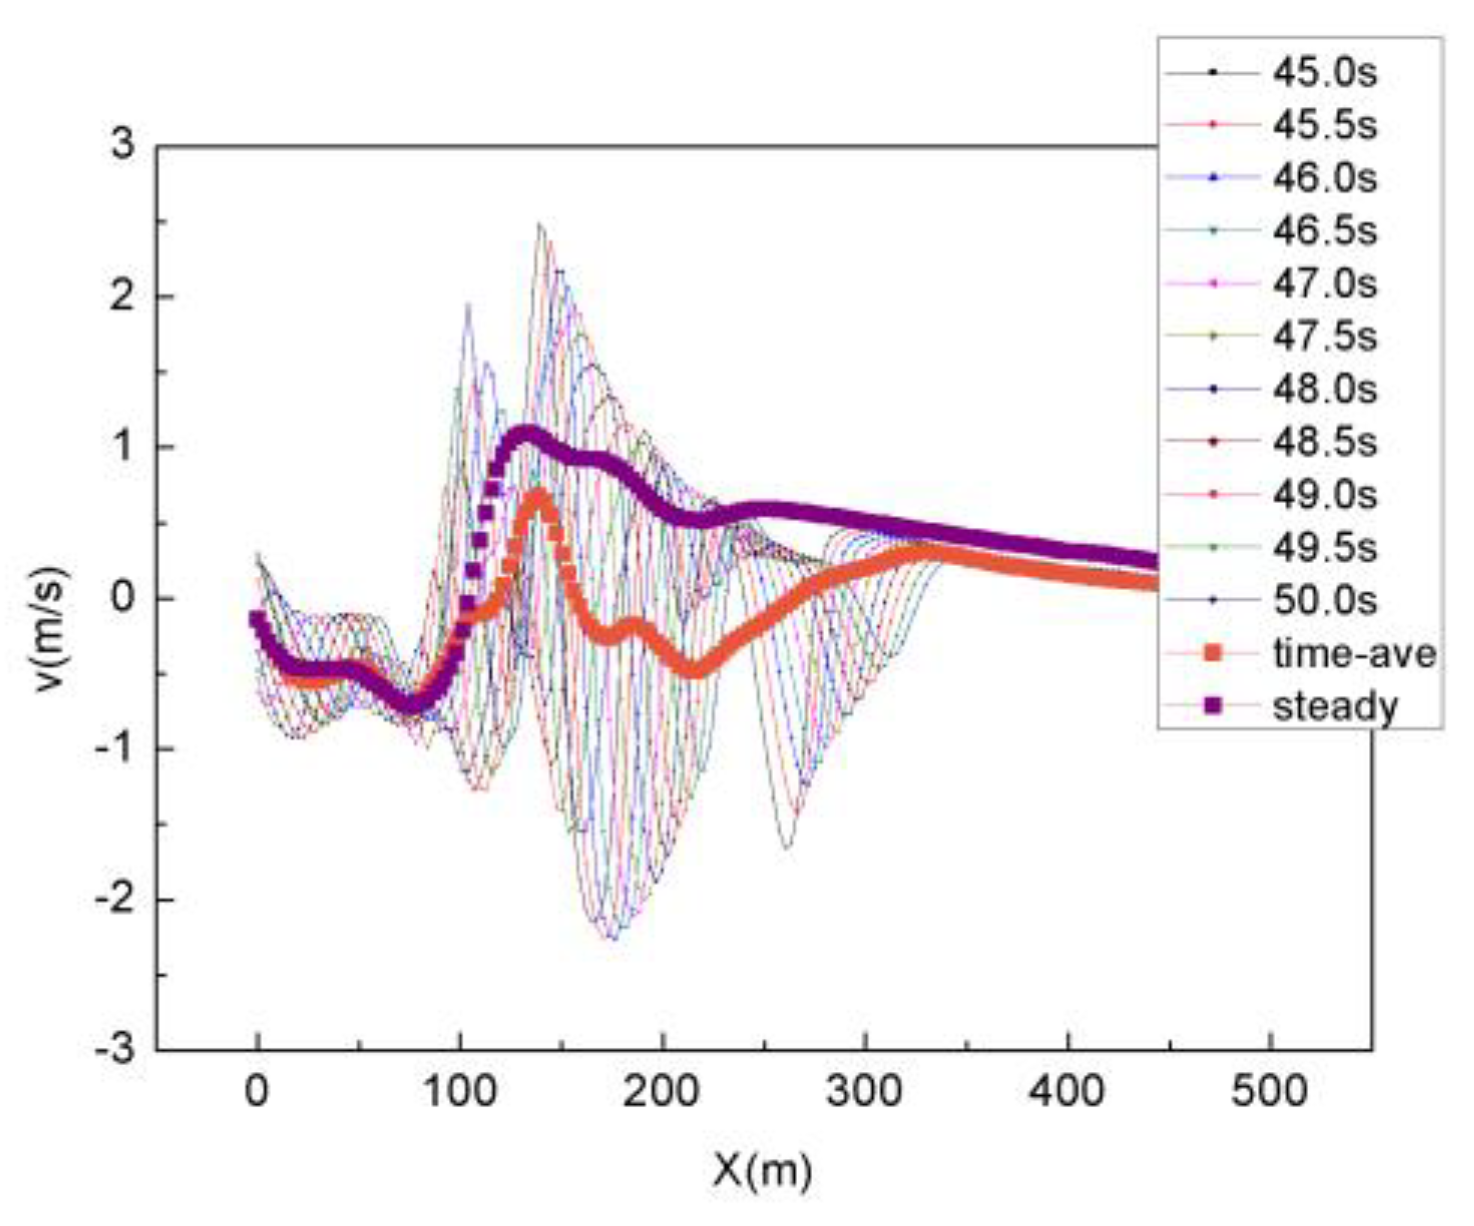
Figure 4.
Vertical wind distribution (transient, time-averaged, and steady) along the ideal glide path for inflow with 15 m/s wind speed and 0° wind direction.
Figure 4.
Vertical wind distribution (transient, time-averaged, and steady) along the ideal glide path for inflow with 15 m/s wind speed and 0° wind direction.
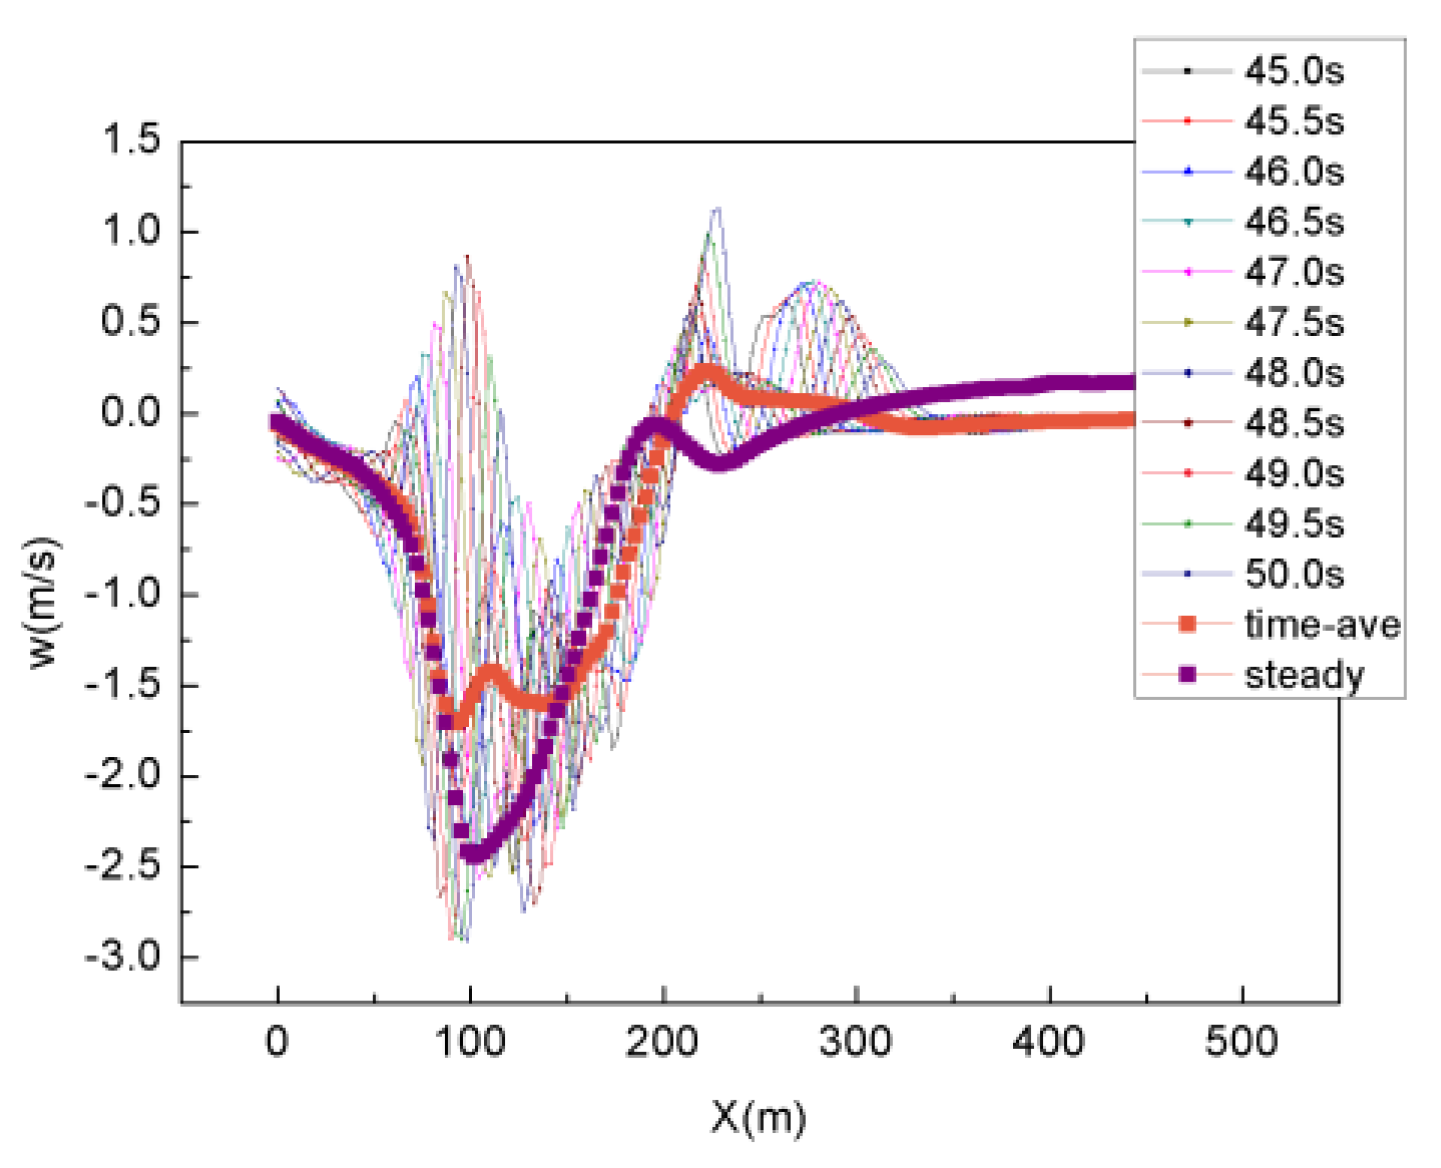
Figure 5.
Typical topology of a three-layer BP neural network.
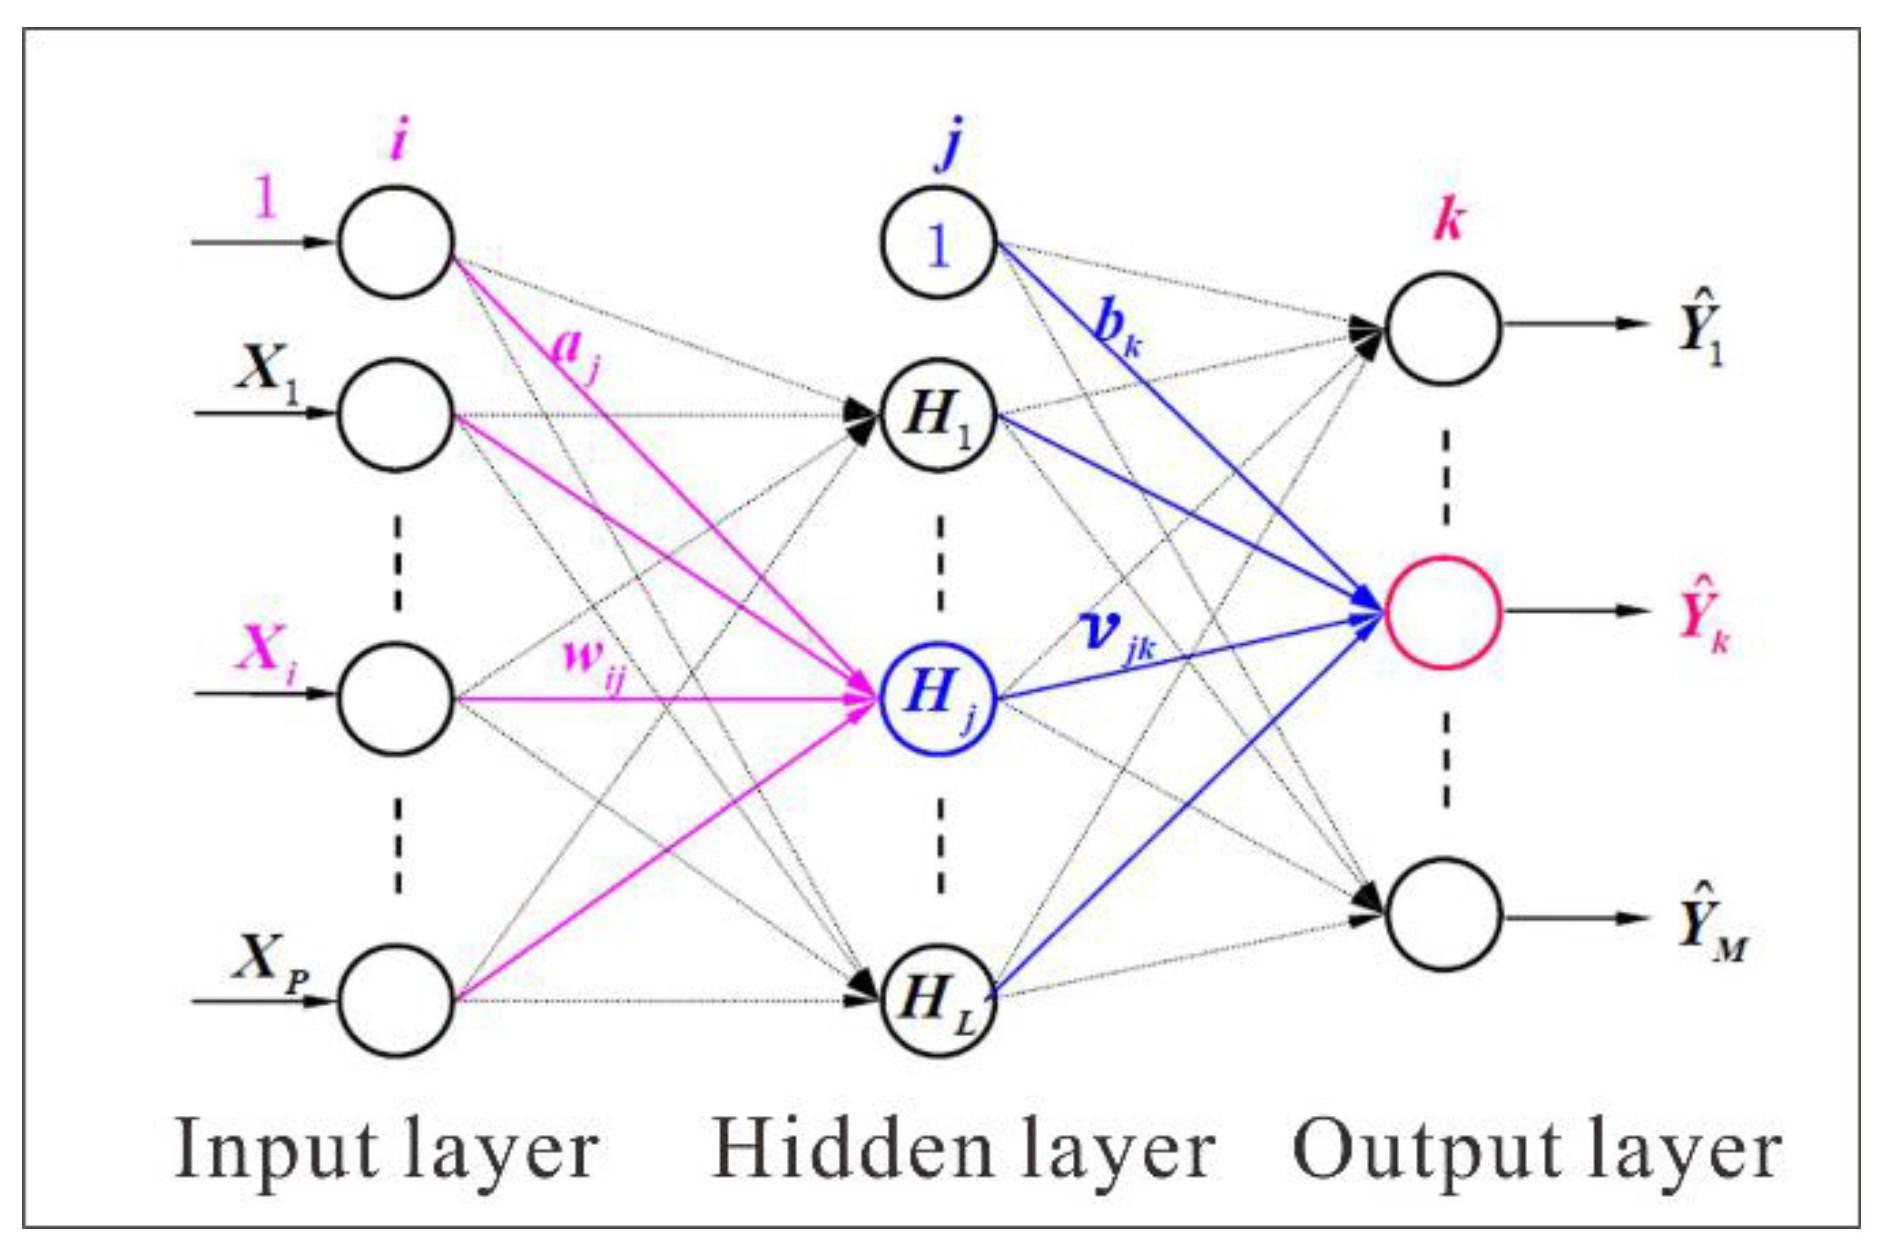
Figure 6.
Prediction model for high spatiotemporal resolution 3D ship airwake along the glide path (the red line represents the ideal glide path, the orange line represents the laser beams).
Figure 6.
Prediction model for high spatiotemporal resolution 3D ship airwake along the glide path (the red line represents the ideal glide path, the orange line represents the laser beams).
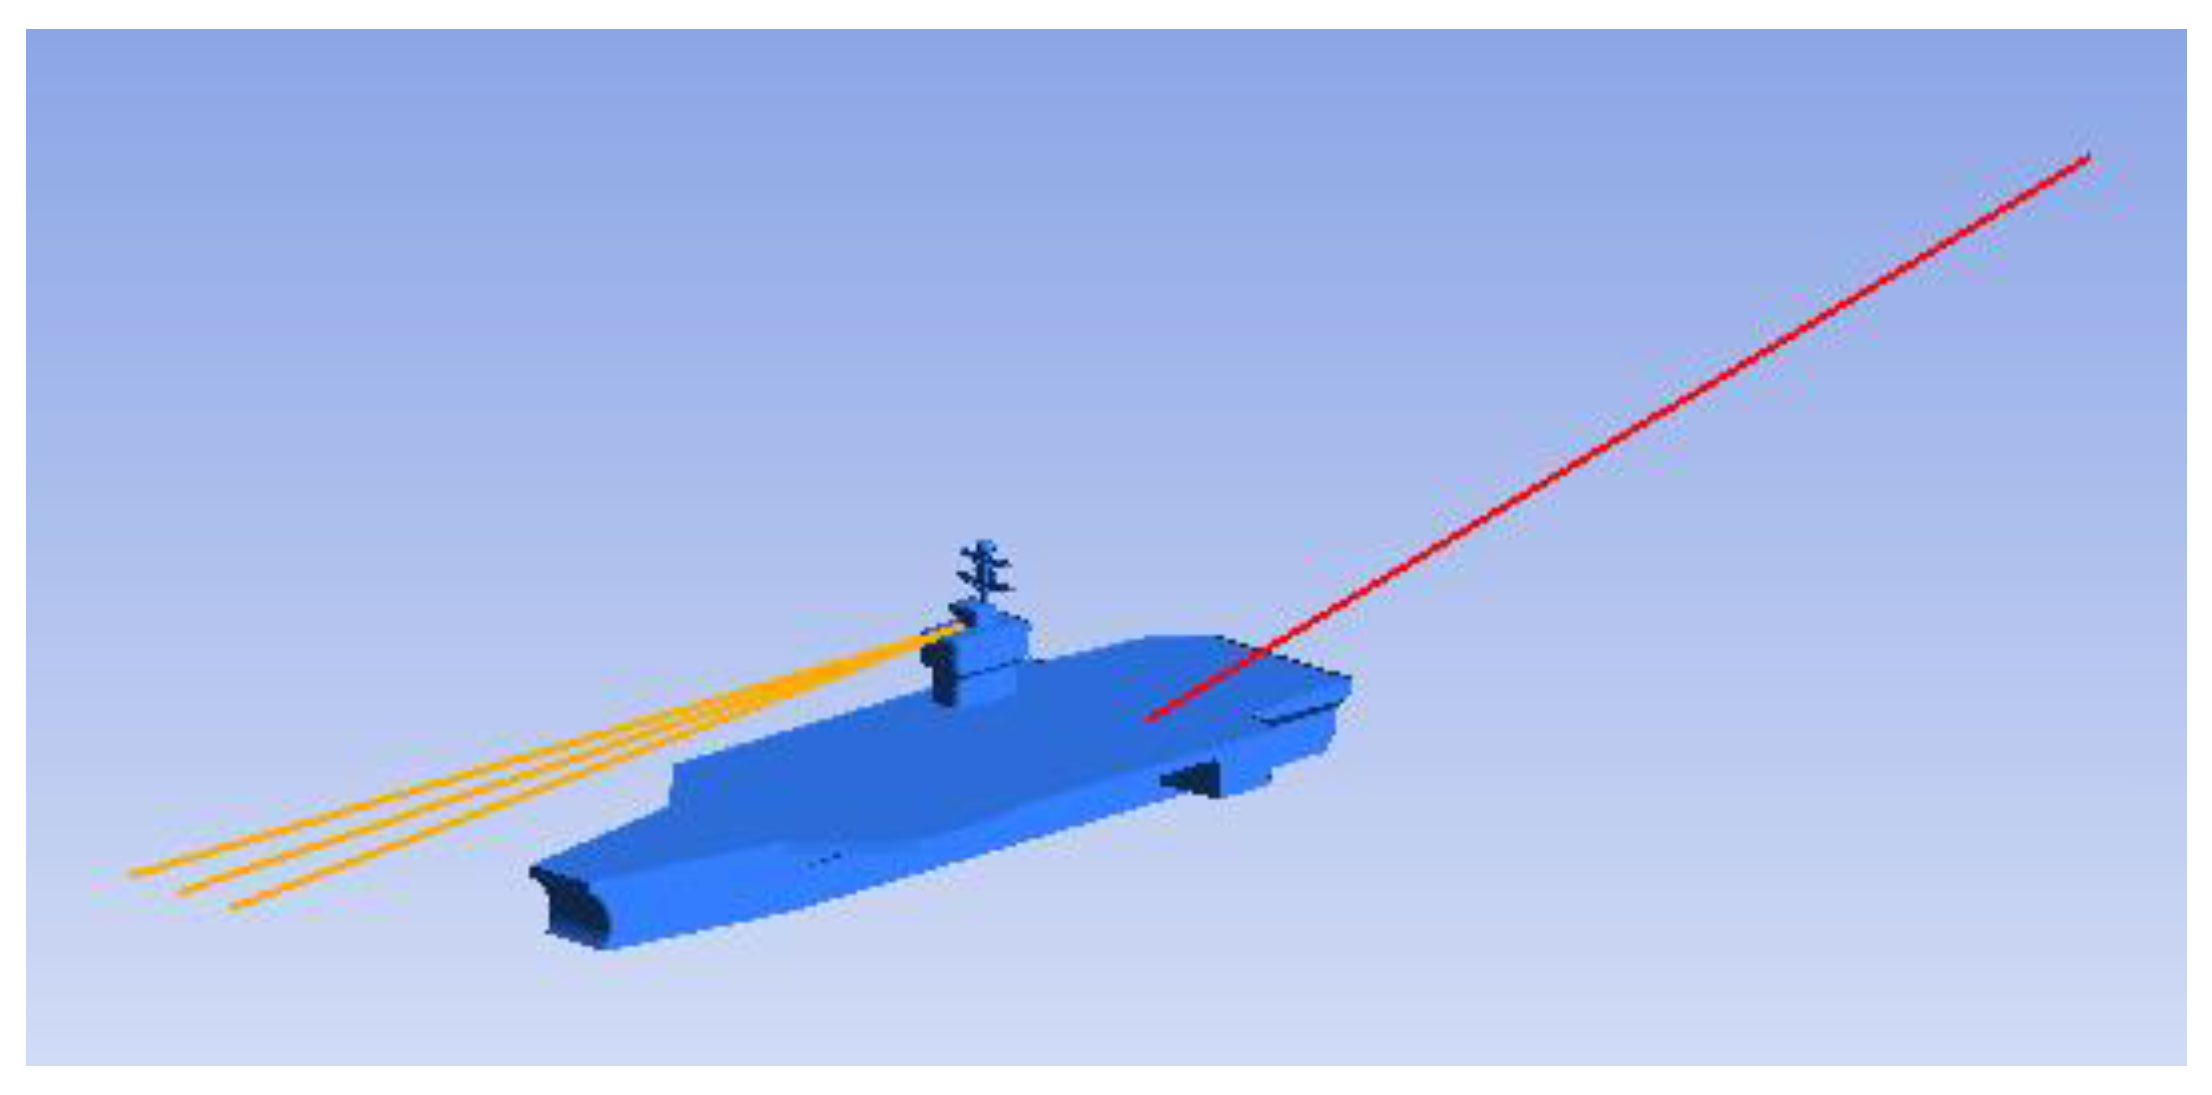
Figure 7.
Prediction results of the headwind BP model along the glide path at various distances behind the stern(a1)-(a5).
Figure 7.
Prediction results of the headwind BP model along the glide path at various distances behind the stern(a1)-(a5).
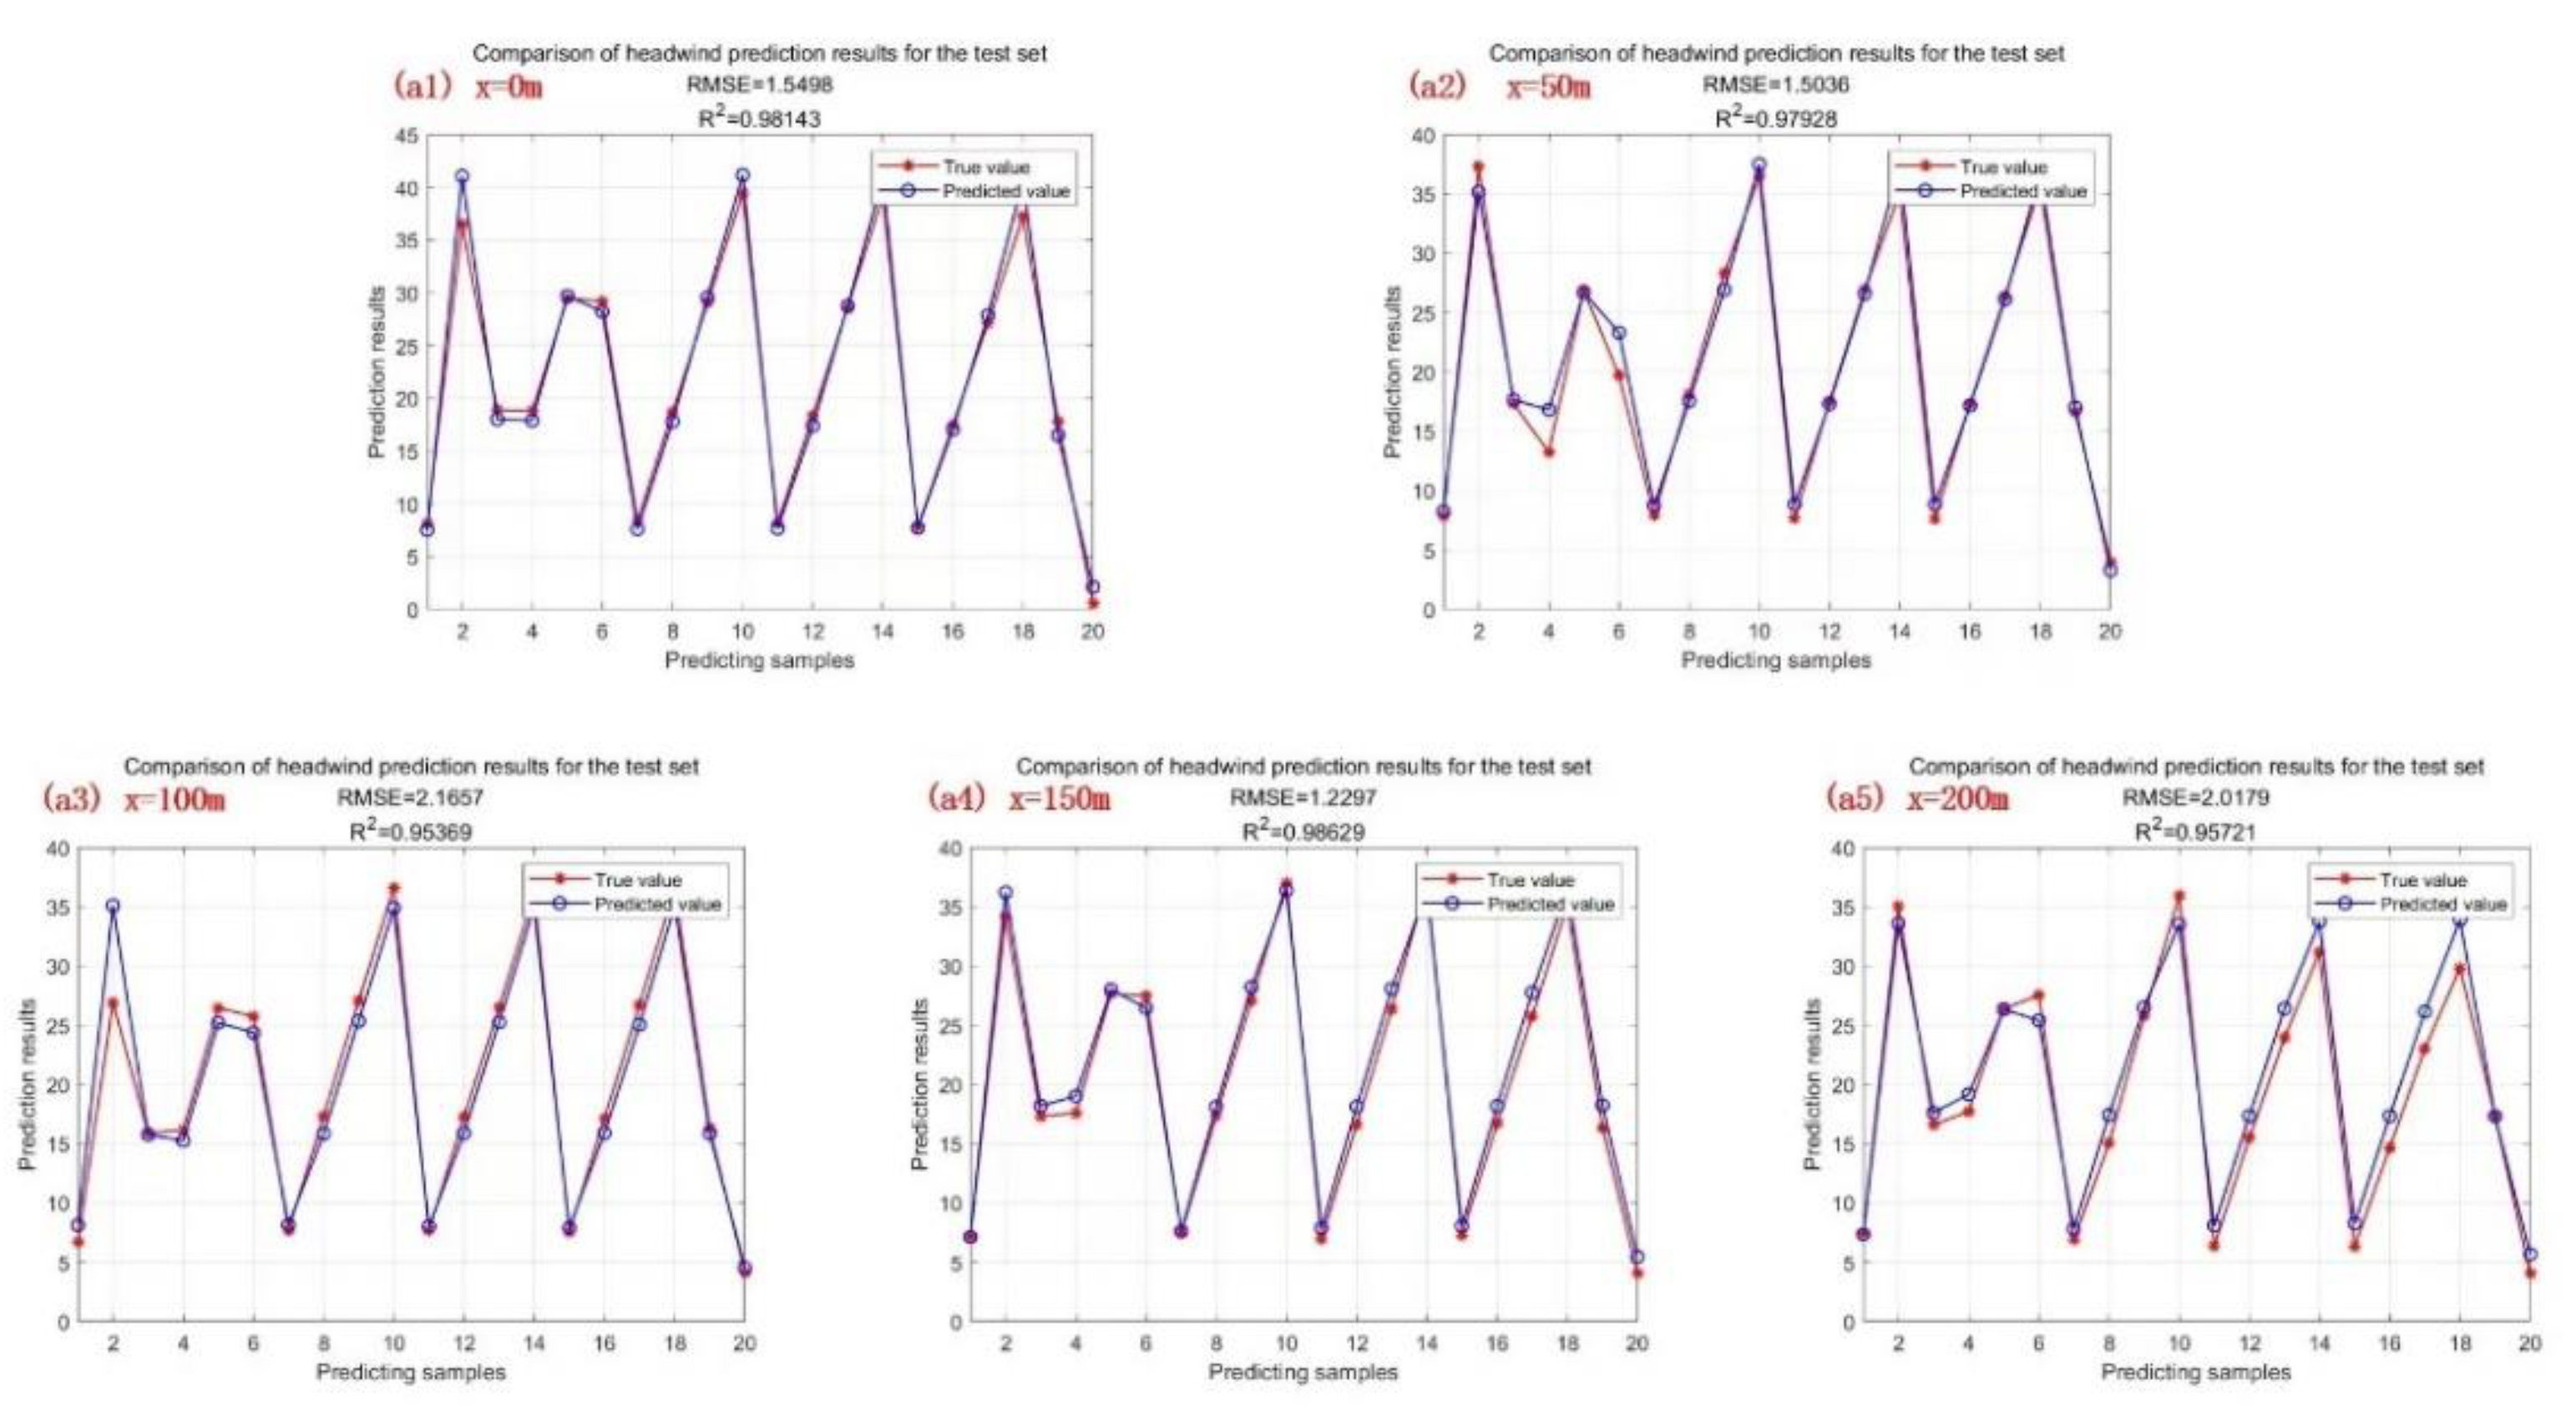
Figure 8.
Prediction results of the crosswind BP model along the glide path at various distances behind the stern(b1)-(b5).
Figure 8.
Prediction results of the crosswind BP model along the glide path at various distances behind the stern(b1)-(b5).
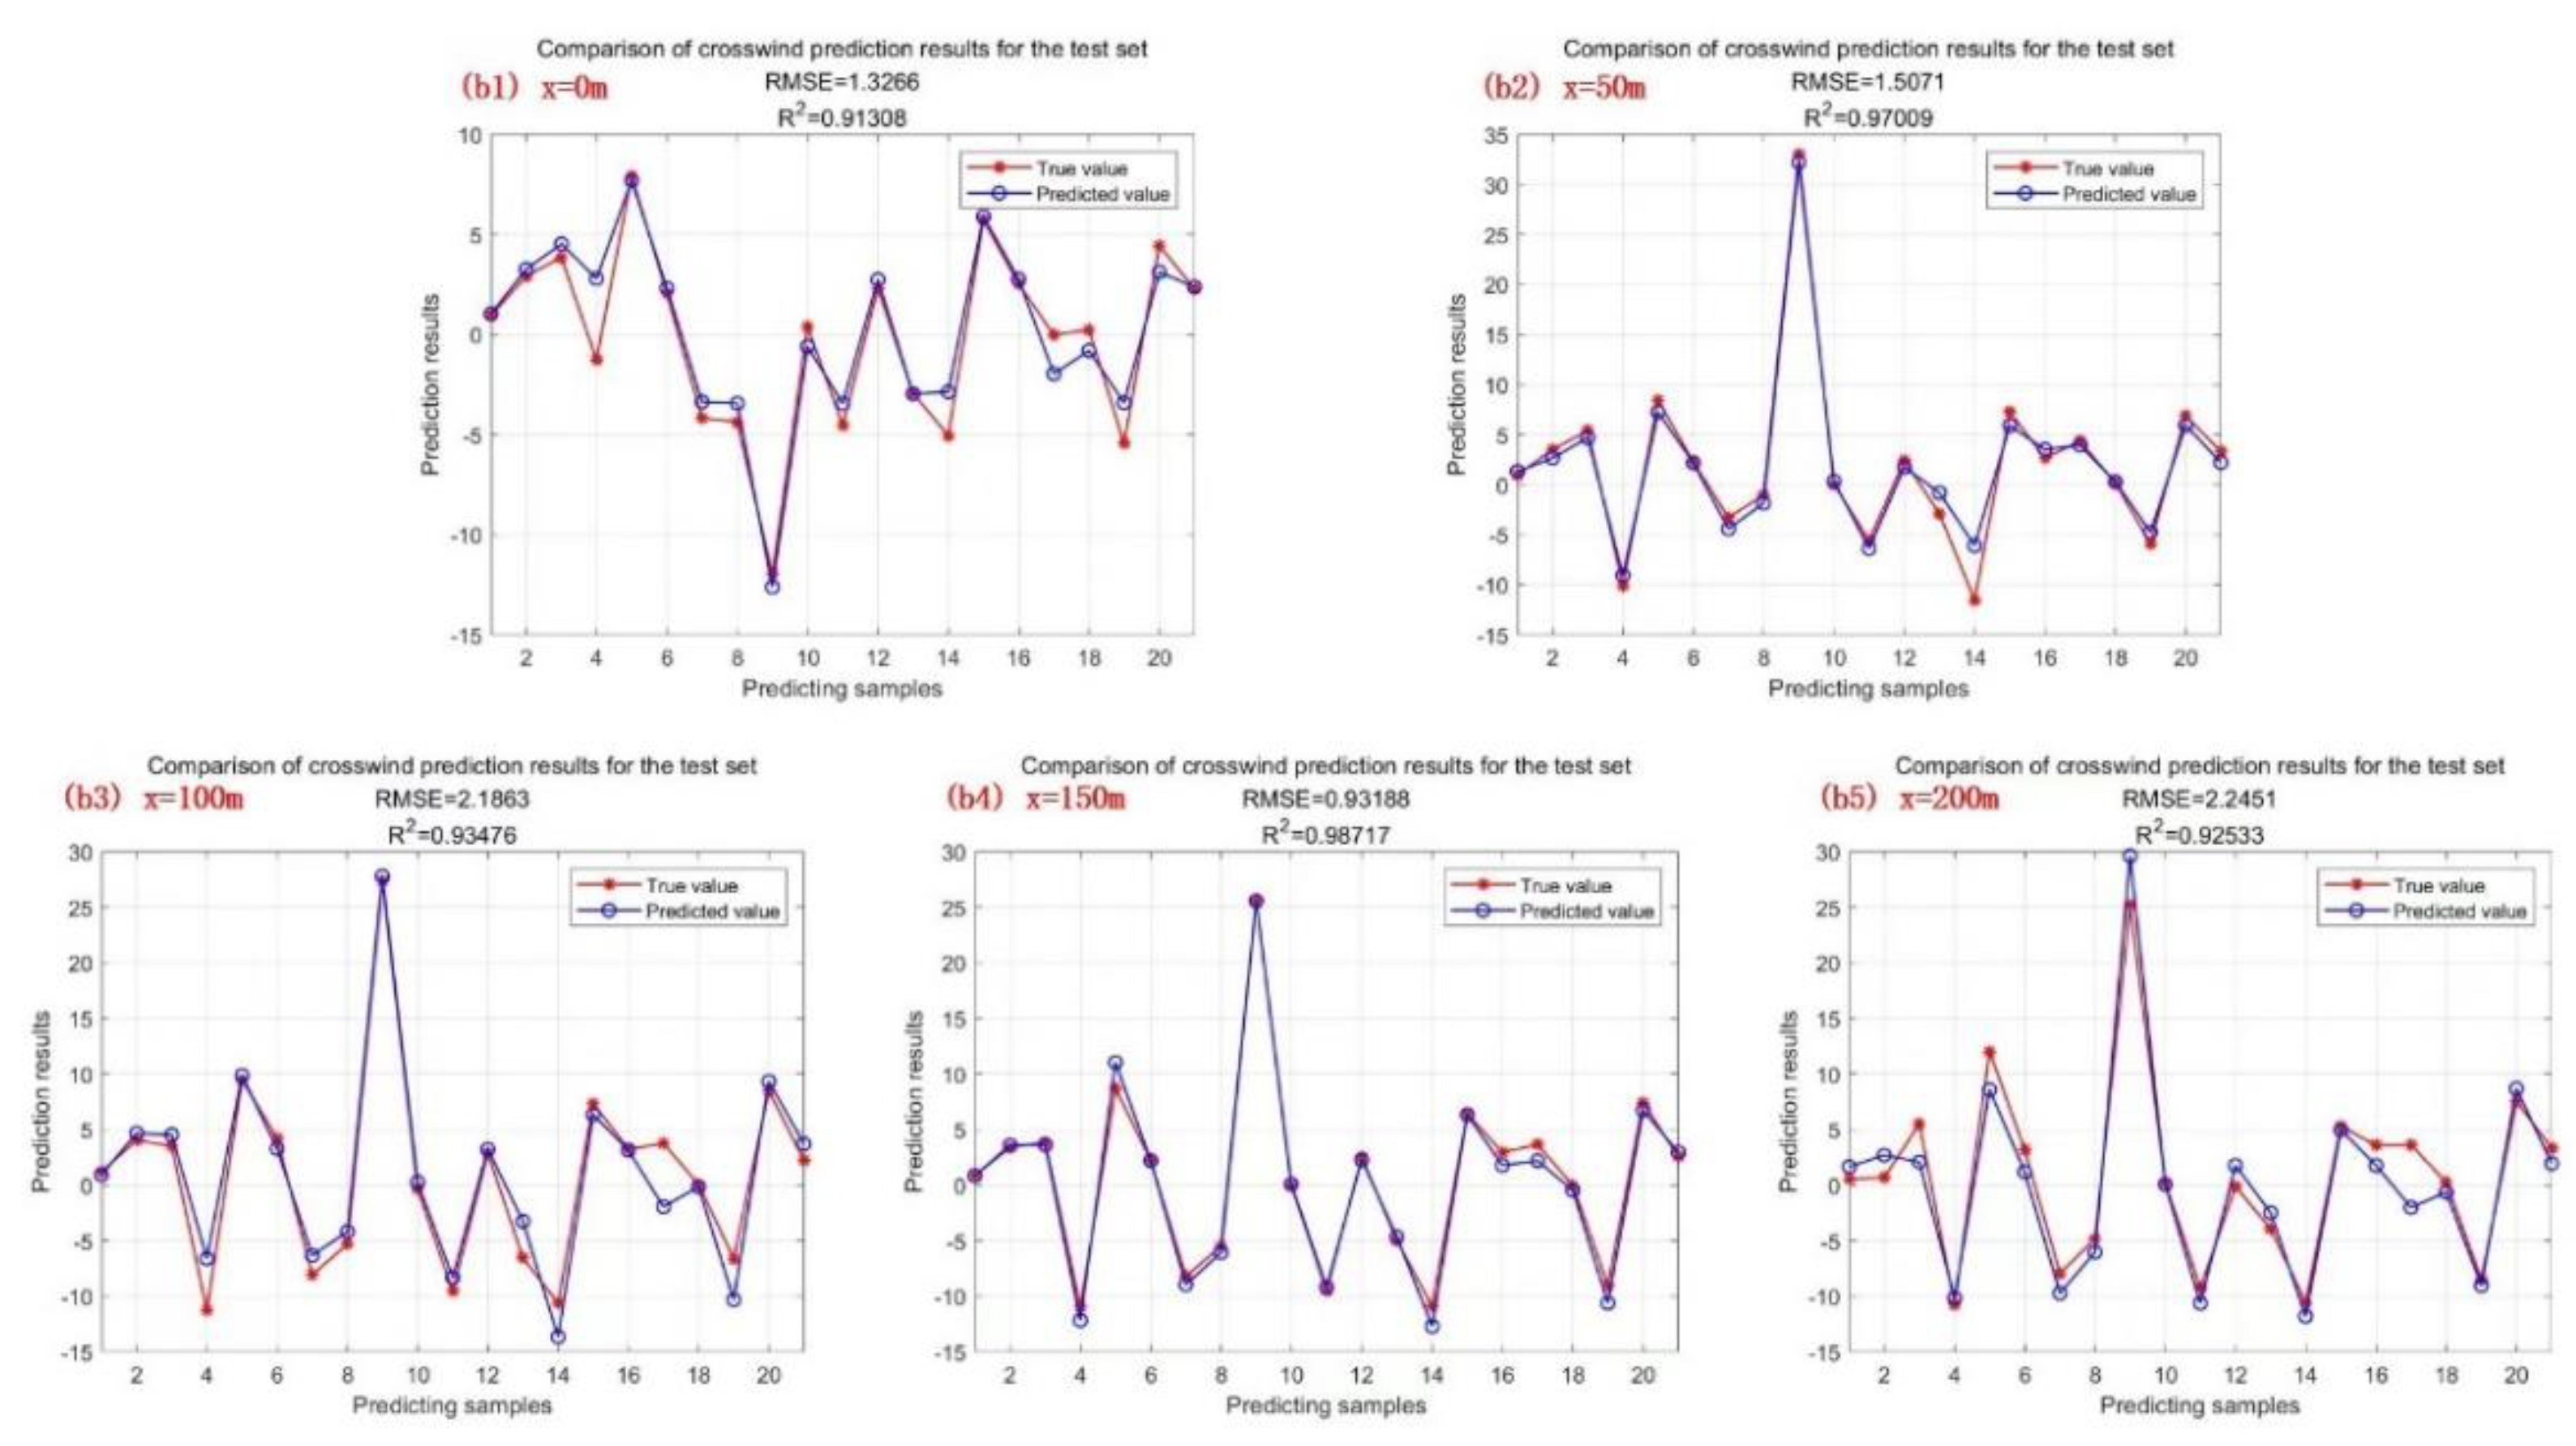
Figure 9.
Prediction results of the vertical wind BP model along the glide path at various distances behind the stern(c1)-(c5).
Figure 9.
Prediction results of the vertical wind BP model along the glide path at various distances behind the stern(c1)-(c5).
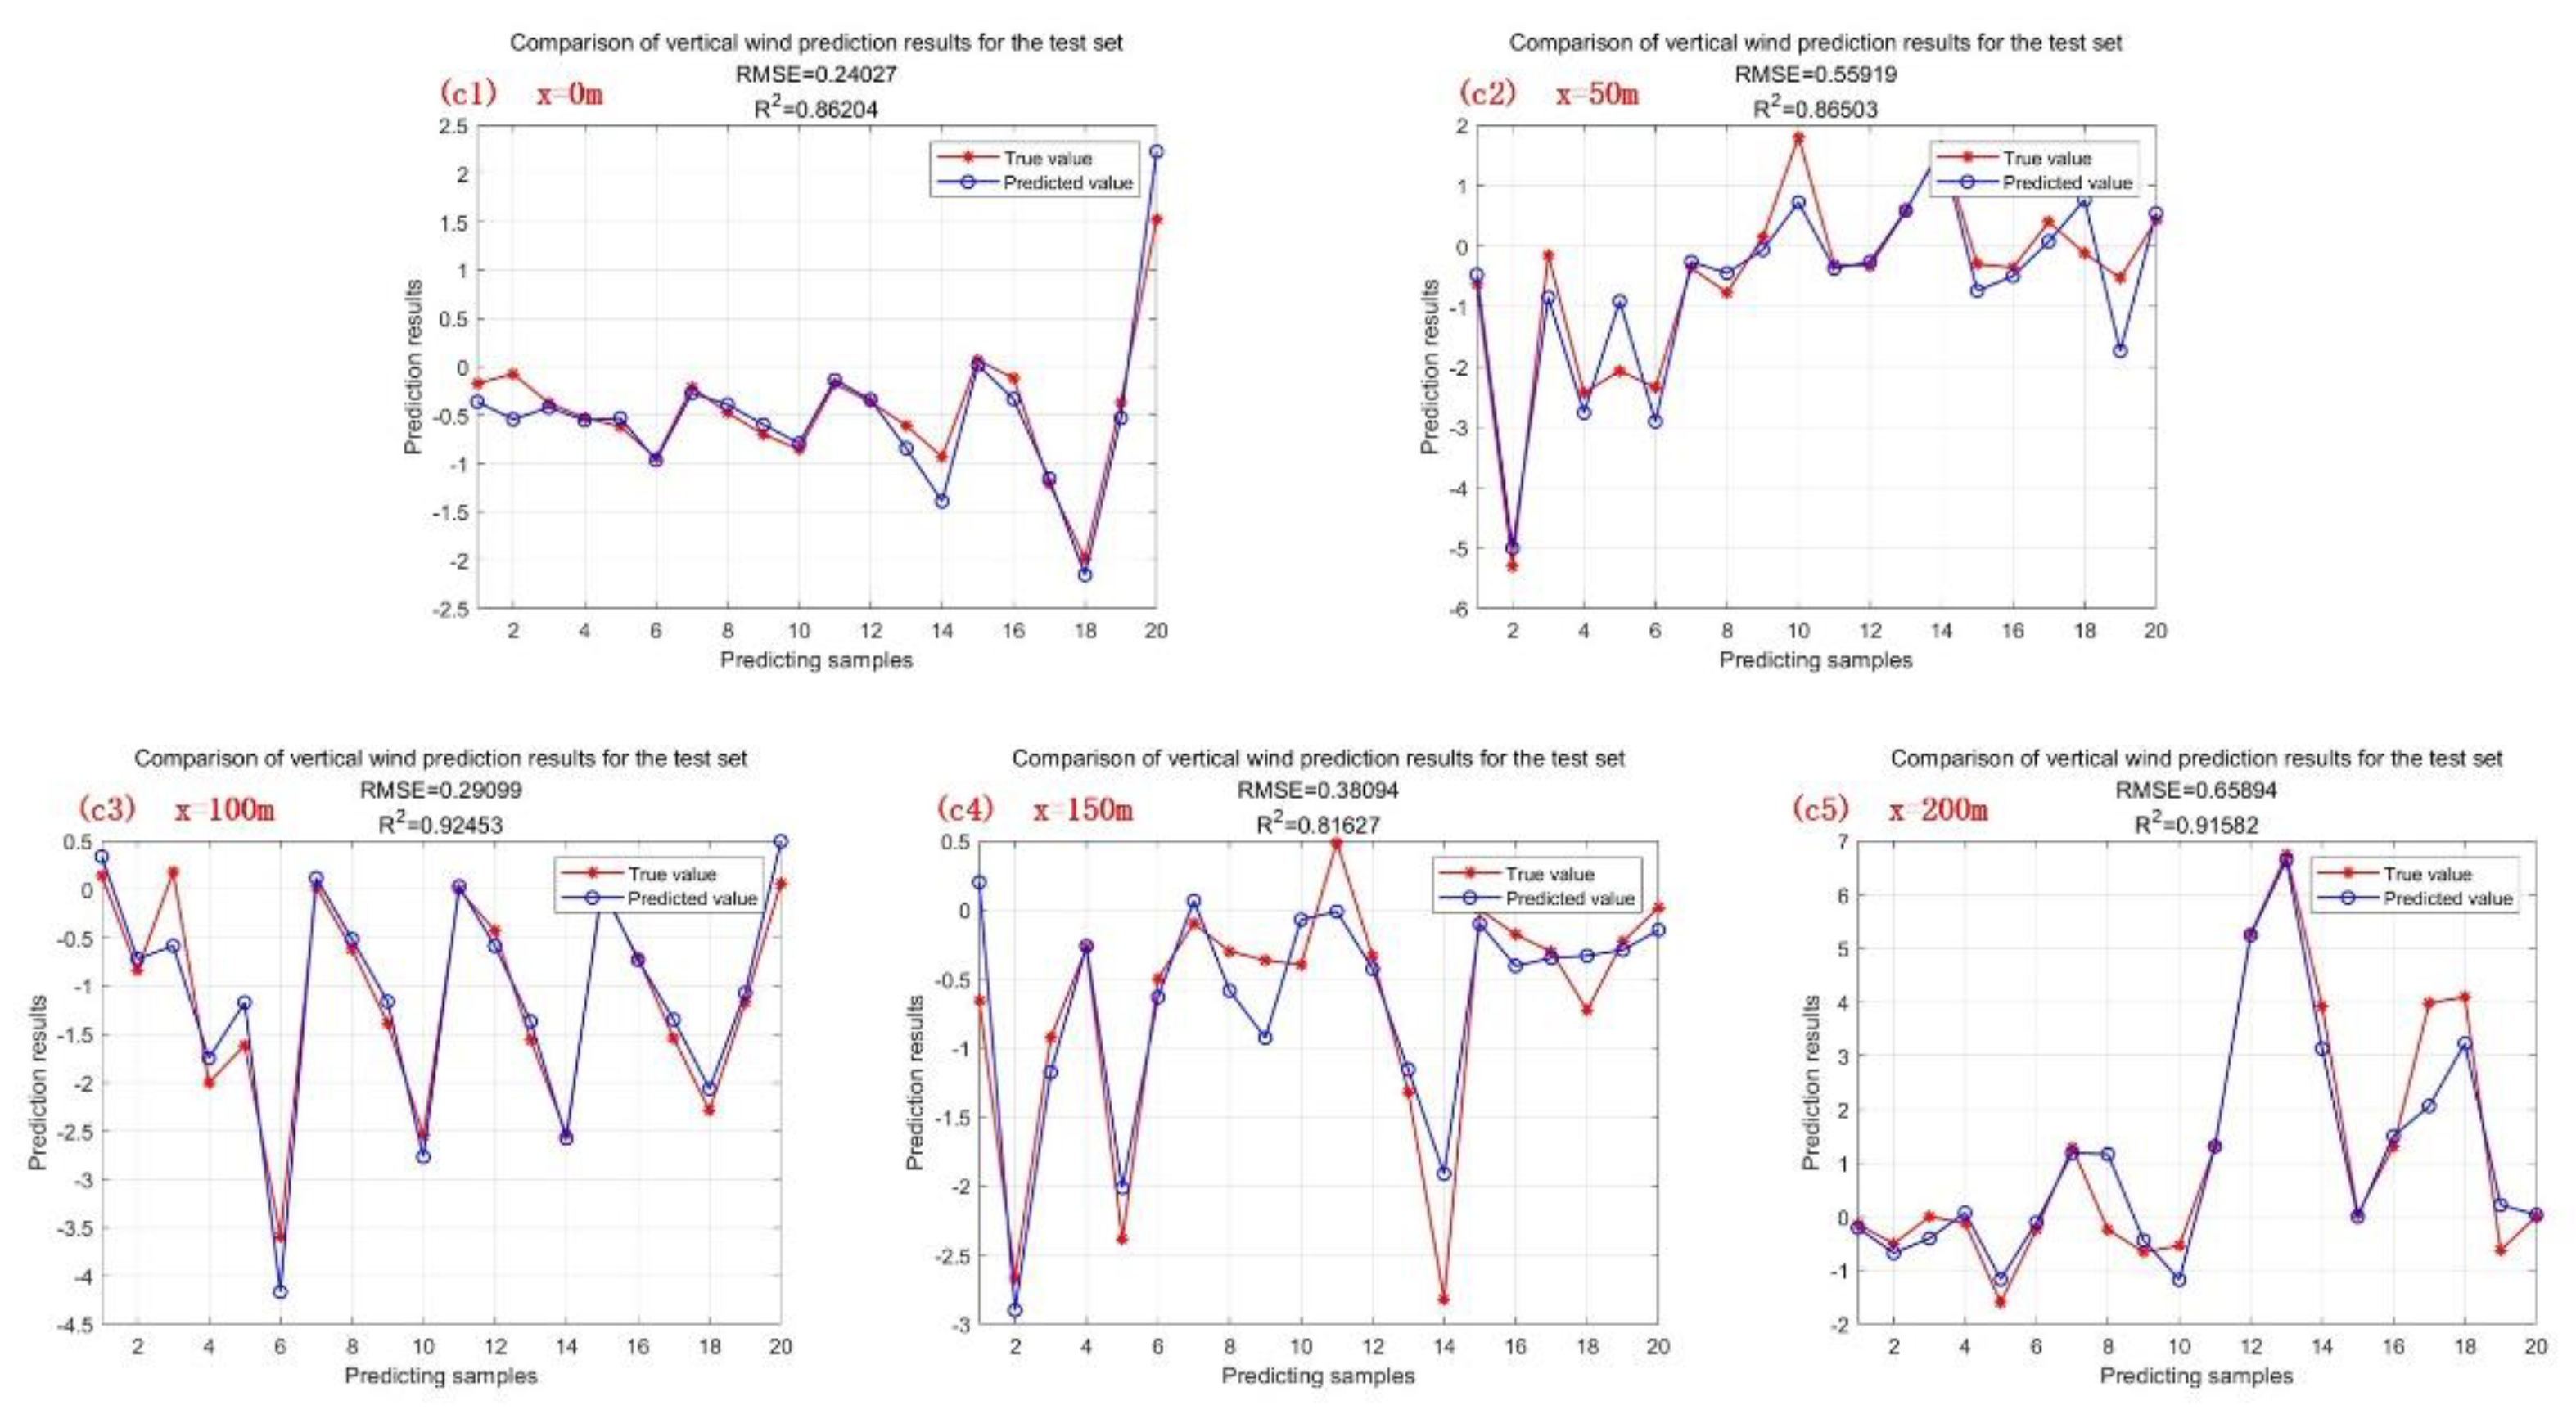

Table 1.
Headwind conditions of training samples.
| inflow angle (°) | 0 | ±5 | ±9 | ±12 | ±15 | ±30 | ±45 | ±60 | |
|---|---|---|---|---|---|---|---|---|---|
| inflow speed (m/s) | |||||||||
| 5 | ✓ | ✓ | ✓ | ✓ | ✓ | ✓ | ✓ | ✓ | |
| 10 | ✓ | ✓ | ✓ | ✓ | ✓ | ✓ | ✓ | ✓ | |
| 15 | ✓ | ✓ | ✓ | ✓ | ✓ | ✓ | ✓ | ✓ | |
| 20 | ✓ | ✓ | ✓ | ✓ | ✓ | ✓ | ✓ | ✓ | |
| 25 | ✓ | ✓ | ✓ | ✓ | ✓ | ✓ | ✓ | ✓ | |
| 30 | ✓ | ✓ | ✓ | ✓ | ✓ | ✓ | ✓ | ✓ | |
| 35 | ✓ | ✓ | ✓ | ✓ | ✓ | ✓ | ✓ | ✓ | |
| 40 | ✓ | ✓ 1 | ✓ | ✓ | ✓ | ✓ | ✓ | ✓ | |
“+” means that the inflow is coming from the port side, “-” means that the inflow is coming from the starboard side.
Table 2.
Headwind conditions of testing samples.
| inflow angle (°) | 0 | ±5 | 8 | 12 | 15 | 20 | 60 | |
|---|---|---|---|---|---|---|---|---|
| inflow speed (m/s) | ||||||||
| 8 | ✓ | ✓ | ✓ | ✓ | ✓ | |||
| 18 | ✓ | ✓ | ✓ | ✓ | ✓ | |||
| 28 | ✓ | ✓ | ✓ | ✓ | ||||
| 38 | ✓ | ✓ | ✓ | ✓ | ||||
“+” means that the inflow is coming from the port side, “-” means that the inflow is coming from the starboard side.
Disclaimer/Publisher’s Note: The statements, opinions and data contained in all publications are solely those of the individual author(s) and contributor(s) and not of MDPI and/or the editor(s). MDPI and/or the editor(s) disclaim responsibility for any injury to people or property resulting from any ideas, methods, instructions or products referred to in the content. |
© 2025 by the authors. Licensee MDPI, Basel, Switzerland. This article is an open access article distributed under the terms and conditions of the Creative Commons Attribution (CC BY) license (http://creativecommons.org/licenses/by/4.0/).
Copyright: This open access article is published under a Creative Commons CC BY 4.0 license, which permit the free download, distribution, and reuse, provided that the author and preprint are cited in any reuse.


