
Submitted:
01 September 2025
Posted:
02 September 2025
You are already at the latest version
Abstract
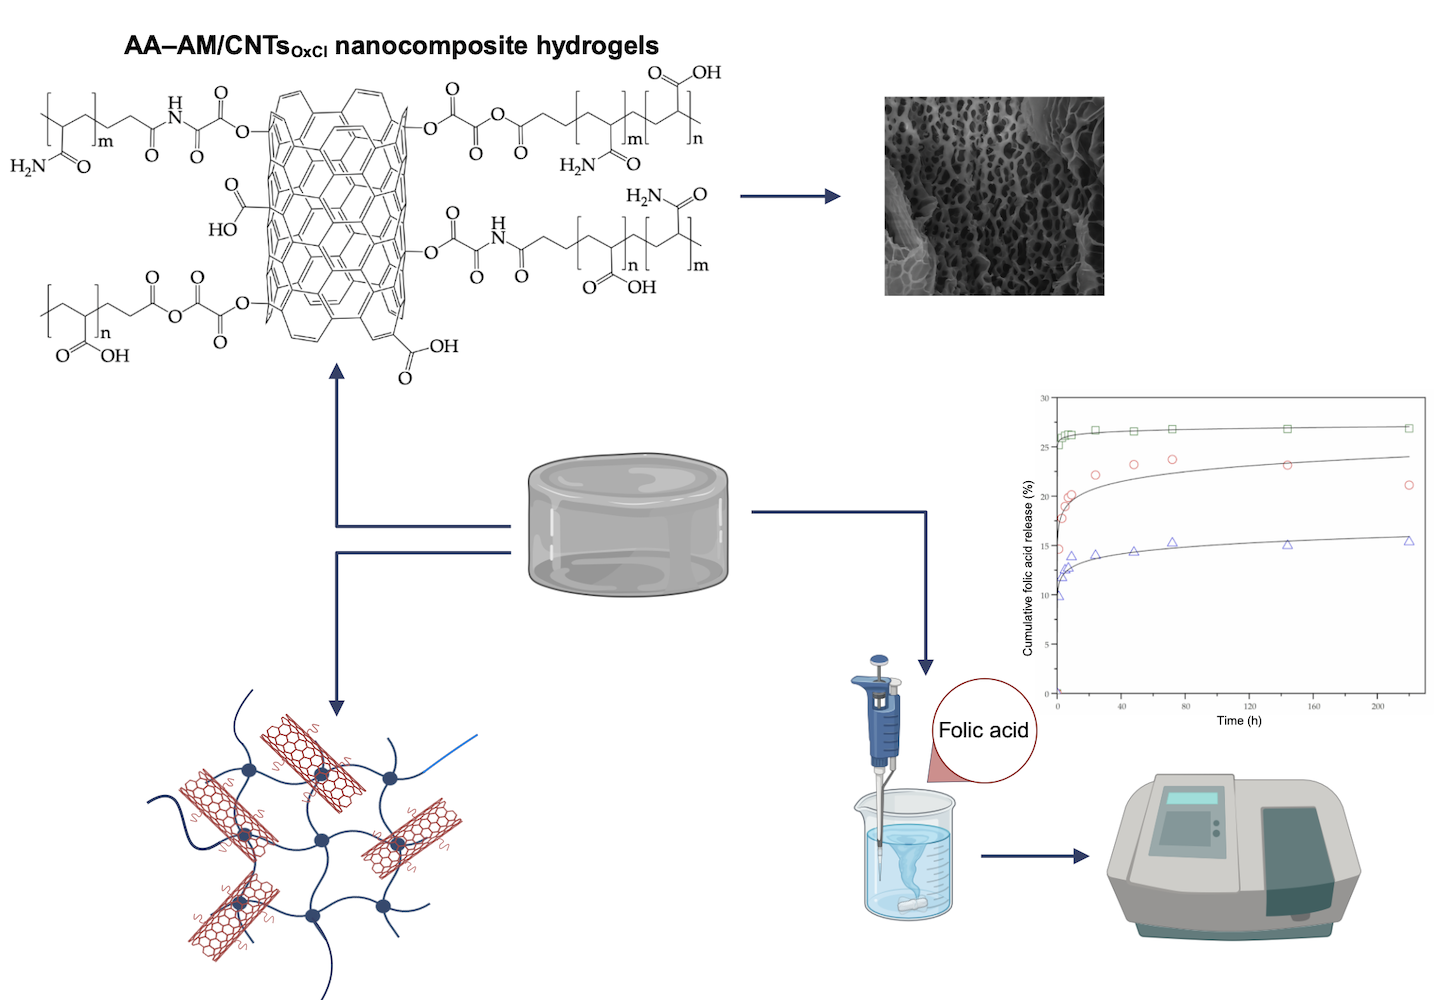
Hydrogels of acrylamide (AM)–acrylic acid (AA) and nanocomposite hydrogels of AM – AA and carbon nanotubes (CNTs) functionalized with acyl chloride groups (CNTsOxCl) were synthesized and characterized, and their ability to release folic acid was analyzed. Both hydrogel types were synthesized via redox polymerization. CNTs were prepared via chemical vapor deposition. The prepared samples were analyzed via transmission electron microscopy, Raman spectroscopy, X–ray photoelectron spectroscopy, and field-emission scanning electron microscopy. Their swelling ability and their mechanical properties (compression tests) were determined at room temperature (~25 °C (298.15 K)), whereas their ability to release folic acid was studied using UV–VIS spectroscopy. The equilibrium swelling of the AM–AA hydrogels was greater than that of the AM–AA/CNTsOxCl nanocomposite hydrogels prepared at the same monomeric relation (wt%), whereas the Young moduli of these nanocomposite hydrogels were higher than that of AM–AA hydrogels. For the AM–AA/CNTsOxCl nanocomposite hydrogels, polymer chains containing AM and AA units were grafted to CNTsOxCl. Folic acid release from the AM–AA hydrogels and AM–AA/CNTsOxCl nanocomposite hydrogels was successfully adjusted using the Weibull model.
Keywords:
hydrogels
; carbon nanotubes
; nanocomposites
; acrylamide
; acrylic acid
; folic acid
1. Introduction
The design of stimuli–responsive drug delivery systems (DDS) has attracted considerable interest in recent years. DDS are sensitive to external stimuli and can provide targeted and controlled drug delivery. Among these, hydrogels have been highlighted for their biocompatibility, nontoxicity, high water content, swelling capacity, and compatibility with several cellular lines [1,2].
Depending on their nature or the type of energy applied, the stimuli that trigger drug release from a specific DDS can be classified into three types: (i) chemical (pH and ionic strength), (ii) physical (temperature, ultrasound, osmotic pressure, and magnetic field), and (iii) biological (endogenous receptors and enzymes) stimulii [3].
Among thermoresponsive polymers, hydrogels are of particular interest owing to their permeability, allowing the diffusion of water or biological fluids, which can be exploited in DDS [4]. Thermoresponsive polymers can be classified into two groups: those with a lower critical solution temperature (LCST), and those with an upper critical solution temperature (UCST) [5]. Thermoresponsiveness involves a sharp transition within a narrow temperature range [6]. Hydrogels with UCST shrink below this temperature but swell upon heating. Their use as drug carriers is rarely reported because such materials are uncommon, particularly under physiological conditions [7]. Nevertheless, UCST hydrogels are of interest for treating fever-related diseases, where elevated body temperatures can induce drug release [8].
The poly(acrylic acid–co–acrylamide) [P(AA–co–AM)] copolymer hydrogel is both pH– and temperature–responsive and exhibits a UCST that decreases with increasing pH [9]. Several studies have characterized P(AA–co–AM) hydrogels and evaluated their drug delivery potential. Ding et al. prepared P(AA–co–AM) hydrogels that were combined with biocompatible SiO2 and polypyrrole (PPy) to obtain a light–, thermal–, and pH–responsive DDS, and evaluated their ability to release 5–fluorouracil (5–FU), an anti–cancer drug. In this system, PPy can convert near–infrared (NIR) irradiation into heat, maintaining the temperature in the UCST range of P(AA–co–AM), while the SiO2 particles reduce burst release, achieving 83.9% cumulative release of 5–FU of at 6 h in pH 7.4 [10]. Ray et al. synthesized both P(AA–co–AM) normal hydrogels and P(AA–co–AM) hydrogel nanoparticles via free–radical polymerization using N,N–methylene–bis–acrylamide (MBA) as the cross–linker and potassium persulfate as the initiator. Their results showed that the nanoparticles were more effective drug carriers for colon-targeted 5-FU release than the P(AA–co–AM) normal hydrogel [11]. Similarly, Thippeswamy et al. synthesized P(AA–co–AM) hydrogels using MBA as the crosslinking agent, and potassium persulfate and sodium metabisulfite were used as the initiators. They evaluated the release of moxifloxacin hydrochloride as a function of pH and observed a higher release at pH 7.4 (99%) than that at 1.2 (18%), with the swelling ratio also increasing with temperature and the Higuchi model successfully describing the release kinetics [12].
Although P(AA–co–AM) hydrogels have been implemented as drug carriers, several challenges remain. The mechanical properties of hydrogels play a crucial role in drug delivery applications. In P(AA–co–AM) hydrogels synthesized via radical polymerization, increasing the cross-linker agent concentration improves the mechanical properties; however, it has a negative impact on the swelling capacity due to decreased porosity, which may in turn slow drug release by limiting diffusion through capillary channels [13].
Carbon nanotubes (CNTs) possess outstanding chemical, mechanical, electrical, and thermal properties, and are considered as the most robust materials known in nature [14]. Their high axial strength [15] and high Young’s modulus, in the range of 0.32–1.47 TPa for single–walled CNTs (SWCNTs) and 0.27–0.95 TPa for multi–walled CNTs (MWCNTs) [16] make them excellent reinforcing agents. CNTs can be dispersed within polymers (used as a matrix) to prepare polymer nanocomposites with enhanced performance. CNT–polymer nanocomposites and smart hydrogels exhibit significant potential for drug delivery and constitute a promising strategy for treating lethal diseases [17].
The use of CNTs as a reinforcing agent to enhance the mechanical properties of poly(acrylamide)–based hydrogels has been well documented. Feng et al. prepared poly(acrylamide)–MWCNT nanocomposite hydrogels via radiation–induced polymerization and evaluated their mechanical properties. Compressive tests revealed extremely high mechanical strengths for these composites compared with the pristine poly(acrylamide) hydrogel, even when the content of MWCNTs was as low as 0.05 wt%, while maintaining a high water content (> 80 wt%). These nanocomposites also exhibited higher elastic moduli compared with pure poly(acrylamide) hydrogels [18]. Takada et al. evaluated the tensile elastic modulus and swelling of polyacrylamide (PAAm)/polyacrylic acid (PAAc) nanocomposite hydrogels (with two structures: a random copolymer and an interpenetrating network (IPN)) reinforced with MWCNTs. Both structures showed higher tensile elastic moduli than those of the pristine PAAm/PAAc hydrogels and decreased swelling. Furthermore, the structure of the nanocomposite hydrogels influences their mechanical response, exhibiting a higher tensile modulus than random copolymers [19]. Kanca et al. prepared nanocomposite hydrogels by incorporating MWCNTs into a covalently bonded PAAm/PAAc hydrogel, with scanning electron microscopy revealing a homogenous MWCNTs distribution. Moreover, compression tests at 10%–40% strain (strain rate 1/min) in phosphate–buffered saline at room temperature revealed that the nanocomposite hydrogels (prepared with 0.5% and 1.0% MWCNTs) had higher compressive moduli than that of pristine PAAm/PAAc hydrogels, confirming their potential as cartilage substitutes [20].
The choice of drug is also critical in drug release studies. Folic acid (FA) is a particularly attractive biological molecule, because it targets folic acid receptors, which are often overexpressed on the surface of cancer cells [21]. The use of FA as a “Trojan horse” strategy for drug delivery to cancer cells has been explored previously [22], motivating the design of DDSs loaded with FA.
In this study, AM–AA hydrogels and AM–AA/CNTsOxCl nanocomposite hydrogels were synthesized and characterized, and their capacity to release FA was evaluated. CNTs were synthesized via chemical vapor deposition (CVD), purified with overheated steam, partially oxidized through acid treatment, and chemically functionalized with oxalyl chloride (OxCl) to insert acyl chloride functionalities on their walls. Functionalized CNTs (CNTsOxCl) were used to prepare nanocomposite hydrogels, and the AM–AA and AM–AA/CNTsOxCl nanocomposite hydrogels were prepared via redox polymerization. The morphologies of the purified CNTs, partially oxidized CNTs, and functionalized CNTs were examined using transmission electron microscopy (TEM). Raman spectroscopy was used to study the vibrational behaviors of the partially oxidized and functionalized CNTs, as well as the AM–AA hydrogels and AM–AA/CNTsOxCl nanocomposite hydrogels. Swelling data were fitted using a second–order kinetic model. All hydrogels were further analyzed by X–ray photoelectron spectroscopy (XPS) and field-emission scanning electron microscopy (FE–SEM), and their mechanical properties were evaluated using compression tests. FA release from the prepared hydrogels was examined using various kinetic models.
2. Materials and Methods
2.1. Materials
Acrylamide (AM) (99.9% purity) was purchased from IBI Corp. (Armonk, NY, USA). N,N’–methylene–bis–acrylamide (NMBA) (99%), acrylic acid (AA) (99%), potassium persulfate (KPS) (99%), oxalyl chloride (98%), dichloromethane (ACS reagent), hydrochloric acid (37.5%), triethylamine (Et3N) (99%), and FA (97%) were provided by Sigma–Aldrich (Saint Louis, MO, USA). Argon gas (99.998%) was obtained from PRAXAIR (Guadalajara, Mexico). Nitrogen gas (99.99%) was obtained from INFRA (Guadalajara, Mexico). Alumina boats were purchased from Alfa Aesar (Tewksbury, MA). Anhydrous ethanol (99.8%) was obtained from Fermont (Monterrey, Mexico). Ferric nitrate nonahydrate (Fe(NO3)3 · 9H2O) (98.2%), sodium bisulfite (NaHSO3) (ACS reagent), and nitric acid (70%) were acquired from Golden Bell (Guadalajara, México). Double–distilled water was obtained from Productos Selectropura (Guadalajara, Mexico). All the mentioned chemical reagents were employed without further purification.
2.2. Synthesis, Purification, Partial Oxidization, and Chemical Functionalization of CNTs
CNTs were synthesized via CVD following our previously reported method [23]. Pristine CNTs were purified using overheated steam following our previously reported methodology [24]; the purified CNTs are denoted as CNTspur. CNTspur were washed repeatedly with water and dried in an oven at 60 °C (333.15 K) for 24 h, followed by acidic treatment under reflux to partially oxidized them. Acidic treatment involved placing 1 g of CNTspur in a 250-cm3 glass Soxhlet apparatus together with 100 cm3 of a 4 M nitric acid solution. The mixture was heated until seven reflux cycles occurred, followed by washing with double–distilled water until obtaining a pH of 7. The product (partially oxidized CNTs) was dried in an oven at 60 °C (333.15 K) to a constant weight and was named CNTspoxi. The content of the hydroxyl and acidic carboxyl groups inserted into the walls of CNTspoxi was calculated via previously reported indirect back-titration methods, where a hydrochloric acid solution was reacted with excess sodium bicarbonate to determine the amount of acidic carboxyl groups, or with an excess sodium hydroxide solution to calculate the amount of hydroxyl groups [25,26]. CNTspoxi were treated with OxCl to create acyl chloride functionalities on their walls, following our previously reported chemical procedure [27]. Briefly, 0.5 g of CNTspoxi was placed in a 100-mL glass reactor partially immersed in an oil bath at 50 °C (323.15 K), followed by the addition of 95 μL of Et3N dissolved in 5 mL of dichloromethane. The dispersion was stirred under a nitrogen atmosphere. After 15 min, 325 μL of OxCl dissolved in 25 mL of dichloromethane was added dropwise with a syringe and allowed to react for at least 1 h. Subsequently, the solvent was completely evaporated at 60 °C (333.15 K), and the product was named CNTsOxCl and stored in a desiccator to remove any moisture.
2.4. Synthesis and Purification of the AM–AA Hydrogels and AM–AA/CNTsOxCl Nanocomposite Hydrogels
AM–AA and AM–AA/CNTsOxCl nanocomposite hydrogels were synthesized via redox polymerization. For AM–AA hydrogel synthesis, a mixture of potassium persulfate (0.05 wt%) and sodium bisulfite (0.05 wt%) was used as the redox initiator, while N,N’–methylene–bis(acrylamide) (0.1 wt%) was employed as the cross–linker agent. Furthermore, a mixture prepared from three different weight ratios of AM and AA (7/3, 8/2, or 9/1 w/w of AM/AA) was used as the co–monomeric mixture (10 wt%) with 89.8 wt% water. For the synthesis of the AM–AA/CNTsOxCl nanocomposite hydrogels, similar formulations were employed, with 0.1 wt% CNTsOxCl and a reduced water content (89.7 wt%). Table 1 lists the identification of samples of prepared hydrogels as a function of its formulation. The preparation of the hydrogels with or without CNTsOxCl was conducted in a similar way; for preparing the AM–AA hydrogels, aqueous solutions of the monomer mixture of AM/AA, NMBA, and the initiator system KPS/NaHSO3 were prepared separately. Each solution was bubbled with N2 for 5 min, after which, the three solutions were mixed and placed in a glass tube. The resulting mixture was stirred for 5 min and partially submerged in a water bath at 40 °C (313.15 K); the hydrogel synthesis was performed for 24 h.
To synthesize the AM–AA/CNTsOxCl nanocomposite hydrogels, aqueous solutions of AM/AA, NMBA, and KPS/NaHSO3 were prepared separately. The three solutions were bubbled with N2 gas for 5 min, after which, an amount of CNTsOxCl was added to the monomeric solution and the dispersion was stirred in an ultrasonic bath (3510R–MTH Bransonic Ultrasonic Cleaner, Danbury, USA) operated at 42 KHz ± 6%, and 100 W for 15 min to ensure homogenous dispersion of the functionalized CNTs. The dispersion, together with the NMBA and KPS/NaHSO3 solutions were mixed and stirred in a glass tube for 10 min, then immersed in a water bath at 40 °C (313.15 K) to initiate nanocomposite hydrogel synthesis. The reaction was allowed to proceed for 24 h. Scheme 1 presents the hypothetical chemical reaction, showing polymeric chains formed for AM and AA units randomly distributed grafted onto functionalized CNTsOxCl decorated with monomeric units of AA and AM. In the synthesized AM–AA/CNTsOxCl nanocomposite hydrogels, this structure was embedded within the gel network.
After polymerization, the hydrogels were recovered by breaking each glass tube. Then, each hydrogel was cut into disks (0.5 in i.d., 0.4 in length) and washed to remove any unreacted residual monomers and other chemical agents, followed by immersion in a 500-mL beaker containing 250 mL of water (water was renewed every 2 d for at least 8 d) until the pH reached 7. The disks were then dried at room temperature for at least 7 d to a constant weight. The dry gel disks (xerogels) were characterized using various experimental techniques and employed in swelling studies.
2.5. CNTs, AM–AA Hydrogels, and AM–AA/CNTsOxCl Nanocomposite Hydrogels Characterization
2.5.1. Transmission Electron Microscopy (TEM)
Purified, partially oxidized, and functionalized CNTs were examined using a transmission electron microscope (JEOL, Peabody, MA, USA; model 1010) operated at 200 kV. The samples were completely dried in an oven at 70 °C (343.15 K) for at least 72 h prior to analysis. Subsequently, a small amount of the sample (approximately 0.010 g) was dispersed in 2 mL of acetone, followed by sonication for 5 min at room temperature. An aliquot was drop-cast onto a copper grid using a Pasteur pipette and dried under a 60-W solar lamp for 20 min prior to examination.
2.5.2. Raman Spectroscopy
The partially oxidized CNTs, functionalized CNTs, AM–AA hydrogels, and AM–AA/CNTsOxCl nanocomposite hydrogels were analyzed via Raman spectroscopy using a Dilor (Villeneuve–d’Ascq, France) Lab Raman II spectrometer equipped with a HeNe laser. The spectrometer was operated at 20 mW with an excitation wavelength of 632.8 nm. A 50 objective with a spot area of 2 mm and 2 cm–1 error was used to perform the measurements.
2.5.3. X–Ray Photoelectron Spectroscopy (XPS)
The AA hydrogels and AM–AA/CNTsOxCl nanocomposite hydrogels were analyzed via XPS using a Phoibos 150 spectrometer with a one-dimensional detector 1D–DLD (SPECS, Berlin, Germany) and an XR50 M monochromatic Al Kα1 (hv = 1486. eV) X–ray source. Prior to analysis, the samples were deposited on a steel sample holder using copper tape to avoid the interface from the carbon tape. Subsequently, they were dried in a vacuum oven for 48 h and then placed in the prechamber (base pressure, 4.2 10–10 mbar). Measurements were acquired at 150 W, with an electron take-off angle of 90°, pass energy of 10 eV, and step size of 0.1 eV. A flood gun was employed for charge neutralization, and spectra were calibrated to the C–C binding energy.
2.5.4. Field–Emission Scanning Electron Microscopy (FE–SEM)
The AM–AA hydrogels and AM–AA/CNTsOxCl nanocomposite hydrogels were examined using a MIRA 3LU field-emission scanning electron microscope (FE–SEM) (Tescan, Brno, Czech Republic). Prior to analysis, the samples were dried in an oven at 60 °C (333.15 K) for 72 h, after which, approximately 0.01 g of each sample was mixed with 1 cm3 of acetone at room temperature (~25 °C (298.15 K)), sonicated for 5 min, and drop-cast onto a copper grid using a Pasteur pipette. After acetone evaporation, the sample was introduced to an SCD004 golden evaporator (BalTec AG, Pfäffikon, Switzerland), and a thin gold layer was applied through a 20-s electrodeposition process before FE–SEM examination.
2.5.5. Swelling Tests
The swelling kinetics of the AM–AA and AM–AA/CNTsOxCl hydrogels were determined gravimetrically. Hydrogel disks were washed repeatedly with water to eliminate any residual chemical reagents, followed by drying in an oven at room temperature for at least 7 d to a constant weight. The dry disks (xerogels) were weighed and immersed in double-distilled water in sealed 300-mL plastic containers and the swelling tests were performed at room temperature (~25 °C (298.15 K)). At specific time points, the disks were recovered, blotted with absorbent tissue paper to remove any excess water, and weighed. The swelling ratio (Sw) was determined as follows:
Where and are the weights of the xerogel and hydrogel, respectively, at time t. The weights of the three disks were measured at the same time to record the average swelling value and swelling was followed until equilibrium. Data were fitted to a second–order kinetic model as follows [28]:
Where is the rate constant, is the water uptake at time , and is the equilibrium water uptake. The following equation was used to determine k:
Where the values of and are determined at time zero and time t, respectively.
2.5.6. Mechanical Tests
Compression tests were performed on AM–AA hydrogel and AM–AA/CNTsOxCl nanocomposite hydrogel disks swollen to equilibrium at room temperature (~25 °C (298.15 K)) using an ARES G2 rheometer (TA Instruments, New Castle, Delaware, USA) operated in parallel dish mode. The disks (2.7 cm i.d. and 1.2 cm thickness) were compressed and the Young’s modulus (E) was determined from the slope of the initial zone of the stress–strain curve (< 5% strain) using the following equation:
Where λ is the deformation ratio of the deformed (h) to the initial thickness (h0) of the hydrogel disks, and τ is the applied stress.
2.5.7. UV–Vis Spectroscopy
The in vitro FA release from the AM–AA hydrogels and AM–AA/CNTsOxCl nanocomposite hydrogels was determined via UV–Vis spectroscopy. The release profile of FA was determined by considering the absorbance as a function of time using an S–2150 UNICO spectrometer (South Brunswick, New Jersey, USA), after establishing a calibration curve at λ = 295 nm. To load FA, xerogels (0.2 g) were immersed in 50 mL of an aqueous solution of 100 ppm FA for 72 h at room temperature (~25 °C (298.15 K)) under constant stirring to achieve FA caption during hydrogel swelling. Measurements were performed in triplicate in an aqueous medium, avoiding exposure to visible light.
3. Results and Discussion
Figure 1 shows the TEM micrographs of the CNTspur sample. In Figure 1A, a helical CNT is observed, whereas in Figure 1B, a straight CNT is detected. Both nanostructure types were observed in the same CNTspur sample. Structural analysis of the CNTs employed in the preparation of the nanocomposite hydrogels is important because, owing to the high anisotropy of graphite, the mechanical properties of CNTs strongly depend on their morphology [29]. The helical CNTs reach lengths greater than 1 μm, with diameters of approximately 100 nm. Such dimensions strongly suggest the presence of helical MWCNTs (HMWCNTs), consistent with our previously reported findings using a similar synthetic procedure [24]. Furthermore, the lengths of the straight CNTs are larger than several microns, with diameters of approximately 80 nm. The coexistence of helical and straight CNTs synthesized via CVD using Fe as a catalyst has been reported previously [30]. Theoretical studies and systematic measurements have determined that the Young’s modulus of HMWCNTs typically ranges from 300 to 1000 GPa, though values up to 1.28 TPa have been also reported [31]. For straight MWCNTs, the Young’s modulus is in the range from 1.05 to 1.58 TPa [32]. Owing to their curved sections, helical CNTs are expected to be more reactive than straight CNTs, because of the sensitivity detected at their curved tips.
To introduce hydroxyl and carboxyl groups into the CNTspur walls, partial oxidation was performed as described in the materials and methods section. Following the methodologies of Xia and Silva–Jara, the amounts of carboxyl and hydroxyl groups were 40.5 and 13.3 wt% per gram of CNTspoxi, respectively [25,26].
Figure 2 shows the Raman spectra of CNTspoxi (Figure 2A) and CNTsOxCl (Figure 2B), revealing three bands in both spectra. Table 2 lists the wavenumbers of the D, G, and G’ bands, the area of the G–band, and the ID/IG ratio determined from the scattering intensities of the D and G bands. At low frequencies, a disorder–induced band (D–band) is detected (at 1233 cm–1 in CNTspoxi and 1235 cm–1 in CNTsOxCl). A D-band is produced when a double–resonance process occurs, owing to elastic and inelastic scattering caused by defects and phonons, respectively [33]. In the Raman spectra of SWCNTs bundles, the D-band is observed between 1250 and 1450 cm–1 and depends on the mean nanotube diameter [34]. In MWCNTs, the D–band shifts to lower frequencies [35]. This finding confirms the presence of MWCNTs in the CNTspoxi and CNTsOxCl samples, consistent with the micrographs of CNTspoxi shown in Figure 1. The bands at 1485 cm–1 (CNTspoxi) and 1466 cm–1 (CNTsOxCl) are attributed to the graphite band (G–band), caused by a first–order Raman effect. The G-band of different carbonaceous materials is typically detected in the region of 1450–1750 cm–1 [36]. In CNTs, the G–band involves an optical phonon mode between two carbon atoms in one graphene unit cell, which constitutes the basic structure of a graphene sheet. This band is caused by high ordered carbon structures like those that form the walls of the CNTs. The shift of the G–band to lower frequencies in CNTsOxCl suggests a modification of the vibrational response of CNTsOxCl, caused by the presence of guest molecules with different electronic characteristics. According to the chemical functionalization route used in this study, this change can be attributed to the presence of acyl chloride groups on the CNTsOxCl walls. At higher frequencies, a G’-band is detected at 2436 cm–1 for CNTspoxi and 2461 cm–1 for CNTsOxCl. For carbonaceous materials, the G’–band is observed as a broad peak in the 2400–2800 cm–1 region [36], arising from a double–resonance process. G’–band is an overtone of the D–band and is observed in the spectrum of materials with sp2 bonded carbon atoms. Similarly to the D–band, the G’–band is sensitive to the chirality and diameter of CNTs. The clear differences in intensity and broadness of the G’–band detected in the spectra of CNTspoxi and CNTsOxCl are caused by the different structural arrangements of both CNT types. The ID/IG ratio is higher for CNTsOxCl than for CNTspoxi, indicating a decrease in the order and crystallinity after functionalization. Fantini et al. attributed such increases in disorder to the formation of structural defects caused by the attachment of chemical groups to the CNTs walls [37]. This supports the conclusion that the presence of acyl chloride groups in the CNTsOxCl walls increases the disorder of the walls. Our previous study involving Fourier transform infrared spectroscopy (FT–IR) confirmed the insertion of acyl chloride groups onto partially oxidized CNTs following a similar chemical route to that used in this work [27].
Figure 3 shows the Raman spectra of the Hydro 1 (Figure 3A), Hydro 2 (Figure 3B), and Hydro 3 (Figure 3C) hydrogels in the region of 200–2500 cm–1. The vibrational band assignments for the polyacrylamide chains (blue arrows) were based on a previous report [38]. In the spectrum of Hydro 3, characteristic peaks are observed at 796 cm–1 (CH2 rocking vibration), 1101 cm–1 (C–C skeletal stretching), 1233 cm–1 (NH2 wagging), 1352 cm–1 (CH2 wagging), and 1544 cm–1 (amide I, C=O stretching) [39]. Similar spectral contributions are detected in Hydro 2 and Hydro 1 at nearly the same frequencies. For poly(acrylic acid) chains (red arrows), most contributions appear as shoulders adjacent to the polyacrylamide chain bands, except for two peaks. In the spectrum of Hydro 1, a weak band at 921 cm–1 is assigned to the stretching vibrations of the carboxylic acid dimer, and an intense band at 1029 cm–1 is attributed to CH2 rocking [40]. The peaks assigned to the vibrations of the poly(acrylic acid) chains are detected at 843, 1127, 1224, and 1326 cm–1, attributed to C–COOH stretching [40], C-CH2 stretching, C–O stretching coupled with O–H in-plane bending, and –CCO stretching [41], respectively. Hydro 2 shows a very similar spectral pattern. Conversely, Hydro 3 exhibits a shift of the carboxylic acid dimer band to 930 cm–1 and the disappearance of the weak shoulders attributed to C–COOH stretching and C–O/O–H coupled vibrations in plane bending. These changes may be due to the higher poly(acrylic acid) chain content of Hydro 3, which modifies the vibrational frequencies of some sensitive groups. The coexistence of Raman bands due to the vibrations of the polyacrylamide and poly(acrylic acid) chains confirm the successful synthesis of the AM–AA hydrogels.
Figure 4 presents the Raman spectra of the nanocomposite hydrogels Nano Hydro 1 (Figure 4A), Nano Hydro 2 (Figure 4B), and Nano Hydro 3 (Figure 4C) recorded in the 200–2500 cm–1 region. Comparing the spectrum of Nano Hydro 1 with Hydro 1 (shown in Figure 3A), several differences are observed; although the majority of spectral contributions are similar, significant differences are also evident: (i) the amide I band (C=O stretching vibration of the amide functionality of the polyacrylamide chains) is detected at 1536 cm–1 in Nano Hydro 1, lower (redshift) than 1546 cm–1 in Hydro 1. This redshift indicates hydrogen bonding between the amide groups of the polyacrylamide chains and the hydroxyl or carboxyl groups (which did not react with OxCl) in the walls of CNTsOxCl, consistent with previously reported Raman spectroscopy findings [42]. (ii) The carboxylic acid dimer band observed at 921 cm–1 in the spectrum of Hydro 1 disappear in Nano Hydro 1, indicating no self–association of the carboxylic acid groups of the poly(acrylic acid) chains is developed. Instead, new hydrogen bonds likely form between the carboxyl groups of the poly(acrylic acid) chains and hydroxyl and carboxyl groups of CNTsOxCl in Nano Hydro 1. Supporting this, the –CCO stretching band shifts from 1326 cm–1 (Hydro 1) to 1322 cm–1 (Nano Hydro 1). It is also possible that in Nano Hydro 1, a high number of carboxylate ions included in the AA units are not associated via hydrogen bonds, because the shift of –CCO stretching band is small. It is important to mention that the formation of the dimer detected in Hydro 1 prevents the formation of carboxylate ions in the hydrogels prepared without CNTsOxCl. (iii) The most significant change is the appearance of the 1234 cm–1 band (orange arrow). In the spectrum of Hydro 1, a double band at 1236 cm–1 with a shoulder at 1224 cm–1 is detected, with a lower intensity than that of the nearby band at 1352 cm–1. In the spectrum of Nano Hydro 1, only one peak is observed at 1234 cm–1, with a higher intensity than that of the nearby band at 1353 cm–1, suggesting additional vibrations increasing the intensity of the 1234 cm–1 band. As shown in Figure 2, a D–band is detected at 1235 cm–1 in the spectrum of CNTsOxCl. Therefore, we consider that the increased intensity of the 1234 cm–1 band in the spectrum of Nano Hydro 1 is because of additional vibrations originating due to the presence of CNTsOxCl. Similar changes are observed in the spectra of Nano Hydro 2 and Nano Hydro 3.
Figure 5 shows the C1s core level normalized spectra of Nano Hydro 2 (Figure 5A) and Hydro 2 (Figure 5B), peak-fitted using the active background method included in AAnalyzer v 1.42 software [43]. The components and their atomic concentrations of Hydro 2 involve C–C / C–H bonds at 285.0 eV [44] (39.5%), CH–COOH bonds at 285.8 eV [45] (19.3%), –N–C=O bonds at 287.9 eV [46,47] (9.6%), and –O–C=O bonds at 289.0 eV [44] (7.7%). Furthermore, the components of Nano Hydro 2 and their atomic concentrations include C–C / C–H bonds at 285.0 eV [44] (39.4%), CH–COOH bonds at 285.9 eV [45] (9.2%), –N–C=O bonds at 288.1 eV [47] (6.1%), and –O–C=O bonds at 289.3 eV [44] (3.4%). The reduced molar concentrations and slight shifts to higher binding energies of the CH–COOH, –O–C=O, and –N–C=O bonds in Nano Hydro 2 compared with Hydro 2 suggest that chemical reactions occur, in which these chemical functionalities participate. Similar spectral behaviors have been reported previously [48,49]. Acyl chloride groups react with nucleophiles bonded to hydrogen atoms during addition-elimination reactions. Thus, based on the obtained results, we consider that the acyl chloride groups inserted on the CNTsOxCl walls react with the nitrogen atom of the amine bonds that form part of the primary amide functionality inserted on the acrylamide monomer, producing secondary amide groups and grafting these monomeric molecules onto CNTsOxCl. Because the acyl chloride functionality also reacts with water (the solvent used to prepare the hydrogels and nanocomposite hydrogels) to produce carboxyl groups, the reaction should be carried out at the beginning of the nanocomposite hydrogel synthesis. The left-hand side of the chemical reaction presented in Scheme 1 shows the AM units grafted onto the CNTsOxCl walls. In parallel, the hydroxyl groups inserted on the CNTsOxCl walls can react with the carboxyl groups that form part of either the acrylic acid monomer or poly(acrylic acid) chains to produce ester groups. Through this chemical path, monomeric acrylic acid units or poly(acrylic acid) oligomers (more available at the beginning of the nanocomposite hydrogel synthesis) are grafted onto the CNTsOxCl walls. The left-hand side of the chemical reaction in Scheme 1 also shows the AA units grafted onto the CNTsOxCl walls. Notably, owing to the synthesis of AM–AA hydrogels and AM–AA/CNTsOxCl nanocomposite hydrogels via radical polymerization, the grafted chains on CNTsOxCl contain randomly ordered AA and AM units.
Figure 6 shows the O1s core–level normalized spectra of Nano Hydro 2 (Figure 6A) and Hydro 2 (Figure 6B), with the components of the O1s spectrum of Hydro 2 being observed at two positions. The components and their atomic concentrations are Clattice at 530.6 eV [50] (3.5%) and O–C(=O)–C [51] / N–C(=O)–C [45] at 531.5 eV (4.5%). Conversely, the components of the O1s spectrum of Nano Hydro 2 are detected at three positions: Clattice at 530.3 eV [50] (5.8%), O–C(=O)–C [51] / N–C(=O)–C [45] / O–C(=O)–Ar [51] at 531.7 eV (13.6%), and O=C–O–C–O [51] at 532.8 eV (2.1%). Lattice oxygen atoms represent oxygen atoms within a bulk structure. In redox reactions, such as those used in this study for hydrogel and nanocomposite hydrogel synthesis, the lattice atoms can participate in electron transfer reactions [52]. Oxygen contamination of polyacrylamide gels during gel preparation has also been reported [53]. The higher atomic concentration of Olattice in Nano Hydro 2 compared with Hydro 2 indicates lattice oxygen contributions from CNTsOxCl. Furthermore, the increased atomic concentration of the bonds detected at 531.7 eV in the spectrum of Nano Hydro 2 than those detected at 531.5 eV in the spectrum of Hydro 2 is due to the contributions of the O–C(=O)–Ar functionality. This confirms the incorporation of CNTsOxCl in Nano Hydro 2 and reflects the aromatic nature of CNTs, as previously reported [54]. Furthermore, the detection of the anhydride functionality at 532.8 eV in Nano Hydro 2 confirms that functionalized CNTs are embedded in the developed nanocomposite hydrogels, as shown in Scheme 1.
Figure 7 and Figure 8 show the swelling isotherms of the AM–AA hydrogels and AM–AA/CNTsOxCl nanocomposite hydrogels, respectively, both exhibiting typical swelling profiles as a function of time [55]. At early times, the isotherms display a quasi-linear shape that gradually stretches asymptotically until the equilibrium–swelling limit is reached. The solid line represents the prediction of the swelling kinetic data, which are obtained by integrating Equation (2) under the initial condition W = 0 at t = 0 to obtain the following:
This equation can be simplified into an equation that predicts swelling as a function of time:
Where m and b are the slope and intercept, respectively, of a linear equation describing the evolution of (calculated from experimental data) as a function of t, which can be obtained using a previously reported method [30]. The values of m and b can be obtained graphically and used to calculate the values of equilibrium–swelling and k using the equations:
Table 3 shows the measured values alongside those predicted by the described model. The accuracy of the proposed model is excellent, with coefficients of determination (R2) of at least 0.9999 for both AM–AA hydrogels and AM–AA/CNTsOxCl nanocomposite hydrogels. It is evident that the measured and predicted values are considerably close. Furthermore, k and increase with AA content for both the AA hydrogels and AM–AA/CNTsOxCl nanocomposite hydrogels. This behavior results from the ionization of the AA units. AA is a weak acid with a pKa of 4.66. Therefore, at pH > 4.66 the AA units ionize and the number of ions increases with increasing pH, promoting greater swelling [56]. However, the values of the AM–AA/CNTsOxCl nanocomposite hydrogels are lower than those of the AM–AA hydrogels, suggesting that CNTsOxCl induces additional crosslinking via NMBA. As detected in the XPS analysis, polymeric chains formed by the AA and AM units are grafted onto CNTsOxCl, constraining their mobility.
Figure 9 shows the FE–SEM micrographs of Hydro 1 and Nano Hydro 1, both recorded with the same scale bars (20 μm). A distinctive morphological characteristic in both micrographs is the presence of pores. ImageJ software was used to calculate the size of the detected pores, calibrated with the scale bar [57]. In the micrograph of Hydro 1, 150 pores are detected with an average size of 3.3 μm, whereas in the micrograph of Nano Hydro 1, 70 pores are observed with an average size of 5.5 μm. This increase in pore size in Nano Hydro 1 can be attributed to the higher concentration of carboxylate ions, which repel each other within the polymer network. As noted in the Raman spectra of the nanocomposite hydrogels (Figure 4), no evidence of dimer formation between the AA units is observed. This absence indicates that the number of carboxylate ions in the AM–AA/CNTsOxCl nanocomposite hydrogels is higher than that in the AM–AA hydrogels.
Table 4 lists the Young moduli and the coefficient of determination R2 of the AM–AA hydrogels and AM–AA/CNTsOxCl nanocomposite hydrogels measured at equilibrium swelling. The Young modulii of all nanocomposite hydrogels are higher than those of the corresponding hydrogels prepared with the same AA/AM composition. This strongly indicates that the polymeric chains formed by AA and AM units grafted onto CNTsOxCl efficiently transfer the applied load to these nanostructures, thereby providing mechanical resistance to the nanocomposite hydrogel network, enhancing its mechanical performance.
Figure 10 and Figure 11 show the FA release profiles from the AM–AA hydrogels and AM–AA/CNTsOxCl nanocomposite hydrogels, respectively. Both systems exhibit similar biphasic cumulative release behaviors, in which an initial rapid “burst release” phase is observed, followed by a plateau. As the AA content increases, the percentage of FA released also increases; however, the release from Hydro 1 and Hydro 2 is higher than that from Nano Hydro 1 and Nano Hydro 2, respectively. A similar trend is observed for Hydro 3 and Nano Hydro 3. Two factors influence these results: (i) the AA content in the polymeric network, and (ii) the number of pores in the AM–AA hydrogels and AM–AA/CNTsOxCl nanocomposite hydrogels. A higher number of pores facilitate this release. To analyze the FA release data, nine kinetic models are employed: zero order, first order, Higuchi, Korsmeyer–Peppas, Hixson–Crowell, quadratic, Gompertz, Probit, and Weibull models. The goodness of fit of each model is evaluated using the following statistical criteria: (i) coefficient of determination (R2), (ii) mean square error (MSE), and (iii) model selection criterion (MSC) provided by DDSolver software [58]. The best fit is considered for the model exhibiting an R2 value close to unity, a minimal MSE value, and maximal MSC value. Based on these criteria, the Weibull model (modified to suit a dissolution/release process) provides the best fit for the release data of FA from the AM–AA hydrogels and AM–AA/CNTsOxCl nanocomposite hydrogels. The solid lines drawn over the experimental points shown in Figure 10 and Figure 11 correspond to the fit of the model. The Weibull model adapted to the release process is expressed using the following equation [59]:
Where is the amount of drug released at time , is the amount of drug loaded, determines the time scale of the process, defines the lag time before the onset of the dissolution or release process (often being zero [60]), and is the shape parameter. This parameter characterizes the curve as either exponential ( = 1) (Case 1); sigmoid, S–shaped ( > 1) (Case 2); or with a steeper initial slope followed by exponential behavior ( < 1) (Case 3). Table 5 lists the values of the Weibull parameters for the AM–AA hydrogels and AM–AA/CNTsOxCl nanocomposite hydrogels and the R2 values. The calculated R2 values range from 0.973 (for Hydro 2) to 0.999 (for Hydro 3), indicating that a reasonable adjustment is achieved with the Weibull model. For all samples, < 1, indicating Case 3 behavior under the prediction of the Weibull model. Furthermore, considering the suggestion of Langenbucher [59] to replace parameter with , where is the dissolution time, and assuming that = 0, Equation (9) can be modified as follows:
Where and are constants that depend on the specific release mechanisms. When , the release mechanism is attributed to Fick diffusion in either Ecluidian or fractal spaces [61]. Based on the fact that all values of and the calculated values of (Weibull model) are negligible (Equation 9), it is possible to consider that FA release from the AM–AA hydrogels and AM–AA/CNTsOxCl nanocomposite hydrogels follows Fickian diffusion. It is important to mention that our study has limitations associated with the difficulty of controlling the dispersion of the CNTsOxCl in the network of synthesized nanocomposite hydrogels.
4. Conclusions
AM–AA hydrogels and AM–AA/CNTsOxCl nanocomposite hydrogels were prepared and characterized, and their ability to release FA was evaluated. Helical and straight CNTs were obtained via the CVD method and used in the preparation of nanocomposite hydrogels. The hydroxyl and carboxyl group contents on CNTspoxi were quantified. TEM and Raman spectroscopy confirmed the presence of MWCNTs in CNTspoxi and CNTsOxCl, while Raman analysis also suggested the successful chemical functionalization of CNTsOxCl. Raman and XPS analyses verified the synthesis of AM–AA hydrogels and AM–AA/CNTsOxCl nanocomposite hydrogels. Raman spectroscopy revealed the presence of dimers formed by the self-association of the carboxylic acid groups in the AM–AA hydrogels, whereas XPS spectroscopy revealed that polymer chains composed of AM and AA units were grafted to CNTsOxCl in the AM–AA/CNTsOxCl nanocomposite hydrogels. The swelling kinetics of the developed hydrogels were successfully adjusted using a second-order equation. Compared with the AM–AA/CNTsOxCl nanocomposite hydrogels, the AM–AA hydrogels showed greater swelling, whereas the Young’s moduli of the AM–AA/CNTsOxCl nanocomposite hydrogels were higher than those of the AM–AA hydrogels. FE-SEM micrographs revealed surface pores in all synthesized hydrogels, with larger pores in the AM–AA/CNTsOxCl nanocomposite hydrogels. This was attributed to the repulsion between the carboxylate ions within the polymer network of the nanocomposite hydrogels. The Weibull model adequately adjusted the FA release data recorded for all the studied hydrogels, whereas the release mechanism was driven by Fickian diffusion. Our study provides findings that can be used in the nanomedicine field for the design of nanocarriers suitable to transport anticancer drugs.
Author Contributions
K. S.–G.: methodology, validation, and investigation. J.A.C.–O.: formal analysis, and investigation. E.B.F.–O.: formal analysis, and investigation. V.H.A.–C.: formal analysis, and investigation. S.M.N.–D.: conceptualization, resources, writing—original draft, writing—review and editing, supervision, project administration, and funding acquisition. All authors have read and agreed to the published version of the manuscript.
Funding
This research was funded by Consejo Nacional de Humanidades, Ciencias y Tecnologías (CONAHCyT), grant number 101369.
Data Availability Statement
The data presented in this study are available upon request from the corresponding author.
Acknowledgments
The authors are thankful to Mr. Francisco Rodriguez, from CINVESTAV Queretaro, for his help in conducting the Raman measurements.
Conflicts of Interest
The authors declare no conflicts of interest. The funders had no role in the design of the study; in the collection, analyses, or interpretation of data; in the writing of the manuscript; or in the decision to publish the results.
Abbreviations
The following abbreviations are used in this manuscript:
| AM | acrylamide |
| AA | acrylic acid |
| CNTs | carbon nanotubes |
| CVD | chemical vapor deposition |
| TEM | transmission electron microscopy |
| XPS | X–ray photoelectron spectroscopy |
| FE-SEM | field-emission scanning electron microscopy |
| SWCNTs | single–walled carbon nanotubes |
| MWCNTs | multi–walled carbon nanotubes |
| DDS | drug delivery systems |
| UCST | upper critical solution temperature |
| PPy | polypyrrole |
| 5-FU | 5–fluorouracil |
| NIR | near–infrared |
| PAAm | polyacrylamide |
| PAAc | polyacrylic acid |
| IPN | interpenetrating network |
References
- Chai, Q.; Jiao, Y.; Yu, X. Hydrogels for Biomedical Applications: Their Characteristics and the Mechanisms behind Them. Gels 2017, 3, 6.
- Seliktar, D. Designing Cell–Compatible Hydrogels for Biomedical Applications. Science 2012, 336, 1124–1128.
- Delcea, M.; Möhwald, H.; Skirtach, A.G. Stimuli–responsive Lbl capsules and nanoshells for drug delivery. Adv Drug Del. Rev. 2011, 63, 730–747.
- Sennakesavan, G.; Mostakhdemin, M.; Dkhar, L.K.; Seyfoddin, A. Acrylic acid/acrylamide based hydrogels and its properties – A review. Polym. Degrad. Stab. 2020, 180, 109308.
- Taylor, M.J.; Tomlins, P.; Sahota, T.S. Themoresposive Gels. Gels 2017, 3, 4.
- Alzari, V.; Ruiu, A.; Nuvoli, D.; Sanna, R.; Martinez, J.I.; Appelhans, D.; Voit, B.; Zschoche, S.; Mariani, A. Three component terpolymer and IPN hydrogels with response to stimuli. Polymer 2014, 55, 5305–5313.
- Marcelo, G.; Areias, L.R.P.; Viciosa, M.T.; Martinho, J.M.G.; Farinha, J.P.S. PNIPAm–based microgels with a UCST response. Polymer 2017, 116, 261–267.
- Bajpai, A.K.; Shukla, S.K.; Bhanu, S.; Kankane, S. Responsive polymers in controlled drug delivery. Prog. Polym. Sci. 2008, 33, 1088–1118.
- Zhou, X.; Weng, L.; Chen, Q.; Zhang, J.; Shen, D.; Li, Z.; Shao, M.; Xu, J. Investigation of pH sensitivity of poly(acrylic acid–co–acrylamide) hydrogel. Polym. Int. 2003, 52, 1153–1157.
- Ding, C.; Guo, Z.; Xiong, J.; Wu, D.; Tao, Y.; Qin, Y.; Kong, Y. Rational design of a multi–responsive drug delivery platform based on SiO2@PPy@poly(acrylic acid–co–acrylamide). React. Funct. Polym. 2019, 137, 88–95.
- Ray, D.; Mohapatra, D.K.; Mohapatra, R.K.; Mohanta, G.P.; Sahoo, P.K. Synthesis and colon–specific drug delivery of a poly(acrylic–co–acrylamide)/MBA nanosized Hydrogel. J. Biomater. Sci. Polymer Ed. 2008, 19, 1487–1502.
- Thippeswamy, M.; Puttagiddappa, M.G.; Thippaiah, D.; Satyanarayan, D.N. Poly(acrylamide–co–acrylic acid) synthesized, moxifloxacin drug–loaded hydrogel: Characterization and evaluation studies. J. Appl. Pharm. Sci. 2021, 11, 074–081.
- Chavda, H.V.; Patel, C.N. Effect of crosslinker concentration on characteristics of superporous hydrogel. Int. J. Pharm. Investig. 2011, 1, 17–21.
- Syduzzaman, M.; Islam Saad, M.S.; Piam, M.F.; Talukdar, T.A.; Shobdo, T.T.; Pritha, N.M. Carbon nanotubes: structure, properties and applications in the aerospace industry. Results Mater. 2025, 25, 100654.
- Yu, M.–F.; Lourie, O.; Dyer, M.J.; Moloni, K.; Kelly, T.F.; Ruoff, R.S. Strength and breaking mechanism of multiwalled carbon nanotubes under tensile load. Science 2000, 287, 637–640.
- Yu, M.–F.; Files, B.S.; Arepalli, S.; Ruoff, R.S. Tensile loading of ropes of single wall carbon nanotubes and their mechanical properties. Phys. Rev. Lett. 2000, 84, 5552.
- Bellingeri, R.; Mulko, L.; Molina, M.; Picco, N.; Alustiza, F.; Grosso, C.; Vivas, A.; Acevedo, D.F.; Barbero, C.A. Nanocomposites based on pH–sensitive hydrogels and chitosan decorated carbon nanotubes with antibacterial properties. Mat. Sci. Eng. C–Mater. 2018, 90, 461–467.
- Feng, H.; Zheng, T.; Wang, X.; Wang, H. Poly(acrylamide)–MWNTs hybrid hydrogel with extremely high mechanical strength. Open Chem. 2016, 14, 150–157.
- Takada, T.; Morikawa, Y.; Kikuchi, Y.; Miyamoto, D.; Hayasaka, Y.; Abe, S. Mechanical and swelling properties of polyacrylamide/polyacrylic acid composite hydrogels: The effects of network structure and carbon nanotube reinforcement. Carbon Rep. 2024, 3, 29–36.
- Kanca, Y.; Özdemir, R.; Dini, D.; Özkahraman, B. Multi–walled carbon nanotube reinforced polyacrylamide–acrylic acid nanocomposite hydrogels with superior mechanical and tribological performance as focal cartilage substitute. Polym. Eng. Sci. 2025, 65, 3988–4005.
- Narmani, A.; Rezvani, M.; Farhood, B.; Darkhor, P.; Mohammadnejad, J.; Amini, B.; Rafahi, S., Goushbolagh, N.A. Folic acid functionalized nanoparticles as pharmaceutical carriers in drug delivery systems. Drug Dev. Res. 2019, 80, 404–424.
- Fuster, M.G.; Wang, J.; Fandiño, O.; Víllora, G.; Paredes, A.J. Folic acid–decorated nanocrystals as highly loaded trojan horses to target cancer cells. Mol. Pharmaceutics 2024, 21, 2781–2794.
- Rúan–Esparza, L.; Soto, V.; Gómez–Salazar, S.; Rabelero, M.; Ávalos–Borja, M.; Luna–Bárcenas, G.; Prokhorov, E.; Nuño–Donlucas, S.M. Poly[ethylene–co–(acrylic acid)]–based nanocomposites: Thermal and mechanical properties and their structural characteristics studied by Raman spectroscopy. Polym. Compos. 2011, 32, 1181–1189.
- Torres–Ávalos, J.A.; Cajero–Zul, L.R.; Vázquez–Lepe, M.; López–Dellmary, F.A.; Martínez–Richa, A.; Barrera–Rivera, K.A.; López–Serrano, F.; Nuño–Donlucas, S.M. Synthesis of poly(methacrylic acid–co–butyl acrylate) grafted onto functionalized carbon nanotube nanocomposites for drug delivery. Polymers 2021, 13, 533.
- Xia, R.; Li, M.; Zhang, Y.; Qian, J.; Yuan, X. Surface modification of MWCNTs with BA–MMA–GMA terpolymer by single–step grafting technique. J. Appl. Polym. Sci. 2011, 119, 282–289.
- Silva–Jara, J.M.; Manríquez–González, R.; López–Dellamary, F.A.; Puig, J.E.; Nuño–Donlucas, S.M. Semi–continuous heterophase polymerization to synthesize nanocomposites of poly(acrylic acid)–functionalized carbon nanotubes. J. Macromol. Sci. Part A 2015, 52, 732–744.
- Cajero–Zul, L.R.; López–Dellmary, F.A.; Gómez–Salazar, S.; Vázquez–Lepe, M.; Vera–Graziano, R.; Torres–Vitela, M.R.; Olea–Rodríguez, M.A.; Nuño–Donlucas, S.M. Evaluation of the resistance to bacterial growth of star–shaped poly(e–caprolactone)–co–poly(ethylene glycol) grafted onto functionalized carbon nanotubes nanocomposites. J. Biomater. Sci. Polym. Ed. 2019, 30, 163–189.
- Katime, I.; Velada, J. L.; Novoa, R.; Díaz de Apodaca; E.; Puig, J.; Mendizábal, E. Swelling kinetics of poly(acrylamide)/poly(mono–n–alkyl itaconates) hydrogels. Polym Int. 1996, 40, 281–286.
- Salvetat, J.–P.; Bonard, J.–M.; Thomson, N.H.; Kulik, A.J.; Forró, L.; Benoit, W.; Zuppiroli, L. Mechanical properties of carbon nanotubes. Appl. Phys. A 1999, 69, 255–260.
- Gómez–Vázquez, D.; Cajero–Zul, L.R.; Torres–Ávalos, J.A.; Sandoval–García, K.; Cortés–Ortega, J.A.; López–Dellamary, F.A.; Soltero–Martínez, J.F.A.; Martínez–Richa, A.; Nuño–Donlucas, S.M. Homogeneous hydrogels made with acrylic acid, acrylamide amd chemically functionalized carbon nanotubes. J. Macromol. Sci. Part A 2019, 56, 417–428.
- Li, C.; Chou, T.–W. Elastic moduli of multi–walled carbon nanotubes and the effect of van der Waals forces. Compos. Sci. Technol. 2003, 63, 1517–1524.
- Sivaganga, K.C.; Varughese, T. Physical properties of carbon nanotubes. In Handbook of carbon nanotubes, 1st ed.; Abraham, J., Thomas, S., Kalarikkal, N., Eds.; Springer: Cham, Switzerland, 2022: pp. 283–297.
- Thomsen, C.; Reich, S. Double resonant Raman scattering in graphite. Phys. Rev. Lett. 2000, 85, 5214.
- Brown, S.D.M.; Jorio, A.; Dresselhaus, M.S.; Dresselhaus, G. Observationsof the D–band feature in the Raman spectra of carbon nanotubes. Phys. Rev. B 2001, 64, 073403.
- Costa, S.; Borowiak–Palen, E.; Kruszyńska, M.; Bachmatiuk, A.; Kaleńczuk, R.J. Characterization of carbon nanotubes by Raman spectroscopy. Mater. Sci.–Pol. 2008, 26, 433–441.
- Heise, H.M.; Kuckuk, R.; Ojha, A.K.; Srivastava, A.; Srivastava, V.; Asthana, B.P. Characterisation of carbonaceous materials using Raman spectroscopy: a comparison of carbon nanotube filters, single– and multi–walled nanotubes, graphitised porous carbon and graphite. J. Raman Spectrosc. 2009, 40, 344–353.
- Fantini, C.; Usrey, M.L., Strano, M.S. Investigation of electronic and vibrational properties of single–walled carbon nanotubes functionalized with diazonium salts. J. Phys. Chem. C 2007, 111, 17941–17946.
- Gupta, M.K.; Bansil, R. Laser Raman spectroscopy of polyacrylamide. J. Polym. Sci., Polym. Phys. Ed. 1981, 19, 353–360.
- Amorim da Costa, A.M.; Amado, A.M. Cationic hydration in hydrogelic polyacrylamide–phosphoric acid network: A study by Raman spectroscopy. Solid State Ion. 2001, 145, 79–84.
- Dong, J.; Ozaki, J.; Nakashima, K. Infrared, Raman, and near–infrared spectroscopic evidence for the coexistence of various hydrogen–bond forms in poly(acrylic acid). Macromolecules 1997, 30, 1111-1117.
- Todica, M.; Stefan, R.; Pop, C.V.; Olar, L. IR and Raman investigation of some poly(acrylic) acid gels in aqueous and neutralized state. Acta Phys. Pol. A 2015, 128, 128-135.
- Liu, S.; Zhang, M.; Huang, B.; Wu, N.; Ouyang, S. Raman spectroscopy for the competition of hydrogen bonds in ternary (H2O–THF–DMSO) aqueous solutions. Molecules, 2019, 24, 3666.
- Herrera–Gomez, A.; Bravo–Sanchez, M.; Ceballos–Sanchez, O.; Vazquez–Lepe, M.O. Practical methods for background substraction in photoemission spectra. Surf. Interface Anal. 2014, 46, 897–905.
- Dietrich, P.M.; Henning, A.; Holzweber, M.; Thiele, T.; Borcherding, H.; Lippitz, A.; Schedler, U.; Resch–Genger, U.; Unger, W.E.S. Surface analytical study of poly(acrylic acid)–grafted microparticles (beads): characterization, chemical derivatization, and quantification of surface carboxyl groups. J. Phys. Chem. C 2014, 118, 20393–20404.
- Beamson, G.; Briggs, D. High Resolution XPS of Organic Polymers: The Scienta ESCA300 Database, 1st ed.; Wiley: Chichester, UK, 1992; pp. 110–111.
- Uchida, E.; Uyama, Y.; Iwata, H.; Ikada, Y. XPS analysis of the poly(ethylene terephthalate) film grafted with acrylamide. J. Polym. Sci., Part A: Polym. Chem. 1990, 28, 2837–2844.
- Mukherjee, S.; Mondal, M.H.; Mukherjee, M.; Doyle, B.P.; Nannarone, S. Onset kinetics of thermal degradation of ultrathin polyacrylamide films. Macromolecules 2009, 42, 7889–7896.
- González–Iñiguez, K.J.; Figueroa–Ochoa, E.B.; Martínez–Richa, A.; Cajero–Zul, L.R.; Nuño–Donlucas, S.M. Synthesis of poly(L–lactide)–poly(–caprolactone)–poly(ethylene glycol) terpolymer grafted onto partially oxidixed carbon nanotube nanocomposites for drug delivery. Polymers 2024, 16, 2580.
- Deng, Y.; Xu, Y.; Nie, L.; Huang, Y. Crosslinked polymer coatings of poly(acrylic acid–co–acrylamide)/polyethyleneimine (P(AA–co–Aam)/PEI) on titanium alloy with excellent lubrication performance for artificial joints. Coatings 2024, 14, 28.
- Khokhra, R.; Bharti, B.; Lee, H.–N.; Kumar, R. Visible and UV photo–detection in ZnO nanostructured thin films via simple tuning of solution method. Sci. Rep. 2017, 7, 15032.
- Briggs, D.; Beamson, G. XPS studies of the oxygen 1s and 2s levels in a wide range of functional polymers. Anal. Chem. 1993, 65, 1517–1523.
- Zhang, N.; Xiong, Y. Lattice oxygen activation for enhanced electrochemical oxygen evolution. J. Phys. Chem. C 2023, 127, 2147–2159.
- Hepworth, S.J.; Leach, M.O.; Doran, S.J. Dynamics of polymerization in polyacrylamide gel (PAG) dosimeters: (II) modeling oxygen diffusion. Phys. Med. Biol. 1999, 44, 1875–1884.
- Linert, W.; Lukovits, I. Aromaticity of carbon nanotubes. J. Chem. Inf. Model. 2007, 47, 887–890.
- Zhang, K.; Feng, W.; Jin, C. Protocol efficiently measuring the swelling rate of hydrogels. MethodsX 2020, 7, 100779.
- Aydınoğlu, D. Investigation of pH–dependent swelling behavior and kinetic parameters of novel poly(acrylamide–co–acrylic acid) hydrogels with spirulina. e–Polymers 2015, 15, 81–93.
- ImageJ. Available online: https://imagej.net/ij/ (accessed on 12 July 2024).
- Zhang, Y.; Huo, M.; Zhou, J.; Zou, A.; Li, W.; Yao, C.; Xie, S. DDSolver: An add–in program for modeling and comparison of drug dissolution profiles. AAPS J. 2010, 12, 263–271.
- Langenbucher, F. Linearization of dissolution rate curves by the Weibull distribution. J. Pharm. Pharmacol. 1972, 24, 979–981.
- Costa, P.; Sousa Lobo, J.M. Modelling and comparison of dissolution profiles. Eur. J. Pharm. Sci. 2001, 13, 123–133.
- Corsaro, C.; Neri, G.; Mezzasalma, A.M.; Fazio, E. Weibull modeling of controlled drug release from Ag–PMA nanosystems. Polymers 2021, 13, 2897.
Scheme 1.
Polymerization reaction of AA and AM monomers on CNTsOxCl previously decorated with AA and AM units.
Scheme 1.
Polymerization reaction of AA and AM monomers on CNTsOxCl previously decorated with AA and AM units.
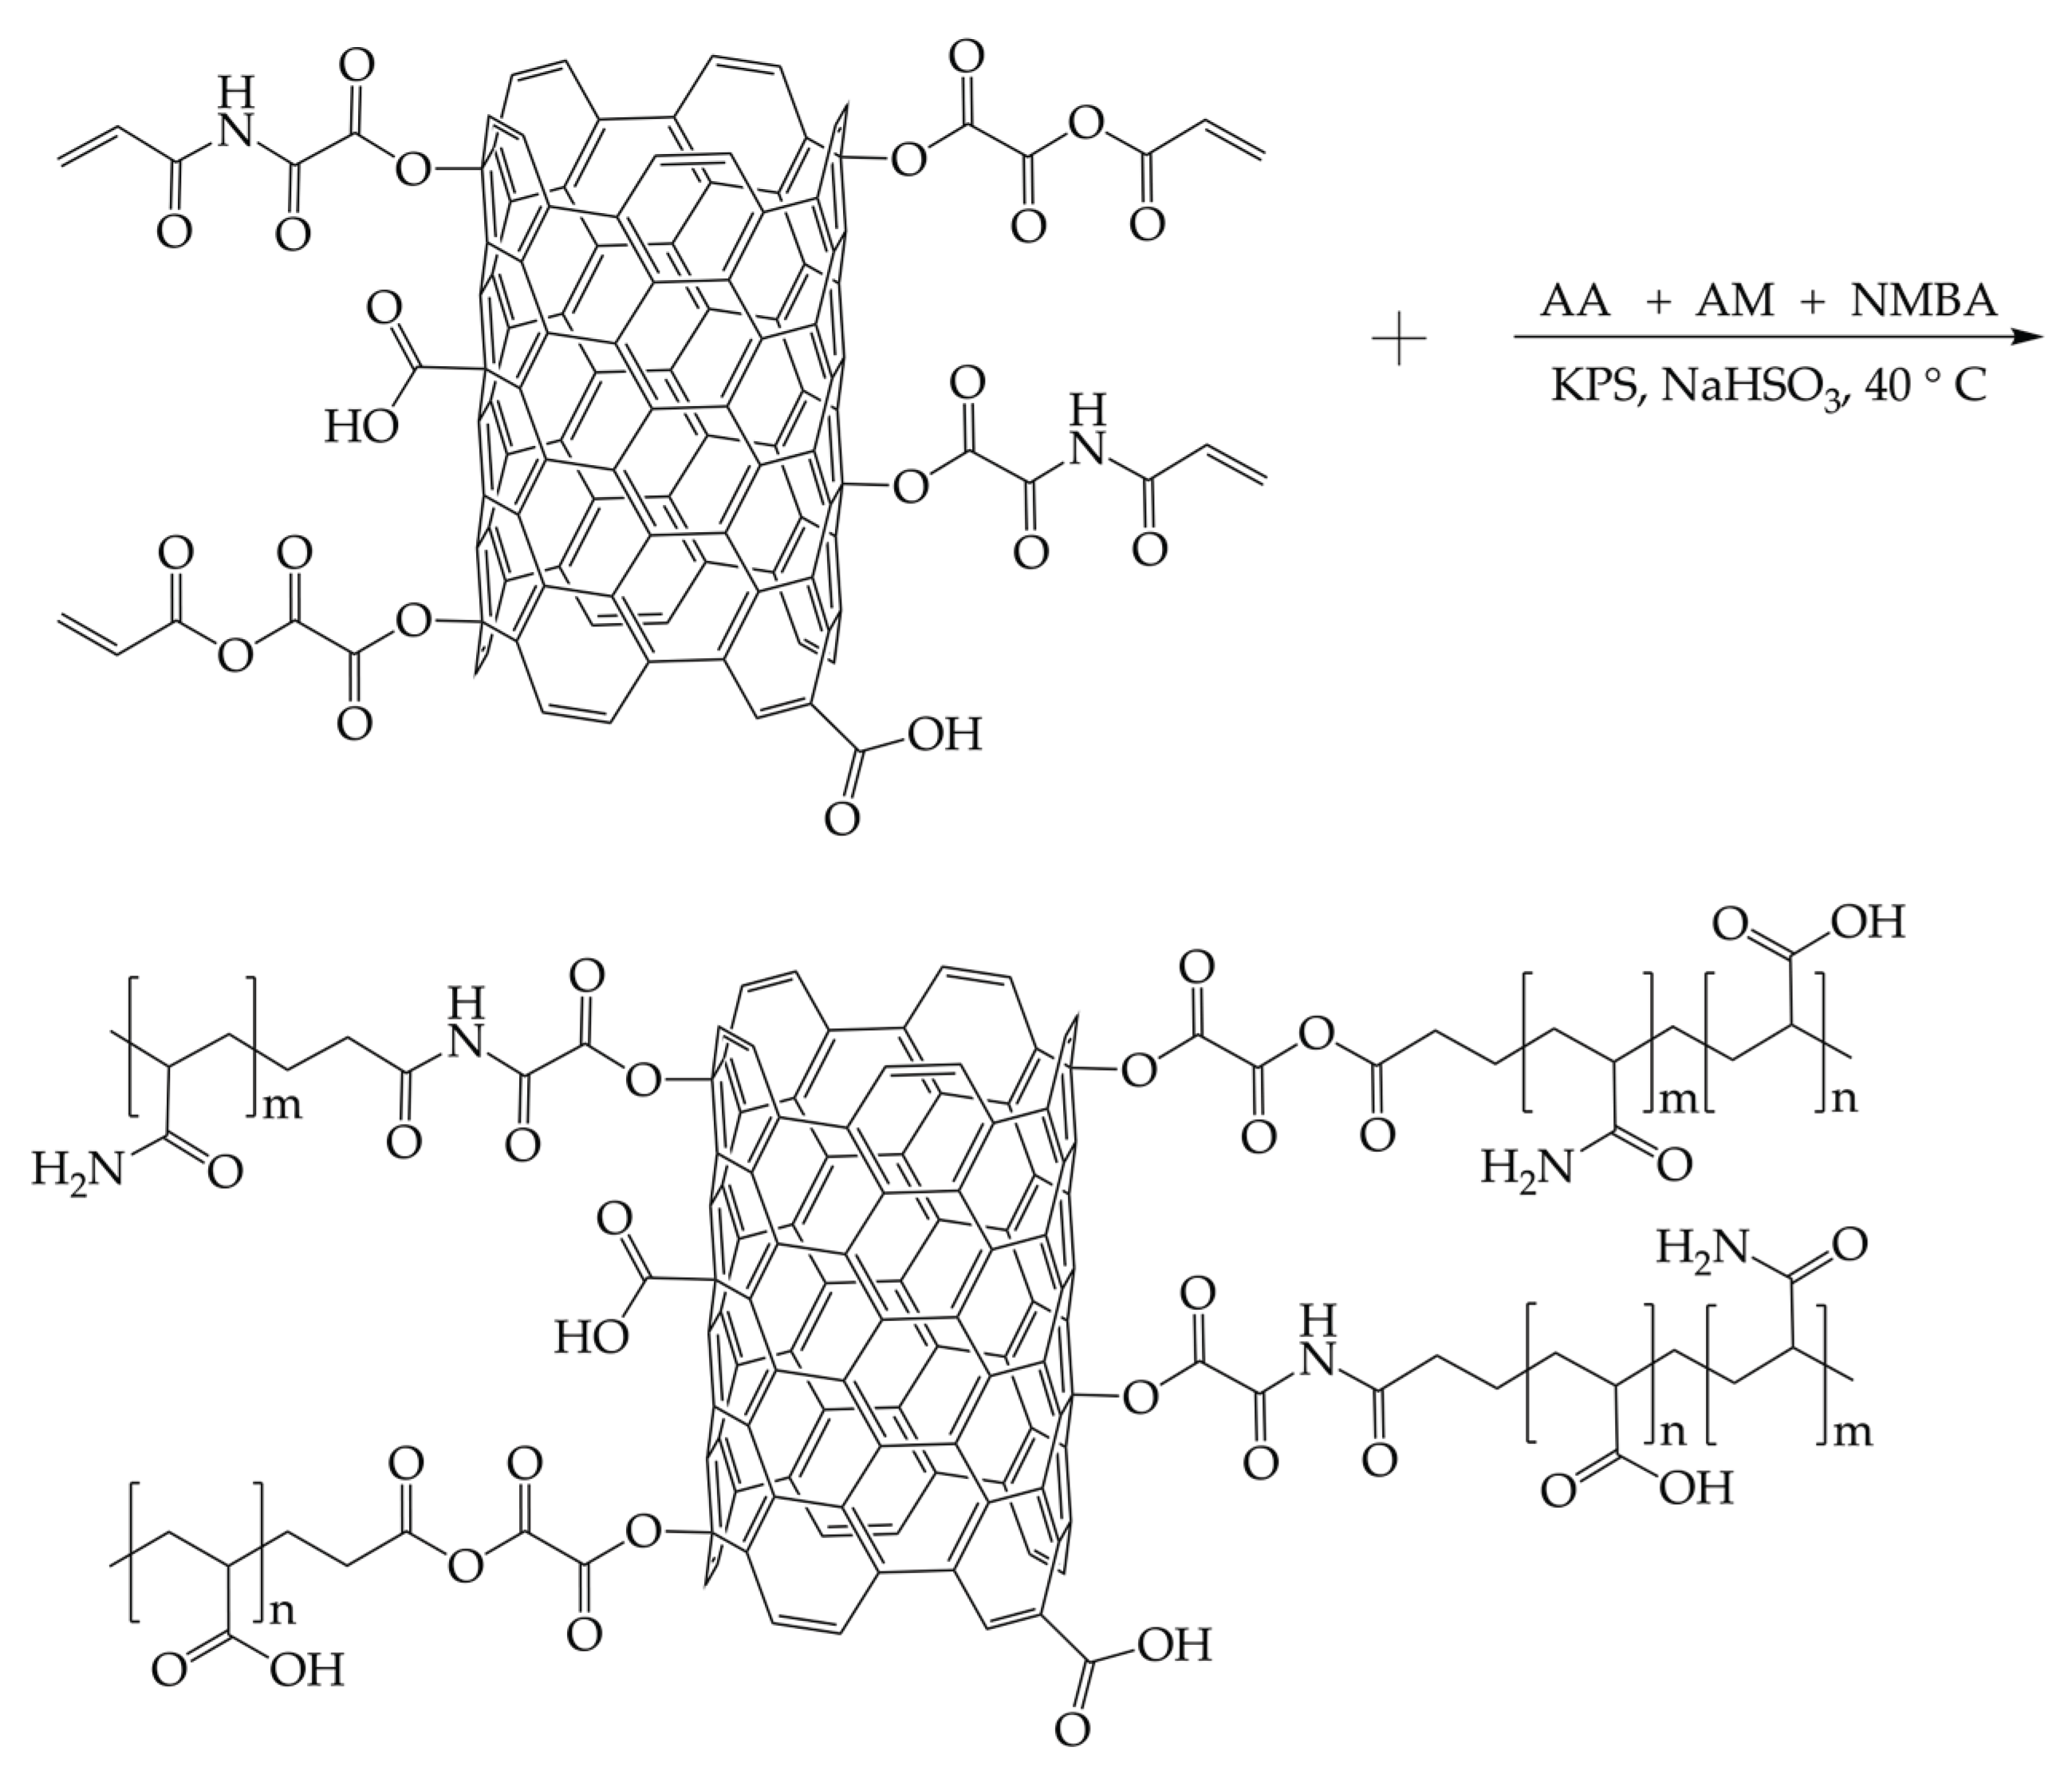
Figure 1.
TEM micrographs of a helical carbon nanotube (HCNT) (A) and a tubular CNT (B). Both nanostructures were detected in a CNTspur sample.
Figure 1.
TEM micrographs of a helical carbon nanotube (HCNT) (A) and a tubular CNT (B). Both nanostructures were detected in a CNTspur sample.
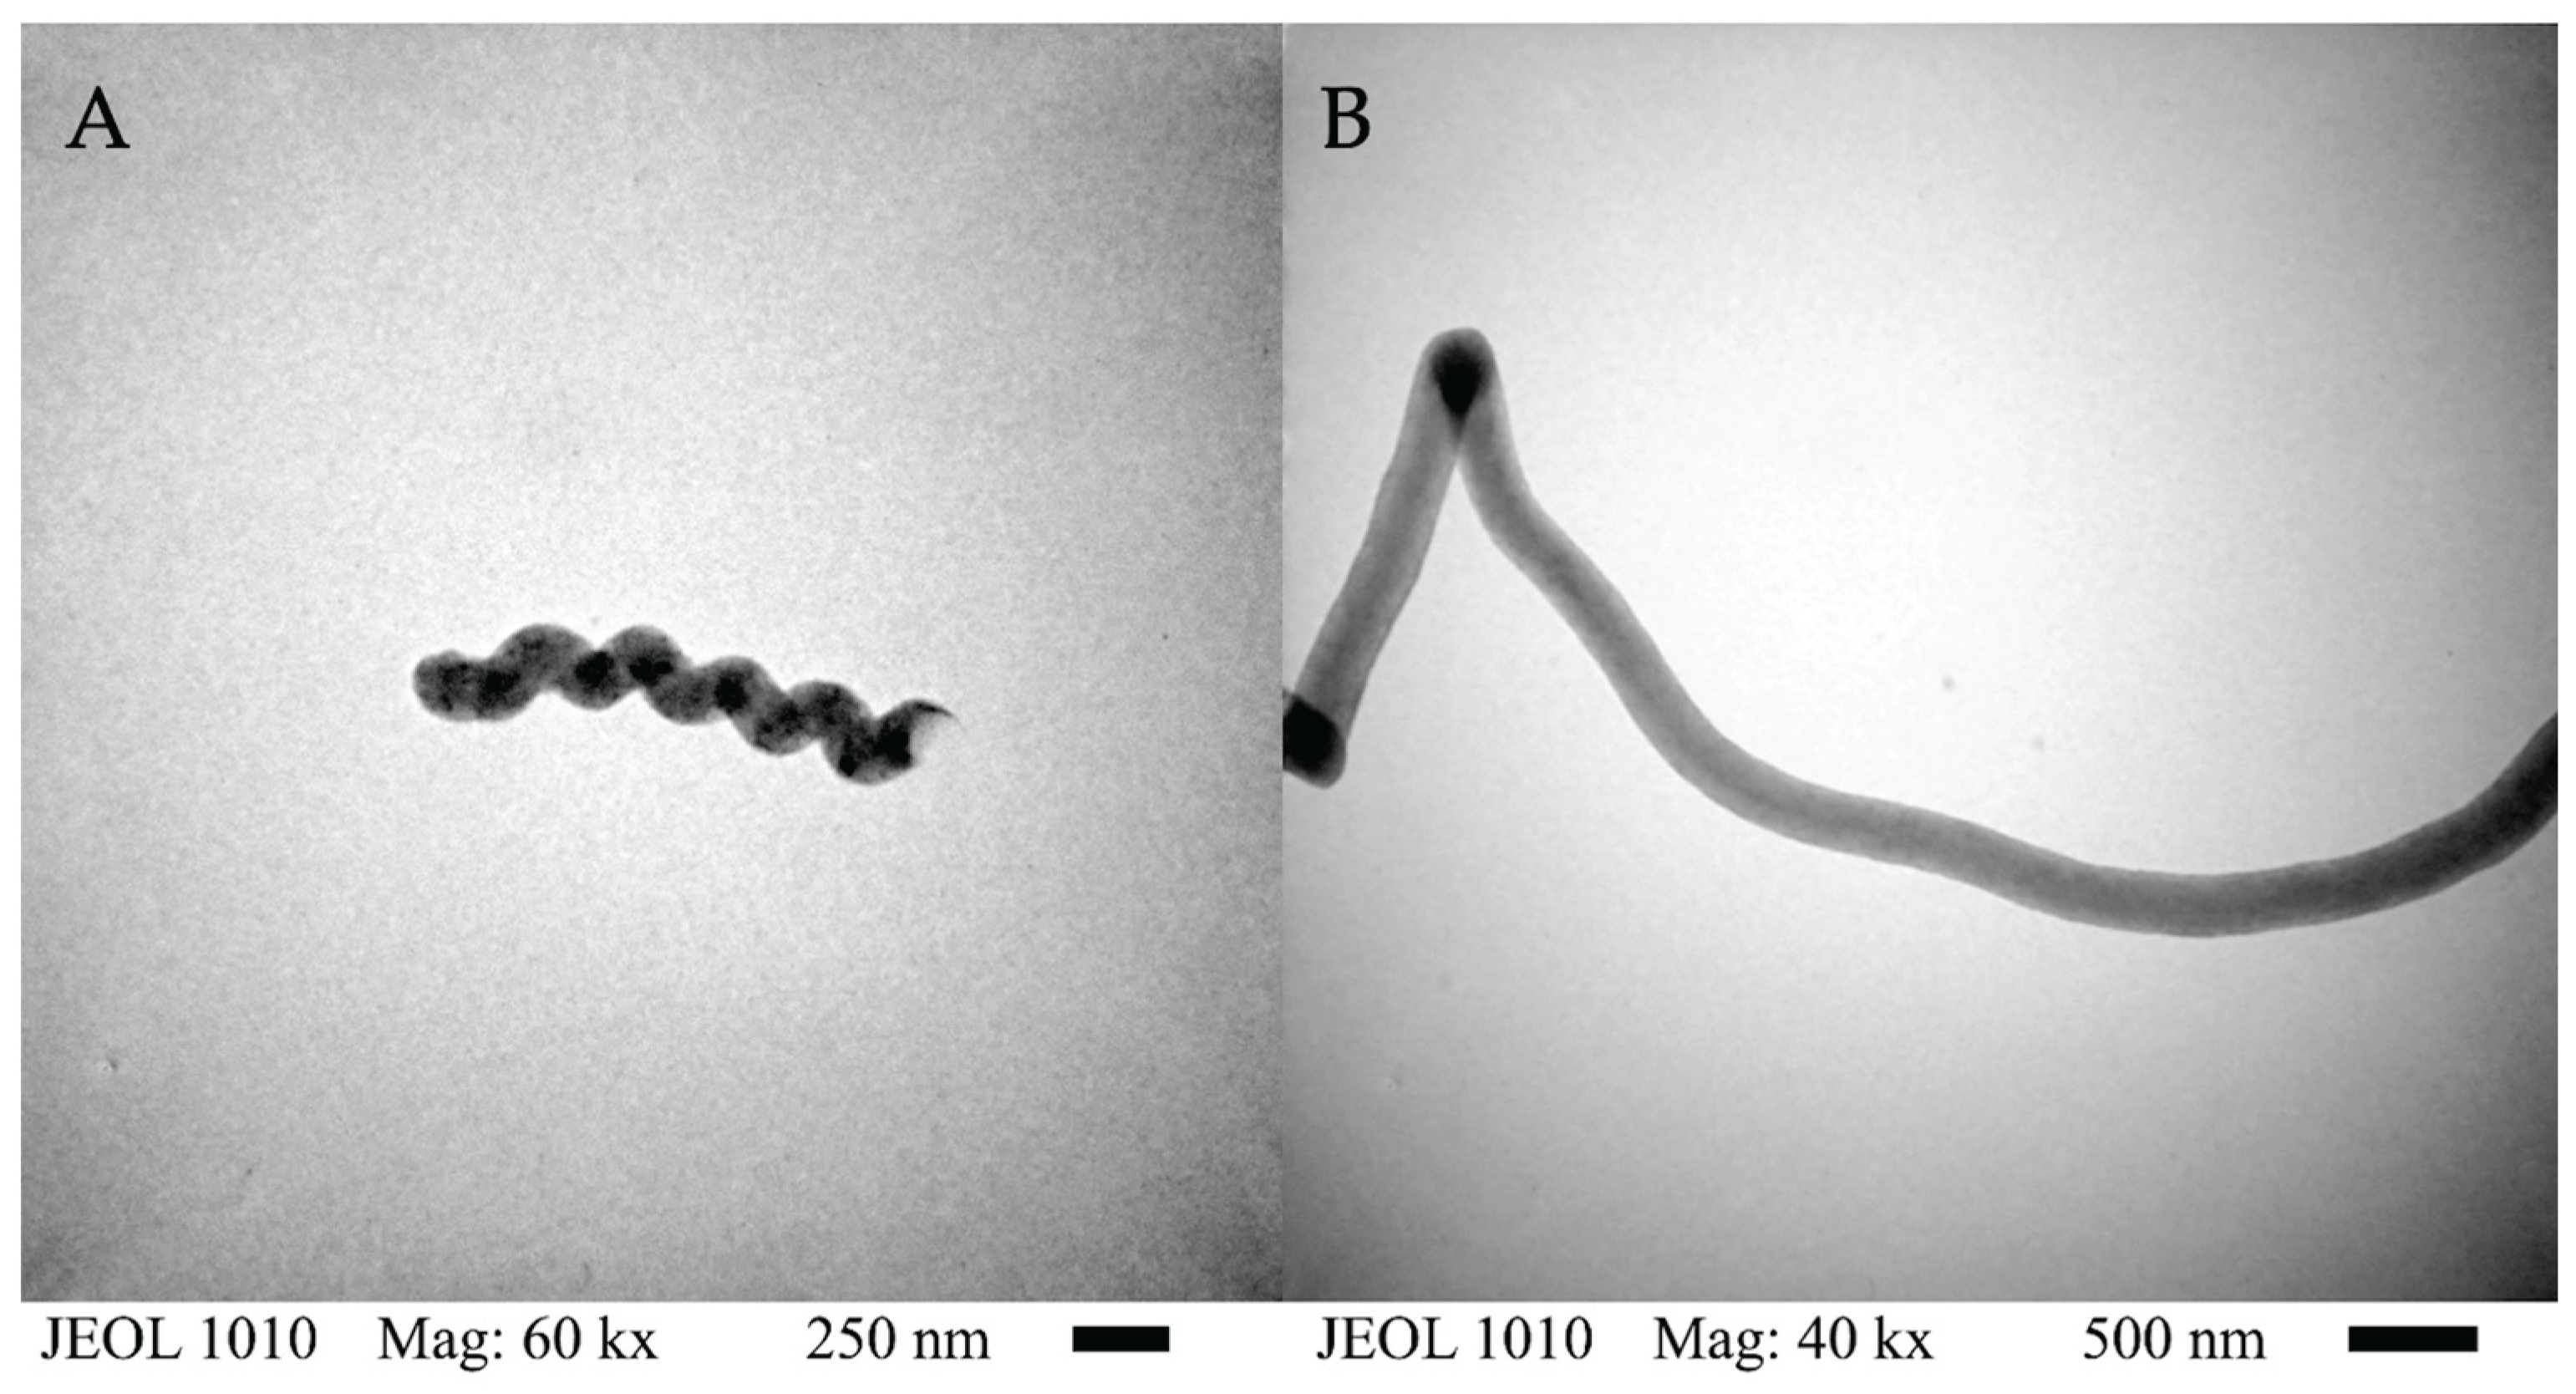
Figure 2.
Raman spectra of CNTspoxi (A) and CNTsOxCl (B).

Figure 3.
Raman spectra of Hydro 1 (A), Hydro 2 (B), and Hydro 3 (C).
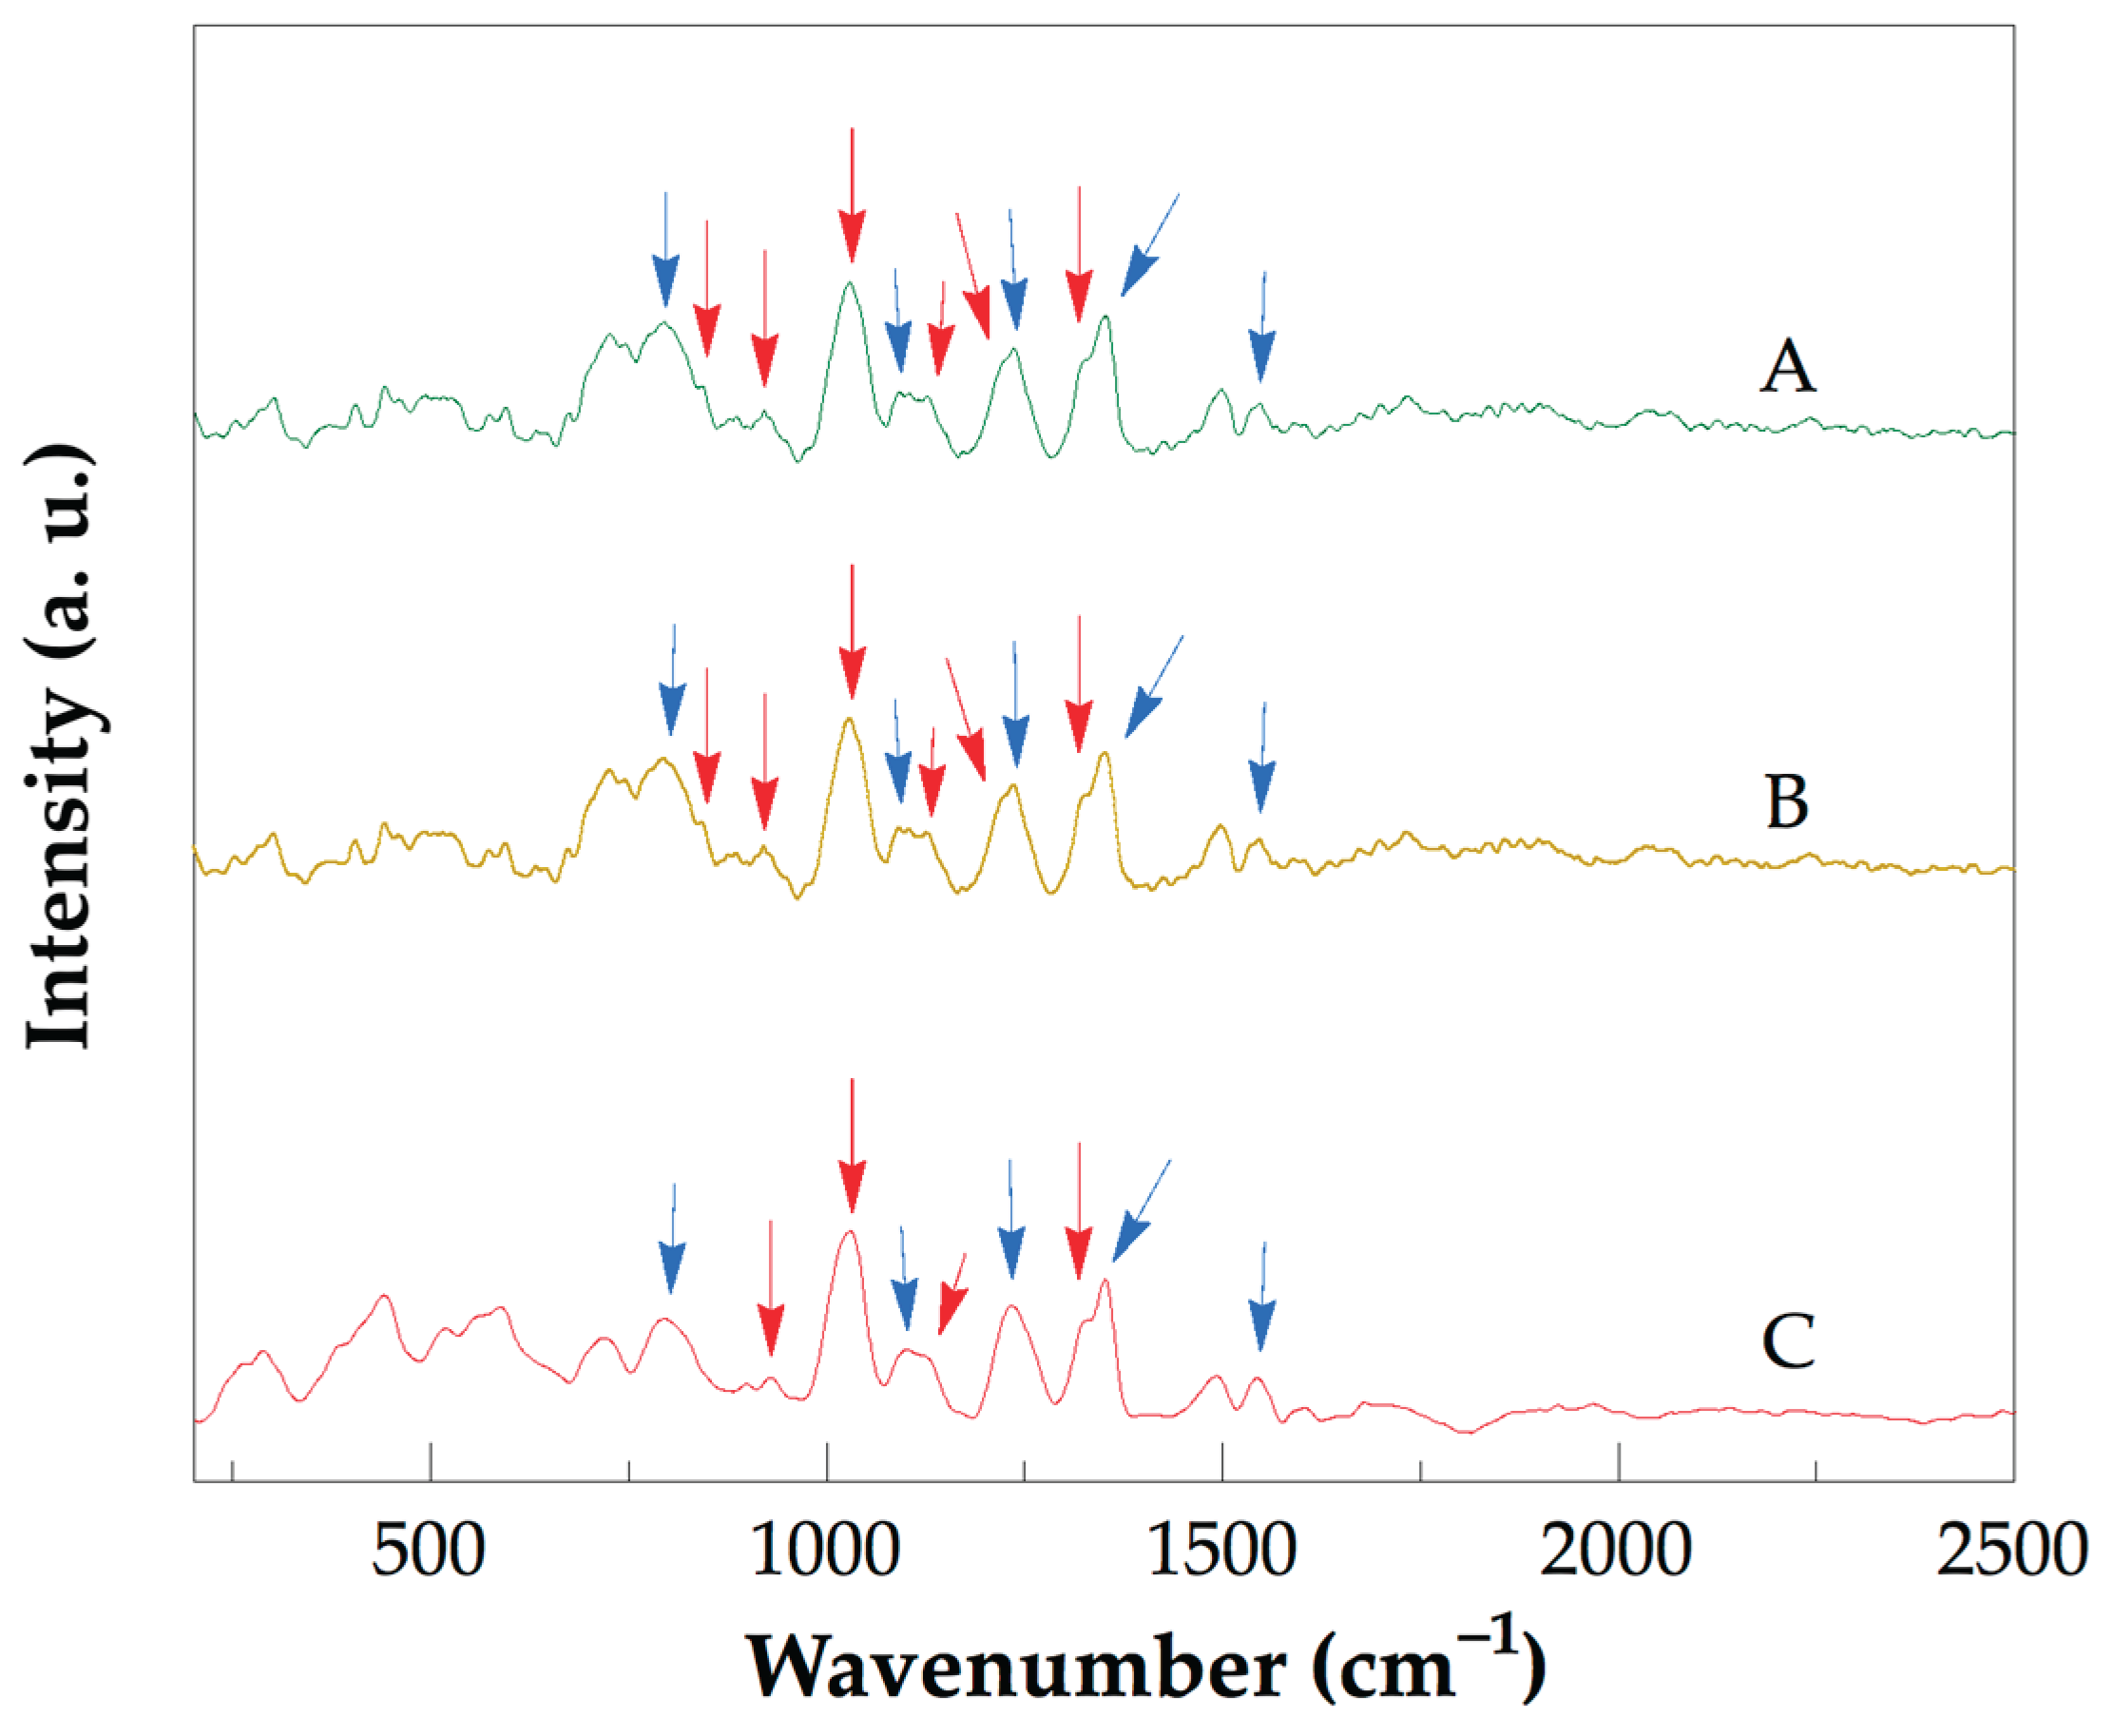
Figure 4.
Raman spectra of Nano Hydro 1 (A), Nano Hydro 2 (B), and Nano Hydro 3 (C).
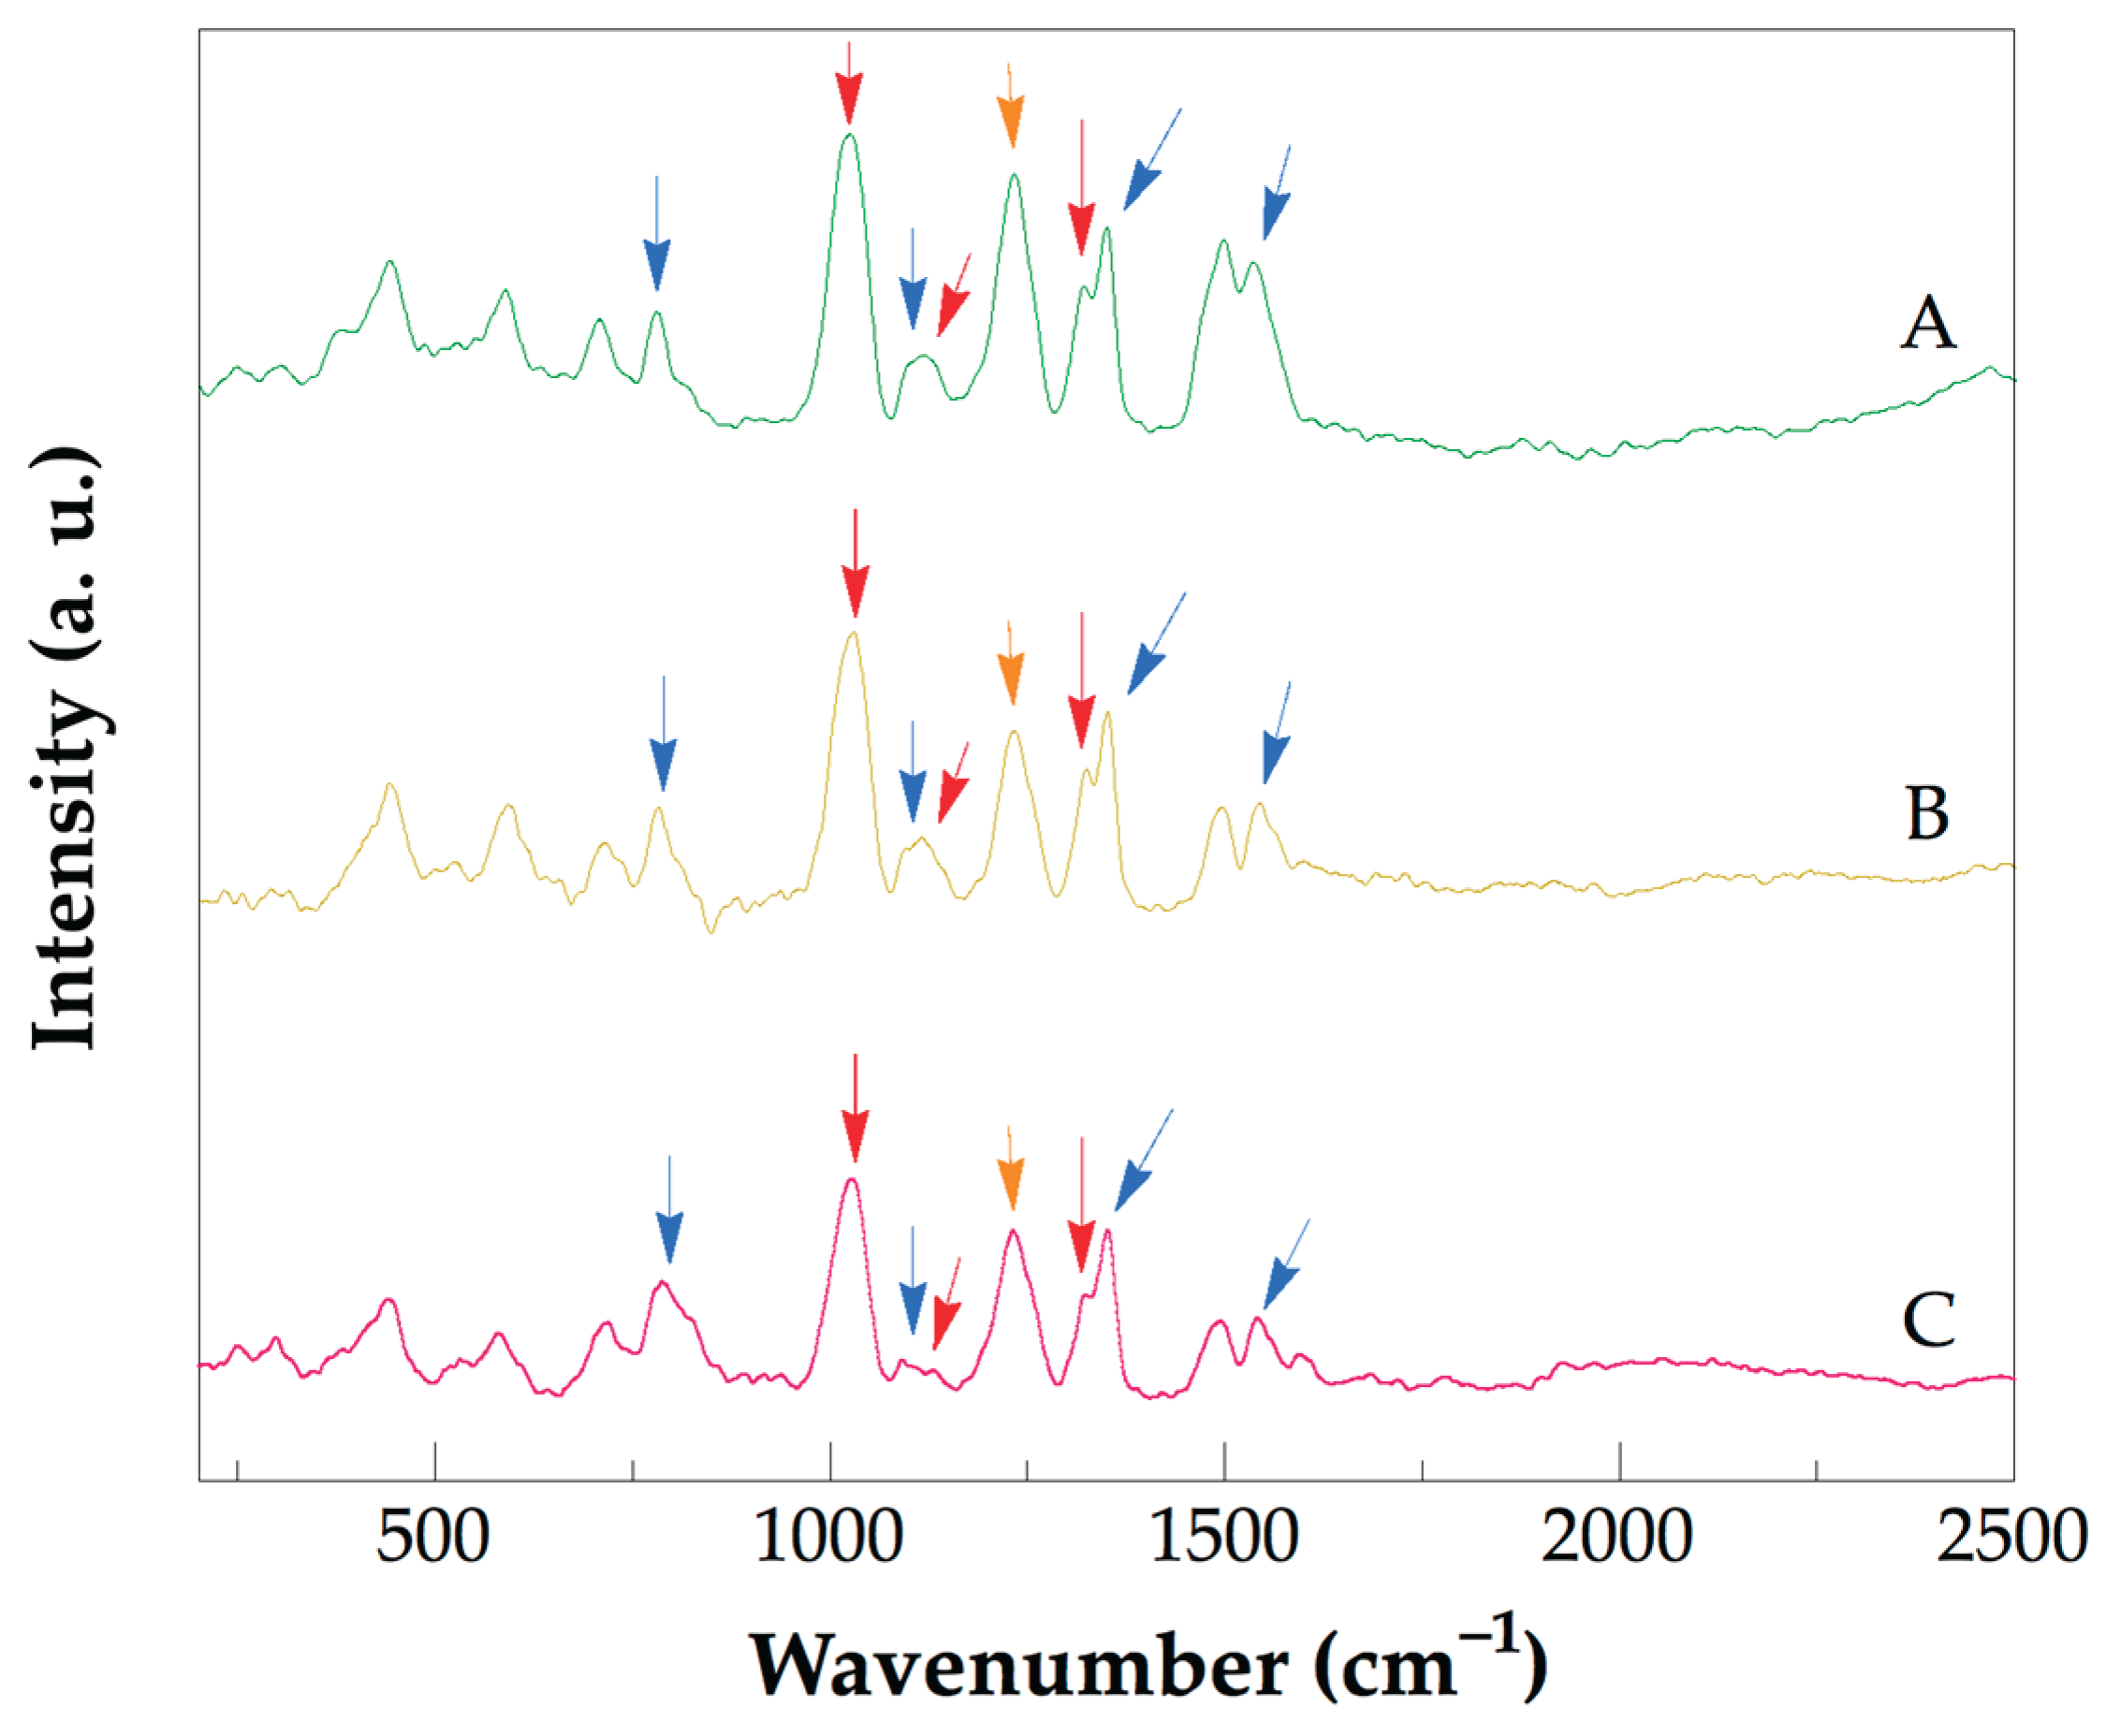
Figure 5.
C1s core–level normalized spectra of Nano Hydro 2 (A) and Hydro 2 (B).
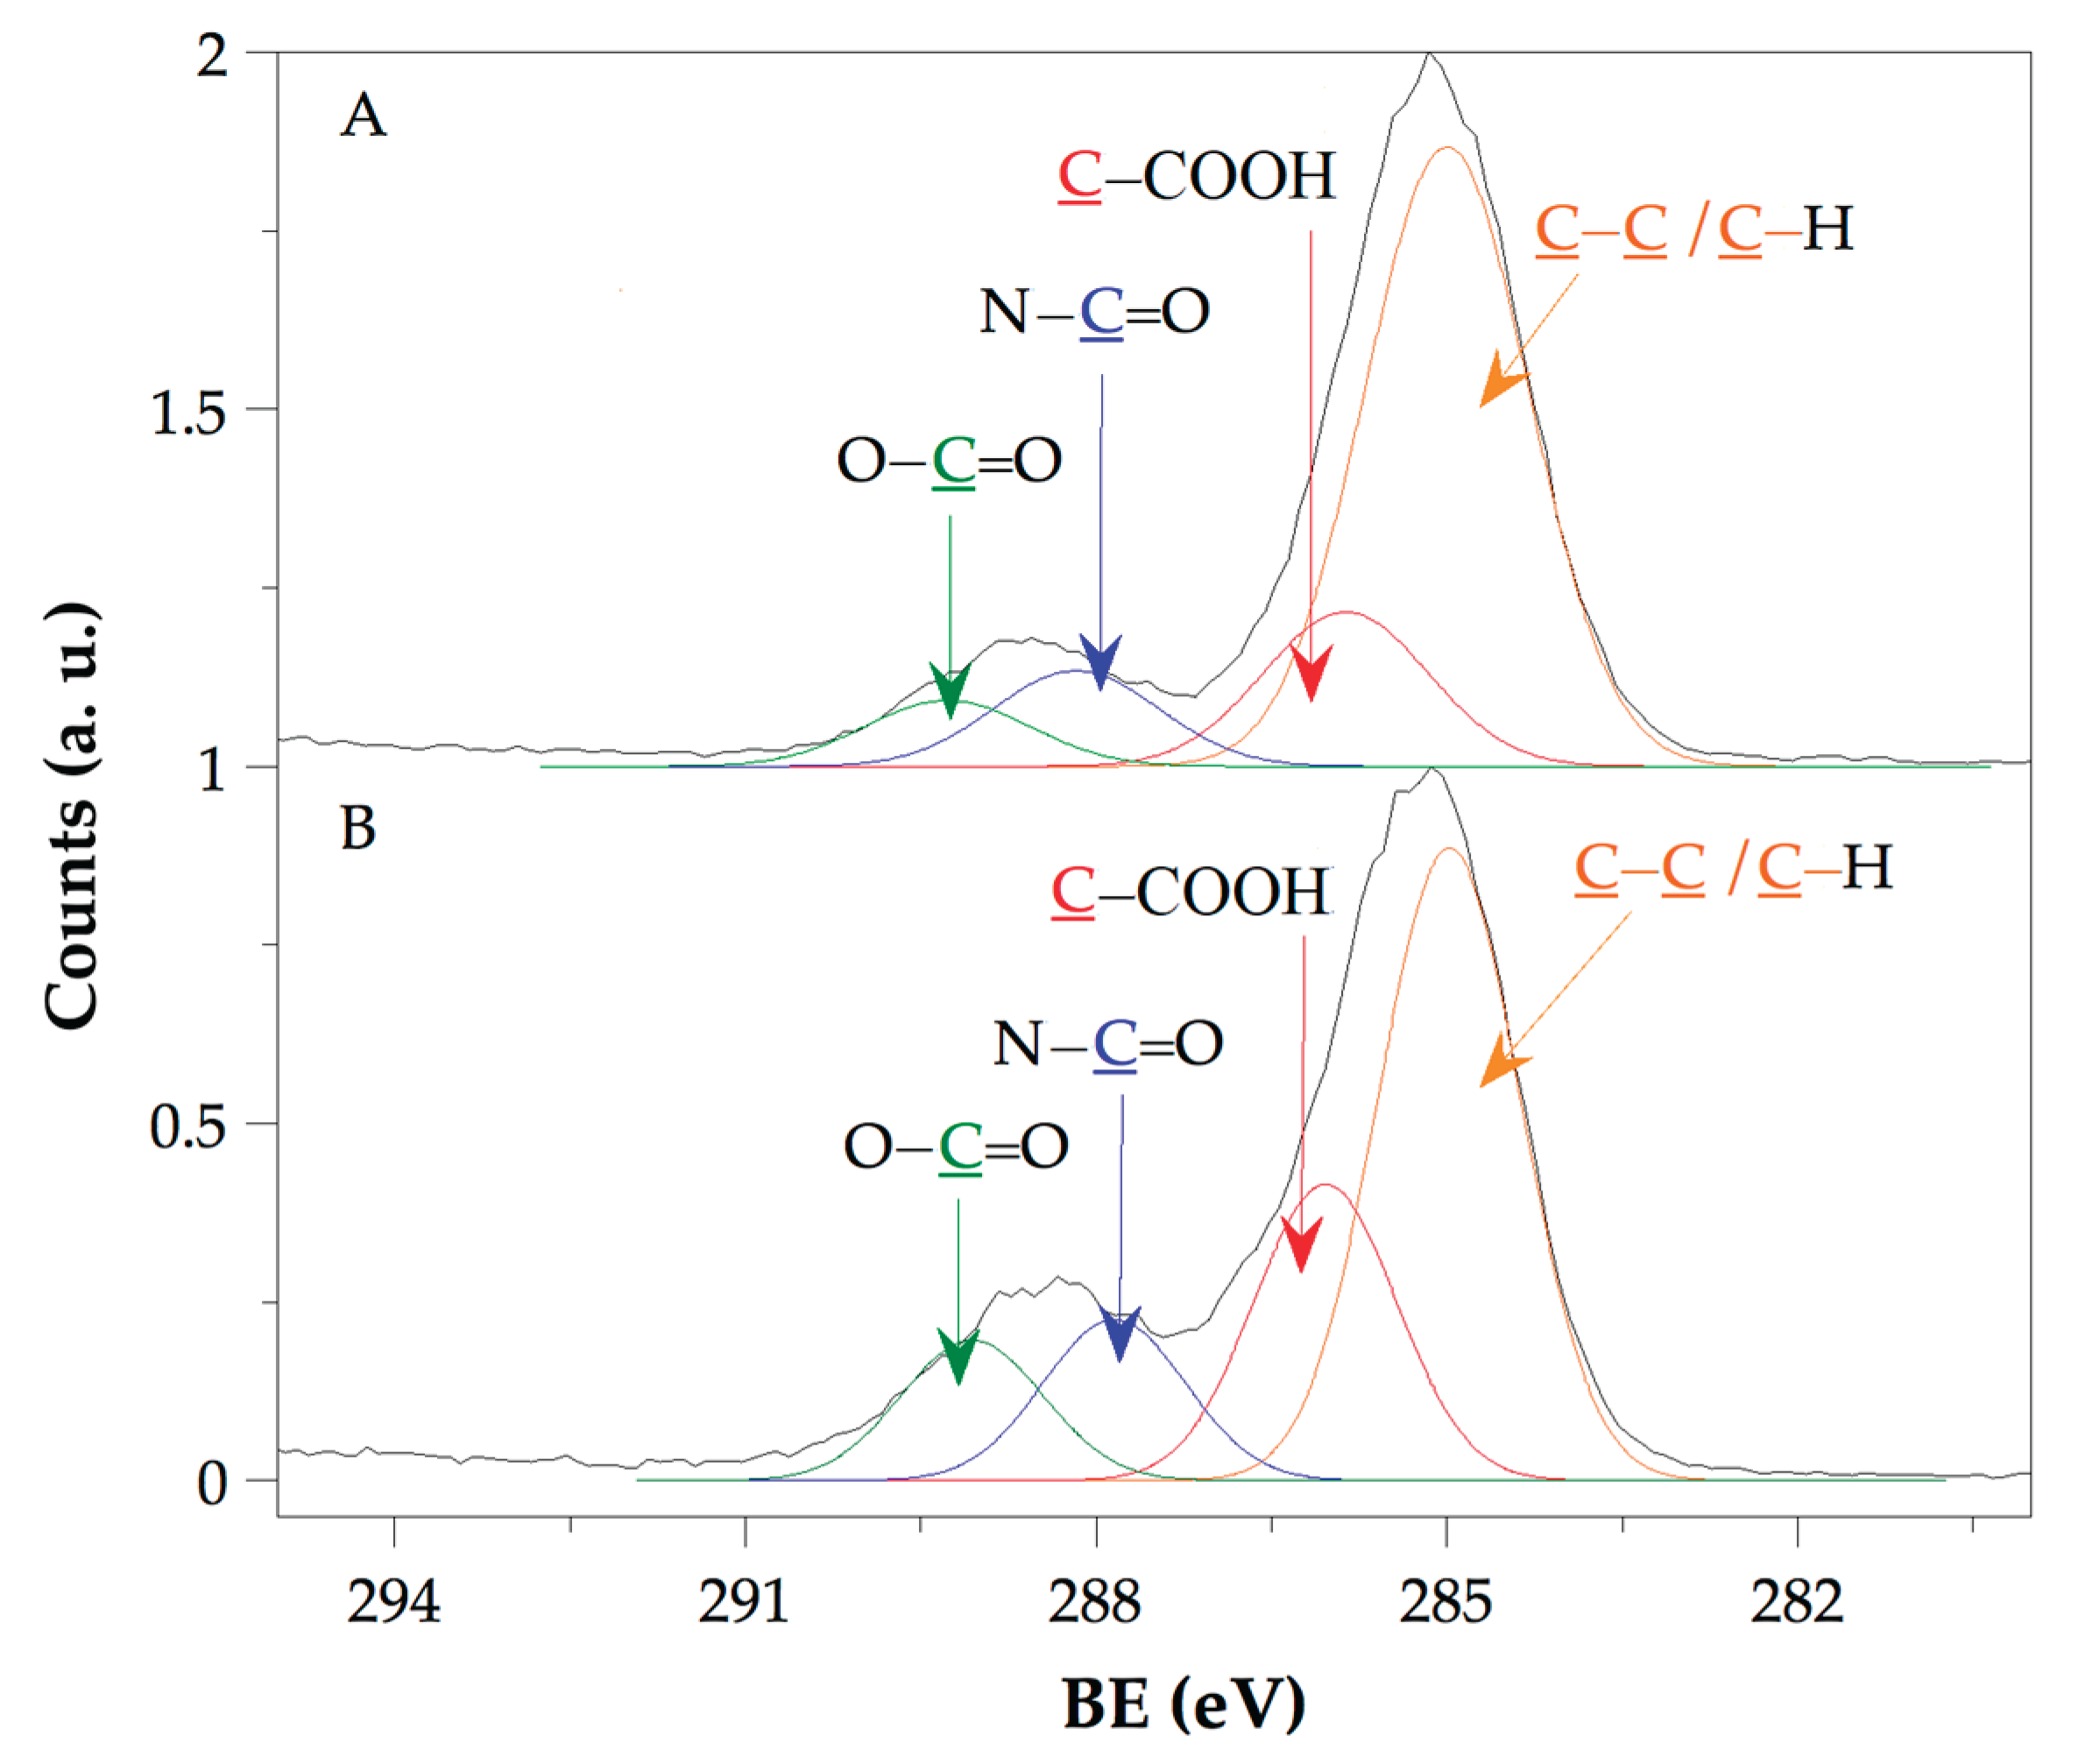
Figure 6.
O1s core–level normalized spectra of Nano Hydro 2 (A) and Hydro 2 (B).
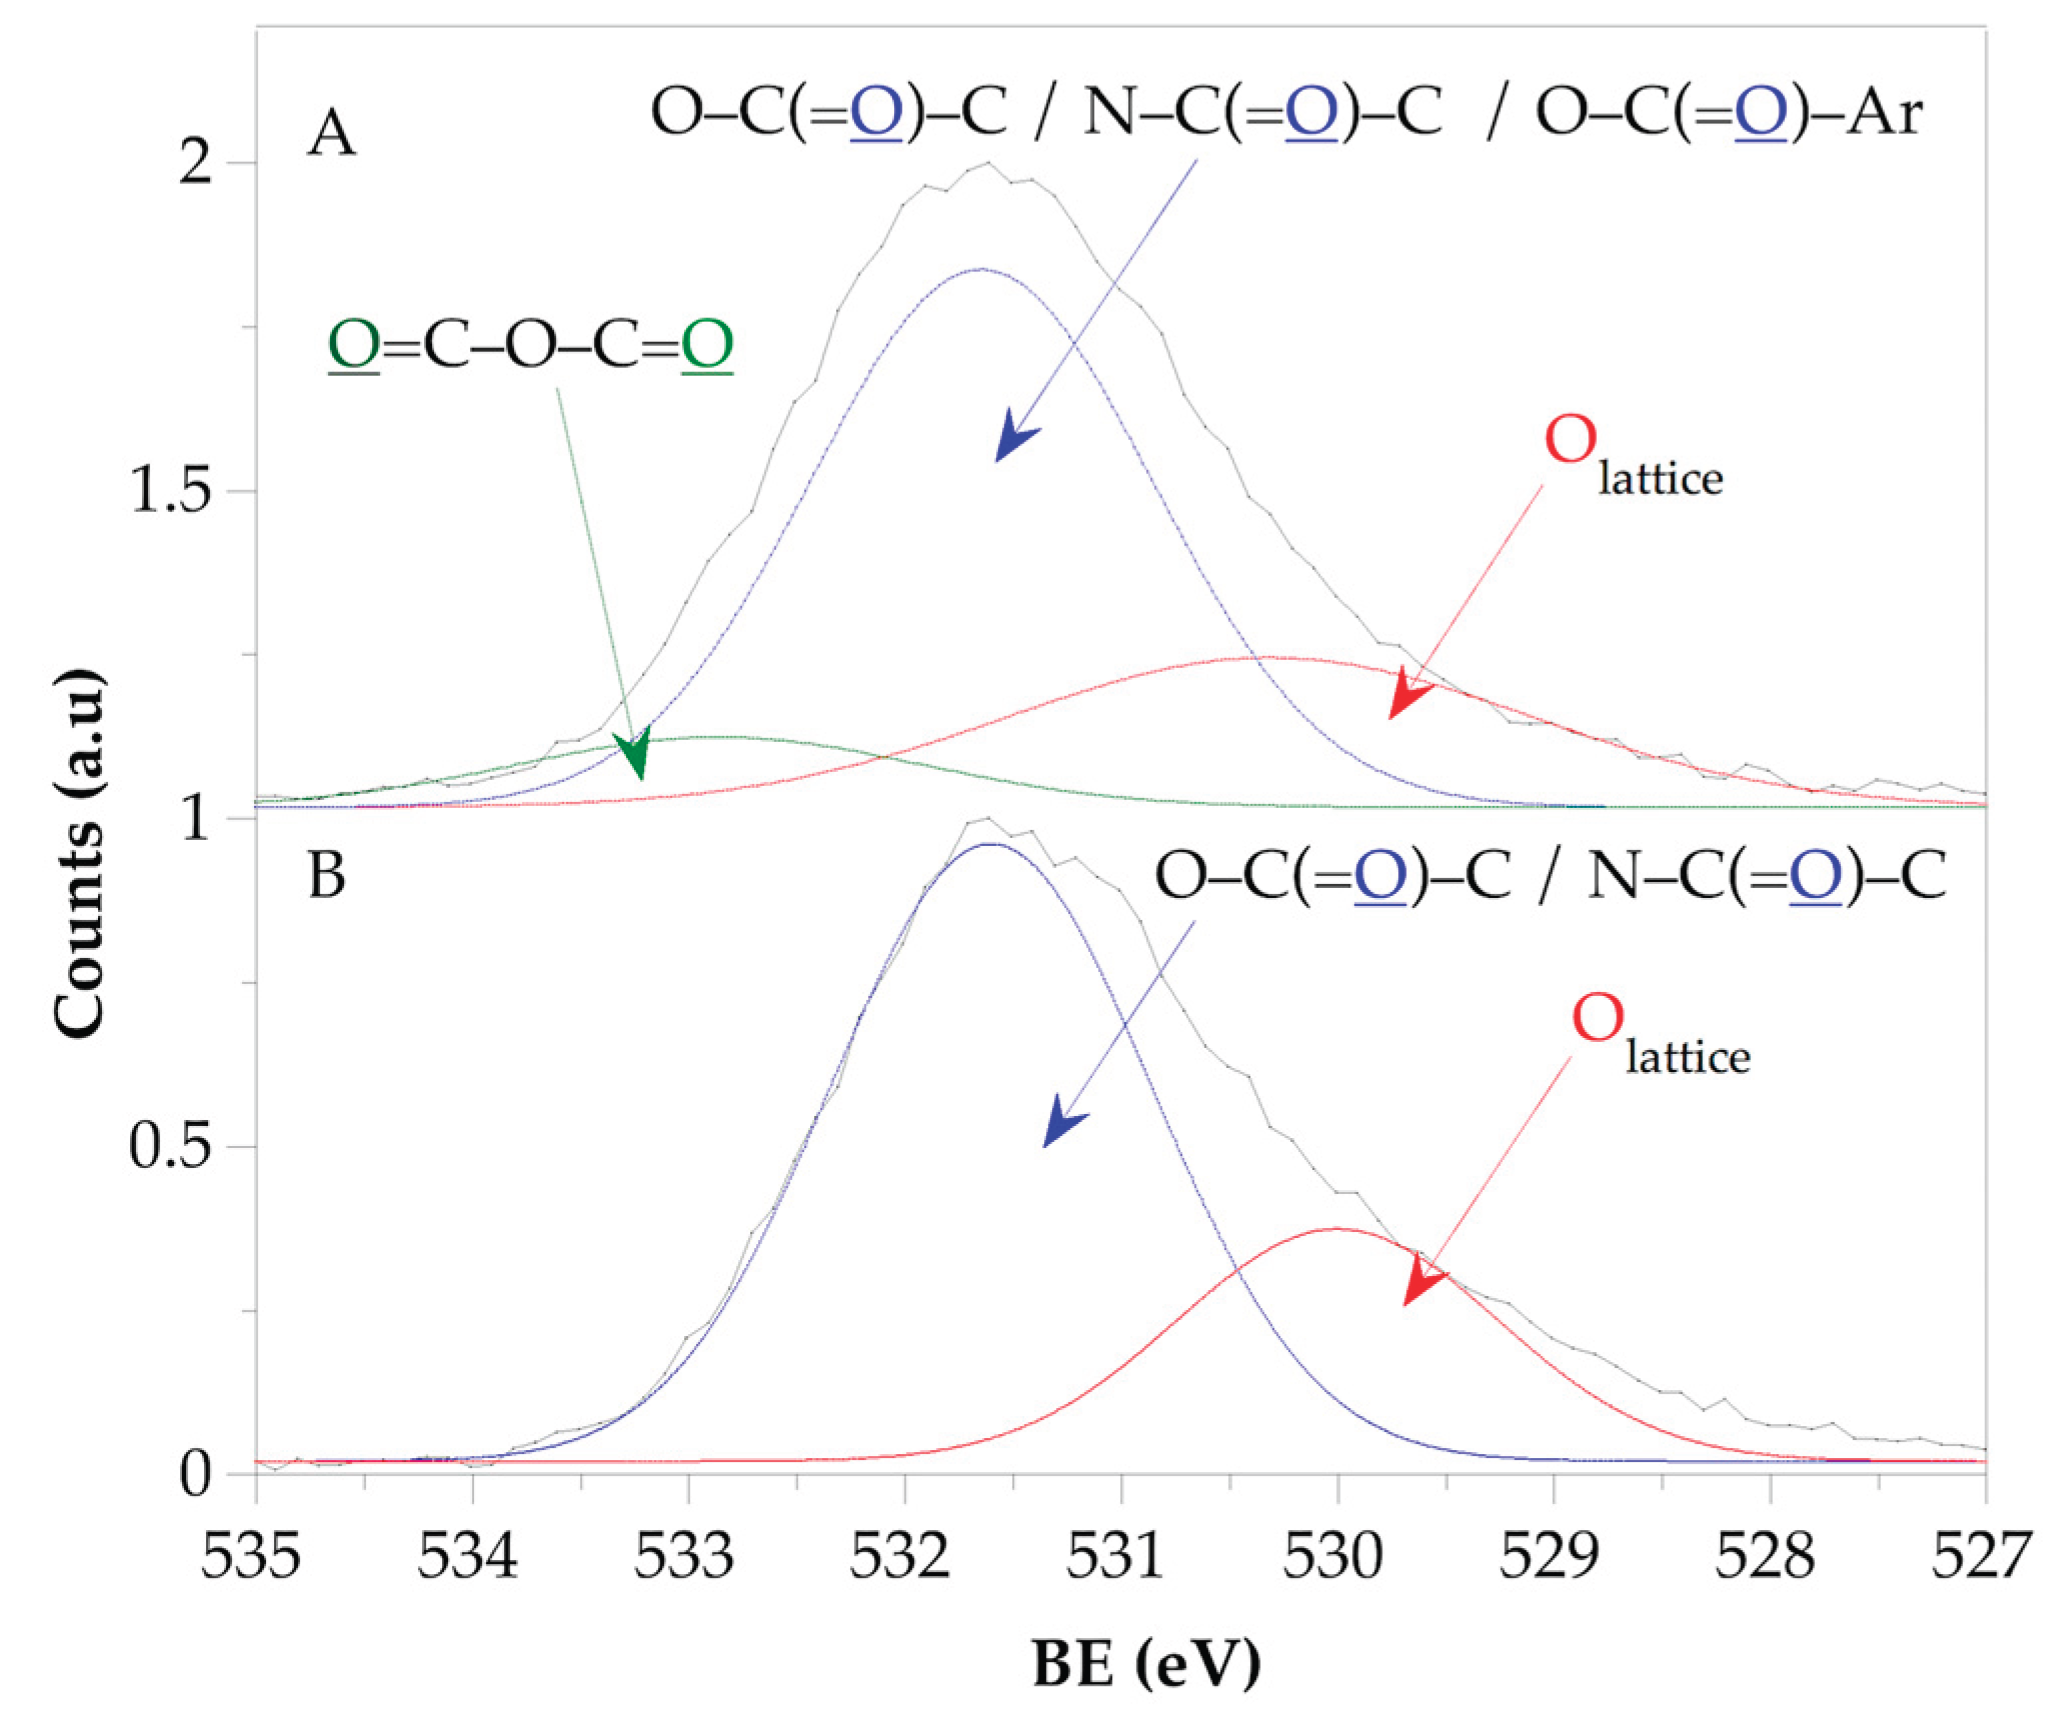
Figure 7.
Swelling isotherms of the hydrogels Hydro 1 ( ), Hydro 2 (
 ), and Hydro 3 (
 ).
).
), Hydro 2 (), and Hydro 3 ().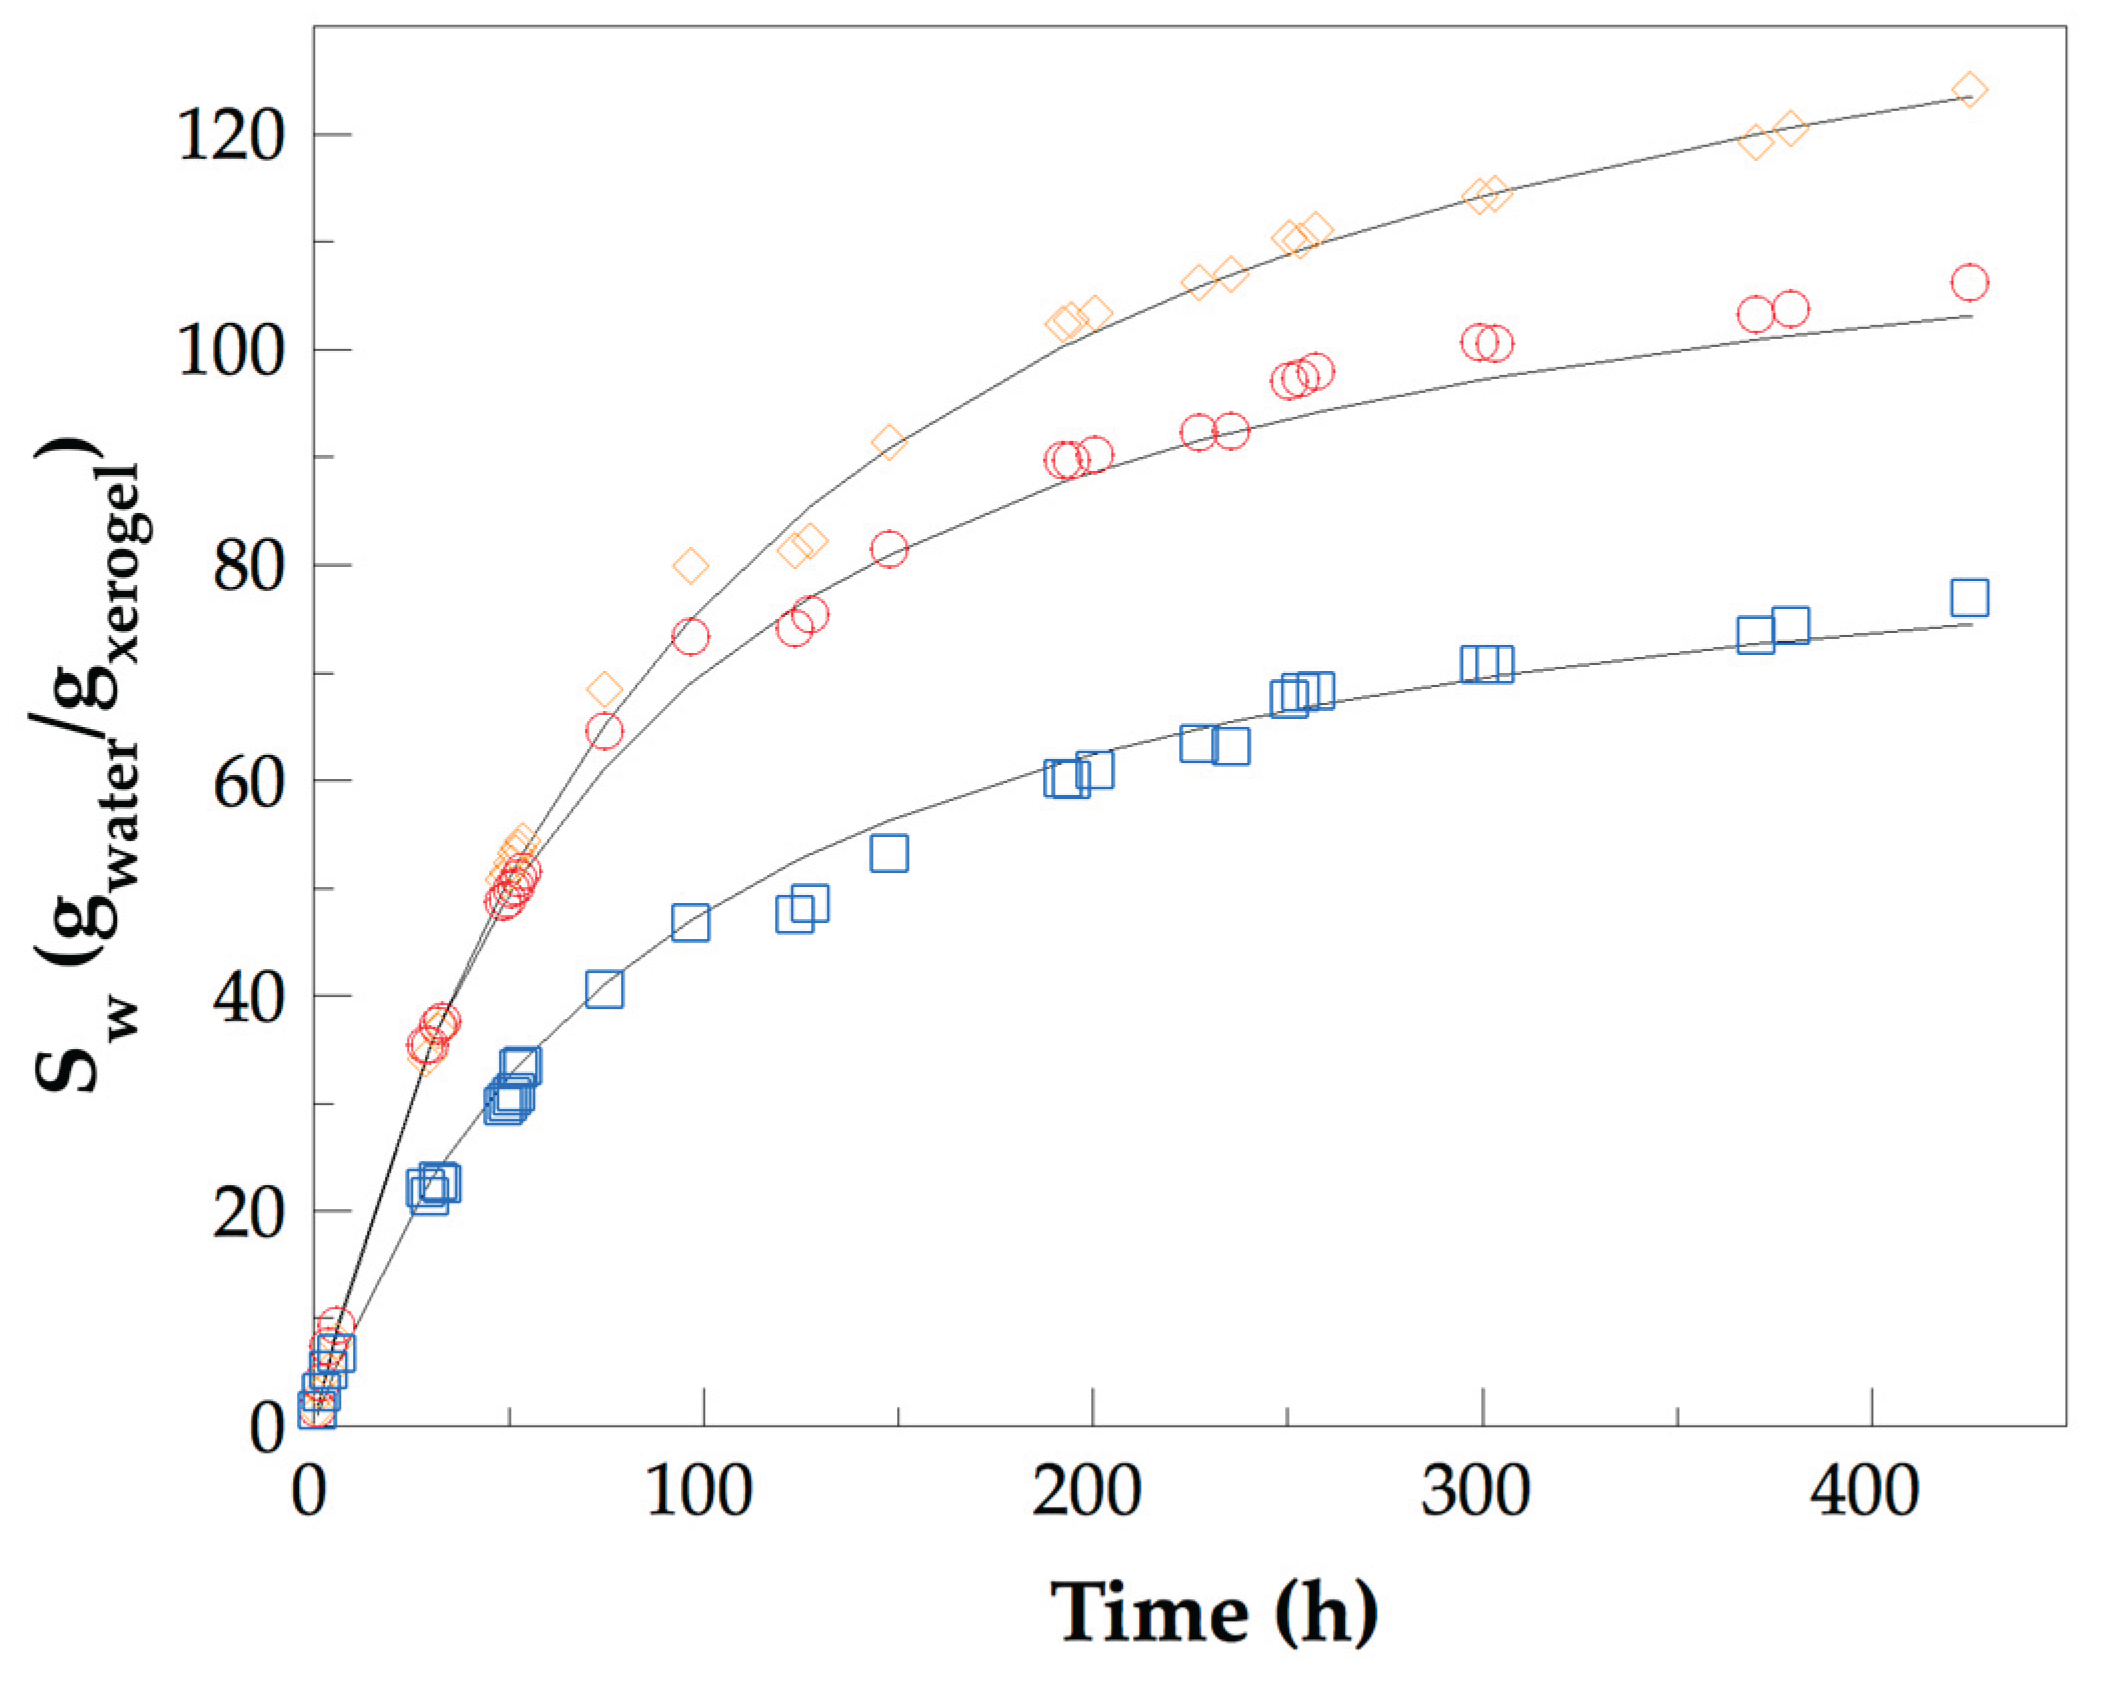
Figure 8.
Swelling isotherms of the nanocomposite hydrogels Nano Hydro 1 ( ), Nano Hydro 2 (
 ), and Nano Hydro 3 (
 ).
).
), Nano Hydro 2 (), and Nano Hydro 3 ().
Figure 8.
Swelling isotherms of the nanocomposite hydrogels Nano Hydro 1 (), Nano Hydro 2 (), and Nano Hydro 3 ().
), Nano Hydro 2 (), and Nano Hydro 3 ().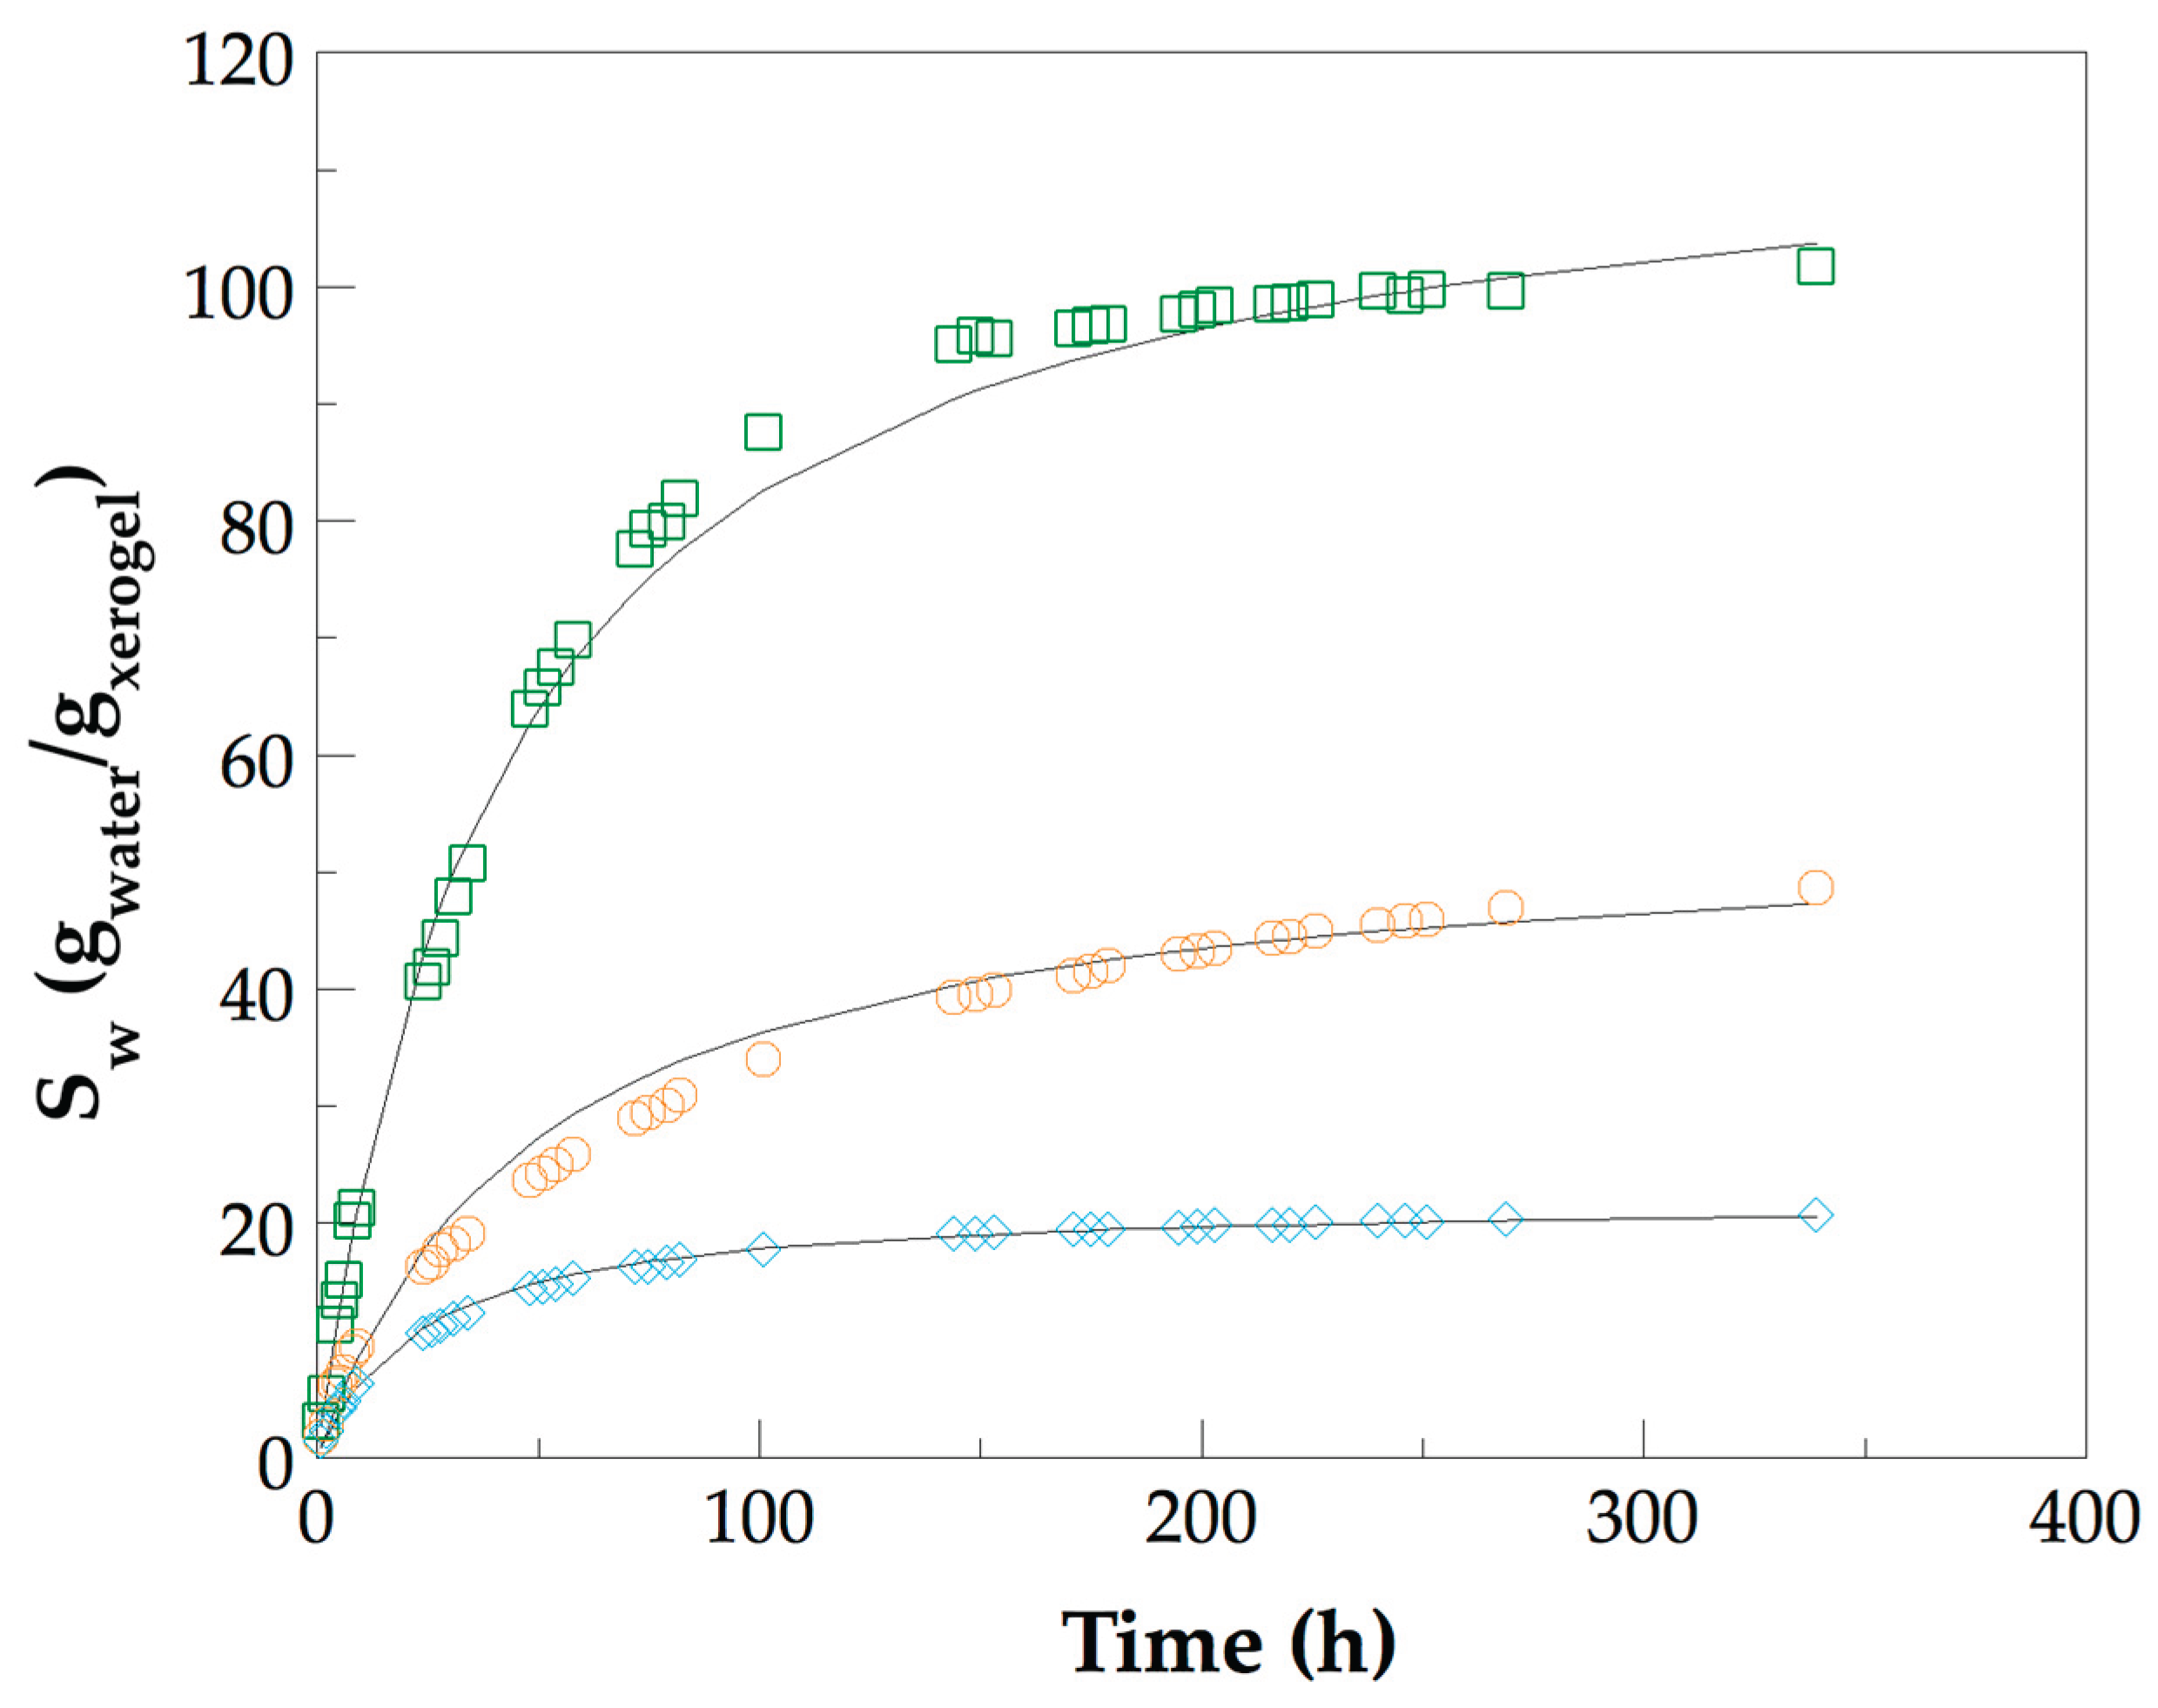
Figure 9.
FE–SEM micrographs of the Nano Hydro 1 (A) and Hydro 1 (B).
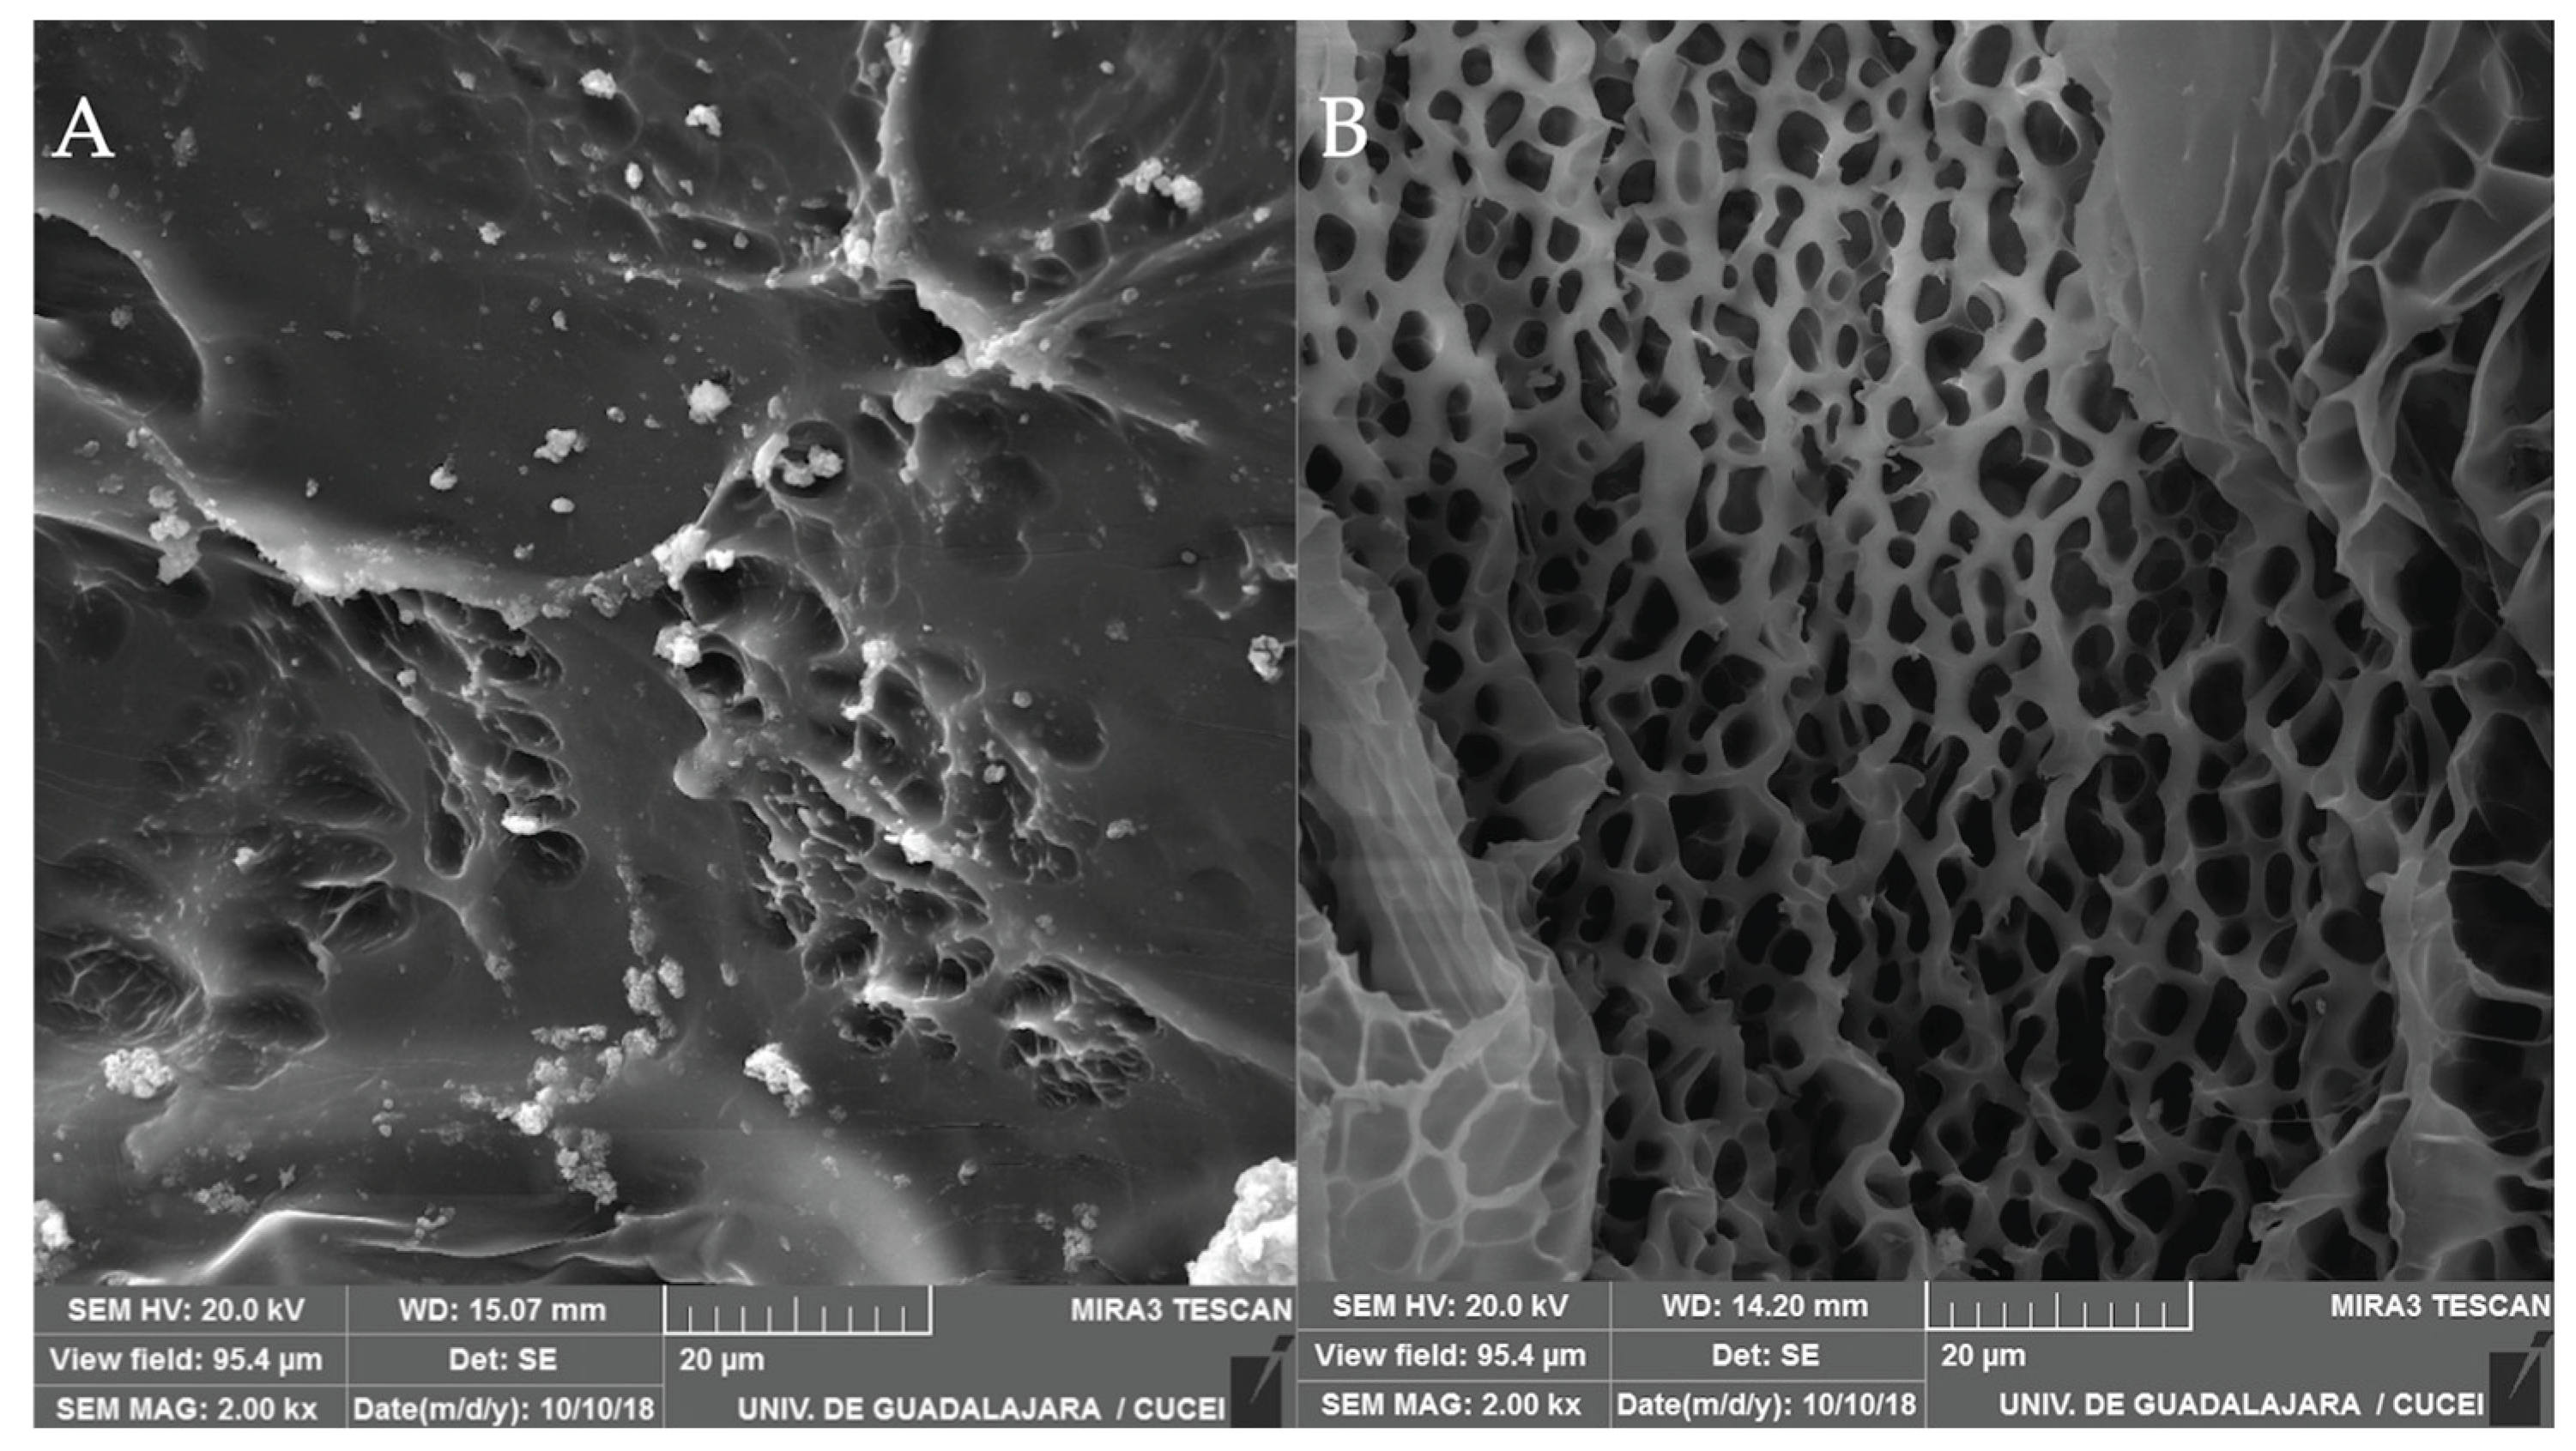
Figure 10.
Folic acid release for Hydro 1 ( ), Hydro 2 ( ), and Hydro 3 (
 ).
).
), and Hydro 3 ().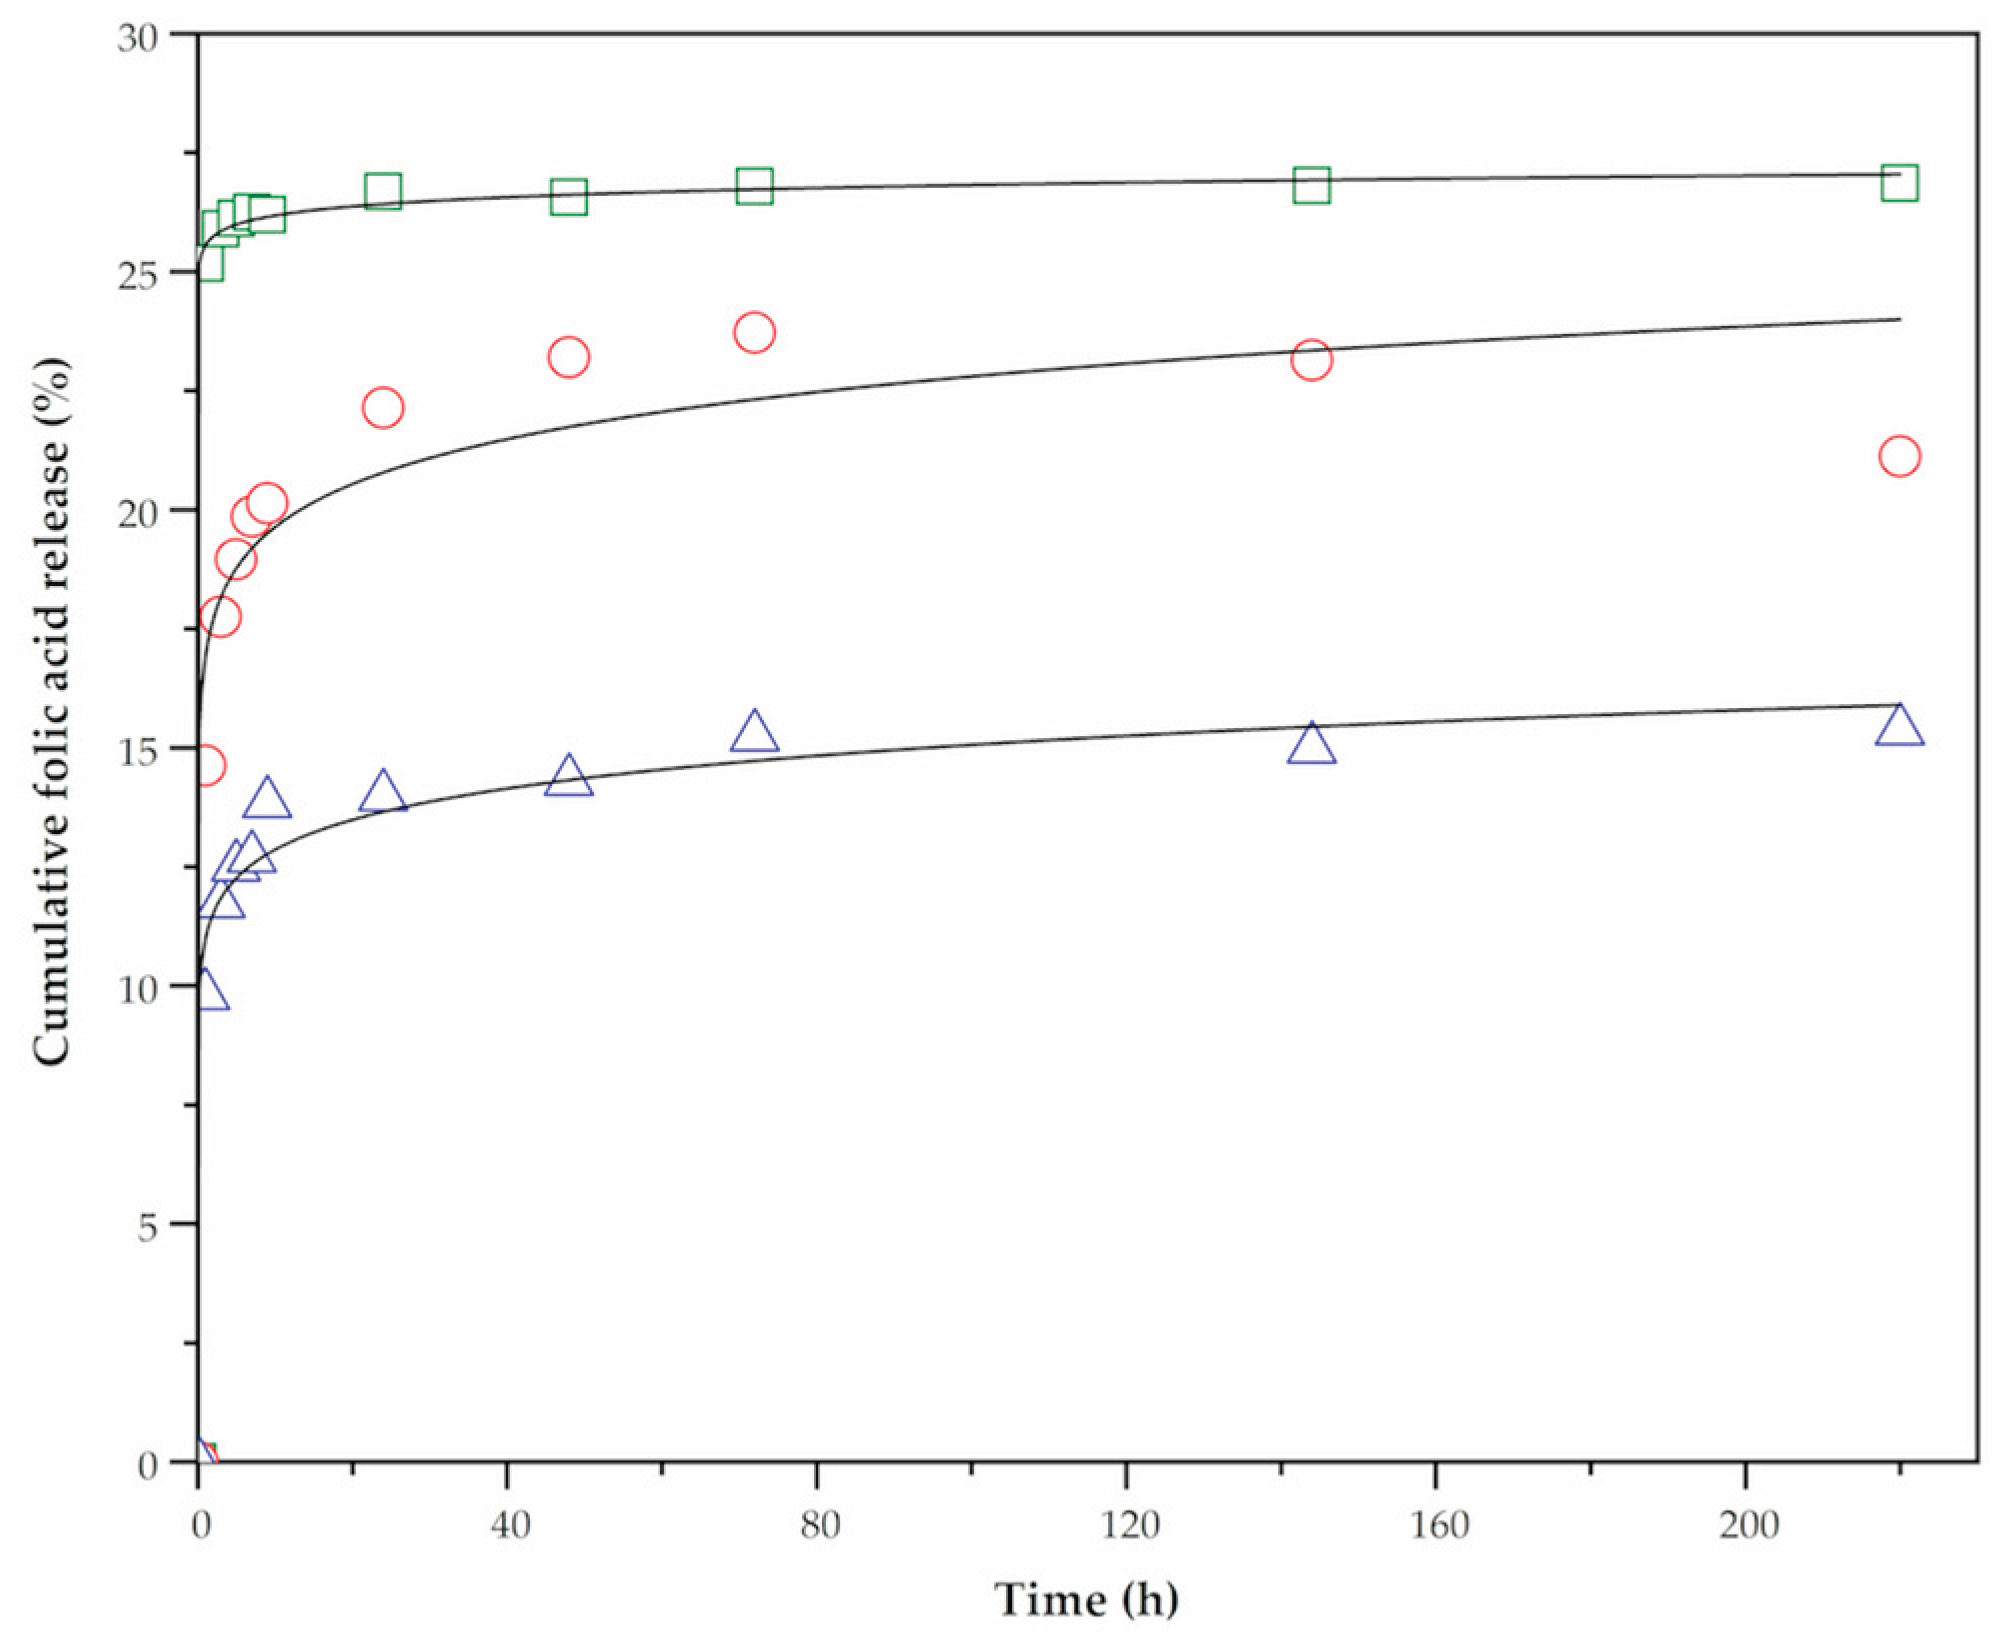
Figure 11.
Folic acid release for Nano Hydro 1 ( ), Nano Hydro 2 (), and Nano Hydro 3 ().
), and Nano Hydro 3 ().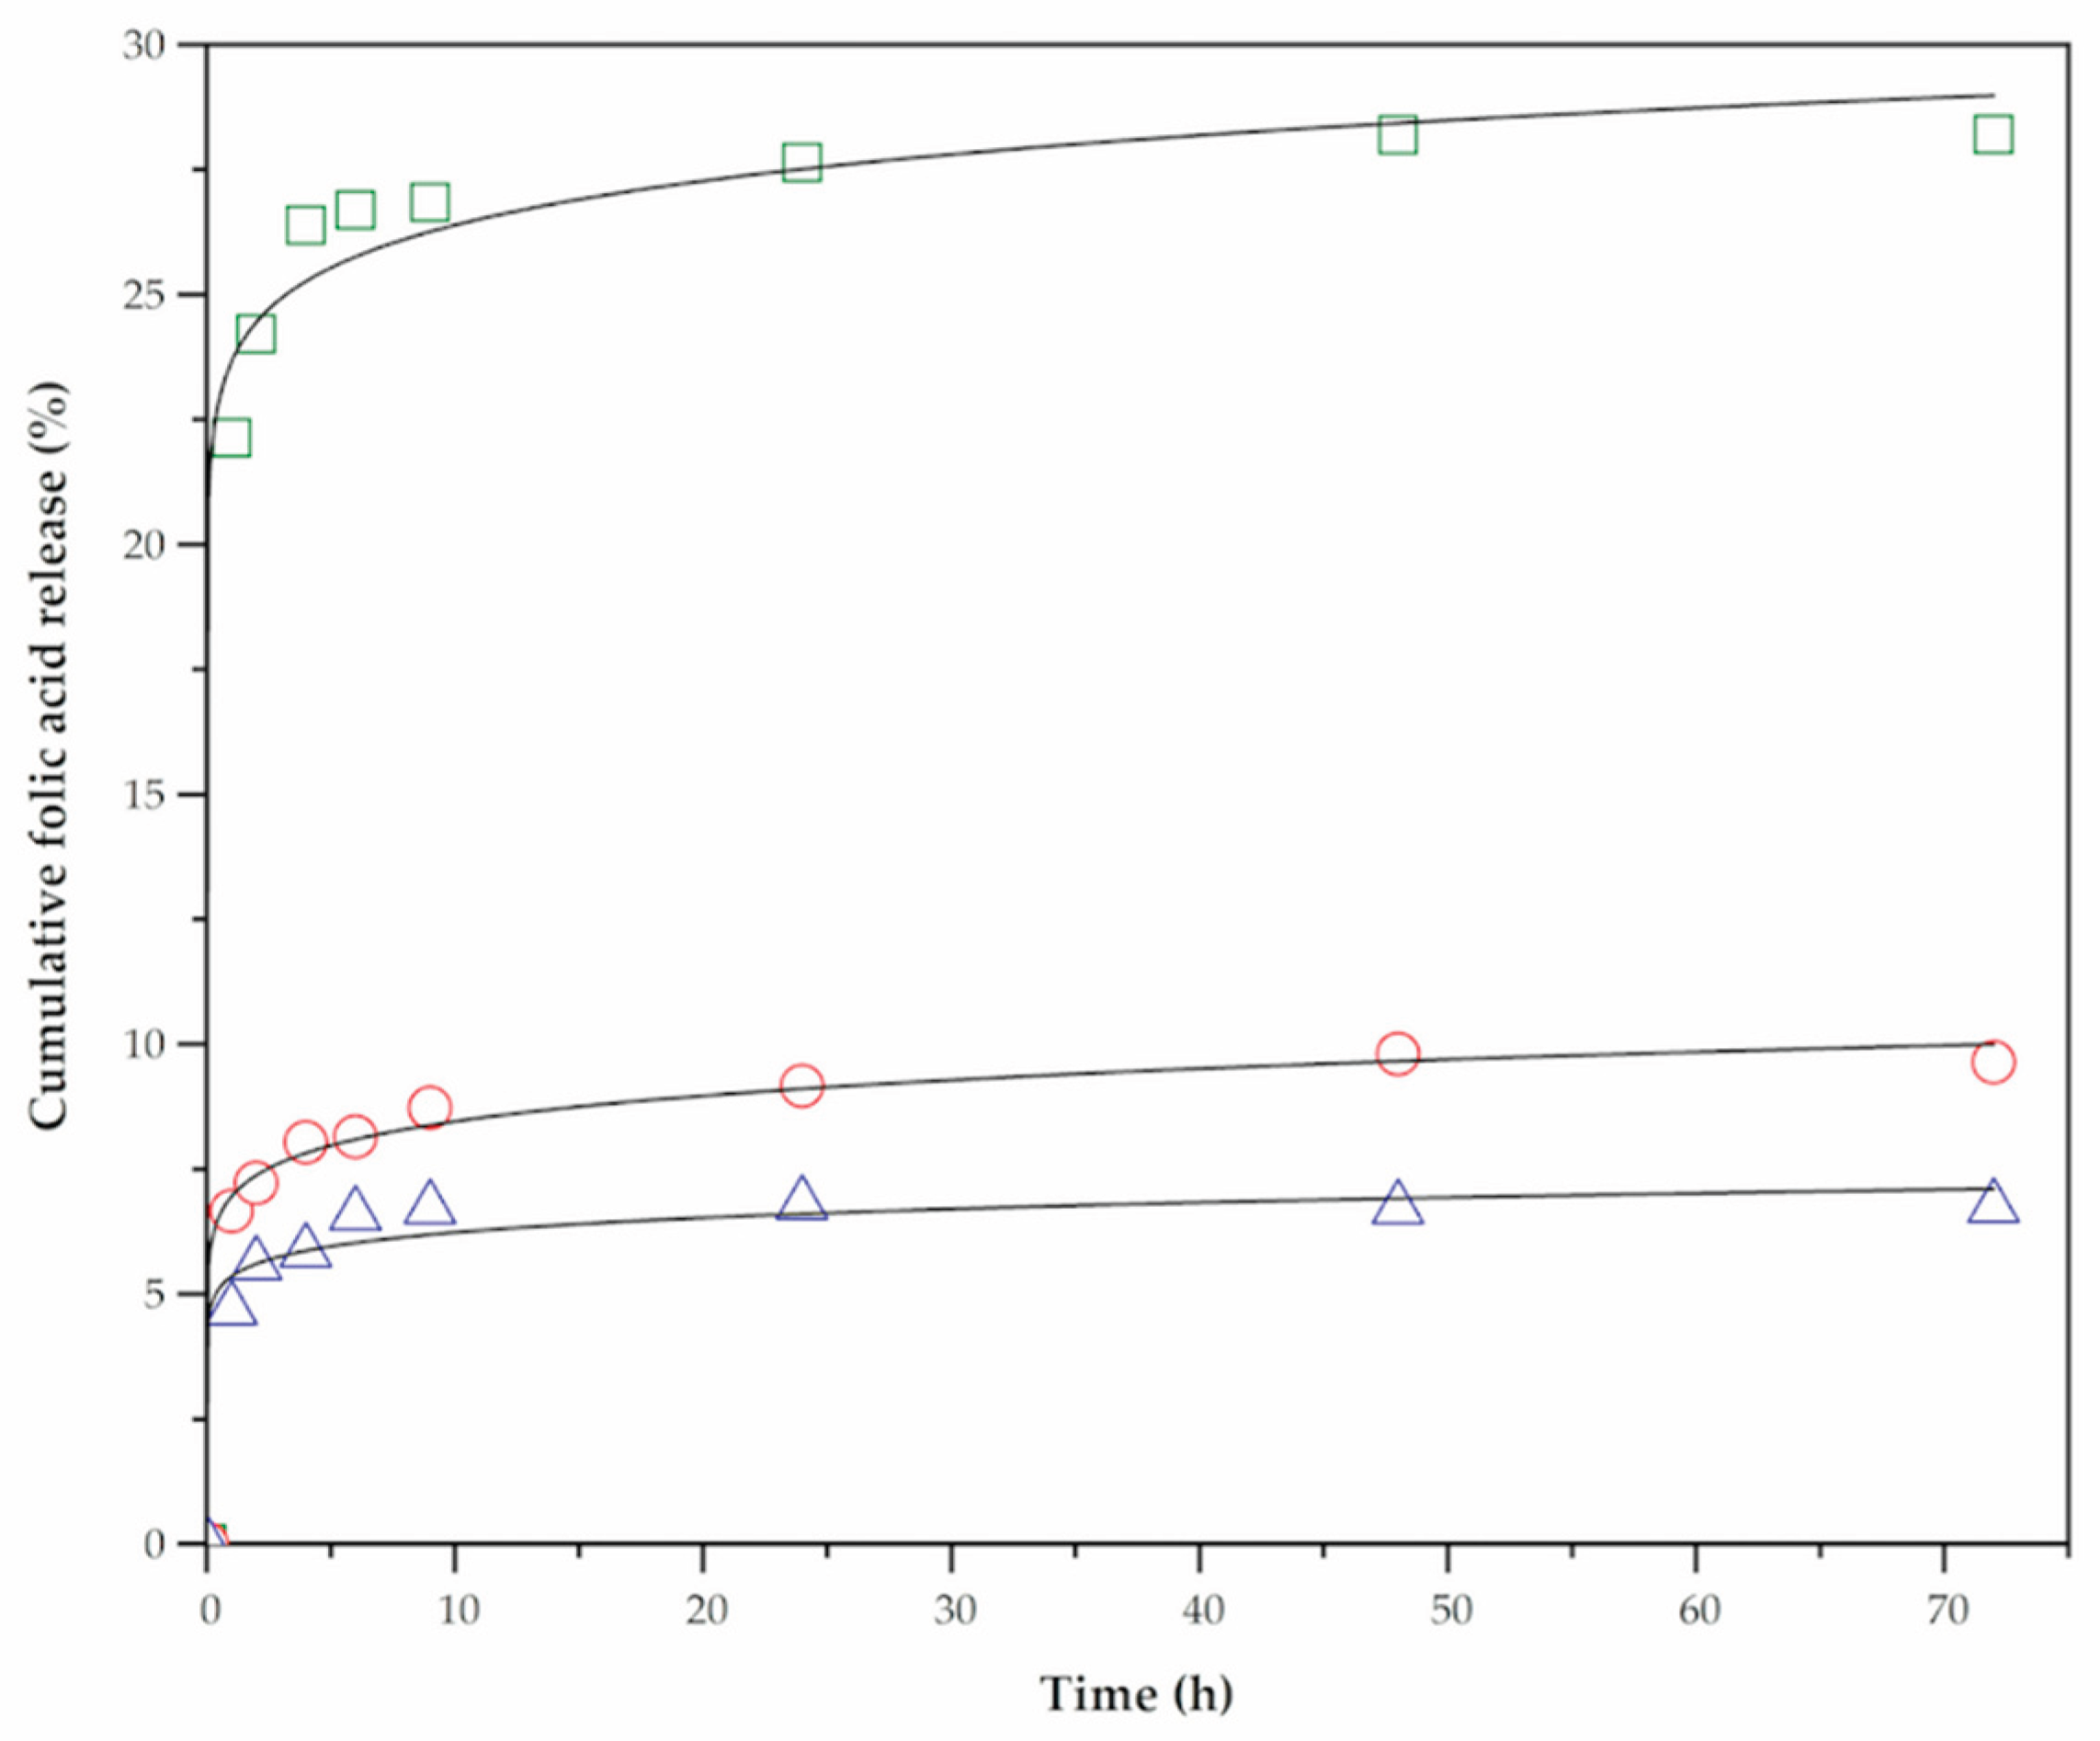

Table 1.
Identification of samples of the AM-AA hydrogels and AM-AA/CNTsOxCl nanocomposite hydrogels as a function of the formulation in wt% used by preparation.
Table 1.
Identification of samples of the AM-AA hydrogels and AM-AA/CNTsOxCl nanocomposite hydrogels as a function of the formulation in wt% used by preparation.
| Samples | AM | AA | NMBA | Na2SO3 | KPS | CNTsOxCl | H2O |
|---|---|---|---|---|---|---|---|
| Hydro 1 | 9 | 1 | 0.1 | 0.05 | 0.05 | 0 | 89.8 |
| Hydro 2 | 8 | 2 | 0.1 | 0.05 | 0.05 | 0 | 89.8 |
| Hydro 3 | 7 | 3 | 0.1 | 0.05 | 0.05 | 0 | 89.8 |
| Nano Hydro 1 | 9 | 1 | 0.1 | 0.05 | 0.05 | 0.1 | 89.7 |
| Nano Hydro 2 | 8 | 2 | 0.1 | 0.05 | 0.05 | 0.1 | 89.7 |
| Nano Hydro 3 | 7 | 3 | 0.1 | 0.05 | 0.05 | 0.1 | 89.7 |
Table 2.
Wavenumbers of the D-, G-, and G’-bands, as well as areas of the G-band and scattering intensity ratios (ID/IG) of CNTspoxi, and CNTsOxCl.
Table 2.
Wavenumbers of the D-, G-, and G’-bands, as well as areas of the G-band and scattering intensity ratios (ID/IG) of CNTspoxi, and CNTsOxCl.
| Samples | D-band (cm-1) |
G-band (cm-1) |
G’-band (cm-1) |
G-band area (u. a.) |
ID/IG |
|---|---|---|---|---|---|
| CNTspoxi | 1233 | 1485 | 2436 | 19.49 | 0.81 |
| CNTsOxCl | 1235 | 1466 | 2461 | 41.43 | 1.56 |
Table 3.
Predicted equilibrium–swelling and swelling rate constants obtained from the second–order swelling kinetic model, and experimentally measured equilibrium–swelling for the AM-AA hydrogels and AM-AA/CNTsOxCl nanocomposite hydrogels.
Table 3.
Predicted equilibrium–swelling and swelling rate constants obtained from the second–order swelling kinetic model, and experimentally measured equilibrium–swelling for the AM-AA hydrogels and AM-AA/CNTsOxCl nanocomposite hydrogels.
| Samples |
|
|
k |
| Hydro 1 | 77.0 | 74.4 | 1.0 |
| Hydro 2 | 106.3 | 103.1 | 1.5 |
| Hydro 3 | 124.2 | 123.4 | 1.7 |
| Nano Hydro 1 | 20.6 | 20.5 | 1.0 |
| Nano Hydro 2 | 48.6 | 47.3 | 1.1 |
| Nano Hydro 3 | 101.3 | 103.6 | 2.9 |
1Values obtained from experimental measurements. 2Values recorded from the second–order swelling kinetic model fitting.
Table 4.
Young moduli and the coefficient of determination (R2) of the AM-AA hydrogels and AM-AA/CNTsOxCl nanocomposite hydrogels recorded at equilibrium swelling.
Table 4.
Young moduli and the coefficient of determination (R2) of the AM-AA hydrogels and AM-AA/CNTsOxCl nanocomposite hydrogels recorded at equilibrium swelling.
| Samples |
E (Pa) |
Coefficient of determination (R2) |
|---|---|---|
| Hydro 1 | 6560 | 0.994 |
| Hydro 2 | 7602 | 0.994 |
| Hydro 3 | 8796 | 0.994 |
| Nano Hydro 1 | 9220 | 0.996 |
| Nano Hydro 2 | 10350 | 0.990 |
| Nano Hydro 3 | 10595 | 0.983 |
Table 5.
Weibull model parameters and coefficient of determination (R2) for the AM-AA hydrogels and AM-AA/CNTsOxCl nanocomposite hydrogels.
Table 5.
Weibull model parameters and coefficient of determination (R2) for the AM-AA hydrogels and AM-AA/CNTsOxCl nanocomposite hydrogels.
| Samples | Parameters of the Weibull model | Coefficient of determination (R2) | ||
|---|---|---|---|---|
| Hydro 1 | 0.96 | 8.0 | 0.057 | 0.993 |
| Hydro 2 | 0.98 | 4.9 | 0.054 | 0.973 |
| Hydro 3 | 0.96 | 3.3 | 0.009 | 0.999 |
| Nano Hydro 1 | 0.99 | 16.6 | 0.042 | 0.987 |
| Nano Hydro 2 | 0.75 | 13.1 | 0.074 | 0.997 |
| Nano Hydro 3 | 0.97 | 3.4 | 0.037 | 0.998 |
Disclaimer/Publisher’s Note: The statements, opinions and data contained in all publications are solely those of the individual author(s) and contributor(s) and not of MDPI and/or the editor(s). MDPI and/or the editor(s) disclaim responsibility for any injury to people or property resulting from any ideas, methods, instructions or products referred to in the content. |
© 2025 by the authors. Licensee MDPI, Basel, Switzerland. This article is an open access article distributed under the terms and conditions of the Creative Commons Attribution (CC BY) license (http://creativecommons.org/licenses/by/4.0/).
Copyright: This open access article is published under a Creative Commons CC BY 4.0 license, which permit the free download, distribution, and reuse, provided that the author and preprint are cited in any reuse.


