
Submitted:
29 August 2025
Posted:
01 September 2025
You are already at the latest version
Abstract
This work details the development of a 10-stage solid-stage linear transformer driver (SSLTD) capable of producing 24 kV, 1 kA pulses with a rise-time of ∼ 10 ns utilizing SiC MOSFET switches. Throughout the development process, various design parameters were investigated for their influence on the LTD performance. Among these considerations was an evaluation of the behavior of several nanocrystalline magnetic core materials subject to high voltage pulsed conditions, with an emphasis on minimizing energy losses. Other design parameter of interest lies in the physical layout of the LTD structure, particularly the diameter of the central stalk and the dielectric material, which together define the characteristics of the coaxial transmission line, as well as the overall height of each stage. The influence of each of these parameters was weighed to optimize the final design for fastest output pulse rise-time, highest efficiency, and cleanest output pulse waveform profile across varying load resistance. This work also introduces a pulsed reset technique, where repetition-rated burst testing was used to find the maximum operational frequency of the LTD without driving the magnetic cores into saturation.
Keywords:
linear transformer driver
; solid-state switching
; nanocrystalline magnetic core
1. Introduction
The demand for faster and more reliable pulsed power systems continues to grow, driven by applications in plasma physics, fusion research, and advanced accelerator technologies [1,2,3]. Advancements in solid-state switching technology have made pulsed power systems utilizing solid-state switches a viable option to meet these demands. The Linear Transformer Driver (LTD) topology is well suited for solid-state switching, and offers the potential for scaling to medium scale pulsed power systems.
LTDs offer competitive advantages over traditional Marx generators, especially in the case of solid-state pulsed power. Although LTDs utilize magnetic cores that are often costly and bulky, the advantage offered over the solid-state Marx generator is the stage-to-stage isolation, meaning each stage is ground referenced, allowing for simple and reliable low voltage trigger circuitry. LTDs are compact, modular devices engineered to deliver high-power, short-duration pulses, achieved by integrating multiple pulse-forming stages that enable high repetition rates, fast rise-times, and efficient energy transfer [4,5,6,7]. Unlike conventional transformers, the LTD functions more like a linear voltage adder, operating similarly to an inductive voltage adder (IVA) in its energy delivery mechanism [8,9].
The characterization of magnetic materials for use in LTDs and IVAs has previously focused on amorphous materials under fast pulse excitation [10,11,12]. This work extends that research to nanocrystalline materials, with a preliminary examination of their behavior under pulsed conditions. Ultimately, this work examines the impact of different magnetic cores and their magnetic properties on overall LTD performance in terms of pulse rise-time as well as energy losses. Additionally, this work utilizes an active (pulsed) magnetic core reset technique, eliminating the need for bulky choke inductors, which are prone to overheating under continuous current operation. To asses the effectiveness of the magnetic core reset, the LTD was operated in a repetition-rated manner to determine the maximum shot frequency under specific output pulse conditions, as resetting the core is required between consecutive shots. This work also examines the role of LTD physical geometry on its performance, more specifically, the center stalk diameter, and dielectric, and the corresponding transmission line impedance. The LTD geometry investigation focuses on the resulting output pulse rise-time and pulse shape across varying loads with different center stalks. The variations in output pulse seen with different stalks speaks to the transmission line nature of the LTD, suggesting the classical understanding of this system as a transformer, while useful is an incomplete representation of the complexities associated with the LTD.
1.1. Background
The LTD was first developed in Tomsk, Russia at the High Current Electronics Institute (HCEI) [13]. The novelty of the LTD as a prime-power generator, is its capability to deliver fast high voltage/current pulses directly to the load without additional pulse compression stages, typically necessary with the more traditional Marx generator based systems [4,9]. Since this first development, there have been successful ventures expanding the scope and capabilities of the LTD topology, including a joint effort conducted between Sandia National lab and the HCEI in Russia. These LTD experiments aimed to produce 0.5 MA pulses with fast rise-time of just 100 ns, utilizing gas switches [14]. The MYKONOS laboratory in Sandia came from this foundational work, where experiments were conducted by stacking 10, 1 MA, 100 kV LTD cavities to achieve a 1 MA, 1 MV output pulse [15]. The LTD technology has also been adapted to smaller-scale systems using solid-state switching, typically using high power MOSFETs [4,5,6,7,16]. A key difference in the operation of a solid-state LTD (SSLTD) in relation to the traditional LTD is the ability to turn off the switches. In SSLTDs, the energy storage capacitors are often relatively large to minimize voltage droop during the pulse. The square output pulse is shaped by the timing of the switches being turned on and off [4]. Another advancement in the development of SSLTDs is the bipolar SSLTD, capable of producing positive or negative pulses based on the input triggers [16].
Table 1 summarizes the performance specifications of SSLTDs reported in literature, along with the results of the system developed in this work, see Section 3.3 for detailed discussion. Reported systems feature stage voltages of 1 kV or less, rise-times in the range of 4 ns - 40 ns, 4 - 30 stages, and resistive loads ranging from 40 to 300 .
2. Materials and Methods
2.1. System Setup
The system includes simple controls for the synchronous triggering of the LTD stages and the core reset boards, a 10-stage LTD, and a load. The individual stages consist of ten bricks, each in parallel, with a total stage voltage of 2.4 kV and a maximum current of 1 kA. In this configuration, current addition is achieved by connecting multiple bricks in parallel within a single stage, whereas voltage addition is accomplished by connecting multiple stages in series. The basic expression given in Equation (1) describes this voltage amplification.
Where is the total output voltage, is the number of stages, and is the charge voltage of each stage.
Figure 1 shows the magnetizing current and the main current paths in a simplified 2-stage LTD. The magnetic core acts as a choke, suppressing the current in the inner loop, the magnetization current. The current in this inner loop is not transferred to the load and is a source of losses in this system, highlighting the necessity of high performance magnetic cores for high efficiency. When the core is driven into saturation, almost all current will take the same path as the magnetization current and load current will be small. In addition to the current loops depicted in Figure 1, the transmission line is depicted with a coaxial geometry consisting of an inner and outer conductor with a dielectric in between. Equation (2) gives an expression for the characteristic impedance of this transmission line.
where and are the relative permeability and permittivity of the dielectric medium, while and represent the outer radius of the inner conductor and the inner radius of the outer conductor, as illustrated in Figure 1.
2.1.1. Stage Layout
Each stage of the LTD consists of ten bricks connected in parallel. The bricks are arranged in an annular configuration around the magnetic core and are interconnected by a copper pad positioned beneath the core; see Figure 2a. The board diameter is 300 mm, a size selected to accommodate the core dimensions available at the beginning of the design process. At the center of the board is a hole with a diameter of 22 mm (or in.), which corresponds to the outer diameter of the transmission line. This size was determined based on the core’s inner diameter of 33.7 mm, providing adequate space for the outer conductor of the transmission line and the reset winding required on the core.
The switch selected for this design is the Genesic G2R120MT33J SiC N-channel MOSFET [17]. This device features a maximum hold-off voltage of 3.3 kV and a pulsed current rating of 100 A. To ensure reliability and extend the lifespan of both the MOSFET and the capacitors, the maximum charging voltage per brick is limited to 2.4 kV. Each brick includes a 330 nF capacitor bank, resulting in a total capacitance of 3.3 per stage. The capacitor configuration comprises multilayer ceramic capacitors arranged in a two-high vertical stack within a metal frame. This metal frame allows for small mechanical vibrations as a result of the piezoelectric effect associated with the fast discharge rates required of the capacitors in this system. The capacitors are arranged with three sets of two series capacitors connected in parallel, totaling six capacitors per brick.
Twelve 6 mm (1/4 in.) vias are located along the edge of the board and are designed for the aluminum standoffs used to stack multiple LTD boards. Ten vias serve as ground connections, while the remaining two are designated for high and low voltage distribution to each board. Depending on operating requirements, the low voltage rail can vary between 10-30 V. On the final board in the stack, both voltage connections are capped with a washer and nut to ensure they do not make contact with the top ground plane, preventing accidental shorts.
The inner conductor of the transmission line, center stalk, is grounded at the bottom of the system and connected to the load at the top. Each individual stage, as well as the load share a common ground, established by the standoffs discussed previously, making this a very modular design where stages can be added or replaced with ease.
2.1.2. Magnetic Reset Controls
An essential part of the LTD is the core reset mechanism. The core’s total flux must be below the saturation point for the LTD to operate correctly. If the core saturates, the inner current loop of the LTD effectively becomes a short circuit. This disruption compromises the voltage to the load, resulting in a distorted or incomplete pulse.
During material testing, both DC and active (pulsed) reset methods are used to evaluate core behavior under different reset conditions. Each core is fitted with a single-turn winding connected to the reset source during testing, serving as the cores reset winding.
The DC reset method utilizes a DC power supply connected through a choke inductor, isolating the reset winding from the power source. The choke inductor permits steady DC current to flow into the winding while effectively blocking high-frequency or pulsed currents that may be induced during testing. Through this investigation, it has been found that choke inductors without magnetic material are best suited for this purpose.
The active reset board determines both the duration and magnitude of the core reset current, allowing the cores to be reset to different levels for comparison or for tailoring the fall time based on the length of the high-voltage pulse. The circuit is a simple switch-capacitor bank design, as shown in Figure 3.
The capacitor bank consists of 6 mF and can be charged up to 20 V, providing sufficient energy storage to maintain a constant current for extended periods. For example, a 4 A current can be sustained for approximately 1 ms before experiencing only a 5% voltage decay. The reset current for each board is regulated by selecting a specific resistor value and adjusting the charging voltage accordingly. The reset board connects directly to the core reset winding, with a MOSFET serving as the switch to control both the timing and duration of the reset pulse. When the MOSFET is open, the LTD is effectively isolated from the reset board, eliminating the need for a choke inductor.
2.2. Magnetic Materials
Identifying core material characteristics is crucial for the design and operation of the LTD. Three different cores were evaluated to optimize LTD performance. While all cores were made from the same Metglas nanocrystalline material from MK Magnetics, they underwent different annealing processes, affecting their magnetic properties. The cores are laminated, which is crucial for minimizing eddy current losses during fast pulse excitation.
The cores are identical in size, with dimensions provided in Figure 2b and a maximum total flux swing, assuming the core is fully reset into negative saturation of 2.36 T. The thickness of the lamination is 13 and the total width of the layer (including the insulation) is 16 , resulting in a lamination count of approximately 2,340. The 3 insulation thickness is inferred from the total area of the core and the packing factor specified in the datasheet.
Although all cores use the same nanocrystalline magnetic material, differences in annealing field strength and orientation result in varied permeability and B-H characteristics, while the material’s maximum flux density remains constant. Table 2 summarizes the magnetic properties of the three cores.
3. Results
3.1. Material Responses
To meet the design requirement of a 500 ns pulse at 2.4 kV (1.2 mVs), the core must support a flux swing of at least 1.62 T without saturating, based on its physical dimensions.
To evaluate the performance of the cores under pulsed conditions, which more accurately reflect LTD operation, their magnetic behavior was tested under fast pulsed excitations. A simple pulse generator was used to apply voltages up to 2.4 kV to the cores, with a rise-time of approximately 20 ns. The core was first reset using a single-turn continuous DC reset current of 4 A before applying the high-voltage pulse. The reset utilizes an air core choke inductor (10 mH) to isolate the low-voltage DC supply from the high-voltage pulse. Due to MOSFET limitations, the maximum available current for testing was 200 A.
Using the current and voltage measurements on a single turn excited by a high voltage pulse from the pulse generator described previously, the average H-field and B-field throughout the core can be calculated using Equations (3)–(5).
Where is the number of primary turns, is the effective cross-sectional area of the core, is the effective path length of the core, is the core outer diameter, and is the inner diameter of the core. For = 1, = 200 A, and an effective magnetic path length of 0.218 m, resulting in a maximum H-field of approximately 900 A/m, using Equations (3) and (5).
Differentiating Equation (4), with the assumption of square pulse excitation, yields the magnetization rate expressed by Equation (6). The magnetization rate is an influential quantity that has been found to directly impact the behavior of the magnetic core [10,12,20,21].
All cores were tested using a single primary turn for consistency with the one-turn topology of LTD, see Figure 4. The cores reach saturation at different times despite resetting with the same 4 A current. This difference highlights the impact of the annealing process on magnetic properties, specifically the DC permeability.
The saturation times for each core align with their initial DC reset points, with the 3W-L core saturating first due to its lower total flux utilization, followed by the 3W-M and 3W-H cores. Upon reaching saturation, all of the cores exhibit a steep voltage drop, signaling the collapse of the effective inductance.
The behavior of each core under these conditions is illustrated in Figure 5a. One feature of the B-H curve that must be considered under pulsed conditions is the initial push-out in H that is a result of the finite diffusion time, which limits the ability of the magnetic field to engage the magnetic material [22]. From Figure 5a it is evident that each core has a significant push out with the 3W-L, 3W-M, and 3W-H materials having an initial push out of ∼ 80 A/m.
Experimentally measured B-H curves of the MK cores with a continuous DC reset current of 4 A . (a) Comparison of MK cores with 2 kV charge voltage. The 3W-H achieves the highest flux at 2.25 T, while the 3W-L only reaches 1.85 T. Initial push-out in H for all cores is ∼ 80 A/m. (b) 3W-H magnetic core B-H curve widening with increasing pulse voltage.
The energy loss of these magnetic materials must also be evaluated to determine the optimal core for the LTD. The energy loss for a magnetic material may be found by taking the area within the B-H curve, an expression for the energy loss of a magnetic core is given by Equation (7).
As seen in Figure 5b, the B-H curve of the magnetic material widens with increasing pulse voltage or magnetization rate; thus, the area within the curve increases, producing higher losses.
To be consistent with the magnetic core’s use case in an LTD where saturation should be avoided, the energy loss comparison was taken at 80 % of the total flux swing, . As a figure of merit, the loss is normalized by the square of the total flux swing, yielding the loss factor in units of . The energy loss factor is given by Equation (8) [23], where a lower loss factor reflects superior core performance.
At the upper end of the magnetization rates of interest, the 3W-L material has the lowest energy losses, followed by the 3W-H, with 3W-M being the most lossy, see Figure 6a. However, considering the loss factor, the 3W-M outperforms the other two cores, see Figure 6b.
This work examines the distinction between continuous reset and active (pulsed) core reset strategies, see Figure 7, with particular attention to the reset time required between repetition-rated pulses. At higher pulse voltages or with extended pulse durations, each pulse induces a substantial flux swing in the core, which must be reset prior to the subsequent pulse. This is not an issue for bipolar LTDs where there is an equal but opposite polarity pulse to reset the core [16]. However, with space or cost limitations in mind, a single-polarity pulse with an active reset mechanism is a viable method to achieve repetition-rated operation. The stage-to-stage isolated pulsed reset allows for independent operation of each LTD stage, which is essential for waveform shaping. In contrast, the simplest DC reset technique utilizing a single choke inductor shared across all cores restricts independent stage-level control.
First, the continuous reset was evaluated at 4 A for each core; see Figure 8a. Even at this reset level, none of the cores could utilize their full available flux swing of 2.36 T. The 3W-H core came closest, reaching 2.2 T after approximately 200 s. Initially, the 3W-L core exhibited the highest recovery flux at 40 s, but the other cores surpassed it by 100 s. All cores reached their total available flux after 200 s, corresponding to a 5 kHz repetition rate. However, suppose the core is not fully saturated and operates within 1 T flux swing. In that case, the maximum repetition rate would increase to approximately 20 kHz, demonstrating the trade-off between flux utilization and achievable pulse repetition rate.
After continuous reset testing, active reset was evaluated in the following manner: an initial reset pulse applied to the core, followed by a high-voltage pulse to drive the core into saturation. This sequence was repeated with a second reset and high-voltage pulse to again saturate the core, as illustrated in Figure 7. The reset board was charged to 20 V with current limited to 4 A. The second high-voltage pulse was measured with varying reset times, and total flux swing calculated to quantify the extent of core reset achieved during the reset pulse.
The time delay between the reset pulse and the high-voltage pulse is set to 10 , ensuring the reset board turns off completely before the high-voltage pulse is applied. Similarly, a 5 delay is introduced between the high-voltage pulse and the next reset pulse. These delays add 15 to the inter-pulse spacing. The reset time is varied from 25 to 500 , where increasing this time no longer provides additional flux swing. The maximum flux achieved during the second high-voltage pulse is plotted against inter-pulse spacing in Figure 8b.
The pulsed reset underperformed in all cases compared to the continuous reset, primarily due to the additional time delay between the reset and high-voltage pulse. This extra delay allows for natural flux relaxation towards , reducing the maximum achievable flux. The effect is most pronounced in the 3W-L core, as its lower remanent flux makes it more susceptible to natural reset effect.
In both reset methods, the 3W-H core exhibits the highest available flux at a reset of 4 A, reaching approximately 2.2 T in both cases. The continuous reset method achieves a slightly higher maximum usable flux than the pulsed reset, and it also reaches complete core reset twice as fast. This demonstrates that while both methods can achieve similar total flux swings, the continuous (DC) reset is generally faster when using similar reset voltage and currents. As a result, DC reset is the preferred approach for high-repetition-rate LTD applications, where space limitations do not discourage the use of large choke inductors. Alternatively, the reset voltage amplitude could be increased. One estimates that roughly a doubling of the amplitude will reset the core in a similar time as the 4 A DC case.
Based on the evaluations described previously, the 3W-H core emerges as the best choice for the LTD, as it provides the largest total flux swing, the lowest energy loss factor at the higher magnetization rates of interest, and similar reset times compared to the other cores with the continuous and pulsed reset techniques. The 3W-M material performed very similar to the 3W-H throughout this evaluation and would also perform well as a LTD magnetic core. Although the 3W-L core underperformed relative to the other two cores during evaluation, its low ratio enables a flux swing of ∼ 1.2 T per pulse without requiring reset circuitry - an advantage in applications where implementing core reset is impractical.
3.2. Single Stage Testing
Following individual characterization, the cores were integrated into the LTD system to evaluate their influence on overall performance, including rise-time, output pulse shape, and system efficiency under practical operating conditions. A statistical comparison based on 100 shots with a 50 load was used to assess each core’s average voltage amplitude during the pulse flat-top and its rise-time, revealing negligible differences. Representative waveforms at 2.4 kV for each core, shown in Figure 9, illustrate nearly identical profiles. The only notable distinction is that the 3W-L core saturates earlier due to its lower available flux swing for a given reset current.
To assess the LTD’s rise-time sensitivity to switching speed, the MOSFET gate voltage was varied - a straightforward method for influencing switching behavior. While advanced gate-boosting techniques exist to mitigate parasitic inductance and capacitance effects [2,24,25,26,27], this study focused on direct gate voltage adjustment. Results show a clear reduction in rise-time with increased gate voltage: from 34.4 ns at 10 V to 7.9 ns at 25 V, see Table 3. Voltages below 10 V were insufficient for full MOSFET activation. At higher speeds, parasitic elements introduced ringing lasting for ∼ 30 ns before the output voltage amplitude settled.
With the switching characteristics established, attention was then directed toward the transmission line section of the LTD, specifically the influence of insulation material and geometry. Variations in dielectric type, stalk height, and diameter were examined to assess their impact on impedance matching and pulse fidelity. Initially, a 6 mm (1/4 in.) diameter stalk operating in air yielded a characteristic impedance of approximately 75 (Equation (2)). Replacing air with PTFE (, ) reduced the impedance to 51 . Although this change had no measurable effect on rise-time, it resulted in a modest increase in average voltage amplitude—from 2305 V to 2320 V — across all core types. This improvement is attributed to better impedance matching with the 50 load, enhancing power transfer and reducing reflection losses.
To further explore geometric influences, the height of the single-stage LTD structure was also evaluated. While the 26 mm core height sets a lower bound, the initial system height of 50.8 mm (2 in.), chosen somewhat arbitrarily during early development, was reduced to 31.75 mm (1.25 in.). This reduction led to a measurable improvement in rise-time, though it had minimal effect on average voltage amplitude. The combined effects of these and previously discussed parameter changes are illustrated in Figure 10.
The results show that when the single stage LTD is shorter and the MOSFET gate is driven with the maximum rated voltage, the rise-time decreases. Additionally, impedance matching improves the average flat-top voltage over the non-impedance matched case. Furthermore, shot-to-shot variations are reduced, improving the consistency of the LTD output.
A complete statistical analysis is provided in Table 4, presenting the 200-shot averages for flat-top voltage, current, rise-time, and jitter. At a 500 V charging voltage, the rise-time is approximately 4.5 ns, and as the voltage increases to the maximum of 2.4 kV, the rise-time increases to 7.9 ns. Jitter is kept relatively constant regardless of voltage. A sweep of input voltages and pulse widths was conducted under these optimized conditions, with the results presented in Figure 11.
3.3. 10-Stage Results
With single-stage performance fully characterized, the study progressed to evaluating the complete 10-stage LTD system. When stacked, the total system capacitance decreases since the LTD charges in parallel but effectively discharge in series, leading to an effective capacitance of . For the 10-stage setup, this results in a capacitance of one-tenth that of a single stage.
The pulsed reset boards were attached with a single turn winding around core of each stage, as shown in Figure 12. To evaluate the voltage output of the full 10-stage LTD, testing was conducted by sweeping the charging voltage from 500 V to up to 2.4 kV in 500 V increments. The fully assembled LTD has a total height of 35.5 cm and a width of 40.5 cm, including the attached pulsed reset boards.
Based on the results of the magnetic core evaluation and single-stage LTD testing, the following parameters were chosen for the best performance: the 3W-H core was used for its higher flux availability compared to the other cores, PTFE dielectric was used as a center stalk insulation material which aided in impedance matching, a shorter overall height was selected to increase rise-time, and a gate drive voltage of 25 V was used to minimize rise-time.
The results for the 10-stage LTD operating with a 12.7 mm (1/2 in.) diameter stalk and PTFE dielectric (, ) with a 50 load are presented in Figure 13a. A voltage overshoot is observed on the leading edge of the pulse, which quickly settles into a stable flat-top. At 24 kV, the FWHM pulse width is 56 ns, and the rise-time is 10 ns. The peak instantaneous power reaches 13 MW, while the average flat-top power over the duration of the pulse is 11.3 MW. The SSLTD developed in this work performs quite well in comparison with others reported in literature, see Table 1. The 24 kV output voltage achieved is slightly lower than the 29 kV reported in [4]; however, the SSLTD presented here delivers over twice the current and has a significantly faster switching speed. It is also capable of driving a lower load impedance of 25 , and demonstrates the fastest dV/dt switching rate of 2.4 kV/ns, outperforming the rest of the devices outlined in Table 1, with the next best at 1.42 kV/ns [5]. The maximum pulse width at the maximum output voltage of 24 kV is just over 500 ns, limited by saturation of the cores. The minimum pulse width is approximately 50 ns, constrained by the cumulative propagation delays of the gate drivers in the trigger signal path. A summary of the statistical averages for the system is provided in Table 5.
The impact of transmission line impedance on voltage waveform shape and rise-time was examined for three different stalk characteristic impedances: 6 , 23 , and 51 , as shown in Figure 13b,c. In Figure 13b, a sweep of load resistances with reveals that the 100 load produces a noticeable voltage overshoot at the front of the pulse, while the 25 load does not. This overshoot is likely caused by the impedance mismatch between the characteristic impedance of the center stalk, , and the load. The similarities in voltage waveforms for the , and , configurations shown in Figure 13b,c, both with approximately support this claim.
Having characterized the influence of transmission line parameters on pulse behavior, the next focus was on evaluating the full 10-stage LTD system under repetition-rated operation. Using a 6 mm stock diameter and PTFE dielectric (), this test aimed to determine the maximum achievable repetition rate while maintaining a significant flux swing in the magnetic cores for each pulse.
Due to limitations in the LTD’s charging capabilities, specifically the limited current capacity of the power supply, the repetition-rate evaluation was conducted in bursts of 10 shots into a 10 load. The active (pulsed) reset scheme used for this evaluation was the same as outlined in Section 3.1. The large load resistance of 10 minimizes voltage droop on the energy storage capacitors, with losses dominated by the magnetic cores (∼180 mJ per pulse), while approximately 20 mJ per pulse is dissipated in the load resistor. A short burst of pulses opposed to continuous repetition-rated operation also eliminates the thermal concerns that arise with the relatively high average power output. A simple method to overcome the charging limitations and achieve a longer burst sequence is to add a large buffer capacitor on the high-voltage power rail. This capacitor allows the discharge capacitors to recharge between subsequent pulses, extending the burst operation.
The LTD was charged to 1.2 kV, with each pulse having a pulse width of 1 , correlating to a flux swing of approximately 1.8 T. Based on previous results outlined in Section 3.1, the minimum inter-pulse spacing that should be expected would be around 300 , correlating to a pulse repetition frequency of 3.3 kHz. Figure 14 shows an example voltage waveform from a 10 shot burst with a charge voltage of 1.2 kV and an inter-pulse spacing of 1 ms.
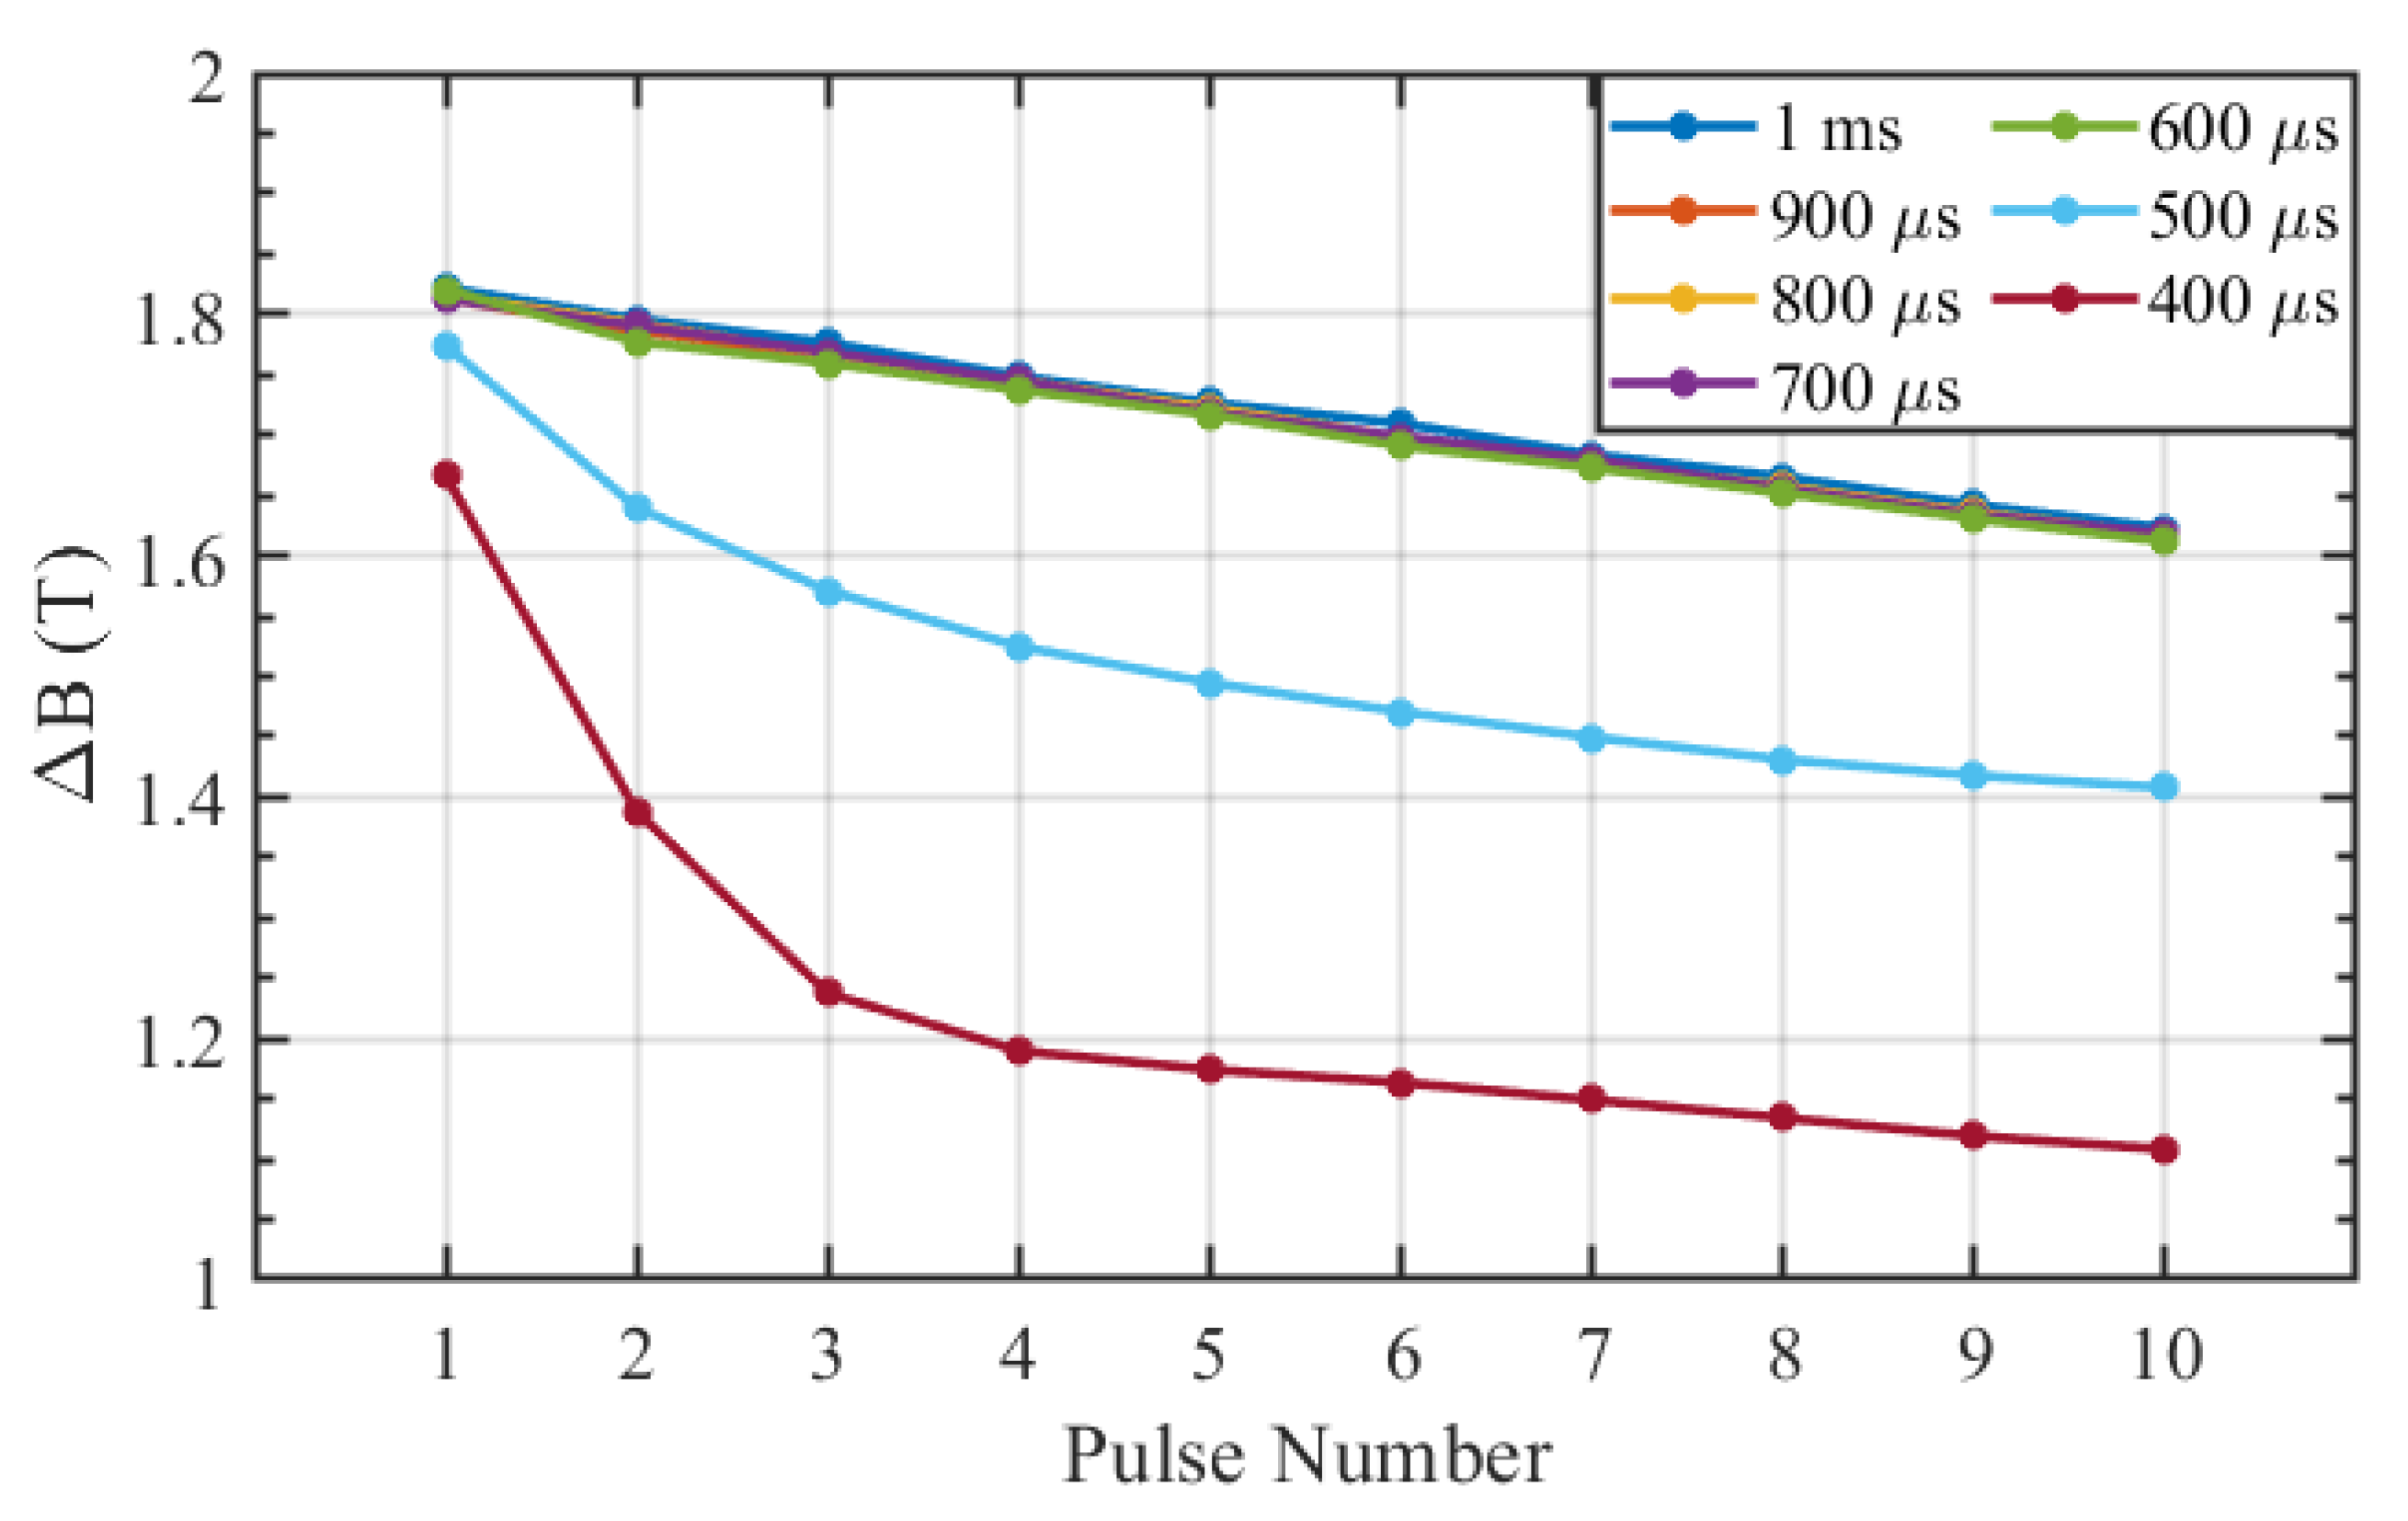
The observed pulse to pulse droop is due to the limited capacitor charging speed and could be overcome or minimized with a more aggressive charging scheme. As discussed previously, the voltage decay on each pulse is due to the losses in the magnetic core and the inability to recharge the energy storage capacitors to the target voltage between pulses. Figure 15 depicts the flux swing of each core of the LTD across the 10 shots in the burst across a range of inter-pulse spacings. The top grouping consisting of the 1 ms - 600 inter-pulse spacings experience some reduction in flux swing as the pulse number increases, associated with the energy loss in the cores. The reduction in flux swing observed in the 500 and 400 inter-pulse spacing tests was significantly more rapid in the initial pulses, indicating saturation of the magnetic cores.
These results demonstrate that, under the previously defined operating conditions, the minimum inter-pulse spacing is between 500 and 600 , corresponding to a maximum operating frequency of just under 2 kHz.
4. Discussion
This work presents the development of a 10-stage LTD and examines how key design parameters influence system performance. The design features a higher per-stage charging voltage of 2.4 kV - more than double the ∼1 kV typically reported in SSLTDs - enabling higher output voltages with fewer stages. Combined with a 1 kA current capacity, this configuration achieves a 24 kV output and ∼10 ns rise-time, placing it at the upper end of SSLTD performance.
Among the nanocrystalline cores tested, the 3W-H material - annealed with a longitudinal field -exhibited the lowest energy loss under high-voltage pulsed conditions. However, single-stage testing showed minimal differences in rise-time and voltage amplitude across all three core material types. These tests also highlighted the importance of maximizing gate voltage, minimizing stage height, and matching transmission line impedance to the load for optimal performance.
In the 10-stage system, impedance matching was shown to improve pulse shape by reducing voltage overshoot. Repetition-rated testing demonstrated that the system can operate just under 2 kHz while maintaining a flux swing of ∼1.8 T per pulse. This confirms that, although continuous reset may support higher frequencies, pulsed reset remains viable for repetition-rated operation.
Author Contributions
Conceptualization, D.W., K.K, and A.N.; methodology, K.K. and D.W.; formal analysis, D.W.; investigation, D.W., K.K., K.S., J.S., J.D., J.M., and A.N.; data curation, D.W. and K.K.; writing—original draft preparation, K.K. and D.W.; writing—review and editing, K.K., and A.N.; funding acquisition, Z.S. and A.N. All authors have read and agreed to the published version of the manuscript.
Funding
This work was done under the auspices of Mission Support and Test Services, LLC, under Contract No. DE-NA0003624 with the U.S. Department of Energy and the National Nuclear Security Administration’s Office of Defense Programs, and supported by the Site-Directed Research and Development Program. DOE/NV/03624- -2234.
Data Availability Statement
The data collected in this work will not be made available.
Conflicts of Interest
The authors declare no conflicts of interest.
Abbreviations
The following abbreviations are used in this manuscript:
| LTD | Linear Transformer Driver |
| SSLTD | Solid-State Linear Transformer Driver |
| SiC | Silicon Carbide |
| PTFE | Polytetrafluoroethylene |
References
- Spielman, R. Pulsed-Power Innovations for Next-Generation, High-Current Drivers. IEEE Transactions on Plasma Science 2022, 50, 2621–2627.
- Azizi, M.; van Oorschot, J.; Huiskamp, T. Ultrafast Switching of SiC MOSFETs for High-Voltage Pulsed-Power Circuits. IEEE Transactions on Plasma Science 2020, 48, 4262–4271.
- Stygar, W.A.; Cuneo, M.E.; Headley, D.I.; Ives, H.C.; Leeper, R.J.; Mazarakis, M.G.; Olson, C.L.; Porter, J.L.; Wagoner, T.C.; Woodworth, J.R. Architecture of Petawatt-Class Z-Pinch Accelerators. Physical Review Special Topics – Accelerators and Beams 2007, 10, 030401.
- Jiang, W. Review of Solid-State Linear Transformer Driver Technology. Matter and Radiation Extremes 2018, 3, 159–164.
- Xue, H.; Yuan, Q.; Ding, W.; Meng, Y.; Wan, Z.; Wang, Y. Fast and Flexible Solid-State Linear Transformer Driver for Plasma Discharge Based on Metal Oxide Semiconductor Field Effect Transistor. Review of Scientific Instruments 2024, 95, 054704.
- Rao, J.; Zhu, Y.; Wang, Y.; Jiang, S.; Li, Z. Study on the Basic Characteristics of Solid-State Linear Transformer Drivers. IEEE Transactions on Plasma Science 2020, 48, 3168–3175.
- Risch, R.; Biela, J. Solid-State Marx Generator vs. Linear Transformer Driver: Comparison of Parasitics and Pulse Waveforms for Nanosecond Pulsers. In Proceedings of the 2021 IEEE Pulsed Power Conference (PPC), 2021, pp. 1–12.
- Smith, I.D. Induction voltage adders and the induction accelerator family. Phys. Rev. ST Accel. Beams 2004, 7, 064801.
- et al., R.D.M. A Primer on Pulsed Power and Linear Transformer Drivers for High Energy Density Physics Applications. IEEE Transactions on Plasma Science 2018, 46, 3928–3967.
- Acosta-Lech, D.; Houck, T.L.; McHale, B.; Misch, M.K.; Sugihara, K. Multi-Pulse Performance of Amorphous Metal Magnetic Cores at High Magnetization Rates. 2019 IEEE Pulsed Power & Plasma Science (PPPS) 2019, pp. 1–4. [CrossRef]
- Taccetti, J.M.; McCrady, R.; Rose, C.R. Fast magnetization of amorphous metallic cores. In Proceedings of the 2017 IEEE 21st International Conference on Pulsed Power (PPC), 2017, pp. 1–4. [CrossRef]
- Kim, M.; Clancy, T.; Houck, T.L.; Pogue, N. Pulsed Transformer Magnetic Core Comparison of Different Materials for Pulsed Power Applications. 2023 IEEE Pulsed Power Conference (PPC) 2023, pp. 1–4.
- Koval’chuk, B.M.; Vizir’, V.A.; Kim, A.A.; Kumpyak, E.V.; Loginov, S.V.; Bastrikov, A.N.; Chervyakov, V.V.; Tsoi, N.V.; Monjaux, P.; Kh’yui, D. Fast primary storage device utilizing a linear pulse transformer. Russian Physics Journal 1997, 40, 1142–1153. [CrossRef]
- Mazarakis, M.G.; Fowler, W.E.; Kim, A.A.; Sinebryukhov, V.A.; Rogowski, S.T.; Sharpe, R.A.; McDaniel, D.H.; Olson, C.L.; Porter, J.L.; Struve, K.W.; et al. High current, 0.5-MA, fast, 100-ns, linear transformer driver experiments. Phys. Rev. ST Accel. Beams 2009, 12, 050401. [CrossRef]
- Mazarakis, M.G.; Fowler, W.E.; LeChien, K.L.; Long, F.W.; Matzen, M.K.; McDaniel, D.H.; McKee, R.G.; Olson, C.L.; Porter, J.L.; Rogowski, S.T.; et al. High-Current Linear Transformer Driver Development at Sandia National Laboratories. IEEE Transactions on Plasma Science 2010, 38, 704–713. [CrossRef]
- Sun, G.; Li, L.; Ding, W.; Shen, S. Bipolar Solid-State LTD Based on Push-pull Circuit. In Proceedings of the 2021 International Conference on Electrical, Communication, and Computer Engineering (ICECCE), 2021, pp. 1–5. [CrossRef]
- G2R120MT33J 3300V 120 mΩ SiC MOSFET. https://www.genesicsemi.com/sic-mosfet/G2R120MT33J/G2R120MT33J.pdf, 2021. Rev 21/May, GeneSic Semiconductor.
- G2R1000MT33J 3300V 1000 mΩ SiC MOSFET. https://www.genesicsemi.com/sic-mosfet/G2R1000MT33J/G2R1000MT33J.pdf, 2021. Rev 21/June, GeneSic Semiconductor.
- FT-3W High-Performance Nanocrystalline Foil. https://metglas.com/wp-content/uploads/2016/12/FT-3W-Datasheet-Nov_2015-1.pdf, 2015. Metglas.
- Zhang, C.; Zhang, M.; Li, Y. Measurement and Simulation of Magnetic Properties of Nanocrystalline Alloys under High-Frequency Pulse Excitation. Materials 2023, 16. [CrossRef]
- Howard, A.B.; Curry, R.D.; Burdt, R.A. High- dB / dt Square-Pulse Excitation of Finemet Magnetic Material. IEEE Transactions on Plasma Science 2016, 44, 1914–1918. [CrossRef]
- Wright, D.; Kelp, K.; Klein, T.; Stephens, J.; Dickens, J.; Mankowski, J.; Shaw, Z.C.; Neuber, A. Assessing nanocrystalline pulsed transformer core performance using Maxwell ANSYS. AIP Advances 2025, 15, 065323. _eprint: https://pubs.aip.org/aip/adv/article-pdf/doi/10.1063/5.0267903/20564483/065323_1_5.0267903.pdf. [CrossRef]
- Greenwood, M.; Gowar, J.; Bird, B. A comparability parameter for amorphous magnetic materials. In Proceedings of the 7th Pulsed Power Conference, 1989, pp. 186–189. [CrossRef]
- Hochberg, M.; Sack, M.; Mueller, G. A Test Environment for Power Semiconductor Devices Using a Gate-Boosting Circuit. IEEE Transactions on Plasma Science 2016, 44, 2030–2034.
- Yang, Y.; Wen, Y.; Gao, Y. A Novel Active Gate Driver for Improving Switching Performance of High-Power SiC MOSFET Modules. IEEE Transactions on Power Electronics 2019, 34, 7775–7787.
- Yamaguchi, K.; Katsura, K.; Yamada, T.; Sato, Y. Comprehensive Evaluation of Gate Boost Driver for SiC-MOSFETs. In Proceedings of the Proc. IEEE Energy Conversion Congress and Exposition (ECCE), September 2016, pp. 1–8.
- Collier, L.; Kajiwara, T.; Dickens, J.; Mankowski, J.; Neuber, A. Fast SiC Switching Limits for Pulsed Power Applications. IEEE Transactions on Plasma Science 2019, 47, 5306–5313.
Figure 1.
Simplified LTD structure cross-section showing the main and magnetizing current paths, and transmission line characteristics.
Figure 1.
Simplified LTD structure cross-section showing the main and magnetizing current paths, and transmission line characteristics.
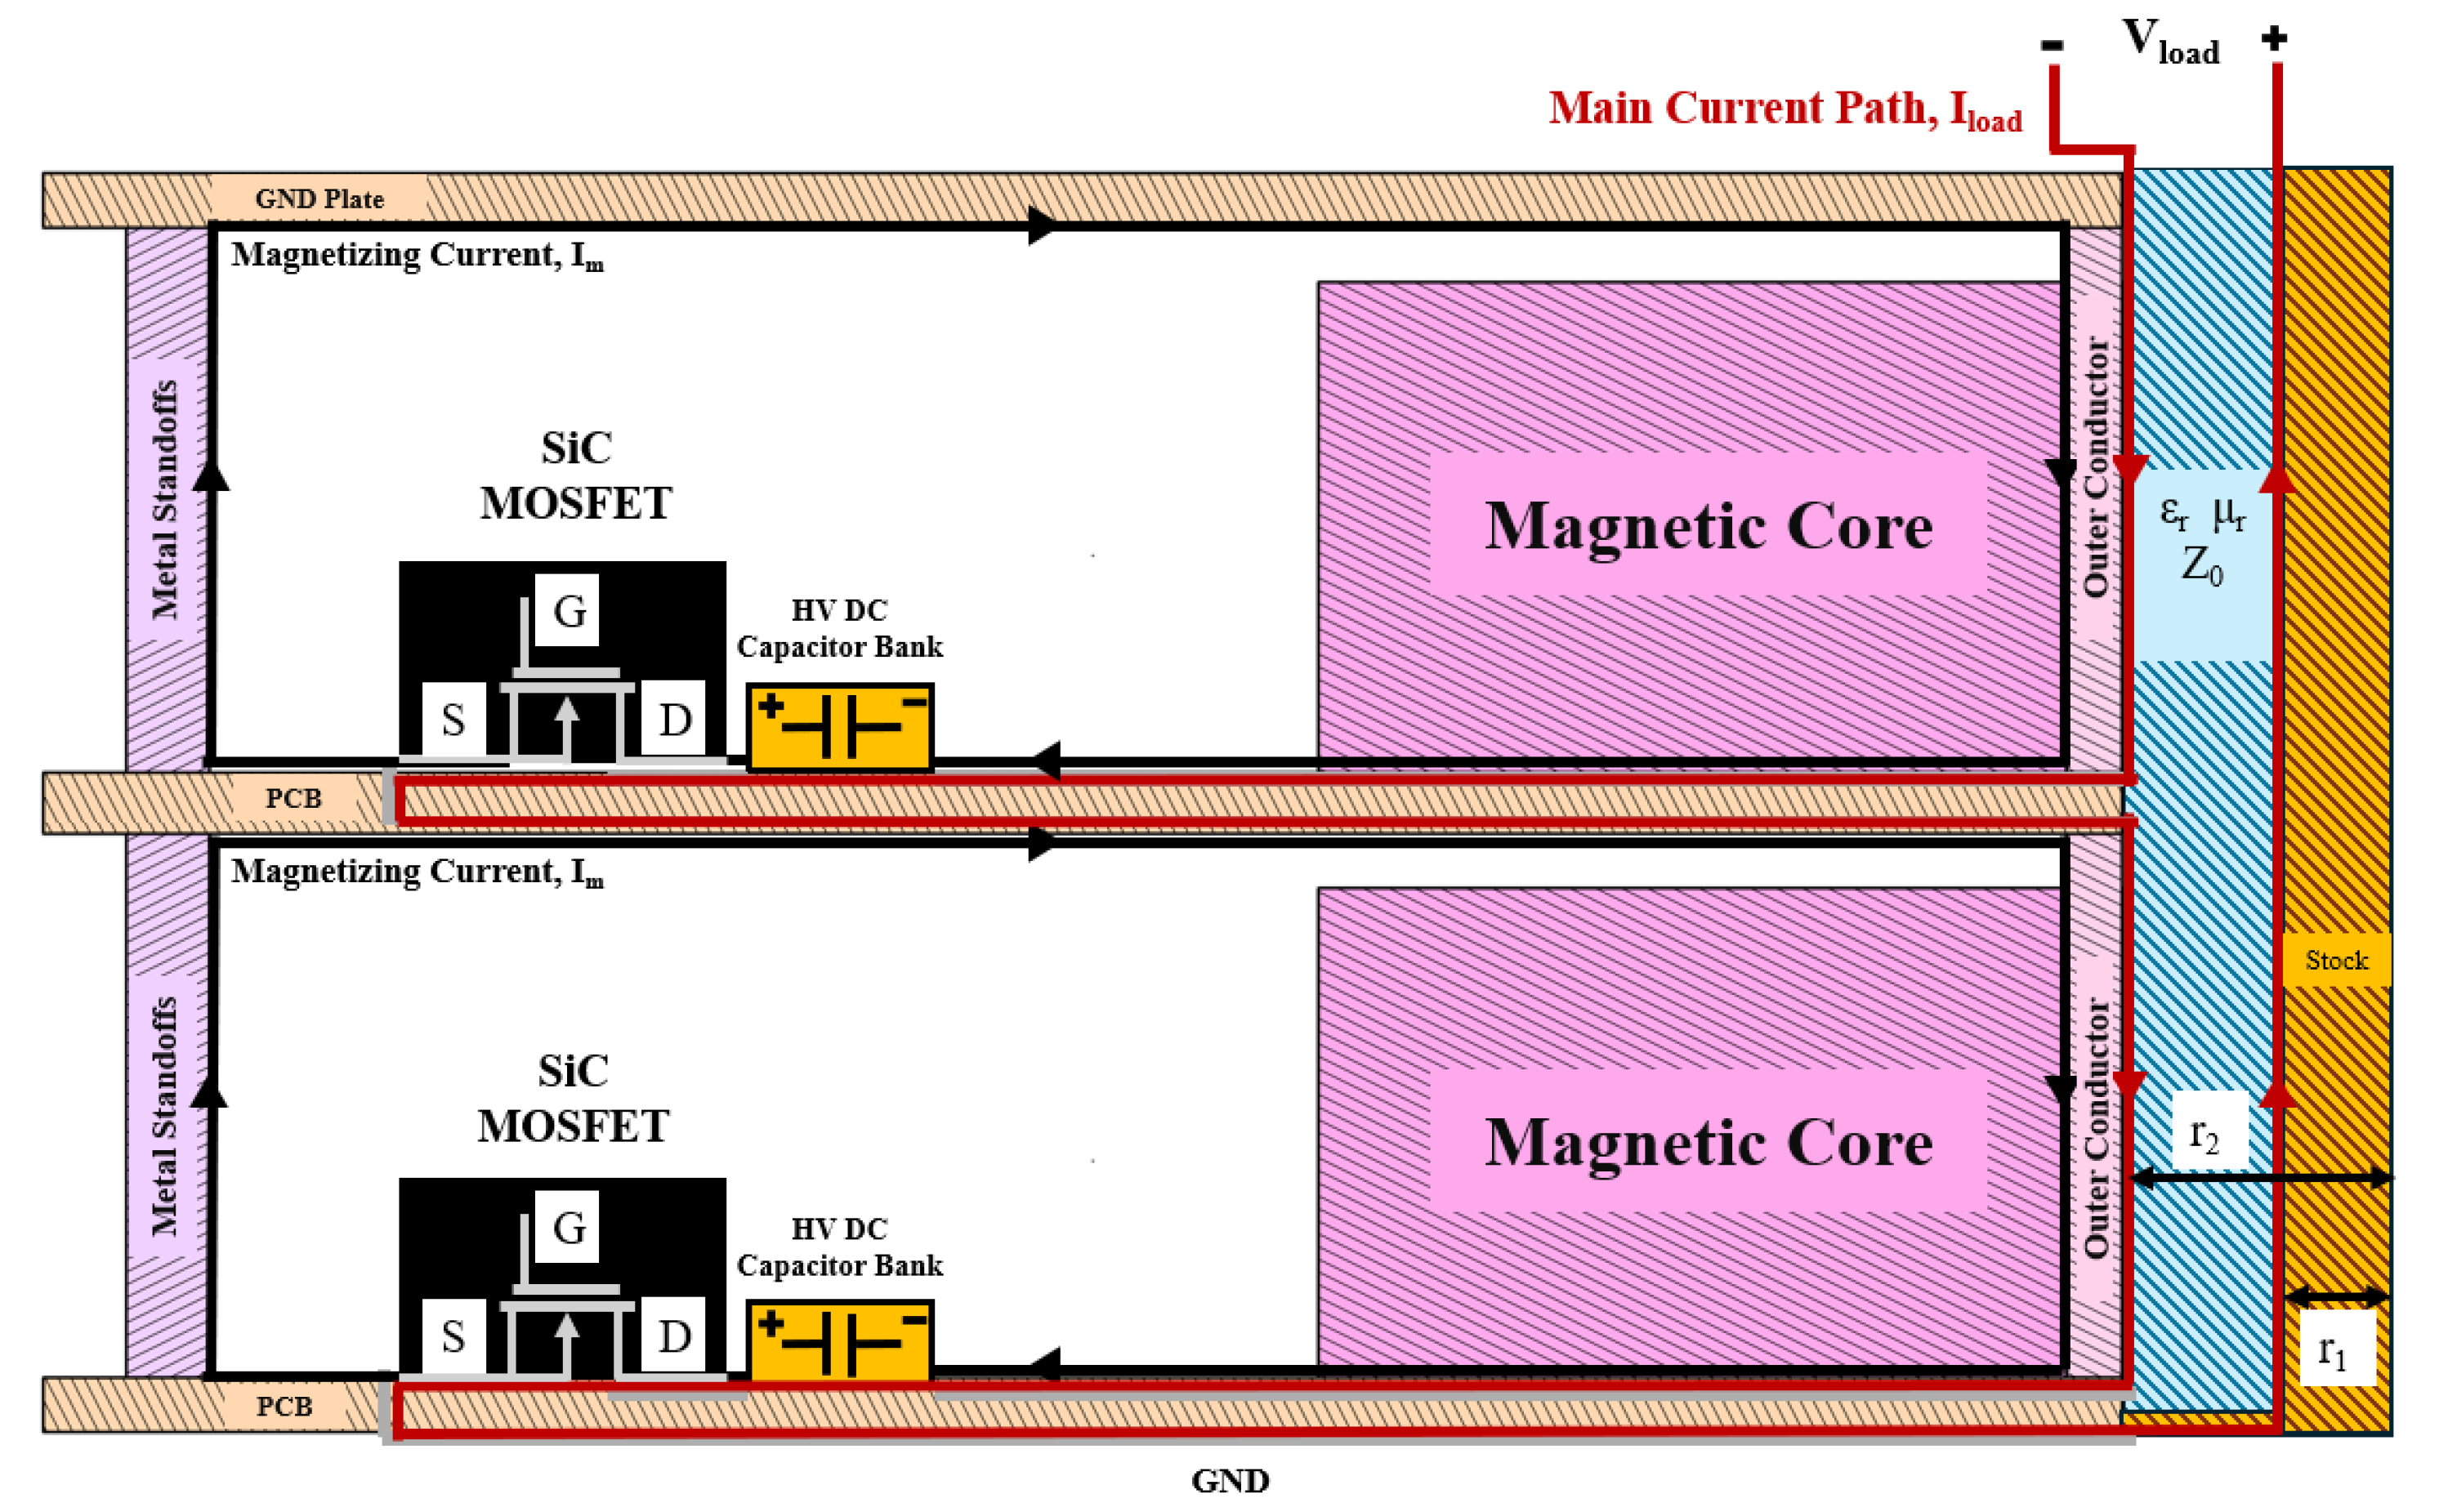
Figure 2.
(a) Physical layout of a single stage of the LTD. (b) Dimensions of the magnetic core used for the LTD. The total board diameter is 300 mm. Trigger path traces are all 143 mm, giving a delay of ∼ one ns. Magnetic core dimensions given as follows, OD = 118.7 mm, ID = 33.7 mm, and height = 28 mm. The total area is 9.53 , with a packing factor of 0.78 resulting in an effective area of 7.43 and an effective length is 218 mm. This core is the FT-3W-H, although all have the same physical dimensions.
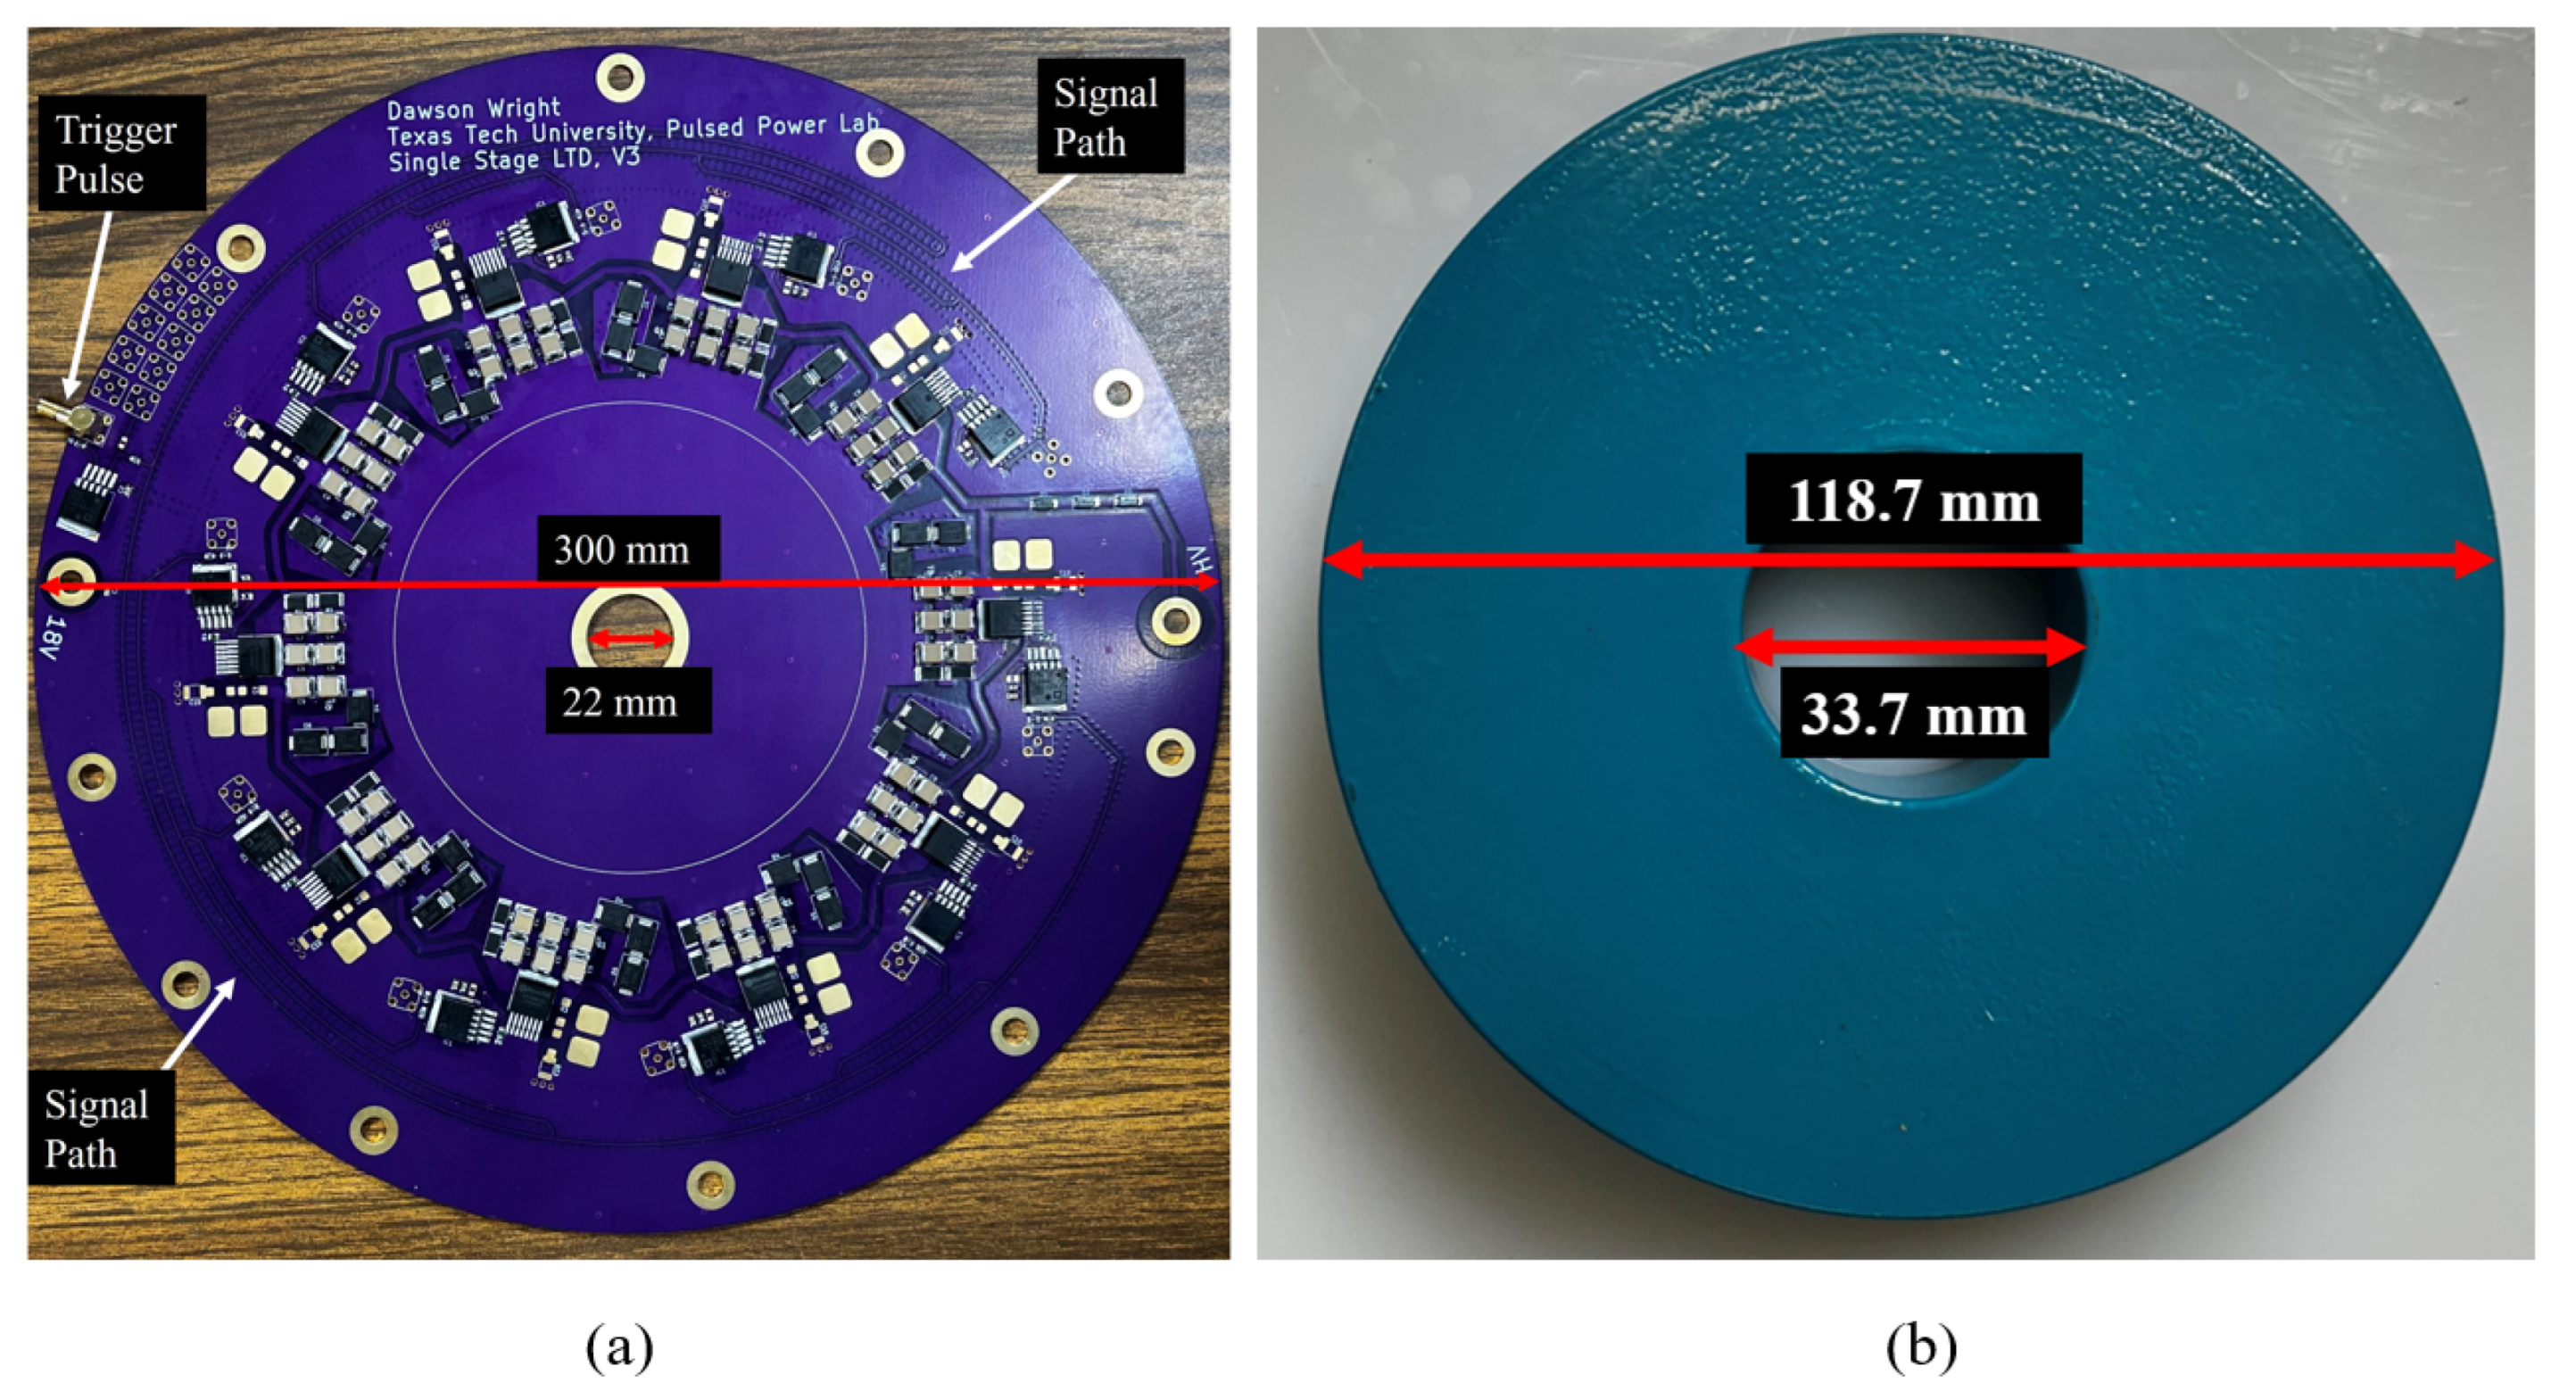
Figure 3.
Pulsed magnetic reset schematic, featuring the charging protection circuit, the discharge capacitor, the current limiting resistor, the MOSFET switch, and the trigger circuitry with and that regulate the switching speed of the MOSFET. The board can provide up to 20 V and 5 A to the core between high-voltage pulses. The MOSFET used on the pulsed reset board is a 3.3 kV rated Genesic G2R1000MT33J [18].

Figure 4.
Primary voltage (solid) and current (dashed) waveforms for the three MK cores with a 4 A reset current. The charging voltage is 2 kV, and the rise-time of the applied voltage pulse is ∼ 20 ns.
Figure 4.
Primary voltage (solid) and current (dashed) waveforms for the three MK cores with a 4 A reset current. The charging voltage is 2 kV, and the rise-time of the applied voltage pulse is ∼ 20 ns.
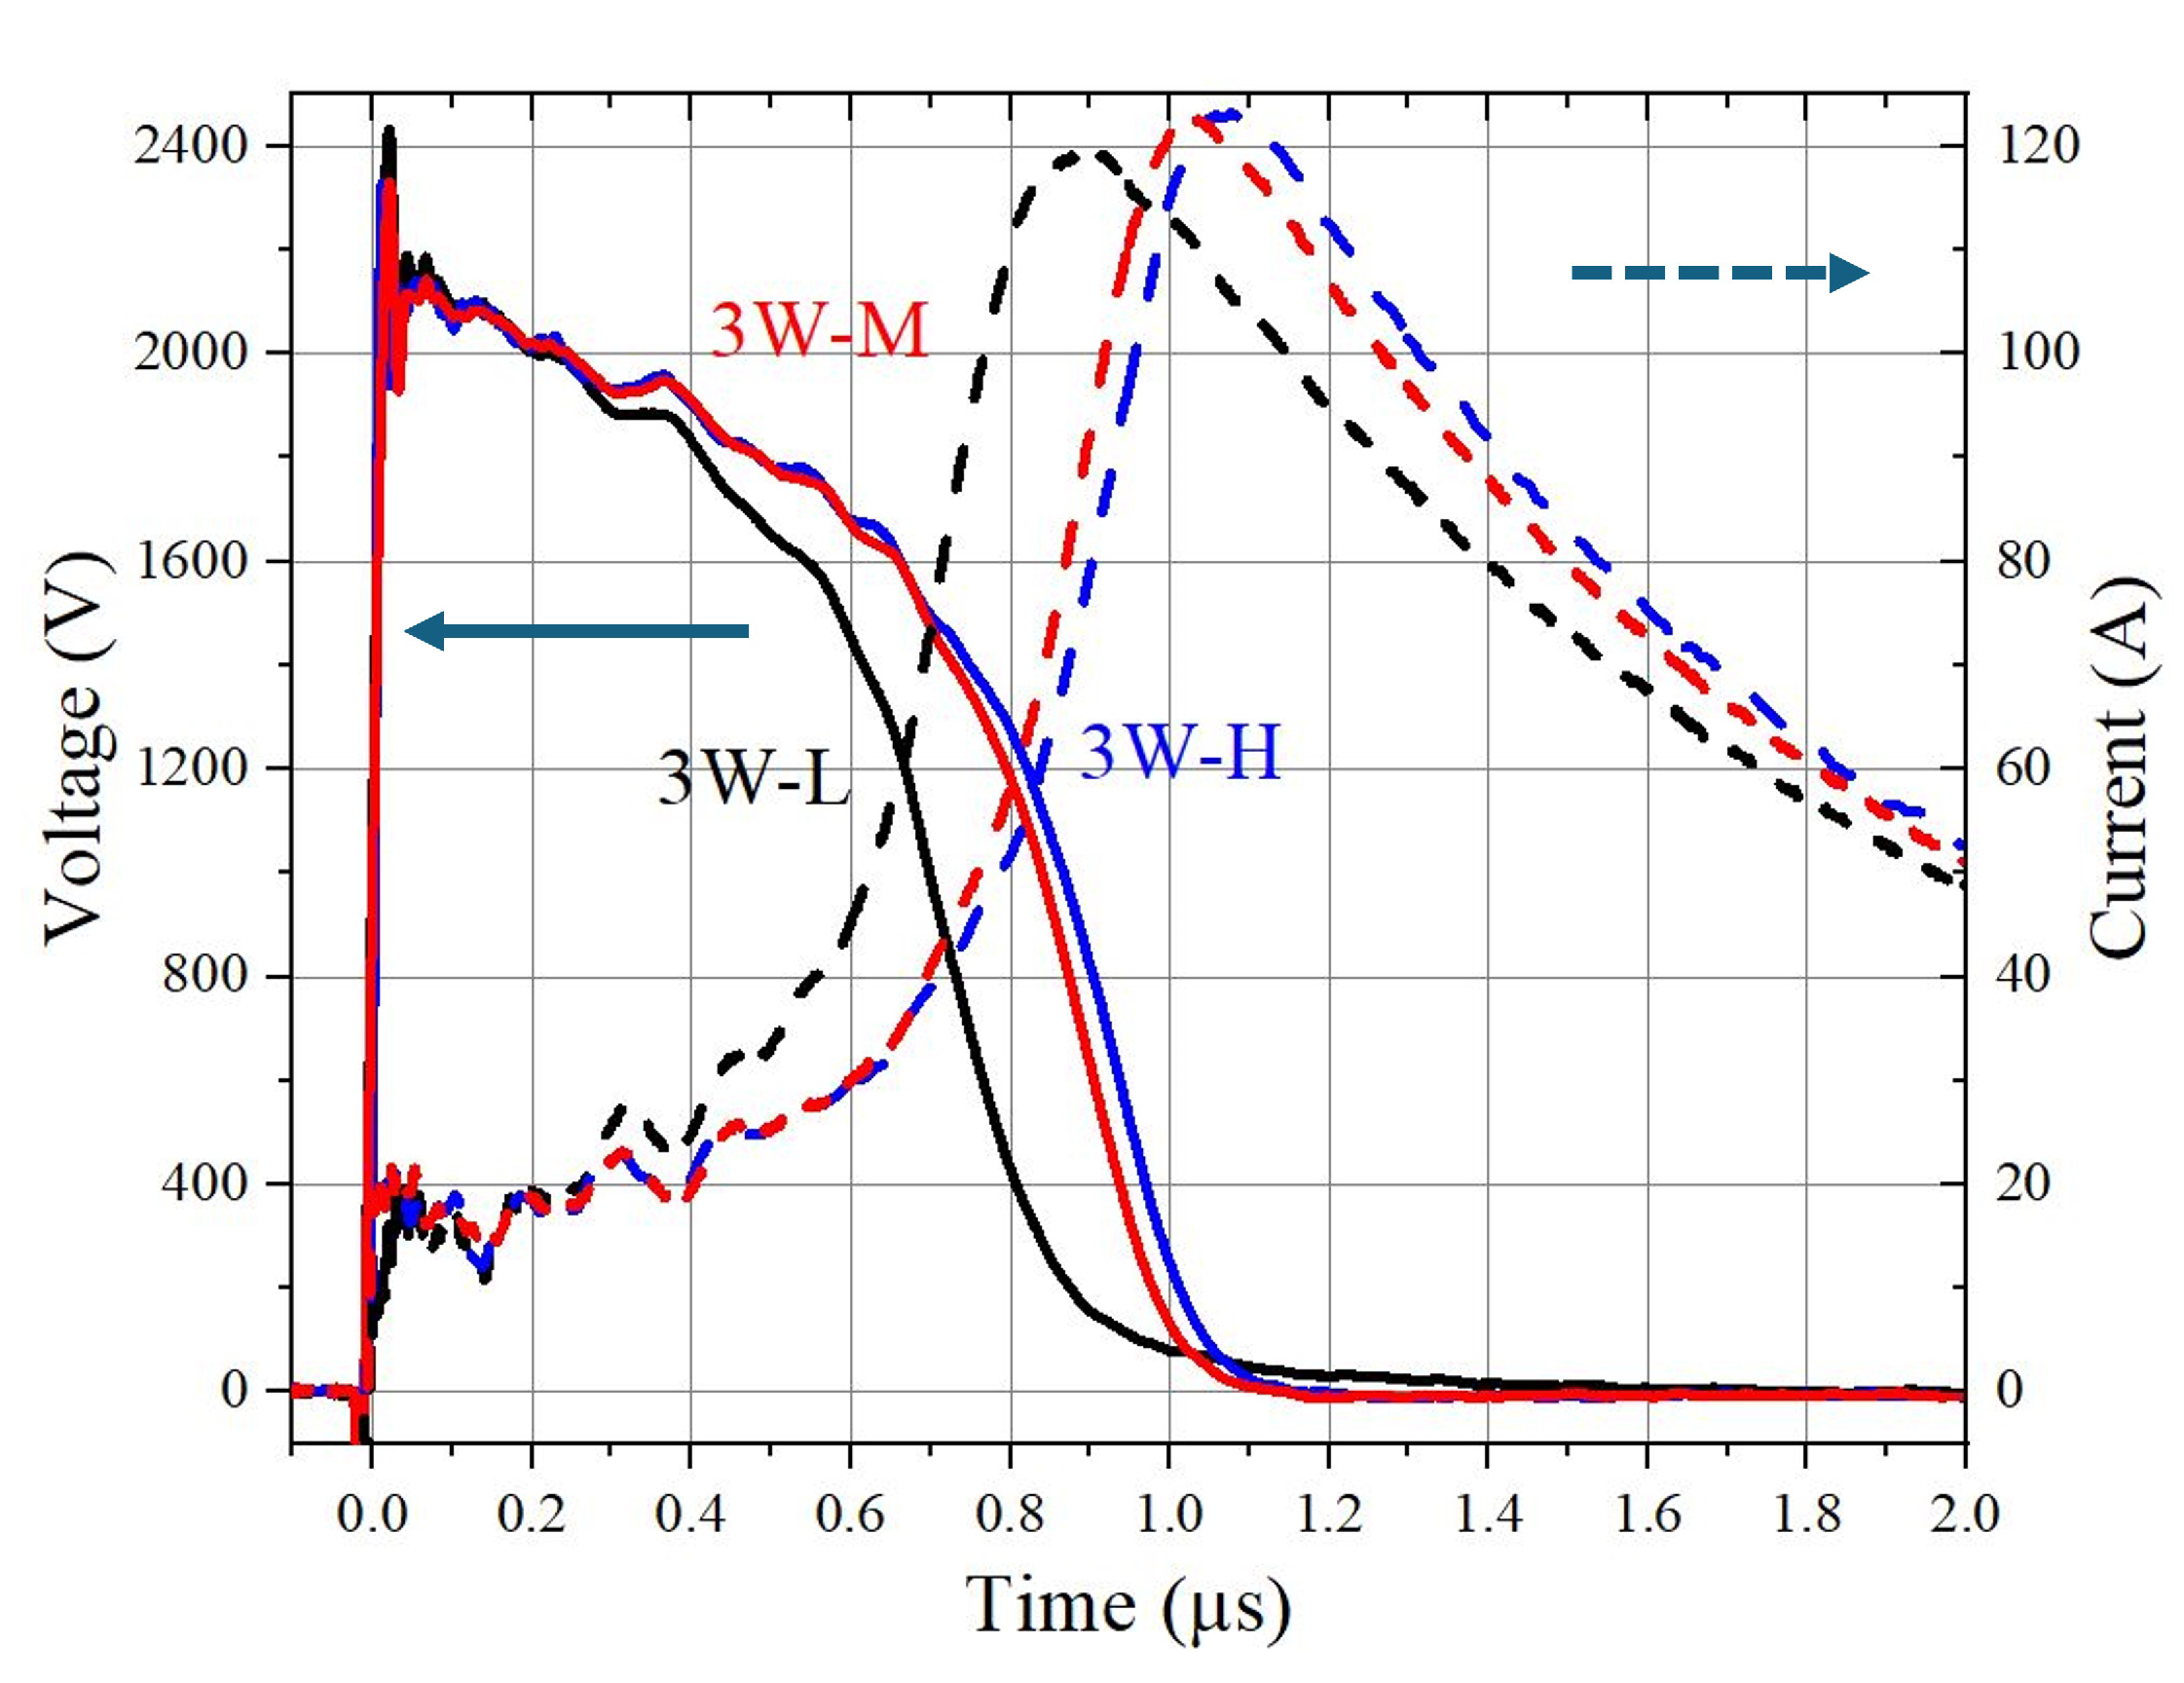
Figure 5.
Experimentally measured B-H curves of the MK cores with a continuous DC reset current of 4 A . (a) Comparison of MK cores with 2 kV charge voltage. The 3W-H achieves the highest flux at 2.25 T, while the 3W-L only reaches 1.85 T. Initial push-out in H for all cores is ∼ 80 A/m. (b) 3W-H magnetic core B-H curve widening with increasing pulse voltage with a continuous DC reset current of 4 A.

Figure 6.
Energy loss evaluation across a range of magnetization rates at 80 % total flux swing. (a) Total energy loss given in . (b) Loss Factor.
Figure 6.
Energy loss evaluation across a range of magnetization rates at 80 % total flux swing. (a) Total energy loss given in . (b) Loss Factor.
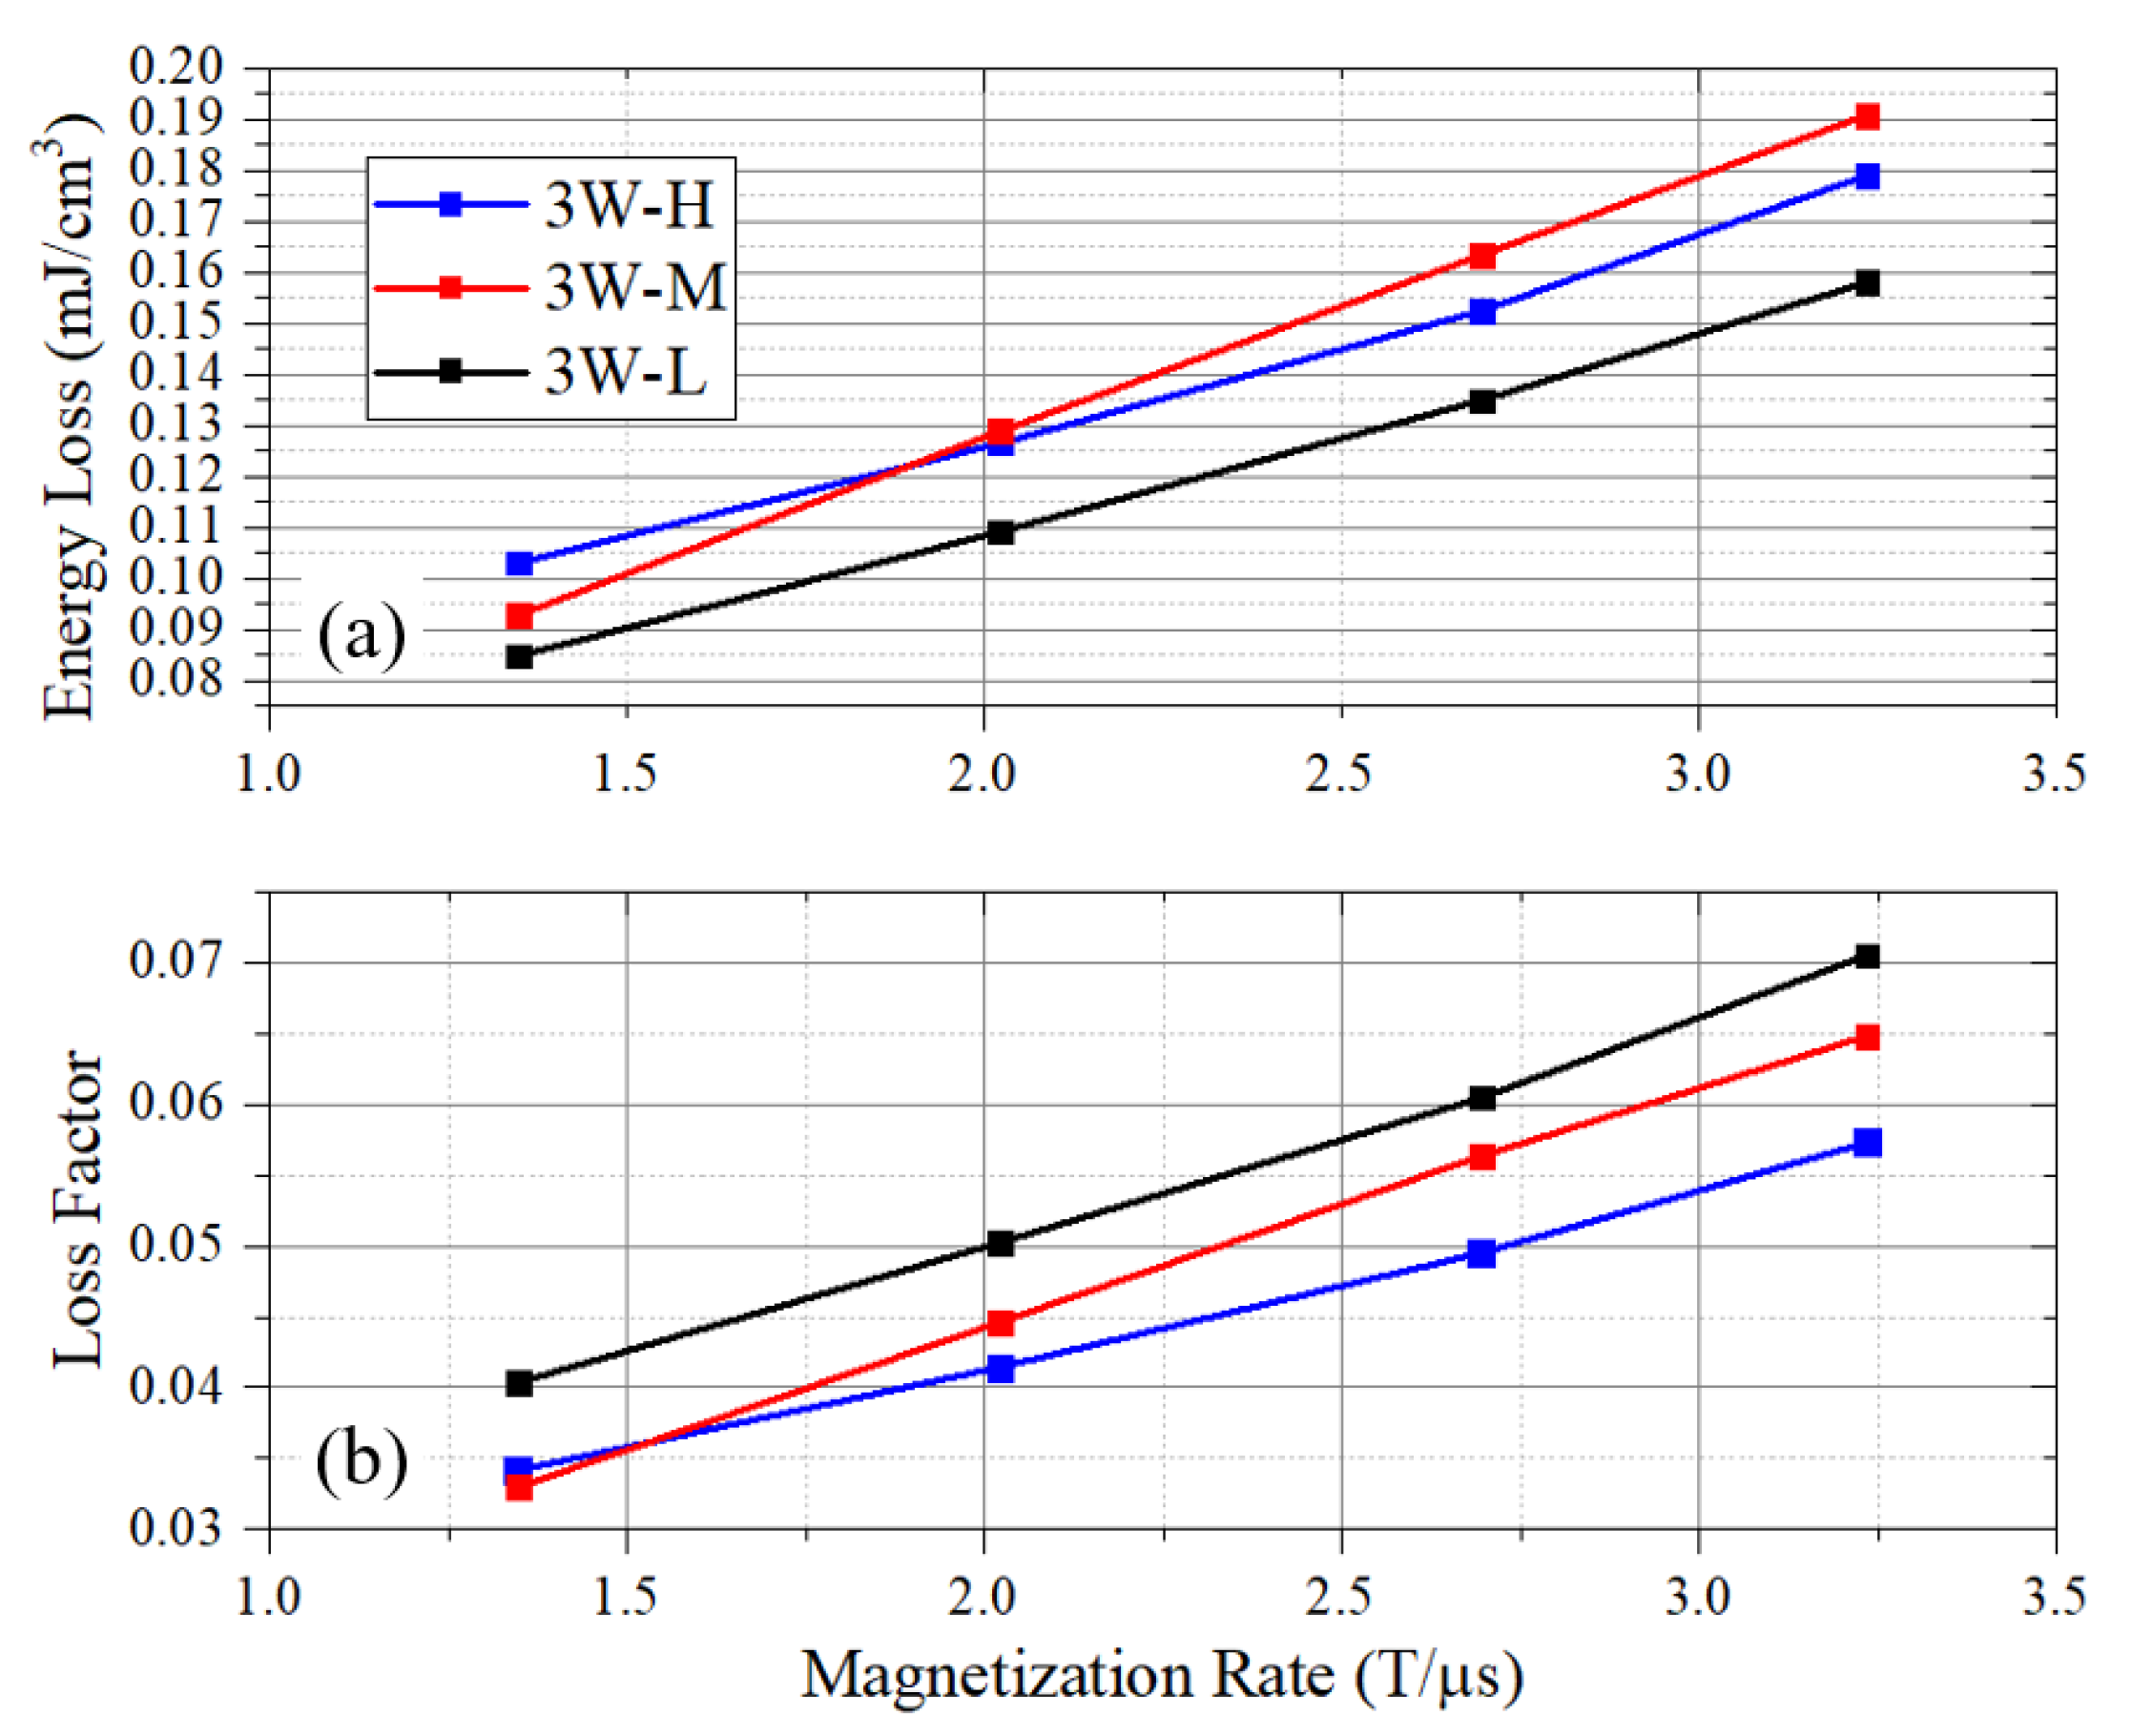
Figure 7.
Visual representation of the timing sequence used in the pulsed reset evaluation, where the reset pulse is opposite polarity of the applied voltage. The inter-pulse spacing is varied, affecting the reset time. Other delay times are held constant throughout.
Figure 7.
Visual representation of the timing sequence used in the pulsed reset evaluation, where the reset pulse is opposite polarity of the applied voltage. The inter-pulse spacing is varied, affecting the reset time. Other delay times are held constant throughout.
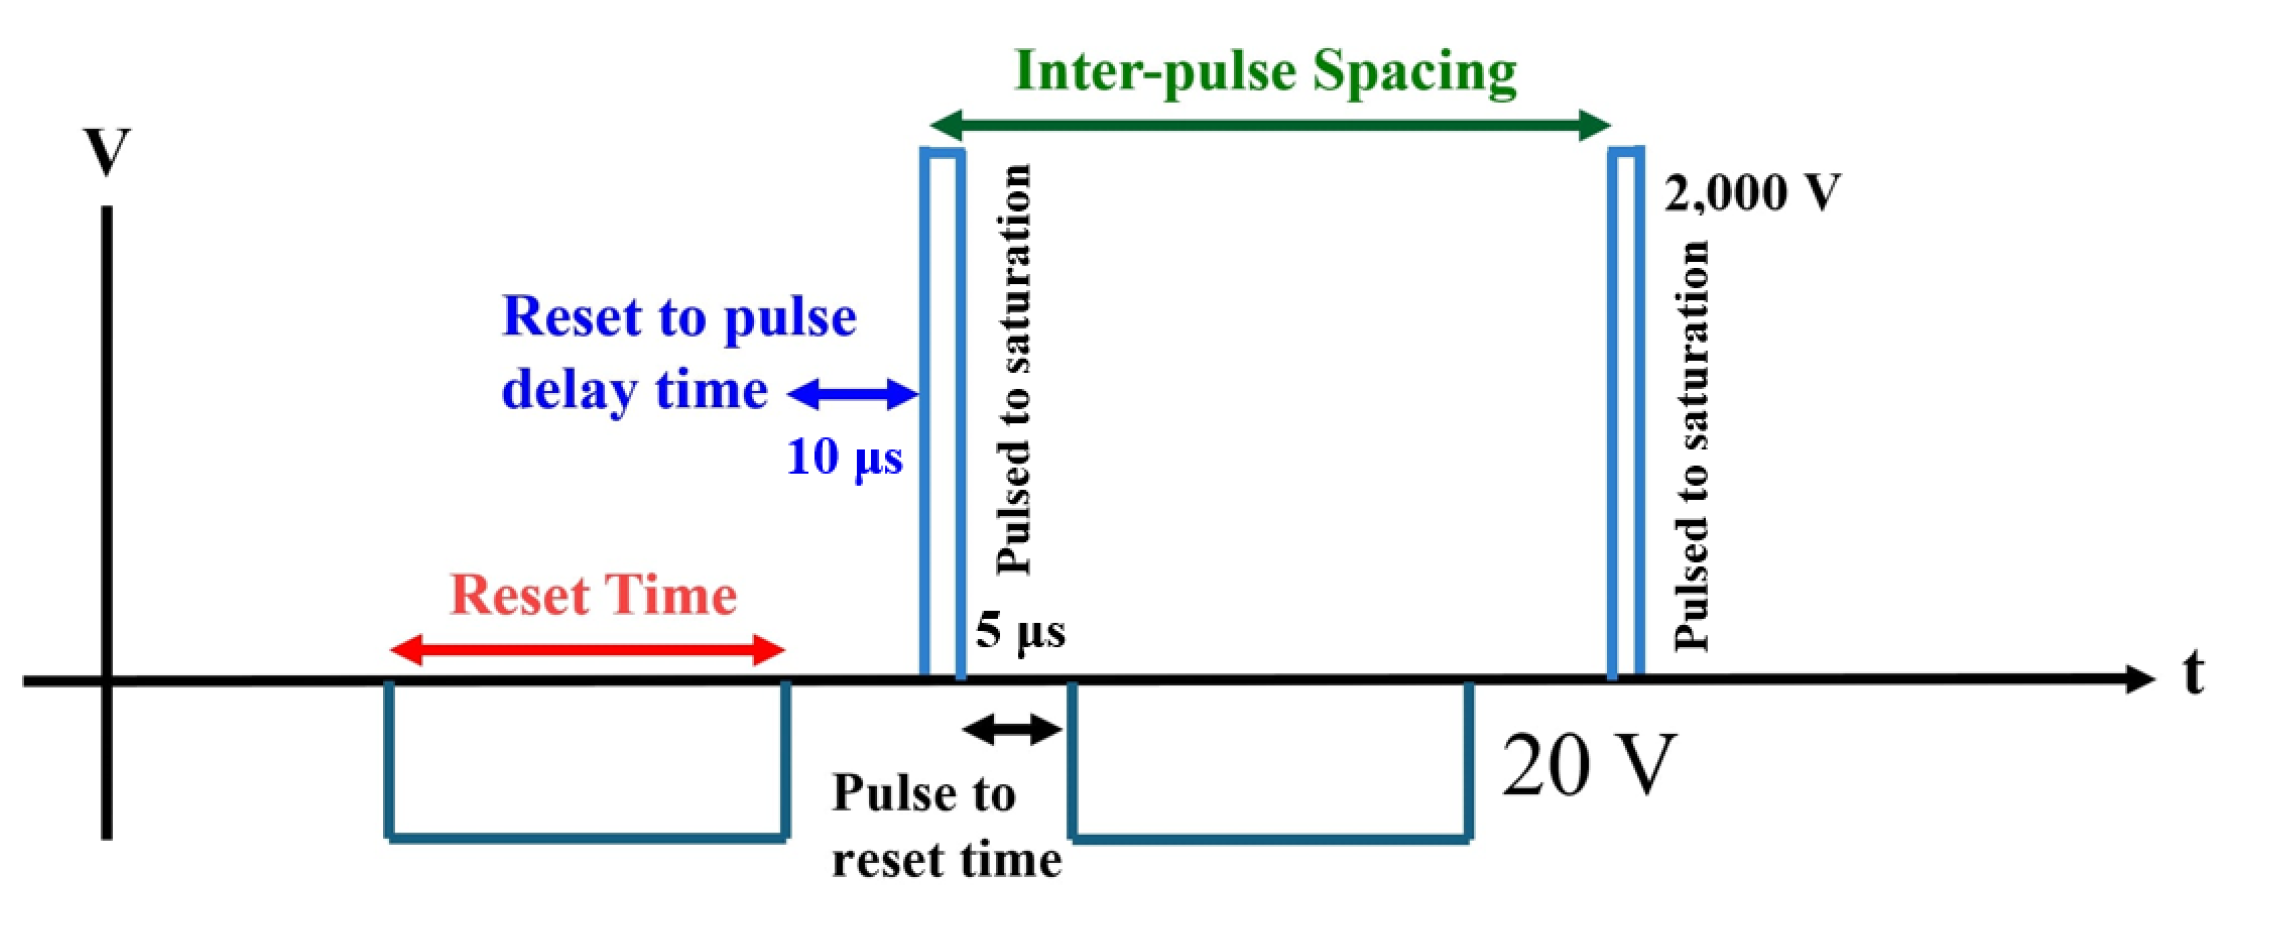
Figure 8.
Magnetic core reset evaluation with flux swing over inter-pulse spa. (a) Continuous core reset at 4 A. Demonstrating that the 3W-H performs the best overall compared to the other cores for an equivalent reset time. (b) Pulsed core reset at 4 A. The 3W-H performs the best overall compared to the other cores for an equivalent reset time unless the inter-pulse spacing is very small, equivalent to a repetition rate of 10 kHz and above.
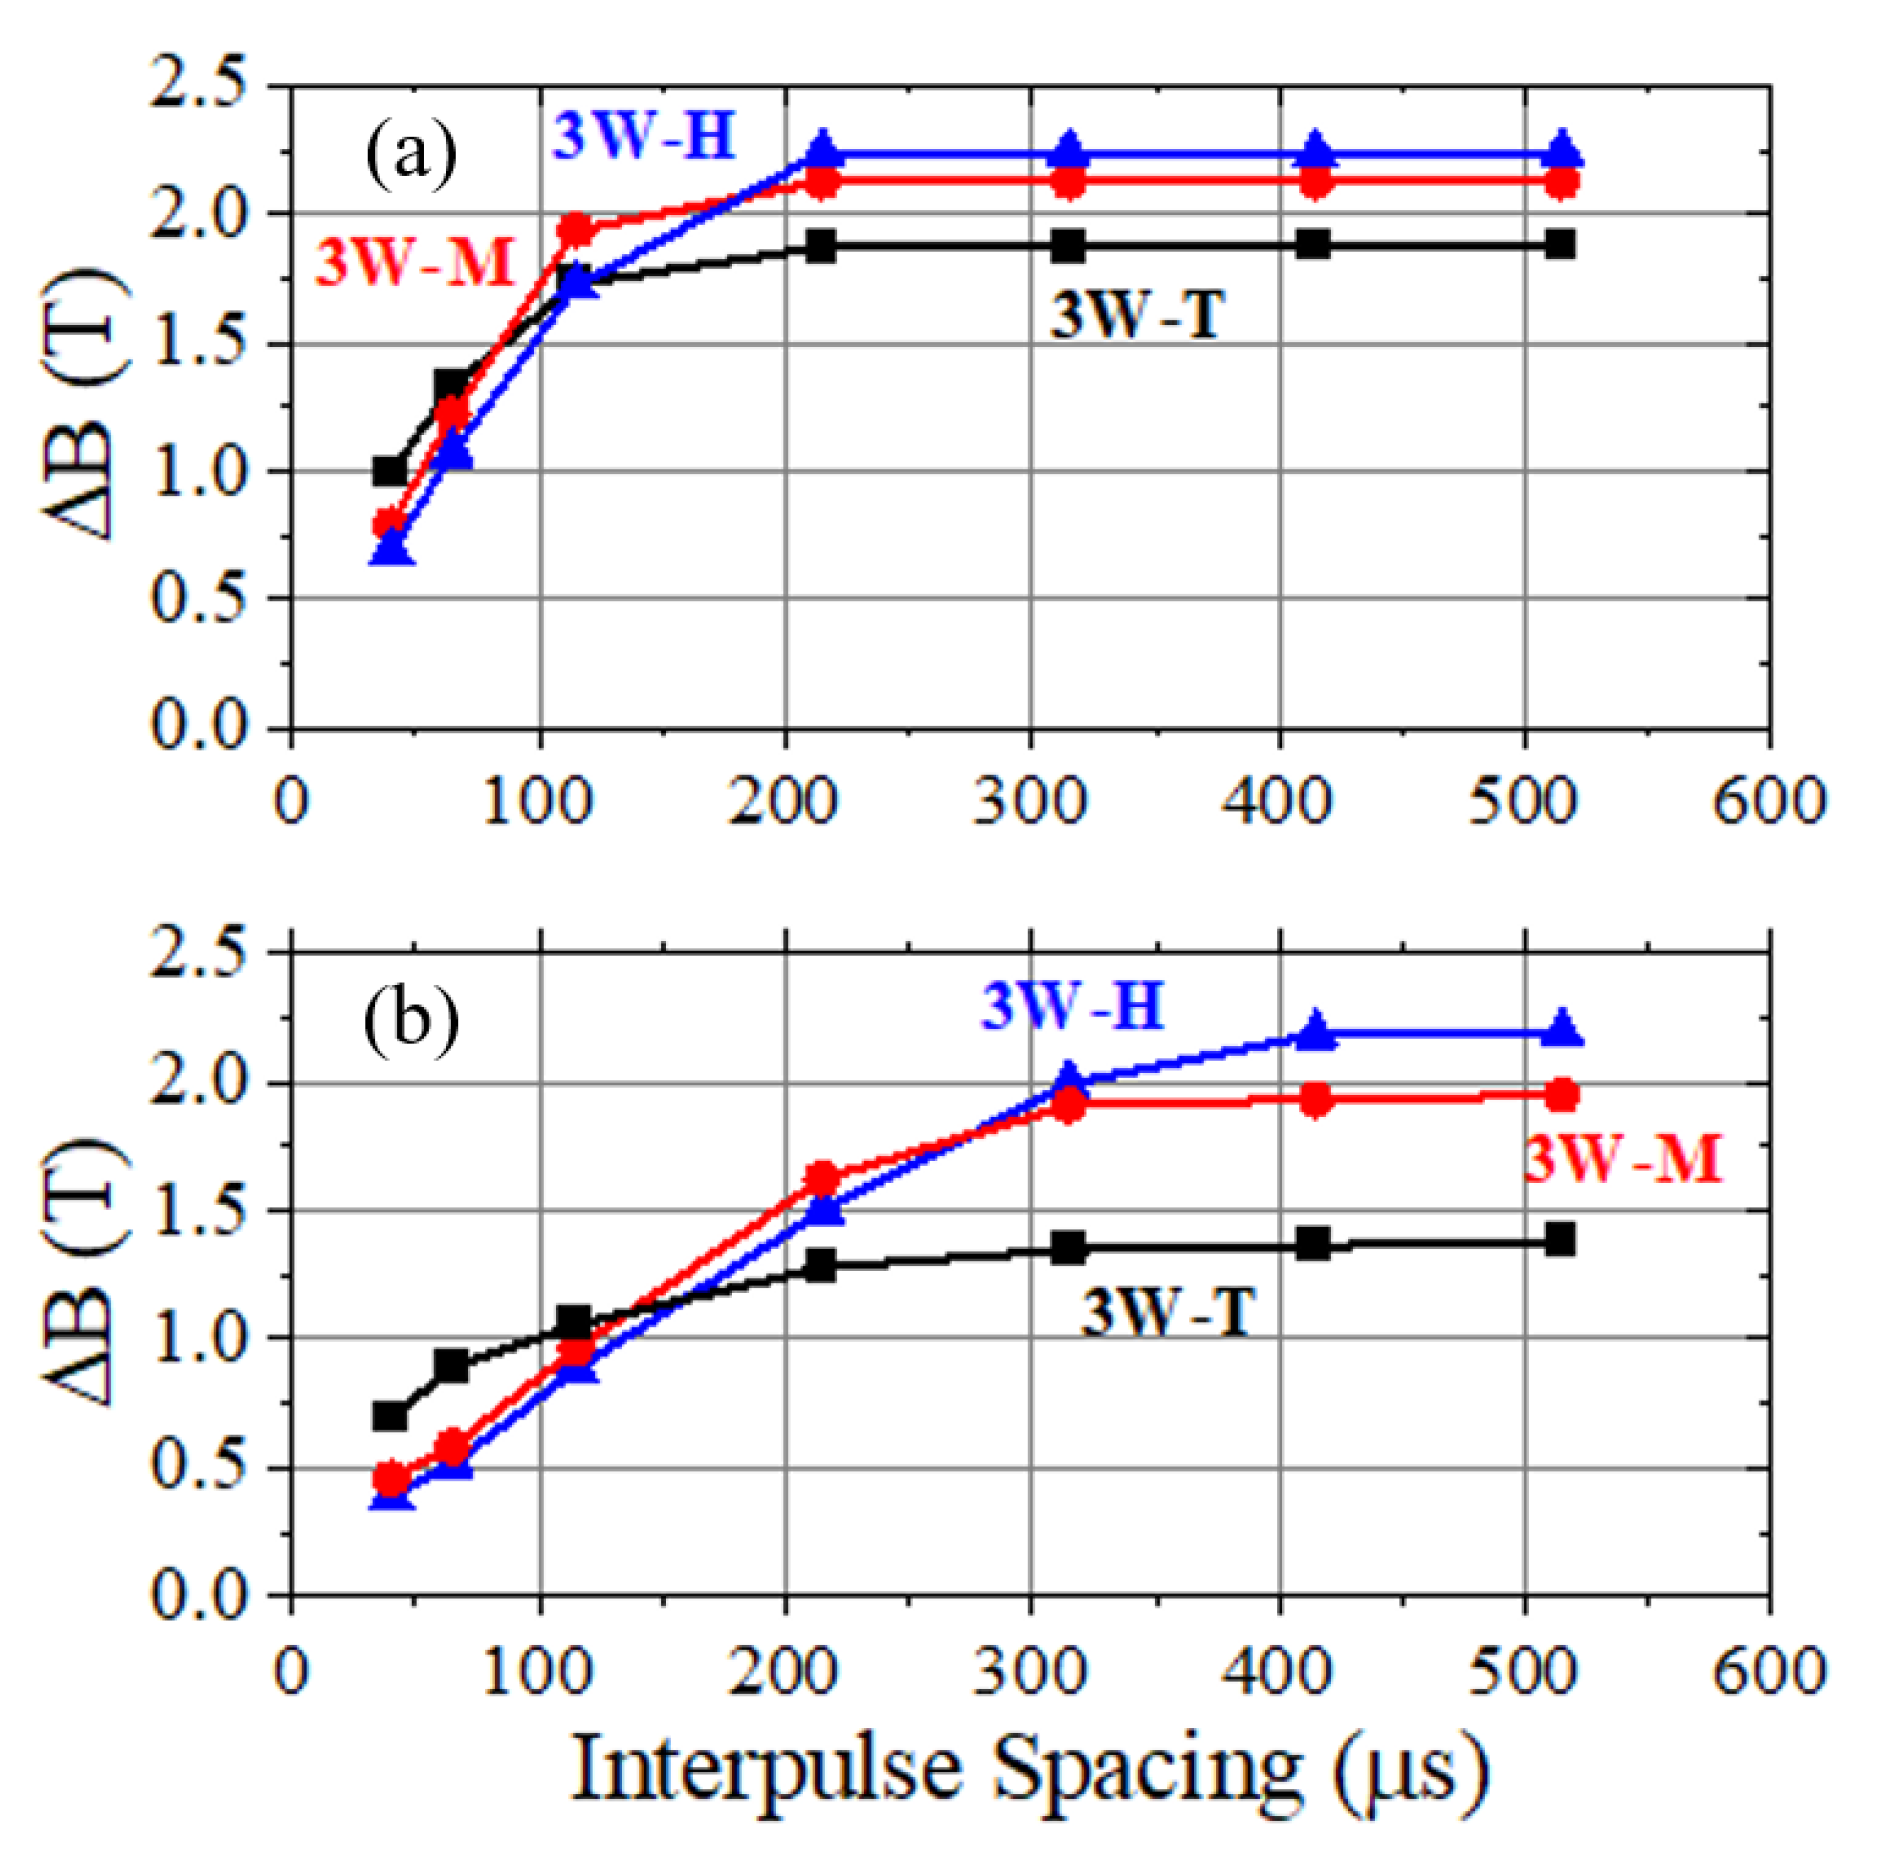
Figure 9.
LTD output waveform at 2.4 kV for each core into a 50 load. Rise-times and voltage amplitudes are similar, but the 3W-L saturates earlier than the other cores. Conditions for the single-stage LTD were a 6 mm (1/4 in.) stalk with PTFE insulation and a 25 V gate voltage.
Figure 9.
LTD output waveform at 2.4 kV for each core into a 50 load. Rise-times and voltage amplitudes are similar, but the 3W-L saturates earlier than the other cores. Conditions for the single-stage LTD were a 6 mm (1/4 in.) stalk with PTFE insulation and a 25 V gate voltage.
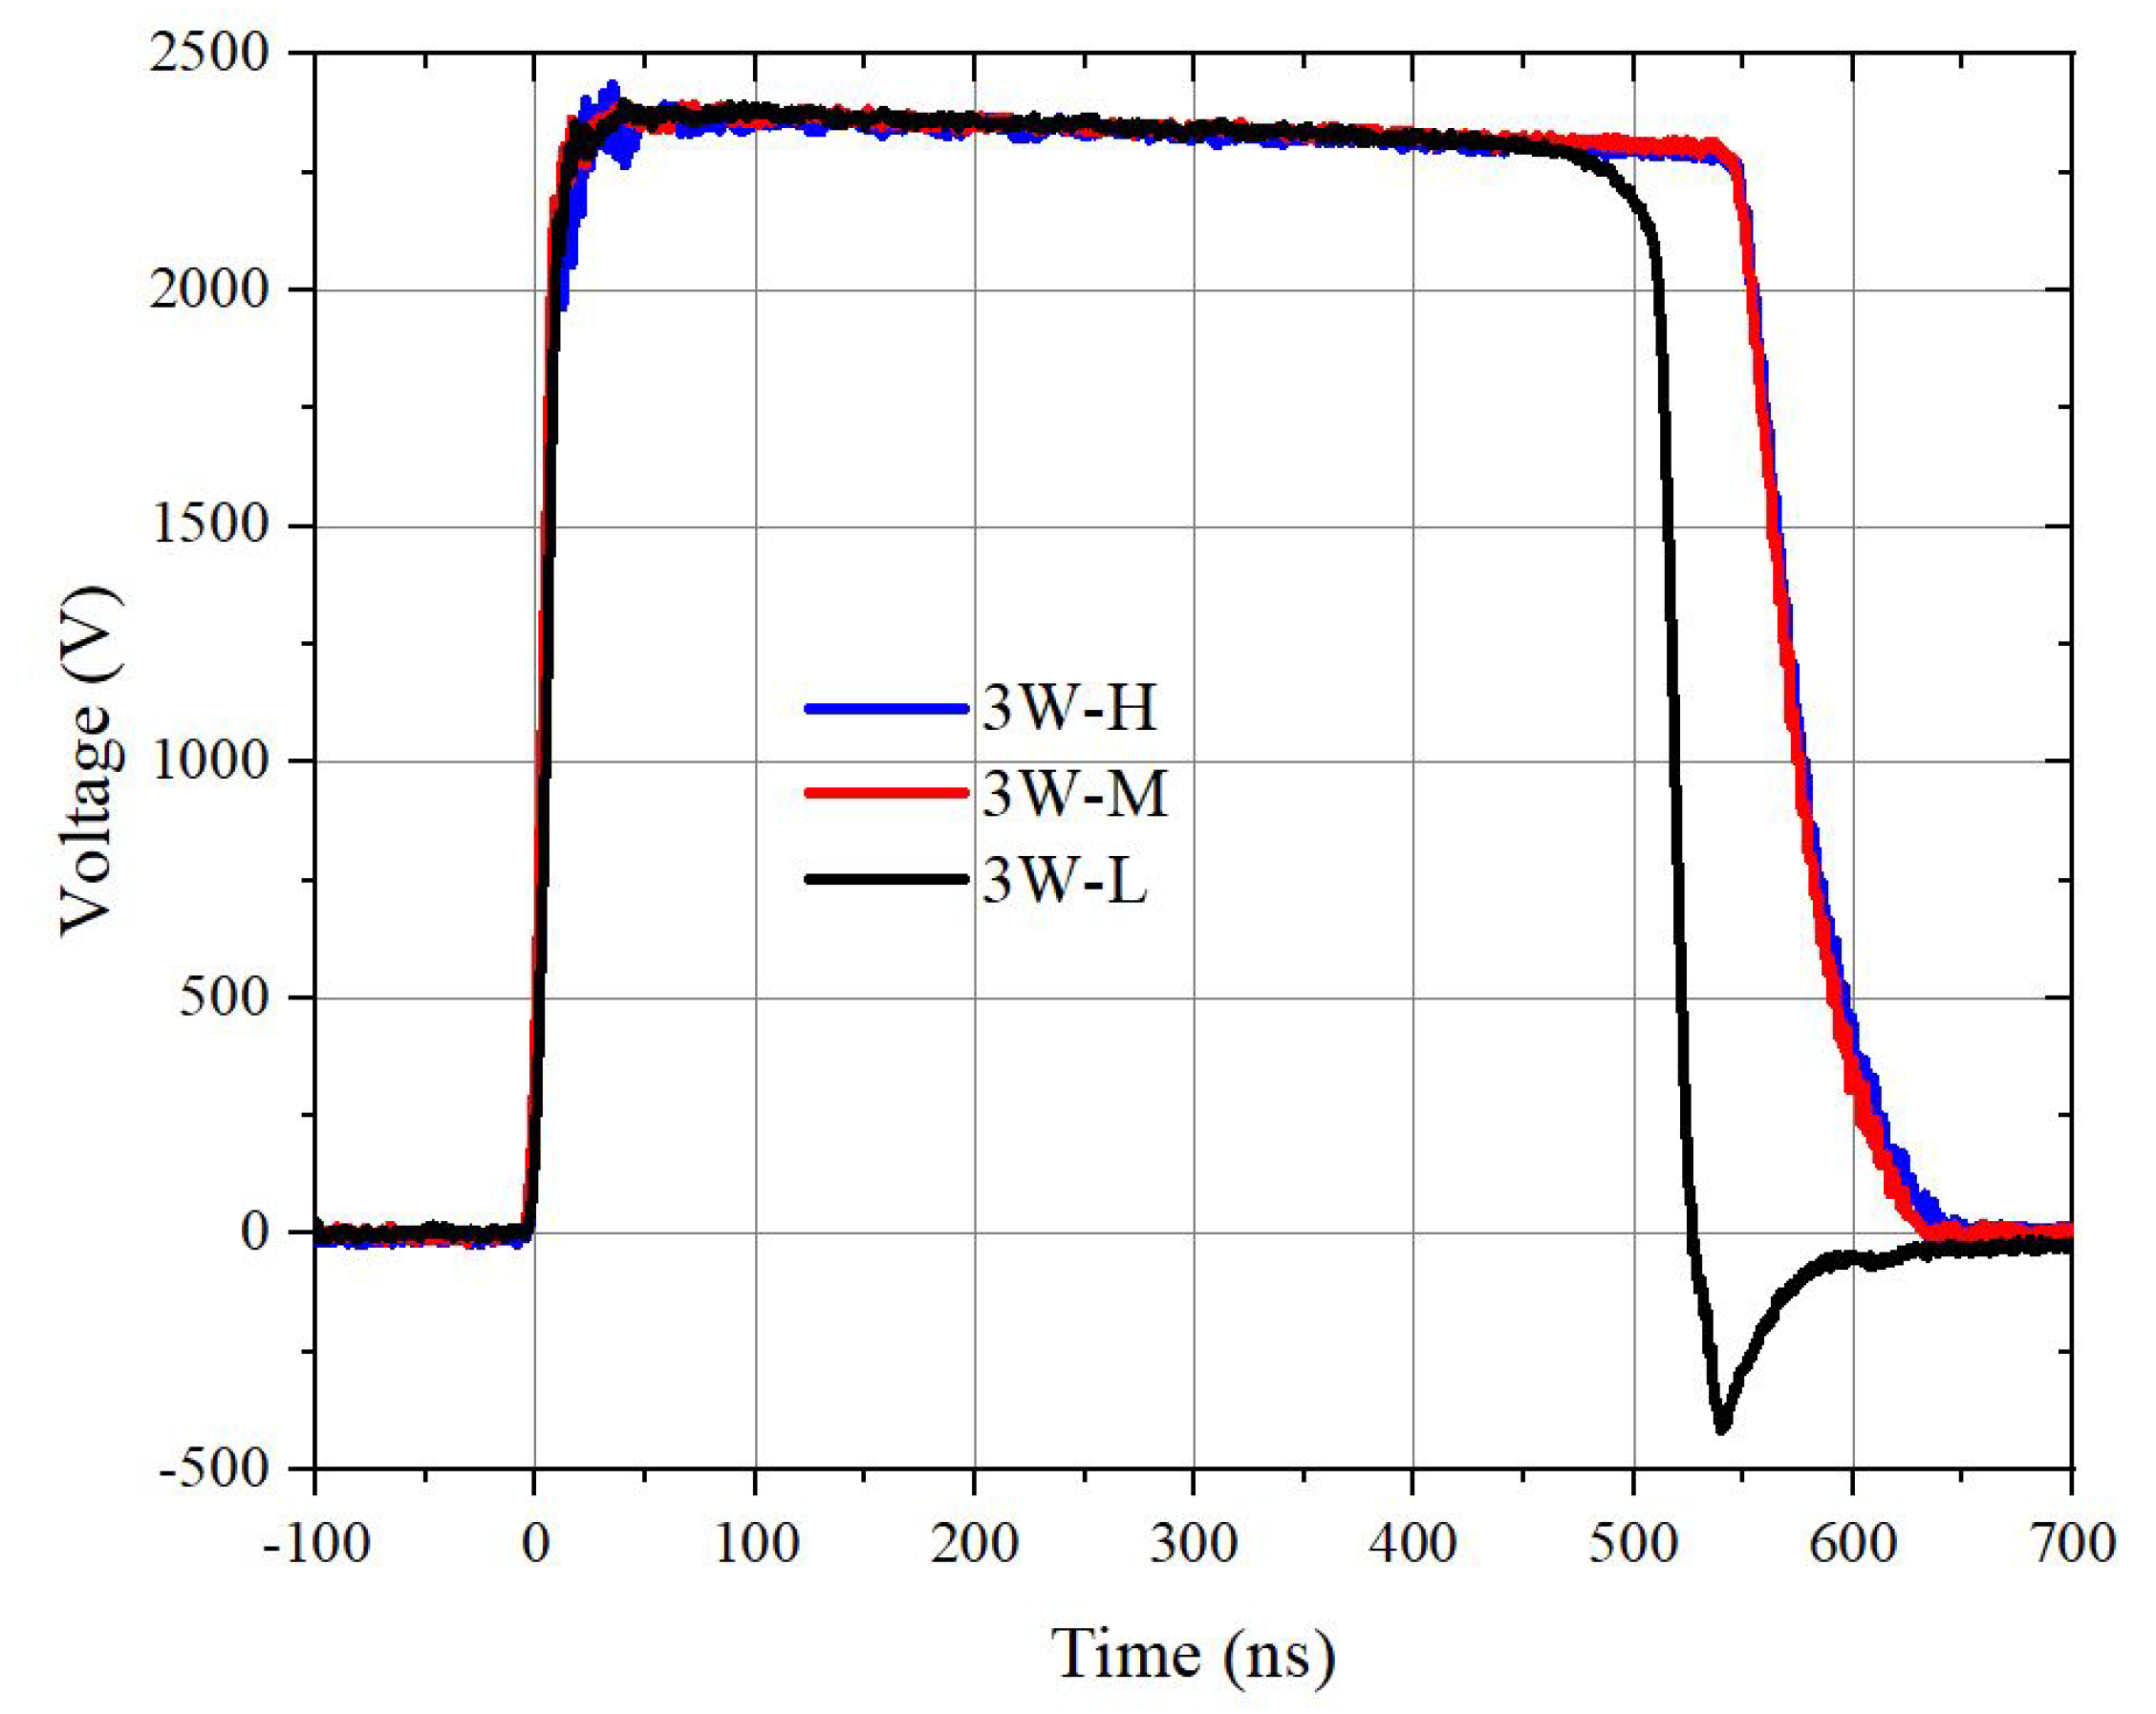
Figure 10.
Influence of varying parameters, height, impedance, and gate voltage on rise-time and average flat-top voltage for the single-stage LTD with a 50 load.
Figure 10.
Influence of varying parameters, height, impedance, and gate voltage on rise-time and average flat-top voltage for the single-stage LTD with a 50 load.
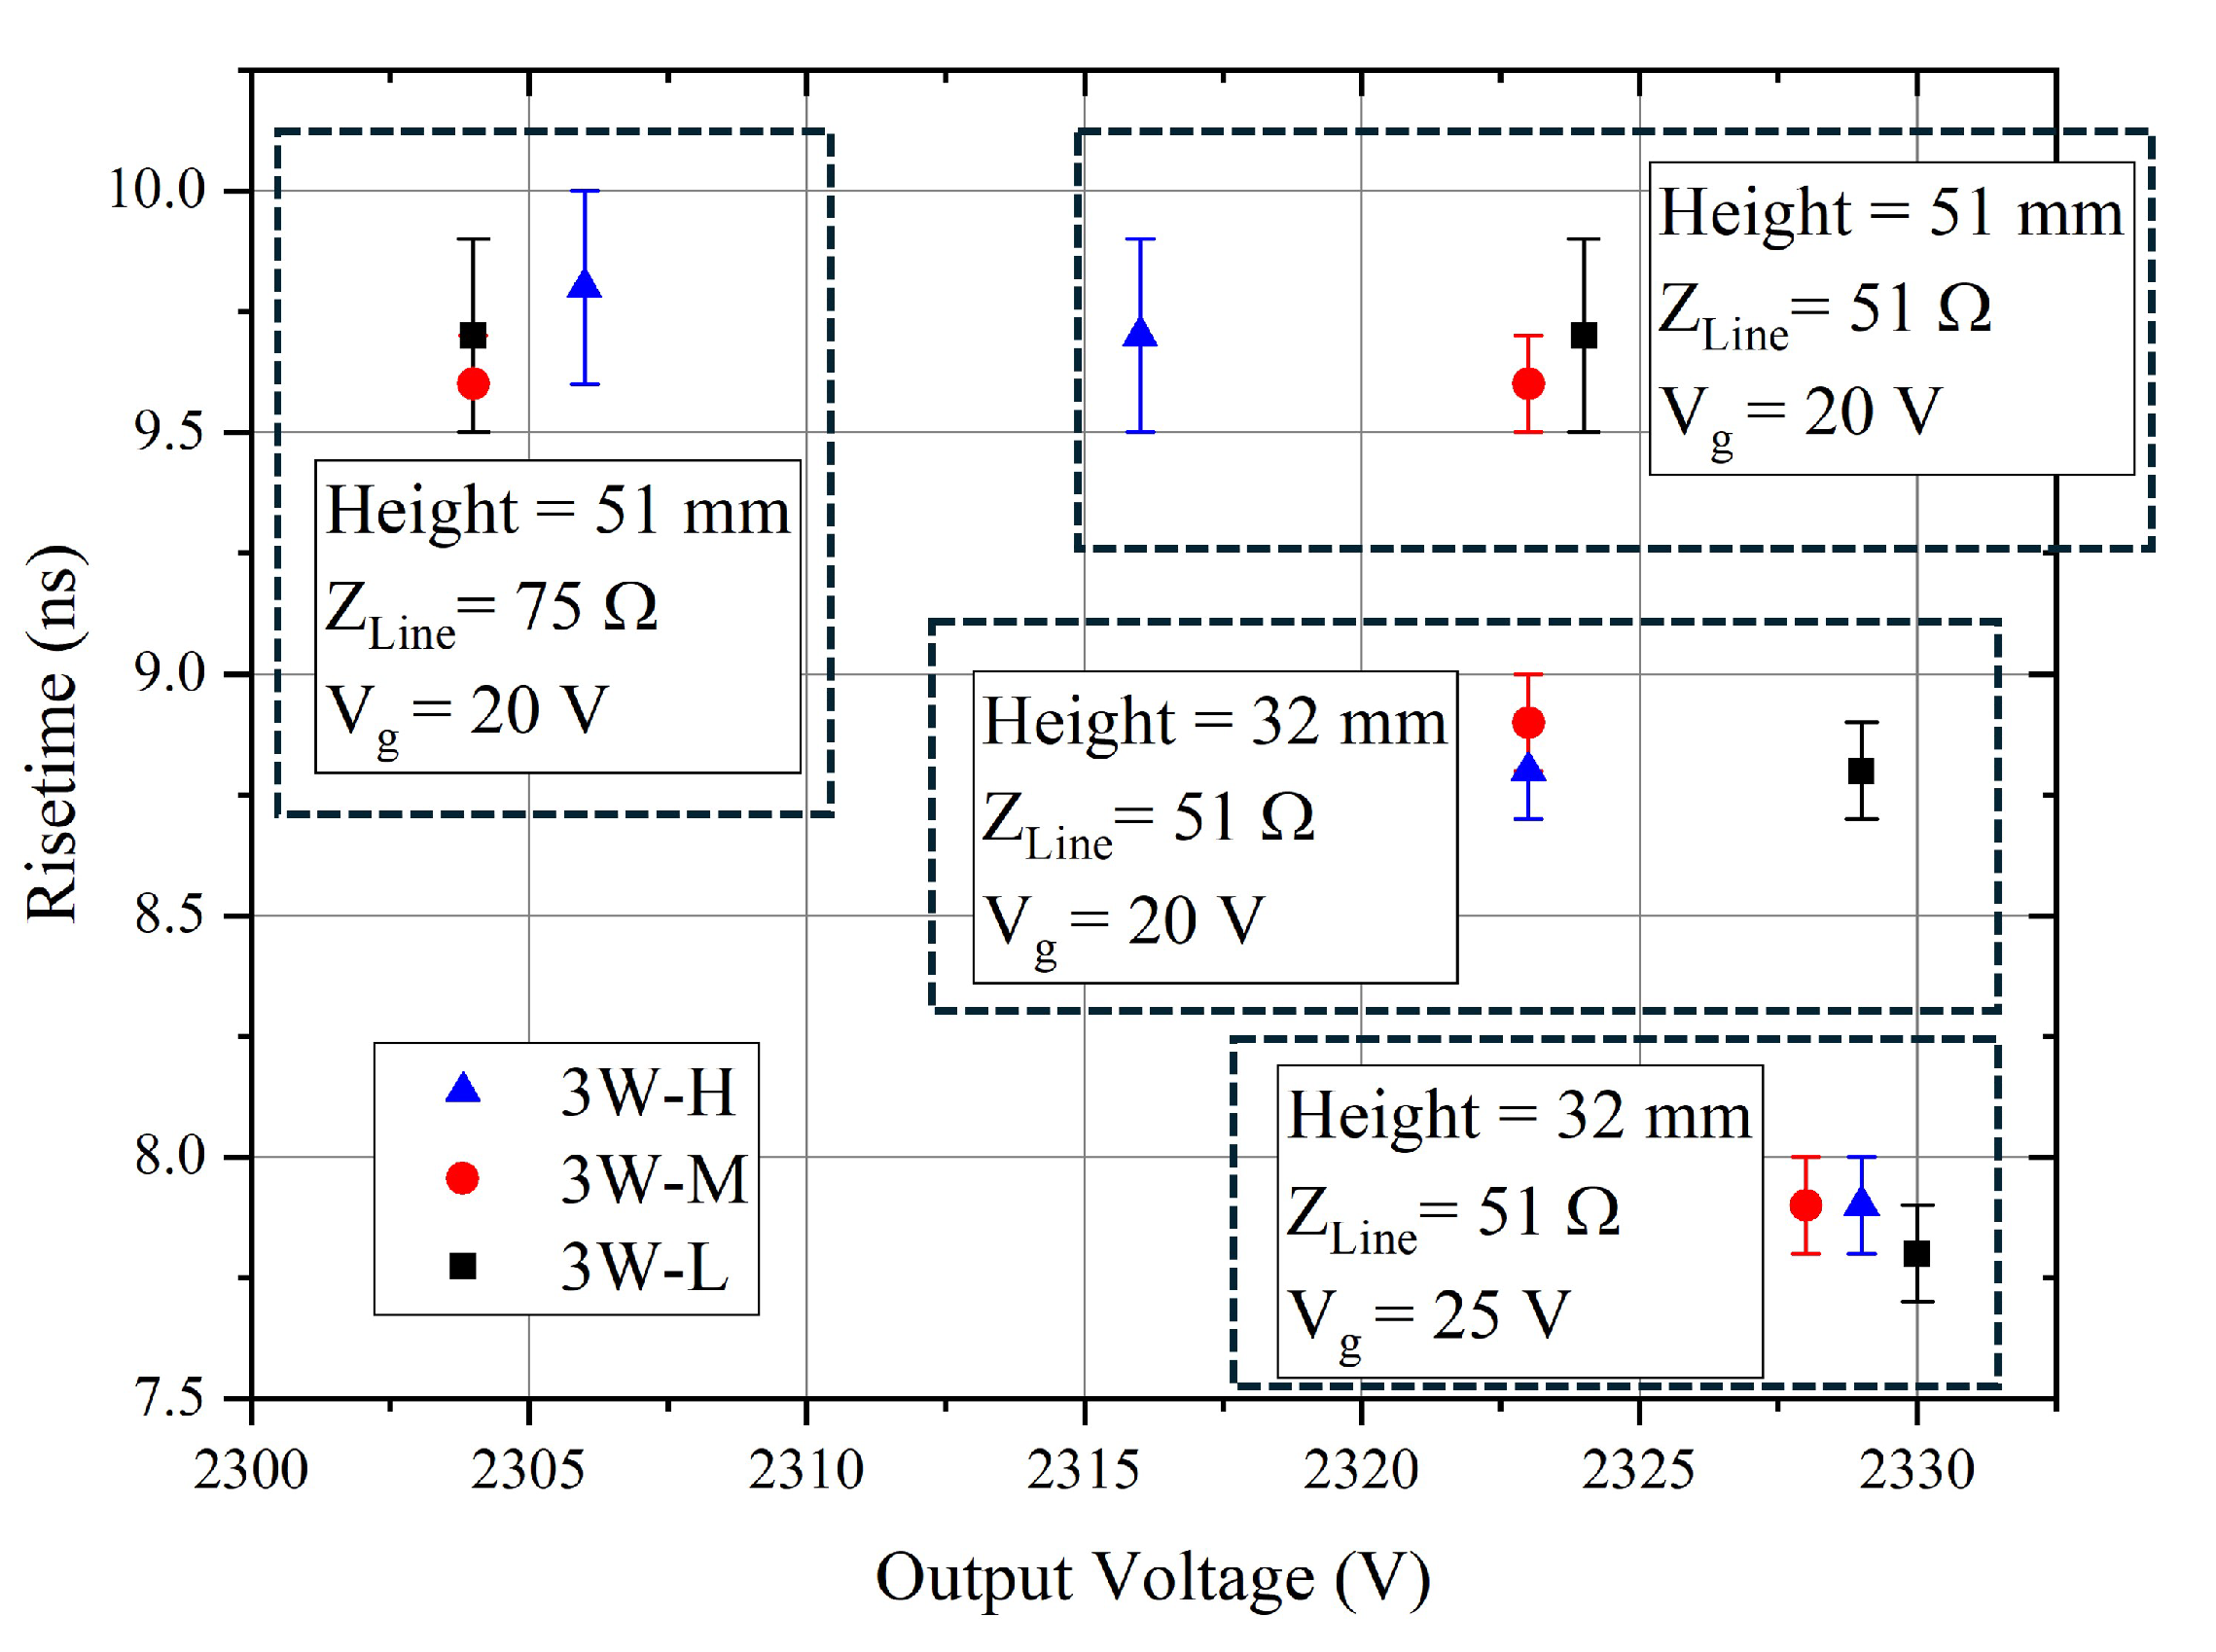
Figure 11.
Single-stage LTD output waveforms with a 6 mm (1/4 in.) stalk with PTFE insulation and a 25 V gate voltage. (a) Varying charge voltages into a 50 load with a pulse width of 500 ns. (b) Varying pulse widths into a 50 load with 2 kV charge voltage.
Figure 11.
Single-stage LTD output waveforms with a 6 mm (1/4 in.) stalk with PTFE insulation and a 25 V gate voltage. (a) Varying charge voltages into a 50 load with a pulse width of 500 ns. (b) Varying pulse widths into a 50 load with 2 kV charge voltage.
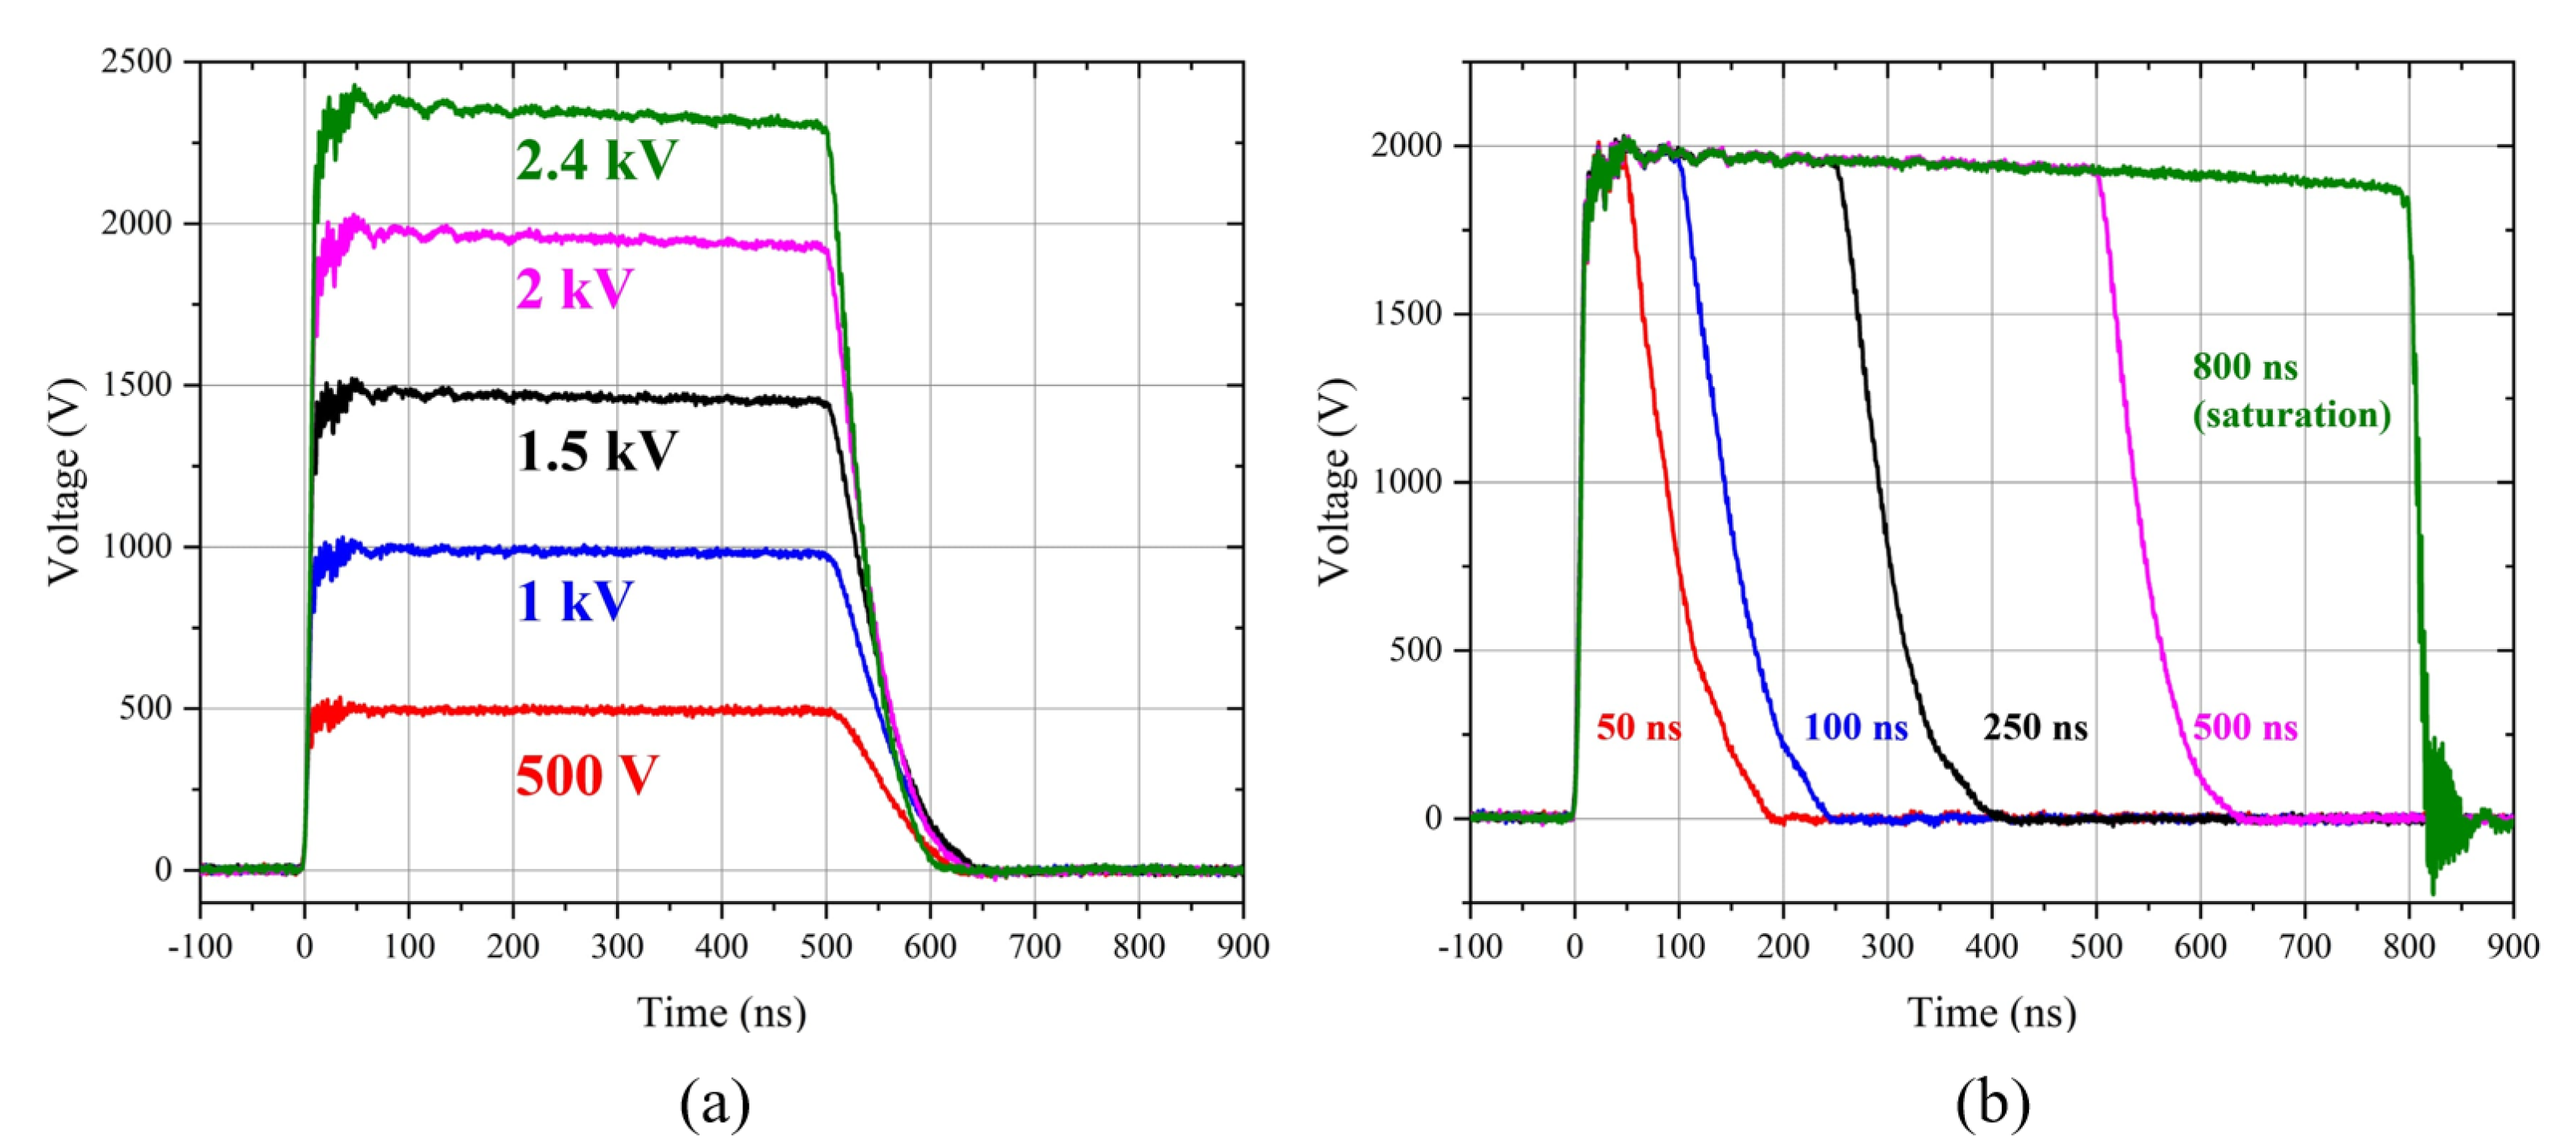
Figure 12.
Full 10-stage LTD stack with pulsed reset boards attached.
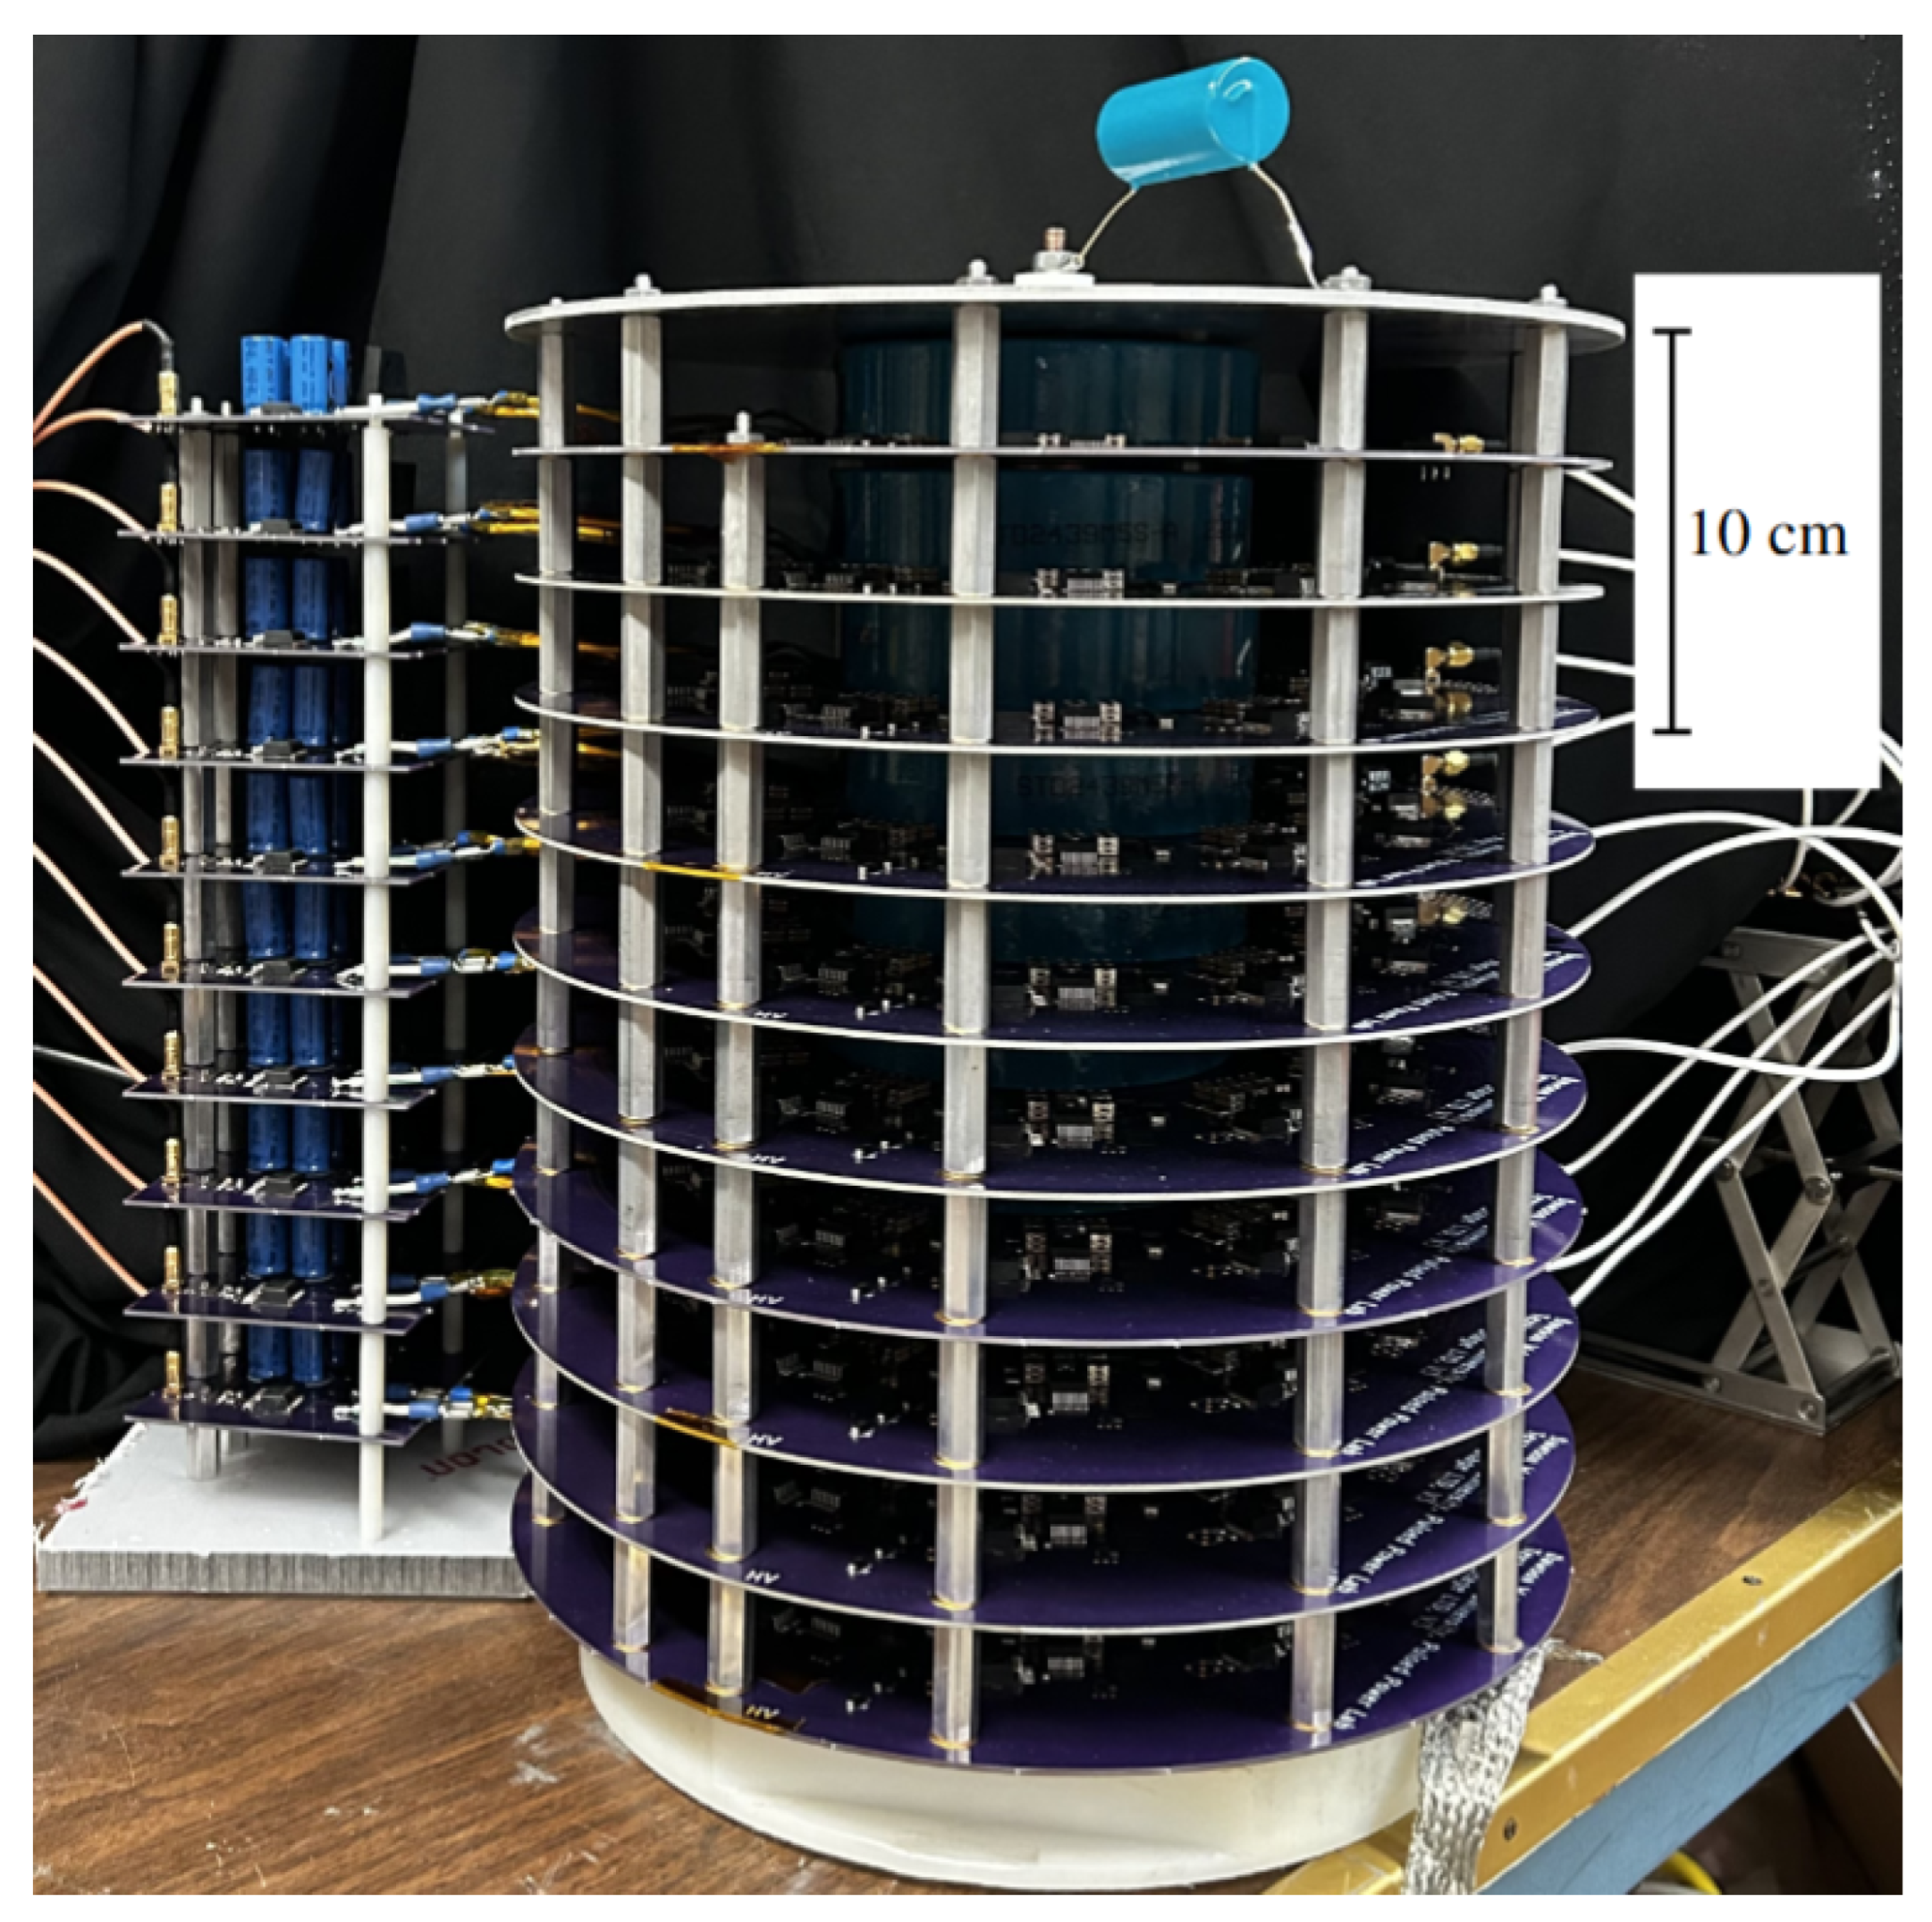
Figure 13.
10-stage LTD voltage output waveforms. (a) Varying charging voltages with 12.7 mm (1/2 in.) diameter stalk with PTFE dielectric () and a 50 load. (b) Varying load resistances with a transmission line characteristic impedance of . (c) Varying load resistances with a transmission line characteristic impedance of . A voltage overshoot is noticeable for load impedances greater than the center stalk coaxial line impedance.
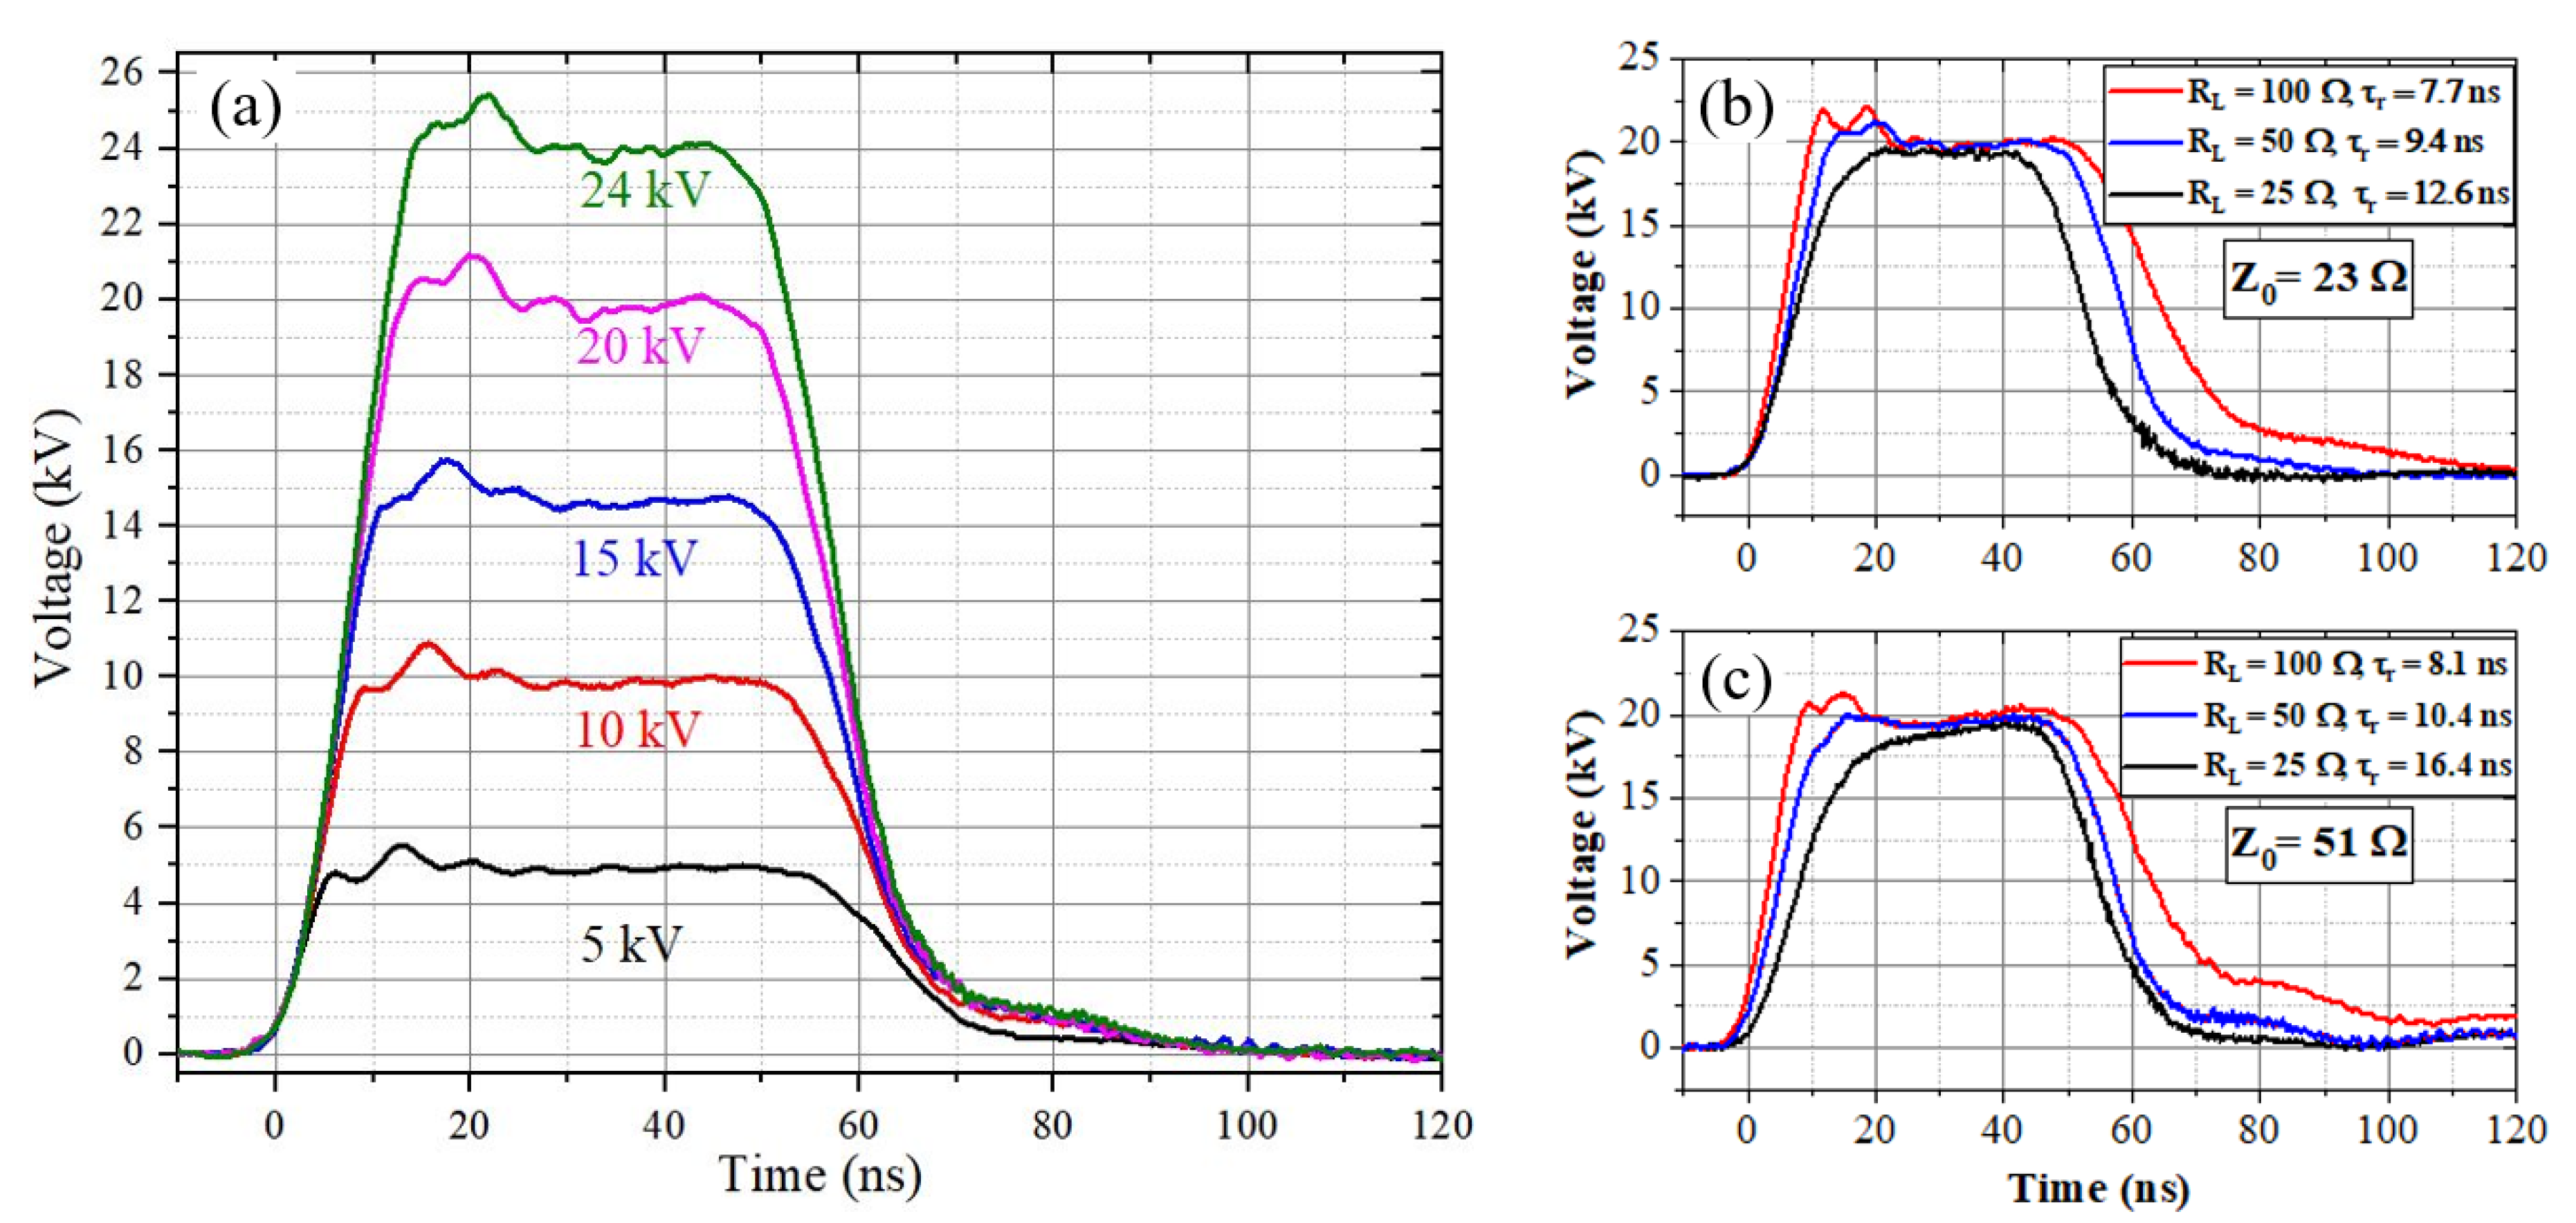
Figure 14.
10-stage LTD 10 shot burst output voltage waveforms with a charge voltage of 1.2 kV with each pulse having a FWHM of ∼ 1.2 s with subsequent pulses being separated by 1 ms delay.
Figure 14.
10-stage LTD 10 shot burst output voltage waveforms with a charge voltage of 1.2 kV with each pulse having a FWHM of ∼ 1.2 s with subsequent pulses being separated by 1 ms delay.
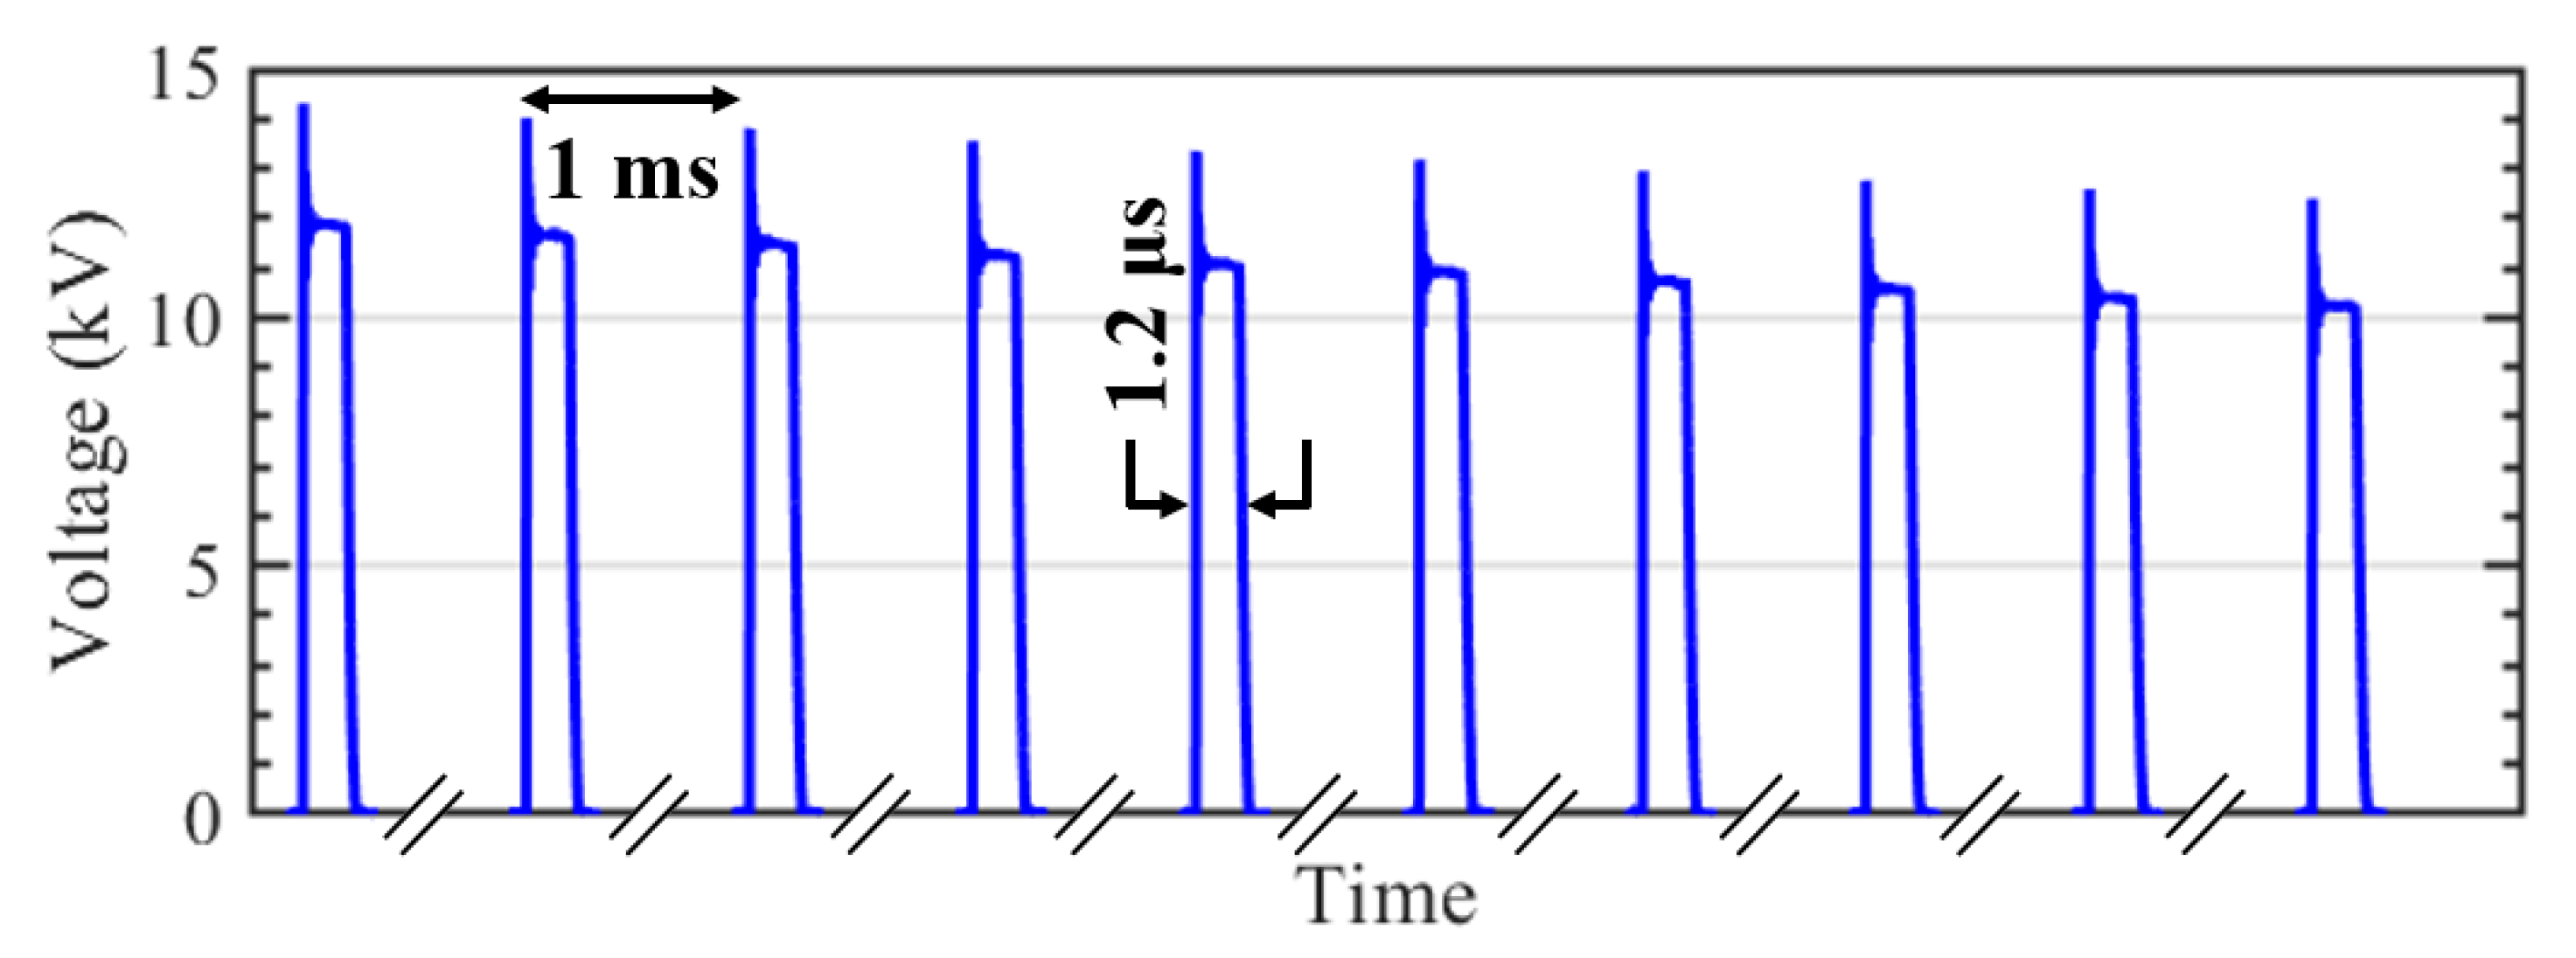
Figure 15.
Flux swing on each core of the LTD measured across each of the 10 shots in the burst, with inter-pulse spacings ranging from 1 ms to 400 , see Figure 7 for core reset timing scheme.
Figure 15.
Flux swing on each core of the LTD measured across each of the 10 shots in the burst, with inter-pulse spacings ranging from 1 ms to 400 , see Figure 7 for core reset timing scheme.

| Author (year) | # of Stages | rise-time | Load | ||
|---|---|---|---|---|---|
| Jiang (2018) | 30 | 40 ns | 29 kV | 967 V | 120 |
| Rao (2020) | 9 | 30.4 ns | 7.5 kV | 833 V | 100 |
| Risch (2021) | 5 | 4 ns | 4 kV | 800 V | 40 |
| Sun (2021) | 4 | 15 ns | 1.9 kV | 433 V | 50 |
| Xue (2024) | 10 | 6.2 ns | 8.8 kV | 880 V | 300 |
| This Work (2025) | 10 | 10 ns | 24 kV | 2.4 kV | 25 |
Table 2.
Materials properties for FT-3W material [19].
Table 2.
Materials properties for FT-3W material [19].
| Material | Annealing Field | (max) | (T) | (A/m) | (%) |
| FT-3W-M | No Field | 74,000 | 1.18 | 1 | 60 |
| FT-3W-L | Transverse | 16,500 | 1.18 | 1 | 3 |
| FT-3W-H | Longitudinal | 6,000 | 1.18 | 1 | 80 |
Note: denotes initial permeability; is the saturation flux density; is the coercive field; and is the remanent flux density.
Table 3.
Gate Voltage and rise-time for 2.4 kV pulse at 32 mm (1.25 in.) LTD height.
| Gate Voltage (V) | Rise-time () |
|---|---|
| 10 | 34.4 |
| 15 | 15.4 |
| 20 | 8.7 |
| 25 | 7.9 |
Table 4.
Average flat-top voltage, average flat-top current, and rise-time for various charging voltages of the single-stage LTD using the 3W-H core, 25 V gate drive voltage, 31.75 mm (1.25 in.) overall height and a 50 load. Each average is over 200 shots and the jitter across the range of voltages is 200 ps or less.
| Average | Average | Rise-time | |
|---|---|---|---|
| 500 V | 488 V | 9.8 A | 4.5 ns |
| 1 kV | 977 V | 19.8 A | 5.7 ns |
| 1.5 kV | 1459 V | 29.7 A | 6.7 ns |
| 2 kV | 1939 V | 39.3 A | 7.5 ns |
| 2.4 kV | 2328 V | 47 A | 7.9 ns |
Table 5.
Average voltage, current and rise-time of the 10-stage LTD for various charging voltages with = 50 . Each average is over 100 shots, with each having a jitter of less than 300 ps.
Table 5.
Average voltage, current and rise-time of the 10-stage LTD for various charging voltages with = 50 . Each average is over 100 shots, with each having a jitter of less than 300 ps.
| (kV) | Average (kV) | Average (A) | Rise-time (ns) |
|---|---|---|---|
| 0.5 | 4.96 | 99 | 5.5 |
| 1 | 9.82 | 196 | 7 |
| 1.5 | 14.68 | 294 | 8.1 |
| 2 | 19.83 | 397 | 9.4 |
| 2.4 | 23.82 | 476 | 10 |
Disclaimer/Publisher’s Note: The statements, opinions and data contained in all publications are solely those of the individual author(s) and contributor(s) and not of MDPI and/or the editor(s). MDPI and/or the editor(s) disclaim responsibility for any injury to people or property resulting from any ideas, methods, instructions or products referred to in the content. |
© 2025 by the authors. Licensee MDPI, Basel, Switzerland. This article is an open access article distributed under the terms and conditions of the Creative Commons Attribution (CC BY) license (http://creativecommons.org/licenses/by/4.0/).
Copyright: This open access article is published under a Creative Commons CC BY 4.0 license, which permit the free download, distribution, and reuse, provided that the author and preprint are cited in any reuse.


