

Submitted:
27 August 2025
Posted:
01 September 2025
You are already at the latest version
Abstract
Atmospheric carbon dioxide (CO₂) levels are rising globally, yet their multiscale varia-bility in remote oceanic regions remains poorly characterized. This study examines a 45-year monthly CO₂ record (1980 – 2024) from the Azores, a subtropical North Atlantic site, using a spectral and statistical framework. The series was decomposed into high- and low-frequency components via Butterworth filtering and analysed with the Cor-relogram-Based Periodogram (CBP) and Monte Carlo significance testing. The residual component robustly recovered the expected seasonal cycle (~12 months), validating the methodology. The trend component revealed an apparent enhancement in low-frequency spectral power, largely explained by the accelerating long-term increase. Control tests with a synthetic quadratic trend and polynomial detrending confirmed that a weak but statistically significant ~11-year oscillation persists, with a very small amplitude (~0.26 ppm peak-to-peak). Segmented regressions showed a sustained and accelerating increase in CO₂ accumulation over the past four decades, consistent with Mauna Loa. These results demonstrate the importance of long-term monitoring in re-mote regions, while highlighting both the potential and limitations of spectral methods for detecting weak low-frequency signals in greenhouse gas records.
Keywords:
atmospheric CO₂
; multiscale variability
; seasonal cycle
; decadal oscillation
; spectral methods
; greenhouse gases
; azores
1. Introduction
The atmospheric concentration of carbon dioxide (CO₂) has increased dramatically since the onset of the industrial era, making it a key driver of global climate change. Long-term monitoring is essential to understand the dynamics of the carbon cycle and to detect shifts associated with both natural processes and anthropogenic activities. Beyond its monotonic increase, CO₂ exhibits oscillatory behavior at multiple time scales, reflecting complex interactions between the atmosphere, biosphere, and ocean systems [1,2,3,4]. Long-term records have revealed seasonal patterns, hemispheric gradients, and interannual variability linked to ocean–atmosphere exchange, biospheric activity, and climate modes such as El Niño and the North Atlantic Oscillation (NAO) [5]. Recent satellite-based studies have confirmed that seasonal modulation is present even in remote subtropical oceanic regions, highlighting the role of local meteorological and biospheric feedbacks [6].
While seasonal cycles of CO₂ are well characterized globally, far less attention has been paid to multiscale periodicities in remote island environments. Such locations provide unique opportunities to observe background atmospheric conditions with minimal continental influence, making them ideal for detecting low-frequency variability and long-range transport signals. However, interpreting these signals can be challenging due to the combined effects of oceanic transport, meteorological variability, and episodic pollution events.
Despite growing interest in CO₂ time series, no previous study has rigorously quantified decadal-scale variability in Azores CO₂ records using statistically validated spectral methods. Here, we address this gap by analysing a 45-year monthly CO₂ record from the Azores using a robust multiscale spectral framework. We apply empirical decomposition to separate high- and low-frequency components, followed by the Correlogram-Based Periodogram (CBP) and Monte Carlo significance testing, to characterize both the seasonal cycle (as a methodological benchmark) and the less-explored decadal-scale variability.
The originality of this study lies not in confirming the well-known increase or the strong seasonal cycle of atmospheric CO₂, but in applying a rigorous multiscale and statistically validated framework to a long-term record from a remote oceanic station. By combining the Correlogram-Based Periodogram (CBP) with Monte Carlo significance testing, synthetic quadratic controls, polynomial detrending, and band-pass filtering, we are able to distinguish genuine low-frequency variability from artefacts of the accelerating anthropogenic trend. This approach allows, for the first time at the Azores site, a quantification of the amplitude of the decadal signal (~0.26 ppm peak-to-peak), demonstrating its statistical detectability but also its limited climatic relevance. In doing so, the paper provides a methodological contribution on how to robustly assess weak oscillatory features in strongly trending greenhouse gas time series. The methodology is described in the following section.
2. Materials and Methods
2.1. Study Area and Dataset
The study focuses on atmospheric CO₂ measurements collected at the Azores archipelago. This archipelago is in the North Atlantic Ocean, between latitudes 36.5°N and 39.5°N and longitudes 24.5°W and 31.5°W. It comprises nine volcanic islands, grouped into three geographic groups: the western group (Flores and Corvo), the central group (São Jorge, Terceira, Graciosa, Faial, and Pico), and the eastern group (São Miguel and Santa Maria). The Azores occupy a strategic position in the context of Atlantic climatology, lying within a transitional zone between tropical and polar air masses. Due to their insular location in the subtropical North Atlantic basin, the islands are directly influenced by large-scale atmospheric systems such as the Azores High, polar fronts, extratropical depressions, and, occasionally, subtropical cyclones. This complex interaction between the islands’ orography and atmospheric dynamics results in a temperate maritime climate, characterized by low annual thermal amplitude, high precipitation levels, elevated relative humidity, and prevailing winds throughout the year.
Given these characteristics, the Azores archipelago has been selected as a strategic location for long-term atmospheric monitoring within the NOAA Cooperative Global Air Sampling Network [7]. The atmospheric CO₂ record analyzed in this study originates from the AZR surface flask site, located on Terceira Island and operated under NOAA’s Global Monitoring Laboratory (GML), which has coordinated flask-based trace gas sampling since the late 1960s. Long-term measurements at this site provide valuable insights into background marine air composition with minimal continental interference.
The AZR station is strategically located in the North Atlantic Ocean, within the Azores archipelago (between 36.5°N and 39.5°N, and 24.5°W to 31.5°W), allowing for the observation of marine boundary layer air masses with minimal local anthropogenic influence Figure 1.
Air samples are collected weekly using a standardized flask sampling protocol, which involves filling paired glass flasks with ambient air and shipping them to the central NOAA laboratory in Boulder, Colorado, for high-precision analysis.
This methodology ensures data consistency and comparability across the global network. Measurements at the AZR site have been continuously conducted since 1979, resulting in a multi-decadal record suitable for evaluating both seasonal cycles and low-frequency climatic oscillations in atmospheric CO₂. The dataset used in this study corresponds to monthly average concentrations, based on rigorous laboratory analysis and quality control procedures applied by NOAA GML. Air samples are collected approximately weekly from network sites, and monthly means are calculated using discrete flask measurements that pass strict laboratory calibration and quality control procedures.
The station provides long-term monitoring data that is considered representative of clean marine boundary layer conditions. Although referred to as “monthly averages,” the CO₂ concentrations values are not continuous monthly means but represent the average of the available high-quality flask measurements that pass NOAA GML’s quality control and calibration procedures.
After collecting, the air samples from the AZR site are analyzed at the NOAA Global Monitoring Laboratory (GML) in Boulder, Colorado. The Measurement Laboratory uses high-precision instrumentation and standardized protocols to determine trace gas concentrations, including CO₂, with rigorous quality assurance and calibration procedures. This ensures that the measurements are consistent, reproducible, and traceable to international reference standards, making the AZR CO₂ record suitable for climate research and long-term variability assessments. According to NOAA GML documentation, CO₂ concentrations are measured using calibrated non-dispersive infrared (NDIR) analyzers. Measurement accuracy is approximately ±0.2 ppm, and measurement precision is typically ±0.1 ppm, based on repeated analysis of standard gases and flask pairs. These values are traceable to the World Meteorological Organization (WMO) CO₂ mole fraction scale. [8].
Prior to decomposition and spectral analysis, missing values in the CO₂ time series were addressed. A total of 28 data points, originally flagged as –999.99, were linearly interpolated using the average of adjacent valid values, given the regular time spacing of the dataset. This approach preserves the continuity of the time series without introducing artificial trends.
This interpolation ensured continuity of the time series while preserving the statistical integrity of long-term trends and spectral characteristics.
The resulting continuous time series includes 3149.0 valid monthly observations spanning multiple decades. Descriptive statistics of atmospheric CO₂ concentrations at the AZR surface flask site are summarized in Table 1.
To investigate the underlying temporal structure of the CO₂ record, the monthly time series was decomposed into low- and high-frequency components, allowing for the identification of distinct modes of variability across different time scales, as described in the following section.
2.2. Decomposition of the Time Series
To isolate different modes of variability in the atmospheric CO₂ time series, we performed an empirical decomposition into two components: a low-frequency trend and a high-frequency residual. This approach enables a more accurate characterization of seasonal and decadal periodicities.
The trend component was extracted using a zero-phase Butterworth low-pass filter with a cutoff frequency of 0.05 cycles/month, equivalent to a 20-month period. This threshold was chosen to attenuate seasonal and interannual fluctuations while preserving slower trends.
The filter was applied using the filtfilt() function from the scipy.signal Python module, which performs forward and reverse filtering to eliminate phase distortion while preserving the amplitude and timing of the signal.
The residual component of the time series is obtained by subtracting the low-frequency trend from the original CO₂ signal. This operation isolates short-term variability, including seasonal and interannual fluctuations, from the long-term evolution of atmospheric CO₂, equation 1.
Residual(t) = CO₂_original(t) − CO₂_trend(t)
This type of smoothing is particularly suitable for climatic time series with nonstationary behavior and aligns with best practices for low-pass filtering under appropriate boundary constraints, as discussed by Mann [9]. The low-pass filtered output represents the trend component, capturing the slow-varying background signal, including long-term growth and decadal oscillations.
Filtering was performed using the filtfilt() function from the scipy.signal module in Python, which applies the operation in both forward and reverse directions. This zero-phase filtering prevents phase distortion and preserves the temporal structure and amplitude of the signal.
A normalized cutoff frequency of 0.05 cycles per month, equivalent to a period of approximately 20 months, was selected to suppress seasonal and interannual variability while retaining low-frequency trends.
To isolate the underlying temporal structures of the atmospheric CO₂ series, a pseudo-EMD decomposition was performed using a zero-phase Butterworth low-pass filter. Although the Empirical Mode Decomposition (EMD) method was not applied directly, we refer to the filtering process as a “pseudo-EMD decomposition” to indicate its functional similarity: the use of a zero-phase Butterworth low-pass filter allows us to separate the original CO₂ signal into a slow-varying trend and a high-frequency residual, akin to the empirical separation of intrinsic mode functions in EMD. This terminology reflects the conceptual goal of isolating temporal components without assuming stationarity or linearity. This approach effectively attenuates short-term fluctuations while preserving the long-term behavior of the signal, allowing us to extract a low-frequency trend component and a high-frequency residual. Similar statistical decomposition strategies have been applied to temperature time series in Europe to identify trends, harmonic structures, episodic fluctuations, and extreme events, thereby enabling a clearer separation between long-term and short-term variability [10].Alternative methods, such as Singular Spectrum Analysis (SSA), have also proven effective for decomposing environmental time series into trend and oscillatory components, particularly in the presence of nonlinearity or nonstationarity [11]. Similar decomposition strategies based on spectral analysis and model selection (e.g., additive vs. multiplicative frameworks) have also been applied to CO₂ time series [12], demonstrating the value of descriptive approaches for capturing seasonal regularity.
After separating the CO₂ time series into trend and residual components, each was subjected to spectral analysis using the Correlogram-Based Periodogram (CBP) to identify dominant periodicities at different time scales.
2.3. Spectral Analysis: Correlogram-Based Periodogram
To detect dominant periodicities in the decomposed CO₂ time series, we employed the Correlogram-Based Periodogram (CBP) method, a robust spectral analysis technique well-suited for nonstationary and noisy environmental datasets. Unlike traditional periodograms that rely on direct Fourier transformation of the original signal, the CBP first computes the autocorrelation function of the time series and then applies a Fast Fourier Transform (FFT) to the resulting correlogram. Throughout this study, frequencies were initially computed in cycles per month (cpm) to match the monthly resolution of the time series. However, for interpretability, dominant periodicities are reported in terms of their corresponding periods (in months), which better reflect the temporal resolution and avoid sub-month interpretations.
Formally, the CBP estimates spectral power S(f) by applying a discrete Fourier transform to the autocorrelation function R(τ) of the time series, equation 2.
where:
- R(τ) is the Spearman rank correlation between the original time series Xt and its lagged version Xt+τ
- τ is the time lag
- f is the frequency, expressed in cycles per month (cpm), corresponding to the inverse of the period in months (e.g., 0.083 cpm = 12-month cycle)
- S(f) is the estimated spectral density at frequency f.
In this study, autocorrelation was estimated using Spearman’s rank correlation coefficient, a non-parametric method more robust to nonlinearities, trends, and outliers features commonly found in geophysical time series. The use of Spearman correlation enhances the robustness of the spectral estimate by relaxing assumptions of linearity and stationarity.
The Correlogram-Based Periodogram (CBP) yields a spectral power distribution in which peaks correspond to dominant periodicities embedded in the original signal. A prominent peak observed at 0.083 cpm (equivalent to a 12-month cycle) reflects the strong annual modulation of atmospheric CO₂. Another peak near 0.0083 cpm (≈120 months) indicates the presence of a decadal-scale oscillation. These spectral features highlight the multiscale structure of the time series.
The CBP method has proven particularly effective in environmental and climate sciences due to its ability to extract meaningful periodicities from relatively short or nonstationary records. Its integration with Monte Carlo-based significance testing, as performed in this study, enhances the statistical robustness of periodicity detection and interpretation. This methodological framework follows best practices in climatic time series analysis, which recommend multiple complementary spectral approaches to distinguish signal from stochastic noise in nonstationary environmental datasets [13].
This approach aligns with established guidelines for climatic time series analysis, which emphasize the importance of spectral methods capable of handling nonstationarity, noise, and signal overlaps in complex environmental datasets [14].
However, the detection of spectral peaks alone is not sufficient; rigorous statistical validation is required to confirm their significance, as detailed in the following section.
2.4. Significance Testing
To evaluate whether the spectral features are statistically significant, we employed a Monte Carlo simulation approach using the global g-statistic, defined as equation 3.
where S(fi) denotes the spectral power at frequency fi, and the denominator represents the total spectral energy across all N frequencies. This method is particularly recommended for environmental and climatic time series due to their strong autocorrelation and non-Gaussian behavior. Such features often lead to false detection of spectral peaks unless properly controlled with surrogate-based resampling techniques, as emphasized [15]. We generated 1,000 surrogate time series by randomly permuting the original data, preserving the distribution but destroying temporal structure, and computed the CBP for each to derive the corresponding g-values.
We note that the random permutation method removes all temporal autocorrelation from the time series. As such, the resulting p-values reflect a conservative test against a white-noise null hypothesis. This approach does not account for autocorrelated structure (e.g., AR(1)), which may affect the estimated significance and will be addressed in future work using more sophisticated surrogates.This number of replicates provided a sufficient empirical distribution for estimating statistical significance while ensuring computational efficiency.The p-value was estimated as the proportion of randomized surrogates with a g-statistic greater than or equal to that of the real series. Spectral peaks with p-values less than 0.001 were considered statistically significant and unlikely to result from stochastic noise alone.This approach follows Monte Carlo testing principles for nonstandard test statistics, ensuring a valid type I error even under complex data structures [16]. It is also consistent with the recommendations of [17], who demonstrated that colored noise processes, such as AR (1), can produce apparent oscillatory features, making rigorous significance testing essential to distinguish true periodicities from stochastic artifacts.
3. Results
Having established the statistical significance of key spectral features using the CBP and Monte Carlo testing, we now present the main findings of the multiscale analysis. These include a strong seasonal cycle, a significant decadal oscillation, and a long-term upward trend in atmospheric CO₂ concentrations at the Azores site.
3.1. Characterizing the Temporal Variability of Atmospheric CO₂
A complete time series of atmospheric CO₂ concentrations measured at the AZR surface flask site between 1980 and 2024 is presented in Figure 2.
The observed data are represented as a continuous line, while the values estimated via linear interpolation (for previously missing months) are highlighted. This long-term record reveals both short-term seasonal fluctuations and a clear long-term increasing trend in CO₂ levels, consistent with global atmospheric patterns.
As seen in Figure 2, CO₂ concentrations exhibit a clear seasonal pattern (intra-annual variability) and a long-term increasing trend. Although interdecadal variability is not immediately visible in the raw series, it becomes apparent after decomposition and spectral analysis, as shown in Figure 6 and Figure 7. This justifies the application of multiscale methods to isolate hidden low-frequency structures.
To further contextualize the long-term evolution of atmospheric CO₂, Figure 3 presents the decadal distribution of monthly concentrations at the AZR site. This boxplot representation captures changes in central tendency and dispersion across successive decades, illustrating the persistent upward shift in CO₂ levels observed over the 45-year monitoring period.
In addition to long-term decadal changes, interannual variability in atmospheric CO₂ is also evident. Figure 4 presents the annual distribution of CO₂ concentrations at the AZR site, providing a finer temporal resolution that captures year-to-year fluctuations. This plot highlights not only the sustained increase in median values over time, but also the presence of potential extremes, further supporting the need for spectral analysis to disentangle underlying cyclical patterns.
To investigate the temporal structure of short-term fluctuations in atmospheric CO₂, we applied the CBP method to the high-frequency residual component of the monthly time series. The spectral analysis revealed a statistically significant peak at approximately 12.0 months (0.083 cycles/month), consistent with the well-established seasonal cycle. The magnitude and statistical significance of this peak are presented in Figure 5 and discussed below.
The residual component analysis revealed a robust seasonal cycle with a periodicity of approximately 12 months (~0.083 cpm), consistent with the global seasonal variability of atmospheric CO₂. Although expected, this result is important for two reasons: (i) it validates the ability of the decomposition and Correlogram-Based Periodogram (CBP) to recover known periodicities, ensuring confidence in the detection of less evident signals such as the decadal oscillation; and (ii) it characterizes the amplitude and phase of seasonality at the Azores site, enabling comparisons with other oceanic observatories and the assessment of potential regional influences, such as the North Atlantic Oscillation (NAO) or sea surface temperature (SST) anomalies. Previous modeling and observational studies [18,19,20] have linked seasonal CO₂ variability to environmental drivers such as SST, vegetation dynamics, and climate oscillations (e.g., El Niño), reinforcing the role of biosphere–climate interactions in shaping short-term fluctuations. These processes, while beyond the main scope of this study, provide important context for interpreting the observed seasonal cycle at the Azores site.
Having confirmed the presence of a statistically significant annual cycle in the residual component, we now turn to the analysis of slower variability embedded in the long-term trend of the CO₂ series.
3.2. Spectral Analysis of Decadal Variability in CO2
The CBP applied to the low-frequency trend component revealed an enhancement in spectral power centred between ~120 and 132 months (~0.0076–0.0083 cpm), consistent with decadal-scale variability, Figure 6.
Figure 6.
Correlogram-Based Periodogram (CBP) of the trend component of the monthly CO₂ time series at the AZR surface flask site (Azores), computed with a maximum lag of 120 months. The trend was extracted using a zero-phase Butterworth low-pass filter (cutoff frequency = 0.05 cycles/month), isolating low-frequency variability. An enhancement in spectral power is observed around a frequency corresponding to a period of approximately 132 months (~11 years), consistent with decadal-scale variability. Although this feature does not appear as a distinct peak, it was statistically significant according to a Monte Carlo test with 1,000 surrogate series (p < 0.001). Similar periodicities have been linked to internal climate variability and external forcing, including solar modulation and ocean–atmosphere interactions, as discussed by [3,20,21], and [34].
Figure 6.
Correlogram-Based Periodogram (CBP) of the trend component of the monthly CO₂ time series at the AZR surface flask site (Azores), computed with a maximum lag of 120 months. The trend was extracted using a zero-phase Butterworth low-pass filter (cutoff frequency = 0.05 cycles/month), isolating low-frequency variability. An enhancement in spectral power is observed around a frequency corresponding to a period of approximately 132 months (~11 years), consistent with decadal-scale variability. Although this feature does not appear as a distinct peak, it was statistically significant according to a Monte Carlo test with 1,000 surrogate series (p < 0.001). Similar periodicities have been linked to internal climate variability and external forcing, including solar modulation and ocean–atmosphere interactions, as discussed by [3,20,21], and [34].
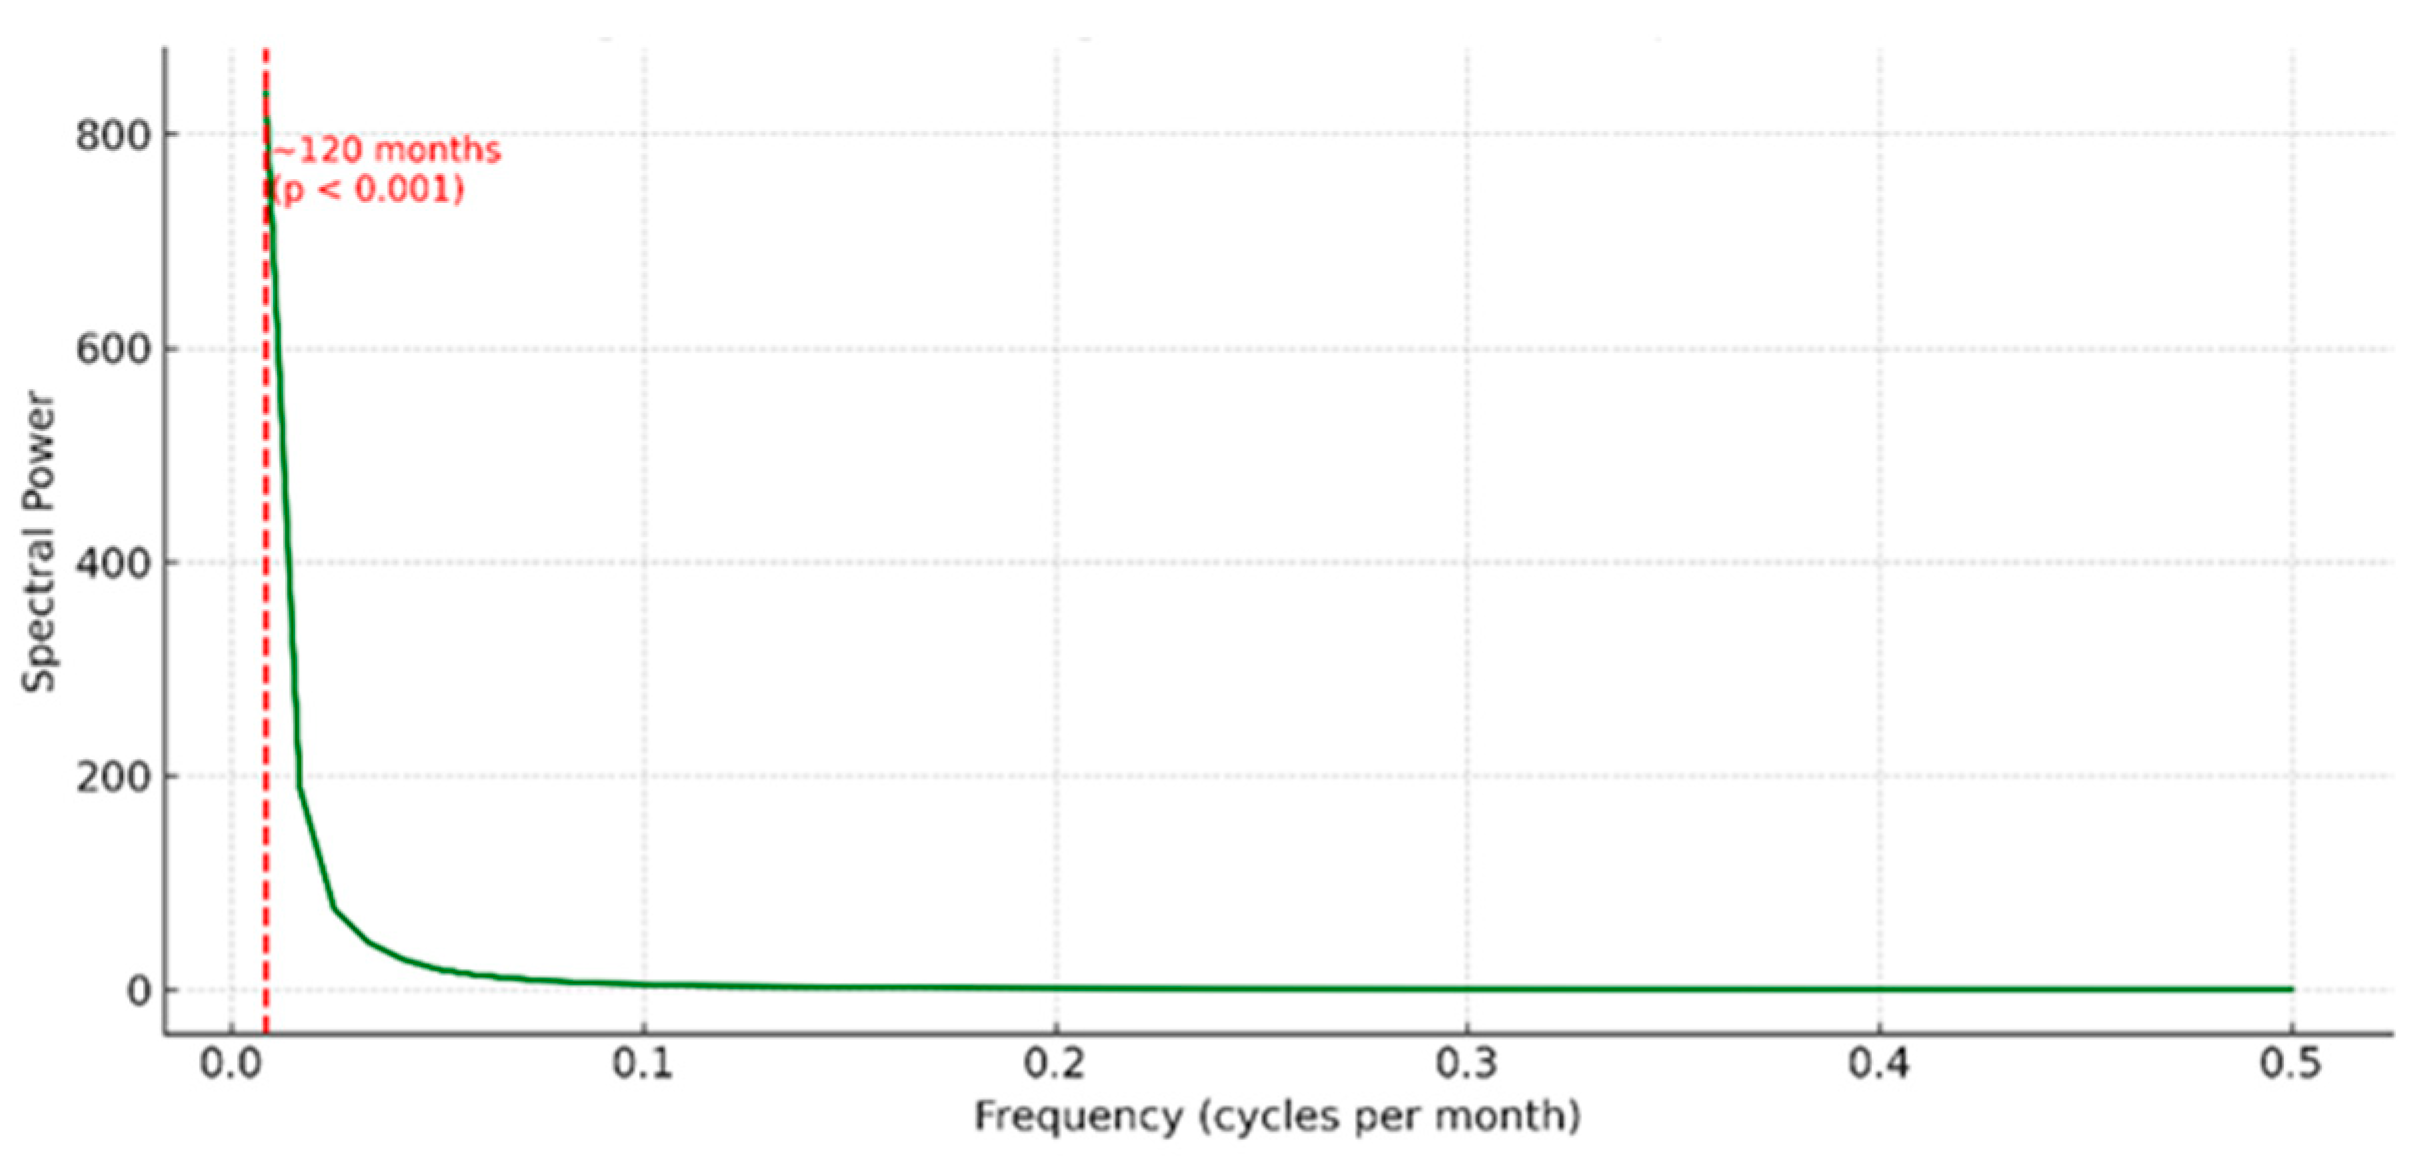
This longer-term fluctuation, embedded in the background evolution of atmospheric CO₂ concentrations, may be linked to decadal-scale climate variability or solar-related forcing. Previous studies have identified ~11-year signals in climate records that are often associated with the solar cycle [21], supporting the possibility that the enhanced low-frequency spectral power observed here could be partially driven by solar variability or other long-term mechanisms.
The enhancement in low-frequency spectral power was statistically significant, with a g-statistic of approximately 0.118 and a p-value < 0.001, indicating that this feature is unlikely to result from stochastic noise. Control experiments with a synthetic quadratic trend confirmed that much of the low-frequency spectral power originates from the accelerating background increase. After applying polynomial detrending, however, a weak but statistically significant oscillation remained in the 9–12-year band. Its estimated amplitude is very small (~0.26 ppm peak-to-peak). These calculations were performed but are not shown here, as they follow standard statistical procedures. In addition to potential solar influences, this decadal-scale variability may reflect internal modes of ocean–atmosphere coupling, such as those observed in the Pacific basin [22], and may represent the impact of low-frequency climatic oscillations on the global carbon cycle. Furthermore, external forcings such as major volcanic eruptions have been shown to interact with background climate variability on decadal timescales, potentially altering atmospheric CO₂ dynamics through feedbacks in the ocean–biosphere system [23].
The comparison between the CBP spectra of the residual and trend components, Figure 7 clearly shows the separation of dominant periodicities: the seasonal cycle (~12 months) in the residual component and the statistically significant low-frequency enhancement (~11 years) in the trend component.
Figure 7.
Correlogram-Based Periodogram (CBP) comparing the residual and trend components of the monthly CO₂ time series at the AZR surface flask site (Azores). The residual component captures the dominant seasonal cycle (~0.083 cycles/month), while the trend component exhibits a statistically significant decadal-scale periodicity (~0.0076 cycles/month). Dashed vertical lines mark the location of the statistically significant peaks identified in each component (p < 0.001).
Figure 7.
Correlogram-Based Periodogram (CBP) comparing the residual and trend components of the monthly CO₂ time series at the AZR surface flask site (Azores). The residual component captures the dominant seasonal cycle (~0.083 cycles/month), while the trend component exhibits a statistically significant decadal-scale periodicity (~0.0076 cycles/month). Dashed vertical lines mark the location of the statistically significant peaks identified in each component (p < 0.001).
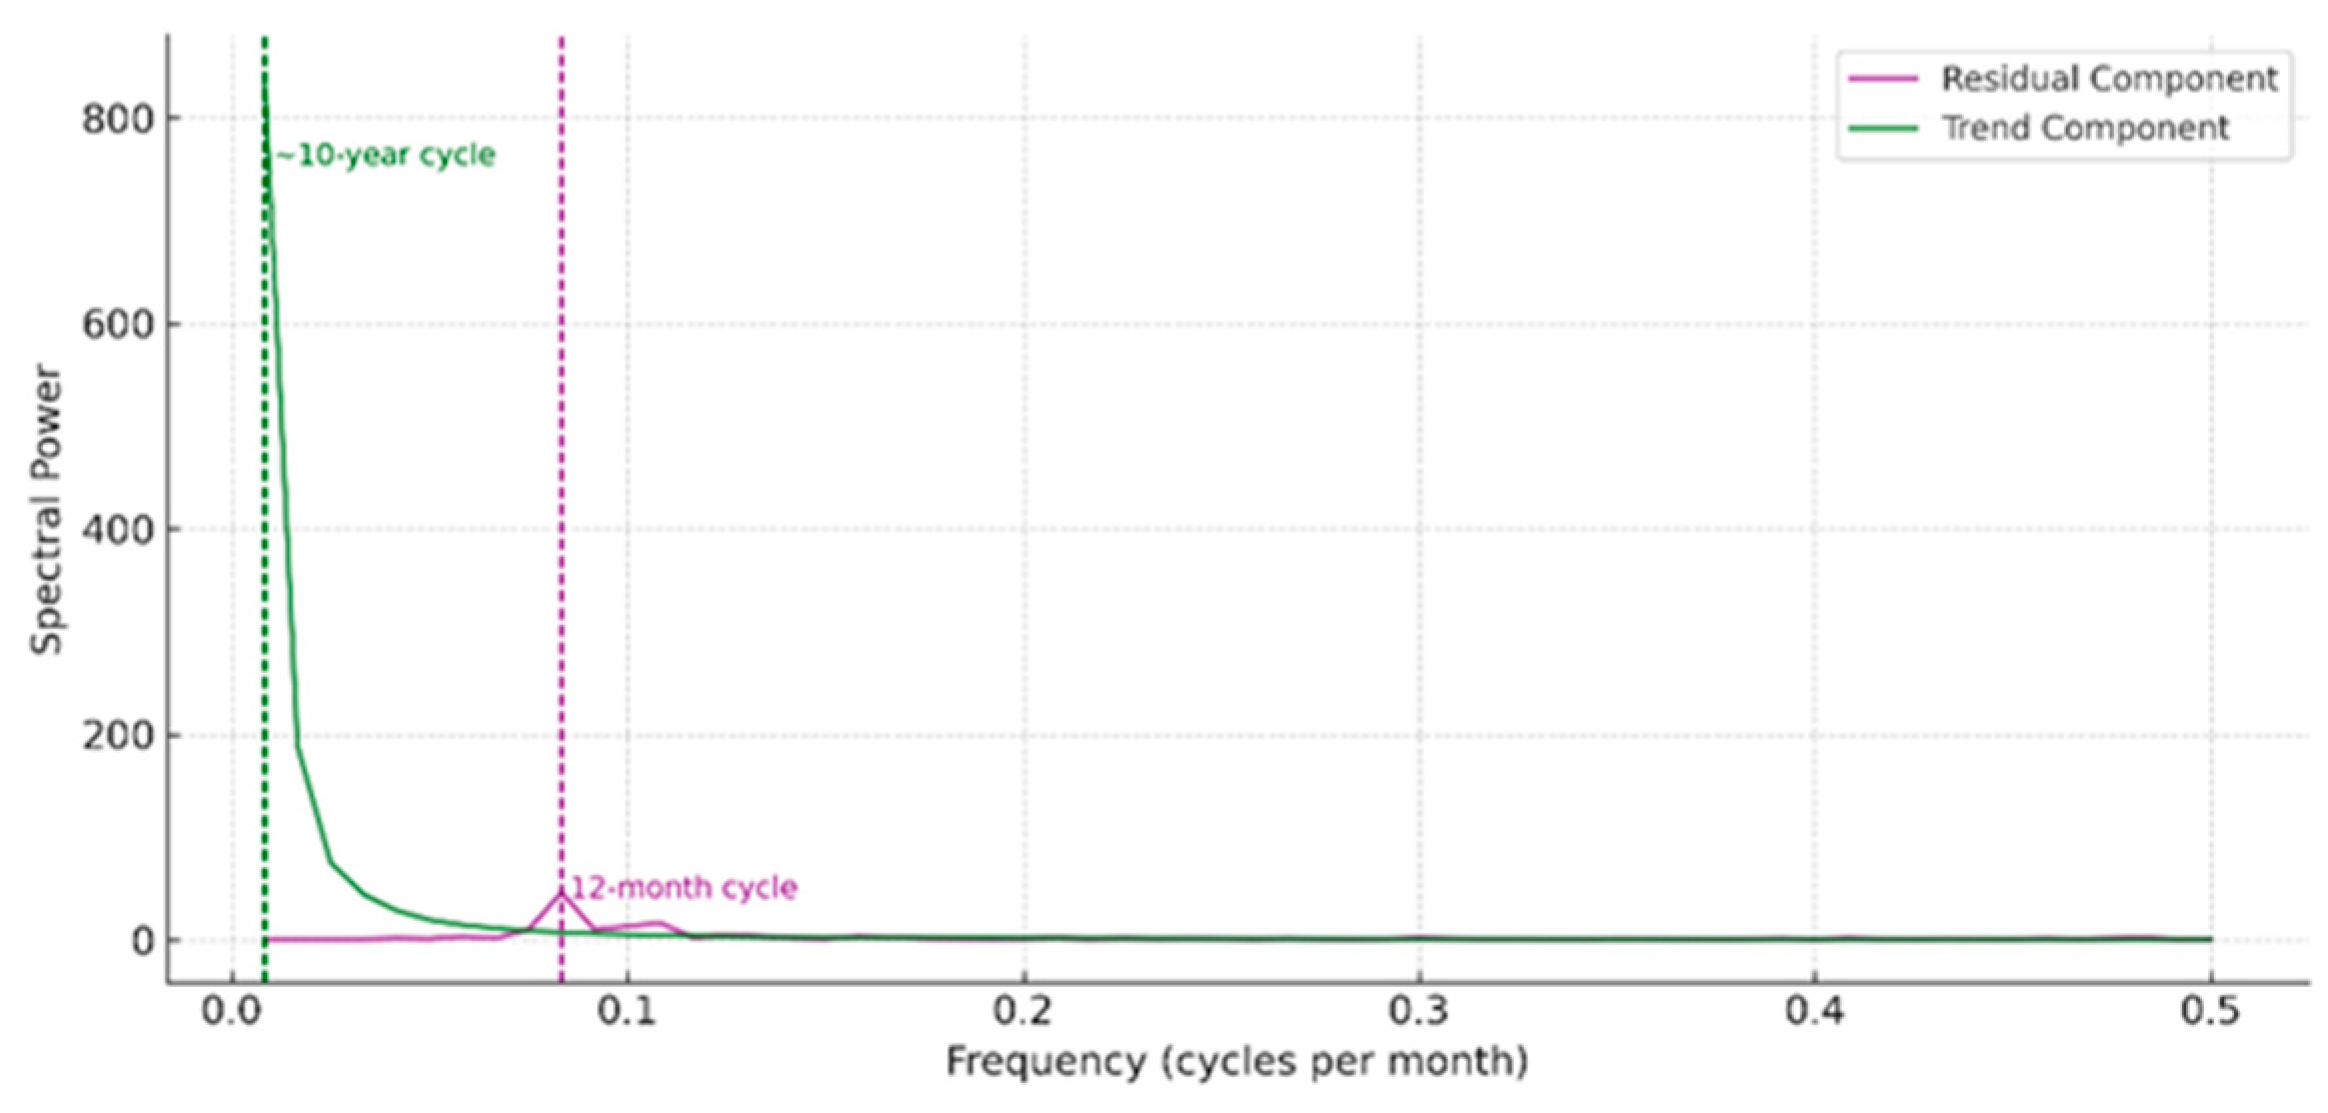
This reinforces the value of the decomposition approach for isolating overlapping temporal processes in atmospheric CO₂ records.
Although this oscillation does not drive the overall upward trend in atmospheric CO₂, it may superimpose temporary accelerations or slowdowns, complicating linear trend interpretations. Identifying such variability is therefore essential for separating natural low-frequency signals from the persistent anthropogenic increase and for improving the representation of carbon–climate feedbacks in models.
We now examine the long-term growth rate of atmospheric CO₂ at the AZR site.
3.3. Decadal CO₂ Growth Rate
Annual mean CO₂ concentrations from the AZR site (1980–2024) were analyzed using segmented linear regressions for each decade and the most recent sub-decade. Table 2 summarizes the results.
Growth rates increased from 1.33 ± 0.16 ppm/year in the 1980s to 2.24 ± 0.16 ppm/year in the 2010s, with a slight decline to 2.16 ± 0.19 ppm/year during 2020–2024, within the margin of error. All regressions show high coefficients of determination (R² ≥ 0.8) and statistically significant p-values.
For comparison, the same analysis was applied to the Mauna Loa record (Table 3). Growth rates rose from 1.57 ± 0.10 ppm/year in the 1980s to 2.54 ± 0.08 ppm/year in 2020–2024, with R² ≥ 0.95 across all intervals.
The consistency between AZR and Mauna Loa trends confirms that the Azores record reflects global background CO₂ accumulation. Segmenting the analysis avoids the bias of fitting a single trend to an accelerating series and highlights the progressive intensification of CO₂ growth over the last four decades.
4. Discussion
The spectral and statistical analyses presented in the previous sections revealed both seasonal and decadal-scale oscillations embedded in the atmospheric CO₂ record from the Azores. In this section, we interpret these findings in light of the broader scientific literature, starting with a descriptive overview of the dataset. Each component of the time series is then examined in detail to elucidate the climatic, oceanographic, and biospheric mechanisms that may underlie the observed multiscale variability.
4.1. Interpretation of Statistical Features in the CO₂ Record
The AZR surface flask record provides a clear view of long-term atmospheric CO₂ evolution in a remote mid-Atlantic location. Rather than reiterating descriptive statistics, interpretation focuses on the structural and temporal features that shape the series.
A statistically significant structural break was detected around 1995 using the Chow test (F = 266.04, p < 1.1 × 10⁻¹⁶). This coincides with NOAA’s designation as the WMO Central Calibration Laboratory for CO₂, ensuring traceability to primary reference standards and improving global measurement consistency. The timing also aligns with a broader acceleration in global emission rates after 1990, suggesting that the breakpoint reflects both an instrumentation improvement and a real intensification of atmospheric CO₂ accumulation [24].
The overall range of 140.8 ppm across 45 years highlights the magnitude of enrichment in a clean marine boundary layer setting, while the relatively symmetric distribution supports the reliability of the dataset for trend and variability analyses. By identifying and accounting for this structural change, subsequent trend and spectral analyses can more accurately distinguish between natural variability and the persistent anthropogenic signal.
Building on these statistical features, the next section examines the decadal and annual distribution patterns of atmospheric CO₂ at the AZR site.
4.2. Visual Patterns in Decadal and Annual Distributions
The boxplots in Figure 3 and Figure 4 represent the decadal and annual distributions of atmospheric CO₂ concentrations at the AZR surface flask site (Azores). Both clearly illustrate a consistent and progressive rise in atmospheric CO₂ over time. The decadal plot highlights a systematic upward shift in both the median and the interquartile range (IQR) from the earliest decades to the most recent ones. This pattern reflects the accumulation of CO₂ in the atmosphere, aligning with global trends driven primarily by fossil fuel combustion and land-use changes.
The annual boxplots provide finer temporal resolution, revealing year-to-year variability superimposed on the long-term trend. While short-term fluctuations are evident, possibly influenced by ocean-atmosphere interactions, volcanic activity, or regional transport. The overall pattern remains one of gradual increase. Notably, the annual medians increase steadily, and the presence of occasional outliers becomes more frequent in recent years, suggesting enhanced variability or increased observational sensitivity. Together, these visualizations support the conclusion that atmospheric CO₂ levels at the mid-Atlantic AZR station are increasing in accordance with global observations. They further underscore the value of long-term, high-precision monitoring networks in detecting both broad trends and fine-scale variations in greenhouse gas concentrations.
The identification of distinct periodicities in the CO₂ time series at the Azores site offers insight into the multiscale processes governing atmospheric carbon variability in an oceanic island context.
4.3. Seasonal Cycle in Atmospheric CO2
The ~12-month cycle detected in the residual component Figure 5, is consistent with the well-established seasonal variability of atmospheric CO₂ [5]. While expected, its clear identification after decomposition confirms the ability of the CBP framework to recover known periodicities, thereby reinforcing confidence in the detection of subtler low-frequency signals such as the decadal oscillation. This seasonal pattern also provides a baseline for comparing the amplitude and phase of CO₂ variability at the Azores with other oceanic monitoring sites, and for assessing potential regional influences from environmental drivers such as sea surface temperature (SST) anomalies, vegetation dynamics, and large-scale climate oscillations (e.g., ENSO, NAO) [18,19,20].
By validating the methodology and ensuring the separation of high- and low-frequency variability, the seasonal signal serves as a reference point for interpreting the more complex decadal-scale variability examined in Section 4.4.
4.4. Decadal Signal in the Trend Component of Atmospheric CO₂
The spectral analysis of the low-frequency trend component revealed a statistically significant enhancement in power at a periodicity of approximately 10 to 11 years. Rather than a sharply defined peak, the signal presents as a broad low-frequency feature, suggesting the presence of persistent long-term variability. This decadal-scale behavior, embedded within the background trend, is unlikely to result from stochastic noise, as confirmed by a Monte Carlo test (p < 0.001) and clearly illustrated in Figure 6.
Additional control analyses were performed to evaluate the robustness of this signal. A synthetic quadratic trend, mimicking the long-term acceleration of CO₂ but without oscillations, reproduced much of the low-frequency enhancement, indicating that the raw spectrum partly reflects the background growth. After polynomial detrending, however, a weak but statistically significant oscillation remained in the 9–12 year band, with an amplitude of only ~0.26 ppm peak-to-peak. These calculations were carried out but are not shown in detail here, following standard procedures.
The identification of this low-frequency oscillation raises the possibility that large-scale climate modes, such as the Atlantic Multidecadal Oscillation (AMO) and the North Atlantic Oscillation (NAO), modulate atmospheric CO₂ variability at the Azores site. Both have been shown to influence ocean–atmosphere CO₂ exchange by altering wind patterns, surface temperatures, and upper-ocean circulation in the North Atlantic [25,26]. The signal may thus reflect climate-induced variations in the rate at which the ocean absorbs or releases CO₂ on multiyear timescales.
In addition to surface exchange processes, longer-term changes in the storage of anthropogenic CO₂ in North Atlantic water masses may also contribute to the observed decadal variability [27]. Oceanic warming, in particular, reduces CO₂ solubility and can disrupt air–sea gas exchange, further amplifying long-term fluctuations in atmospheric CO₂ concentrations [28].
Although these decadal oscillations do not drive the overall upward trend in CO₂, they can modulate the pace of accumulation, creating temporary accelerations or slowdowns that complicate linear trend interpretation. Identifying such oscillatory behavior is therefore essential for understanding natural variability superimposed on anthropogenic forcing and for improving long-term projections of the carbon cycle.
The coexistence of seasonal and decadal cycles revealed in the trend and residual components calls for a comparative assessment. We address this in the following section through a joint interpretation of their CBP spectra.
4.5. Comparison of Seasonal and Decadal Cycles in the CBP Spectrum
The CBP spectra of the residual and trend components Figure 7, reveal distinct dominant periodicities: a ~12-month seasonal cycle in the residual component and a broad low-frequency enhancement (~10–11 years) in the trend component. The seasonal signal likely reflects biospheric activity and hemispheric-scale atmospheric transport patterns, consistent with long-range temporal correlations and scaling behavior reported in CO₂ records [29]. The decadal variability is compatible with large-scale climate modes such as the Atlantic Multidecadal Oscillation (AMO) and North Atlantic Oscillation (NAO), which can modulate ocean–atmosphere CO₂ fluxes through changes in wind regimes, sea surface temperature, and upper-ocean circulation [26] and [30,31,32,33].
The coexistence of these two periodicities highlights the multiscale nature of atmospheric CO₂ variability at the AZR site. Seasonal and decadal oscillations arise from distinct physical mechanisms and operate on different time scales, but together they shape the temporal structure of background CO₂. Recognizing and separating these signals is essential for improving model representations of the carbon cycle and for distinguishing natural variability from the persistent anthropogenic trend. This multiscale perspective provides the basis for examining decadal trends in CO₂ accumulation, as discussed in Section 4.6.
4.6. Decadal Trends in CO₂ Accumulation
Average annual growth rates for successive decadal and sub-decadal periods were calculated from annual mean CO₂ concentrations at the AZR site using segmented linear regression. The results, summarized in Table 2 and Table 3, reveal a statistically significant acceleration in CO₂ accumulation over the last four decades.
At the AZR site, the growth rate increased from 1.33 ppm/year in the 1980s to 2.24 ppm/year in the 2010s, with a slight decrease to 2.16 ppm/year in the 2020–2024 period. This small decline remains within the margin of error and does not indicate a reversal of the long-term trend. Similar behavior was observed in the Mauna Loa series, where the growth rate rose from 1.57 ppm/year in the 1980s to 2.54 ppm/year in the most recent period. These findings confirm the persistent and accelerating nature of atmospheric CO₂ accumulation at both regional and global scales.
Segmented regression by period offers a more accurate depiction of the long-term trend compared to fitting a single linear model across the entire time series. This approach avoids bias caused by recent acceleration and allows the identification of inflection points or regime shifts. The agreement between the AZR and Mauna Loa records further supports the representativeness of the Azores as a reliable location for monitoring background atmospheric CO₂ levels.
These decadal trends emphasize the importance of sustained long-term observations and highlight the anthropogenic nature of the observed increase, providing a robust basis for improving future carbon cycle projections.
4.7. Methodological Considerations
The combined use of pseudo-EMD decomposition and the Correlogram-Based Periodogram (CBP) provided a robust framework for isolating and quantifying both short- and long-term variability in nonstationary climate time series. Unlike traditional Fourier-based spectral analyses, CBP is well suited to short records and benefits from the use of non-parametric autocorrelation estimators such as Spearman’s rank.
Despite these advantages, CBP does not capture transient or evolving spectral features. In forecasting contexts, ARIMA-type models have been widely used for temperature and precipitation, but they rely on assumptions of stationarity and are not designed to detect hidden or multiscale periodicities, nor to assess the statistical significance of spectral peaks [34]. Alternative methods, such as wavelet transforms, are particularly effective in identifying multiscale and time-localized oscillations in nonstationary climate records [35]. Similarly, the discrete cosine transform (DCT) has been applied in spatial climate diagnostics to reduce spectral distortions from aperiodic boundaries [36].
The robustness of the present results was tested by re-running the decomposition and CBP analyses without interpolated values. The absence of significant differences in the location or magnitude of dominant peaks indicates that interpolation did not bias the detection of periodicities. Nonetheless, future studies could apply imputation methods optimized for autocorrelated climate time series to further validate this step.
The methodological framework applied here effectively identified dominant periodicities but would benefit from complementary time–frequency methods in future work, enabling the detection of non-stationary features whose amplitude or periodicity changes over time.
Based on these methodological considerations and the results obtained, the main conclusions of this study are presented in the following section.
5. Conclusions
This study applied a multiscale spectral approach, combining pseudo-EMD decomposition, Correlogram-Based Periodogram (CBP) analysis, and Monte Carlo significance testing, to characterize atmospheric CO₂ variability at the Azores site. By separating the monthly series into high- and low-frequency components, we identified distinct periodicities and quantified their contributions to long-term variability.
The residual component showed a robust seasonal cycle (~12 months) consistent with biospheric fluxes and ocean–atmosphere exchanges, while the trend component revealed a statistically significant decadal-scale oscillation (~11 years) likely linked to solar variability and large-scale climate modes such as the NAO and AMO. Additional tests (synthetic trend experiments, polynomial detrending, and band-pass filtering) confirmed that much of the raw low-frequency power reflects the accelerating background growth. A weak residual signal persisted in the 9–12 year band, but with an amplitude of only ~0.26 ppm peak-to-peak, far smaller than the anthropogenic increase. These calculations were carried out but are not detailed here, as they follow standard approaches. Segmented trend analysis demonstrated a sustained and accelerating increase in CO₂ accumulation over the past four decades at both the AZR site and Mauna Loa.
These findings demonstrate that atmospheric CO₂ variability in remote oceanic regions is shaped by both short-term biological processes and long-term climatic oscillations, underscoring the need to account for natural variability when interpreting trends and projecting future carbon dynamics.
The results highlight the value of long-term, high-quality measurements from remote stations such as the Azores for supporting global climate assessments, validating transport models, and informing climate policy. Future work should extend this framework to other observatories and greenhouse gases, integrating satellite observations (e.g., OCO-2, TROPOMI) and reanalysis data to better resolve spatial patterns and improve carbon-cycle modelling.
Author Contributions
For research articles with several authors, a short paragraph specifying their individual contributions must be provided. The following statements should be used “Conceptualization, M.G.M.; methodology, M.G.M. and H.C.V.; software, M.G.M.; validation, M.G.M., and H.C.V.; formal analysis, M.G.M.; investigation, M.G.M. and H.C.V.; resources, H.C.V.; data curation, M.G.M. and H.C.V.; writing—original draft preparation, M.G.M.; writing—review and editing, M.G.M. and H.C.V.; visualization, M.G.M. and H.C.V.; supervision, M.G.M. and H.C.V.; project administration, M.G.M.; funding acquisition, not applicable. All authors have read and agreed to the published version of the manuscript.” Please turn to the CRediT taxonomy for the term explanation. Authorship must be limited to those who have contributed substantially to the work reported.
Funding
This research received no external funding. The article processing charge (APC) was fully waived by Air as part of an official invitation to submit this manuscript.
Institutional Review Board Statement
Not applicable.
Informed Consent Statement
Not applicable.
Data Availability Statement
The CO₂ data used in this study are publicly available from the NOAA Global Monitoring Laboratory (GML) at https://gml.noaa.gov/aftp/data/trace_gases/co2/flask/surface/txt/co2_azr_surface-flask_1_ccgg_event.txt. (accessed on 26 April 2025).
Use of Artificial Intelligence
AI-assisted tools were not used in drafting any aspect of this manuscript.
Acknowledgments
The authors acknowledge the NOAA Global Monitoring Laboratory for providing the CO2 used in statistical analysis.
Conflicts of Interest
The authors declare no conflicts of interest.
Abbreviations
The following abbreviations are used in this manuscript:
| CO2 | Carbon dioxide |
| AZR | Azores (NOAA Global Monitoring Laboratory flask site) |
| NOAA | National Oceanic and Atmospheric Administration |
| GML | Global Monitoring Laboratory |
| WMO | World Meteorological Organization |
| CBP | Correlogram-Based Periodogram |
| EMD | Empirical Mode Decomposition |
| NDIR | Non-Dispersive Infrared (analyzer) |
| NAO | North Atlantic Oscillation |
| SSA | Singular Spectrum Analysis |
| FFT | Fast Fourier Transform |
| AR (1) | Autoregressive Model of Order 1 |
| SST | Sea Surface Temperature |
| IQR | Interquartile Range |
| ENSO | El Niño–Southern Oscillation |
| AMO | Atlantic Multidecadal Oscillation |
| ARIMA | Autoregressive Integrated Moving Average |
| DCT | Discrete Cosine Transform |
| OCO-2 | Orbiting Carbon Observatory-2. |
| TROPOMI | Tropospheric Monitoring Instrument |
References
- Keeling CD, Bacastow RB, Bainbridge AE, Ekdahl CA Jr, Guenther PR, Waterman LS, Chin JFS. (1976) Atmospheric carbon dioxide variations at Mauna Loa Observatory, Hawaii. Tellus, 28: 538-551. [CrossRef]
- Ciais P, C Sabine, G Bala, L Bopp, V Brovkin, J Canadell, A Chhabra, R DeFries, J Galloway, M Heimann, C Jones, C Le Quéré, RB Myneni, S Piao, P Thornton. (2013) Carbon and Other Biogeochemical Cycles. In: Climate Change 2013: The Physical Science Basis. Contribution of Working Group I to the Fifth Assessment Report of the Intergovernmental Panel on Climate Change [Stocker, T.F., D. Qin, G.-K. Plattner, M. Tignor, S.K. Allen, J. Boschung, A. Nauels, Y. Xia, V. Bex and P.M. Midgley (eds.)] pp. 465 - 570. Cambridge University Press, Cambridge, United Kingdom and New York, NY, USA.
- Mudelsee M. (2014) Climate time series analysis: Classical statistical and bootstrap methods. Springer. [CrossRef]
- Hasselmann K. (1976). Stochastic climate models: Part I. Theory. Tellus, 28(6), 473–485. [CrossRef]
- Keeling RF, & Graven HD. (2021) Insights from Time Series of Atmospheric Carbon Dioxide and Related Tracers. Annual Review of Environment and Resources, 46, 85–110. [CrossRef]
- Golkar, F., Al-Wardy, M., Saffari, S. F., Al-Aufi, K., & Al-Rawas, G. (2020) Using OCO-2 Satellite Data for Investigating the Variability of Atmospheric CO₂ Concentration in Relationship with Precipitation, Relative Humidity, and Vegetation over Oman. Water, 12(1), 101. [CrossRef]
- NOAA Global Monitoring Laboratory. (2024) Cooperative Global Air Sampling Network. National Oceanic and Atmospheric Administration. https://gml.noaa.gov/ccgg/flask.php.
- NOAA Global Monitoring Laboratory (2024). Carbon Cycle Greenhouse Gases – Measurement Techniques. National Oceanic and Atmospheric Administration. Available at: https://gml.noaa.gov/ccgg/about/co2_measurements_ndir.html.
- Mann, M. E. (2004) On smoothing potentially non-stationary climate time series. Geophysical Research Letters, 31(7), L07214. [CrossRef]
- Grieser J, Trömel S, Schönwiese CD. (2002) Statistical time series decomposition into significant components and application to European temperature. Theor Appl Climatol 71, 171–183. [CrossRef]
- Deng C. (2014) Time Series Decomposition Using Singular Spectrum Analysis (Master’s thesis, East Tennessee State University). https://dc.etsu.edu/etd/2352.
- Nweke CJ, Mbaeyi GC, Ojide KC, Elem-Uche O, & Nwebe OS 2019. A Descriptive Time Series Analysis Applied to the Fit of Carbon-Dioxide (CO2). Bulletin of Mathematical Sciences and Applications.
- Yiou P, Baert E, Loutre, MF. (1996) Spectral analysis of climate data. Surveys in Geophysics, 17(6), 619–663. [CrossRef]
- Ghil M, Allen MR, Dettinger M D, Ide K, Kondrashov D, Mann M E, ... & Yiou P. (2002) Advanced spectral methods for climatic time series. Reviews of Geophysics, 40(1), 3-1–3-41. [CrossRef]
- Mudelsee, M. (2019) Trend analysis of climate time series: A review of methods. Earth-Science Reviews, 190, 310–322. [CrossRef]
- Mrkvička T, Soubeyrand S, Myllymäki M, Grabarnik P, Hahn U. (2016) Monte Carlo testing in spatial statistics, with applications to spatial residuals. Spatial Statistics, 18, 40–53. [CrossRef]
- Allen MR, & Smith LA (1996). Monte Carlo SSA: Detecting Irregular Oscillations in the Presence of Colored Noise. Journal of Climate, 9(12), 3373–3404. [CrossRef]
- Savage AC, Arbic BK, Alford MH, Ansong JK, Farrar JT, Menemenlis D, ... Zamudio L (2017). Spectral decomposition of internal gravity wave sea surface height in global models. Journal of Geophysical Research: Oceans, 122(10), 7803–7821. [CrossRef]
- Girach AI, Ponmalar M, Murugan S, Rahman PA, Babu SS and Ramachandran R. (2022) “Applicability of Machine Learning Model to Simulate Atmospheric CO₂ Variability,” in IEEE Transactions on Geoscience and Remote Sensing, vol. 60, pp. 1-6, Art no. 4107306, doi: 10.1109/TGRS.2022.3157774.
- He W, Jiang F, Ju W, Byrne B, Xiao J, Nguyen N. T, et al. (2023) Do state-of-the-art atmospheric CO₂ inverse models capture drought impacts on the European land carbon uptake? Journal of Advances in Modeling Earth Systems, 15(6), e2022MS003150. [CrossRef]
- Scafetta, N., & West, B. J. (2006) Phenomenological reconstructions of the solar signature in the Northern Hemisphere surface temperature records since 1600. Journal of Geophysical Research: Atmospheres, 111(D12). [CrossRef]
- Trenberth, K. E., & Hurrell, J. W. (1994) Decadal atmosphere–ocean variations in the Pacific. Climate Dynamics, 9(6), 303–319. [CrossRef]
- Torrence, C., & Compo, G. P. (1998) A practical guide to wavelet analysis. Bulletin of the American Meteorological Society, 79(1), 61–78. [CrossRef]
- NOAA Global Monitoring Laboratory. (2023). Carbon Dioxide Air Standards. Retrieved August 1, 2025, from https://gml.noaa.gov/ccl/airstandard.html.
- Thomas, H., A. E. Friederike Prowe, I. D. Lima, S. C. Doney, R. Wanninkhof, R. J. Greatbatch, U. Schuster, A. Corbière. (2008) Changes in the North Atlantic Oscillation influence CO2 uptake in the North Atlantic over the past 2 decades, Global Biogeochem. Cycles, 22, GB4027, doi:10.1029/2007GB003167.
- Lüger H, Wanninkhof R, Wallace DWR, & Körtzinger A. (2006) CO₂ fluxes in the subtropical and subarctic North Atlantic based on measurements from a volunteer observing ship. Journal of Geophysical Research: Oceans, 111(C6), C06024. [CrossRef]
- Pérez, F. F., Vázquez-Rodríguez, M., Mercier, H., Velo, A., Lherminier, P., Ríos, A. F. (2010) Trends of anthropogenic CO2 storage in North Atlantic water masses, Biogeosciences, 7, 1789–1807, . [CrossRef]
- Resplandy L, Keeling RF, Eddebbar Y, et al. (2019) Quantification of ocean heat uptake from changes in atmospheric O₂ and CO₂ composition. Scientific Reports, 9, 20244. [CrossRef]
- Varotsos C, Assimakopoulos MN, & Efstathiou M. (2007) Technical Note: Long-term memory effect in the atmospheric CO₂ concentration at Mauna Loa. Atmospheric Chemistry and Physics, 7, 629–634. [CrossRef]
- Thejll P A. (2001) Decadal power in land air temperatures: Is it statistically significant? Journal of Geophysical Research: Atmospheres, 106(D23), 31693–31702. [CrossRef]
- Zanchettin D, Bothe O, Graf HF, Jansen E, Luterbacher J, Timmreck C, Xoplak, E. (2016) Background conditions influence the decadal climate response to strong volcanic eruptions. Climate Dynamics, 46(7–8), 2241–2262. [CrossRef]
- Hao, X., Sein, D. V., Spiegl, T., Niu, L., Chen, X., Lohmann, G. (2025) Modeling the Atlantic Multidecadal Oscillation: The high-resolution ocean brings the timescale; the atmosphere, the amplitude. Ocean–Land–Atmosphere Research, 4, Article 0085. [CrossRef]
- Fu Z, Dong J, Zhou Y, Stoy PC & Niu S. (2017) Long-term trend and interannual variability of land carbon uptake—the attribution and processes. Environmental Research Letters, 12(1), 014018. [CrossRef]
- Dimri T, Ahmad S, & Sharif M. (2020) Time series analysis of climate variables using seasonal ARIMA approach. Journal of Earth System Science, 129(149). [CrossRef]
- Lau KM, & Weng H. (1995) Climate signal detection using wavelet transform: How to make a time series sing. Bulletin of the American Meteorological Society, 76(12), 2391–2402. [CrossRef]
- Denis B, Côté J, Laprise R. (2002) Spectral decomposition of two-dimensional atmospheric fields on limited-area domains using the discrete cosine transform (DCT). Monthly Weather Review, 130(7), 1812–1829. [CrossRef]
Figure 1.
Location of the AZR surface flask sampling site in the Azores archipelago, North Atlantic Ocean. The station is located on Terceira Island (Central Group) at 38.7660° N, 27.3750° W, with an elevation of 19.00 meters above sea level (masl). The archipelago comprises nine volcanic islands grouped into Western, Central, and Eastern groups. The AZR station is part of NOAA’s Cooperative Global Air Sampling Network and provides long-term observations of marine boundary layer carbon dioxide (CO₂) concentrations under minimal continental influence.
Figure 1.
Location of the AZR surface flask sampling site in the Azores archipelago, North Atlantic Ocean. The station is located on Terceira Island (Central Group) at 38.7660° N, 27.3750° W, with an elevation of 19.00 meters above sea level (masl). The archipelago comprises nine volcanic islands grouped into Western, Central, and Eastern groups. The AZR station is part of NOAA’s Cooperative Global Air Sampling Network and provides long-term observations of marine boundary layer carbon dioxide (CO₂) concentrations under minimal continental influence.
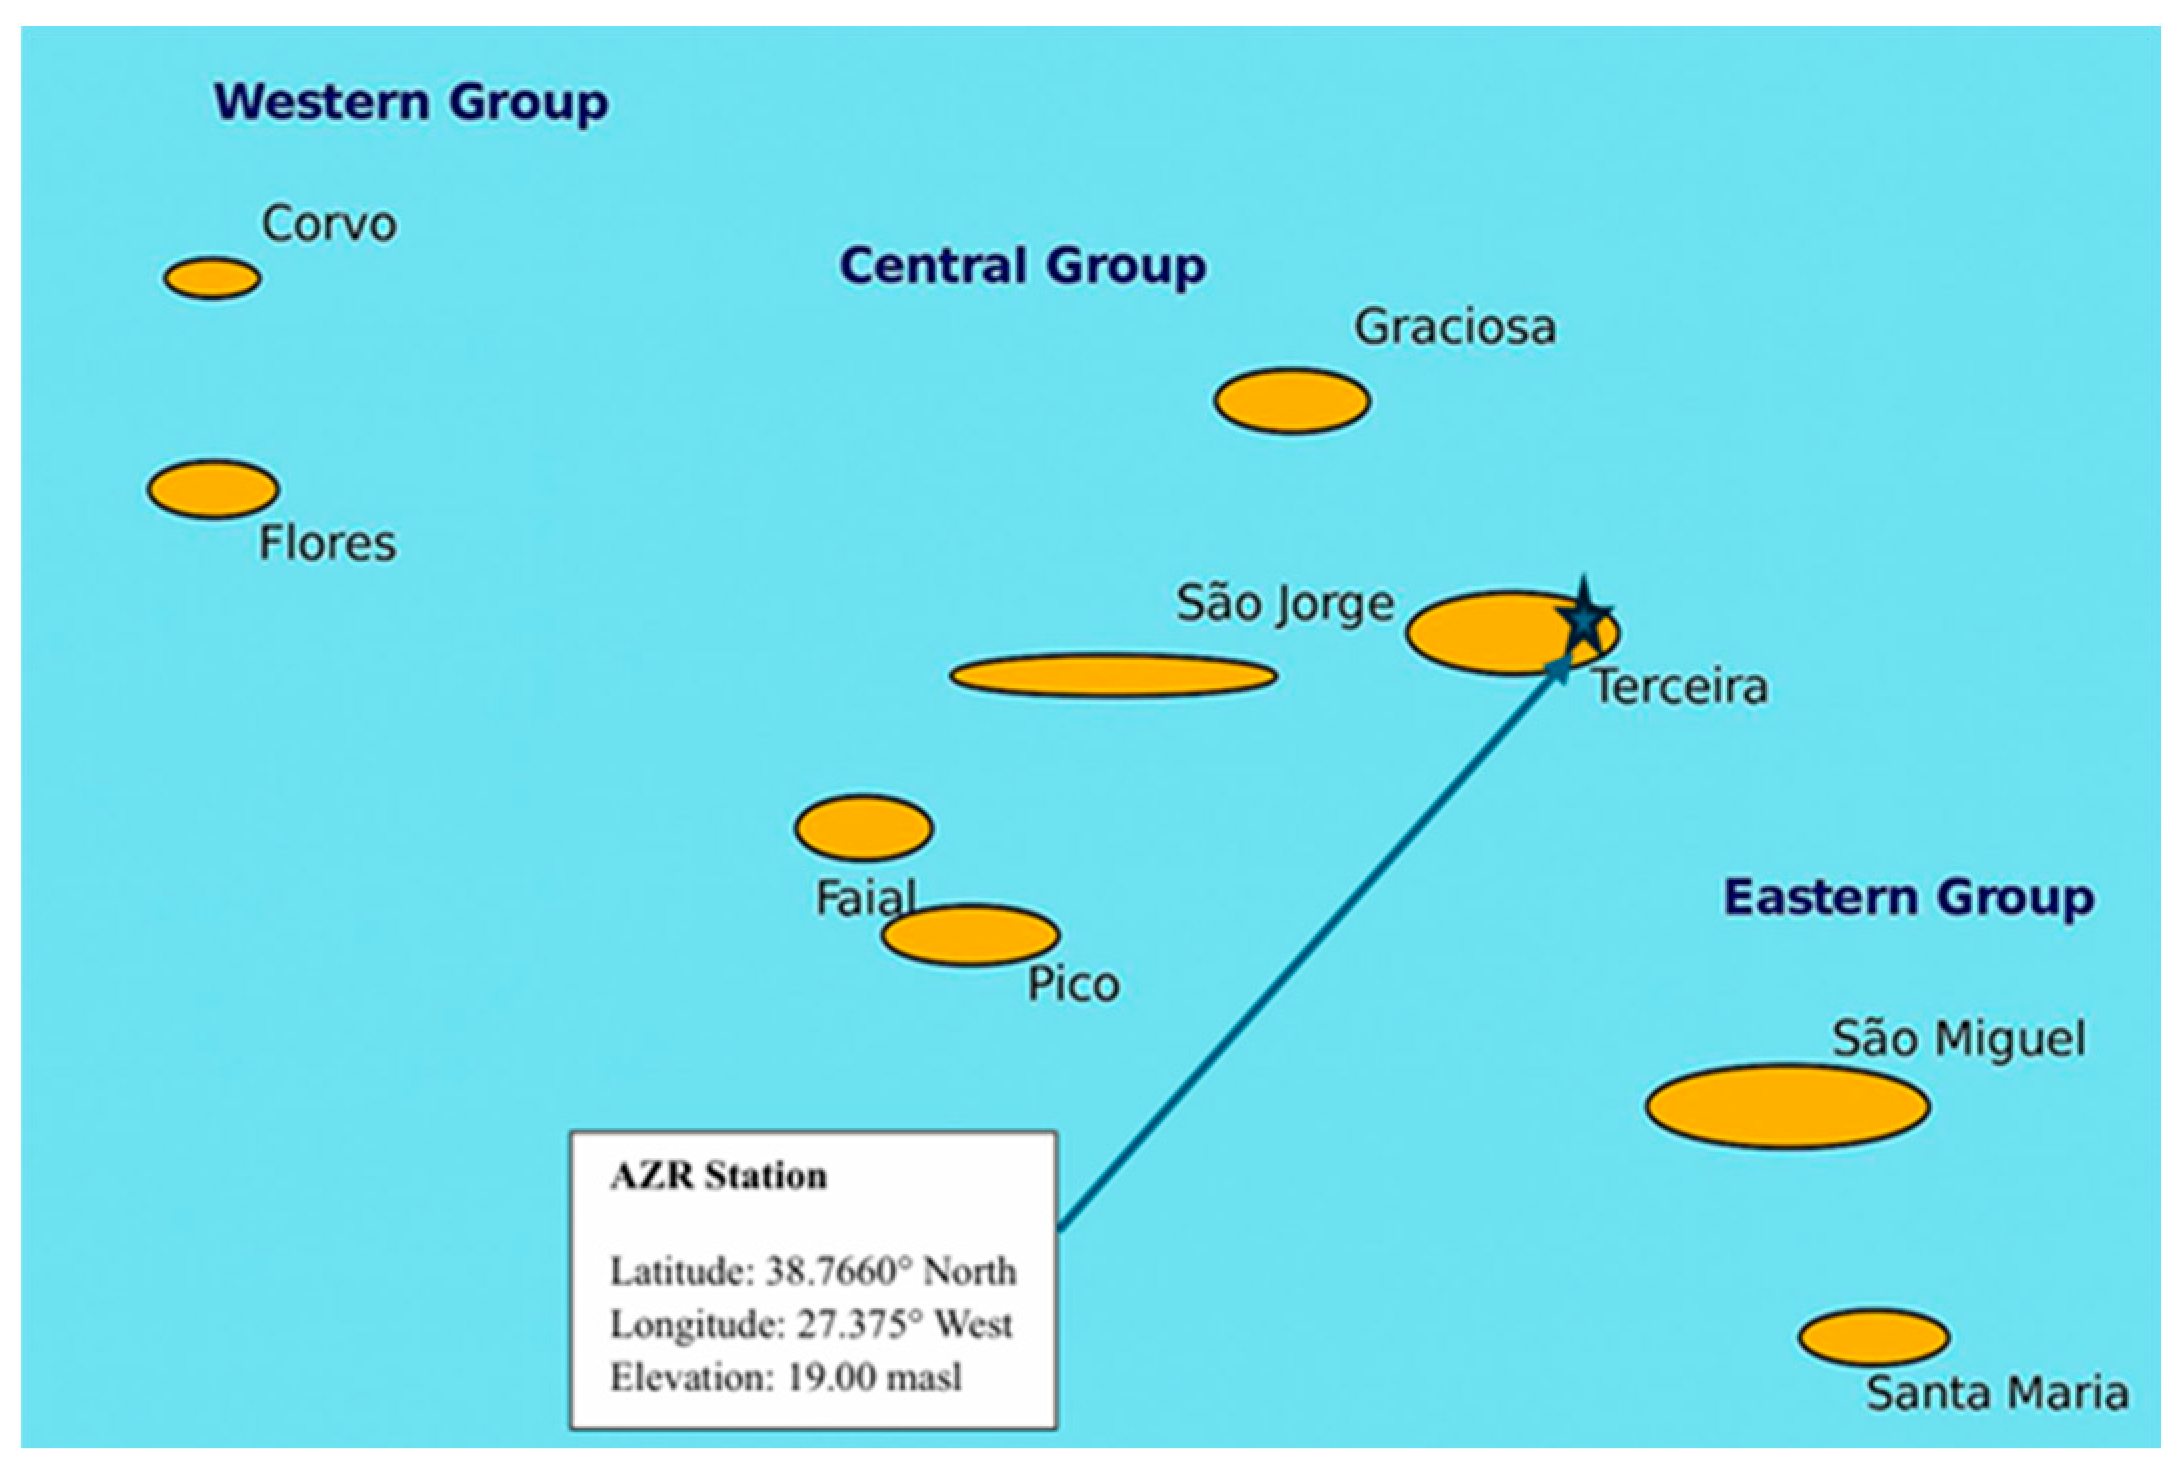
Figure 2.
Monthly atmospheric CO₂ concentrations at the AZR surface flask site (1980–2024). Observed data are shown in navy; interpolated values are highlighted in orange. The series illustrates seasonal variability and a long-term increasing trend.
Figure 2.
Monthly atmospheric CO₂ concentrations at the AZR surface flask site (1980–2024). Observed data are shown in navy; interpolated values are highlighted in orange. The series illustrates seasonal variability and a long-term increasing trend.
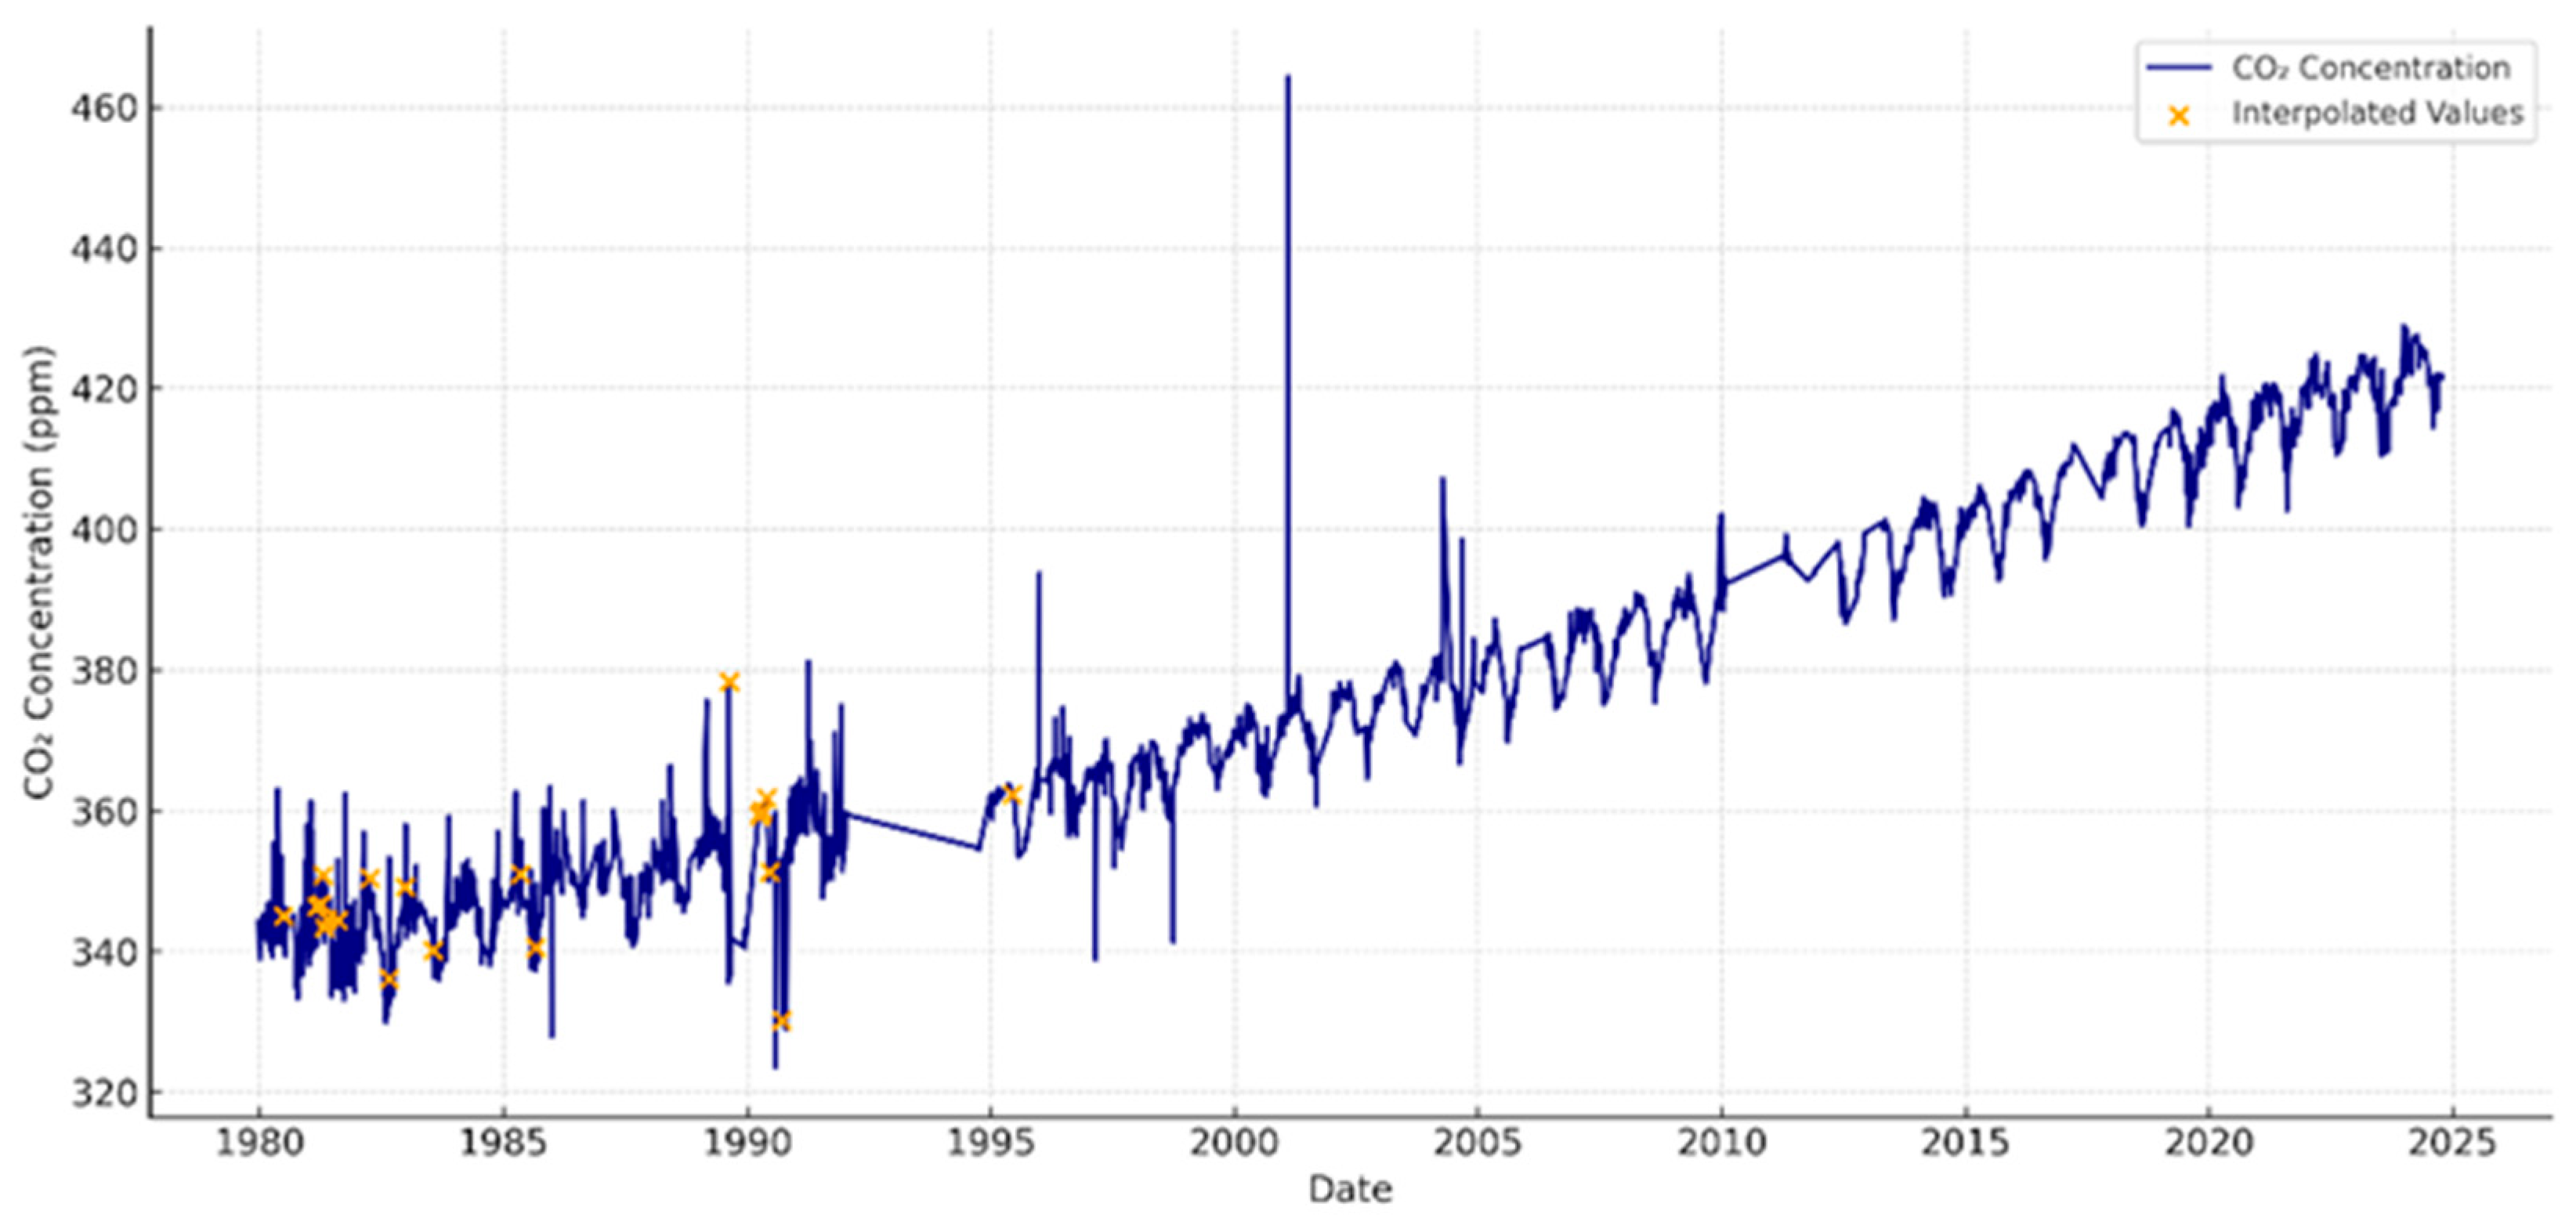
Figure 3.
Decadal distribution of atmospheric CO₂ concentrations measured at the AZR surface flask site (Azores). Boxplots represent the interquartile range (IQR) for each decade, with the horizontal line indicating the median. Whiskers extend to the minimum and maximum values within 1.5×IQR, while values beyond this range are shown as potential outliers. The plot illustrates a persistent rise in atmospheric CO₂ over successive decades, consistent with global trends driven primarily by anthropogenic emissions.
Figure 3.
Decadal distribution of atmospheric CO₂ concentrations measured at the AZR surface flask site (Azores). Boxplots represent the interquartile range (IQR) for each decade, with the horizontal line indicating the median. Whiskers extend to the minimum and maximum values within 1.5×IQR, while values beyond this range are shown as potential outliers. The plot illustrates a persistent rise in atmospheric CO₂ over successive decades, consistent with global trends driven primarily by anthropogenic emissions.
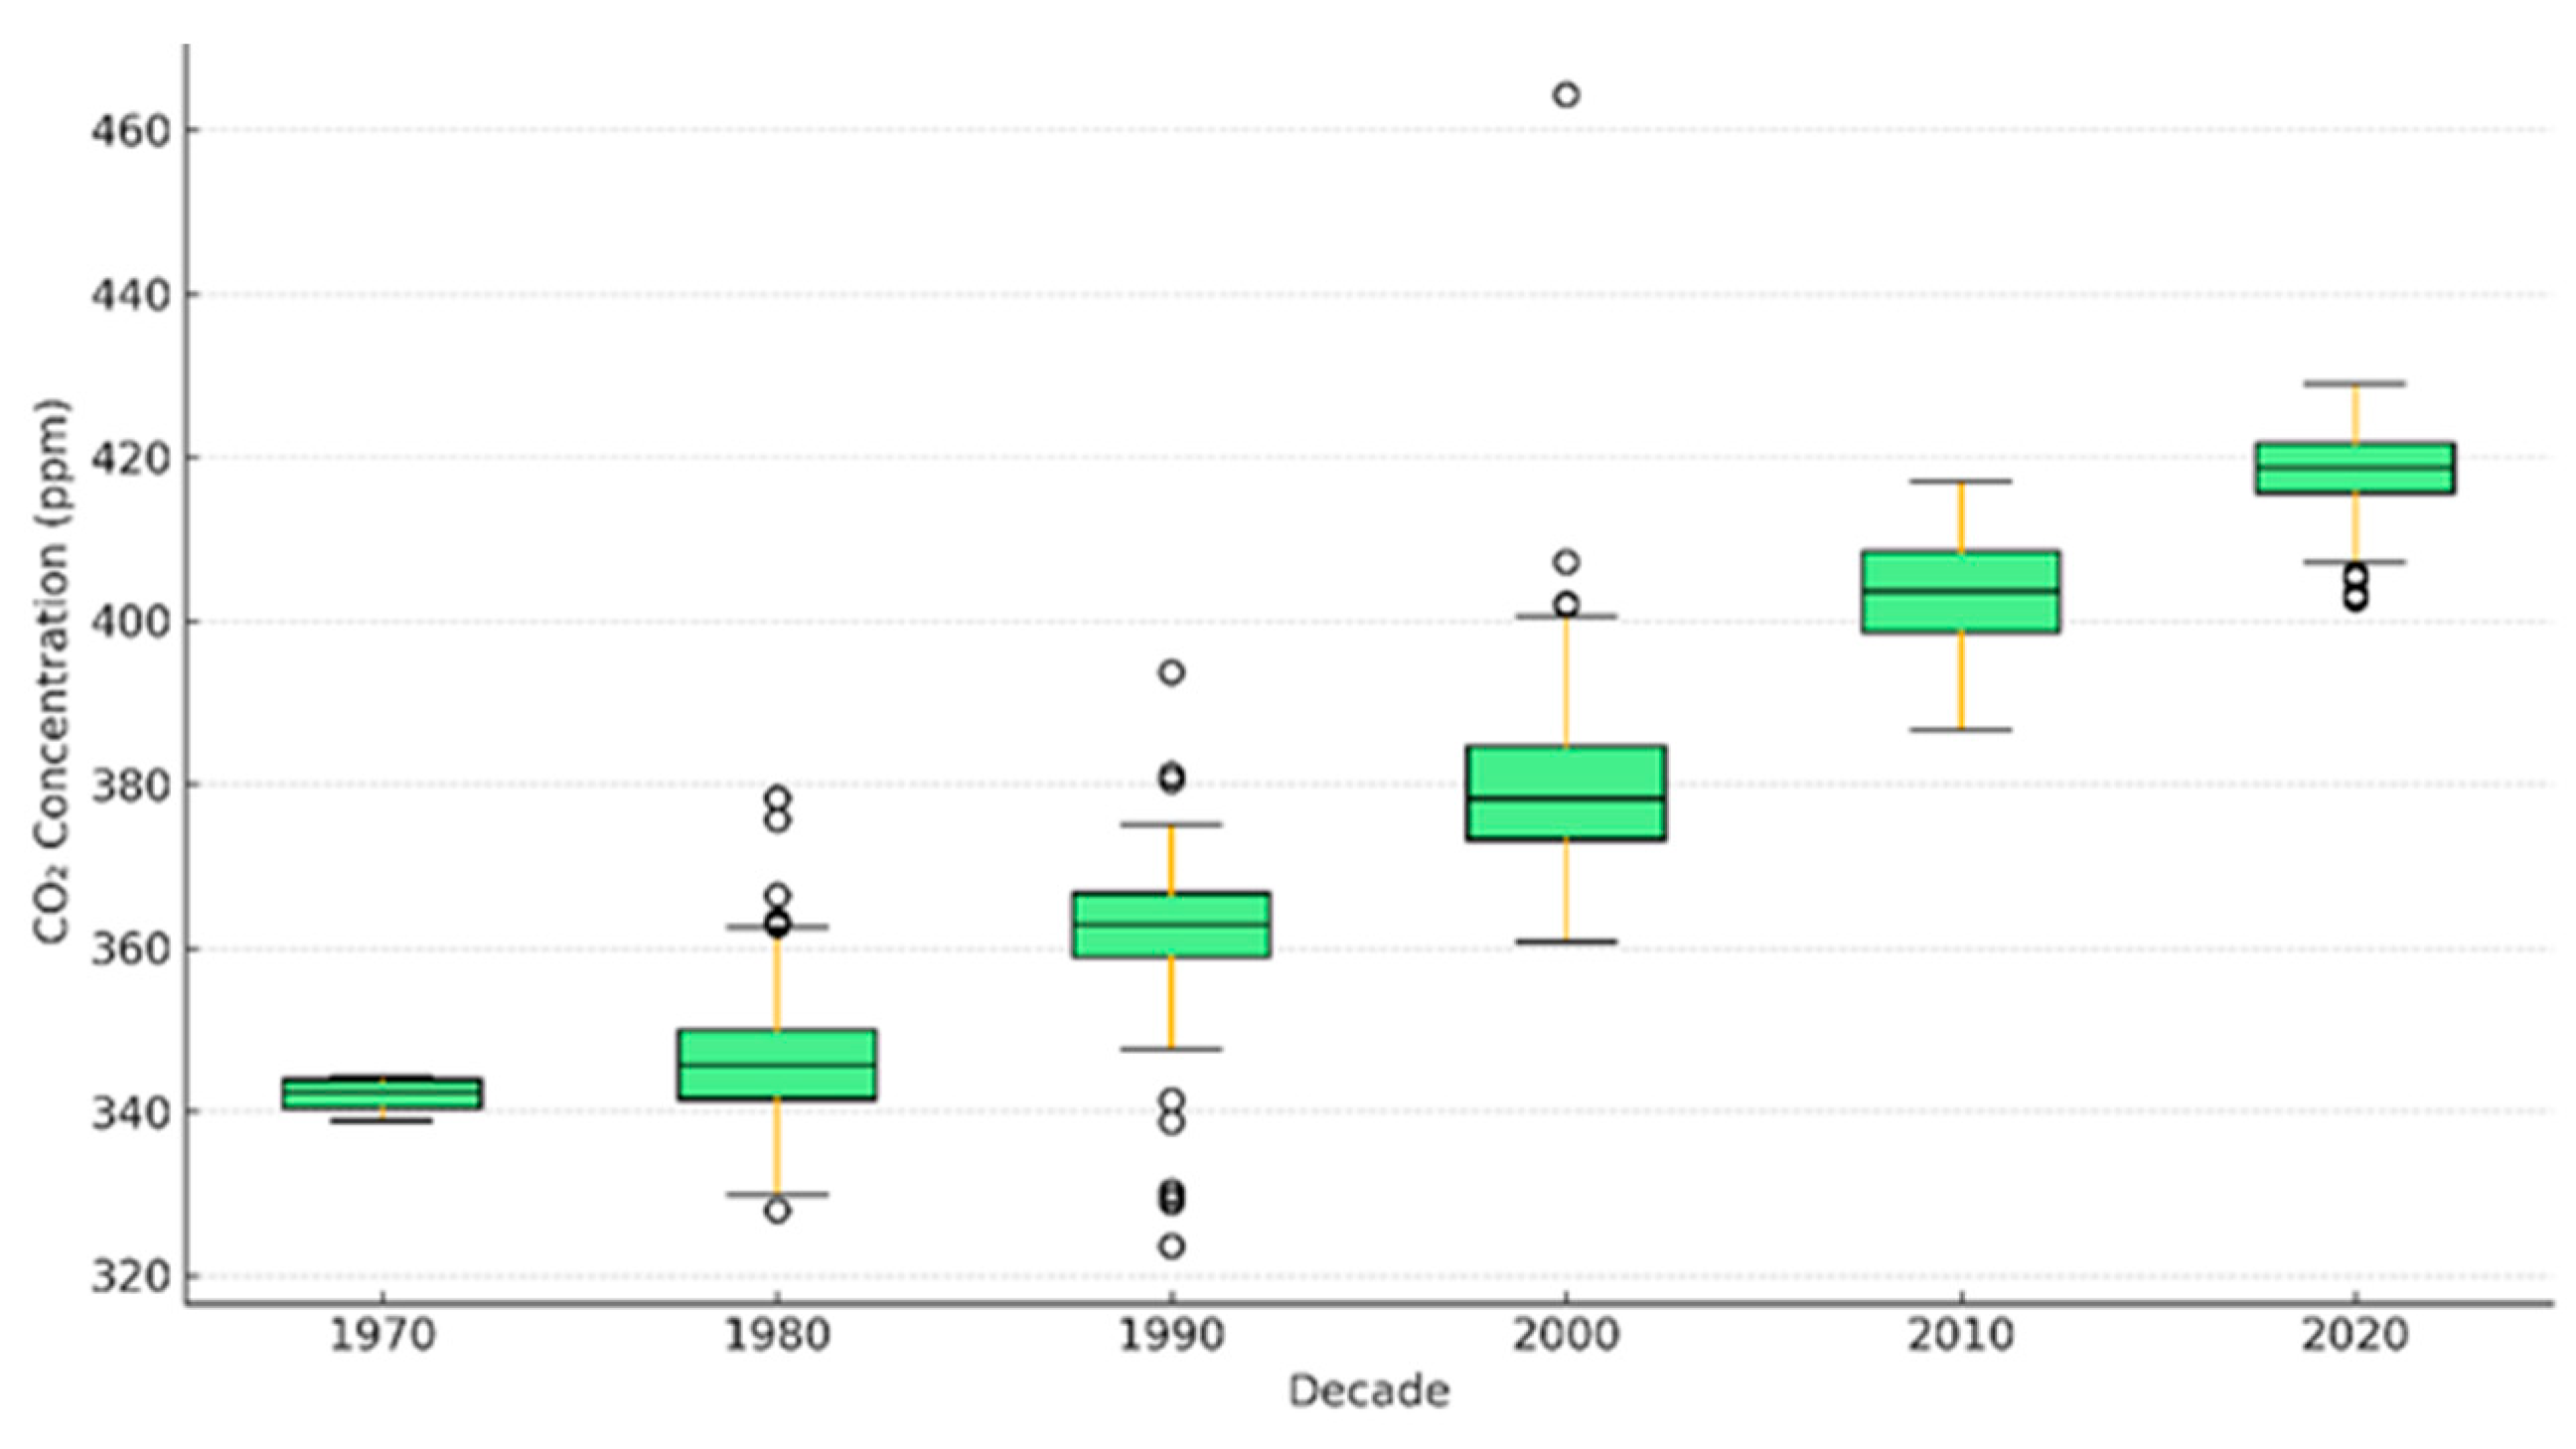
Figure 4.
Yearly distribution of atmospheric CO₂ concentrations measured at the AZR surface flask site (Azores). Each box represents the interquartile range (IQR) for a given year, with the horizontal line indicating the median CO₂ concentration. Whiskers extend to the minimum and maximum values within 1.5×IQR, while individual points beyond this range are shown as potential outliers. The plot illustrates interannual variability superimposed on a persistent long-term upward trend.
Figure 4.
Yearly distribution of atmospheric CO₂ concentrations measured at the AZR surface flask site (Azores). Each box represents the interquartile range (IQR) for a given year, with the horizontal line indicating the median CO₂ concentration. Whiskers extend to the minimum and maximum values within 1.5×IQR, while individual points beyond this range are shown as potential outliers. The plot illustrates interannual variability superimposed on a persistent long-term upward trend.
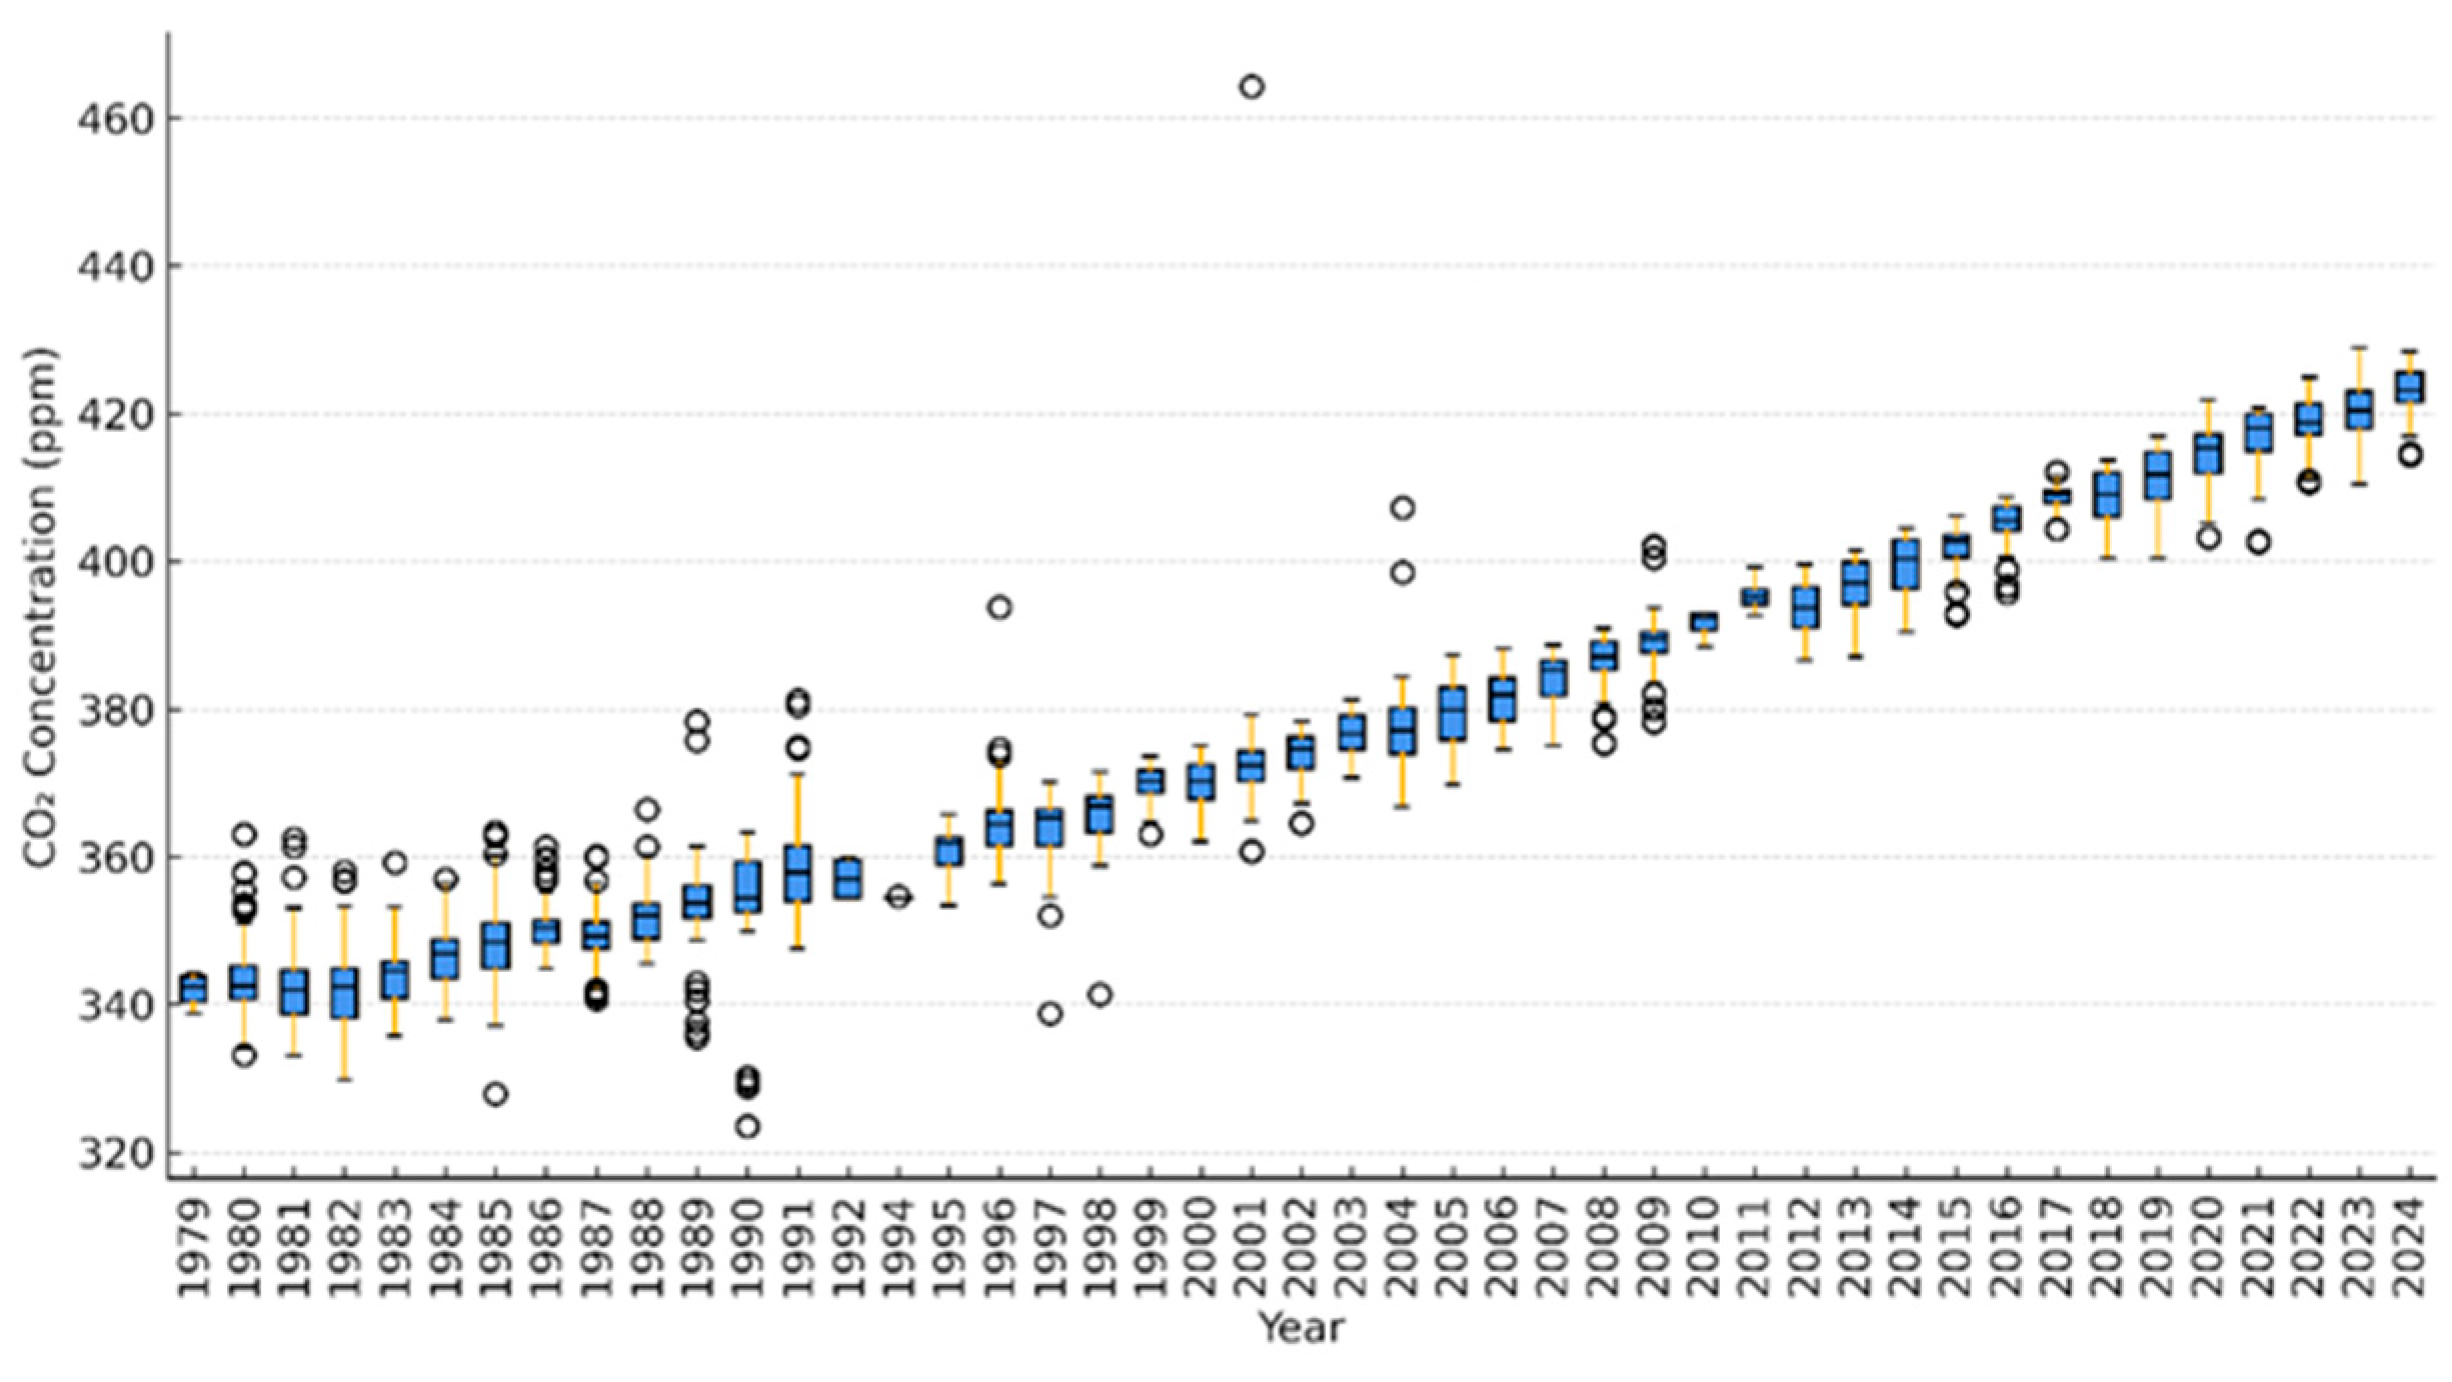
Figure 5.
Correlogram-Based Periodogram (CBP) of the residual component of the monthly CO₂ time series at the AZR surface flask site (Azores), computed using a maximum lag of 120 months. The residual series was obtained by subtracting a low-frequency trend extracted via a Butterworth low-pass filter (cutoff = 0.05 cycles/month). A significant spectral peak is observed at a frequency corresponding to a 12-month period, indicative of a strong seasonal cycle. The significance of this peak was confirmed via a Monte Carlo simulation with 1,000 randomized series, yielding a p-value < 0.001.
Figure 5.
Correlogram-Based Periodogram (CBP) of the residual component of the monthly CO₂ time series at the AZR surface flask site (Azores), computed using a maximum lag of 120 months. The residual series was obtained by subtracting a low-frequency trend extracted via a Butterworth low-pass filter (cutoff = 0.05 cycles/month). A significant spectral peak is observed at a frequency corresponding to a 12-month period, indicative of a strong seasonal cycle. The significance of this peak was confirmed via a Monte Carlo simulation with 1,000 randomized series, yielding a p-value < 0.001.
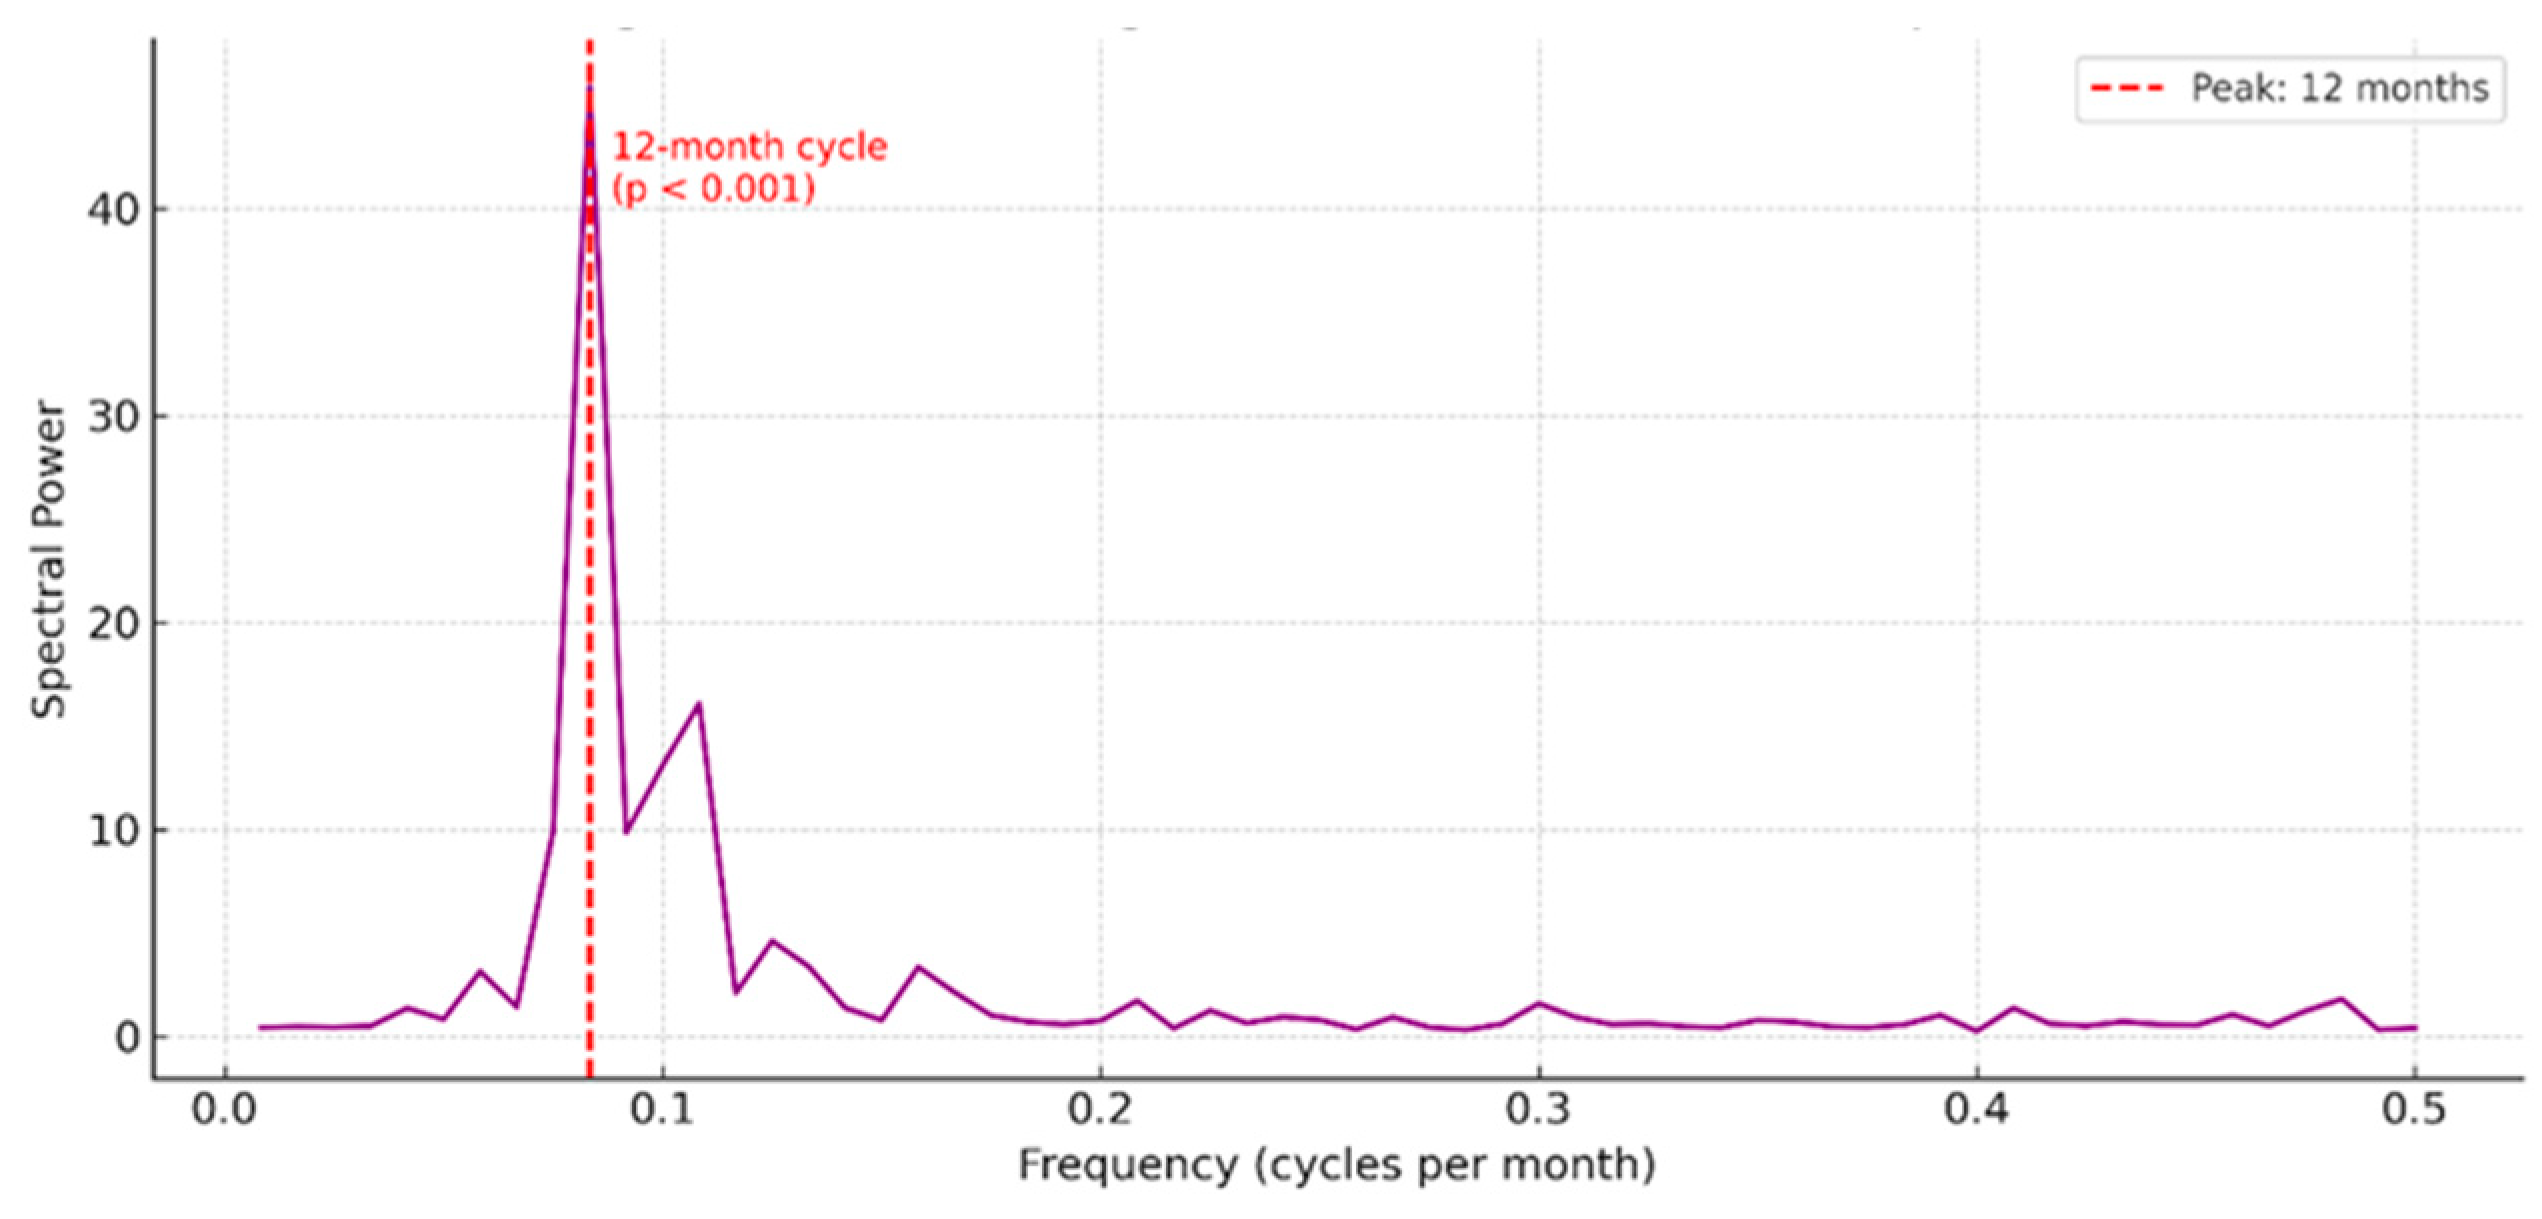

Table 1.
Descriptive statistics of atmospheric CO₂ concentrations measured at the AZR surface flask site (Azores). The table includes measures of central tendency, dispersion, and distribution shape, based on 3149.0 valid observations spanning multiple decades.
Table 1.
Descriptive statistics of atmospheric CO₂ concentrations measured at the AZR surface flask site (Azores). The table includes measures of central tendency, dispersion, and distribution shape, based on 3149.0 valid observations spanning multiple decades.
| Statistics | CO₂ (ppm) |
| Count | 3149.0 |
| Mean | 374,8 |
| Minimum | 323,5 |
| 25th Percentile (Q1) | 351,1 |
| Median (Q2) | 370,2 |
| 75th Percentile (Q3) | 398,9 |
| Maximum | 464,3 |
| Range | 140,8 |
| Interquartile Range (IQR) | 47,8 |
| Skewness | 0,4 |
| Kurtosis | -1,1 |
Table 2.
Decadal and recent-period trends in atmospheric CO₂ concentrations at the AZR station (1980–2024).
Table 2.
Decadal and recent-period trends in atmospheric CO₂ concentrations at the AZR station (1980–2024).
| Period | Growth Rate (ppm/year) | Standard Error | R² | p-value |
| 1980–1989 | 1.33 | ±0.16 | 0.89 | 3.95e-05 |
| 1990–1999 | 1.57 | ±0.29 | 0.8 | 0.00105 |
| 2000–2009 | 1.99 | ±0.08 | 0.99 | 8.89e-09 |
| 2010–2019 | 2.24 | ±0.16 | 0.96 | 5.27e-07 |
| 2020–2024 | 2.16 | ±0.19 | 0.98 | 0.00138 |
Table 3.
Decadal and recent-period trends in atmospheric CO₂ concentrations at the Mauna Loa station (1980–2024).
Table 3.
Decadal and recent-period trends in atmospheric CO₂ concentrations at the Mauna Loa station (1980–2024).
| Period | Growth Rate (ppm/year) | Standard Error | R² | p-value |
| 1980–1989 | 1.57 | ±0.10 | 0.95 | 2.1e-06 |
| 1990–1999 | 1.52 | ±0.09 | 0.97 | 6.7e-07 |
| 2000–2009 | 1.93 | ±0.07 | 0.99 | 3.2e-09 |
| 2010–2019 | 2.43 | ±0.05 | 0.99 | 7.8e-10 |
| 2020–2024 | 2.54 | ±0.08 | 0.99 | 3.4e-04 |
Disclaimer/Publisher’s Note: The statements, opinions and data contained in all publications are solely those of the individual author(s) and contributor(s) and not of MDPI and/or the editor(s). MDPI and/or the editor(s) disclaim responsibility for any injury to people or property resulting from any ideas, methods, instructions or products referred to in the content. |
© 2025 by the authors. Licensee MDPI, Basel, Switzerland. This article is an open access article distributed under the terms and conditions of the Creative Commons Attribution (CC BY) license (http://creativecommons.org/licenses/by/4.0/).
Copyright: This open access article is published under a Creative Commons CC BY 4.0 license, which permit the free download, distribution, and reuse, provided that the author and preprint are cited in any reuse.


