
Submitted:
30 August 2025
Posted:
02 September 2025
You are already at the latest version
Abstract
This paper introduces ARCI′ (Adjusted Rural Connectivity Index), a novel graph-theoretic metric designed to evaluate and optimize sparse networks by balancing construction cost and population coverage. Traditional minimum spanning tree (MST) approaches focus solely on minimizing cost, often neglecting social factors such as population distribution. ARCI′ incorporates a penalty factor to weigh network cost against population served, allowing flexible prioritization. We analyze ARCI′ mathematically, study its sensitivity to the penalty parameter, and demonstrate its utility through computational experiments on synthetic network data. Our results highlight ARCI′ as a promising metric for multi-objective network design in rural infrastructure, sensor placement, and related fields.
Keywords:
graph theory
; minimum spanning tree
; network optimization
; rural connectivity
; multi-objective index
; ARCI
1. Introduction
1.1. Background
Network design is a fundamental problem in applied mathematics, operations research, and computer science [1,2]. Applications include transportation planning, communication systems, power grid construction, and sensor deployment [3,4]. A common mathematical model for such problems is the weighted graph, where nodes represent locations (e.g., villages or substations), edges represent potential connections, and weights capture construction costs, distances, or other resources [5].
The Minimum Spanning Tree (MST) problem is a classical formulation that seeks to minimize the total edge cost while ensuring full network connectivity [6,7]. MST-based methods are widely used because they are computationally efficient and guarantee minimum cost. However, they neglect additional objectives such as service quality, population distribution, or redundancy [8,9]. In many real-world contexts—especially rural infrastructure planning—minimizing cost alone may lead to networks that are cheap but socially suboptimal [10].
1.2. Motivation
Rural regions in developing countries often face limited budgets for infrastructure projects (roads, electricity, telecommunication). Governments must balance two competing priorities:
- Cost minimization, to stay within budget constraints.
Current network indices and optimization approaches do not always provide a direct mathematical measure for this trade-off [13].
1.3. Objective
This paper proposes ARCI′ (Adjusted Rural Connectivity Index), a new graph-theoretic index that explicitly integrates cost and population served. By adjusting a penalty parameter α\alphaα, ARCI′ enables planners to explore different trade-offs between cost efficiency and social benefit.
1.4. Contributions
- Definition: We formally define ARCI′ as a cost-penalized connectivity index.
- Analysis: We investigate its mathematical behavior, including sensitivity to the penalty parameter.
- Simulation: We evaluate ARCI′ on synthetic network data and compare it with standard MST metrics.
- Application Potential: We discuss its relevance to rural road planning, sensor networks, and related infrastructure problems.
Section 2: Definition of ARCI′
2.1. Graph Model
Let G= (V, E) be a connected, undirected weighted graph, where V is the set of nodes, E is the set of edges, and each edge e ∈ E has:
2.2. ARCI′ Definition
The Adjusted Rural Connectivity Index (ARCI′) for a connected subgraph H ⊆ G is:
ARCI′ (H, α) = where α>1 is a penalty parameter controlling cost sensitivity [16].
2.3. Interpretation
- Higher population coverage → higher ARCI′.
- Higher cost → lower ARCI′ (penalized exponentially by α).
-
The parameter α determines the trade-off:
- ∘
- α≈1.0: low-cost penalty.
- ∘
- α>1.5: strong cost penalty.
2.4. Properties
- Positivity: ARCI′>0 for any connected graph.
- Monotonicity: ARCI′ decreases as α increases (for fixed cost and population).
- Scaling: If all edge costs are multiplied by k>0, then
ARCI′ (H, α) →
Thus, ARCI′ scales as .
Section 3: Experimental Results
3.1. Experimental Setup
To analyze the behavior of ARCI′, we performed computational experiments using synthetically generated graphs. Each graph represents a simplified model of rural villages connected by potential roads.
Parameters:
- Number of nodes (villages): n=10
- Coordinates: Randomly sampled in a 100×100 plane.
- Population per node: Random integers between 100 and 1000.
- Edge cost: Euclidean distance multiplied by a terrain factor (random between 1.0 and 3.0).
- Population served per edge: Sum of the populations of its two endpoints.
All graphs were generated using NetworkX (Python), and MSTs were computed using Kruskal’s algorithm.
3.2. ARCI′ Sensitivity to α
We computed ARCI′ values for the MST across penalty parameter values α ∈ [1.0,2.0] (step size 0.1).
3.3. Visualization
A plot of ARCI′ vs α reveals a steep exponential decay, demonstrating that the penalty parameter α strongly influences the index:
3.4. Interpretation
- Trade-off Insight:
For α values between 1.0 and 1.3, ARCI′ remains relatively high, indicating networks with moderate cost penalties. Beyond α=1.5, the index becomes very small, reflecting aggressive cost penalization.
- 2.
- Parameter Tuning:
The results suggest that selecting an α around 1.2–1.3 achieves a balance between population coverage and cost minimization.
Section 4: Discussion
4.1. Key Findings
The computational analysis shows that ARCI′ is highly sensitive to the penalty parameter α:
- For low values of α\alphaα (close to 1), ARCI′ values remain high. This indicates that the population component dominates, and the model favors networks that cover more people even if they are more expensive.
- As α\alphaα increases, ARCI′ decreases sharply. Cost minimization becomes the dominant factor, reducing ARCI′ to very small values for α>1.5.
This confirms that α acts as a control knob for planners to tune the trade-off between social benefit (population served) and financial constraints (total cost).
4.2. Comparison with Traditional MST Metrics
The classical Minimum Spanning Tree (MST) minimizes cost but ignores population coverage. ARCI′ introduces a quantitative measure that allows network evaluation beyond cost:
- MST cost is constant for a given graph.
- ARCI′ reveals how that same MST performs when population is included as a priority.
Thus, ARCI′ can complement MST rather than replace it.
4.3. Limitations
- Synthetic Data: The current experiments used artificial graphs, which may not reflect real-world complexity such as geographic obstacles, existing road layouts, or socio-political constraints.
- Single Objective Extension: While ARCI′ handles cost vs population, it does not yet include other factors such as reliability, redundancy, or maintenance cost.
- Parameter Selection: Choosing an appropriate α requires domain knowledge; the index alone does not prescribe the “best” value.
4.4. Future Work
- Real-World Case Studies: Apply ARCI′ to real African or Asian rural networks.
- Multi-Objective Optimization: Integrate ARCI′ into evolutionary algorithms to generate not just MST but Pareto-optimal networks.
- Theoretical Analysis: Prove formal properties (e.g., bounds, complexity, asymptotic behavior).
- Extension of Tareq Index (TI): Investigate how TI [17], originally for molecular graphs, can be generalized to networks like ARCI′, forming a family of indices for various domains.
Section 5: Conclusion
This paper introduced ARCI′ (Adjusted Rural Connectivity Index), a new graph-theoretic metric designed to evaluate and compare sparse networks by incorporating both population served and construction cost within a single formula. Unlike classical MST approaches that prioritize only cost minimization, ARCI′ provides a tunable parameter α that allows decision-makers to balance financial constraints with social benefits.
Our computational analysis demonstrated that:
- ARCI′ decreases rapidly as α increases, reflecting the growing influence of cost penalties.
- Parameter values around α≈1.2–1.3 may achieve a practical balance for rural infrastructure contexts.
- ARCI′ can serve as an auxiliary evaluation tool for planners rather than a replacement for established algorithms like MST.
Future research should focus on validating ARCI′ using real-world geographic and demographic data, extending the model to multi-objective frameworks, and exploring its theoretical relationship to previously developed graph indices such as the Tareq Index (TI).
References
- Diestel, R. Graph Theory, 5th ed.; Springer: Berlin, 2017. [Google Scholar]
- Bondy, J. A.; Murty, U. S. R. Graph Theory with Applications; North-Holland: Amsterdam, 1976. [Google Scholar]
- Ahuja, R. K.; Magnanti, T. L.; Orlin, J. B. Network Flows: Theory, Algorithms, and Applications; Prentice Hall: New Jersey, 1993. [Google Scholar]
- Magnanti, T. L.; Wong, R. T. Network Design and Transportation Planning: Models and Algorithms. Transportation Science 1984, 18, 1–55. [Google Scholar] [CrossRef]
- Cormen, T. H.; Leiserson, C. E.; Rivest, R. L.; Stein, C. Introduction to Algorithms, 3rd ed.; MIT Press: Cambridge, 2009. [Google Scholar]
- Kruskal, J. B. On the Shortest Spanning Subtree of a Graph and the Traveling Salesman Problem. Proceedings of the American Mathematical Society 1956, 7, 48–50. [Google Scholar] [CrossRef]
- Prim, R. C. Shortest Connection Networks and Some Generalizations. Bell System Technical Journal 1957, 36, 1389–1401. [Google Scholar] [CrossRef]
- Magnanti, T. L.; Wong, R. T. Accelerating Benders Decomposition: Algorithmic Enhancement and Model Selection Criteria. Operations Research 1981, 29, 464–484. [Google Scholar] [CrossRef]
- Ghosh, D.; Das, S. Multi-objective Optimization for Rural Road Network Design. European Journal of Operational Research 2015, 243, 865–876. [Google Scholar]
- Gutjahr, W. J.; Dzubur, A. Bi-Objective Road Network Design with Minimal Cost and Maximal Connectivity. Annals of Operations Research 2013, 206, 63–90. [Google Scholar]
- Yeh, C.-H.; Chou, S.-Y. Multiobjective Optimization of Road Network Design Considering Traffic Safety and Cost. IEEE Transactions on Intelligent Transportation Systems 2011, 12, 1363–1371. [Google Scholar]
- Fan, Y.; Kalaba, R. Multiobjective Optimization for Transportation Networks. Applied Mathematics and Computation 2001, 117, 1–12. [Google Scholar]
- Deb, K. Multi-Objective Optimization Using Evolutionary Algorithms; Wiley: Chichester, 2001. [Google Scholar]
- Chen, M.; Yang, H.; Lo, H. K. Capacity Reliability of a Road Network: An Assessment Methodology and Numerical Results. Transportation Research Part B: Methodological 2002, 36, 225–252. [Google Scholar] [CrossRef]
- Dijkstra, E. W. A Note on Two Problems in Connection with Graphs. Numerische Mathematik 1959, 1, 269–271. [Google Scholar] [CrossRef]
- Zitzler, E.; Thiele, L. Multiobjective Evolutionary Algorithms: A Comparative Case Study and the Strength Pareto Approach. IEEE Transactions on Evolutionary Computation 1999, 3, 257–271. [Google Scholar] [CrossRef]
- Asaduzzaman, M. (2025). The Tareq Index (TI): A Novel Graph-Based Descriptor for Inorganic Acids. ChemRxiv. This content is a preprint and has not been peer-reviewed. [CrossRef]
Figure 1.
ARCI′ vs α.
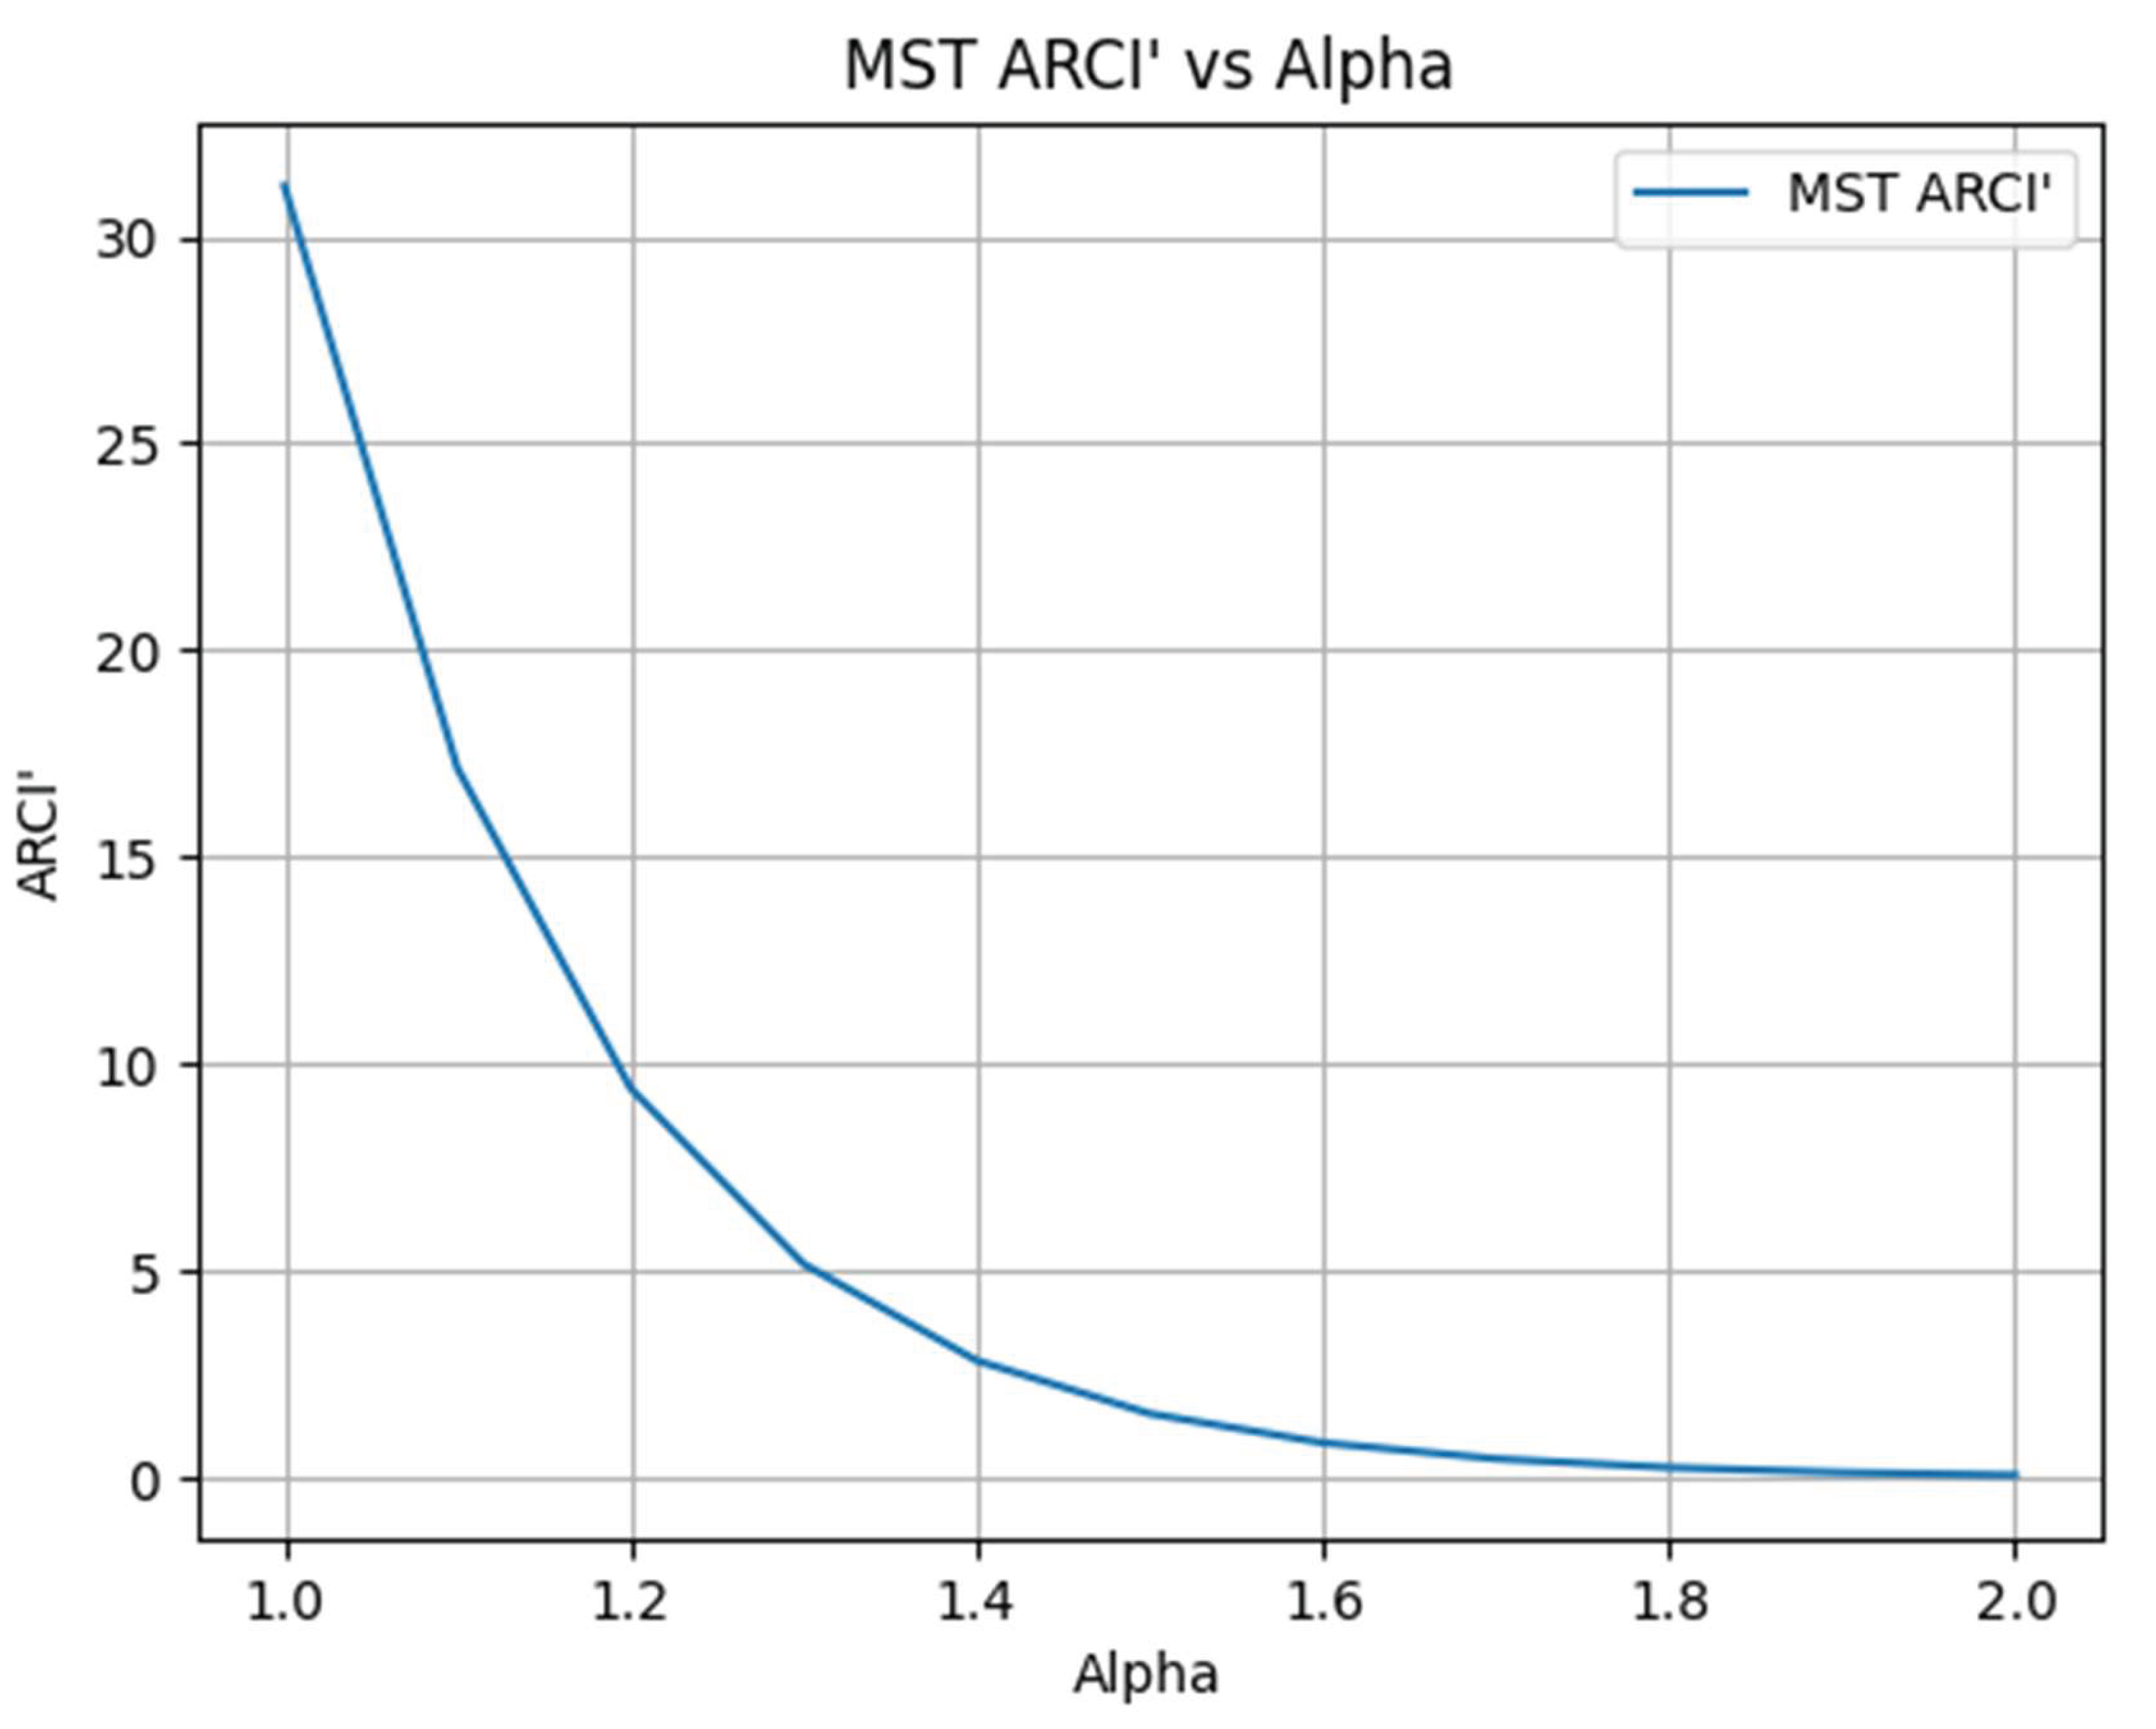

Table 1.
ARCI′ values for MST vs α.
| α (alpha) | MST_ARCI′ |
| 1.0 | 31.218589 |
| 1.1 | 17.148364 |
| 1.2 | 9.419593 |
| 1.3 | 5.174180 |
| 1.4 | 2.842176 |
| 1.5 | 1.561207 |
| 1.6 | 0.857571 |
| 1.7 | 0.471063 |
| 1.8 | 0.258755 |
| 1.9 | 0.142134 |
| 2.0 | 0.078074 |
Disclaimer/Publisher’s Note: The statements, opinions and data contained in all publications are solely those of the individual author(s) and contributor(s) and not of MDPI and/or the editor(s). MDPI and/or the editor(s) disclaim responsibility for any injury to people or property resulting from any ideas, methods, instructions or products referred to in the content. |
© 2025 by the authors. Licensee MDPI, Basel, Switzerland. This article is an open access article distributed under the terms and conditions of the Creative Commons Attribution (CC BY) license (http://creativecommons.org/licenses/by/4.0/).
Copyright: This open access article is published under a Creative Commons CC BY 4.0 license, which permit the free download, distribution, and reuse, provided that the author and preprint are cited in any reuse.


