Preprint
Article

This version is not peer-reviewed.

Chromosome 12 and Environmental Factors in Parkinson’s Disease: An All of Us Data Analysis

A peer-reviewed article of this preprint also exists.

Submitted:

28 August 2025

Posted:

01 September 2025

You are already at the latest version

Abstract

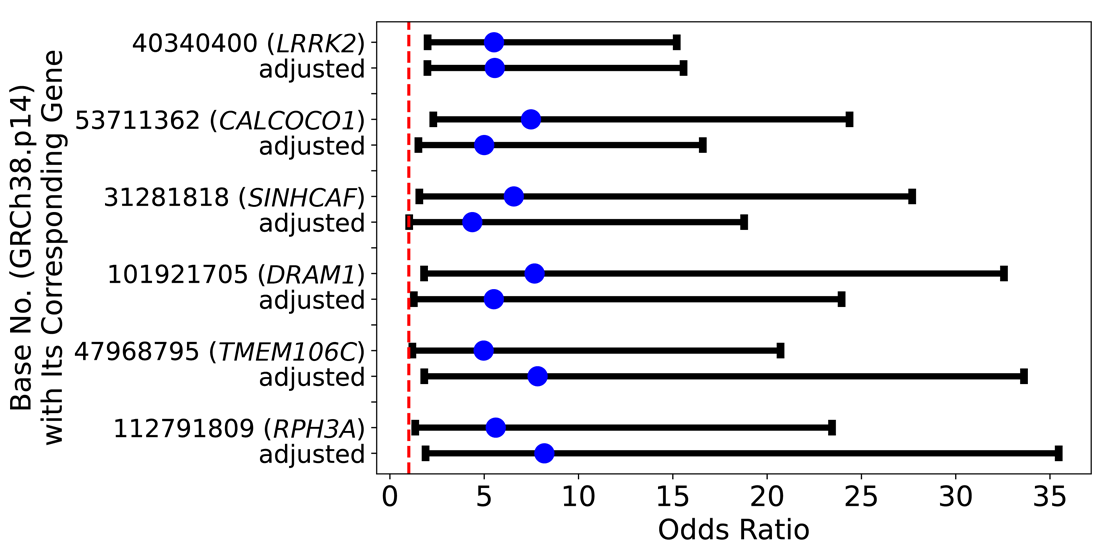
Background/Objectives: Parkinson’s disease (PD) is a neurodegenerative disease that develops with age and is related to a decline in motor function. Studies suggest that the causes may be based on genetic dysfunction including PARK gene mutations and environmental factors. Methods: To explore those factors, we used multivariable logistic regression to obtain odds ratios (ORs ) and adjusted ORs by using the All of Us Dataset which contains genomic, blood test, and other environmental data. Results: On Chromosome 12, there were 3,709 candidate single nucleotide polymorphisms (SNPs) that are associated with PD. Of those SNPs, fifteen SNPs had high ORs which are similar to the OR of the PARK8 gene G2019S mutation. Of those 3,709 SNPs, a 2.00-fold change in OR was observed in five SNPs located at bases 53,711,362 (OR = 4.86, 95% CI [1.46, 16.18]), 31,281,818 (OR = 4.37, 95% CI [1.02, 18.82]), 101,921,705 (OR = 5.38, 95% CI [1.23, 23.51]), 47,968,795 (OR = 7.82, 95% CI [1.81, 33.83]), and 112,791,809 (OR = 8.05, 95% CI [1.85, 35.05]) by calcium, Vitamin D, and alcohol intake and were statistically significant. Conclusions: The results suggest that the progression of some PD caused by certain SNPs can be delayed or prevented by the environmental factors above. In February 2025, All of Us released the CT Dataset v.8 which has a 50% increase in the number of participants. Potentially, it may be possible to research more SNPs and environmental factors. In future studies, we would like to explore other environmental factors and SNPs on other chromosomes. It is believed that specific SNPs may tailor current treatments and qualify patients for clinical trials. Additionally, genetic knowledge may help increase accuracy in clinical trials.

Keywords: 
;  ;  ;  ;  

1. Introduction

Parkinson’s disease (PD) is a progressive neurodegenerative disorder [1]. PD is caused by a lack of dopamine due to degeneration of the substantia nigra in the midbrain, which leads to impaired motor function, such as resting tremor, akinesia, and rigidity [2]. PD is more likely to develop with age [3], which also suggests that this may be related to a decline in brain function. In addition, PD affects men than women in the United States. Females tend to be older than males at symptom onset [4]. While age and sex are major risk factors, the underlying cause of PD is unknown [1].
Why does brain dysfunction resulting in dopamine deficiency occur? To date, we know that there are genetic and environmental factors involved [2]. In the following section, we review previous research based on both genetic and environmental factors.

1.1. Epidemiology of Parkinson’s Disease

According to the World Health Organization, more than 8.5 million individuals had PD in 2019, doubling in the past 25 years [5]. In North America, the estimated prevalence range for those aged > 65 is from 108 to 212 per 100,000 [6]. Furthermore, the economic burden is also a problem. In the United States, it is estimated annual costs of PD is approximately $52 billion [7].
PD prevalence increases with age [8]. Because the worldwide population is aging, it is estimated that the number of individuals who have PD may grow to 12.9 million in 2040 [9]. The burden is also on caregivers. Between 2017 and 2019, average caregiver age was over 60, and 70% of caregivers were patient’s spouses [10]. This suggests that both PD patients’ and caregivers’ burden may be increasing due to worldwide aging. The problem of quality of life (QOL) is also crucial. Studies suggest PD patients had significantly poorer QOL compared with healthy individuals, and it affects functional outcomes [11]. Regarding disability-adjusted life-years (DALYs) of PD, China, India, the United States, Japan, and Germany had the five highest prevalence rates and DALYs in 2019 [12]. Since DALY is calculated by the sum of years of healthy life lost due to disability and years of life lost due to premature mortality [13], the result means that the patients in the five countries above live with the burden for a long time.

1.2. Definition of Monogenic and Idiopathic

PD is classified as monogenic PD and idiopathic PD, but care must be taken with this terminology, as the definition varies slightly depending on the researcher. The definition of monogenic PD is almost consistent, and is PD caused by mutations in single genes [1,14]. The term idiopathic, however, can have two main meanings depending on the context: one refers to the development of PD due to genome-wide association, i.e., multiple gene alterations [8,15], and the other refers to a combination of complex genetic and environmental factors [1,16]. Based on the first definition, 3 – 5% of PD can be explained as a monogenic cause and 16 – 36% can be explained by idiopathic [8], whereas based on the second definition, 10% of PD is a monogenic form and 90% is idiopathic [1,16]. In this study, we adopt the second definition because monogenic PD is a minority condition and, because its cause is unknown, factors other than genetic factors should also be considered.

1.3. Environmental Factors

Some have gone as far as to argue that most cases of PD are preventable by avoiding environmental exposure to chemicals such as certain pesticides, the solvent trichloroethylene, and air pollution [17].

1.3.1. Diets

According to Maraki et al., there is a correlation between the onset of PD and certain foods [18]. The results of a cross-sectional study of 1,731 elderly Greek people showed that those who ate a Mediterranean diet (MeDi) had a lower probability of developing prodromal PD. They also mentioned that the number of studies investigating the relationship between MeDi and PD is limited. However, in the context of diet and PD, the benefits of MeDi are often mentioned, many of which suggest a preventive effect [19,20,21].
One of the reasons why diet is related to PD is thought to be changes in intestinal bacteria. Regarding the progression of PD, there is the Braak hypothesis [22], which states that the pathological process of PD begins in the peripheral/enteric nervous system, progresses to the midbrain, and finally progresses to the cerebrum. According to a comprehensive narrative review by Omotosho et al., there is evidence suggesting a relationship between diet and PD, but they point out that not all PD can be explained by diet alone [23].

1.3.2. Calcium

The association between PD and calcium intake is unclear. Previous studies show there is an association between PD and calcium [24], but some studies do not support the association [25]. More research is needed to confirm the association using epidemiological methods.

1.3.3. Vitamin D

Vitamin D has a beneficial effect on calcium intake [26]. In the context of PD, studies show that PD patients have lower Vitamin D levels [27,28]. On the other hand, some conflicting results exist; one demonstrated an increased risk for PD with lower mid- life vitamin levels, and the other showed no association between Vitamin D levels and PD risk [29].

1.3.4. Alcohol Intake

The relationship between alcohol consumption and PD is unclear. Alcohol, or ethanol, is contained in alcoholic beverages and consumed for recreational purposes [30]. Alcohol affects mainly the liver which metabolizes alcohol, but broad brain areas are also affected. Alcohol interacts with proteins involved in neurotransmission, but the inter- action system is different from other drugs [31]. According to Kamal et al., some studies show that moderate alcohol consumption has a protective effect on PD, but others do not [32]. Therefore, it is necessary to confirm the association by using epidemiological methods.

1.4. Genetic Factors

Genes, found in deoxyribonucleic acid (DNA), contain instructions to make specific proteins. There are over 20,000 genes in human DNA. Genes are coded by four nucleotides; Adenine (A), Cytosine (C), Guanine (G), and Thymine (T). Chromosomes consist of packed DNA and humans have 22 autosomes and one sex chromosome [33].
Twenty-three PARK gene loci have been identified in the genome that are associated with development of monogenic PD, but PARK mutations do not explain all PD cases [34]. The contribution of each PARK to hereditary PD varies from person to person. For example, PARK1 is responsible for approximately 2% of hereditary PD cases [16]. PARK2 mutation is responsible for approximately 50% [35] to as much as 77% [36,37] of early-onset PD, particularly in patients younger than 30 years of age. However, LRRK2 mutations are the most common genetic cause of familial PD. The protein α-synuclein (α-syn), which is encoded by the SNCA gene, consists of 140 amino acids [38]. Although α-syn is thought to play an important physiological role, its detailed function remains unknown [39]. Monomeric α-syn is normally present throughout the brain [40]. However, when α-syn misfolds and becomes α-syn fibrils, it can cause damage to neurons and lead to cell loss [39]. Mutations in SNCA can make α-syn more prone to misfold. Mutations such as the A53T mutation lead to autosomal-dominant PD [41]. SNCA has been classified as PARK1 (located at Chromosome 4), a genetic locus associated with PD.
PARK2 encodes the Parkin protein, an E3 ubiquitin ligase [42]. Ubiquitin is a protein that can modify protein to change their function, or target them for degradation [43], and an E3 ligase is the enzyme that attaches ubiquitin [44]. Ubiquitin involves mitophagy, which is an autophagic process of damaged mitochondria. Thus, PARK2 mutations lead to an accumulation of damaged mitochondria associated with progression of PD [45].
In 1996, to identify the genetic locus associated with the development of PD, Polymeropoulos et al. examined genetic linkage analysis for a total of 140 genetic markers in a large Italian pedigree and identified the SNCA gene (PARK1) as being involved [46,47]. However, among the PARK s identified using a genome-wide association study (GWAS), which is the gold standard for investigating genetic risk factors [48], some PARK s cannot be determined clearly for the association with PD. For instance, Satake et al. identified a susceptibility locus thought to be correlated with PD in a GWAS study of 2,011 cases and 18,381 controls in Japan and reported it as PARK16 [49]. On the other hand, it has been reported that pathogenic mutations in PARK16 are rare in people of European descent [50], and some researchers have not yet added PARK16 to the PARK group because the association has not yet been identified [34].

1.5. PARK8 /LRRK2 Gene and Environmental Factors

There are multiple factors for PD, including monogenic genes, common variants, and environmental factors for PD. In this research, we will focus on PARK8 /LRRK2 gene SNPs and environmental factors.
The leucine rich repeat kinase 2 (LRRK2) gene is located on Chromosome 12. It was found in a large Japanese family as one of the causes of PD and identified as the PARK8 in 2002 [51]. Studies suggest that if the 40,340,400th base of Chromosome 12 on the Genome Reference Consortium Human build 38 patch 14 (GRCh38.p14) [52] changes from G to A (G>A), also known as G2019S mutation [53], a missense mutation results [54], which is a single base pair mutation that changes amino acid coding [55]. LRRK2 missense mutations are the most common cause of monogenic PD but are relatively rare in the overall PD population. PD GWAS studies have identified genetic variants in and near the LRRK2 as risk factors of PD in individuals who have no genetic cause of PD [54]. This suggests that it is important to research the relationship between SNPs of not only LRRK2 but also other loci on Chromosome 12 and PD.
Moreover, although the relationship between PD and environmental factors has been mentioned in several previous studies, few studies have mentioned the interactions between LRRK2 mutation and Chromosome 12 SNPs and environmental factors.
In this paper, unless otherwise noted, genomic base numbers follow GRCh38.p14.

1.6. Research Question

Due to the mix of genetic and environmental factors that confer risk for PD, the purpose of this research was to explore the relationship between genetic and environmental factors. Specifically, we are exploring (1) if the odds ratio of PD caused by PARK8 G2019S mutation is adjusted by calcium, Vitamin D, and alcohol intake, and (2) if there are other SNPs found to be adjusted by calcium, Vitamin D, and alcohol intake.

2. Materials and Methods

The dataset uses genetic and environmental data provided by All of Us. The participants of All of Us are residents in the United States except aged 5–18 (19 in Alabama, 21 in Puerto Rico), and individuals consented to sharing information about their privacy and genomics data [56]. The author obtained permission to use the dataset from All of Us in September 2024.
This was a cross-sectional study using the All of Us Dataset [57]. The dataset contains short-read whole-genome sequencing (srWGS) data. By combining these with demographic and health-related data, we investigated the probabilities of having PD by genetic and environmental factors.
Probabilities of PD were estimated using adjusted odds ratios (AORs) obtained using logistic regression. Since the terms of use forbid the output of All of Us raw data from the cloud server, the data was analyzed using Python [58], Hail [59], and Pandas [60] on Jupyter Notebook [61] running in the cloud server environment. More detailed methods is found at https://www.protocols.io/private/7DBCBB32694C11F0A4C70A58A9FEAC02.

2.1. Definition of SNP in the All of Us Data

In the MatrixTable of Chromosome 12, data for all 1,576,756 bases, 0/0 (reference type) was recoded as SNP = 0, and all other combinations were recoded as SNP = 1. There were 2,429 types of SNPs in the dataset. For all 245,394 participants, the total number of those with no SNP was 381,055,807,656 bases (99.67%) and those with a SNP was 1,260,533,354 bases (0.33%). The total number of missing data was 17,086,615 bases.

2.2. Preliminary Analysis

The total sample size of the genomic data in the Controlled Tier Dataset was 245,394. In addition, the total sample size of All of Us Controlled Tier (CT) v.7 Curated Data Repository (CDR) was 245,388 (6 samples were dropped from the former genomic dataset [62]). In the latter sample, the total number of individuals with PD was 1,422.
For preliminary analysis to find candidate SNPs from 1,576,756 bases, we used the former genomic data (n = 245,394), and 243,972 individuals (245,394 - 1,422 = 243,972) were regarded as PD negative (case PD positive) = 1,422 (0.58%), control (PD negative) = 243,972 (99.42%)). For the main analysis using specific candidate bases, we used the latter CDR which has 245,388 samples.

2.3. Power Analysis

2.3.1. Simple Logistic Regression for PD and SNPs

We used G*Power 3.1.9.7 [63] to analyze statistic power for a simple logistic regression. When the conditions are α = 0.05, 1 - β = 0.80, the SNP positive is 0.33%, PD positive is 0.58%, and the total sample size is 245,394; an OR of > 2.57 can be detected statistically. Therefore, an OR of 2.58 was set as a criterion to extract candidate bases for preliminary analysis.

2.3.2. Multivariable Logistic Regression for PD, SNPs, and Environmental Factors

For appropriate sample size of multivariable logistic regression, the number of events per variable (EPV) was proposed by Peduzzi et al. [64]. In the context of this study, it means how many in the sample are positive for PD. The number of variables refers to the number of independent variables. Peduzzi et al. pointed out that EPV should be 10 or more [64].

2.4. Data Processing

Table 1, Table 2 and Table 3 show the frequencies of all recoded variables. After the exclusion of missing values, the sample size was 34,162. The EPV for all dummy variables was 369 / 13 = 28.38, therefore the power analysis condition was fulfilled (note that 13 refers to the number of recoded variables except reference variables).
The age of each sample was calculated as a difference between birthday and July 1, 2022 which is the data cutoff date. Relatively, older people tend to have PD. Also, PD onset age less than 50 is regarded as young onset PD [65]. Additionally, in a previous study that analyzed genomic factors by using GWAS, age of < 50 years was used as the threshold of young-onset PD [66]. In the dataset of All of Us, the sample size of PD-positive under 50 years old was small. Therefore, it was recoded as binary (< 50 and 50).
For sex, we chose “sex at birth” but not gender. The answers such as “Skip”, “No matching concept”, “I prefer not to answer”, “None”, and “Intersex” were recoded as missing. Then, male was recoded as 0 and female was as 1.
For calcium level, “calcium [mass/volume] in serum or plasma” was used. In the dataset, there were several unit types such as milligram per deciliter (mg/dL), millimole per liter, milligram per milliliter, no value, and others. Since some values of millimole per liter, milligram per milliliter, etc. seemed to be mistakes of mg/dL or other units and each sample size was relatively small, we used values that have mg/dL and others were regarded as missing data. Then, values of 10,000,000 mg/dL were deleted because they can be regarded as missing or mistaken. If one individual had multiple values since the individual took the blood test several times, the mean value was used. According to the University of California San Francisco, the normal value range of calcium levels is from 8.5 to 10.2 mg/dL [67]. Similarly, according to the National Institutes of Health, calcium level is typically 8.8 to 10.4 mg/dL in healthy people [68]. For the data of All of Us, quantile values were 9.00, 9.28, and 9.53 for Q1, Q2, and Q3. In the dataset, the sample size of > 10 mg/dL seemed to be small; thus, from those data, we recoded the continuous values of the calcium level to 1 for < 8.5, 2 for 8.5 – < 9.0, 3 for 9.0 – < 9.5, and 4 for 9.5.
For Vitamin D level, “25-hydroxyvitamin D3 [mass/volume] in serum or plasma” was used. In the dataset, there were several types of units such as nanogram per milliliter (ng/mL), milliliter per minute, pictogram per milliliter, and no value. We used values that have ng/mL and others were regarded as missing data. If one individual had multiple values since the individual took the blood test several times, the mean value was used. According to the University of Florida, 20–40 ng/mL or 30–50 ng/mL are recommended [69]. Similarly, according to Holic, < 20 ng/mL is considered to be a Vitamin D deficiency, 21–29 ng/mL is considered to be insufficient, and 30 ng/mL to take full advantage [70]. For the All of Us Data, Q1 was 23.00, Q2 was 31.00, and Q3 was 39.33. Therefore, from the data above, we recoded vitamin D values to 1 for < 20 ng/mL, 2 for 20 ng/mL–< 30 ng/mL, 3 for 30 ng/mL–< 40 ng/mL, and 4 for 40 ng/mL.
For alcohol consumption level, “Alcohol: Drink frequency past year” was used. There were 5 levels; “Never”, “Monthly or less”, “2 to 4 per month”, “2 to 3 per week”, and “4 or more per week”. Each level was recoded as 0 to 4. Other answers such as “Prefer not to answer” and “Skip” were regarded as missing.

3. Results

3.1. PD and LRRK2 Gene SNPs

We used the Hail Logistic Regression Tool to calculate OR for PD (positive or negative) and SNPs (0 or 1) of all 1,576,756 bases. Results that had p>.050 and OR < 2.58 were excluded. After the procedure, we obtained 3,709 candidate bases.
The LRRK2 (PARK8) gene is located between the 40,224,997th and 40,369,285th base of Chromosome 12 [71]. In the LRRK2 gene, the 40,340,400th G>A SNP is associated with PD [53]. This mutation is called rs34637584 or G2019S on the Reference SNP (rs) Report.
In the 3,709 candidate bases, 12 bases belonging to LRRK2 were included. In the 12 bases, G2019S has smallest p-value (OR = 5.46, 95% CI [2.90, 10.27], p = 0.000000139).

3.2. Other Bases That Have Similar ORs and p-Values of G2019S

Based on the result above, other bases that have similar ORs of PD and SNPs were extracted (OR 5.00, 95% CI range 10). Table 4 shows the results and were used for comparison with the ORs of PD, SNPs, and environmental factors, as described later. Table 5 shows the role of each gene in Table 4.
This is a part of the preliminary analysis resulting in 3,709 bases. At the main analysis, those bases in Table 1 were compared with the main results using the All of Us CD (n = 245,388). Original p-values were calculated by logistic regression. Adjusted p-values are corrected p-values for detection of false discovery rate (FDR) by using Benjamini-Hochberg method. For FDR confirmation, StatsModels on Python was used.

3.3. PD and Environmental Factors

3.3.1. Factors and Statistical Power

In the All of Us data, there were 245,388 samples. This CDR included demographic data, health condition data, and questionnaire results.
Since some data were missing, too many multiple variables led to low EPV. The EPV should be over 10, therefore the sample size is too small to calculate ORs by using logistic regression. Moreover, in the last model which includes PD, SNPs, and environmental factors, some environmental factors will be converted into dummy variables and some bases may include missing variables for SNPs, therefore the sample size must be large. From this aspect, 5 variables (2 variables were from demographics data, 2 variables were blood test data, and 1 variable was from survey data) were chosen as environmental factors to keep the sample size more robust. The actual EPV for the statistical analysis is shown in each note in Table 7.

3.4. Adjusted ORs of PD, SNPs, and Environmental Factors

We calculated (a) ORs of SNPs for PD and (b) adjusted ORs (AORs) of SNPs adjusted by environmental factors for 34,162 samples using the Hail logistic regression tool. Each sample had a data of SNPs of 3,709 candidate bases.

3.4.1. Comparison of OR and AOR to Access the Environmental Factors’ Adjustment

From the result of 3,709 bases, we chose AORs that had p-values < .050 and the difference between OR and AOR was ≥ ±2 units. Table 5 shows these results.
The AORs of SNPs on the bases belonging to CALCOCO1, SINHCAF, and DRAM1 were decreased and the AORs of SNPs on the bases belonging to TMEM106C and RPH3A were increased.
CALCOCO1 is a gene that works for DNA binding activity in specific RNA polymerase II cis-regulatory regions [72]. In the context of neurodegeneration, CALCOCO1 dysfunction may contribute to Golgi homeostasis disruption that leads neurodegenerative diseases, cancers, etc. [73]. This dysfunction can cause PD [74]. DRAM1 is associated with autophagy activation [75] and various tumors if the transcriptional expression is decreased [76]. The SNPs of DRAM1 may be associated with PD [77].
SINHCAF adjusts cell migration [78]. One study found that SINHCAF ’s dysfunction may contribute to Alzheimer’s disease [79], but few studies mentioned the relationship between SINHCAF and PD. The mutation of TMEM106B on chromo- some 7, a homolog of TMEM106C, is a risk factor of neurodegeneration disease [80]. TMEM106B can form amyloid filaments that cause neurodegeneration. Therefore, in this context, TMEM106C mutation may be associated with PD. However, few stud- ies mentioned about the relationship between TMEM106C itself and PD. The protein encoded by RPH3A may be involved in neurotransmitter release and traffic of synaptic vesicle [81]. Study shows that loss of RPH3A contributes dementia severity, cholin- ergic differentiations, and increased β-amyloid concentrations [82]. The β-amyloid oligomers may associate with α-syn oligomer formation, but typically β-amyloid itself has no association with PD [83]. Therefore, the association of dysfunction of RPH3A and PD is unclear.
We also calculated the AORs of LRRK2 (PARK8) G2019S and other SNPs that had similar characteristics to G2019S. Table 6 shows the results. Results with p-value > .050 and uncalculatable were excluded. It is assumed that the cause of some ORs and AORs of SNPs on certain bases could not be calculated because the sample size was changed from the preliminary analysis (n = 245,394) to the main analysis (n = 34,162) and each base has different missing samples.
For the LRRK2 G2019S SNP, the difference between OR and AOR was 0.05. This result suggests that PD caused by G2019S mutation receives few effects from age, sex, calcium level, Vitamin D level, or alcohol drinking habits. Also, for other SNPs that had similar characteristics with G2019S, the differences between OR and AOR were relatively small and up to 1.60 units.

3.4.2. AOR of SNPs Adjusted by Environmental Factors

We calculated AORs of each stratum of environment factors based on the results referred on Table 5. Table 7 shows these AORs. Each base has different missing data and those were excluded.

4. Discussion

4.1. Main Findings

In the preliminary analysis, we found 3,709 candidate bases that may be associated with PD. In those bases, 14 bases had similar ORs of the G2019 SNP in LRRK2 (PARK8) and some of the genes identified has not been previously associated with risk for PD [84,85,86,87,88,89,90,91,92]. Although those results were outside of the main focus of this study, they warrant additional investigation in future studies.
According to Shu et al., ORs of PD caused by the G2019S mutation varied in each ethnicity, with an OR = 8.71, 95%CI [6.12, 12.38] (p-value < .000) among European/West Asians [93]. Compared with the previous research, our ORs were lower. The Benjamin-Hochberg method was used to confirm the false discovery rate. As a result of FDR confirmation (total number of tested: 3,709), all 3,709 results were significant.
In the results of the main analysis, there were two types of SNPs; SNPs which were not affected by adjustment for demographic and environmental factors, and those which were. The OR of G2019 SNP on LRRK2 was hardly adjusted by demographic and environmental factors, therefore individuals with G2019 should be regarded as people who may tend to have PD regardless of age, sex, calcium, Vitamin D, or alcohol intake. For PD related to other SNPs that had similar ORs to LRRK2 SNP OR, the interpretation is similar.
However, ORs of PD caused by five SNPs (chr12:53711362, chr12:31281818, chr12:101921705, chr12:47968795, chr12:112791809) were significantly changed by adjustment demographic and environmental factors. Although the major factors of PD among five SNPs seem to be genetics, this result indicates that the susceptibility of PD caused by five SNPs may be modified by age, sex, and lifestyle related to calcium, vitamin D, or alcohol intake.
Overall, for the five SNPs above, AORs of age and sex were statistically significant. Therefore, it can be said that males over 50 years of age tend to have PD compared with younger males and women. This trend is consistent with the previous studies.
The AORs of calcium level for the five SNPs were less than 1 for high calcium levels and were statistically significant. However, it was not statistically significant for lower calcium levels. The result indicates that individuals with PD have lower calcium levels, but this result does not meet the result of previous studies [24,25]; thus more research is needed.
The AORs of Vitamin D levels for the five SNPs were greater than 1 (95% CIs var- ied; from 1.02 to 2.64) for high Vitamin D levels and statistically significant. However, it was not statistically significant for lower Vitamin D levels. This result is opposite compared with previous studies indicating that PD patients have lower Vitamin D levels [27,28]. Objectively, Fullard and Duda concluded that there was no association between PD and Vitamin D levels [29]. Those three previous studies were systematic reviews, so the hierarchy of scientific evidence is higher than our cross-sectional study. However, since the results of previous studies were not consistent, more studies focused on Vitamin D levels are needed.
The results of alcohol consumption habits for the five SNPs were statistically significant except for chr12:112791809 (RPH3A). For four SNPs, the AORs indicated that alcohol drinking may reduce the odds of PD. However, Kamal et al. have shown that the association between alcohol and PD is unclear [32]; therefore, careful interpretation is needed. For the RPH3A SNP, alcohol consumption and PD were not associated statistically.
For the five SNPs, CALCOCO1 and DRAM1 are associated with tissue metabolism and/or autophagy, which is crucial for reducing “garbage” substances such as amyloid beta and α-syn in the human brain. That dysfunction may be related to PD, but the results also show that the tendency can be reduced by environmental factors. Also, the result suggests that environmental factors may reduce the odds of PD related to the SNP on SINHCAF and increase the odds of PD related to the SNP on TMEM106C, but we could not find previous studies mentioned SINHCAF or TMEM106C for PD association; therefore, more study is needed.

4.2. Strengths and Limitations

There are some advantages found in this study. Firstly, this research studied the relationship between not only PD and SNPs or PD and environmental factors but PD, SNPs, and environmental factors; therefore, it suggests that some environmental factors and lifestyle can reduce the odds of PD even if the individual has certain SNPs. Secondly, the results were statistically significant, and some results support previous studies. Thirdly, the differences between OR and AOR of five SNPs were compared to the results of LRRK2 as PARK8; therefore, the differences in characteristics between five SNPs and LRRK2 were shown.
Limitations in this study were that the results did not exclude possibilities of confounders; our results of environmental factors mentioned only lifestyles related to calcium, Vitamin D, or alcohol intake. Also, this study did not mention the change of coding for each gene; not all SNPs lead to dysfunction of coded proteins, but the results did not take account into the above.
Finally, the results of alcohol intake may have a strong bias because it is based on the survey and thus more likely to be inaccurate.

5. Conclusions

It is difficult to analyze live human brains for PD, but we can explore the correlation between PD, SNPs, and environmental factors by using data. Some PD caused by gene mutations can be inevitable, but this study showed that some genetic PD risk is modifiable by nutrition intake or changing lifestyles.
It may be also said that PD is an ensemble-like neurodegeneration disorder played by many genomic factors. If some of the 3,709 instruments named SNPs are broken, the skewed harmony may lead to serious consequences. However, the results of this study suggest that if the conductor of the orchestra can intervene by using environmental factors, the consequences may be delayed or prevented. We used only calcium, Vitamin D, and alcohol intake levels for the proxy of environmental or lifestyle factors in this study, but the results can be used for further analysis of PD such as biomarkers to predict the progression of PD.
In the future, we would like to research the association of other factors of PD. We also want to analyze interactions between SNPs and SNPs on other chromosomes so that we can specify more characteristics of PD, SNPs, and environmental factors.

Author Contributions

Conceptualization, Kenta Abe; research, data analysis, original draft preparation, review, and editing, Karen Niemchick; review and editing, epidemiology supervision. All authors have read and agreed to the published version of the manuscript.

Funding

This research received no external funding.

Institutional Review Board Statement

This project was reviewed by Grand Valley State University IRB (Study No. 25-143-H), and determined the project does not meet the definitions of human subjects research as per 45CFR 46.102.

Informed Consent Statement

Not applicable.

Data Availability Statement

Acknowledgments

We gratefully acknowledge All of Us participants for their contributions, without whom this research would not have been possible. We also thank the National Institutes of Health’s All of Us Research Program for making available the participant data examined in this study.

Conflicts of Interest

The authors declare no conflicts of interest.

Abbreviations

The following abbreviations are used in this manuscript:
PD Parkinson’s disease
OR Odds ratio
AOR Adjusted odds ratio
AD
GRCh38.p14
Alzheimer’s disease
Genome Reference Consortium Human build 38 patch 14

References

  1. Jimenez-Ferrer, I.; Swanberg, M. Immunogenetics of Parkinson’s Disease. In Parkinson’s Disease: Pathogenesis and Clinical Aspects [Internet]; Codon Publications: Brisbane, Australia, 2018. [Google Scholar]
  2. Warner, T.T.; Schapira, A.H.V. Genetic and Environmental Factors in the Cause of Parkinson’s Disease. Annals of Neurology: Official Journal of the American Neurological Association and the Child Neurology Society 2003, 53, S16–S25. [Google Scholar] [CrossRef]
  3. Post, B.; Van Den Heuvel, L.; Van Prooije, T.; Van Ruissen, X.; Van De Warrenburg, B.; Nonnekes, J. Young Onset Parkinson’s Disease: A Modern and Tailored Approach. Journal of Parkinson’s disease 2020, 10, S29–S36. [Google Scholar] [CrossRef]
  4. Haaxma, C.A.; Bloem, B.R.; Borm, G.F.; Oyen, W.J.G.; Leenders, K.L.; Eshuis, S.; Booij, J.; Dluzen, D.E.; Horstink, M.W.I.M. Gender Differences in Parkinson’s Disease. Journal of Neurology, Neurosurgery & Psychiatry 2007, 78, 819–824. [Google Scholar] [CrossRef]
  5. World Health Organization. Parkinson Disease. Available online: https://www.who.int/news-room/fact-sheets/detail/parkinson-disease (accessed on 3 May 2025).
  6. Willis, A.; Roberts, E.; Beck, J.; Fiske, B.; Ross, W.; Savica, R.; Van Den Eeden, S.; Tanner, C.; Marras, C.; C. Marras on behalf of the Parkinson’s Foundation P4 Group. Incidence of Parkinson Disease in North America. Incidence of Parkinson Disease in North America. npj Parkinson’s Disease 2022, 8, 170. [Google Scholar] [CrossRef] [PubMed]
  7. Grotewold, N.; Albin, R.L. Update: Descriptive Epidemiology of Parkinson Disease. Parkinsonism & Related Disorders 2024, 120, 106000. [Google Scholar] [CrossRef] [PubMed]
  8. Bloem, B.R.; Okun, M.S.; Klein, C. Parkinson’s Disease. The Lancet 2021, 397, 2284–2303. [Google Scholar] [CrossRef]
  9. DeSalvo, K.B. Public Health 3.0: A Call to Action for Public Health to Meet the Challenges of the 21st Century. Prev. Chronic Dis. 2017, 14. [Google Scholar] [CrossRef]
  10. Martinez-Martin, P.; Skorvanek, M.; Henriksen, T.; Lindvall, S.; Domingos, J.; Alobaidi, A.; Kandukuri, P.L.; Chaudhari, V.S.; Patel, A.B.; Parra, J.C.; et al. Impact of Advanced Parkinson’s Disease on Caregivers: An International Real-World Study. Journal of Neurology 2023, 270, 2162–2173. [Google Scholar] [CrossRef]
  11. Zhao, N.; Yang, Y.; Zhang, L.; Zhang, Q.; Balbuena, L.; Ungvari, G.S.; Zang, Y.-F.; Xiang, Y.-T. Quality of Life in Parkinson’s Disease: A Systematic Review and Meta-Analysis of Comparative Studies. CNS neuroscience & therapeutics 2021, 27, 270–279. [Google Scholar] [CrossRef]
  12. Zhong, Q.-Q.; Zhu, F. Trends in Prevalence Cases and Disability-Adjusted Life-Years of Parkinson’s Disease: Findings from the Global Burden of Disease Study 2019. Neuroepidemiology 2022, 56, 261–270. [Google Scholar] [CrossRef]
  13. World Health Organization. Global Health Estimates: Leading Causes of DALYs. Available online: https://www.who.int/data/gho/data/themes/mortality-and-global-health-estimates/global-health-estimates-leading-causes-of-dalys (accessed on 3 May 2025).
  14. Pitz, V.; Makarious, M.B.; Bandres-Ciga, S.; Iwaki, H.; Singleton, A.B.; Nalls, M.; Heilbron, K.; Blauwendraat, C. Analysis of Rare Parkinson’s Disease Variants in Millions of People. NPJ Parkinson’s disease 2024, 10, 11. [Google Scholar] [CrossRef]
  15. Valente, A.X.; Liao, Q.; Rohkin, G.; Bouça-Machado, R.; Guedes, L.C.; Ferreira, J.J.; Lee, S.M.-Y. Mitochondrial Methylation Two-Peak Profile Absent in Parkinson’s Disease Patient. bioRxiv 2017, 197731. [Google Scholar] [CrossRef]
  16. Lesage, S.; Brice, A. Parkinson’s Disease: From Monogenic Forms to Genetic Susceptibility Factors. Human molecular genetics 2009, 18, R48–R59. [Google Scholar] [CrossRef] [PubMed]
  17. Dorsey, E.R.; Bloem, B.R. Parkinson’s Disease Is Predominantly an Environmental Disease. Journal of Parkinson’s Disease 2024, 14, 451–465. [Google Scholar] [CrossRef]
  18. Maraki, M.I.; Yannakoulia, M.; Stamelou, M.; Stefanis, L.; Xiromerisiou, G.; Kosmidis, M.H.; Dardiotis, E.; Hadjigeorgiou, G.M.; Sakka, P.; Anastasiou, C.A.; et al. Mediterranean Diet Adherence Is Related to Reduced Probability of Prodromal Parkinson’s Disease. Movement Disorders 2019, 34, 48–57. [Google Scholar] [CrossRef]
  19. Alcalay, R.N.; Gu, Y.; Mejia-Santana, H.; Cote, L.; Marder, K.S.; Scarmeas, N. The Association between Mediterranean Diet Adherence and Parkinson’s Disease. Movement Disorders 2012, 27, 771–774. [Google Scholar] [CrossRef]
  20. Bianchi, V.E.; Rizzi, L.; Somaa, F. The Role of Nutrition on Parkinson’s Disease: A Systematic Review. Nutritional Neuroscience 2023, 26, 605–628. [Google Scholar] [CrossRef] [PubMed]
  21. Chu, C.-Q.; Yu, L.; Chen, W.; Tian, F.-W.; Zhai, Q.-X. Dietary Patterns Affect Parkinson’s Disease via the Microbiota-Gut-Brain Axis. Trends in Food Science & Technology 2021, 116, 90–101. [Google Scholar] [CrossRef]
  22. Braak, H.; Del Tredici, K.; Rüb, U.; De Vos, R.A.; Steur, E.N.J.; Braak, E. Staging of Brain Pathology Related to Sporadic Parkinson’s Disease. Neurobiology of aging 2003, 24, 197–211. [Google Scholar] [CrossRef]
  23. Omotosho, A.O.; Tajudeen, Y.A.; Oladipo, H.J.; Yusuff, S.I.; AbdulKadir, M.; Muili, A.O.; Egbewande, O.M.; Yusuf, R.O.; Faniran, Z.O.; Afolabi, A.O.; et al. Parkinson’s Disease: Are Gut Microbes Involved? Brain and Behavior 2023, 13, e3130. [Google Scholar] [CrossRef]
  24. Tehrani, S.S.; Sarfi, M.; Yousefi, T.; Ahangar, A.A.; Gholinia, H.; Ahangar, R.M.; Maniati, M.; Saadat, P. Comparison of the Calcium-Related Factors in Parkinson’s Disease Patients with Healthy Individuals. Caspian Journal of Internal Medicine 2020, 11, 28. [Google Scholar] [CrossRef]
  25. Wang, Y.; Gao, L.; Lang, W.; Li, H.; Cui, P.; Zhang, N.; Jiang, W. Serum Calcium Levels and Parkinson’s Disease: A Mendelian Randomization Study. Frontiers in genetics 2020, 11, 824. [Google Scholar] [CrossRef]
  26. Eleni, A.; Panagiotis, P. A Systematic Review and Meta-Analysis of Vitamin D and Calcium in Preventing Osteoporotic Fractures. Clinical rheumatology 2020, 39, 3571–3579. [Google Scholar] [CrossRef]
  27. Lv, L.; Tan, X.; Peng, X.; Bai, R.; Xiao, Q.; Zou, T.; Tan, J.; Zhang, H.; Wang, C. The Relationships of Vitamin D, Vitamin D Receptor Gene Polymorphisms, and Vitamin D Supplementation with Parkinson’s Disease. Translational neurodegeneration 2020, 9, 1–13. [Google Scholar] [CrossRef]
  28. Rimmelzwaan, L.M.; van Schoor, N.M.; Lips, P.; Berendse, H.W.; Eekhoff, E.M.W. Systematic Review of the Relationship between Vitamin D and Parkinson’s Disease. Journal of Parkinson’s disease 2016, 6, 29–37. [Google Scholar] [CrossRef]
  29. Fullard, M.E.; Duda, J.E. A Review of the Relationship between Vitamin D and Parkinson Disease Symptoms. Frontiers in neurology 2020, 11, 454. [Google Scholar] [CrossRef] [PubMed]
  30. Ferguson, E.; Fiore, A.; Yurasek, A.M.; Cook, R.L.; Boissoneault, J. Association of Therapeutic and Recreational Reasons for Alcohol Use with Alcohol Demand. Experimental and clinical psychopharmacology 2023, 31, 106. [Google Scholar] [CrossRef] [PubMed]
  31. National Institutes of Health Information about Alcohol. NIH Curriculum Supplement Series [Internet]; National Institutes of Health: Maryland, United States, 2007. [Google Scholar]
  32. Kamal, H.; Tan, G.C.; Ibrahim, S.F.; Shaikh, M.F.; Mohamed, I.N.; Mohamed, R.M.P.; Hamid, A.A.; Ugusman, A.; Kumar, J. Alcohol Use Disorder, Neurodegeneration, Alzheimer’s and Parkinson’s Disease: Interplay between Oxidative Stress, Neuroimmune Response and Excitotoxicity. Frontiers in Cellular Neuroscience 2020, 14, 282. [Google Scholar] [CrossRef] [PubMed]
  33. Genetic Alliance Genetics 101. Understanding Genetics: A New York, Mid-Atlantic Guide for Patients and Health Professionals; Genetic Alliance: Brisbane, Australia, 2009. [Google Scholar]
  34. Kouli, A.; Torsney, K.M.; Kuan, W.-L. Parkinson’s Disease: Etiology, Neuropathology, and Pathogenesis. In Parkinson’s Disease: Pathogenesis and Clinical Aspects [Internet]; Codon Publications: Brisbane, Australia, 2018. [Google Scholar]
  35. Kasten, M.; Hartmann, C.; Hampf, J.; Schaake, S.; Westenberger, A.; Vollstedt, E.-J.; Balck, A.; Domingo, A.; Vulinovic, F.; Dulovic, M.; et al. Genotype-Phenotype Relations for the Parkinson’s Disease Genes Parkin, PINK1, DJ1: MDSGene Systematic Review. Movement Disorders 2018, 33, 730–741. [Google Scholar] [CrossRef]
  36. Klein, C.; Westenberger, A. Genetics of Parkinson’s Disease. Cold Spring Harbor perspectives in medicine 2012, 2, a008888. [Google Scholar] [CrossRef]
  37. Lucking, C.B.; Durr, A.; Bonifati, V.; Vaughan, J.; De Michele, G.; Gasser, T.; Harhangi, B.S.; Meco, G.; Denefle, P.; Wood, N.W. Association between Early-Onset Parkinson’s Disease and Mutations in the Parkin Gene. New England Journal of Medicine 2000, 342, 1560–1567. [Google Scholar] [CrossRef]
  38. Stefanis, L. α-Synuclein in Parkinson’s Disease. Cold Spring Harbor perspectives in medicine 2012, 2, a009399. [Google Scholar] [CrossRef]
  39. Sharma, M.; Burré, J. α-Synuclein in Synaptic Function and Dysfunction. Trends in neurosciences 2023, 46, 153–166. [Google Scholar] [CrossRef] [PubMed]
  40. Cookson, M.R. α-Synuclein and Neuronal Cell Death. Molecular neurodegeneration 2009, 4, 1–14. [Google Scholar] [CrossRef]
  41. Krzisch, M.; Yuan, B.; Chen, W.; Osaki, T.; Fu, D.; Garrett-Engele, C.; Svoboda, D.; Andrykovich, K.; Sur, M.; Jaenisch, R. The A53T Mutation in α-Synuclein Enhances pro-Inflammatory Activation in Human Microglia. bioRxiv 2023, 2023–08. [Google Scholar] [CrossRef]
  42. Zilocchi, M.; Colugnat, I.; Lualdi, M.; Meduri, M.; Marini, F.; Corasolla Carregari, V.; Moutaoufik, M.T.; Phanse, S.; Pieroni, L.; Babu, M.; et al. Exploring the Impact of PARK2 Mutations on the Total and Mitochondrial Proteome of Human Skin Fibroblasts. Frontiers in Cell and Developmental Biology 2020, 8, 423. [Google Scholar] [CrossRef]
  43. Hershko, A.; Ciechanover, A. The Ubiquitin System. Annual review of biochemistry 1998, 67, 425–479. [Google Scholar] [CrossRef]
  44. MedlinePlus. UBE3A Gene. Available online: https://medlineplus.gov/genetics/gene/ube3a/ (accessed on 3 May 2025).
  45. Liang, Y.; Zhong, G.; Ren, M.; Sun, T.; Li, Y.; Ye, M.; Ma, C.; Guo, Y.; Liu, C. The Role of Ubiquitin–Proteasome System and Mitophagy in the Pathogenesis of Parkinson’s Disease. NeuroMolecular Medicine 2023, 25, 471–488. [Google Scholar] [CrossRef] [PubMed]
  46. Polymeropoulos, M.H.; Higgins, J.J.; Golbe, L.I.; Johnson, W.G.; Ide, S.E.; Di Iorio, G.; Sanges, G.; Stenroos, E.S.; Pho, L.T.; Schaffer, A.A.; et al. Mapping of a Gene for Parkinson’s Disease to Chromosome 4q21-Q23. Science 1996, 274, 1197–1199. [Google Scholar] [CrossRef]
  47. Deng, H.; Wang, P.; Jankovic, J. The Genetics of Parkinson Disease. Ageing research reviews 2018, 42, 72–85. [Google Scholar] [CrossRef] [PubMed]
  48. Bandres-Ciga, S.; Diez-Fairen, M.; Kim, J.J.; Singleton, A.B. Genetics of Parkinson’s Disease: An Introspection of Its Journey towards Precision Medicine. Neurobiology of disease 2020, 137, 104782. [Google Scholar] [CrossRef]
  49. Satake, W.; Nakabayashi, Y.; Mizuta, I.; Hirota, Y.; Ito, C.; Kubo, M.; Kawaguchi, T.; Tsunoda, T.; Watanabe, M.; Takeda, A.; et al. Genome-Wide Association Study Identifies Common Variants at Four Loci as Genetic Risk Factors for Parkinson’s Disease. Nature genetics 2009, 41, 1303–1307. [Google Scholar] [CrossRef]
  50. Tucci, A.; Nalls, M.A.; Houlden, H.; Revesz, T.; Singleton, A.B.; Wood, N.W.; Hardy, J.; Paisán-Ruiz, C. Genetic Variability at the PARK16 Locus. European Journal of Human Genetics 2010, 18, 1356–1359. [Google Scholar] [CrossRef]
  51. Funayama, M.; Hasegawa, K.; Kowa, H.; Saito, M.; Tsuji, S.; Obata, F. A New Locus for Parkinson’s Disease (PARK8) Maps to Chromosome 12p11. 2–Q13. 1. Annals of Neurology: Official Journal of the American Neurological Association and the Child Neurology Society 2002, 51, 296–301. [Google Scholar] [CrossRef]
  52. Genome Reference Consortium. The Genome Reference Consortium. Available online: https://www.ncbi.nlm.nih.gov/grc (accessed on 3 May 2025).
  53. National Library of Medicine. dbSNP. Available online: https://www.ncbi.nlm.nih.gov/snp/rs34637584 (accessed on 3 May 2025).
  54. Taymans, J.-M.; Fell, M.; Greenamyre, T.; Hirst, W.D.; Mamais, A.; Padmanabhan, S.; Peter, I.; Rideout, H.; Thaler, A. Perspective on the Current State of the LRRK2 Field. npj Parkinson’s Disease 2023, 9, 104. [Google Scholar] [CrossRef]
  55. National Cancer Institute Missense Mutation.
  56. Department of Health and Human Services. All of Us Research Hub. Available online: https://www.researchallofus.org/ (accessed on 2 May 2025).
  57. All of Us Research Program. Controlled CDR Directory (Archived C2022Q4R13 CDRv7). Available online: https://support.researchallofus.org/hc/en-us/articles/4616869437204-Controlled-CDR-Directory-Archived-C2022Q4R13-CDRv7 (accessed on 2 May 2025).
  58. Python. Python Source Releases. Available online: https://www.python.org/downloads/source/ (accessed on 3 May 2025).
  59. Hail Team. Install Hail on GNU/Linux. Available online: https://hail.is/docs/0.2/install/linux.html (accessed on 3 May 2025).
  60. Pandas. Installation. Available online: https://pandas.pydata.org/docs/getting_started/install.html (accessed on 3 May 2025).
  61. Jupyter. Installing Jupyter. Available online: https://jupyter.org/install (accessed on 3 May 2025).
  62. Department of Health and Human Services. All of Us Controlled Tier Dataset v7 CDR Release Notes (C2022Q4R13). Available online: https://docs.google.com/document/d/1tr-WqlUsJicbF9QeCkvhvQmMiSiwEg4vSLiQ0A5zR_4/edit?tab=t.0#heading=h.k6xpincu6nx5.
  63. Buchner, A.; Erdfelder, E.; Faul, F.; Lang, A.-G. G*Power. Available online: https://www.psychologie.hhu.de/arbeitsgruppen/allgemeine-psychologie-und-arbeitspsychologie/gpower (accessed on 3 May 2025).
  64. Peduzzi, P.; Concato, J.; Kemper, E.; Holford, T.R.; Feinstein, A.R. A Simulation Study of the Number of Events per Variable in Logistic Regression Analysis. Journal of clinical epidemiology 1996, 49, 1373–1379. [Google Scholar] [CrossRef]
  65. Johns Hopkins University. Young-Onset Parkinson’s Disease. Available online: https://www.hopkinsmedicine.org/health/conditions-and-diseases/parkinsons-disease/youngonset-parkinsons-disease (accessed on 3 May 2025).
  66. Kukkle, P.L.; Geetha, T.S.; Chaudhary, R.; Sathirapongsasuti, J.F.; Goyal, V.; Kandadai, R.M.; Kumar, H.; Borgohain, R.; Mukherjee, A.; Oliver, M.; et al. Genome-Wide Polygenic Score Predicts Large Number of High Risk Individuals in Monogenic Undiagnosed Young Onset Parkinson’s Disease Patients from India. Advanced Biology 2022, 6, 2101326. [Google Scholar] [CrossRef]
  67. University of California San Francisco. Calcium Blood Test. Available online: https://www.ucsfhealth.org/medical-tests/calcium-blood-test (accessed on 3 May 2025).
  68. National Institutes of Health. Calcium. Available online: https://ods.od.nih.gov/factsheets/Calcium-HealthProfessional/ (accessed on 3 May 2025).
  69. University of Florida. 25-Hydroxy Vitamin D Test. Available online: https://ufhealth.org/conditions-and-treatments/25-hydroxy-vitamin-d-test (accessed on 3 May 2025).
  70. Holick, M.F. Vitamin D Status: Measurement, Interpretation, and Clinical Application. Annals of epidemiology 2009, 19, 73–78. [Google Scholar] [CrossRef] [PubMed]
  71. National Library of Medicine. NM_198578.4(LRRK2):C.6055G>A (p.Gly2019Ser) AND Young-Onset Parkinson Disease. Available online: https://www.ncbi.nlm.nih.gov/clinvar/261088770/.
  72. National Library of Medicine. CALCOCO1 Calcium Binding and Coiled-Coil Domain 1 [ Homo Sapiens (Human) ]. Available online: https://www.ncbi.nlm.nih.gov/gene/57658 (accessed on 3 May 2025).
  73. Chen, W.; Ouyang, X.; Chen, L.; Li, L. Multiple Functions of CALCOCO Family Proteins in Selective Autophagy. Journal of Cellular Physiology 2022, 237, 3505–3516. [Google Scholar] [CrossRef] [PubMed]
  74. Hill, M.A.; Sykes, A.M.; Mellick, G.D. ER-Phagy in Neurodegeneration. Journal of Neuroscience Research 2023, 101, 1611–1623. [Google Scholar] [CrossRef]
  75. Zhang, X.-D.; Qi, L.; Wu, J.-C.; Qin, Z.-H. DRAM1 Regulates Autophagy Flux through Lysosomes. PLoS one 2013, 8, e63245. [Google Scholar] [CrossRef]
  76. National Library of Medicine. DRAM1 DNA Damage Regulated Autophagy Modulator 1 [ Homo Sapiens (Human) ]. Available online: https://www.ncbi.nlm.nih.gov/gene/55332 (accessed on 3 May 2025).
  77. Morita, E. Membrane Closure in Stress Induced-Autophagosome Formation. Cell Stress 2018, 2, 122. [Google Scholar] [CrossRef] [PubMed]
  78. National Library of Medicine. SINHCAF SIN3-HDAC Complex Associated Factor [ Homo Sapiens (Human) ]. Available online: https://www.ncbi.nlm.nih.gov/gene/58516 (accessed on 3 May 2025).
  79. Soudy, M.; Bars, S.L.; Glaab, E. Sex-Dependent Molecular Landscape of Alzheimer’s Disease Revealed by Large-Scale Single-Cell Transcriptomics. Alzheimer’s & Dementia 2025, 21, e14476. [Google Scholar] [CrossRef]
  80. Jiao, H.-S.; Yuan, P.; Yu, J.-T. TMEM106B Aggregation in Neurodegenerative Diseases: Linking Genetics to Function. Molecular Neurodegeneration 2023, 18, 54. [Google Scholar] [CrossRef]
  81. National Library of Medicine. RPH3A Rabphilin 3A [ Homo Sapiens (Human) ]. Available online: https://www.ncbi.nlm.nih.gov/gene/22895 (accessed on 3 May 2025).
  82. Wang, H.; Dou, S.; Wang, C.; Gao, W.; Cheng, B.; Yan, F. Identification and Experimental Validation of Parkinson’s Disease with Major Depressive Disorder Common Genes. Molecular Neurobiology 2023, 60, 6092–6108. [Google Scholar] [CrossRef]
  83. Shi, M.; Zhang, J. CSF α-Synuclein, Tau, and Amyloid β in Parkinson’s Disease. The Lancet Neurology 2011, 10, 681. [Google Scholar] [CrossRef]
  84. Ablinger, C.; Geisler, S.M.; Stanika, R.I.; Klein, C.T.; Obermair, G.J. Neuronal A2δ Proteins and Brain Disorders. Pflügers Archiv-European Journal of Physiology 2020, 472, 845–863. [Google Scholar] [CrossRef]
  85. Tröger, J.; Moutty, M.C.; Skroblin, P.; Klussmann, E. A-Kinase Anchoring Proteins as Potential Drug Targets. British journal of pharmacology 2012, 166, 420–433. [Google Scholar] [CrossRef]
  86. Perot, B.P.; Ménager, M.M. Tetraspanin 7 and Its Closest Paralog Tetraspanin 6: Membrane Organizers with Key Functions in Brain Development, Viral Infection, Innate Immunity, Diabetes and Cancer. Medical Microbiology and Immunology 2020, 209, 427–436. [Google Scholar] [CrossRef] [PubMed]
  87. Cruchaga, C.; Bradley, J.; Western, D.; Wang, C.; Da Fonseca, E.L.; Neupane, A.; Kurup, J.; Ray, Ni.; Jean-Francois, M.; Gorijala, P.; et al. Novel Early-Onset Alzheimer-Associated Genes Influence Risk through Dysregulation of Glutamate, Immune Activation, and Intracell Signaling Pathways. Research square 2024, rs-3. [Google Scholar] [CrossRef]
  88. National Library of Medicine. LALBA Lactalbumin Alpha [ Homo Sapiens (Human) ]. Available online: https://www.ncbi.nlm.nih.gov/gene/3906 (accessed on 3 May 2025).
  89. National Library of Medicine. RACGAP1 Rac GTPase Activating Protein 1 [ Homo Sapiens (Human) ]. Available online: https://www.ncbi.nlm.nih.gov/gene/29127 (accessed on 3 May 2025).
  90. Liu, X.; Wang, H.; Bei, J.; Zhao, J.; Jiang, G.; Liu, X. The Protective Role of miR-132 Targeting HMGA2 through the PI3K/AKT Pathway in Mice with Alzheimer’s Disease. American Journal of Translational Research 2021, 13, 4632. [Google Scholar] [PubMed]
  91. Ayers, K.L.; Eggers, S.; Rollo, B.N.; Smith, K.R.; Davidson, N.M.; Siddall, N.A.; Zhao, L.; Bowles, J.; Weiss, K.; Zanni, G.; et al. Variants in SART3 Cause a Spliceosomopathy Characterised by Failure of Testis Development and Neuronal Defects. nature communications 2023, 14, 3403. [Google Scholar] [CrossRef] [PubMed]
  92. National Library of Medicine. GATC Glutamyl-tRNA Amidotransferase Subunit C [ Homo Sapiens (Human) ]. Available online: https://www.ncbi.nlm.nih.gov/gene/283459 (accessed on 3 May 2025).
  93. Shu, L.; Zhang, Y.; Sun, Q.; Pan, H.; Tang, B. A Comprehensive Analysis of Population Differences in LRRK2 Variant Distribution in Parkinson’s Disease. Frontiers in Aging Neuroscience 2019, 11, 13. [Google Scholar] [CrossRef] [PubMed]
Table 1. Recoded Environment Variables (n= 34,162).
Item Category Value %
PD (n) Positive 369 1.08
Negative 33793 98.92
Age (n) < 50 8310 24.33
≥ 50 25852 75.67
Sex (n) Female 24201 70.84
Male 9961 29.16
Calcium (mg/dL) < 8.5 743 2.17
≥ 8.5 & < 9.0 4831 14.14
≥ 9.0 & < 9.5 17183 50.3
≥ 9.5 11405 33.39
Vitamin D (ng/mL) < 20 5219 15.28
≥ 20 & < 30 9999 29.27
≥ 30 & < 40 10394 30.43
≥ 40 8550 25.03
Alcohol consumption (n) Never 6771 19.82
Monthly or less 11244 32.91
2 to 4 per month 7042 20.61
2 to 3 per week 4714 13.80
4 or more per week 4391 12.85
The sample size of 34,162 excludes missing data from all 245,388 samples.
Table 2. Cross Table of PD and Recoded Environment Variables (n = 34,162).
Item Category PD positive
(n = 369)
PD negative
(n = 33,793)
p-value
Age (n) < 50 9 8301 < .0001
≥ 50 360 25492
Sex (n) Female 176 24025 < .0001
Male 193 8301
Calcium (mg/dL) < 8.5 8 735 < .0002
≥ 8.5 & < 9.0 84 4747
≥ 9.0 & < 9.5 180 17003
≥ 9.5 97 111308
Vitamin D (ng/mL) < 20 28 5191 < .0002
≥ 20 & < 30 85 9914
≥ 30 & < 40 138 10256
≥ 40 118 8432
Alcohol consumption (n) Never 103 6668 .0382
Monthly or less 115 11129
2 to 4 per month 53 6989
2 to 3 per week 48 4666
4 or more per week 50 4341
1Pearson’s Chi-square test. 2Mantel-Haenszel test for liner trend.
Table 3. AOR of Environmental Factors for PD (n = 34,162).
Item Category AOR (95% CI) p-value
Age (n) < 50 (Reference)
≥ 50 10.09 (5.18–19.64) < .000
Sex (n) Female 0.41 (0.34–0.51) < .000
Male (Reference)
Calcium (mg/dL) < 8.5 0.63 (0.30–1.32) 0.223
≥ 8.5 & < 9.0 (Reference)
≥ 9.0 & < 9.5 0.61 (0.47–0.79) < .000
≥ 9.5 0.49 (0.37–0.67) < .000
Vitamin D (ng/mL) < 20 0.70 (0.46–1.08) 0.112
≥ 20 & < 30 (Reference)
≥ 30 & < 40 1.46 (1.11–1.92) .007
≥ 40 1.56 (1.17–2.07) .002
Alcohol consumption (n) Never (Reference)
Monthly or less 0.89 (0.68–1.16) .389
2 to 4 per month 0.59 (0.42–0.83) .002
2 to 3 per week 0.73 (0.52–1.03) .077
4 or more per week 0.66 (0.47–0.93) .016
AOR is the adjusted odds ratio. The sample size 34,162 is a result that excluded missing data from all 245,388 samples. The result was calculated by the StatsModels module on Python.
Table 4. ORs of LRRK2 G2019S and Other SNPs With Similar ORs and 95% CI Ranges (OR ≥ 5.00, 95% CI ≤ 10 (n = 245,394, Outcome: PD positive/negative).
Base No. (GRCh38.p14) OR (95% CI) Original p-value Adjusted p-value Gene Name
1860203 5.58 (2.76–11.31) < .000 < .000 CACNA2D4
4628152 5.43 (2.43–12.11) < .000 < .000 AKAP3
11869533 5.94 (2.93–12.05) < .000 < .000 ETV6
13537468 5.25 (2.97–9.27) < .000 < .000 GRIN2B
30983164 5.53 (2.60–11.76) < .000 < .000 TSPAN11
38321345 5.77 (2.85–11.69) < .000 < .000 ALG10B
40340400 (G2019S) 5.46 (2.90–10.27) < .000 < .000 LRRK2 (PARK8)
48569196 5.28 (2.61–10.70) < .000 < .000 LALBA
49990203 5.09 (2.26–11.48) < .000 .002 RACGAP1
52107506 5.33 (2.36–12.02) < .000 .001 SMIM41
65955867 5.06 (2.24–11.42) < .000 .002 HMGA2
66254622 5.87 (2.89–11.89) < .000 < .000 IRAK3
81260048 5.30 (2.35–11.96) < .000 .001 ACSS3
108544453 5.01 (2.48–10.15) < .000 < .000 SART3
120460300 5.69 (2.67–12.10) < .000 < .000 GATC
Table 5. Odds Ratios of Single Nucleotide Polymorphism for Parkinson’s Disease Adjusted by Age, Sex, Calcium Level, Vitamin D Level, and Alcohol Drinking Habits Factors (n = 34,162).
Base No. (GRCh38.p14) OR (95% CI) AOR (95% CI) AOR p-value Gene Name
53711362 7.48 (2.30–24.37) 5.00 (1.51–16.59) .009 CALCOCO1
31281818 6.57 (1.56–27.69) 4.37 (1.02–18.78) .047 SINHCAF
101921705 7.67 (1.81–32.56) 5.51 (1.27–23.95) .023 DRAM1
47968795 4.97 (1.19–20.71) 7.83 (1.82–33.62) .006 TMEM106C
112791809 5.61 (1.34–23.44) 8.19 (1.89–35.46) .005 RPH3A
AOR is the adjusted odds ratio. Since the Hail logistic regression tool does not provide a dummy variable function and does not calculate the AORs of variables that are used for adjustment, we obtained only the AORs of SNPs.
Table 6. Odds Ratios of LRRK2 (PARK8 ) and other Single Nucleotide Polymorphism for Parkinson’s Disease Adjusted by Age, Sex, Calcium Level, Vitamin D Level, and Alcohol Drinking Habits Factors (n = 34,162).
Base No. (GRCh38.p14) OR (95% CI) AOR (95% CI) AOR p-value Gene Name
1860203 4.77 (1.49–15.29) 4.60 (1.41–15.03) .012 CACNA2D4
13537468 5.68 (1.41–22.82) 4.52 (1.12–18.23) .034 GRIN2B
30983146 5.12 (1.59–16.45) 4.41 (1.35–14.45) .014 TSPAN11
40340400 (G2019S) 5.52 (2.00–15.21) 5.56 (1.99–15.57) .001 LRRK2 (PARK8)
49990203 5.89 (1.82–18.99) 4.29 (1.31–14.08) .016 RACGAP1
81260048 5.03 (1.57–16.45) 4.23 (1.30–13.83) .017 ACSS3
120460300 5.22 (1.62–16.77) 4.32 (1.33–14.05) .015 GATC
AOR refers adjusted odds ratio. The results were calculated by Hail logistic regression tool.
Table 7. AORs of 53,711,362th base (CALCOCO1), 31,281,818th base (SINHCAF), 101,921,705th base (DRAM1), 47,968,795th base (TMEM106C), 112,791,809th base (RPH3A), and Environmental Factors.
Item Category chr12:53711362
(n = 34,162)
chr12: 31281818
(n = 34,158)
chr12: 101921705
(n = 34,150)
chr12: 47968795
(n = 34,144)
chr12: 112791809
(n = 16,972)
AOR
(95% CI)
p-value AOR
(95% CI)
p-value AOR
(95% CI)
p-value AOR
(95% CI)
p-value AOR
(95% CI)
p-value
SNP Reference nucleotide (Reference) (Reference) (Reference) (Reference) (Reference)
Polymorphic nucleotide 4.86
(1.46–16.18)
.010 4.37
(1.02–18.82)
.048 5.38
(1.23–23.51)
.025 7.82
(1.81–33.83)
.006 8.05
(1.85 – 35.05)
.005
Age (n) < 50 (Reference) (Reference) (Reference) (Reference) (Reference)
≥ 50 10.04
(5.16–19.55)
< .000 10.08
(5.18–19.62)
< .000 10.07
(5.17–19.60)
< .000 10.10
(5.19–19.67)
< .000 11.44
(4.22 – 31.01)
< .000
Sex (n) Female 0.42
(0.34–0.52)
< .000 0.41
(0.34–0.51)
< .000 0.42
(0.34–0.51)
< .000 0.41
(0.33–0.51)
< .000 0.55
(0.40 – 0.74)
< .000
Male (Reference) (Reference) (Reference) (Reference) (Reference)
Calcium (mg/dL) < 8.5 0.56
(0.26–1.21)
.014 0.64
(0.30–1.32)
.227 0.64
(0.31–1.33)
.227 0.64
(0.30–1.32)
.226 0.66
(0.20 – 2.16)
.489
≥ 8.5 & < 9.0 (Reference) (Reference) (Reference) (Reference) (Reference)
≥ 9.0 & < 9.5 0.61
(0.47–0.79)
< .000 0.61
(0.47–0.79)
< .000 0.61
(0.47–0.79)
< .000 0.61
(0.47 – 0.79)
< .000 0.68
(0.46 – 1.00)
.050
≥ 9.5 0.49
(0.37–0.67)
< .000 0.50
(0.37–0.67)
< .000 0.49
(0.37–0.67)
< .000 0.49
(0.36–0.66)
< .000 0.50
(0.32 – 0.78)
.002
Vitamin D (ng/mL) < 20 0.71
(0.46–1.09)
.118 0.71
(0.46–1.09)
.115 0.71
(0.46–1.09)
.114 0.72
(0.46–1.10)
.130 0.50
(0.24 – 1.03)
.059
≥ 20 & < 30 (Reference) (Reference) (Reference) (Reference) (Reference)
≥ 30 & < 40 1.44
(1.10–1.90)
.009 1.45
(1.11–1.91)
.007 1.45
(1.11–1.91)
.007 1.48
(1.13 – 1.95)
.005 1.52
(1.02 – 2.26)
.040
≥ 40 1.55
(1.16–2.05)
.003 1.55
(1.17–2.06)
.002 1.56
(1.17–2.07)
.002 1.59
(1.20 – 2.11)
.001 1.76
(1.18 – 2.64)
.006
Alcohol
consumption (n)
Never (Reference) (Reference) (Reference) (Reference) (Reference)
Monthly or less 0.89
(0.68–1.17)
.397 0.89
(0.67–1.16)
.377 0.89
(0.68–1.17)
.394 0.89
(0.68 – 1.16)
.391 0.99
(0.67 – 1.46)
.961
2 to 4 per month 0.59
(0.42–0.83)
.002 0.59
(0.42–0.83)
.002 0.59
(0.42–0.83)
.002 0.58
(0.41 – 0.81)
.002 0.66
(0.41 – 1.06)
.085
2 to 3 per week 0.71
(0.50–1.01)
.060 0.73
(0.52–1.04)
.079 0.73
(0.51–1.03)
.071 0.73
(0.51 – 1.03)
.072 0.66
(0.39 – 1.13)
.128
4 or more per week 0.65
(0.46–0.92)
.015 0.66
(0.47–0.93)
.016 0.66
(0.47–0.93)
.016 0.66
(0.47 – 0.93)
.017 0.70
(0.43 – 1.16)
.165
AOR refers adjusted odds ratio. For 53,711,362th base, missing samples were 16, EPV = 28.31 ≥ 10; for 31,281,818th base, missing samples were 4, EPV = 28.38 ≥ 10; for 101,921,705th base, missing samples were12, EPV = 28.38 ≥ 10; for 47,968,795th base, missing samples were 18, EPV = 28.31 ≥ 10; for 112,791,809th base, missing samples were 17,190, EPV = 13.77 ≥ 10.
Disclaimer/Publisher’s Note: The statements, opinions and data contained in all publications are solely those of the individual author(s) and contributor(s) and not of MDPI and/or the editor(s). MDPI and/or the editor(s) disclaim responsibility for any injury to people or property resulting from any ideas, methods, instructions or products referred to in the content.
Copyright: This open access article is published under a Creative Commons CC BY 4.0 license, which permit the free download, distribution, and reuse, provided that the author and preprint are cited in any reuse.
Prerpints.org logo

Preprints.org is a free preprint server supported by MDPI in Basel, Switzerland.

Subscribe

Disclaimer

Terms of Use

Privacy Policy

Privacy Settings

© 2025 MDPI (Basel, Switzerland) unless otherwise stated