
Submitted:
21 August 2025
Posted:
29 August 2025
You are already at the latest version
Abstract
Climate evolution is revisited in terms of the Theory of Dynamical Systems, successfully used in predictions of catastrophic events as avalanches, landslides, or economy and civilization collapses. Such tippings are announced by warning signs, named “critical softening”, allowing a tipping date estimate through well-known equations. In the case of climate the warning signs are extreme events of increasing amplitudes. In such a context, numerical simulations cannot predict incoming tipping points, due to a divergence of computational time at the singularity. This is probably the reason why numerical predictions are systematically revised upwards with every new IPCC report. Based on such warning signals, a recent publication of Copenhagen University shows that the Atlantic Meridional Oceanic Circulation is likely to collapse well before the end of the century, triggering switchover cascades, eventually culminating in global climate tipping. Paleoclimatic studies also show that tippings occurred in the past, particularly during the PETM event 56 Myrs ago. If this was to happen now, average global temperatures might reach an unbearable level, with a deadline much closer than expected. This extreme emergency has major consequences on implementation times of sustainability policies, in energy production, mobility, agriculture, housing …, that absolutely must be operational on time.
Keywords:
climate tipping
; extreme climatic events
; critical systems
; dynamical systems
; energy production
; IPCC
; numerical simulations
; sustainability
; renewable energy
; climatic emergency
1. Introduction
We are experiencing an unprecedented climate crisis, at least at human scale. In particular, during the last million years, Earth’s surface temperature has fluctuated through a succession of ice ages separated by warmer episodes, with a period of about 100,000 years, essentially due to changes in its orbital parameters. The last ice age ended about 15,000 years ago, temperatures fluctuating by ± 0.5oC or so during the last 12,000 or 10,000 years. This is presumably one of the reasons why humans evolved in this period from nomad hunters-gatherers to sedentary “farmers”. Such a stable climate would have been expected to last for another 80,000 years or so, but an unexpected sudden change of climate control parameters started in the end of 19th century, with the beginning of the industrial era and the associated skyrocketing emission rate of greenhouse gases (GHG). About 150 years later, the average temperature anomaly (temperature increase from pre-industrial period) is now overshooting the upper 1.5 oC threshold set by the Paris conference, and previsions published by every next IPCC report have to be systematically revised upwards, which raises a number of questions and concerns on current prevision procedures. This is why the present paper aims at revisiting the climate prevision methods on the basis of strong and undebatable physical arguments.
2. The State of the Art, from Simple to Complex Systems
According to the tradition, Isaac Newton devised his gravitation theory observing an apple falling from an apple tree. For this purpose, he simply considered the interaction between two bodies, the apple and the planet Earth, neglecting tree leaves shivering in the wind and bugs running in the grass. On the opposite, Henri Poincaré demonstrated in 1892 that the behavior of N-body systems made of interacting objects, as our solar system for instance, though acknowledged to obey laws as simple as Newton’s gravitation, may at some time become chaotic. The apparent stability of such systems is only temporary, and its observation for some time is no guarantee of its continued existence.
The climatic system obviously belongs to the second type. The fact that no climatic tipping or collapse has ever been directly observed by humans cannot ensure this situation will last forever. A number of tipping points have indeed been identified in paleoclimatic studies [1,2,3].
As part of Poincaré’s deterministic chaos, the theory of dynamical systems helps finding equilibrium points in a complex system. Stable equilibrium points are named “attractors”, and unstable ones “repulsors”. A continuous variation of control parameters (e.g. GHG concentration for climate) usually results in a continuous drift of “order parameters” (e.g. temperature in the case of climate). But it may happen that during such a drift the attractor meets a neighbor repulsor, with which it merges (e.g. [4,5]). The system suddenly becomes unstable, and rapidly evolves onto the nearest attractor. This type of bifurcation, called “tipping point”, corresponds to a discontinuous change of the order parameter (temperature in our case). As all elements of complex systems are strongly correlated, such bifurcations may simultaneously affect climate as well as food production, health or life expectancy for instance, up to possible major economical or geopolitical switchovers, as so many pins (i.e. “secondary” tipping points) in a bowling game.
3. Climate Prevision Methods
3.1. The Precursors
Let us start with the precursors. Dennis and Donella Meadows, Jorgen Randers and William Behrens published in 1972 the famous “Meadows report” commissioned by the MIT (Massachusetts Institute of Technology) at the request of the Club of Rome [6,7]. It outlined (Figure 1) that just because resources were decreasing (in green), and population increasing (in black), food per capita, then life expectancy and industrial activity had inevitably to go through a maximum (impressively estimated at this time to occur around 2024), before eventually declining. On this basis, agronomist René Dumont warned in 1974 on the risk of a total collapse of our civilization in the 21st century.
3.2. Numerical Simulations
Since then, forecasting techniques have improved through the spectacular computing power we got at the turn of 21st century, allowing large scale climate simulations, periodically synthetized and published in IPCC reports. For this purpose, the "ocean-atmosphere system" is divided into a large number of 3-dimensional boxes, just like 2-dimensional pixel arrangements in camera sensors. Each of these cells is assigned initial conditions of temperature, pressure, humidity, wind speed, and other relevant parameters. In contrast to camera pixels, these cells then periodically exchange such information with each other, and respond by modifying their own state, through physical (but also phenomenological) laws. Some of these data include different possible scenarios of greenhouse gas emissions or political or economic decisions (or indecisions), that result in different forecast trends depending on the chosen scenario. A typical example of results is shown on Figure 2 [8].
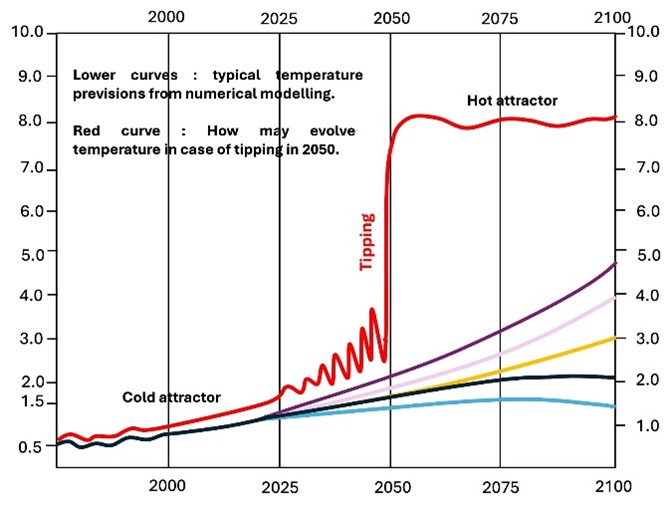
It can be noticed that, in spite of the sudden jump of GHG injection rate, doubled in 150 years, the predicted evolution remains continuous in every case (no tipping point). However, as mentioned above, forecasts disclosed by every next IPCC report have to be systematically revised upwards, suggesting a possible flaw in corresponding prevision techniques.
A characteristic of complex systems is indeed the sensitivity to initial conditions, commonly known as “butterfly wings effect”. For this reason, climate simulations require a constant upgrading of input data accuracy in order to improve their reliability. This is obtained through a reduction of cell sizes, i.e. an increase in cell number, in the same way as an increase of pixel number enhances image sharpness in a camera. As the number of cell interactions grows up much faster than cell number, the computation time becomes readily prohibitive, and one has to resort to simplification methods. They usually consist in merging neighbor cells into larger groups (supercells), and attributing to each of them the average of the properties of the cells they are made of. Such an operation reduces the number of elements the computers have to deal with, speeding up the computation time, but simultaneously decreasing the accuracy of data ascribed to supercells, due to the averaging procedure. We end up with a vicious circle, in which accuracy improvement and information losses balance each other. As a consequence, the possible occurrence of a tipping point, which is a mathematical singularity, extremely sensitive to possible butterfly effects, is blurred out, due to the divergence of the computing time resulting from the skyrocketing number of cells that should operate at the bifurcation. This is why numerical simulations are unable to predict any possible incoming tipping point. The systematic underestimate of climate warming rate is a confirmation of such a flaw.
3.3. The Theory of Dynamical Systems
Let us now turn to the Theory of Dynamical Systems. Highly non-linear systems usually have numerous attractors. How should we be informed on whether we are staying in an attractor for some time, or instead heading to a nearby tipping point that would propel us onto a new and still unexplored attractor? Figure 3 shows a schematic potential profile. The temperature axis is horizontal, increasing from left to right. On the left, Earth is in equilibrium like a balloon at the bottom of a trough. It stays in the “cold” attractor AC, separated from a hotter attractor AH by a repulsor R.
On the left image of Figure 3, because of statistical noise (ordinary meteorological fluctuations), the balloon representing the Earth slightly swings forth and back, representing the usual small heat strokes or cold snaps, around an average temperature value close to the valley bottom. This is Gaïa, the Earth that James Lovelock had assumed to be stable in a self-regulating state. Now, if we gradually increase the amount of GHGs (mainly CO2) in the atmosphere, the profiles of these valleys would be distorted. In the middle image, Earth would still stay in equilibrium at the bottom of the trough, but the trough itself would have shifted to the right. The “average climate“ would have turned warmer. But in addition, due to the nearby repulsor R, the valley floor flattens, and similar statistical noises would result in increasingly important oscillations of temperatures, due to a smaller restoring force from the potential profile. It results in a broadening of oscillation distributions. Heat waves and cold snaps would turn stronger and stronger, and so would rains, droughts, storms and associated forest fires.
A further (and fundamental) clue that we are actually approaching a tipping point is that the distribution becomes more and more asymmetric, with an increasing weight of largest events. This obviously results from the increasing asymmetrical shape of the potential profile in Figure 3, that flattens more on the right-hand side than on the left one. Both broadening and asymmetry are clearly confirmed and illustrated in a NASA recent publication (Figure 4) [9].
This distortion of the distributions to the right is exactly what we qualitatively expect in a gradual transition from a “Gaussian-like” bell-shaped curve (weakly-correlated events) to a power law, characteristic of a highly correlated system (critical state), in which the smallest events are the most probable, while the largest ones may be of impressive amplitudes, but are the least frequent, to the point that their rarity often makes them escape our vigilance. They are also named scale invariant or “fat-tailed” distributions [10]. Such an evolution from bell-shaped to fat-tailed distributions is the signature of the famous precritical fluctuations, known in phase transitions as “critical softening”, and in climatology as extreme events, and should be understood as a clear warning signal for an incoming tipping point. This NASA publication totally confirms what Figure 3 diagrams suggest, but also what we are feeling year after year.
Similar climate tippings have actually taken place in the past, as analyzed by a number of climatologists and paleoclimatologists [11,12,13,14,15,16,17,18]. Most of them have contemplated a possible applicability to the current situation. The key point is now to determine when it is supposed to happen, and what should be the corresponding temperature jump.
4. Estimates of Tipping Date and Temperature Jump
Based on a thorough analysis of tipping points precursory signs, a group of geophysicists from Zürich was able to develop a method a few years ago which predicts the date of serac collapse in glaciers [19,20]. They recorded fluctuations in glacier flow velocity using GPS beacons. The oscillatory "runaway" of these warning signs allowed them to determine the date of the collapse with an impressive accuracy, from 24 to 48 hours, which made it possible to evacuate in time the villages located downstream.
An analysis of the same type, also based on the approach of a critical point in the Theory of Dynamical Systems, was used at Copenhagen University to predict the time slot for a collapse of ocean currents circulation in the Atlantic, or "AMOC", which is a key element in the climate bowling game [21]. They showed that “AMOC collapse may occur as soon as 2025, but more probably around the middle of this century “This event would lead to a series of chain reactions, triggering, as in a kind of gigantic domino tumbling, a number of other switchovers, including climate [1,2,3]. This is imminent. We are in an absolute emergency, all the more as the system has inertia. If we don't take drastic action right now, it will be too late. Once the tipping point has been passed, it will no longer be possible to step back, even if GHG gas concentration was reduced to its preindustrial value. We should have to wait indeed for the next ice age, typically in 80,000 years or so.
Now, what should we expect in terms of temperatures? While broadening and asymmetry of temperature distributions provide a clear evidence for a nearby tipping point, we have shown above that numerical simulations fail at the approach of such a singularity. Using such numerical tools to estimate future temperatures beyond tipping is therefore hopeless. We should just guess that, due to the discontinuous jump, they would be significantly higher than what numerical predictions say. The only way to get a somewhat more precise idea is a comparison with previous tipping events. Let us refer for instance to the PETM (Paleocene-Eocene Thermal Maximum) that occurred 56 million years ago, during which roughly the same total amount of CO2 as that we are injecting now was introduced. As it ended up about 10°C above the preceding period, we may expect more or less a comparable order of magnitude, despite the fact than the conditions were somewhat different. A lot of species, both plants and animals (including humans), would have to worry about their survival, just because they are interdependent. Such a temperature jump is considerably above the most pessimistic statements based on numerical simulations, that predicted a warming of about 4oC by the end of the century. One consolation however is that this fiery hell will be quiet, because after passing the tipping point the system would probably fall into a “normal” narrow valley, a new Gaïa, where the precritical oscillations will have disappeared. But alas, the probability that we'll still be around to enjoy this renewed calm is relatively low.
5. How to Manage the Situation and Avoid the Incoming Disaster?
Both the proximity and the expected amplitude of climate tipping impose crucial constraints on sustainability climatic policies, concentrating our efforts on an immediate and drastic reduction of GHG emission, in fields as varied as energy, mobility, agriculture, water resources, migrations, architecture, etc. Within an even shorter term, precritical fluctuations (extreme events) require taking also into account mitigation constraints. The unprecedented emergency we are facing in both cases makes it absolutely compulsory to give up any project that would require more than a few years to work properly and efficiently. We have to focus only on already tried-and-tested and immediately operational carbon-free technologies.
5.1. Energy
Energy is the driving force of our technical civilization. It is often produced as thermal (disordered) energy, but mainly used in its (ordered) mechanical or electrical forms. The transformation of the former into the latter requires the use of a “thermal machine” that operates between two different “heat sources”, and necessarily obeys Carnot’s law. This law states that the maximum attainable efficiency is given by 1-Tc/Th, where Tc and Th are the temperatures (in Kelvins) of respectively cold and hot sources. In an electric power plant, Th is the temperature of water vapor at turbine inlet, and Tc that of the river that cools down water at the outlet. In usual conditions, Carnot’s efficiency of a thermal machine is around 30 to 35%, which means that producing 1kWh of electricity forces 2kWh out into atmosphere, rivers or oceans, with all damages that can be imagined on local biodiversity. This is the case for fossil fuel plants (coal, fuel, gas), for biomass, but also for … nuclear plants, that only differ from the previous ones by the heating method, nuclear reactions instead of burning carbon-rich fossil stuff. This has obvious consequences on water resources, and conversely because such plants have to be slowed down or even stopped in case of water shortage. In addition to such an energy waste associated with thermal machines, further nuclear energy development, as the 14 European Pressurized Reactors (EPR) planned in France for instance, is probably the most striking example of what has absolutely to be set aside due to climatic emergency. Such reactors will not even start contributing to reduction of CO2 emissions until 2040 or 2050. As mentioned above, there is a non-negligible “chance” that the climate would have tipped over well before. And so, such investments would serve absolutely no purpose, except to waste money that could have accelerated renewable energies set up! In terms of lead times, such reactors cannot compete indeed with off-shore windmill farms of a comparable power that can become operational within a few years, not to mention a significantly lower investment and maintenance costs [22]. All the more, hypothetical future fusion reactors, fast neutron (breeder) reactors ad other long development techniques, in spite of their possible potential interest, should be immediately abandoned.
5.2. Extreme Hydrological Events
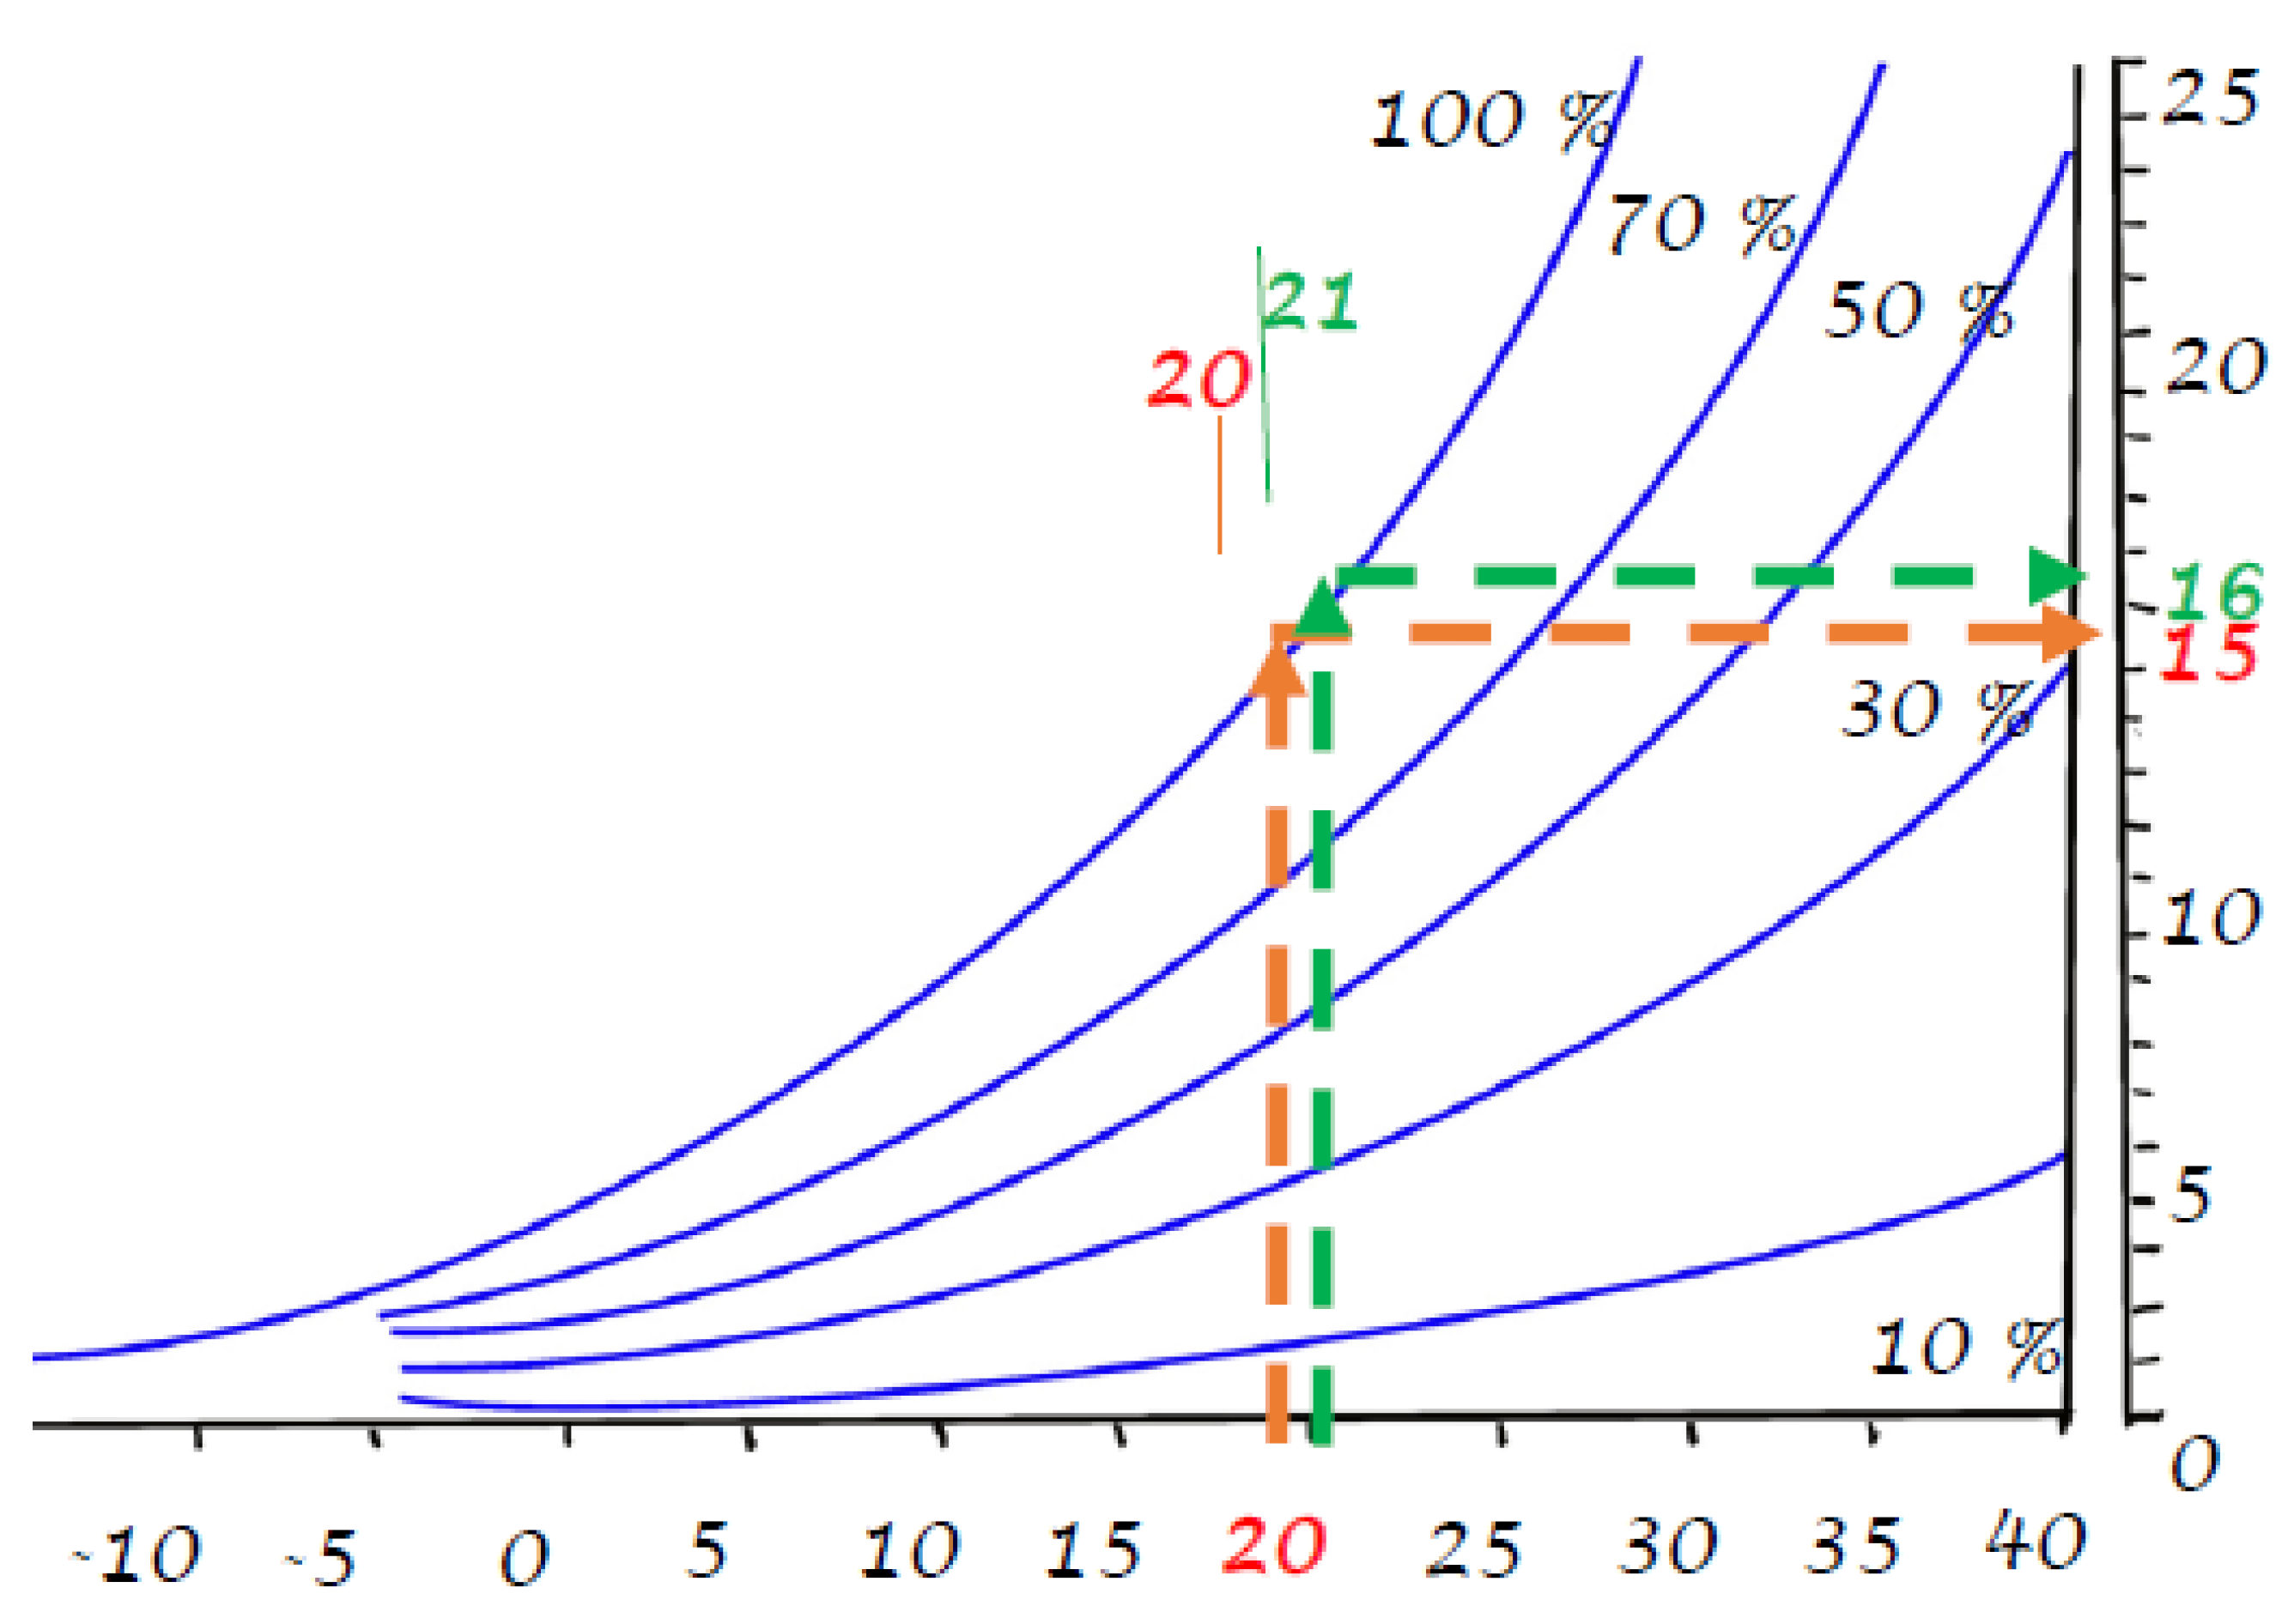
There is a common belief that episodes of intense rainfall we are experiencing are due solely to the rise in temperatures caused by global warming, just because a warmer atmosphere would contain more water vapor, and therefore produce more rain. But how to understand then why Gobi or Sahara deserts are not turning green again? The well-known saturation curve given by the Clausius-Clapeyron equation and represented in Figure 5 (top curve labelled 100%) shows indeed that the maximum amount of vapor the atmosphere can hold at a temperature of around 20oC (saturation curve) increases by about 7% per additional degree. But does that really mean that the average amount of rain would automatically increase by 7%, as too often claimed? What we are talking about is 7% of the maximum allowed amount of vapor in air at 20oC before the temperature is raised by 1oC. Figure 5 shows that around 20oC this “saturating” quantity of vapor is 15g / kg of air, i.e. 1.5% of air mass. And 7% of 1.5% is roughly 1 / 1000!
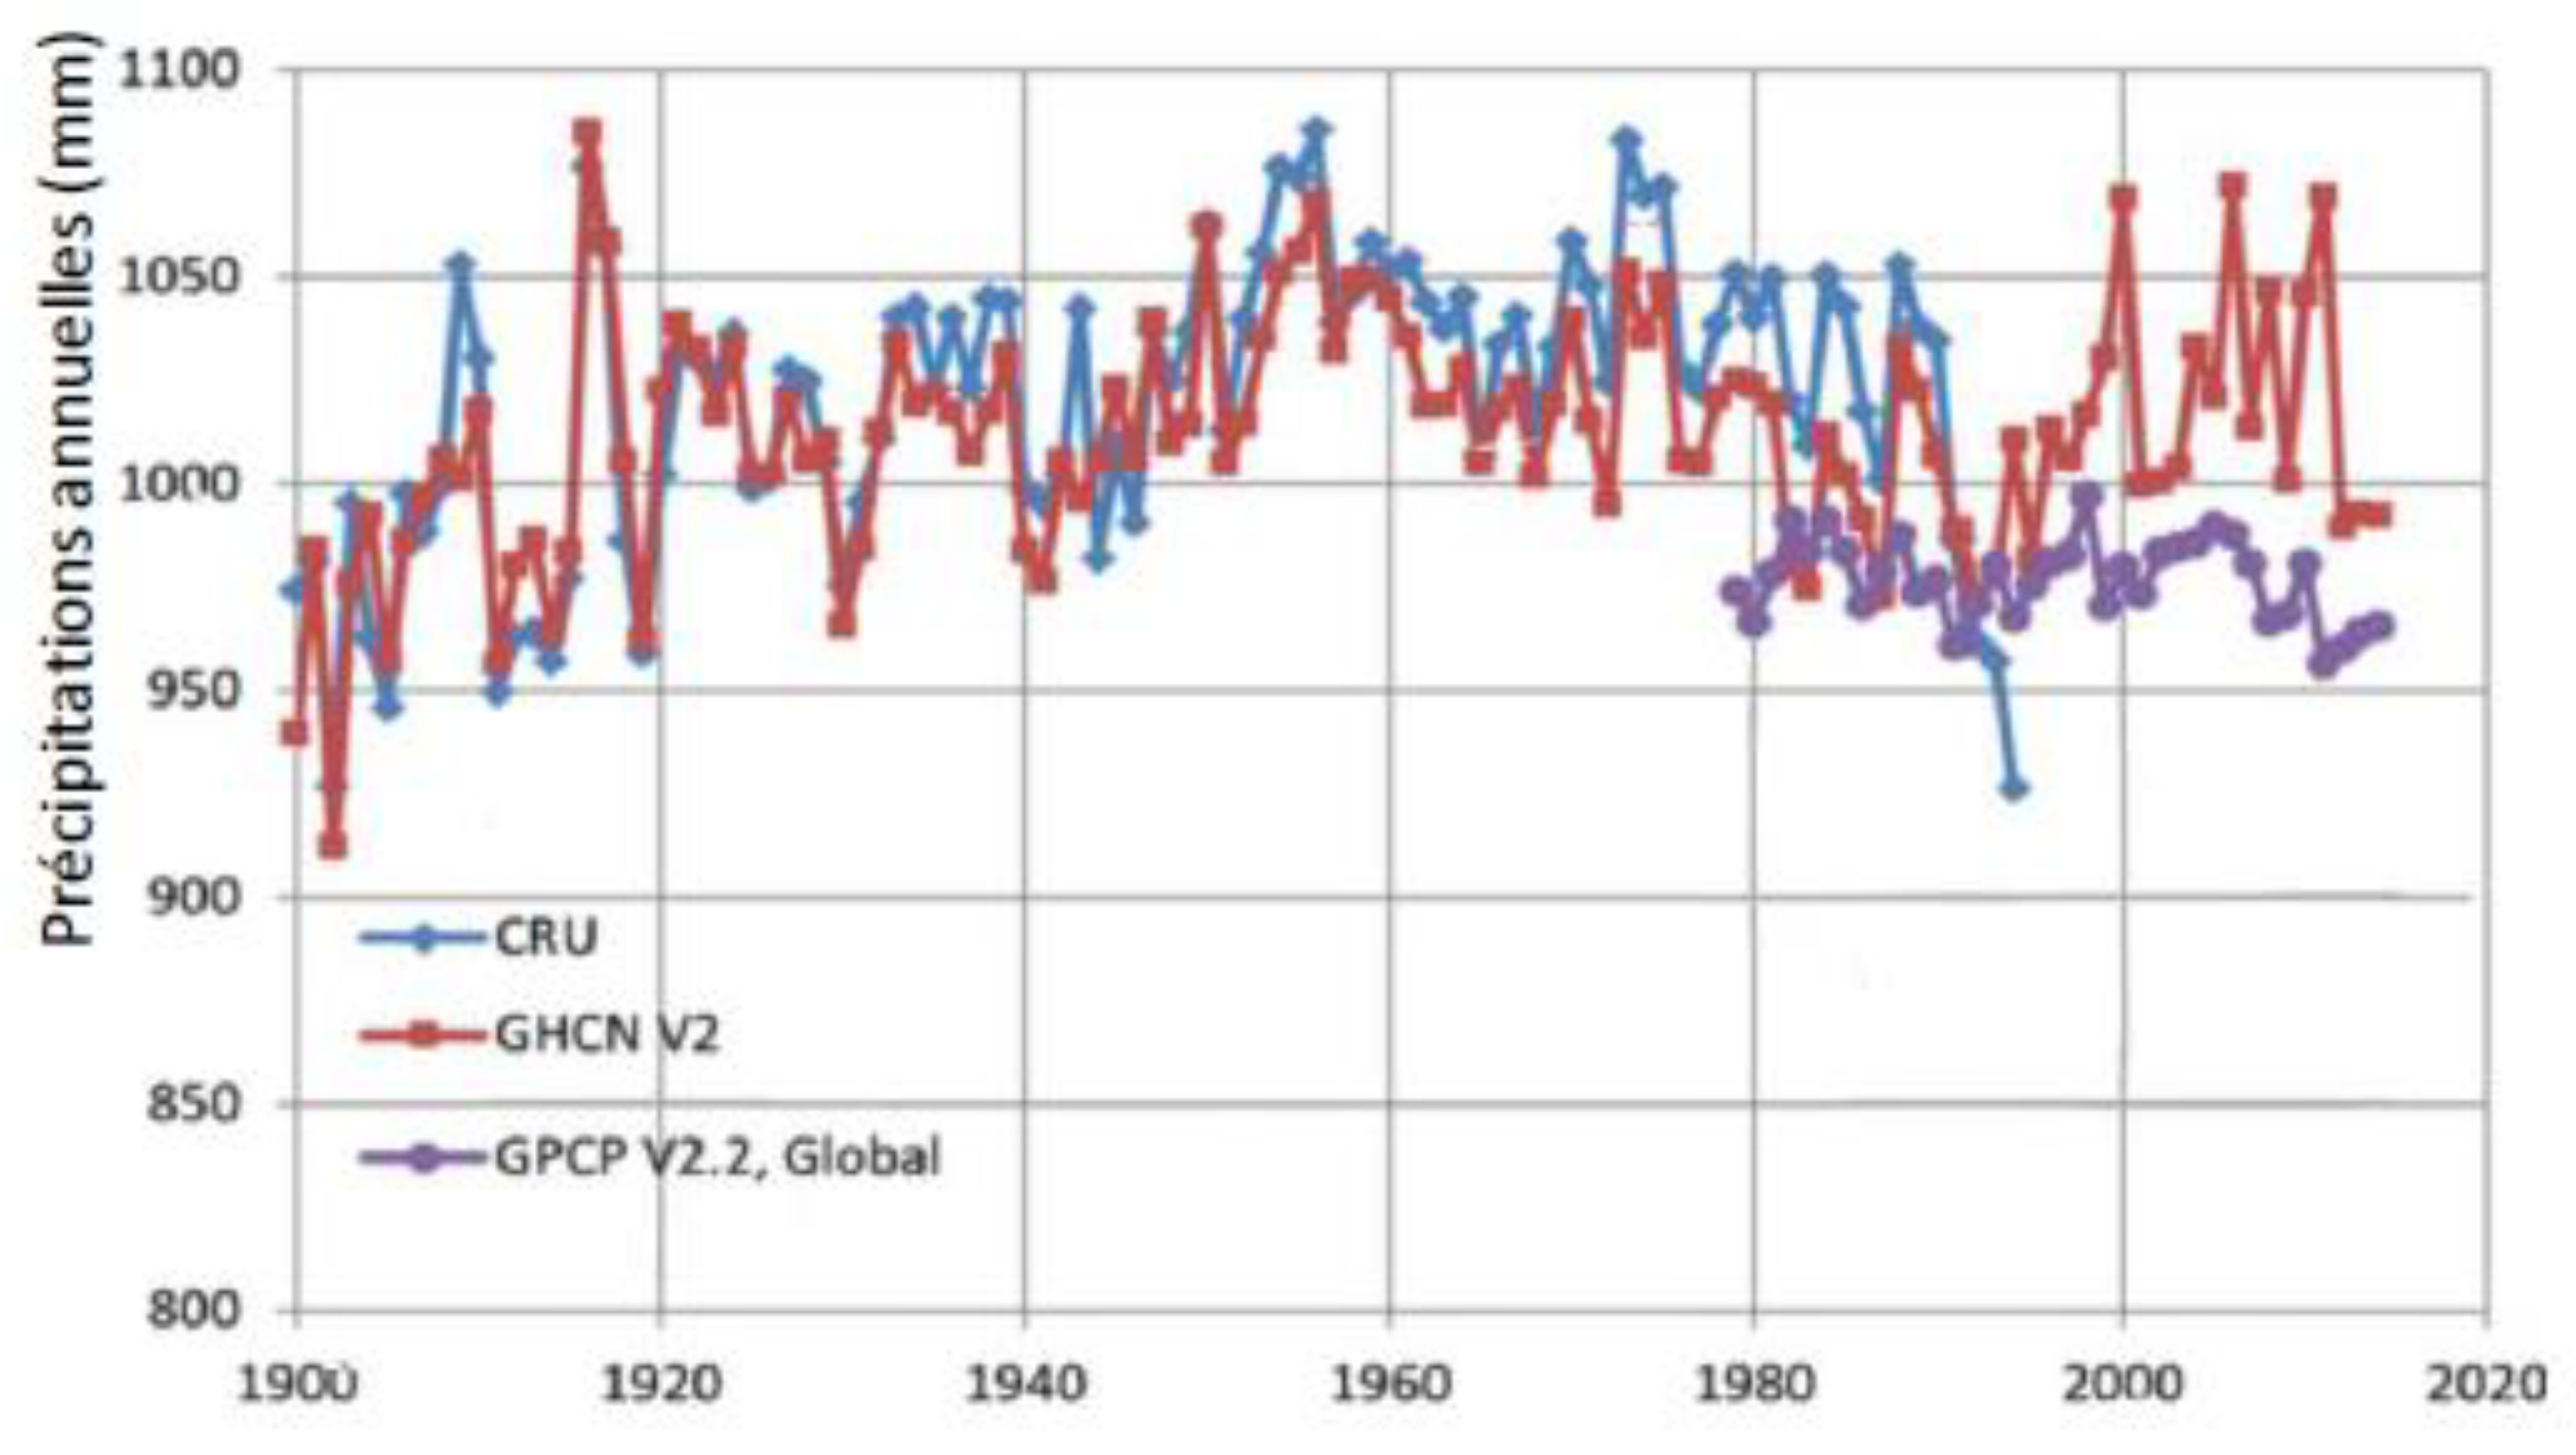
Moreover, and this is the main point, Figure 6 shows that there is not the slightest trend of an increase in the world average level of precipitation since ... 1960. It seems obvious that the only reasonable explanation results from local fluctuations in time and space. The atmosphere is not always and everywhere saturated with water vapor, often a long way off... It only rains somewhere when vapor reaches saturation locally, due to a temperature fluctuation, or to an incoming humid air mass in a cold zone, for example. It cannot be inferred from an increase by 7% of the maximum allowed proportion of water vapor in the atmosphere that the global precipitation average would also raise by 7%! Actually, it is not raining more, as shown on Figure 6, but it is raining more violently and more intermittently. Such a behavior perfectly illustrates the pre-critical fluctuations discussed above. Nevertheless, practical consequences of a same amount of rain falling continuously or intermittently are totally different on agriculture, human mobility, and water supply, for instance, with possible cascading effects on housing organization, migrations, etc, and have to be seriously taken into account.
5.3. Heating and Cooling
As production of 1kWh of electricity from heat implies a waste of 2kWh as mentioned above, heating buildings with electric radiators that transform back this precious “ordered” electric energy into heat is nothing but a heresy. By contrast, heat pumps do not produce heat from electricity, but simply transfer heat from outdoor to inject it indoor. The electricity consumption is restricted to pump operation, just as in a fridge. In addition, most heat pumps can run backwards in summer, in air conditioning mode, which electric heaters can't. And of course wood burning is also a virtuous heating solution in sparsely populated areas, with a net zero CO2 emission as long as the overall wood consumption does not exceed tree growing rate.
In any case, in the current climate perspective, it is essential not to reproduce or extrapolate old patterns. We need to imagine new, modular and smart solutions, playing between insulation and thermal inertia, combining winter insulation through innovative techniques and summer night ventilation that could be inspired by the traditional architecture of tropical countries. People who do not live in the middle of the forest or at the foot of a waterfall may opt for vegetalized or clear reflective roofs, white or vegetalized facades, wide roof overhangs, flysheets (that may be equipped with photovoltaic panels) allowing circulation of cooler air during summer nights, (or production of sun preheated air for heating during beautiful winter days). And why not structures on stilts that could be closed in winter to store firewood?
5.4. Mobility
Transportation is one of the main sources of CO2 emissions. The International Energy Agency (IEA) recommended (in 2021) zero CO2 emissions by 2050, but this set date is obviously too late. The unexpected dramatic proximity of climate tipping requires significantly more drastic measures. A similar comment should be made about European Union recommendation to stop selling fossil fuel powered cars by 2035. A number of them would still be in working order and producing CO2-rich exhaust until 2055, too late to contribute fighting against climate tipping. Large scale production of Hydrogen powered planes or cars may seem fascinating at first glance, but if such projects are mostly based on Hydrogen production using fossil stuff combustion or nuclear made electricity, it would be nonsense. Same remark for electric cars that still rely heavily on fossil fuel or nuclear electricity. By contrast, massive Hydrogen production from electrolysis using powerful winds available e.g. in Patagonia and redistributed by Hydrogen powered freighters, would be worth being studied. Meanwhile. the most acceptable solutions would depend on length and frequency of travels. Big heavy SUVs are totally unsuitable for local displacements, for which walking, cycling or using light small electric vehicles fed by solar or wind energy, should be preferred. Trains are obviously the solution for intracontinental travels, and particularly night trains that could possibly accept light vehicles onboard. As for intercontinental journeys, airliners seem to be inevitable so far. The basic rule should be sobriety, which does not necessarily mean deprivation.
6. Conclusion
Climatic previsions using numerical simulations predict a continuous temperature rise of about 4 to 5oC by the end of the century, along with a series of extreme climatic events of growing amplitudes, supposed to originate only from temperature increase. They do not exhibit the slightest hint of a possible incoming tipping point, which results either from the effective absence of such a tipping point, or more probably from the divergence of computing time in the vicinity of a true discontinuity.
By contrast, the Theory of Dynamical Systems provides a direct and obvious interpretation of extreme events. They are analyzed as pre-critical fluctuations, warning us of a nearby tipping point that would trigger a sudden and irreversible jump to a significantly hotter state. This analysis is fully confirmed by the recent publication of a clear observed broadening and incipient asymmetry of temperature statistical distributions between 1964 and 2024, and also supported by a thorough analysis published in 2023 [21] predicting a collapse of Atlantic Current Circulation around the middle of the century, that would trigger a series of switchovers, including climate tipping. In such a context, climate tipping is estimated to occur well before the end of the century, which means in a few decades if not years, resulting in a temperature jump probably within a 6 to 10oC range. This would be terrific and would clearly trigger a 6th extinction. Such dreadful forecasts show that the only chance of saving climate, as well as our own lives and the biodiversity we belong to, is to stop immediately greenhouse gases emissions. Such a dramatic emergency imposes drastic constraints on possible sustainability measures we have to take, in terms of selection and lead times. We have no choice. It is a question of survival.
For more global information the reader may refer to a popularization graphic book issued in 2024 [27].
Acknowledgements
The author acknowledges his friends and colleagues Serge Castel, John D. Embury, Jerome Faillettaz, Marc Fivel, and Christopher D Latham for their assistance, helpful advices and suggestions.
This work received no external funding.
References
- Manabe, S & Stouffer, R.J., Two stable equilibria of a coupled ocean-atmosphere model. J. Clim. 1988, 1, 841–866.
- Rahmstorf, S. , Bifurcations of the Atlantic thermohaline bifurcation in response to changes in the hydrological cycle. Nature 1995, 378, 145–149. [Google Scholar] [CrossRef]
- Lenton, T. M. , Held, H., Krieger, E., Hall, J., Lucht, W., Rahmstorf, S., Schellnhuber, H. J., Tipping elements in the Earth’s climate system. PNAS 2008, 105, 1786–1793. [Google Scholar] [CrossRef] [PubMed]
- Louchet, F. Weather instabilities as a warning sign for a nearby climatic tipping point? arXiv 2016. [Google Scholar] [CrossRef]
- Louchet, F. How far can we trust climate change predictions? arXiv 2022. [Google Scholar] [CrossRef]
- Meadows, D.N. , Meadows D.L., Randers, J., William Behrens, W., The Limits of Growth, Universe Books, New York, USA, 1972.
- Meadows, D.N. , Meadows D.L., Randers, J., William Behrens, W., Limits to Growth: The Thirty-Year Update, C: River Junction, 2004. [Google Scholar]
- https://scied.ucar.edu/learning-zone/climate-change-impacts/predictions-future-global-climate.
- https://svs.gsfc.nasa.gov/5452.
- https://en.wikipedia.org/wiki/Critical_phenomena.
- Lenton, T.M. Early warning of climate tipping points. Nature Climate Change 2011, 1, 201–209. [Google Scholar] [CrossRef]
- Dakos, V. , and Scheffer, M. : Climate bifurcation during the last deglaciation. Climate of the Past 2012, 8, 1127–1139. [Google Scholar] [CrossRef]
- Livina, V. N. and Lenton, T. M.: A modified method for detecting incipient bifurcations in a dynamical system. Geophysical Research Letters 2007, 34, L03712. [Google Scholar] [CrossRef]
- Lenton, T. M. , Livina, V. N., Dakos, V., van Nes, E. H., and Scheffer, M.: Early warning of climate tipping points from critical slowing down: comparing methods to improve robustness. Philosophical Transactions of the Royal Society A: 5 Mathematical, Physical and Engineering Sciences 2012, A370, 1185–1204. [Google Scholar] [CrossRef] [PubMed]
- Lenton, T. M. , Livina, V. N., Dakos, V., Scheffer, M., climate bifurcation during the last glaciation. Climate of the Past 2012, 8, 1127–1139. [Google Scholar] [CrossRef]
- Bathiany, S. , Dijkstra, H., Crucifix, M., Dakos, V., Brovkin, V., Williamson, M. S., Lenton, T. M., and Scheffer, M.: Beyond bifurcation: using complex models to understand and predict abrupt climate change. Dynamics and Statistics of the Climate System 2016, 1, dzw004. [Google Scholar] [CrossRef]
- Steffen, W. , Rockstrom, J., Richardson, K., Lenton, T. M., Folke, C., Liverman, D., Summerhayes, C. P., Barnosky, A. D., Cornell, S. E., Crucifix, M., et al.: Trajectories of the Earth System in the Anthropocene. PNAS 2018, 115, 8252–8259. [Google Scholar] [CrossRef] [PubMed]
- Lenton, T. M. , Rockstrom, J., Gaffney, O., Rahmstorf, S., Richardson, K., Steffen, W., Schellnhuber, H. J.: Climate tipping points—too risky to bet against. Nature 2019, 575, 592–595. [Google Scholar] [CrossRef] [PubMed]
- Faillettaz, J. , Funk, M., Vincent, C.: Avalanching glacier instabilities: review on processes and early warning perspectives. Reviews of Geophysics 2015, 203–224. [Google Scholar] [CrossRef]
- Faillettaz, J. , Funk, M., Vagliasindi, M.: Time forecast of a break-off event from a hanging glacier. The Cryosphere 2016, 10, 1191–1200. [Google Scholar] [CrossRef]
- Ditlevsen, P. , Ditlevsen, S., Warning of a forthcoming collapse of the Atlantic meridional overturning circulation. Nature Comm. 2023, 14, 4254–1. [Google Scholar] [CrossRef] [PubMed]
- https://www.climatecouncil.org.au/resources/csiro-confirms-nuclear-fantasy-would-cost-twice-as-much-as-renewables/.
- https://www.eoas.ubc.ca/books/Practical_Meteorology/prmet/Ch04-Moist.pdf24.
- http://climexp.knmi.nl/select.cgi?id=someone@somewhere&field=gpcp_22.
- http://www.cru.uea.ac.uk/cru/data/precip/.
- http://www.ncdc.noaa.gov/temp-and-precip/ghcn-gridded-products/.
- Louchet, F. Castel, S., Climate, Leaping into the unknown. Amazon 2024. [Google Scholar]
Figure 1.
illustration of Meadows report conclusions [6].
Figure 1.
illustration of Meadows report conclusions [6].
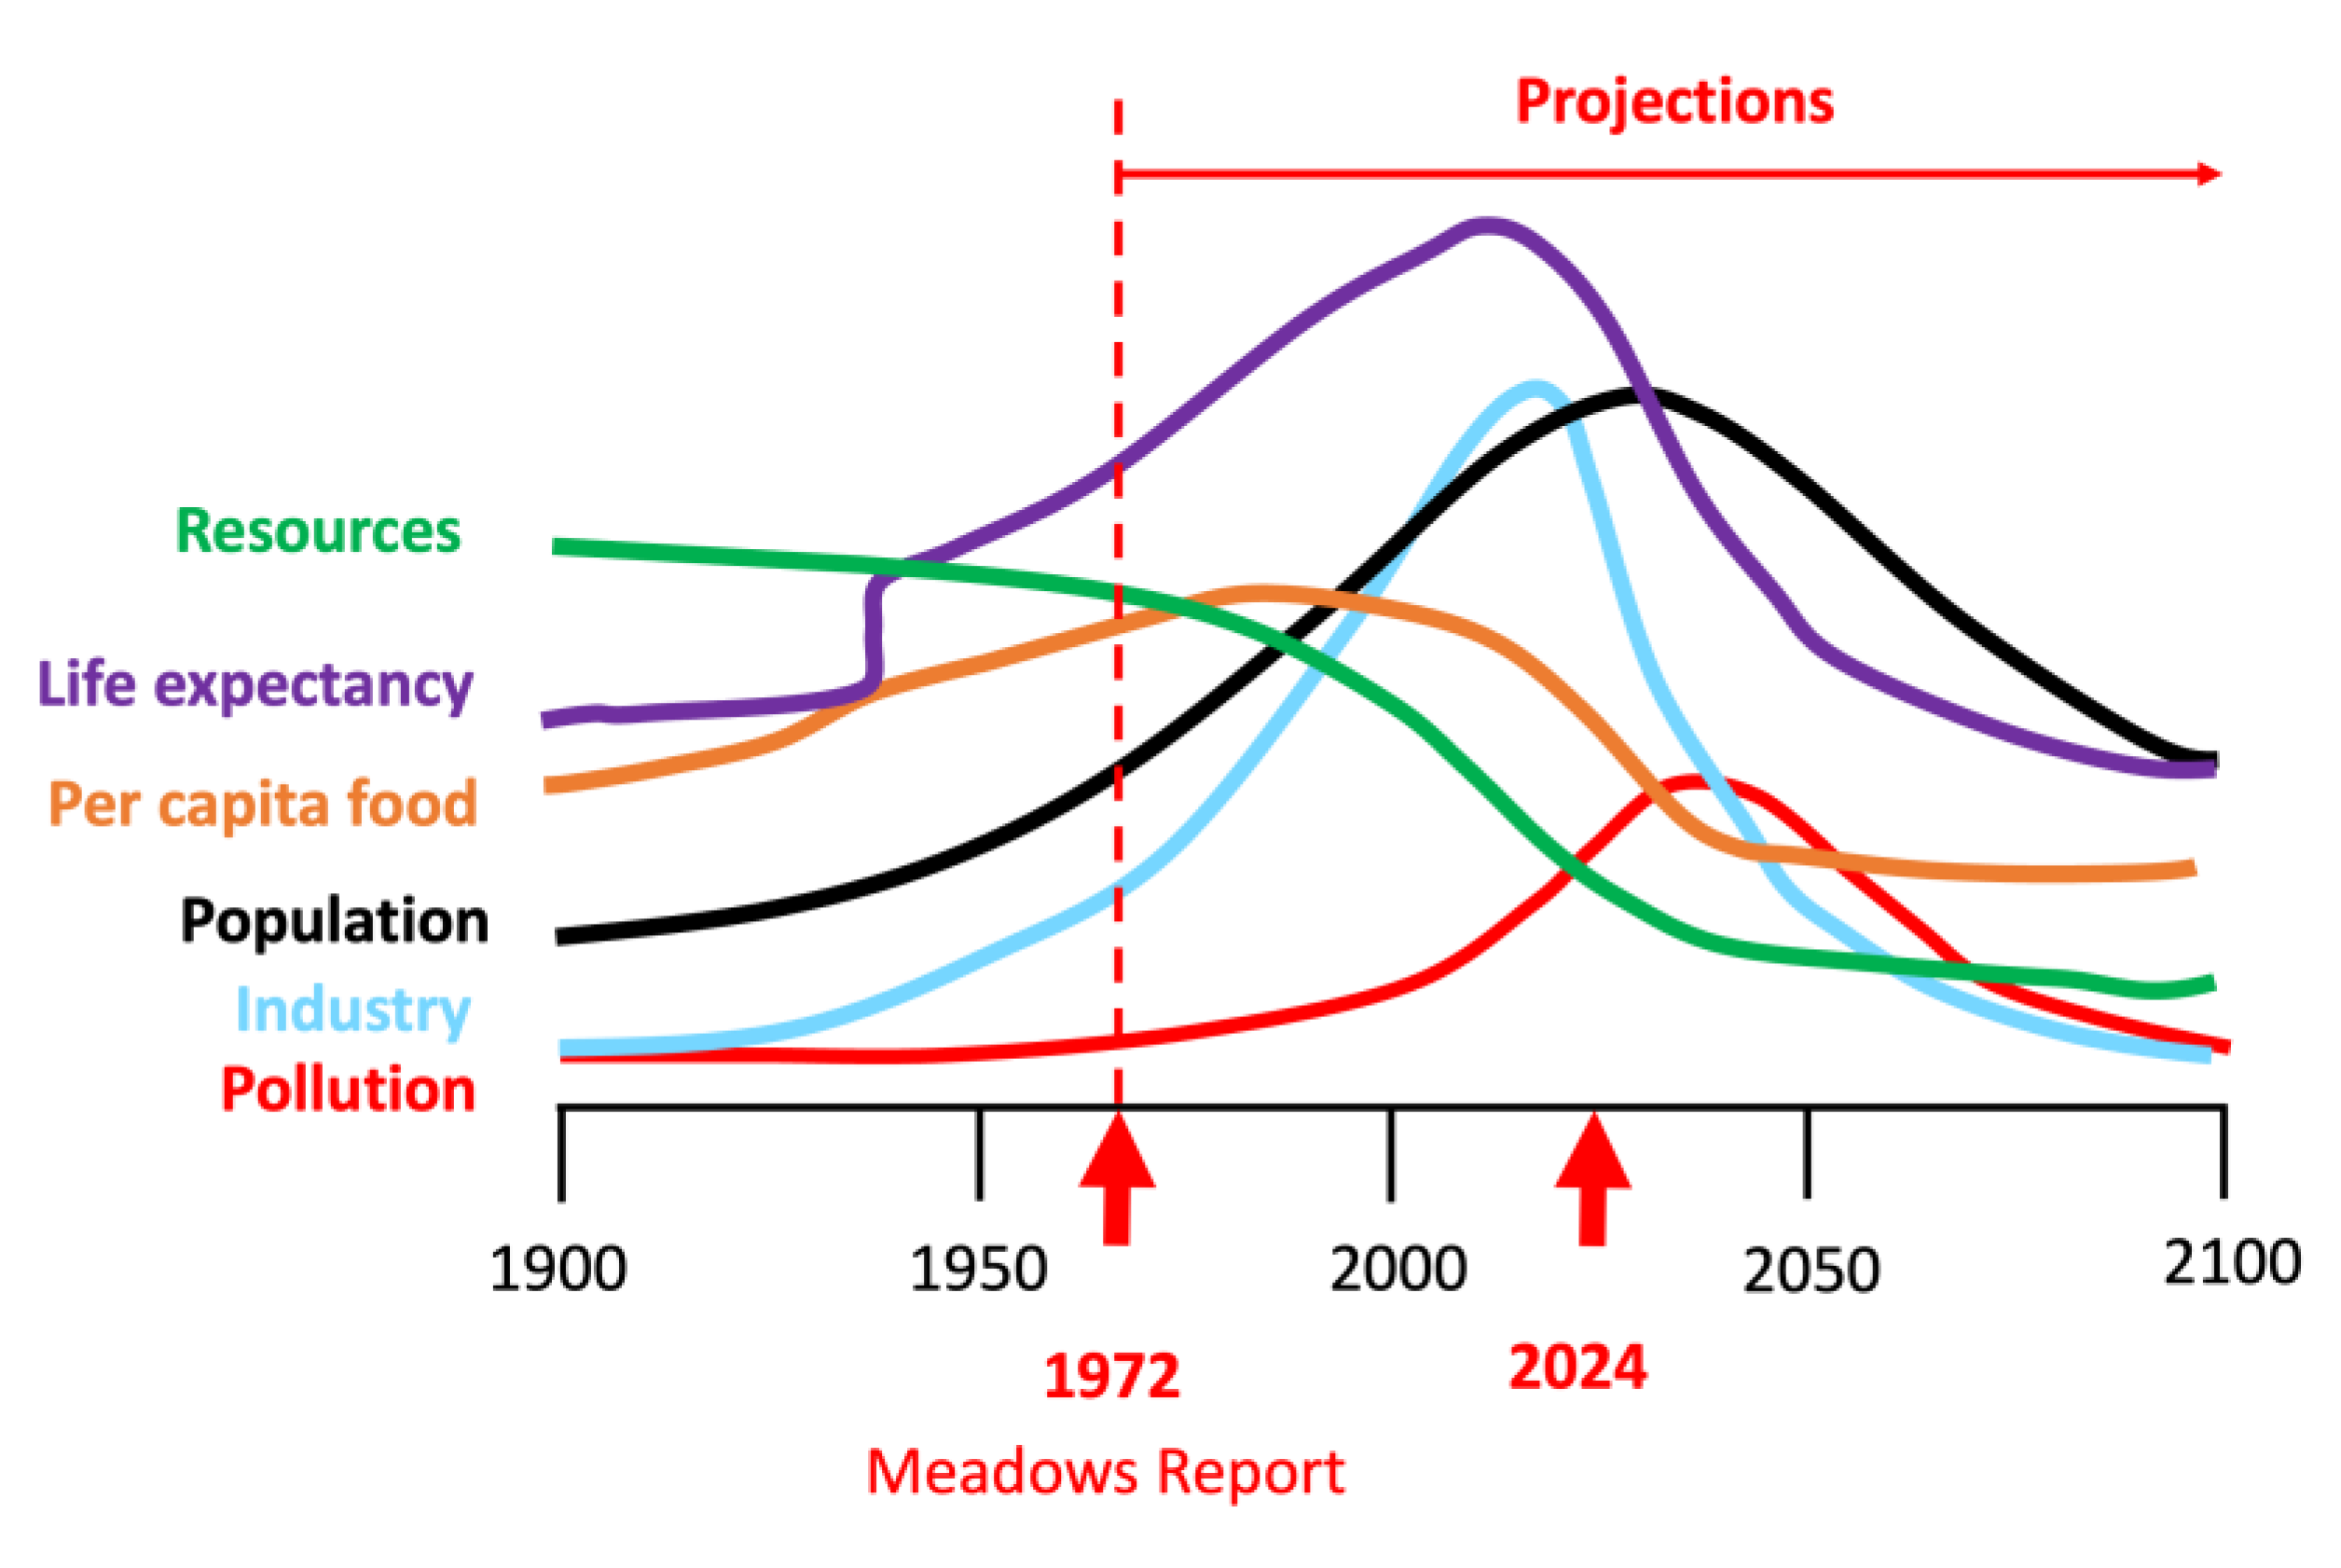
Figure 2.
Simulated temperature increase for 5 different CO2 injection scenarios.[8].
Figure 2.
Simulated temperature increase for 5 different CO2 injection scenarios.[8].
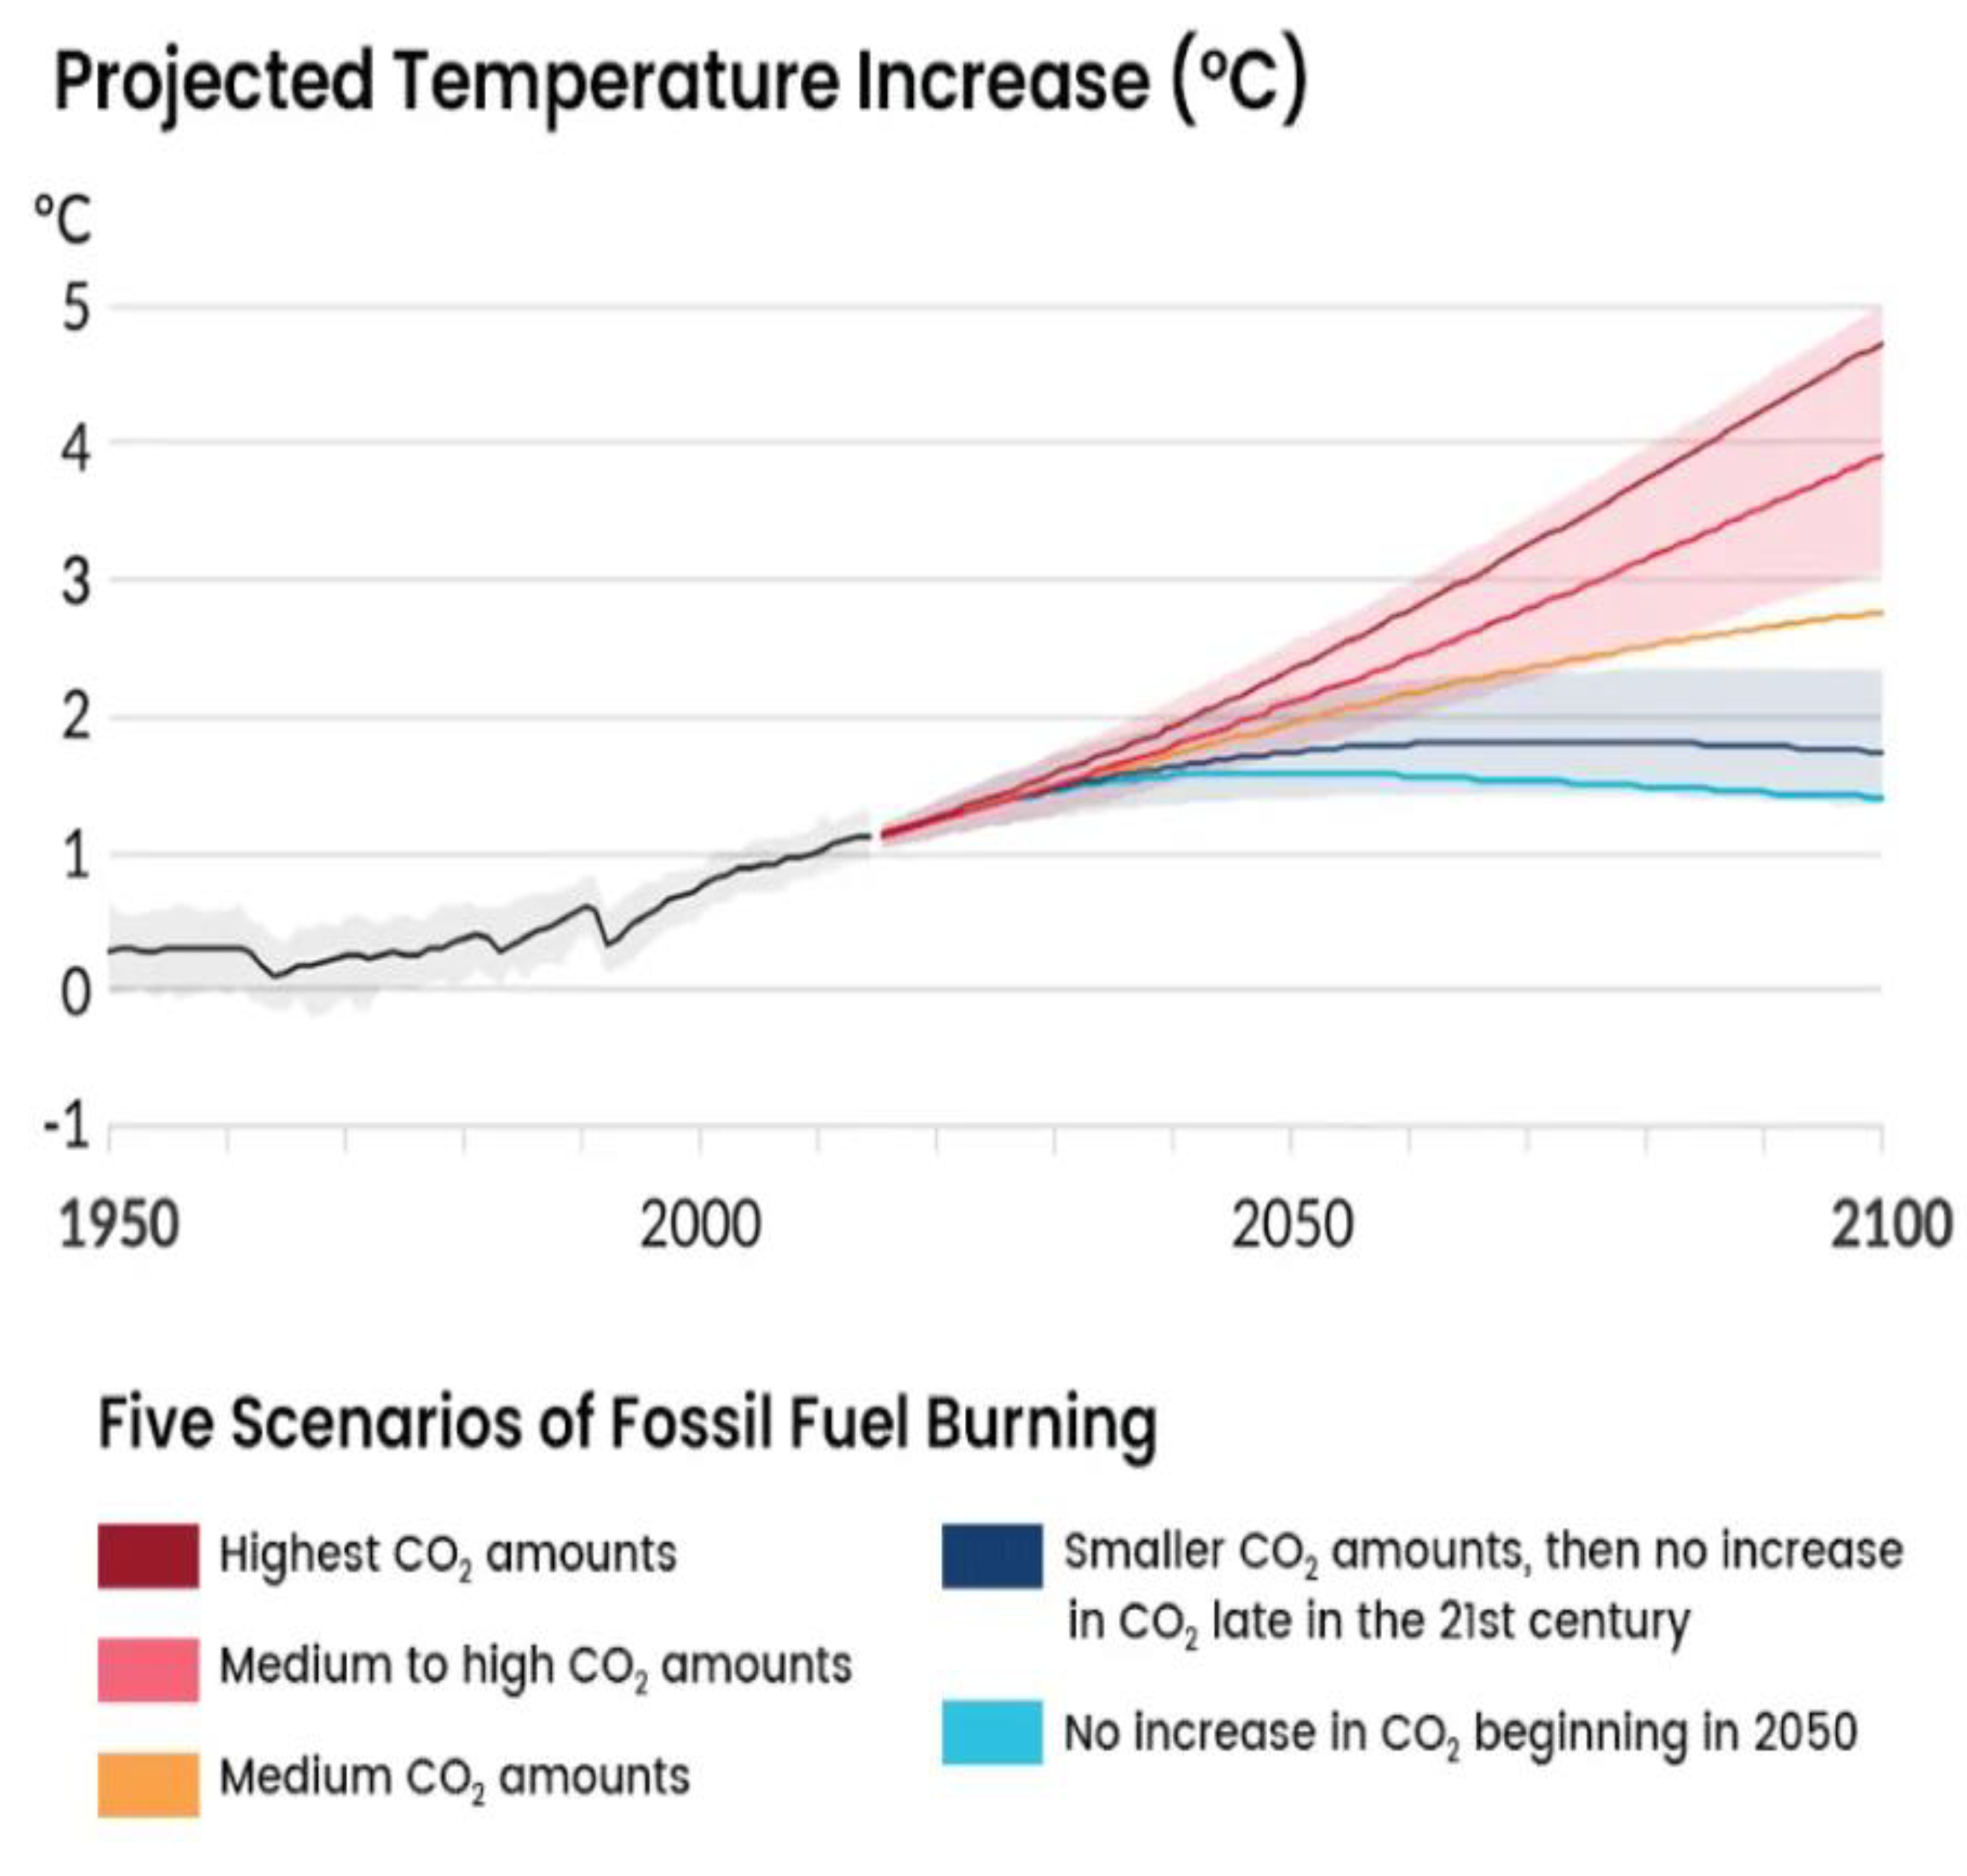
Figure 3.
Potential profile evolution showing a cold attractor AC and a hot attractor AH, separated by a repulsor R. Gradual injection of Green House Gases deforms the potential profile from left to right. The climate system, sitting at the bottom of the AC valley, warms up while drifting to the right. Merging of the cold attractor AC and the repulsor R triggers tipping (between middle and right images), suddenly and irreversibly propelling the system into the hot attractor AH.
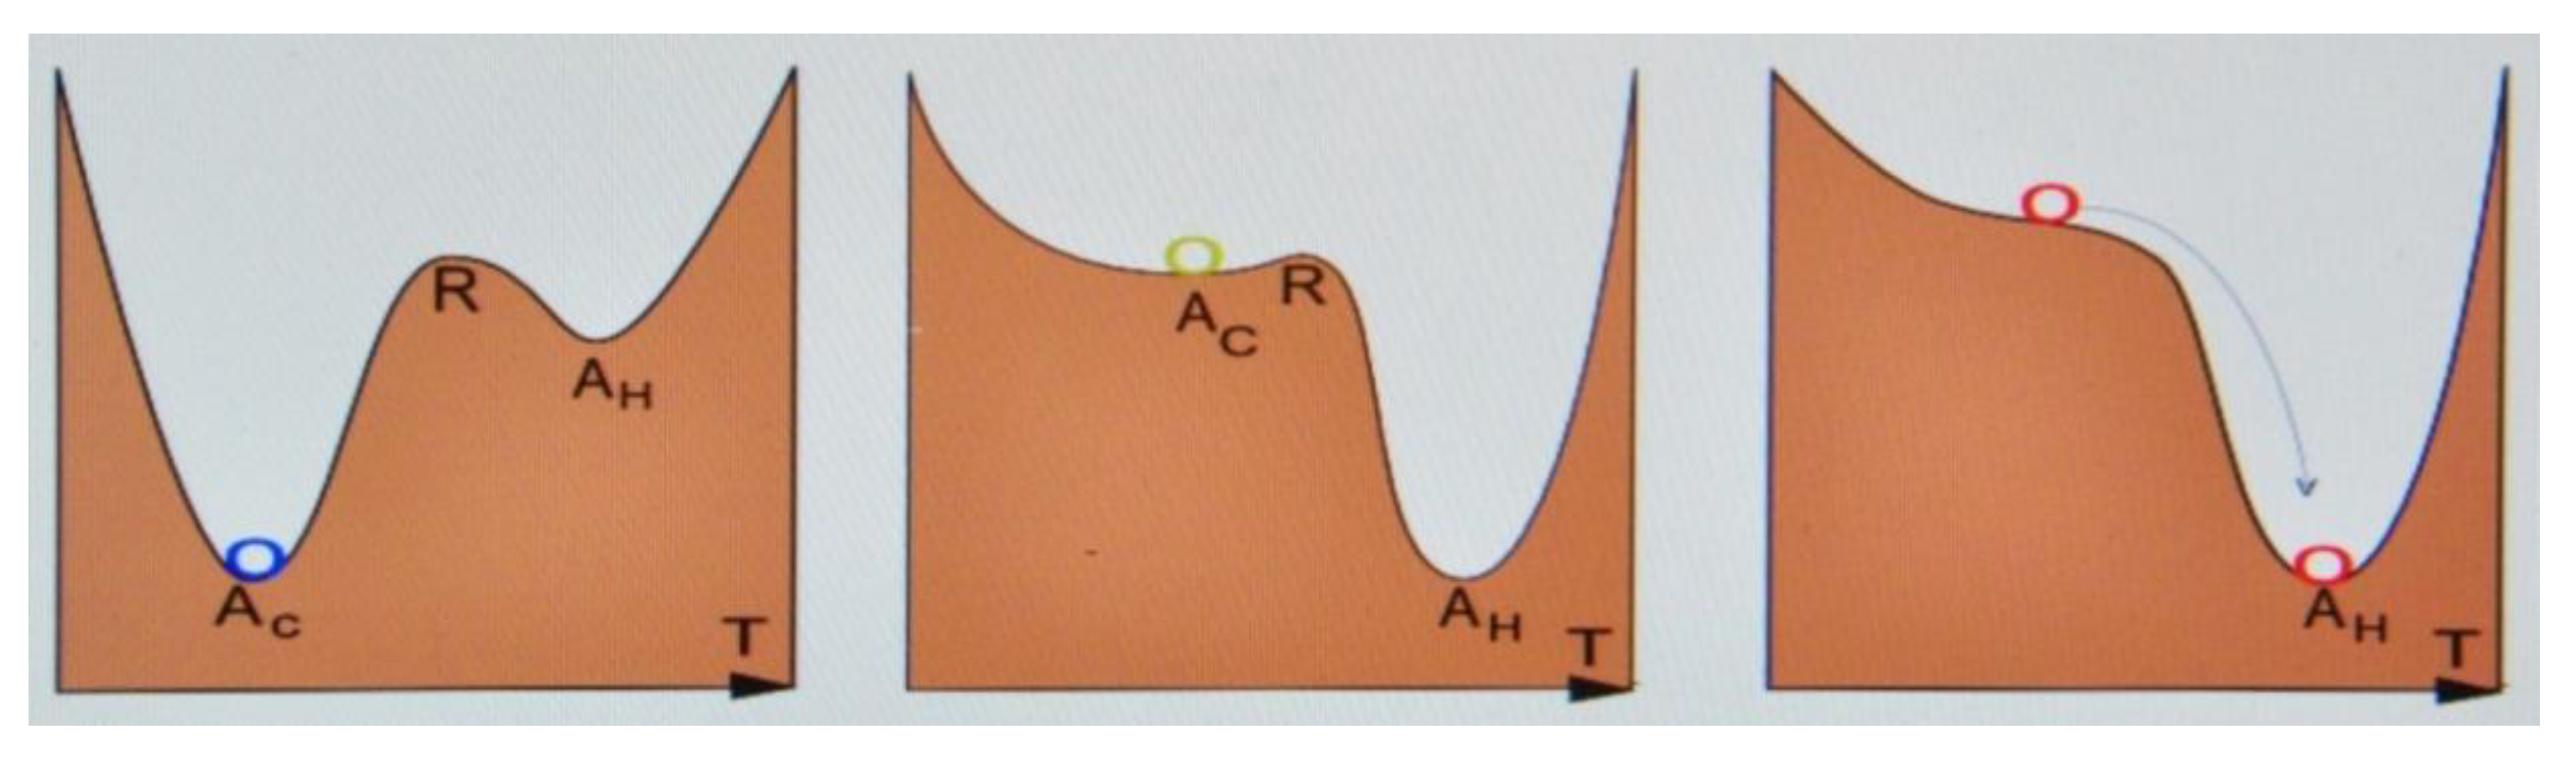
Figure 4.
Distortion of land temperature distributions vs time, after NASA 2025 [9]: The initial distribution (1964) is shown by the thin curve. Broadening is already significant in 2005, and an additional incipient asymmetry starts being visible in 2024.
Figure 4.
Distortion of land temperature distributions vs time, after NASA 2025 [9]: The initial distribution (1964) is shown by the thin curve. Broadening is already significant in 2005, and an additional incipient asymmetry starts being visible in 2024.
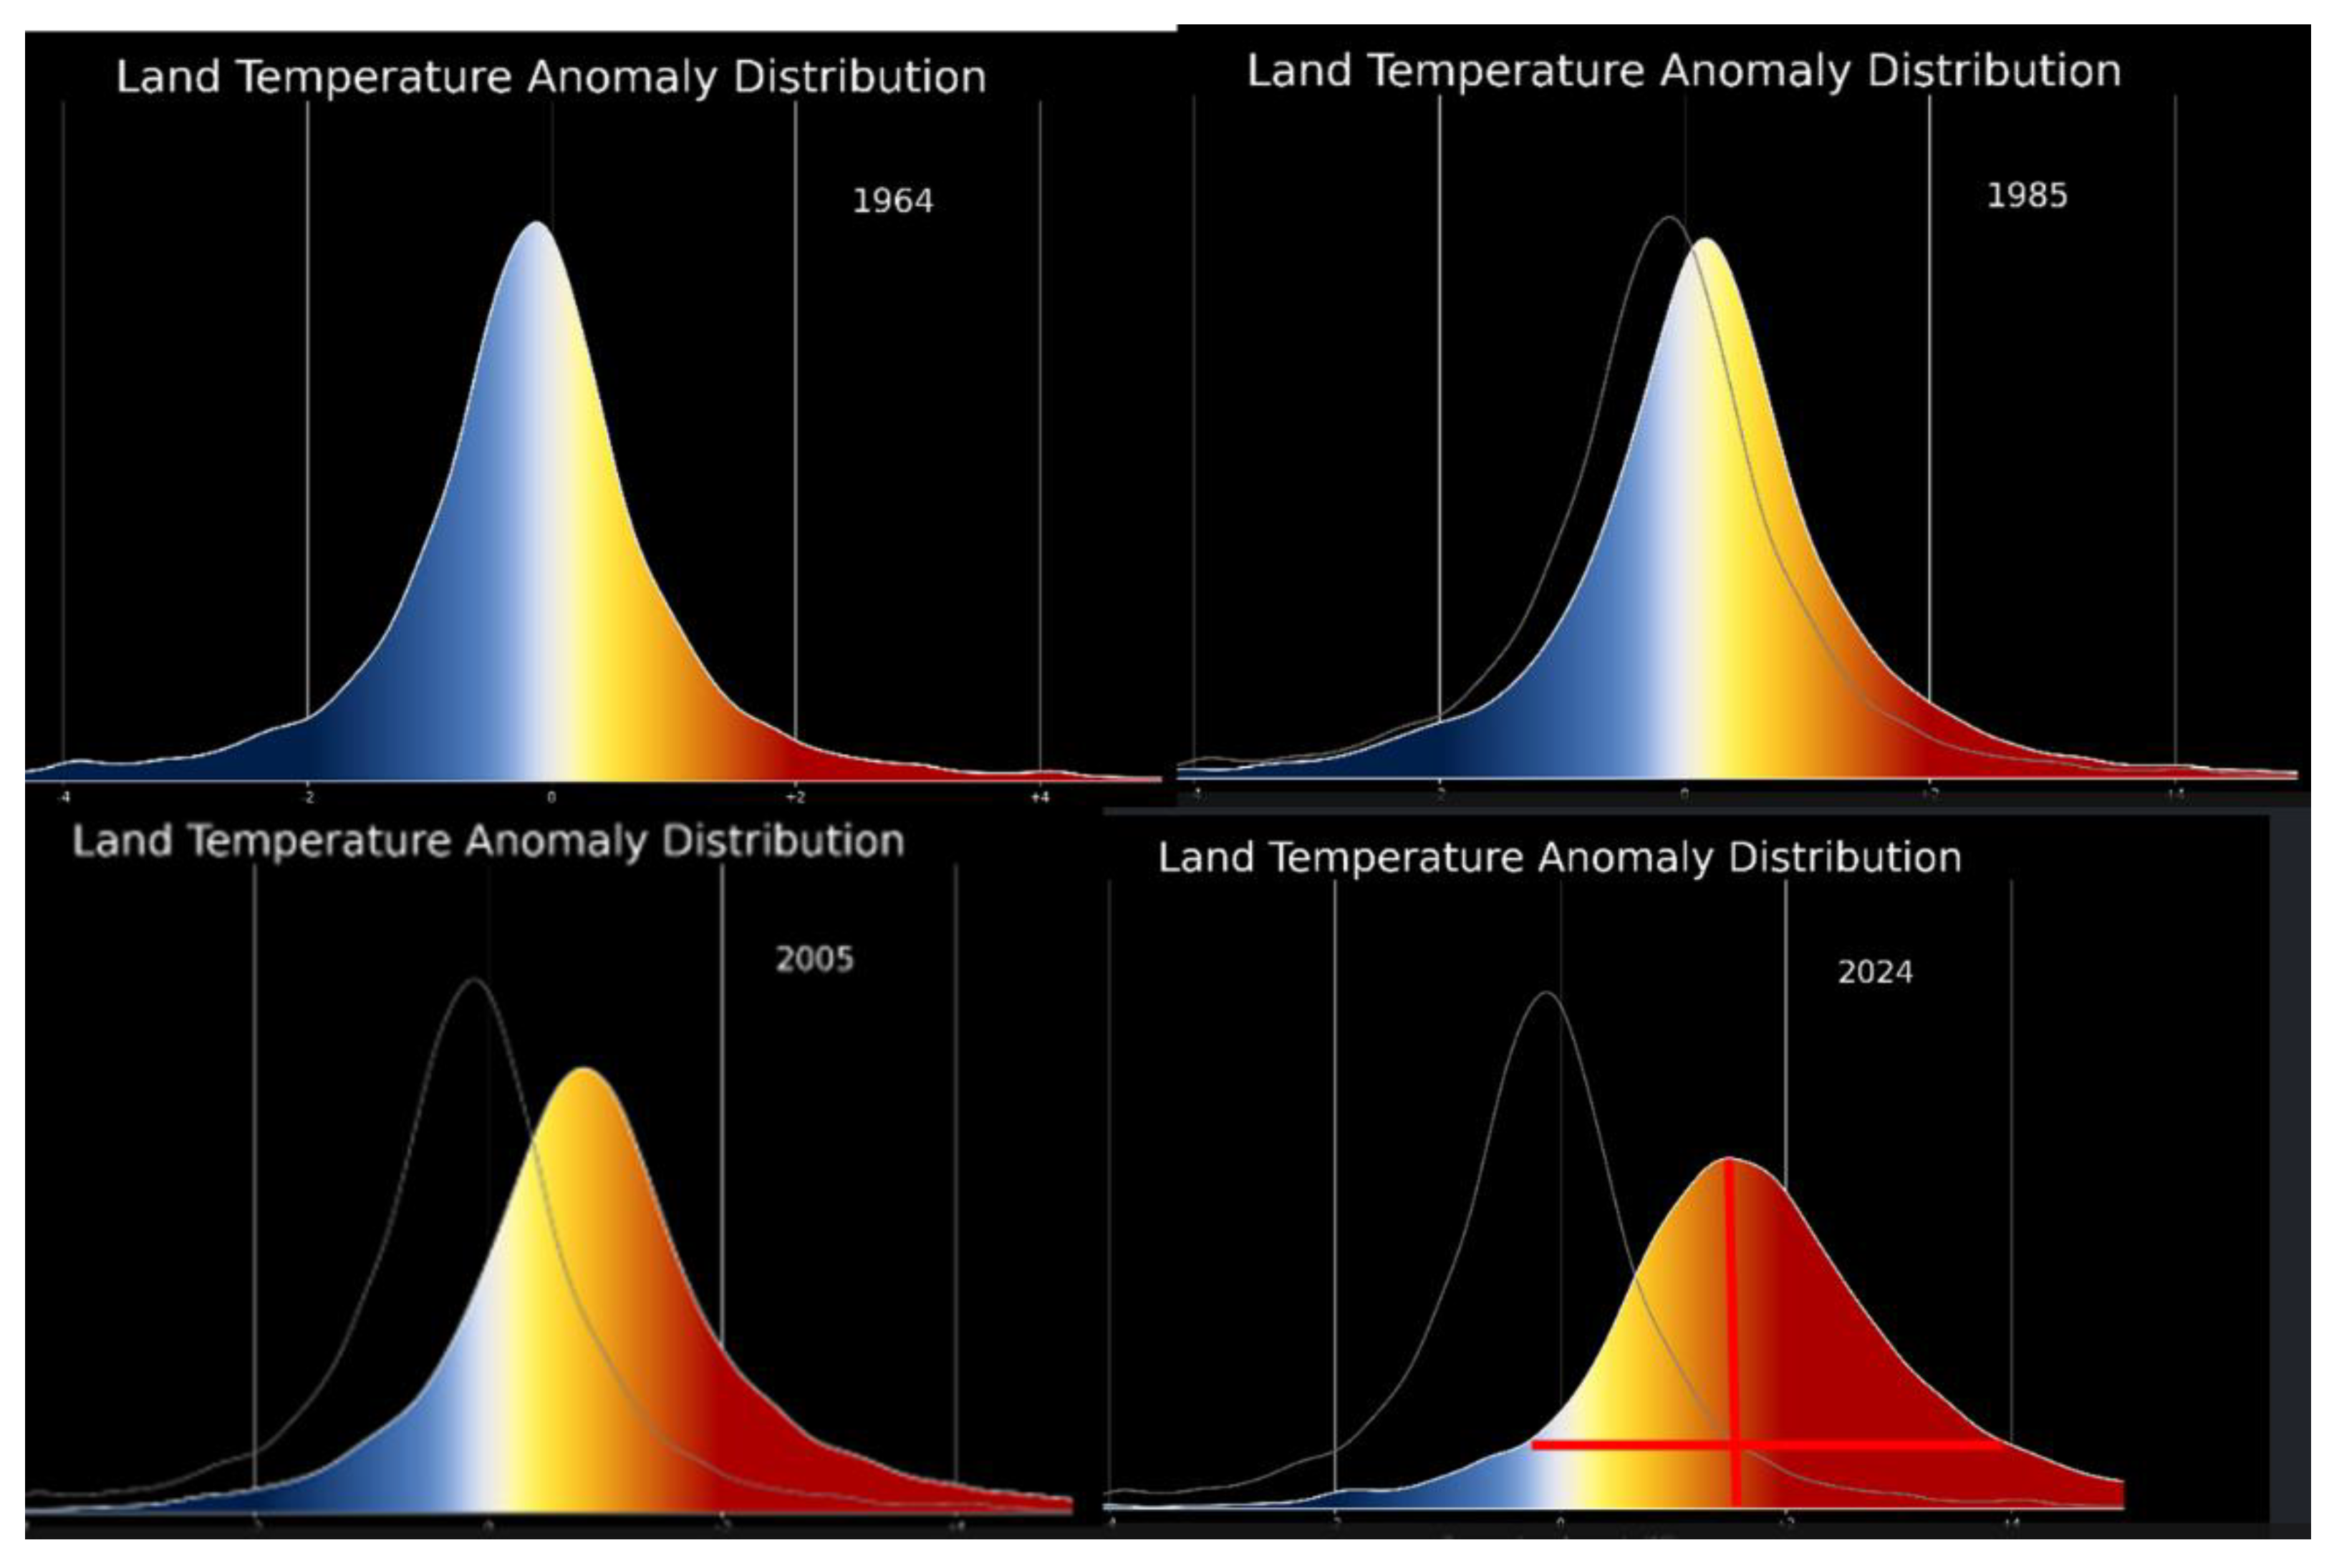
Figure 5.
Variation of the amount of saturation water vapor contained in air (g/kg) with temperature. Lower curves stand for unsaturated vapor [23].
Figure 5.
Variation of the amount of saturation water vapor contained in air (g/kg) with temperature. Lower curves stand for unsaturated vapor [23].
Disclaimer/Publisher’s Note: The statements, opinions and data contained in all publications are solely those of the individual author(s) and contributor(s) and not of MDPI and/or the editor(s). MDPI and/or the editor(s) disclaim responsibility for any injury to people or property resulting from any ideas, methods, instructions or products referred to in the content. |
© 2025 by the authors. Licensee MDPI, Basel, Switzerland. This article is an open access article distributed under the terms and conditions of the Creative Commons Attribution (CC BY) license (http://creativecommons.org/licenses/by/4.0/).
Copyright: This open access article is published under a Creative Commons CC BY 4.0 license, which permit the free download, distribution, and reuse, provided that the author and preprint are cited in any reuse.


