
Submitted:
28 August 2025
Posted:
29 August 2025
You are already at the latest version
Abstract
Micronutrient content is a major aspect of food quality and has been under threat after gain in production post green revolution. Calcium (Ca) and magnesium (Mg) are the micronutrients that are cofactors for many enzymes and plays critical role in human physiology. Deciphering the accumulation of these micronutrients in wheat and identification of QTLs associated with these elements, is very significant for cutting the risk of malnutrition in humans. Here, genome wide association study (GWAS) of 105 lines from an elite panel of wheat association mapping initiative (WAMI) was done for the two cropping seasons of 2021-22 and 2022-23 for grain calcium and magnesium content (GCaC and GMgC). Notably, two marker trait associations (MTAs) wsnp_Ex_c2718_5038582, Kuk-ri_c11327_977, and RAC875_c9984_1003 were found for GCaC and similarly three MTAs (Tdurum_contig28802_213, wsnp_Ex_c34597_42879693 and RFL_Contig6053_3082) were identified for GMgC in both the cropping seasons proving their utility and non-redundancy. MTA associated with SNP marker (wsnp_Ex_c34597_42879718) was also identified in the two seasons and significant for both GCaC and GMgC. Our study widens the insights on the genetic control of Ca and Mg accumulation in wheat and utilization of this information for future breeding programs, wherein wheat improvement with enhanced Ca and Mg may be designed and conducted.
Keywords:
GWAS
; calcium
; magnesium
; micronutrients
; malnutrition
; MTAs
; WAMI
; wheat
1. Introduction
Wheat is (Triticum aestivum L.) one of the world's leading food crops and the cradle for the human civilization, marks an annual production of 797.86 million tons in about 223.01 million hectares [1]. It plays a fundamental role in providing global food security with an average of 19% calories and 21% of the protein required in daily human diet [2]. However, reports have shown that worldwide one out of 3 people suffer from some form of malnutrition. Almost 50% of deaths below the age of 5 years results from malnutrition, which majorly occurs in poor or middle-income nations [3]. Combating malnutrition is a global health challenge, for which United Nations declared 2016 to 2025 as United Nations Decade of Action on Nutrition. Since it is a decade to address malnutrition in every form and achieve the Sustainable Development Goals, studies and sustainable approach are required to remove this micronutrient malnutrition.
Calcium (Ca) in human body forms the structure of bones and is responsible for the normal body movements including tissue rigidity, strength, and flexibility, with undergoing continuous remodeling through constant deposition and resorption of Ca into the bone [4]. However, this starts declining in women due to hormone fluctuations and menopause. Moreover, children suffering with rickets does not have normal mineralization of growth cartilage, leading to irreversible deformities in the skeleton. Ca deficiency results in reduction of bone strength and osteoporosis. Another problem arising due to chronic Ca deficiency is osteomalacia and bone softening, which occurs in children and adults. Since Ca binds to fatty acids in the body, it reduces lipid absorption and therefore involved in lowering the risk of cardiovascular disease [5].
Another important micronutrient in human body, Magnesium (Mg), is a cofactor for more than 300 enzyme systems regulating various biochemical reactions, which includes blood glucose regulation, nerve and muscle functions, blood pressure regulation and protein synthesis [6]. It is involved in active transportation of calcium and potassium ions across cell membrane, which is required for nerve impulse conduction, muscle contractions, and normal heart rhythm. Essential for energy generation, glycolysis, and oxidative phosphorylation, it also plays an important role in DNA and RNA synthesis and development of bones by influencing the activities of osteoblasts and osteoclasts [7]. Initial symptoms of Mg deficiency include nausea, weakness, and loss of appetite. With deficiency being grim resulting into muscle contractions and cramps, abnormal heart rhythms, numbness seizures [8]. Since Mg influences the concentrations of parathyroid hormone and the active form of vitamin D, it is highly impactful in bone homeostasis. According to WHO, recommended Ca allowances range from 200-400 mg/day for infants to 1300 mg/day in children of 9-18 years and 1000-1200 mg/day in older adults. Similarly, for Mg it ranges from 30-75 mg in infants and around 400 mg in children and adults [3].
Molecular breeding is an efficient method for facilitating crop improvement targeted for micronutrient-related traits. Marker-trait associations (MTAs) associated with micronutrients and various other traits in wheat have been reported using Genome Wide Association Studies (GWAS) [9,10,11,12,13,14]. In GWAS, differentiation between true associations and false-positive MTAs resulting from population structure and kinship has been a big hurdle [15]. To overcome such associations, various statistical models have been developed, namely, single-locus mixed linear model and multi-locus models. In single-locus model incorporation of two confounding factors are considered for analysis as covariates [15]. However, this may lead to false-negative MTAs due to overfits, which results in missing of chances to uncover the loci associated with targeted traits [16]. For surpassing such incidences of false-negative MTAs, variety of multi-locus models have been developed such as, fixed, and random model circulating probability unification (FarmCPU) and Bayesian-information and linkage disequilibrium iteratively nested keyway (BLINK). FarmCPU model includes multiple markers simultaneously as the covariates, which eliminates the confounding effect of markers and kinship and therefore removing the false-positive MTAs without any compromise for true associations. It utilizes fixed-effect and random effect model for complete removal of cofounding. However, FarmCPU is time consuming where number of markers and individuals is high. In comparison, BLINK is statistically better and time-efficient using Bayesian information criterion. Unlike FarmCPU, BLINK utilizes linkage disequilibrium (LD) to eliminate the assumption that causal genes are evenly distributed across the genome [17,18]. Proper execution in GWAS reveal novel genomic regions associated with targeted traits and hence facilitate the identification of genes that control such traits. In the present investigation, 105 diverse wheat genotypes from the Wheat Association Mapping Initiative (WAMI) panel has been analyzed for grain Ca and Mg content using FarmCPU and BLINK models. Identification of genomic regions associated with controlling the two micronutrients was done, from which markers could be designed for their introgression in future breeding program.
2. Results
2.1. Variability for Grain Ca and Mg Concentration
Estimation of micronutrient concentrations of Ca and Mg in all 105 grain samples from the cropping season 2021-22 and 2022-23 was performed. Variations were observed in the concentration of the estimated micronutrients. Ca and Mg in two consecutive cropping season is presented in Figure 1.

Table 1.
Combined ANOVA table for grain micronutrient in WAMI panel constituting of 105 wheat accessions.
Table 1.
Combined ANOVA table for grain micronutrient in WAMI panel constituting of 105 wheat accessions.
| Source | Df | Ca_SS | Mg_SS |
|---|---|---|---|
| Year | 1 | 42.2* | 476* |
| Entry | 104 | 8.79* | 9.68 * |
| Replication | 2 | 10.3 | 60.5 |
| Year× Entry | 104 | 5.35* | 7.61* |
| SS: Sum of square; Df: degrees of freedom; significant at ** p <0.001. | |||
Based on the samples obtained during 2021-2022, the mean GCaC for all three replicates was 398.62 ppm and, for 2022-2023, it was 380.42 ppm, with the final mean of 389.52 ppm (Table S1). The mean GMgC for the year 2021-2022 for all three replicates was 1211.87 ppm and, for 2022-2023, it was 1118.01ppm, with the final mean of 1164.94 ppm. Frequency distribution of variation for
Table 2.
The statistical analysis for the GCaC and GMgC in the WAMI panel constituting of two consecutive years 2021-22 and 2022-23.
Table 2.
The statistical analysis for the GCaC and GMgC in the WAMI panel constituting of two consecutive years 2021-22 and 2022-23.
| Statistics | 2021-22 | 2022-23 | ||
|---|---|---|---|---|
| BLUP Ca | BLUP Mg | BLUP Ca | BLUP Mg | |
| Heritability | 0.66 | 0.73 | 0.68 | 0.78 |
| Genotypic variance | 2312.00 | 10528.4 | 2786.74 | 4323.17 |
| Grand Mean | 398.62 | 1211.88 | 380.42 | 1118.02 |
| LSD | 49.83 | 73.2 | 49.36 | 85.21 |
| CV | 8.36 | 3.88 | 8.55 | 5.34 |
| LSD = Least significant difference; CV = Coefficient of variation | ||||
2.3. Population Structure Analysis
The allele frequencies in the WAMI panel were found to be distributed evenly by principal components analysis (Figure 2A). PC1 explained 17.9% of the variance, whereas PC2 explained 5.5% and PC3 explained 3.9%. These findings imply that PC1, PC2 and PC3 collectively account for a significant amount of the panel's underlying genetic variation, making it possible to recognise and distinguish the subgroups that make up the WAMI population.
2.4. MTAs for the Target Trait Utilizing GWAS
To find out the significant associations of Ca and Mg content and SNP markers in the lines, GWAS analyses were carried out. A scatter plot of r2 values of paired markers was developed, demonstrating genome-wide linkage disequilibrium (LD) degradation for 105 WAMI genotypes assessed using the Hill and Weir formula [20]. LD analysis was performed using Trait Analysis by aSSociation, Evolution and Linkage (TASSEL) data with a sliding window of 100 SNPs. The average genome-wide r2 was 0.11, with LD decline starting at r2 = 0.46 and ending at r2 = 0.23 (Figure 2B). The LD decay curve intersected the half-decay and standard critical (r2 = 0.3) lines at 23754184 and 11877092 basepair (bp), respectively. This establishes 11877092 bp as the genome-wide threshold distance for detecting linkage, as done in previous works [9,19].
The MTAs were investigated utilizing two multi-locus models, FarmCPU and BLINK, which identified 86 SNP loci with prominent associations with the trait studied and utilization of Manhattan plots and Quantile-Quantile plot (Q-Q) plots (Figure 3). Genotypic data was available for 26,814 SNPs, but only 21,132 SNPs were utilized for GWAS. We have found 49 SNPs significantly associated with Ca and located on the 13 chromosomes (1A, 1B, 1D, 2A, 2B, 2D, 3A, 3B, 3D, 5A, 6B and 7A), which is confirmed in the data provided for the consecutive years of cropping season using both the models (Table S2, S3, S4 and S5). About 37 SNPs were significantly found for GMgC located significantly on chromosomes 1B, 2A, 2B, 3A, 4A, 4B, 4D, 5B, 6A, 6B, 7A, 7B and 7D (Table S6, S7, S8 and S9).
2.4.1. MTAs for GCaC
For the initial crop year 2021–22, the MTAs were found to be distributed on multiple chromosomes, which were found notably on the chromosome 2A (4 MTAs), 3D (13 MTAs), 5A (2 MTAs), 6A (3 MTAs), 7B (6 MTAs), and 7A (5 MTAs). Interestingly, a dense concentration of 13 MTAs were observed between the physical position of 604.6-746.6 Mb on chromosome 3D, exhibiting a significant and rich association. This striking presence underscores potentially a genomic hotspot associated with Ca content. Presence of 4 MTAs on 7B was observed within the range of 35.4-37 Mb. Another profound presence of MTAs was on 7A, with three MTAs co-located on 52.9 Mb and one on 49.8 Mb. For the year 2022-23, these 7 MTAs were identified on 2B and 5A. Notably, these four MTAs were consistent in both the cropping season of 2021-22 and 2022-23, with each located on chromosome 2A, 6B and 2 MTAs on chromosome 5A (Table 3). There were four loci for GCaC, which showed presence in both the cropping years, Kukri_c11327_977 on chromosome 2A, wsnp_Ex_c2718_5038582 and RAC875_c9984_1003 both on 5A, and wsnp_Ex_c34597_42879718 on 6B.
2.4.2. MTAs for GMgC
In study for the year 2021-22, MTAs for GMgC extended on various chromosomes with notable presence on 4A (6 MTAs), 6A (3 MTAs) and 7A (4 MTAs). At a specific position of 99.2 Mb on chromosome 4A, two MTAs were found to be co-located. Moreover, two pair of co-located MTAs on 7A with positions at 159.5 Mb and 696.9 Mb were identified. In the cropping year 2022-23, prominent number of MTAs were observed on 2B (6MTAs), 4B (2 MTAs), 5B (3 MTAs) and 6A (4MTAs). The most prominent observation for MTAs associated with Mg, which were consistent in both the cropping season were on 6A and 6B. There were four loci for GMgC which showed presence in both the cropping years. Interestingly out of these, three of them were located on 6A, at 597.8 Mb i.e. Tdurum_contig28802_213, wsnp_Ex_c34597_42879693 and RFL_Contig6053_3082, while the fourth one, wsnp_Ex_c34597_42879718 was found on 6B at 597.8 Mb.
2.4.3. Multi-Effect MTA Locus for Ca and Mg
A multi-effect MTA locus, represented by wsnp_Ex_c34597_42879718 on chromosome 6B at 597.8 Mb and was found to be responsible for controlling both the traits simultaneously, and was consistent for both the consecutive crop seasons.
3. Discussion
One of the biggest global health concerns which needs immediate attention is micronutrient malnutrition. High throughput genotyping technologies coupled with statistics provide us vast information and better understanding of genomes. Genome-wide association mapping is an effective strategy to facilitate the identification of genes that regulate traits of interest, whose efficiency is dependent on the genetic diversity within the germplasm that are utilized as association panels. Since genome sequencing and genotyping technologies have advanced so quickly, GWAS has been widely used in wheat and many other crops [23,24]. Gene discovery and cloning have been made easier by the wheat reference genome and a wealth of transcriptomic resources [25,26]. Additionally, this has made it much easier to investigate the QTLs for traits related to wheat yield and quality. Since wheat is one of the most important crop in the world, breeding it to accumulate more nutrients will help reduce nutrient deficiencies. For fulfilling such objectives GWAS is used to identify genomic regions associated with micronutrient trait. Pyramiding of different micronutrients related markers into the high yield genotypes can remove micronutrient deficiency in population. The availability of multiple micronutrient related QTLs/MTAs in wheat germplasm utilized from different countries has also been studied previously [28,29]. Preliminary work on WAMI population was undertaken for investigating these advanced wheat lines for SNPs associated with complex traits without the confounding effects of phenology and plant height [27]. Various panels for investigating QTLs associated with grain Ca have been undertaken earlier, one of which utilized a European wheat diversity panel of 353 varieties with 90k and 35k SNP markers [28]. Moreover, for the mitigation of false positive association, it is important to consider population structure in GWAS [30].
In present investigation, for deciphering the novel GCaC and GMgC associated MTAs, the crop grown in the years 2021-22 and 2022-23 were undertaken, utilizing diverse wheat panel of WAMI. The study decoded involvement of multiple QTLs that contributed for the desired traits and highlighted a total of 86 MTAs (49 for GCaC and 37 for GMgC). Many MTAs identified in our studies have not been reported earlier and therefore, they are potentially novel MTAs controlling GCaC and GMgC. It may be due to the different origin of the panels/populations and different methods used for their detection. Here, chromosome 1A, 1B, 1D, 2A,2B, 2D, 3A, 3B, 3D, 5A, 6B, 7A and 7B have been found to carry QTLs for GCaC in wheat as reported earlier [28,31,32,33,34,35,36,37,38,39], indicating potential role of these chromosomes in different populations for GCaC. The QTLs wsnp_Ex_c2718_5038582, Kukri_c11327_977, and RAC875_c9984_1003 have been found associated with GCaC earlier [24], are consistent with the QTLs detected in the present investigation for both the cropping seasons, making them the most significant loci for GCaC and their accumulation. QTLs Excalibur_c23906_303 and wsnp_Ra_c193_406396 were found to be in the proximity of another QTL reported [40] on 1D for GCaC under hydroponics condition indicating their utility as a potential marker under different conditions.
For GMgC, chromosome 1B, 2A, 2B, 3A, 4A, 4B, 4D, 5B, 6A, 6B, 7A, 7B and 7D were found to carry QTLs for the said trait as found involved in previous studies [32,38,41,42,43,44,45]. The QTLs Tdurum_contig28802_213, wsnp_Ex_c34597_42879693 and RFL_Contig6053_3082 associated with GMgC and reported in present investigation for both the cropping seasons have been identified [22] in a study but under different environmental conditions and thus promises to be genuine for GMgC accumulation. QTL wsnp_Ex_c34597_42879718 located on 6B at 597.8 Mb had been associated with GCaC [22], was also found to be present in both the cropping season and thus promises be a genuine locus for GCaC.
4. Materials and Methods
4.1. Genetic Material and Experimental Conditions
The grain micronutrient concentrations (Ca and Mg) were investigated using spring wheat lines from the Wheat Association Mapping Initiative (WAMI) population from the International Maize and Wheat Improvement Center (CIMMYT) [27]. It consisted of 105 elite and genetically diverse wheat lines, distribution of which was done via International Wheat Improvement Network (IWIN) by CIMMYT. Due to presence of narrow range in variation of days to heading and plant height, this is suitable for gene discovery with no confounding effects of plant height and phenology. The crop was grown for two consecutive cropping seasons in the year 2021-22 and 2022-2023 at the research farm of Eternal University, Baru Sahib, Himachal Pradesh, India using three replications. Each block of a 2 m row with a 0.10 m plant spacing was designated to represent a genotype. Fertilizers used was 120 kg N, 40 kg K2O and 60 kg P2O5, with thorough use of all fertilizers at the time of sowing, except nitrogen. Dose of N was used in three parts: half at sowing, one-fourth on initial irrigation i.e. 21 days after sowing, and rest one-fourth during second irrigation i.e. 45 days after sowing. Distance in plantation was 20 cm and 5 cm between the plants.
4.2. DNA Extraction and Genotyping
Extraction of DNA, genotyping the samples and data processing were followed as previously [46]. Further, genotyping was carried out by USDA-ARS Small Grain Genotyping Center, Fargo, using Illumina 90K Infinium iSelect assay (Illumina Inc., San Diego, CA, USA) [47]. Process of SNP calling used the default clustering algorithm integrated in Genome Studio v2011.1 (Illumina Inc., San Diego, CA, USA), which resulted in identifying total 26,814 bi-allelic SNPs [46,48]. For upholding standards in data quality, SNPs characterized with minor allele frequency (MAF) lower than0.05 were eliminated from the analysis, including monomorphic and low-quality SNPs. Such thorough filtration resulted in retention of around 21,132 polymorphic SNPs, which were utilized for GWAS in our study [46,49].
4.3. Elemental Analysis for GCaC and GMgC
Approximately 0.5 g of homogenised seed material was measured into a digestion tube and subjected to digestion with suprapure nitric acid with a microwave digester. The digestate was filtered using Whatman® filter paper no. 42 and diluted to a volume of 10 ml using ultrapure water in a calibrated volumetric flask.
Concentrations of analytes were quantified utilising inductively coupled plasma–optical emission spectroscopy (ICP-OES; Manufacturer: Perkin Elmer, Model: 7300DV). Calibration was conducted using blanks and five matrix-matched standards. The calibration curve was constructed by linear regression, requiring a minimum correlation coefficient of 0.995. GCaC and GMgC were examined in radial mode, using the standard approach (approach 984.27).
4.3. Statistical Analyses
Analysis of Pearson’s correlation coefficients was conducted utilizing Agricolae (version 1.2–4) package of the R (version 4.0.3) software [50]. Components of variance were studied by restricted maximum likelihood (REML) method implemented in META-R software v6.0.4 [51]. Parameters of covariance were used as component unbiased genetic variance for broad-sense heritability (H2) as Alemu et al. [9]. Data of BLUP was extracted utilizing ‘lme40 package in R [52]. Statistical analysis like, mean, coefficient of variation (CV), and standard deviation were studied utilizing SPSS v. 17.0 (SPSS Inc., Chicago, IL, USA, 2008).
4.4. Population Structure, Kinship Matrix, and Principal Components Analyses (PCA)
Population structure matrix or Q matrix were modelled utilizing PCA for the genotypic data of total 21,132 high-quality SNPs, as earlier [15]. The Kinship matrix (relatedness or K matrix) was evaluated using R (version 4.0.3) software, utilizing the parameters given by VanRaden and Yin et al. [53,54]. Utilizing Bayesian information criterion (BIC), the optimum numbers of PCAs were identified [55]. Scatter plot was formed using first two principal components, which demonstrated the genotype distribution.
4.5. Genome-Wide Association Analyses
GWAS was performed utilizing 21,132 high quality SNPs available from the CIMMYT, Mexico website (https://data.cimmyt.org/dataset.xhtml?persistentId=hdl:11529/10714; accessed on 22 December, 2023). Among the SNP markers, pairwise squared allele-frequency correlations (r2) were determined through TASSEL software (Trait Analysis by Association, Evolution, and Linkage) ver. 5.2.9, with sliding window size of 100. Plot between r2 values and genetic distance (cM) was made for assessing LD between the loci. Forming a smoothing spline regression line at the genome level, LD decay curve utilizing Hill and Weir method [19] in the R environment was achieved with script utilized by Marroni et al. [56]. Following the earlier studies for identification of significant MTAs, significant threshold of p < 0.001 (-log10(P) > 3.0) was considered [9,57,58]. In present study, this QTL has also been identified for GMgC for both the cropping seasons proving its non-redundancy and its ability for detecting multiple micronutrient content in wheat. Breeding for higher GCaC and GMgC content, attention may be paid to these MTAs. These identified MTAs provide valuable insights into the molecular mechanisms corresponding to grain micronutrients in wheat. However, it is prerequisite to consider the environmental factors while making breeding decisions, with proper validation using independent populations which plays crucial role in the performance of the traits.
5. Conclusions
The MTAs so reported in this study were found significant in both the cropping seasons and the non-redundancy was further confirmed by the two GWAS models. This makes them robust enough to be used for breeding for higher GCaC and GMgC and therefore attention may be paid to these MTAs. These identified MTAs provide valuable insights into the molecular mechanisms corresponding to grain micronutrients in wheat. However, it is prerequisite to consider the environmental factors while making breeding decisions, with proper validation using independent populations which plays crucial role in the performance of the traits.
Supplementary Materials
The following supporting information can be downloaded at the website of this paper posted on Preprints.org.
Author Contributions
Conceptualization, N.K.V.; methodology, C.N. and N.K.V.; formal analysis, C.N and N.K.V.; investigation, C.N., N.K.V. and K.K.; resources, K.K., P.V., N.K.V.; data curation, N.K.V. and C.N.; writing—original draft preparation, C.N.; N.K.V. writing—review and editing, R.D., P.V. and N.K.V.; visualization, C.N.; R.D. and N.K.V.; supervision, N.K.V.; K.K. project administration, N.K.V.; funding acquisition, N.K.V. All authors have read and agreed to the published version of the manuscript.
Funding
This research was funded by the Science and Engineering Research Board, New Delhi, grant number SRG/2020/000091.
Data Availability Statement
The single-nucleotide polymorphism (SNP) genotyping data of the wheat association mapping initiative (WAMI) germplasm panel of spring wheat, which are used for the present study, have been published previously by Sukumaran et al. [46], and are available publicly to download from the link: http://hdl.handle.net/11529/10714 (accessed on 12 July 2024). All other data generated or analyzed during this study are included in this published article.
Acknowledgments
We sincerely acknowledge the International Maize and Wheat Improvement Center (CIMMYT), Mexico, for generously providing the WAMI population and granting access to the molecular data used in this study.
Conflicts of Interest
The authors declare no conflict of interest. The funders had no role in the design of the study; in the collection, analyses, or interpretation of data; in the writing of the manuscript; or in the decision to publish the results.
Abbreviations
The following abbreviations are used in this manuscript:
| BIC | Bayesian information criterion |
| BLINK | Bayesian-information and linkage disequilibrium iteratively nested keyway |
| BLUP | Best Linear Unbiased Prediction |
| Ca | Calcium |
| CIMMYT | International maize and wheat improvement center |
| CV | Coefficient of variation |
| FarmCPU | Fixed, and random model circulating probability unification |
| GCaC | Grain calcium content |
| GMgC | Grain magnesium content |
| GWAS | Genome wide association study |
| ICP-OES | Utilising inductively coupled plasma–optical emission spectroscopy |
| IWIN | International wheat Improvement Network |
| LD | Utilizes linkage disequilibrium |
| LSD | Least significant difference |
| MAF | Minor allele frequency |
| Mg | Magnesium |
| MTAs | Marker trait associations |
| PCA | Principal component analysis |
| Q-Q | Quantile-Quantile |
| QTL | Quantitative trait loci |
| r2 | Pairwise squared allele-frequency correlations |
| REML | Restricted maximum likelihood |
| TASSEL | Trait Analysis by aSSociation, Evolution and Linkage |
| WAMI | Wheat association mapping initiative |
| BIC | Bayesian information criterion |
| BLINK | Bayesian-information and linkage disequilibrium iteratively nested keyway |
| BLUP | Best Linear Unbiased Prediction |
| Ca | Calcium |
| CIMMYT | International maize and wheat improvement center |
| CV | Coefficient of variation |
| FarmCPU | Fixed, and random model circulating probability unification |
| GCaC | Grain calcium content |
| GMgC | Magnesium content |
| GWAS | Genome wide association study |
| ICP-OES | Utilising inductively coupled plasma–optical emission spectroscopy |
| IWIN | International wheat Improvement Network |
| LD | Utilizes linkage disequilibrium |
| LSD | Least significant difference |
| MAF | Minor allele frequency |
| Mg | Magnesium |
| MTAs | Marker trait associations |
| PCA | Principal component analysis |
| Q-Q | Quantile-Quantile |
References
- FAOSTAT. Food and Agriculture Organization 2025.
- Shewry, P.R. Wheat. J. Exp. Bot. 2009, 60, 1537–1553. [Google Scholar] [CrossRef] [PubMed]
- World Health Organization. Fact sheets 2025.
- Weaver, C.M. Calcium. In Present Knowledge in Nutrition; Marriott, B.P., Birt, D.F., Stallings, V.A., Yates, A.A., Eds.; Wiley-Blackwell: Cambridge, Massachusetts, 2022; pp. 21–48. [Google Scholar]
- Mulet-Cabero, A.I.; Wilde, P.J. Role of calcium on lipid digestion and serum lipids: a review. Crit. Rev. Food Sci. Nutr. 2023, 63, 813–826. [Google Scholar] [CrossRef] [PubMed]
- Institute of Medicine (IOM). Food and nutrition board. Dietary reference intakes: calcium, phosphorus, magnesium, vitamin D and fluoride. Washington, DC: National Academy Press; 1997.
- Rude, R.K. Magnesium. In modern nutrition in health and disease; Ross, A.C., Caballero, B., Cousins, R.J., Tucker, K.L., Ziegler, T.R., Eds.; Williams & Wilkins: Baltimore, Mass: Lippincott, 2012; pp. 159–75. [Google Scholar]
- Rude, R.K.; Singer, F.R.; Gruber, H.E. Skeletal and hormonal effects of magnesium deficiency. J. Am. Coll. Nutr. 2009, 28, 131–41. [Google Scholar] [CrossRef]
- Alemu, A.; Brazauskas, G.; Gaikpa, D.S.; Henriksson, T.; Islamov, B.; Jørgensen, L.N.; Koppel, M.; Koppel, R.; Liatukas, Ž.; Svensson, J.; Chawade, A. Genome-wide association analysis and genomic prediction for adult-plant resistance to Septoria tritici blotch and powdery mildew in winter wheat. Front. Genet. 2021, 12, 661742. [Google Scholar] [CrossRef]
- Rabieyan, E.; Bihamta, M.R.; Moghaddam, M.E.; Alipour, H.; Mohammadi, V.; Azizyan, K.; Javid, S. Analysis of genetic diversity and genome-wide association study for drought tolerance related traits in Iranian bread wheat. BMC Plant Biol. 2023, 23, 431. [Google Scholar] [CrossRef]
- Tadesse, W. ; Gataa, Zakaria.; Rachdad, F.E.; El Baouchi, A.; Kehel, Z.; Alemu, A. Single- and multi-trait genomic prediction and genome-wide association analysis of grain yield and micronutrient-related traits in ICARDA wheat under drought environment. Mol. Genet. Genomics 2023, 298, 1515–1526. [Google Scholar] [CrossRef]
- Krishnappa, G.; Khan, H.; Krishna, H.; Kumar, S.; Mishra, C.N.; Parkash, O.; Devate, N.B.; Nepolean, T.; Rathan, N.D.; Mamrutha, H.M.; Srivastava, P.; Biradar, S.; Uday, G.; Kumar, M.; Singh, G.; Singh, G.P. Genetic dissection of grain iron and zinc, and thousand kernel weight in wheat (Triticum aestivum L.) using genome-wide association study. Sci. Rep. 2022, 12, 12444. [Google Scholar] [CrossRef]
- Aljabri, M.; El-Soda, M. Genome-wide association mapping of macronutrient mineral accumulation in wheat (Triticum aestivum L.) grain. Plants 2024, 13, 3472. [Google Scholar] [CrossRef]
- Bhadana, D.; Kaur, P.; Kaur, R.; Ravat, V.K. ; Ashutosh; Kumar, R.; Vasistha, N.K. Genome-wide association study for powdery mildew resistance in CIMMYT’s spring wheat germplasm. Plant Pathol. 2024, 74, 455–464. [Google Scholar] [CrossRef]
- Kaler, A.S.; Gillman, J.D.; Beissinger, T; Purcell, L.C. Comparing different statistical models and multiple testing corrections for association mapping in soybean and maize. Front. Plant Sci. 2020, 10, 1794. [Google Scholar] [CrossRef]
- Price, A.L.; Patterson, N.J; Plenge, R.M.; Weinblatt, M.E.; Shadick, N.A.; Reich, D. Principal components analysis corrects for stratification in genome-wide association studies. Nat. Genet. 2006, 38, 904–909. [Google Scholar] [CrossRef]
- Liu, X.; Huang, M.; Fan, B.; Buckler, E.S.; Zhang, Z. Iterative usage of fixed and random effect models for powerful and efficient genome-wide association studies. PloS Genet. 2016, 12, e1005767. [Google Scholar] [CrossRef] [PubMed]
- Huang, M.; Liu, X.; Zhou, Y.; Summers, R.M.; Zhang, Z. BLINK: a package for the next level of genome-wide association studies with both individuals and markers in the millions. Giga Sci. 2019, 8, giy154. [Google Scholar] [CrossRef] [PubMed]
- Kaur, R.; Vasistha, N.K.; Ravat, V.K.; Mishra, V.K.; Sharma, S.; Joshi, A.K.; Dhariwal, R. Genome-wide association study reveals novel powdery mildew resistance loci in bread wheat. Plants 2023, 12, 3864. [Google Scholar] [CrossRef] [PubMed]
- Hill, W.G.; Weir, B.S. Variances and covariances of squared linkage disequilibria in finite populations. Theor. Popul. Biol. 1988, 33, 54–78. [Google Scholar] [CrossRef]
- Elkelish, A.; Alqudah, A.M.; Alomari, D.Z.; Alammari, B.S.; Alsubeie, M.S.; Hamed, S.M; Thabet, S.G. Targeting candidate genes for the macronutrient accumulation of wheat grains for improved human nutrition. Cereal Res. Commun. 2024, 53, 719–732. [Google Scholar] [CrossRef]
- Aljabri, M.; El-Soda, M. Genome-wide association mapping of macronutrient mineral accumulation in wheat (Triticum aestivum L.). Genome-wide association mapping of macronutrient mineral accumulation in wheat (Triticum aestivum L.) grain. Plants 2024, 13, 3472. [Google Scholar] [CrossRef]
- Edwards, D.; Batley, J.; Snowdon, R.J. Accessing complex crop genomes with next-generation sequencing. Theor. Appl. Genet. 2013, 126, 1–11. [Google Scholar] [CrossRef]
- Yu, P.; Ye, C.; Li, L.; Yin, H.; Zhao, J.; Wang, Y.; Zhang, Z.; Li, W.; Long, Y.; Hu, X.; Xiao, J. Genome-wide association study and genomic prediction for yield and grain quality traits of hybrid rice. Mol. Breed. 2022, 42, 16. [Google Scholar] [CrossRef]
- Pang, Y.; Liu, C.; Wang, D.; Amand, P.S.; Bernardo, A.; Li, W.; He, F.; Li, L.; Wang, L.; Yuan, X.; Dong, L. High-resolution genome-wide association study identifies genomic regions and candidate genes for important agronomic traits in wheat. Mol. Plant. 2020, 13, 1311–1327. [Google Scholar] [CrossRef]
- Shariatipour, N.; Heidari, B.; Tahmasebi, A.; Richards, C. Comparative genomic analysis of quantitative trait loci associated with micronutrient contents, grain quality, and agronomic traits in wheat (Triticum aestivum L.). Front. Plant Sci. 2021, 12, 709817. [Google Scholar] [CrossRef]
- Lopes, M.S.; Dreisigacker, S.; Pena, R.J.; Sukumaran, S.; Reynolds, M.P. Genetic characterization of the wheat association mapping initiative (WAMI) panel for dissection of complex traits in spring wheat. Theor. Appl. Genet. 2015, 128, 453–464. [Google Scholar] [CrossRef] [PubMed]
- Alomari, D.Z.; Eggert, K.; von Wirén, N.; Pillen, K.; Röder, M.S. Genome-wide association study of calcium accumulation in grains of European wheat cultivars. Front. Plant Sci. 2017, 8. [Google Scholar] [CrossRef] [PubMed]
- Kang, Y.; Barry, K.; Cao, F.; Zhou, M. Genome-wide association mapping for adult resistance to powdery mildew in common wheat. Mol. Biol. Rep. 2020, 47, 1241–1256. [Google Scholar] [CrossRef] [PubMed]
- Singh, S.; Sehgal, D.; Kumar, S.; Arif, M.A.R.; Vikram, P.; Sansaloni, C.P.; Fuentes-Dávila, G.; Ortiz, C. GWAS revealed a novel resistance locus on chromosome 4D for the quarantine disease karnal bunt in diverse wheat pre-breeding germplasm. Sci. Rep. 2020, 10, 5999. [Google Scholar] [CrossRef]
- Ma, J.; Ren, J.; Yuan, X.; Yuan, M.; Zhang, D.; Li, C.; Zeng, Q.; Wu, J.; Han, D.; Jiang, L. Genome-wide association study reveals the genetic variation and candidate gene for grain calcium content in bread wheat. Plant Cell Rep. 2023, 42, 1379–1390. [Google Scholar] [CrossRef]
- Bhatta, M.; Baenziger, P.S.; Waters, B.M.; Poudel, R.; Belamkar, V.; Poland, J.; Morgounov, A. Genome-wide association study reveals novel genomic regions associated with 10 grain minerals in synthetic hexaploid wheat. Int. J. Mol. Sci. 2018, 19, 3237. [Google Scholar] [CrossRef]
- Shi, X.; Zhou, Z.; Li, W.; Qin, M.; Yang, P.; Hou, J.; Huang, F.; Lei, Z.; Wu, Z.; Wang, J. Genome-wide association study reveals the genetic architecture for calcium accumulation in grains of hexaploid wheat (Triticum aestivum L.). BMC Plant Biol. 2022, 22, 229. [Google Scholar] [CrossRef]
- Rathan, N.D.; Krishna, H.; Ellur, R.K.; Sehgal, D.; Govindan, V.; Ahlawat, A.K.; Krishnappa, G.; Jaiswal, J.P.; Singh, J.B.; Sv, S. Genome-wide association study identifies loci and candidate genes for grain micronutrients and quality traits in wheat (Triticum aestivum L.). Sci. Rep. 2022, 12, 7037. [Google Scholar] [CrossRef]
- Wang, W. , Guo, H., Wu, C., Yu, H., Li, X., Chen, G., Tian, J.; Deng, Z. Identification of novel genomic regions associated with nine mineral elements in Chinese winter wheat grain. BMC Plant Biol. 2021, 21, 311. [Google Scholar]
- Sigalas, P.P.; Shewry, P.R.; Riche, A.; Wingen, L.; Feng, C.; Siluveru, A.; Chayut, N.; Burridge, A.; Uauy, C.; Castle, M.; Parmar, S. Improving wheat grain composition for human health by constructing a QTL atlas for essential minerals. Commun. Biol. 2024, 7, 1001. [Google Scholar] [CrossRef] [PubMed]
- Yang, F.; Dong, F.S.; Hu, F.H.; Liu, Y.W.; Chai, J.F.; Zhao, H.; Lv, M.Y.; Zhou, S. Genome-wide identification and expression analysis of the calmodulin-binding transcription activator (CAMTA) gene family in wheat (Triticum aestivum L.). BMC Genet. 2020, 21, 105. [Google Scholar] [CrossRef] [PubMed]
- Peleg, Z.; Cakmak, I.; Ozturk, L.; Yazici, A.; Jun, Y.; Budak, H.; Korol, A.B.; Fahima, T.; Saranga, Y. Quantitative trait loci conferring grain mineral nutrient concentrations in durum wheat × wild emmer wheat RIL population. Theor. Appl. Genet. 2009, 119, 353–369. [Google Scholar] [CrossRef] [PubMed]
- Shi, X.; Zhou, Z.; Li, W.; Qin, M.; Yang, P.; Hou, J.; Huang, F.; Lei, Z.; Wu, Z.; Wang, J. Genome-wide association study reveals the genetic architecture for calcium accumulation in grains of hexaploid wheat (Triticum aestivum L.). BMC Plant Biol. 2022, 22, 229. [Google Scholar] [CrossRef]
- Genc, Y.; Taylor, J.; Rongala, J.; Oldach, K. A major locus for chloride accumulation on chromosome 5A in bread wheat. PloS One. 2014, 9, 98845. [Google Scholar] [CrossRef]
- Alqudah, A.M.; Elkelish, A.; Abu-Elsaoud, A.M.; Hassan, S.E.D.; Thabet, S.G. Genome-wide association study reveals the genetic basis controlling mineral accumulation in wheat grains under potassium deficiency. Genet. Resour. Crop Evol. 2025, 72, 783–796. [Google Scholar] [CrossRef]
- Zhang, F.S. Characterization of quantitative trait loci for grain minerals in hexaploid wheat (Triticum aestivum L.). J. Integr. Agric. 2013, 12, 1512–1521. [Google Scholar] [CrossRef]
- Sigalas, P.P.; Shewry, P.R.; Riche, A.; Wingen, L.; Feng, C.; Siluveru, A.; Chayut, N.; Burridge, A.; Uauy, C.; Castle, M. , Parmar, S. Improving wheat grain composition for human health by constructing a QTL atlas for essential minerals. Commun. Biol. 2024, 7, 1001. [Google Scholar] [CrossRef]
- Hao, Y.; Kong, F.; Wang, L.; Zhao, Y.; Li, M.; Che, N.; Li, S.; Wang, M.; Hao, M.; Zhang, X.; Zhao, Y. Genome-wide association study of grain micronutrient concentrations in bread wheat. J. Integr. Agri. 2024, 23, 1468–1480. [Google Scholar] [CrossRef]
- Alomari, D.Z.; Alqudah, A.M.; Pillen, K.; von Wirén, N.; Röder, M.S. Toward identification of a putative candidate gene for nutrient mineral accumulation in wheat grains for human nutrition purposes. J. Exp. Bot. 2021, 72, 6305–6318. [Google Scholar] [CrossRef] [PubMed]
- Sukumaran, S.; Crossa, J.; Jarquín, D.; Lopes, M.; Reynolds, M.P. Genomic and pedigree prediction with genotype x environment interaction in spring wheat grown in South and Western Asia, North Africa, and Mexico. G3. 2016, 7, 481–495. [Google Scholar] [CrossRef] [PubMed]
- Wang, S.; Wong, D.; Forrest, K.; Allen, A.; Chao, S.; Huang, B.E.; Maccaferri, M.; Salvi, S.; Milner, S.G.; Cattivelli, L. Characterization of polyploid wheat genomic diversity using a high-density 90,000 single nucleotide polymorphism array. Plant Biotechnol. J. 2014, 12, 787–796. [Google Scholar] [CrossRef] [PubMed]
- Sukumaran, S.; Lopes, M.; Dreisigacker, S.; Reynolds, M. Genetic analysis of multi-environmental spring wheat trials identifies genomic regions for locus-specific trade-offs for grain weight and grain number. Theor. Appl. Genet. 2018, 131, 985–998. [Google Scholar] [CrossRef]
- Ahirwar, R.N.; Mishra, V.K.; Chand, R.; Budhlakoti, N.; Mishra, D.C.; Kumar, S.; Singh, S.; Joshi, A.K. Genome-wide association mapping of spot blotch resistance in wheat association mapping initiative (WAMI) panel of spring wheat (Triticum aestivum L.). PLoS ONE. 2018, 13, e0208196. [Google Scholar] [CrossRef]
- R Core Team. R: A Language and environment for statistical computing; R foundation for statistical computing: Vienna, Austria, 2013. [Google Scholar]
- Alvarado, G.; Rodríguez, F.M.; Pacheco, A.; Burgueño, J.; Crossa, J.; Vargas, M.; Pérez-Rodríguez, P.; Lopez-Cruz, M.A. META-R: A Software to analyze data from multi-environment plant breeding trials. Crop J. 2020, 8, 745–756. [Google Scholar] [CrossRef]
- Bates, D.; Mächler, M.; Bolker, B.; Walker, S. Fitting linear mixed-effects models using lme4. J. Stat. Softw. 2015, 67, 1–48. [Google Scholar] [CrossRef]
- VanRaden, P.M. Efficient Methods to compute genomic predictions. J. Dairy Sci. 2008, 91, 4414–4423. [Google Scholar] [CrossRef]
- Yin, L.; Zhang, H.; Tang, Z.; Xu, J.; Yin, D.; Zhang, Z.; Yuan, X.; Zhu, M.; Zhao, S.; Li, X.; et al. rMVP: A Memory-efficient, visualization-enhanced, and parallel-accelerated tool for genome-wide association study. Genom. Proteom. Bioinform. 2021, 19, 619–628. [Google Scholar] [CrossRef]
- Schwarz, G. Estimating the dimension of a model. Ann. Stat. 1978, 6, 461–464. [Google Scholar] [CrossRef]
- Marroni, F.; Pinosio, S.; Zaina, G.; Fogolari, F.; Felice, N.; Cattonaro, F.; Morgante, M. Nucleotide diversity and linkage disequilibrium in Populus nigra cinnamyl alcohol dehydrogenase (CAD4) Gene. G3. 2011, 7, 1011–1023. [Google Scholar] [CrossRef]
- Singh, S.; Gaurav, S.S.; Vasistha, N.K.; Joshi, A.K.; Mishra, V.K.; Chand, R.; Gupta, P.K. Genetics of spot blotch resistance in bread wheat (Triticum aestivum L.) using five models for GWAS. Front. Plant Sci. 2023, 13, 1036064. [Google Scholar] [CrossRef]
- Maccaferri, M. ; El-Feki,W.; Nazemi, G.; Salvi, S.; Canè, M.A.; Colalongo, M.C.; Stefanelli, S.; Tuberosa, R. Prioritizing quantitative trait loci for root system architecture in tetraploid wheat. J. Exp. Bot. 2016, 67, 1161–1178. [Google Scholar] [CrossRef]
Figure 1.
Frequency distribution for micronutrient related trait (A) and (B) for GCaC, (C) and (D) for GMgC recorded from the 105 elite wheat genotypes tested for two years.
Figure 1.
Frequency distribution for micronutrient related trait (A) and (B) for GCaC, (C) and (D) for GMgC recorded from the 105 elite wheat genotypes tested for two years.
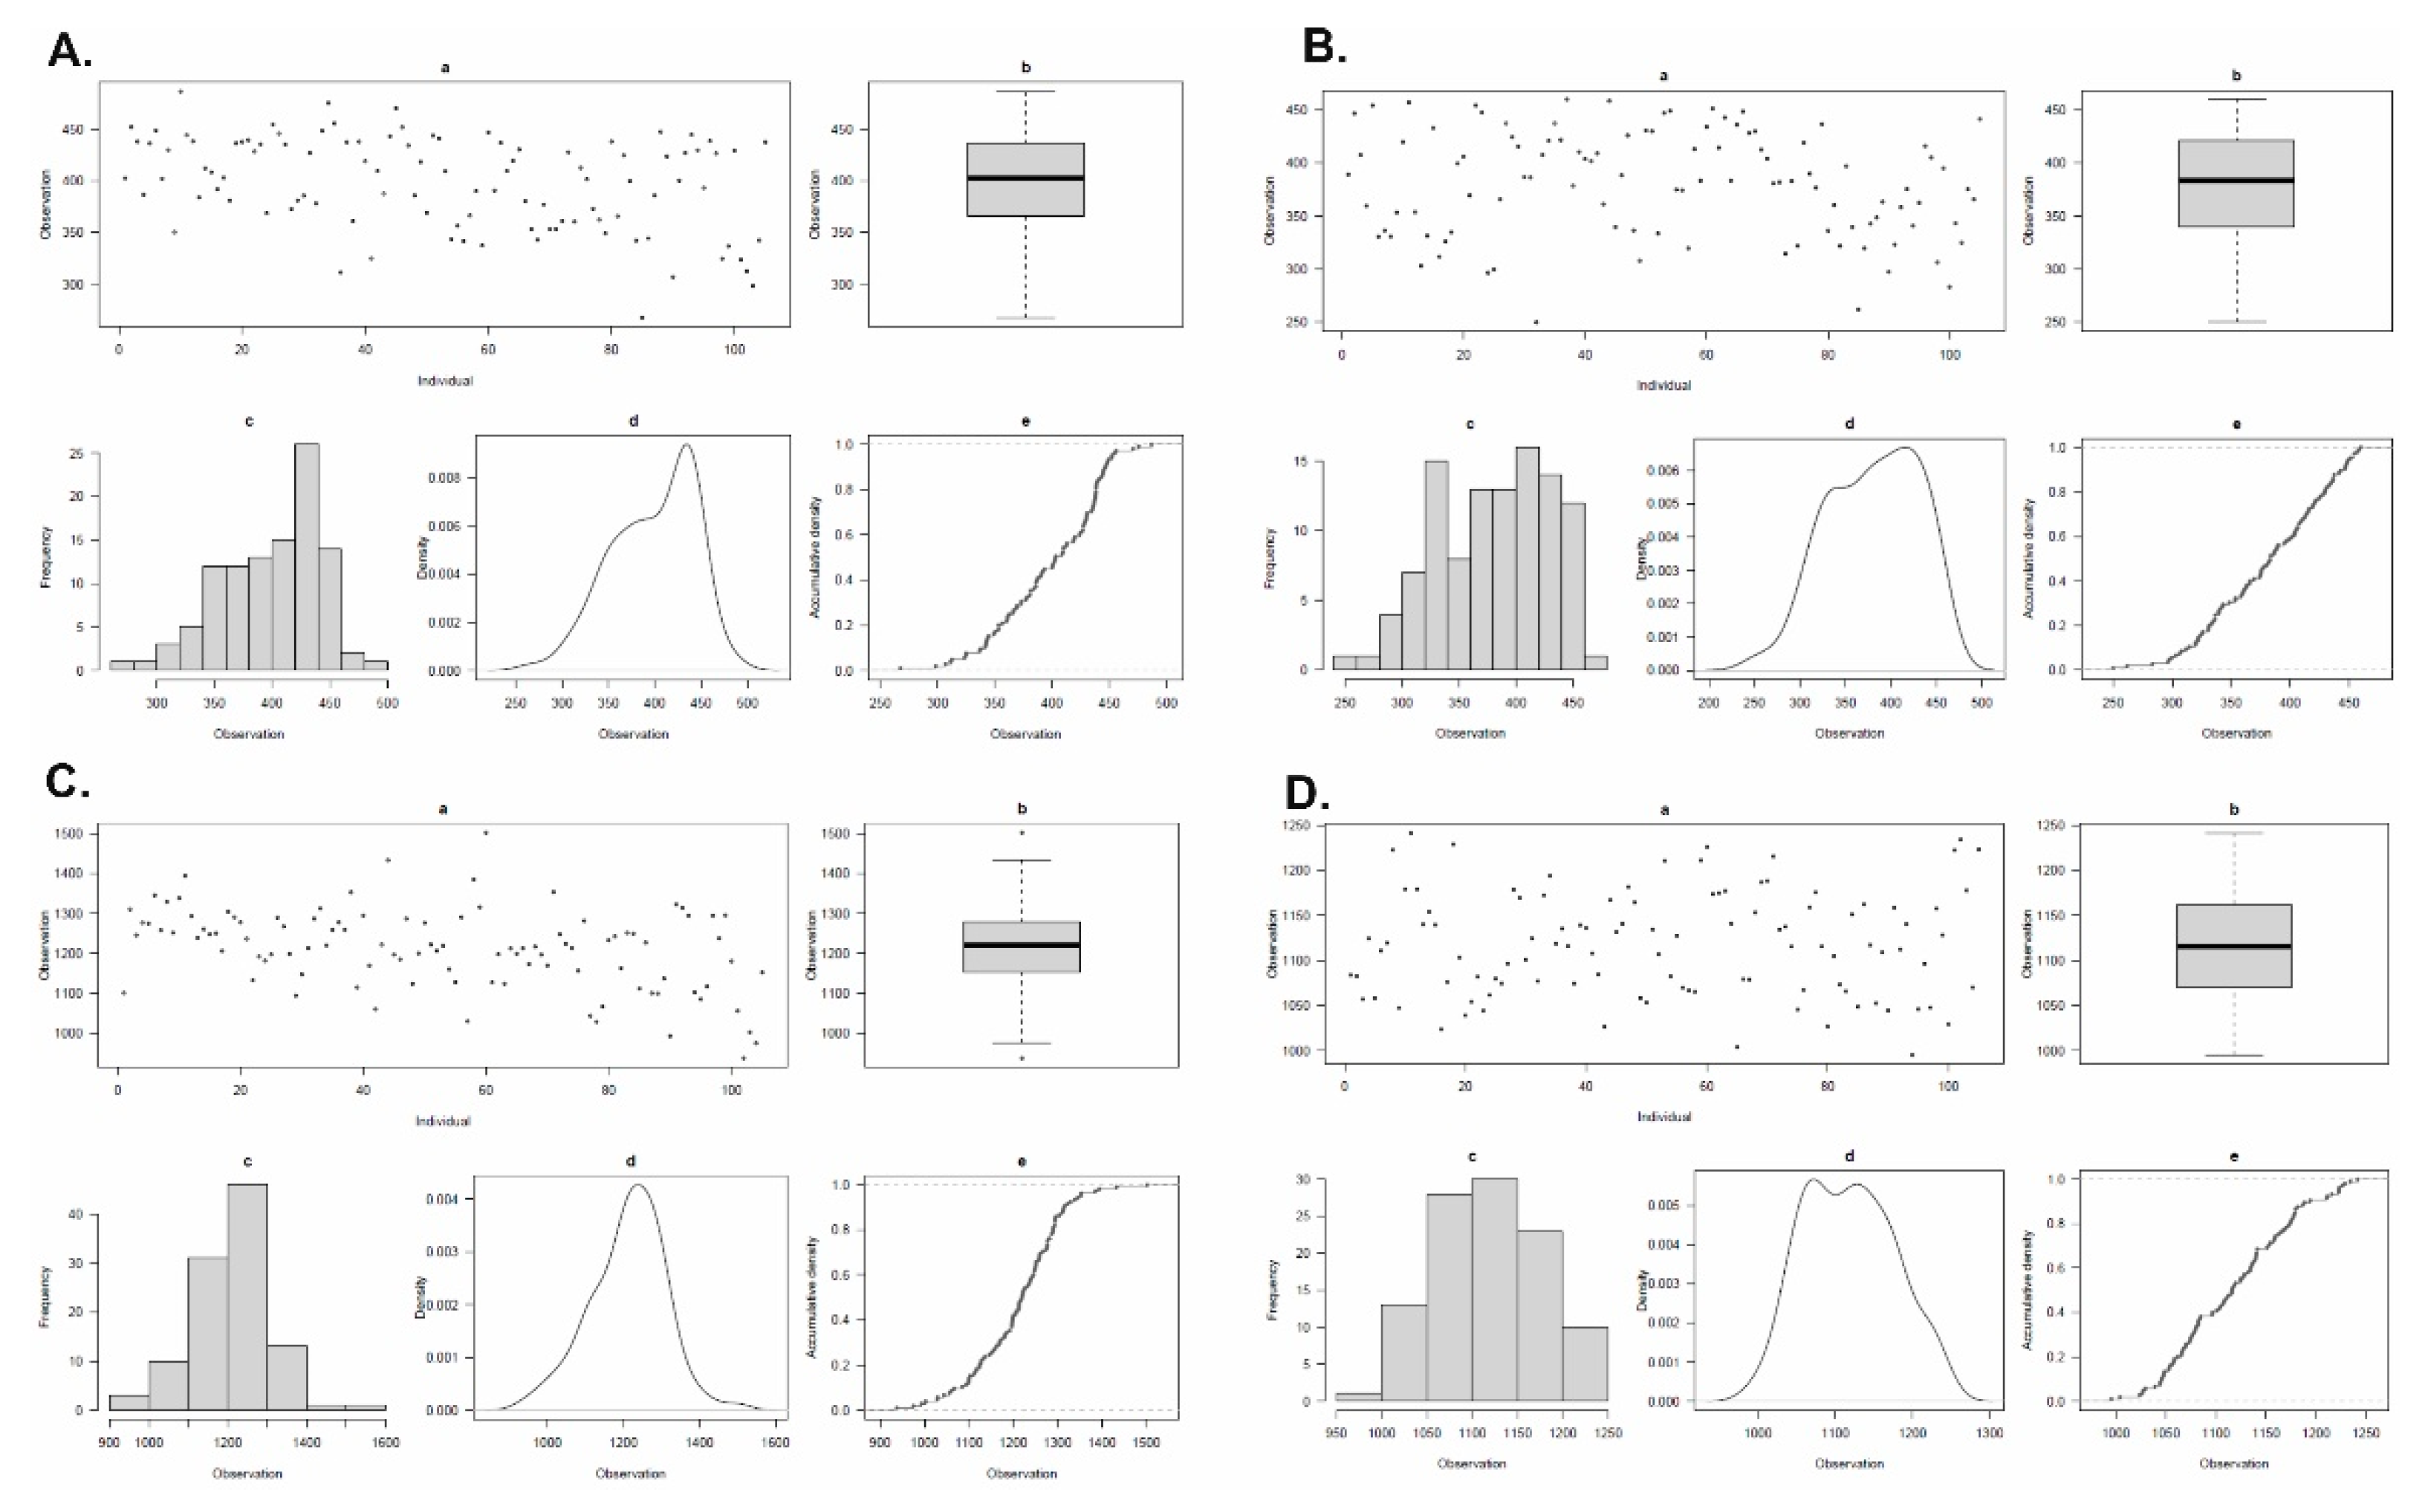
Figure 2.
Population structure, linkage disequilibrium (LD) and correlation coefficient (A). Scatterplot depicting the results of principal component analysis (PCA), analyzed on the genotypic data of WAMI panel consisting of 105 wheat accessions. It highlights the population structure of the WAMI panel, as shown by the three components (PC1, PC2 and PC3), providing insights into the genetic relationships among the individuals [19]. (B). A scatter plot for r2 values of pairwise markers representing disequilibrium decay for 105 accessions. The curve shown in red colour, represents smoothing spline regression model fitted for LD decay. The horizontal and vertical line represents standard critical r2 value and physical distance in basepair (bp) respectively. The sky blue vertical line represents physical distance (23754184 bp), where the LD half decay intersects the LD decay curve [19]. (C). Pearson’s correlation between two consecutive years with Ca and Mg grain micronutrients.
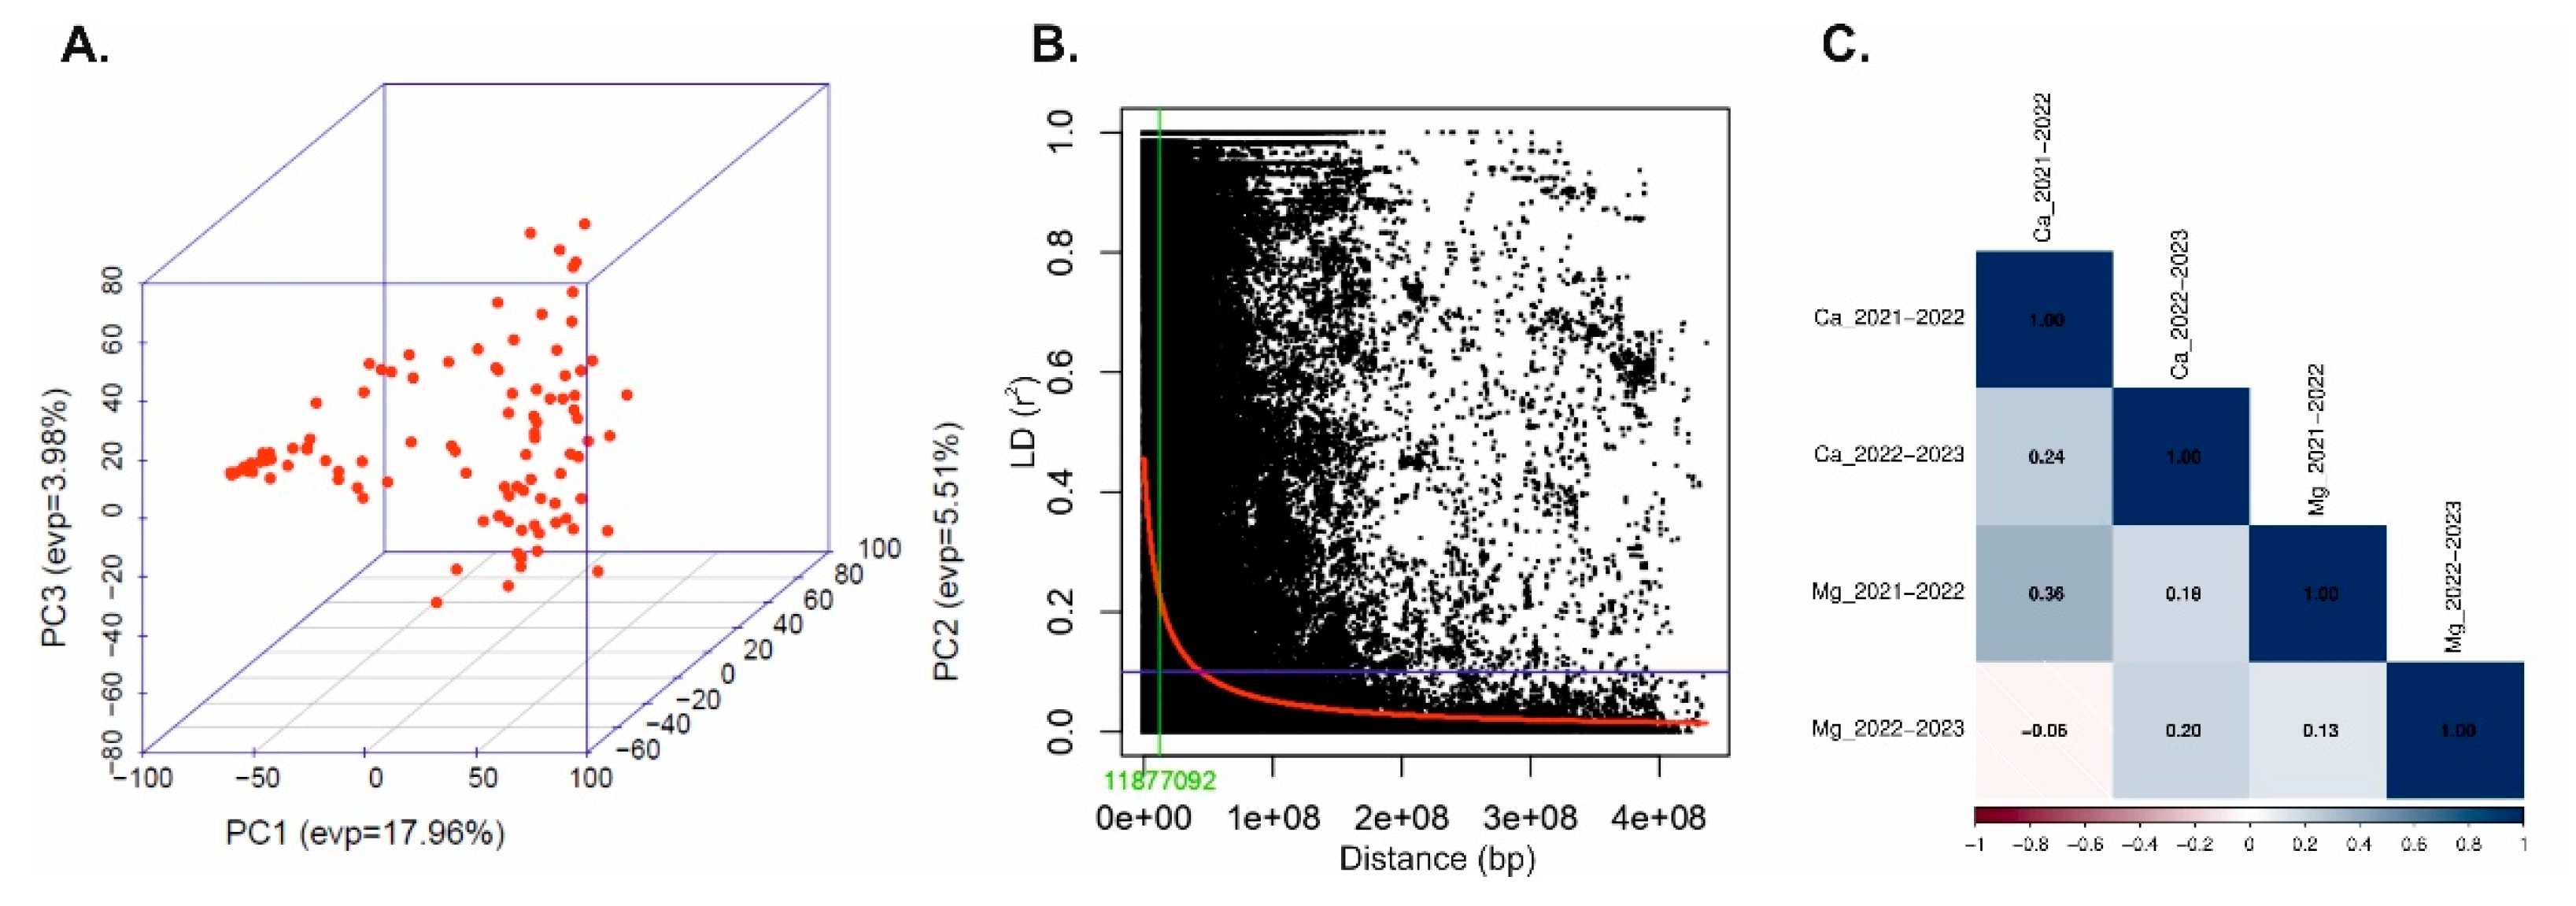
Figure 3.
Manhattan and Q–Q plots of SNPs associated with GCaC and GMgC, obtained using BLINK and FarmCPU. Q-Q (Quantile-Quantile) plots consists of grey areas, indicating 95% confidence interval under the null hypothesis, with no association between SNP and the investigated trait. The significance threshold of −log10(P) = 3.0 and SNPs above this threshold are significantly associated with GCaC and GMgC in the plots.
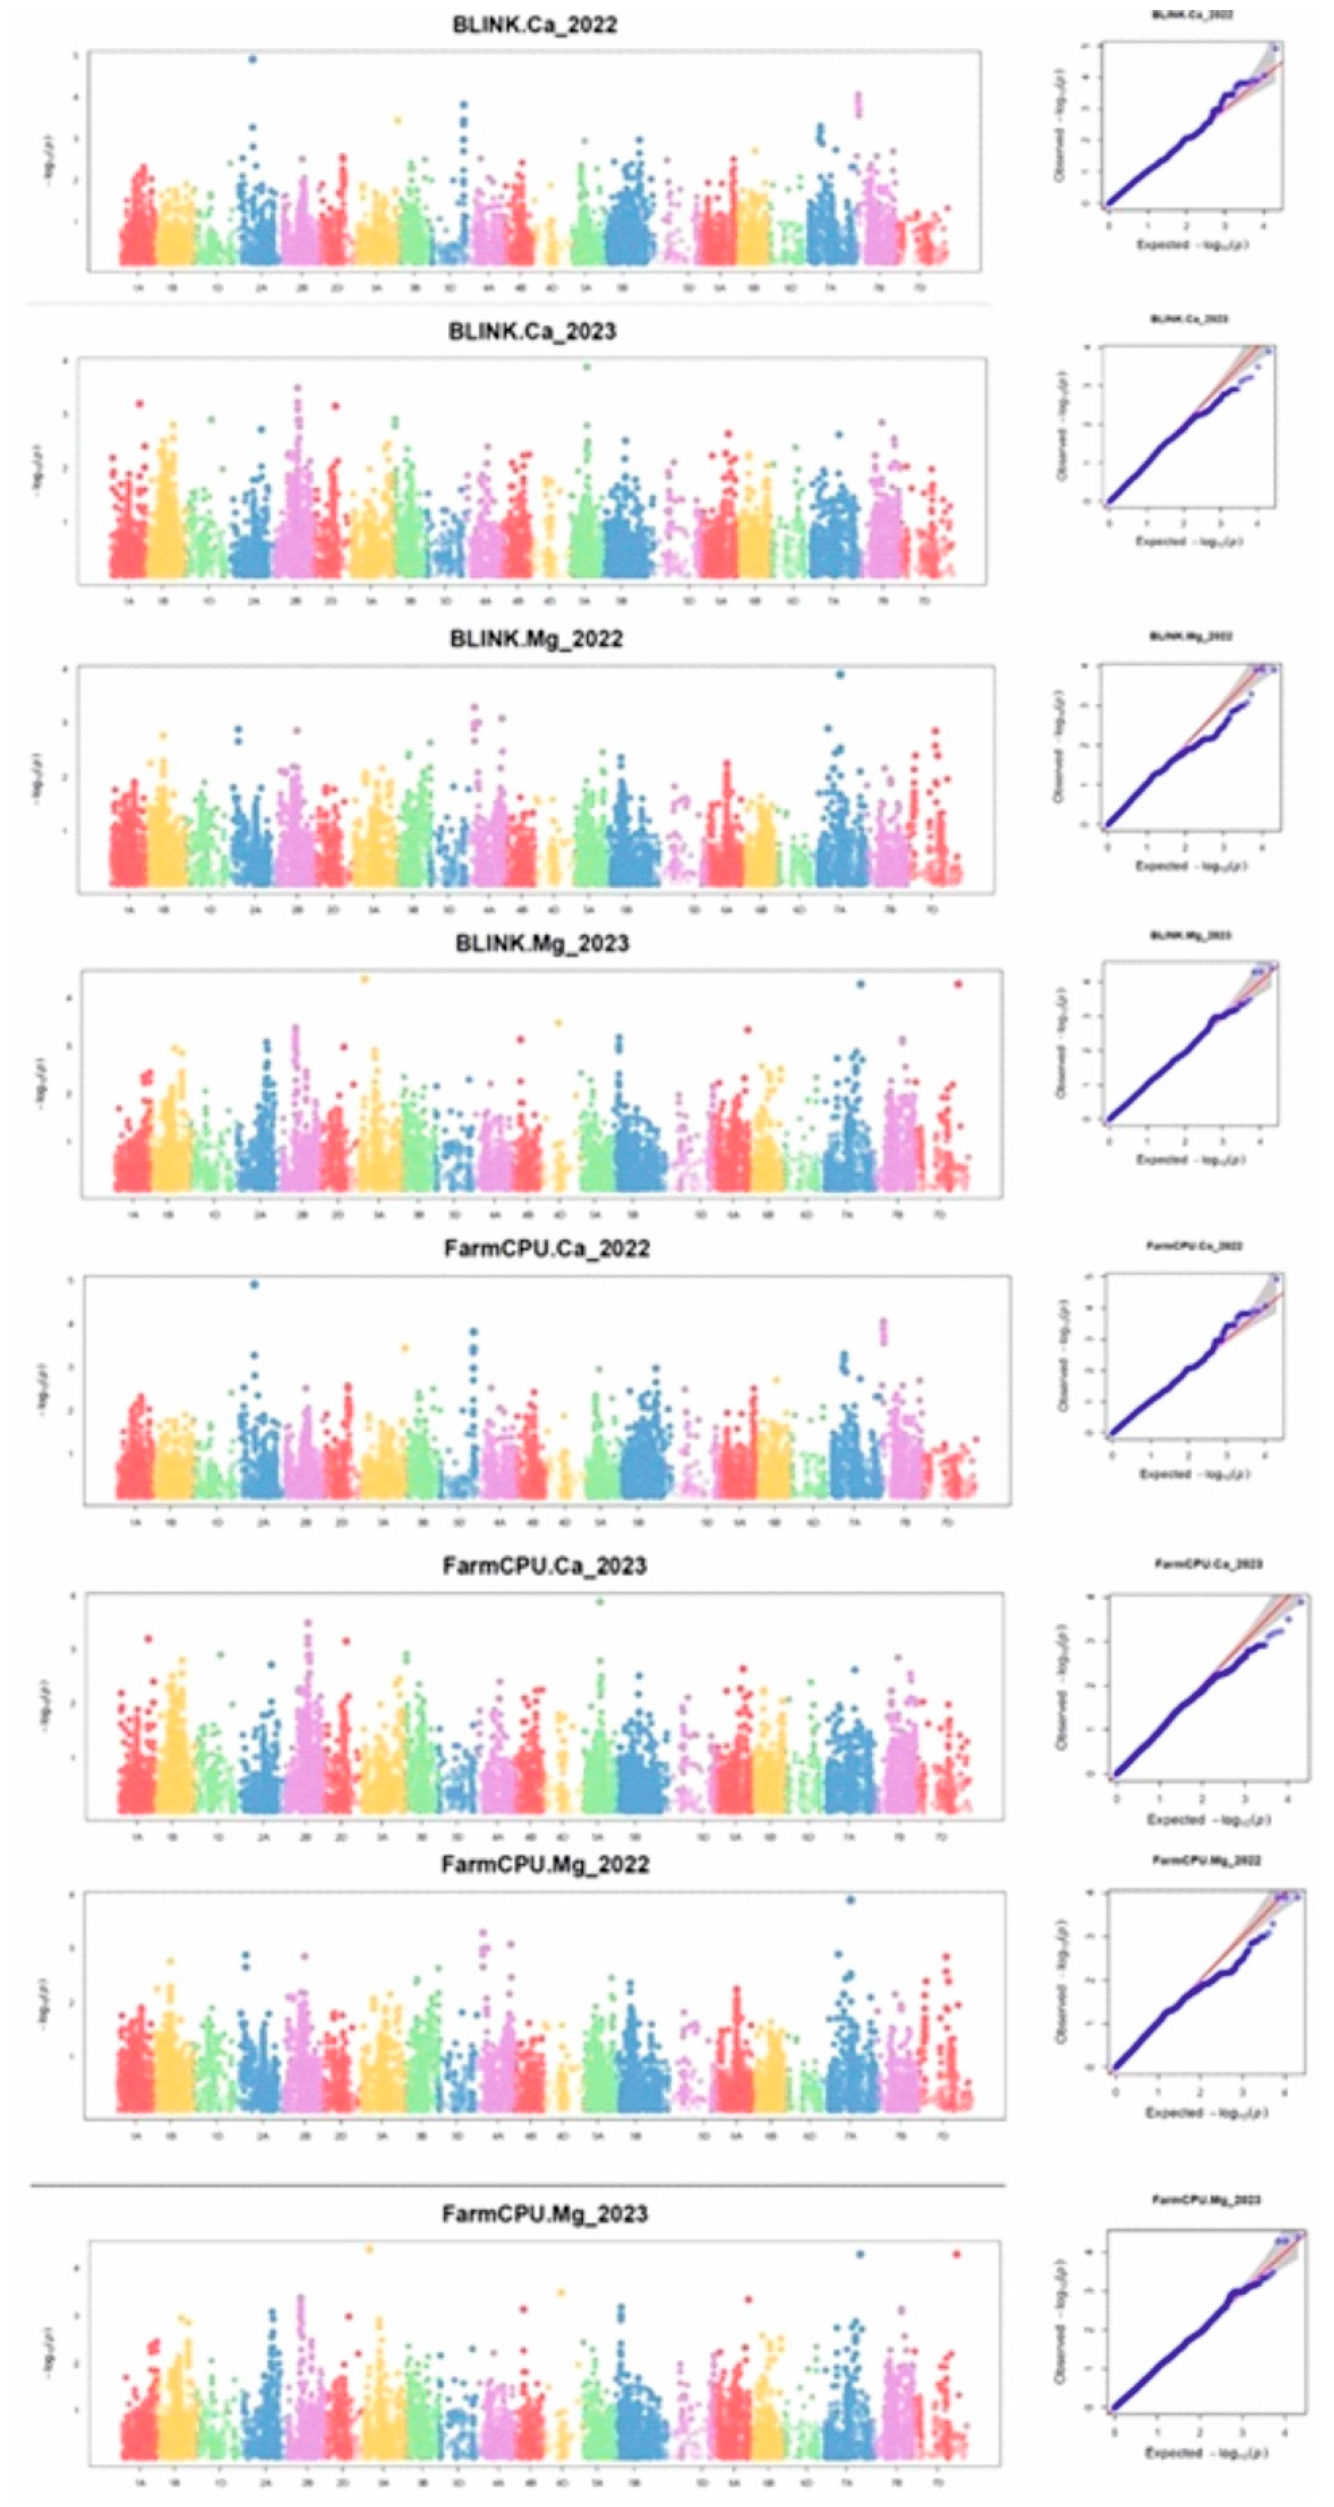
Table 3.
Description of marker–trait associations (MTAs) detected for GCaC and GMgC in the WAMI panel for the year 2021–2022 and 2022–2023.
Table 3.
Description of marker–trait associations (MTAs) detected for GCaC and GMgC in the WAMI panel for the year 2021–2022 and 2022–2023.
| Marker | Chr | Pos (cM)# | Pos (Mb)* |
Effect | Trait | Year | MAF | Ref. |
|---|---|---|---|---|---|---|---|---|
| wsnp_BE591290B_Ta_2_7 | 1A | 133.0 | 661.8 | -21.85 | Ca | 2022-23 | 0.19 | PNF |
| wsnp_BG274294B_Ta_2_3 | 1B | 77.0 | 543.0 | 36.33 | Mg | 2021-22 | 0.37 | PNF |
| IAAV565 | 1B | 122.0 | 652.4 | 18.64 | Ca | 2022-23 | 0.26 | PNF |
| Excalibur_c23906_303 | 1D | 115.0 | 436.9 | -34.07 | Ca | 2022-23 | 0.14 | PNF |
| wsnp_Ra_c193_406396 | 1D | 115.0 | 435.8 | -34.07 | Ca | 2022-2023 | 0.14 | PNF |
| BS00068139_51 | 2A | 62.0 | 30.4 | 34.28 | Ca | 2021-2022 | 0.07 | PNF |
| Kukri_c11327_977 | 2A | 101.0 | 361.3 | 19.62 10.69 |
Ca | 2021-2022, 2022-2023 |
0.13 |
[21] |
| wsnp_Ex_c61879_61748626 | 2A | 62.0 | 30.4 | 21.38 | Ca | 2021-2022 | 0.13 | PNF |
| RAC875_c39634_370 | 2A | 27.0 | 10.7 | -35.81 | Mg | 2021-2022 | 0.40 | PNF |
| wsnp_Ex_c11827_18986376 | 2A | 133.0 | 733.9 | -17.24 | Ca | 2022-2023 | 0.29 | PNF |
| RFL_Contig3509_229 | 2A | 128.0 | 723.8 | -32.11 | Mg | 2022-2023 | 0.09 | PNF |
| TA005606-1282 | 2B | 96.0 | 212.2 | -36.83 | Mg | 2021-2022 | 0.23 | PNF |
| Ra_c10607_524 | 2B | 114.0 | 692.9 | -26.26 | Ca | 2022-2023 | 0.11 | PNF |
| Kukri_c19751_873 | 2B | 108.0 | 594.1 | 20.46 | Ca | 2022-2023 | 0.47 | PNF |
| wsnp_Ex_rep_c67543_66165372 | 2B | 108.0 | 593.6 | 20.25 | Ca | 2022-2023 | 0.48 | PNF |
| BS00022800_51 | 2B | 108.0 | 595.1 | 19.23 | Ca | 2022-2023 | 0.48 | PNF |
| Kukri_c25815_263 | 2B | 108.0 | 594.8 | 18.76 | Ca | 2022-2023 | 0.49 | PNF |
| Excalibur_c7963_1722 | 2B | 69.0 | 31.0 | -19.95 | Mg | 2022-2023 | 0.46 | PNF |
| GENE-1421_802 | 2B | 69.0 | 46.0 | -19.80 | Mg | 2022-2023 | 0.45 | PNF |
| Tdurum_contig12879_1273 | 2B | 115.0 | 712.6 | -21.51 | Ca | 2022-2023 | 0.20 | PNF |
| Ku_c51309_212 | 2B | 115.0 | 714.7 | -22.06 | Ca | 2022-2023 | 0.19 | PNF |
| Kukri_c29640_212 | 2B | 69.0 | 47.1 | -20.51 | Mg | 2022-2023 | 0.47 | PNF |
| Gene_1421_706 | 2B | 69.0 | 46.0 | 19.73 | Mg | 2022-2023 | 0.45 | PNF |
| Excalibur_c2050_748 | 2B | 69.0 | 46.1 | -20.77 | Mg | 2022-2023 | 0.45 | PNF |
| GENE-1421_124 | 2B | 69.0 | 47.1 | -21.02 | Mg | 2022-2023 | 0.44 | PNF |
| RAC875_c66820_684 | 2D | 91.0 | 622.9 | 20.76 | Ca | 2022-2023 | 0.23 | PNF |
| wsnp_Ku_c2249_4335279 | 3A | 188.0 | 611.2 | 25.67 | Ca | 2021-2022 | 0.10 | PNF |
| D_contig35269_394 | 3A | 33.0 | 16.1 | -34.31 | Mg | 2022-2023 | 0.13 | PNF |
| RAC875_rep_c111781_179 | 3B | 5.0 | 13.0 | -22.87 | Ca | 2022-2023 | 0.20 | PNF |
| Kukri_c17082_519 | 3B | 5.0 | 24.8 | -23.06 | Ca | 2022-2023 | 0.18 | PNF |
| RAC875_c13385_1268 | 3B | 5.0 | 24.8 | -23.06 | Ca | 2022-2023 | 0.18 | PNF |
| BS00062806_51 | 3D | 143.0 | 604.6 | 26.18 | Ca | 2021-2022 | 0.10 | PNF |
| BS00070060_51 | 3D | 143.0 | 614.6 | 26.18 | Ca | 2021-2022 | 0.10 | PNF |
| D_GBF1XID02HLMWB_65 | 3D | 143.0 | 604.4 | 26.18 | Ca | 2021-2022 | 0.10 | PNF |
| Excalibur_c51976_119 | 3D | 143.0 | 611.2 | 26.18 | Ca | 2021-2022 | 0.10 | PNF |
| TA006354-0937 | 3D | 143.0 | 611.2 | 26.18 | Ca | 2021-2022 | 0.10 | PNF |
| BobWhite_c5246_196 | 3D | 143.0 | 746.6 | 25.67 | Ca | 2021-2022 | 0.10 | PNF |
| BS00070059_51 | 3D | 143.0 | 614.6 | 25.67 | Ca | 2021-2022 | 0.10 | PNF |
| BS00105800_51 | 3D | 143.0 | 611.5 | 25.67 | Ca | 2021-2022 | 0.10 | PNF |
| D_GDEEGVY01CO81T_81 | 3D | 143.0 | 604.3 | 25.67 | Ca | 2021-2022 | 0.10 | PNF |
| Excalibur_c17654_1090 | 3D | 143.0 | 611.2 | 25.67 | Ca | 2021-2022 | 0.10 | PNF |
| Excalibur_c6906_804 | 3D | 143.0 | 612.8 | 25.67 | Ca | 2021-2022 | 0.10 | PNF |
| wsnp_Ex_c12963_20529964 | 3D | 143.0 | 612.9 | 25.67 | Ca | 2021-2022 | 0.10 | PNF |
| wsnp_Ku_c7264_12545135 | 3D | 143.0 | 612.9 | 25.67 | Ca | 2021-2022 | 0.10 | PNF |
| Excalibur_c12032_1101 | 4A | 26.0 | 10.6 | 39.71 | Mg | 2021-2022 | 0.36 | PNF |
| wsnp_Ex_c7280_12498193 | 4A | 144.0 | 725.6 | 48.11 | Mg | 2021-2022 | 0.12 | PNF |
| Ra_c7973_1185 | 4A | 43.0 | 46.1 | 46.51 | Mg | 2021-2022 | 0.14 | PNF |
| Tdurum_contig59603_74 | 4A | 26.0 | 99.2 | 37.64 | Mg | 2021-2022 | 0.39 | PNF |
| Tdurum_contig59603_94 | 4A | 26.0 | 99.2 | 37.64 | Mg | 2021-2022 | 0.39 | PNF |
| Tdurum_contig31139_143 | 4B | 35.0 | 13.9 | -22.53 | Mg | 2022-2023 | 0.22 | PNF |
| Tdurum_contig31139_79 | 4B | 35.0 | 13.9 | -22.53 | Mg | 2022-2023 | 0.22 | PNF |
| wsnp_Ku_c9140_15390166 | 4D | 79.0 | 50.1 | -35.87 | Mg | 2022-2023 | 0.07 | PNF |
| wsnp_Ex_c2718_5038582 | 5A | 43.0 | 46.7 | 16.98 18.48 |
Ca | 2021-2022, 2022-2023 |
0.43 0.23 |
[21] |
| RAC875_c9984_1003 | 5A | 89.0 | 585.4 |
16.55 11.10 |
Ca | 2021-2022, 2022-2023 |
0.31 0.23 |
[21] |
| Excalibur_c52167_355 | 5A | 76.0 | 549.5 | -28.63 | Ca | 2022-2023 | 0.12 | PNF |
| wsnp_Ra_c17216_26044790 | 5A | 76.0 | 549.5 | -22.78 | Ca | 2022-2023 | 0.13 | PNF |
| wsnp_Ku_c5308_9450093 | 5B | 21.0 | 16.4 | -20.67 | Mg | 2022-2023 | 0.39 | PNF |
| GENE-3277_145 | 5B | 20.0 | 16.9 | -20.05 | Mg | 2022-2023 | 0.40 | PNF |
| wsnp_Ex_c12927_20480163 | 5B | 20.0 | 16.4 | -20.05 | Mg | 2022-2023 | 0.40 | PNF |
| Tdurum_contig28802_213 | 6A | 125.0 | 597.8 | 17.94 18.12 | Mg | 2021-2022, 2022-23 | 0.19 0.38 | [22] |
| BS00077044_51 | 6A | 140.0 | 614.6 | -33.63 | Mg | 2022-2023 | 0.09 | PNF |
| wsnp_Ex_c34597_42879693 | 6A | 125.0 | 597.8 | 19.2,1 21.02 | Mg | 2021-2022, 2022-23 | 0.29 0.37 | [22] |
| RFL_Contig6053_3082 | 6A | 126.0 | 597.7 | 17.76 24.84 |
Mg | 2021-22, 2022-2023 |
0.24 0.26 |
[22] |
| wsnp_Ex_c34597_42879718 | 6B | 93.0 | 597.8 | Ca, Mg | 2021-2022, 2022-23 | PNF | ||
| CAP11_c1473_320 | 7A | 82.0 | 52.9 | -19.47 | Ca | 2021-2022 | 0.20 | PNF |
| BS00078460_51 | 7A | 82.0 | 52.9 | -18.50 | Ca | 2021-2022 | 0.22 | PNF |
| Ex_c9615_1202 | 7A | 82.0 | 52.9 | -18.50 | Ca | 2021-2022 | 0.22 | PNF |
| Ex_c9615_574 | 7A | 82.0 | 49.8 | -18.50 | Ca | 2021-2022 | 0.22 | PNF |
| RAC875_c52560_123 | 7A | 76.0 | 46.7 | 22.30 | Ca | 2021-2022 | 0.11 | PNF |
| BS00022751_51 | 7A | 126.0 | 159.5 | -41.85 | Mg | 2021-2022 | 0.34 | PNF |
| wsnp_Ex_c25025_34285478 | 7A | 126.0 | 159.4 | -41.85 | Mg | 2021-2022 | 0.34 | PNF |
| Tdurum_contig45437_1667 | 7A | 74.0 | 42.1 | 45.24 | Mg | 2021-2022 | 0.12 | PNF |
| Kukri_c31824_636 | 7A | 183.0 | 696.9 | 24.44 | Mg | 2022-2023 | 0.32 | PNF |
| Tdurum_contig31699_276 | 7A | 183.0 | 696.9 | 24.44 | Mg | 2022-2023 | 0.32 | PNF |
| RAC875_c10555_178 | 7B | 8.0 | 35.4 | 20.69 | Ca | 2021-2022 | 0.29 | PNF |
| IAAV1902 | 7B | 8.0 | 36.8 | 20.44 | Ca | 2021-2022 | 0.29 | PNF |
| wsnp_JD_c1285_1848292 | 7B | 10.0 | 37.0 | 19.93 | Ca | 2021-2022 | 0.30 | PNF |
| BobWhite_c47269_128 | 7B | 10.0 | 37.0 | 19.65 | Ca | 2021-2022 | 0.30 | PNF |
| Tdurum_contig97814_355 | 7B | 95.0 | 641.1 | 18.45 | Ca | 2022-2023 | 0.35 | PNF |
| wsnp_Ex_c10430_17064001 | 7D | 118.0 | 112.4 | -37.60 | Mg | 2021-2022 | 0.48 | PNF |
# = Genetic position in centiMorgan (cM); * = Physical position in base pair (bp); PNF = Potentially new finding.
Disclaimer/Publisher’s Note: The statements, opinions and data contained in all publications are solely those of the individual author(s) and contributor(s) and not of MDPI and/or the editor(s). MDPI and/or the editor(s) disclaim responsibility for any injury to people or property resulting from any ideas, methods, instructions or products referred to in the content. |
© 2025 by the authors. Licensee MDPI, Basel, Switzerland. This article is an open access article distributed under the terms and conditions of the Creative Commons Attribution (CC BY) license (http://creativecommons.org/licenses/by/4.0/).
Copyright: This open access article is published under a Creative Commons CC BY 4.0 license, which permit the free download, distribution, and reuse, provided that the author and preprint are cited in any reuse.


