
Submitted:
27 August 2025
Posted:
28 August 2025
You are already at the latest version
Abstract
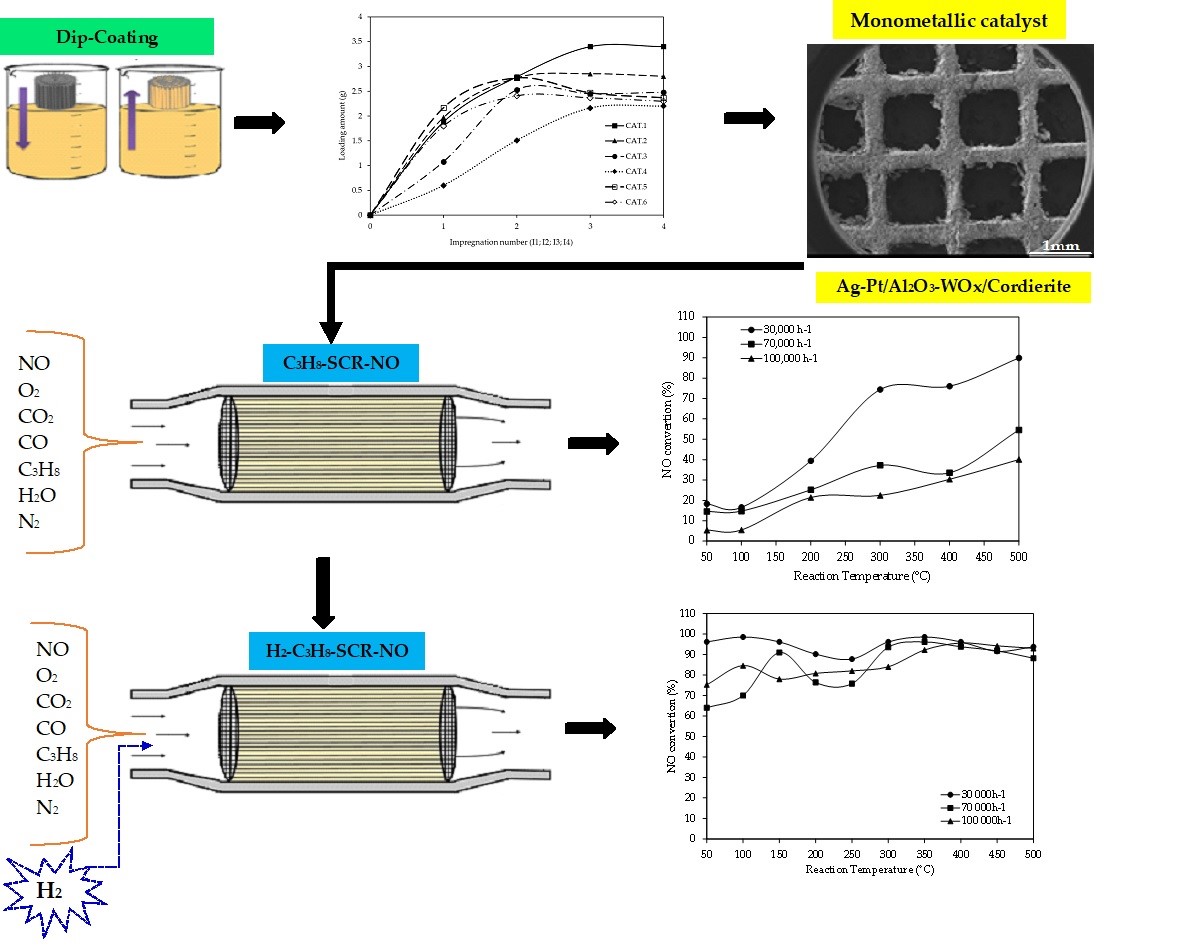
Ag and Pt-Ag catalysts supported on Al2O3-tungsten oxides (WOx) deposited on cordierite monoliths were prepared for the removal of nitrogen oxides (NOx) from diesel engine ex-haust emissions using C3H8 as well as H2 as reductants in the selective catalytic reduction. The catalysts were characterized by N2 physisorption, X-ray diffraction (XRD), tempera-ture programmed reduction (TPR), scanning electron microscopy (SEM/EDX), transmis-sion electron microscopy (STEM/HAADF), H2 chemisorption, and Raman and UV-vis spectroscopy of the evaluated catalysts. The conversion of NO, C3H8 and CO was studied as a function of three GHSVs 30,000, 70,000 and 100,000 h-1 as well as the reaction tem-perature. The combination of 0.1wt%Pt-2wt%Ag /Al₂O₃-WOx on cordierite monoliths was active in NO reduction and CO and C₃H8 combustion. By STEM, small Pt-Ag bimetallic particles (20 nm) presented a high Pt concentration (58.6 atom%). Separate Ag particles were also detected. The best preparation conditions of boehmite AlO(OH)/cordierite mon-olith were obtained by applying three or four boehmite AlO(OH) impregnations, drying, calcination in air flow, and H₂ reduction at 500 °C and exchange with H₂PtCl₃ and AgNO3. A one-dimensional model of NO conversion as a function of reactor length was proposed considering external mass transfer limitations as dominant.
Keywords:
Pt-Ag
; Al2O3-WOx
; cordierite monoliths
; NO
; reduction with C3H8 and H2
1. Introduction
Diesel engines contribute to increasing greenhouse gas emissions; they emit NOx, CO2, CO and unburned hydrocarbons. However, NOx and particulate matter (PM) are of great concern due to their effects on human health and the environment. This has led to a further increase in legislation to reduce NOx emissions in recent decades [1,2,3].
Catalytic processes have been designed and developed to convert NOx into nitrogen, and this reduce environmental pollution. The selective catalytic reduction (SCR) of NOx with hydrocarbons and oxygenates has remained among environmental catalysis research processes as a promising method for the reduction of NOx in the exhaust gases of diesel and lean combustion engines [4,5,6].
However, not only hydrocarbons (HC) have been studied as reducers, but alcohols such as methanol, ethanol and butanol [6,7,8]. Some of the most used reducers (HC) are methane, propene, n-propane, n-butane and n-octane [7,8,9]. The SCR-NOx system with HC (or HC-SCR) is of great interest because in the presence of an oxidizing atmosphere, just as diesel engines work, it is possible to eliminate NOx [10,11].
Among the various catalytic systems proposed in SCR-NOx technology with organic reducing agents, there are noble metals (Rh, Ru, and Pt) supported on metal oxides, obtaining promising results with hydrocarbons of short chain (HC) [12]. However, since the early work of Held at al. [13] and Iwamoto et al. [14] a large number of different materials have been proposed and tested for HC-SCR. Among these, Ag/Alumina has shown high activity both in the laboratory and in real-scale tests [15].
Ag -alumina is of great interest due to its high activity, good selectivity to form N2, good stability against water vapor and tolerance to SO2 [6,7,16,17]. Various studies that have been to carried out mainly with C3H6 and through impregnation methods of the Ag precursor in Al2O3, have identified that the appropriate concentration of Ag on the support is between 1 and 3wt% [18].
Studies have also been carried out on the nature and role of active Ag species during NOx reduction in the presence of C3H6 and water [9,10,11,12,13,14,15,16,17,18,19]. The SCR of NO with Ag/Al2O3, catalysts in the presence of O2 depends on the concentration and type of Ag on the surface in the form of Ag+ cations and Agn nanoclusters (n= 8), the Ag0 nanoparticles have catalyzed the oxidation of total hydrocarbons or alcohols to CO2 and H2O [16].
On the other hand, the Ag/Al2O3 catalyst presents some drawbacks, such as its high activity in a narrow operating temperature window, and the activity decreases below 400°C in the case of SCR with light hydrocarbons [6,16].
However, despite these drawbacks, various studies have been carried out to expand the operating temperature window with the addition of H2 [19,20], the results show that it has been achieved mainly in the low temperature range (80-180°C) and in the high temperature range (180 to 480°C), that is, two thermal zones are present where NO is reduced with C3H8 and the presence of H2.
In the search for other reducers, the mixture of H2 and NH3 together has also been investigated [21,22], obtaining good reduction results at low temperatures, although there may be NH3 emissions. In a study carried out by Shang Z. et al. [23], the combined effect of CO in the presence of C3H8 was analyzed and the temperature window was expanded, but a catalyst of 5wt%Ag/Al2O3 was required.
For its part, the addition of noble metals such as Pt to Ag [24] is useful to obtain high conversions of NO at low temperatures, using octane as a reducing agent. The catalytic composition that showed the greatest activity for the reduction of NOx was a catalyst with 2%wt Ag/Al2O3 doped with 500 ppm of Pt. This catalyst showed a greater capacity to adsorb and partially oxidize the hydrocarbon (reductant), where the Pt has a predominant role.
Other studies of NO reduction were investigated with Pt, Rh and Ag/Al2O3 with C3H6, and Ag was the most active at higher temperatures (300°C), while Pt and Rh were active at lower temperatures (200 -250°C) [25]. The Pt catalysts supported on WO3/ZrO2 with presence of H2 without Ag in the reduction of NO [26], found high activity at temperatures below 200°C and high selectivity to N2 (90%). Furthermore, the catalyst showed excellent hydrothermal stability as well as resistance to SO2.
Previous studies have shown that the addition of small amounts of WOx (<1 wt%) to Al2O3 or a Pt/Al2O3 catalyst results in increased thermal stability of both the Al2O3 and the Pt catalyst, increasing the resistance to noble metal sintering [27,28].
This is the reason because we have adopted these WOx, especially to preserve the thermal stability of the Pt species, in order to increase the resistance to deactivation by sintering, stabilizing the porous structure of the Al2O3. This effect helps keep the support area after high temperature heat treatments (until 800°C) and also this effect could extend to Ag species (Ag0, Ag+ cations and Agn nanoclusters).
In this study we focused on obtaining monolithic catalysts based on solid honeycomb cordierite supports containing M-Al2O3 -WOx (M= Ag, Pt [29] or Ag-Pt) catalytic systems. As mentioned previously, the study contributes to improving the performance of the Ag/Al2O3 catalyst by adding minimal amounts of Pt and WOx
The catalytic activity of the Ag-Pt/ Al2O3-WOx catalyst in the reduction of nitrogen monoxide (NO) in the presence of C3H8 and subsequent addition of H2 as a reducing gas has allowed to obtain a higher conversion of NO at low temperature (120°C) than when H2 was not added. The study combines the presence of the reductants H2 and C3H8 and the presence of small amounts of Pt, using a synthetic mixture of emission gases (C3H8, CO, CO2, NO, O2 and water vapor) similar to those emissions from diesel engines.
2. Materials and Methods
2.1. Synthesis of Structured Catalyst
The catalyst was synthesized using a cordierite ceramic monolith, with density 400 cells/square inch (cpsi), and with dimensions of diameter 25.4mm, length 50 mm, and a volume of 25.3 cm3 (Ganzhou Dingchang New Materials Co. Ltd. of China ). The average monolith weight was 17 g and the amount of deposited catalyst was approximately 1.0 g deposited by the Dip-coating method. The catalyst composition was 2wt% Ag, 0.1wt% Pt supported on Al2O3 promoted with 0.5wt% W. The details of the catalyst preparation are described below.
A suspension of boehmite (AlO(OH)), as a precursor to Al2O3 together with ammonium metatungstate in aqueous solution, was prepared by co-precipitation of Al(NO3)3∙9H2O (99%, Fermont, Mexico) and (NH4)12W12O40∙5H2O (66.55%W, Aldrich) as promotor to obtain a nominal content of 0.5wt% W. NH4OH (J.T Baker, USA) was used as a precipitating agent at a concentration of 30wt% to obtain a suspension with a pH of 9. The (AlO(OH)) suspension obtained was kept under stirring for 12 h at 25°C, and the monoliths were impregnated by the total immersion method Dip-coating (see Figure 1).
Considering important impregnation variables [30] such as: boehmite (AlO(OH)) concentration, extraction speed of the monolith from the suspension, number of immersion cycles, drying and calcination temperature on the deposited coating load and on the adherence of the washcoat, we prepared six samples named: CAT.1 to CAT.6. Prior to impregnation, the monolith was heated at 500°C. in air flow (100 ml/min) for 4 h to stabilize the structure and eliminate humidity and impurities from the environment.
The boehmite impregnation was carried out through the following stages: first, the monolith was slowly immersed in the bohemite suspension, to allow time for the air to be displaced from the channels (Figure 1(a)). The monolith remained immersed (from 1 to 1.5 h) in the suspension until the air was completely displaced. The monolith was then slowly removed (3 cm/min) [30] and placed in a position that allowed the excess suspension to be removed from the channels by the action of gravity (Figure 1(b)). This resulted in the formation of a well adherent layer on the surface of all the supports.
When the monoliths remained immersed in the boehmite suspension for 1 to 1.5 h a deposit of 2.3 to 5.8wt% Al2O3-WOx was obtained. At each immersion stage (each cycle), the monoliths were dried at 110°C for 24 h, and then weighed (see Figure 2). Once the weight remained constant, the calcination stage of the materials was carried out. The first three catalysts (CAT.1, CAT.2 and CAT.3) were calcined at 500°C with air flow of 100 ml/min for 6 h. The catalysts CAT.4, CAT.5 and CAT.6 were calcined in a static atmosphere also at 500°C for 6 h.
With the impregnation stage of the Al2O3-WOx support on the cordierite monoliths, the effect that the concentration of the boehmite suspension, the number of immersions and the frequency of each immersion, as well as the use of 3wt% SiO2 colloidal silica (LUDOX, 40wt% suspension, Aldrich) had on the adhesion and the mechanical stability of the coating.
The coating process using the Dip-coating method shows an increase in weight on the cordierite monoliths after two to four immersions (named I2 to I4) for the CAT.1, CAT.2, CAT.3, CAT.5 and CAT.6 catalysts (Figure 2). However, the CAT.4 catalyst showed a low coating. (Figure 2). Attributing the poor adhesion of the support to during the first immersion (I1) and an air film could have formed that did not allow the boehmite suspension to rise and adhere homogeneously to the channels of the monolith.
It was observed that when the number of immersion increased the viscosity of the suspension increased (of 500 mPa·s to 900 mPa·s) and this caused a lower adhesion of the boehmite on the monolith. Therefore, the structured catalysts were obtained with four immersions (I4). Under these conditions, a homogeneous and stable support layer was produced and a 5.8wt% Al2O3-WOx layer with a thickness of 50 μm was obtained.
Bimetallic Pt–Ag/Al2O3–WOx/Cordierite catalysts (CAT.1, CAT.2, CAT.3, CAT.4 and CAT.6) were prepared using the monolith with the already calcined Al2O3-WOx coating and using the methodology described in the article by Naomi et al., 2020 [29]. The impregnation of the metallic precursors was performed sequentially, starting with the impregnation of H2PtCl6 with the appropriate concentration to obtain a concentration of 0.1 wt% (based on the Al2O3 deposit) using the incipient humidity method. Subsequently, the monolith was dried at 110°C for 12 h and calcined at 500°C for 5 h, and then the Ag precursor (AgNO3 99%, Aldrich) with the appropriate concentration to obtain a concentration of 2 wt% (based on the Al2O3 deposit) was impregnated at room temperature and dried at 110°C for 12 h and calcined at 500°C for 5 h.
In the case of 2wt%Ag/Al2O3–WOx/Cordierite catalyst (CAT.5), we used 25 ml of an aqueous solution of AgNO3 (99%, Aldrich) with a concentration of 4 mgAg/ml in 1 g of Al2O3–WOx adhered on the monolith. The obtained material was dried at 110°C for 12 h, and calcined at 500°C for 5 h.
For Pt impregnation, 32.89 ml of aqueous solution of H2PtCl6 (99%, Aldrich) in 0.7 and 1 g of Al2O3-WOx adhered to cordierite (pH = 2.5) were used to obtain solids with a Pt content of 0.1 wt%. The solids were dried at 110 °C for 24 h and calcined in two different ways, the first three catalysts (CAT.1, CAT.2 and CAT.3) were calcined. Finally, the catalysts were reduced in a flow of H2 (30 cm3/min) at 500°C for 3 h.
2.2. Synthesis of Powder Catalysts
Two catalysts in powder form were synthesized, one with high Pt concentration (1wt%Pt–2 wt%Ag/Al2O3–WO), abbreviated as (1 PtAg/AW) and the second one with the lowest Pt concentration (0.1 wt% Pt–2 wt% Ag/ Al2O3–WO) abbreviated as (0.1 PtAg/AW) They were made first preparing a stirred aqueous mixture containing 0.44 mg/mL of Al(NO)3 .9H2O (Fermont, Mexico) plus the required amount of ammonium metatungstate in aqueous solution to obtain a nominal content of 0.5 wt% W. A 30% NH4OH solution (J.T. Baker) was added dropwise to this mixture until a boehmite precipitate (AlO(OH)) was formed at a pH of 9–10. This precipitate was left to stand for 12 h at 25 °C, then filtered, dried at 110 °C for 24 h, and calcined at 500 °C for 6 h. The exchange with the Pt and Ag precursors was sequential for the catalyst (1PtAg/AW) and was as follows: we started the impregnation with 131.56 mL of H2PtCl6 solution in 5 g of Al2O3-WOx (pH = 2.5) and with the catalyst (0.1PtAg/AW), we started the impregnation with 13.15 mL of H2PtCl6 solution in 5 g of Al2O3-WOx (pH = 2.8). These solids were dried at 110 °C for 12 h, calcined at 500 °C for 6 h. Subsequently, 5 g of the calcined solids were impregnated with 25 mL of a solution of AgNO3 (4 mgAg/mL) (Aldrich, USA) to obtain a concentration of 2 wt%Ag. This solution was soaked at 60°C for 2 h and the solid was filtered, dried at 110°C for 12 h, and calcined at 500°C for 6 h. All catalysts were reduced in H2 flow (30 cm3/min) at 500°C for 2 h.
2.3. Characterization
N2 physisorption using a Micromeritics ASAP-2460 Version 2.01 instrument, was carried out at 77 K to determine the textural properties of the catalysts. The samples were heated at 300°C during 3h under vacuum (1x10⁻³torr). The surface area values were obtained by application of the BET equation (absolute error ± 1.5m2/g). The micropore volume of the samples was calculated by means of the t-plot method. The calculation of the pore size was carried out by applying the BJH model to desorption branch of the isotherm, assuming cylindrical pore geometry.
X-Ray Diffraction (XRD) conducted the structural analysis of the synthesized catalysts (CAT.1, CAT.2, CAT.3, CAT.4, CAT.5 and CAT.6) on a Bruker D8FOCUS analytical instrument with Cu Kλ radiation. XRD patterns were made using angles of 2Ѳ from 10 to 70°, with a step size of 0.02° and a counting time of 2s, the absolute error was ±0.1°. The identification of the different crystalline phases (after and before calcination of 500°C) was performed by comparison with the corresponding JCPDS diffraction data cards.
The surface morphology, particle size and dispersion were analyzed by Scanning Electron Microscopy (SEM) in a JEOL (model JFM-6701-F) instrument equipped with energy dispersive X-ray detector (EDX) and by Scanning Transmission Electron Microscopy (HAADF-STEM). The particle size distribution of (Ag-Pt) and Ag in the catalyst samples was obtained at an 8× 10⁵ magnification. The size distribution of particles and the mean diameter of Ag particles were calculated from images taken from different areas of the sample. The qualitative and quantitative chemical analyzes were obtained by coupling the energy dispersive spectroscopy of X-ray (EDS) to microscope, the absolute error was ±0.1 keV. For the observation, each sample was spread on a graphite tape to make it conductive and Pd and Au atoms were also deposited.
Pt dispersion was obtained by H2 chemisorption in glass volumetric adsorption equipment with pressure sensors (Cole-Parmer EW-68073). The materials were previously reduced at 500°C for 3 h with a constant flow of H2 and degassed (1x10⁻³Torr) at 400°C for 2 h in an adsorption cell and stabilized at 25°C. The sample weight was 0.5 g and the H2 adsorption was performed at room temperature (25°C). Gas pressure at adsorption equilibrium was about 550 torr. The dead volume of the apparatus was 16.942 cm3, for the estimation of Pt metal dispersion and the absolute error was ±5 mmol of H2. The molar ratio of adsorbed hydrogen atom to the surface Pt atom was considered as one (H/Pt = 1) on the basis of the previous reports [27,28].
The temperature programmed reduction (TPR) profiles of the calcined powder catalysts of 0.1PtAg/AW and 1PtAg/AW were obtained on a Bel Japan Equipment, (Belcat model), equipped with a thermal conductivity detector (TCD). A gas mixture of 10%H2/Ar was used, with 30 mg of sample at a flow rate of 25cm3/min. The temperature was increased from 25 to 800°C at a heating rate of 10°C/min. The H2 consumption was monitored by a TCD (absolute error ± 0.15 mmol/g). The amount of H2 consumed was obtained by the deconvolution and integration of the TPR peaks using the Peak Fit program. The calibration was done by measuring the change in weight due to a reduction in H2 of 20 mg of CuO using an electrobalance Cahn-RG (USA). The TPR signal of CuO was made and correlated with the stoichiometric H2 consumption.
Ex situ UV-visible NIR diffuse reflectance spectra were obtained at 25°C from 0.5 g of the samples calcined at 500°C. The monolith samples evaluated at 450°C were also analyzed in a UV-vis spectrophotometer (GBC model Cintra 20) equipped with a Praying Mantis diffuse reflectance accessory (Harrick Scientific Products Inc.) The range studied was 200–800 nm at a 1 nm resolution and a 500 nm min−1 scan rate (error 0.5% absorbance).
The Raman spectra of the catalysts evaluated in the C3H8-SCR of NO were determined under ambient conditions using powder samples. A Renishaw InVia Raman spectrometer was used with a 532 nm (green) laser, in the range 25-4000 cm-1, with an exposure time of 10 s.
2.4. Catalytic Tests
The activity of the monolith catalysts was carried out using a cylindrical stainless-steel reactor of 22 cm in length, 25.4 mm of internal diameter (Figure 3). Three thermocouples were used, two of them indicated the initial and final temperatures of the oven and were placed in contact with the reactor. The third one, was placed in the center of the reactor, and was used to measure the temperature achieved in the middle of the monolith catalyst.. With these three temperatures the average longitudinal temperature was calculated.
The monolith of cordierite had 1 g approximately of catalyst deposited with a wall thickness of 50µm. The feed of exhaust gases was composed of 750 ppm NO, 1750 ppm C3H8, 6vol%O2, 600 ppm CO, 10vol%CO2, 12vol%H2O and N2. In the first reaction, a GHSV of 12, 000 h-1 was used at constant temperature of 350°C for 4 h with a flow rate of 550 ml/min.
The evaluation of NO and NO2 analysis was performed by chemiluminescence on a Thermo Scientific analyzer (42i-HL). The reaction products: CO, CO2 and C3H8 were analyzed by gas chromatography, using a silica gel column (18m x 1/8” ID) and a HayesepD column (9m x 1/8” from DI) to analyze C3H8. We used a Gow-Mac gas chromatograph with thermal conductivity detector (TCD) and H2 as carrier gas. Prior to catalytic testing, the CAT.6 catalyst was subjected to a high severity test using a gas mixture of 25 ppm SO2/Air at 750°C for 16 h. The conditions of this severity test were adopted from the literature [31].
The catalytic evaluation was also performed using SCR of NO by adding a hydrogen stream containing 1vol% H2 obtained from the ethanol steam reforming reaction. A gaseous diluent was used to mix H2 with the main gas stream containing NO.
The total pressure within the reaction system remained constant at 590 Torr, with GHSV of 30,000, 70,000 and 100,000 h-1 respectively. The reaction temperature range varied from 50 to 500°C in a period of 6 h.
Simultaneous analysis of NO, CO, CO2, C3H8 and O2 was also performed on a Consino automotive emissions gas analyzer, model FGA-4100. Conversion curves versus temperature were obtained from 50°C to 500°C for 6 h, using three different total flow rates (450, 900 and 1200 mL/min), keeping the feed composition constant.
The presence of external diffusion was considered important and was considered to calculate the conversion of NO as a function of the length of the monolith using a one-dimensional model (see Supplementary Information).
3. Results and Discussion
3.1. Characterization
3.1.1. Textural Properties
The Al2O3-WOx support deposited on cordierite monoliths (γ-Al2O3-WOx/Cordierite) showed type IV isotherms (IUPAC) (Figure 4(a)), that indicate the presence of multilayer physical adsorption, characteristic of mesoporous solids [32]. The γ-Al2O3-WOx/Cordierite sample presented a high area and the largest pore volume (Table 1), and a unimodal pore distribution was observed, as reported by Neimark et al. [33], in the alumina synthesized for used as a support in the reaction of SCR of NO with C10H22.
The fresh catalysts CAT.1 with Pt-Ag and CAT.5 with only Ag also presented type IV isotherms. The characteristic of this type of isotherm is the presence of a hysteresis cycle, which is associated with the capillary condensation phenomenon that occurs in the mesopores (Figure 4(a)) [34].
The pore volume distribution is shown in Figure 4(b), the support (γ-Al2O3-WOx/Cordierite) showed the greatest variation (ΔV/ΔDp) located at 24 Å, which is between the range of micropores and mesopores [35].
The variation (ΔV/ΔDp) of the CAT.1 and CAT.5 catalysts drops drastically (2/3) respect the support (γ-Al2O3-WOx/Cordierite) due to the impregnation of the Pt and Ag precursors respectively. The pore size distribution was also unimodal, indicating that there were no drastic changes in pore size distribution during the preparation of these catalysts.
After the catalytic evaluation, the type IV isotherm persists in the CAT.3, CAT.4 and CAT.6 catalysts (Figure 5(a)) and have H2 type hysteresis [34,36]. This type of cycle is characteristic of pores and solids formed by small spherical particles [34,36]. The pore size distribution was unimodal (Figure 5(b)).
The CAT.2 catalyst shows an H3 type hysteresis (Figure 5(a)), associated with aggregates of particles in the form of parallel plates that give rise to slit-shaped pores [37]. This material presented a bimodal pore distribution (Figure 5(b)), where the formation of large pores (63Å) corresponds to the residual spaces between particles existing or formed after the reaction [38]. The presence of small pores did not change really (24Å) as expected.
This distribution bimodal (Figure 5(b)), provided a good NO conversion. Because it suggested that catalysts whose supports have bimodal pore size distributions are beneficial to avoid rapid deactivation in the catalysts [39].
Table 1 shows the areas and pore size distribution of fresh catalysts (calcined at 500 °C for 6 h and reduced at 500 °C for 3 h) and evaluated in the NO reduction reaction (at 350 °C for 4 h). A decrease in the BET area is observed in all supported catalysts after being evaluated at 350°C. The drop is about half of the first area (in some cases) where carbon deposits are present. We confirmed this by Raman spectroscopy analysis [40].
3.1.2. Crystalline Properties
The X-ray diffraction pattern of the CAT.1 catalyst (Figure 6 (a)) shows the intense and sharp peaks characteristic of crystalline cordierite [41], eleven diffraction peaks were found and observed at 10.35º, 18.36º, 19.11º, 21.63º, 26.38º, 28.37º, 29.58º, 33.75º, 38.45º, 43.12º and 54° with Miller (hkl) plans corresponding to: (100), (110), (002), (102), (112), (202), (211), (212), (310) and (312), respectively. The crystalline phase assigned was α-cordierite (JCPDS card no. 84–1222). In addition, there are two small peaks either in the CAT.1 catalyst and the cordierite (calcined at 1350°C) close to 37º and 39.7º which could be related to the corundum phase of ceramics.
The XRD for the powder catalysts (Figure 6(b) AW, Figure 6(c) 0.1PtAg/AW and Figure 6(d) 1PtAg/AW) showed three broad low intensity reflections with 2θ = 37°, 46° and 67° corresponding to the (311), (400) and (440) planes of Al2O3 in its cubic phase (JCPDS card no. 10-0425). The characteristic peaks indicate amorphous samples with low crystallinity. This agrees with what was reported by Aguado et al., [42] and Hernández-Terán et al., [43] for γ-Al2O3.
The characteristic reflections of Pt and Ag were not found in the CAT.1 diffraction pattern (Figure 6 (a)), due to high dispersion of Pt in the samples or, it could also be due to the limited resolution of the XRD, since the concentrations of 0.1wt%Pt and 2wt%Ag were below the detection limit of the equipment.
However, some authors such as Richter et al., [44] have observed the presence of Ag2O at 2θ= 38.7, 50.5 and 66.8, in a catalyst with 5wt%Ag/Al2O3, and although the peaks have a metastable structure, it can be said that Ag2O is present on the surface of their catalysts.
3.1.3. Scanning Electron Microscopy (SEM/EDX) Before Catalytic Evaluation
SEM images of the inner walls of the support and the catalysts supported on the surface of the cordierite monoliths are shown in Figure 7. SEM images of the cleaned cordierite monolith are shown in Figures 7(a), (b), and (c) at different magnifications (25X, 500X, and 20,000X, respectively). Figure 7(c) shows macropores on the cordierite surface, revealing scale-like structures that could harbor a certain amount of boehmite.
The secondary coating of the support (γ-Al2O3) obtained using the dip-coating method (Al2O3-WOx/Cordierite), Figure 7(d), (e), and (f), shows the coating within the monolith channels. In this coating, good surface homogeneity was observed (Figure 7(e)), reaching a thickness of approximately 50 µm. After coating the support, approximately 5% by weight of γ-Al2O3-WOx was obtained on the cordierite monolith, using the dip-coating method with a boehmite suspension. In all these figures, the porosity type was very different from the type observed in fresh cordierite.
The secondary support coating formed a root-shaped layer within the soil or, in this case, within the monolith’s channels, which helped improve the adhesion or interaction with the active layer (Ag and PtAg) compared to the interaction with the clean monolith.
Sandeeran Govender and Holger B. Friedrich [43,45] mention that suspension coating can be ideal for high weight percentage coatings and that the particle size of the coated alumina can be controlled. Suspension coating can offer fewer recoats and good alumina adhesion.
Using this technique on the CAT.1 (PtAg/Al2O3-WOx/Cordierite) catalyst, Figure 7(g) and (h) were very similar to the figures where only Al2O3-WOx was added (Figure 7(d) and 7(e)). In contrast, spherical particles, or groups of them, deformed between 150 nm and 350 nm, are already observed on the CAT.1 catalyst (Figure 7(i)).
In the case of Figure 7(j) and (k) of the CAT.5 catalyst (Ag/Al2O3-WOx/Cordierite), no significant differences are observed with the corresponding Al2O3-WOx/Cordierite samples (Figure 7(d) and (e)) and the CAT.1 sample (Figure 7(g) and (h)).
On the other side, at higher resolution, spherical particles with sizes between 250 nm and 310 nm were observed for the CAT.5 catalysts (Figure 7(l)). Similar particles in shape and texture are again observed but in the CAT.1 catalyst (Figure 7(i))
Two different zones of the clean cordierite were analyzed by energy dispersive spectroscopy (EDX). Figure 8(a) shows the results of the qualitative chemical analysis and the presence of the elements detected in these two areas. The presence of Au and Pd in the spectrum of the cordierite monolith (Figure 8(a)) was due to the coating that the sample received before characterization to make it conductive.
The presence of oxygen, silicon, aluminum and magnesium in a greater proportion was observed, this is indicating that cordierite is indeed found, since as mentioned by Bueno-López et al. [46], cordierite is a mineral belonging to the ternary system MgO, Al2O3 and SiO2, the most accepted global formula for this inorganic compound is 2MgO2 Al2O3.5SiO2 with a stoichiometric composition of 51.36% SiO2, 34.86% Al2O3 and 13.78% MgO.
Qualitative EDX analysis of the Al2O3-WOx/Cordierite support (Figure 8(b)) indicates the presence of cordierite. O, Si, Al, and Mg are present in major proportions, while Fe, Ti, and Ca are present in smaller proportions.
Figure 8(c) shows the spectrum of the CAT.5 catalyst (Ag/Al2O3-WOx/Cordierite); the elements that compose cordierite (O, Al, Si, Mg) are also present, as well as the active metal Ag. Figure 8(d) shows the spectrum of the CAT.1 catalyst (AgPt/Al2O3-WOx/Cordierite), which indicates the presence of cordierite, as well as the elements W, Pt, and Ag.
The elemental mapping of the CAT.1 catalyst (PtAg/Al2O3-WOx/Cordierite) coated on the monolith is shown in Figure 9(a-f) by EDX. The Al2O3-WOx layer with a thickness of about 50 μm grew uniformly on the channel walls of the cordierite monolith.
The Figure 9(a) shows the image of the analyzed section of the catalyst. The Figure 9(b) and 9(c) show the densest atomic distributions of O2 and Al, while the Figure 9(d) shows a fairly good density of Ag. Next, we have that in Figure 9(e) for Pt the lowest density was observed. Finally, Figure 9(f) shows the distribution of W, also in a small amount. These densities of Pt atoms compared to those of W correspond approximately to the amounts of 0.1wt%Pt and 0.5wt%W.
3.1.4. Scanning Transmission Electron Microscopy (HAADF-STEM)
For the powder-calcined catalyst (0.1PtAg/AW), bright Ag nanoparticles were found in Figure 10(a). These metal particles with high density contrasted with the Al2O3 support, having round shapes without being perfect spherical.
Figure 10(b) shows the particle diameter histogram, obtaining an average particle size of 35.3 nm in monomodal form with sizes ranging from 20 to 140 nm. The shape of these particles was similar (shape and intensity) to those obtained by Kondratenko, et al. [47], Hernández y Fuentes [43] and Gauthard et al. [48].
Kondratenko, et al. [47] have mentioned that they correspond to polycrystalline silver oxide (Ag2O). While in the case of Gauthard et al. [48] in PtAg/Al2O3 bimetallic catalysts by TEM found a monomodal distribution of particle sizes that varied from 10 to 200 nm and with a composition by EDX that varied from 20 to 80 at%Ag.
Hernández et al. [43], have also been found similar particles by HRTEM with a 2wt.%Ag/Al2O3 catalyst, having an average particle size of 11 nm. These authors identified AgO, Ag2O and Ag0.
In the case of the 1PtAg/AW catalyst, Figure 10(c) also show spherical particles with sizes similar to the sizes found in the previous sample. Figure 10(d) shows the particle size histogram of this catalyst where a monomodal distribution with an average size of 18.47 nm was found.
The particles analyzed for this catalyst showed concentrations of Pt and Ag evaluated by EDX that were correlated with the particle diameter observed in the analysis zone within a selected region of the STEM image
In the case of the calcined CAT.1 catalyst, Figure 10(e) are shown, where Ag nanoparticles (metal with high density) are observed that contrast with the Al2O3 support, having round shapes without being perfect spherical.
The STEM analysis of the CAT.1 catalyst is shown in Figure 10(e), where Ag (high-density metal) nanoparticles are observed that contrast with the Al2O3 support, presenting round shapes without being perfectly spherical. Figure 10(f) shows the particle size histogram, obtaining an average particle size of 24.04 nm in monomodal form with sizes ranging from 10 to 60 nm.
3.1.5. Temperature Programmed Reduction (H2-TPR)
Figure 11(a) shows the H2-TPR profile of the 1PtAg/AW catalyst in powder form. This TPR showed a small reduction peak near 78°C, which was attributed to the reduction of Ag2O to Ag [49].
In the case of the 1PtAg/AW catalyst, two main peaks were observed (Figure 11(a)). The first peak located 215°C was related to the reduction of the supported Pt oxide species, such as [Pt(OH)xCly]s [50]. The second peak was located at 353°C represents the reduction of PtOx surface particles, which is consistent with a previous report by Kim et al. [51].
A third peak was observed at 425°C (Figure 11(a)) which corresponded to the reduction of AgO and Ag2O clusters. This result has already been reported using a 2wt%Ag/Al2O3 catalyst by Bethke and Kung [8] and Hernández-Terán [52].
In the case of the TPR of the catalyst 0.1PtAg/AW (Figure 11(b)) three main peaks were observed at temperatures of 78°C, 130°C and 470°C. The peak at 78°C has appeared in the TPR of 2%Ag/Al2O3 catalysts [52] and has been attributed to the reduction of AgO clusters, while the peak at 130°C has been found using Ag2O pure [52]. The third peak at 420°C has been more difficult to identify because it could well be due to the reduction of Pt oxychlorocomplexes [Pt(OH)xCly] [50] or also to well-dispersed Ag2O clusters.
The Pt reduction peak of the [Pt(OH)xCly] type in this catalyst could not be clearly distinguished, probably due to the low metal content (0.1wt%Pt). Additionally, in these studies of reduction of Ag oxides, it is known that after calcination of the Ag/Al2O3 catalyst, there was a proportion of metallic silver Ag° that certainly does not appear during the reduction of these catalysts [44,53]. The reduction of WOx to low concentration (0.5wt%W) occurs at very high temperatures such as 950°C [53].
3.1.6. Pt Dispersion (H2-Chemisorption)
Table 2 shows the dispersions of the catalysts prepared with the cordierite monoliths. Higher Pt dispersions are observed in catalysts CAT.1 (76.8%) and CAT.2 (70.8%) with respect to catalysts CAT.3 (35.4%), CAT.4 (25.3%) and CAT.6 (7.07%). In all of them the Pt and Ag contents were the same (catalyst CAT.5 had no Pt).
(a) Pt dispersion of the catalyst reduced to 500°C for 3h, (b) Pt dispersion of the catalyst after reaction at 350°C for 4h, (c) High severity test ( gas mixture of 25 ppm SO2/Air at 750°C for 16 h).
When investigating the pretreatment of each catalyst, it is observed that the dynamic calcination conditions had a great effect on the Pt dispersion since catalysts CAT.1 and CAT.2 that were calcined in air flow (30 ml/min) showed dispersions of 76.8 and 70.8% respectively, while catalysts CAT.3, CAT.4 and CAT.6 showed lower dispersions when calcined in a muffle or static atmosphere.
A possible explanation could be that the flow calcination improves the mass transfer coefficients of O2 so that they can oxidize the Pt oxychlorocomplexes on Al2O3 towards the formation of PtO2 and PtOxCly (Pt oxychlorides), thereby achieving a better reduction to metallic Pt than when these Pt complexes containing chlorine are not completely oxidized [50,55].
For Pt/Al2O3 catalysts, without Ag, some authors such as Lietz and Lieske [50,55] found that if the calcination temperature in air is 500 or 600°C, a peak is obtained by TPR at 290°C due to the reduction of PtClxOy (Pt4+ to Pt°) whereby the reduction at 500°C allows to obtain good Pt dispersions, as has been demonstrated in the literature even in the presence of WOx with alumina [26,27].
In the case of catalysts CAT.3 and CAT.4, they showed a low dispersion of Pt, probably due to a partial transformation towards Pt oxychlorocomplexes (PtOxCly) due to an insufficient supply of O2 during static calcination (in a muffle).
It is already known that chlorinated compounds in alumina of the type [PtCl6=/Al2O3] require higher temperatures to be reduced to Pt° than those (PtOxCly).
The CAT.6 catalyst showed the least dispersion, due to the high severity pretreatment (25 ppm SO2/Air at 750°C for 16 h). It is known that SO2 is a poison for Pt sites.
On the other hand, the determination of Ag dispersion and particle diameter in catalysts from 1.28 to 6wt% Ag in Al2O3 was carried out with O2 chemisorption at 170°C by Arve et al. [56].
The samples were reduced previously in H2 flow up to 250°C. The authors validated the stoichiometry of O2 chemisorption (O2/Ag=2) by comparing the average particle size using O2 chemisorption techniques, bright field TEM, high angle annular dark field (HAADF) and the values of active Ag dispersion that they found were: 57.6% (for 1.28wt% Ag); 51% (for 1.91wt% Ag); 44.8% (for 2.88wt% Ag) and 51.2% (for 6wt% Ag). The particle sizes were: 2.63 nm, 2.62 nm, 3 nm and 2.63 nm, respectively, in the percentages of Ag mentioned above.
Besides, Hu, et al. [57], studied the effect of the type of Pt precursor, the heating rate during calcination, the way of calcining in a static air atmosphere in a muffle and dynamically with an air flow. Their investigations demonstrated that calcination in air flow and slow heating rates (2°C/min) improved the Pt dispersion.
3.1.7. Ex-situ UV-vis Spectra of the Pt-Ag/Al2O3-WOx/Cordierite Catalysts
The Figure 12(a) shows the spectrum of the Pt-Ag/Al2O3-WOx/Cordierite catalyst. The bands between 220 and 230 nm, corresponding to the electronic transition of Ag+ ions. In this same sample, a shoulder was observed around 240 and 270 nm, assignable to oxidized silver clusters (Agn+) [58,59], however, studies carried out by Contreras et al., [60] this band could also be a ligand-metal charge transfer band of the single W-O ligand, because this same band was also observed for the Al2O3-WOx support deposited in cordierite.
The UV–vis spectra the Pt-Ag/Al2O3-WOx/Cordierite catalysts after reaction at 350°C in the SCR reaction of NO with C3H8 shown in Figure 12(b). A band at 220 nm, was observed again due to ionic Ag (Ag+). For its part, the band between 250 to 300 nm, were related to the reduction of Pt4+ to Pt0, as shown in Figure 12(b) [27,61].
In the case of CAT.1, CAT. 2, and CAT.3 catalysts the presence of Ag+ is observed, and also the bands above 390 nm (or 400 nm) were due to the formation of metallic silver Ag0 [24], and a plasmon was observed, and it was almost imperceptible in the CAT.4 catalyst.
This Ag plasmon did not appear in the CAT.5 and CAT.6 catalysts. As can be seen, the F(R) signal decreases in the following order-: CAT.1 > CAT.2 > CAT.3 > CAT.4, which seems to be related to the NO conversion (see Figure 14a).
3.1.8. Raman Spectra the Pt-Ag/Al2O3-WOx/Cordierite (CAT.1) Catalyst Evaluated
The Raman spectra of the CAT.1 catalyst evaluated in the reduction of NO with C3H8 (C3H8-SCR) at different space velocity (GHSV), are shown in Figure 13.
A band at 1560 cm−1 was observed for the CAT.1 catalyst tested at three space velocities (30,000, 70,000, and 100,000 h−1), which was much more pronounced for the catalyst tested at 100,000 h−1. The band width is characteristic of a graphitic carbon [40,41,42]. All three catalysts tested exhibited consistent carbon deposits. These particles may arise from the catalytic decomposition of C3H8.
3.2. Catalytic Tests
3.2.1. NO Conversion in the SCR with C3H8 Without H2
The NO conversion profiles of the catalysts CAT.1 to CAT.6 were obtained in a period of time of 4 h at 350°C as shown in Figure 14(a) with a GHSV de 12000 h-1. The most significant conversions occurred in the CAT.1 and CAT.2 catalysts, which showed the highest Pt dispersions (see Table 2). Thus, CAT.1 showed 76.8% Pt dispersion and CAT.2 showed 70.8% Pt dispersion.
In the case of the CAT.3 (Figure 14(a)) catalyst, a greater NO conversion was observed as a function of time (Figure 14(a)) compared to the CAT.4 catalyst. This difference could be due to the fact that in the CAT.3 a deposit of 5.14wt.% of the Al2O3-WOx coating was obtained on the monolith (Table 2), while in the CAT.4 catalyst only 2.36wt.% of the Al2O3-WOx coating was deposited. In addition, the Pt dispersion of the CAT.3 catalyst was 35.4%, while for CAT.4 it was 24.3% (Table 2).
The CAT.5 (Figure 14(a)) catalyst did not show greater activity than the other catalysts. Ag/Al2O3 catalysts are among the most active and selective for the catalytic reduction of NO to N2; however, one of the problems they present is their low activity at temperatures below 350°C [41]. However, when Pt and Ag are on the same Al2O3-WOx support, the different reaction steps described above occur sequentially in each metal, with Pt being the most active catalyst to convert C3H8 at low temperatures, as has already been demonstrated in powder evaluations and in the literature [60,61].
The CAT.6 (Figure 14(a)) catalyst showed the lowest NO reduction, since it was subjected to the high severity test (25 ppm SO2/Air at 750°C for 16 h) and was strongly inhibited by the presence of SO2, which produced deactivation effects due to poisoning of the Pt nanoparticles (lower Pt dispersion) in most catalytic reactions [56]. Furthermore, the CAT.6 catalyst, showed a Pt dispersion of 7%, being the lowest (Table 2) and also showed a lower amount of deposit of the Al2O3-WOx layer (Figure 2) on the cordierite monolith.
Now, in the case of NO2 as a reaction product, Figure 14(b) shows its behavior at the reactor outlet as a function of reaction time. A decrease in NO2 concentration (up to 84.6%) was observed as a function of time at 350 °C for 4 h for catalysts CAT.1, CAT.2, CAT.3, and CAT.5; however, this decrease was 73% for CAT.6, likely due to SO2 contamination. Finally, a 47% decrease was observed for catalyst CAT.4, which was due to the presence of a lower amount of catalyst (2.36% by weight of Al2O3-WOx) and also to a low Pt dispersion (24.3%).
According to the work of Shimitzu et al. [64] In a study of SCR-NOx with n-hexane on 2% Ag/Al2O3 catalysts in the absence of H2, it was shown that NO in the presence of O2 readily forms NO2, and this forms NO3ˉ adsorbed on the catalyst, which reacts with the surface acetate species formed on the catalyst due to the presence of hexane (or propane) and in the presence of O2. The simultaneous participation of both metals (Pt and Ag) in the NO reduction mechanism explains the synergistic effect observed in bimetallic catalysts, but not in monometallic Ag catalysts (CAT.5). Golcalves and Figueirido [65] reported that, in the presence of a transition metal, the Pt-NO bond was weakened, facilitating the dissociation of NO by a charge transfer from the transition metal to the noble metal, thus modifying the catalyst properties. On the other hand, the Pt catalyst is capable of chemisorbing more C3H8 species on the surface due to its greater adhesion probability, thus increasing the reduction of NOx at low temperatures.
3.2.2. NO Conversion the CAT.1 Catalyst in the SCR with C3H8 Assisted by H2
The conversion of NO, C3H8, and CO of the CAT.1 catalyst was evaluated in the presence of 1 vol.% H2. In the case where a GHSV of 30,000 h-1 was used in Figure 15(a)), a conversion profile similar to that of the evaluated powder catalyst was observed. Two NO conversion maxima were observed: one at 150 °C with 93% and the other between 280°C and 320 °C with a conversion of 95%. The two low GHSVs (30,000 and 70,000 h-1) at low temperature (100°C) showed a greater conversion difference (15%) compared to the GHSV of 100,000 h-1. In the case of high temperatures (350 °C), this difference is smaller (7%).
In the case of C3H8 conversion, initial values are obtained at 200°C and culminate at 450°C with 100% (Figure 15(b)). It was observed that at 250°C, the conversions for the GHSV of 30,000 h-1 are almost equal to those for the GHSV of 70,000 h-1, while with the GHSV of 100,000 h-1, temperatures of up to 350°C are required to reach 70% conversion.
In the case of CO conversion, a rapid increase in conversion was observed starting at 150°C (Figure 15(c)), reaching 100% conversion at 200°C. Unlike C3H8, with CO, high conversions (70-85%) are achieved at low temperatures around 150°C. At a GHSV of 100,000 h−1, the two previously reported NO conversion maxima were observed (Figure 15(a)). The first was recorded at 105 °C with 86% and the second at 400 °C with 95%. Slow propane conversion was also observed from 200 °C to 450 °C, with a maximum conversion of 94% (Figure 15(b)). At this GHSV of 100,000 h-1, a pronounced increase in CO conversion was observed from 50 °C to 200 °C (Figure 15(c)). From the previous exploratory experiments, only the CAT.1 catalyst was studied to show the best performance in NO conversion.
In the case of NO conversion, two temperatures were found where conversion is maximum; at the first temperature (150 °C) a maximum of 94% was found, while between 300 and 400 °C there is an interval where the conversion remains at 98%. In this temperature range, the reducing agent is mainly the hydrocarbon (C3H8), even in Ag/Al2O3 catalysts, where the main product is N2 [21].
For these reactions, in the presence of small amounts of H2, it is suggested that this reducer plays two roles. First, H2 could remove adsorbed nitrates with the simultaneous formation of more Ag sites, and second, the rate of the reduction reaction at Ag sites was faster, due to a lower activation energy than the activation energy in the absence of H2 [66]. On the other hand, these same authors reported that, when evaluating the wash-coat mass transfer resistance (Al2O3-WOx deposition), an average resistance to external NO mass transfer was found around 250 °C. As can be seen, the best conditions for NO reduction in the presence of H2 appear to be in the first temperature range (100 to 200 °C) and, in the absence of H2, between 300 and 400 °C.
It was observed that at 450 °C, C3H3 was completely consumed in the 30,000, 70,000, and 100,000 h−1 evaluations (Figure 15(b)). On the other hand, CO was consumed at 250 °C in all tests (Figure 15(c)). Studies conducted by M. Richter et al. [44] show that SCR of NOx with C3H4 in the presence of H2 with Ag/Al2O3 catalysts (0.5 wt% Ag and 5 wt% Ag), the results confirm that SCR of NOx with C3H4 is notably improved when H2 is co-fed into a lean exhaust gas mixture, achieving high NO conversion over a wide operating temperature range (190-550 °C).
4. Conclusions
The effect of GHSV on the conversion of NO, C3H8, and CO was studied as a function of reaction temperature in the presence of H2 (1% vol.) added to the feed gases at three GHSV: 30,000, 70,000, and 100,000 h-1 on a CAT.1. In the case of NO conversion, two temperatures were found where conversion is maximum; at the first temperature (150 °C), a maximum of 94% was found, while between 300 and 400 °C, there is an interval where the conversion remains at 98%. In the case of C3H8 conversion, initial values are obtained at 200°C and culminate at 450°C with 100%. In the case of CO conversion, a rapid increase in conversion was observed starting at 150°C, reaching 100% conversion at 200°C. Unlike C3H8, with CO, high conversions (70–85%) are achieved at low temperatures (around 150°C).
This CAT.1 catalyst was active in both NO reduction, and the combustion of CO and C3H3. The highest NO conversions in catalysts on monoliths corresponded to catalysts with high Pt dispersions (CAT.1 and CAT.2) and with a 5.95% by weight content of γ-Al2O3-WOx deposited on the monoliths. The dip-coating process with AlO(OH) layers showed an increase in the weight of AlO(OH) in the cordierite monoliths after two to four impregnations were performed to saturate the internal surface of the monolith and achieve an Al2O3-WO3 coating thickness of 50 μm. The optimal preparation conditions were up to four successive impregnations with AlO(OH), followed by calcination in air flow at 500 °C to obtain ϒ-Al2O3. Finally, successive impregnations were performed with H2PtCl3 and Ag(NO3). TEM showed that as the particle diameter decreased to 20 nm, the Pt concentration increased to 58.6 atom %, while as the diameter increased to 30 nm, the Pt concentration decreased to 11atom %. Surface mapping using SEM-EDX showed a uniform distribution of Pt, Ag, and W on γ-Al2O3. Carbon was analyzed on the catalysts tested at 350°C. A one-dimensional model of NO conversion was proposed as a function of reactor length, where external mass transfer was important.
Supplementary Materials
The following supporting information can be downloaded at the website of this paper posted on Preprints.org, Figure S1: Thickness of the catalyst washcoat on the cordierite monolith (the division scale is to 25 µm); Figure S2: Differential mass balance of reactant A. (a) Monolith length, L and b value. (b) Differential section of the monolith, for mass balance; Figure S3: Conversion of NO against the length of the monolith at four volumetric flows in (cm3/s); Table S1: Values of experimental and calculated properties of the NO reaction in the monolith reactor.
Author Contributions
Conceptualization, Naomi N. Hernández and José Contreras Larios; and Gustavo A. Fuentes; Formal analysis, José Contreras Larios, Naomi N. González ,Deyanira Beltrán; María Eugenia Hernández Terán, Israel Pala-Rosas; Funding acquisition, José Contreras Larios and Leticia Licona ; Investigation, Naomi N. Hernández , José Contreras Larios, Beatriz Zeifert, Gustavo A. Fuentes, María Eugenia Hernández Terán, Ricardo Medina, José Salmones, Deyanira Beltrán, Leticia Licona and Israel Rosas ;Methodology, Naomi N. Hernández and José Contreras Larios; Resources, José Contreras Larios, Beatriz Zeifert, Gustavo A. Fuentes, Ricardo Medina, José Salmones ,Deyanira Beltrán and Leticia Licona ;Supervision, José Contreras Larios; Writing – original draft, Naomi N. Hernández , José Contreras Larios, Ricardo Medina, Deyanira Beltrán and Israel Rosas ; Writing – review & editing, José Contreras Larios. Naomi N. González, Gustavo A. Fuentes, María Eugenia Hernández Terán, José Salmones; Software. Maria Eugenia Hernández Terán.
Funding
“This research received no external funding”.
Acknowledgments
Naomi N. González Hernández thanks CONACHYT for the postgraduate scholarship awarded through program 001379. We thank the Chemical Industry Process Laboratory, UAM-A and the company Sintesis y Aplicaciones Industriales, S.A. for its support.
Conflicts of Interest
“The authors declare they have no conflicts of interest”.
Abbreviations
The following abbreviations are used in this manuscript:
| HC-SCR | Selective Catalytic seduction with Hydrocarbons |
| H2-HC-SCR | Selective Catalytic Reduction with Hydrocarbons and Hydrogen |
| GHSV | Gas Hourly Space Velocity |
| SEM/EDX | Scanning Electron Microscopy |
| STEM/HAADF | Transmission Electron Microscopy |
| XRD | X-ray diffraction |
| TPR-H2 | temperature programmed reduction |
| CRTA | Cordierite |
| SBET | BET area |
| Vp | Pore Volume |
| Dp | Pore Diameter |
References
- Bueno-López, A.; Illán-Gómez, M.; de Lecea, C.S.-M. Effect of NOx and C3H6 partial pressures on the activity of Pt-beta-coated cordierite monoliths for deNOx C3H6-SCR. Appl. Catal. A: Gen. 2006, 302, 244–249. [Google Scholar] [CrossRef]
- Kannisto, H.; Ingelsten, H.H.; Skoglundh, M. Ag–Al2O3 catalysts for lean NOx reduction—Influence of preparation method and reductant. J. Mol. Catal. A: Chem. 2009, 302, 86–96. [Google Scholar] [CrossRef]
- Satokawa, S.; Yamaseki, K.-I.; Uchida, H. Influence of low concentration of SO2 for selective reduction of NO by C3H8 in lean-exhaust conditions on the activity of Ag/Al2O3 catalyst. Appl. Catal. B: Environ. 2001, 34, 299–306. [Google Scholar] [CrossRef]
- Lionta, G.D.; Christoforou, S.C.; Efthimiadis, E.A.; Vasalos, I.A. Selective Catalytic Reduction of NO with Hydrocarbons: Experimental and Simulation Results. Ind. Eng. Chem. Res. 1996, 35, 2508–2515. [Google Scholar] [CrossRef]
- He, C. , Paulus M. , Chu W., Find J., Nickl A. J., Kohler K. Selective Catalytic reduction of NO by C3H8 over CoOx/Al2O3: An investigation of structure-activity relationships. Catalysis Today, 2008, 131, 305–313. [Google Scholar]
- Popovych, N.O.; Soloviev, S.O.; Orlyk, S.M. Selective Reduction of Nitrogen Oxides (NOx) with Oxygenates and Hydrocarbons over Bifunctional Silver–Alumina Catalysts: a Review. Theor. Exp. Chem. 2016, 52, 3. [Google Scholar] [CrossRef]
- Kyriienko, P.; Popovych, N.; Soloviev, S.; Orlyk, S.; Dzwigaj, S. Remarkable activity of Ag/Al2O3/cordierite catalysts in SCR of NO with ethanol and butanol. Appl. Catal. B: Environ. 2013, 140-141, 691–699. [Google Scholar] [CrossRef]
- Bethke, K.A.; Kung H., H. Supported Ag catalysts for the lean reduction of NO with C3H6. J. Catal. 1997, 172, 93–102. [Google Scholar] [CrossRef]
- M. C.; Kung, H.H. Kung. Lean NOx catalysis over alumina-supported catalysts. Top. Catal. 2000, 10, 21–26.
- Meunier F., C.; Breen J., P.; Zuzaniuk, V.; Olsson, M.; Ross J. R., H. Mechanistic aspects of the selective reduction of NO by propene over alumina and silver-alumina catalysts. J. Catal. 1999, 187, 493–505. [Google Scholar] [CrossRef]
- Martínez-Arias, A.; Fernández-García, M.; Iglesias-Juez, A.; Anderson, J.A.; Conesa, J.C.; Soria, J. Study of the lean NOx reduction with C3H6 in the presence of water over silver/alumina catalysts prepared from inverse microemulsions. Appl. Catal. B Environ. 2000, 28, 29–41. [Google Scholar] [CrossRef]
- Hernández-Carucci J., R. , Kurman a. , Karhu H., Arve K., Eranen k., Warna j., Salmi T., Murzin D. Yu. Kinetics of the biofuels-assisted SCR of NOx over Ag/Alumina-coated microchannels. Chemical Engineering Journal 2009, 154, 34–44. [Google Scholar]
- Held, W. , Koning, A. Paper Ser. No. 90 0496, 1990. [Google Scholar]
- Iwamoto, M. , Yahiro H. , Shundo S., Yu-u Y., Mizuno N. Appl. Catal. 1991, 69, L15. [Google Scholar]
- Eränen, K.; Klingstedt, F.; Arve, K.; Lindfors, L.-E.; Murzin, D.Y. On the mechanism of the selective catalytic reduction of NO with higher hydrocarbons over a silver/alumina catalyst. J. Catal. 2004, 227, 328–343. [Google Scholar] [CrossRef]
- Männikkö, M.; Wang, X.; Skoglundh, M.; Härelind, H. Characterization of the active species in the silver/alumina system for lean NO reduction with methanol. Catal. Today 2016, 267, 76–81. [Google Scholar] [CrossRef]
- Deng, H.; Yu, Y.; He, H. Adsorption states of typical intermediates on Ag/Al2O3 catalyst employed in the selective catalytic reduction of NOx by ethanol. Chinese Journal of Catalysis 2015, 36, 1312–1320. [Google Scholar] [CrossRef]
- Hoost T., E.; Kudla R., J.; Collins K., M.; Chattha M., S. Characterization of Ag/γ-Al2O3 catalysts and their lean-NOx properties. Appl. Catal. B Environ. 1997, 13, 59–67. [Google Scholar] [CrossRef]
- Chaieb, T.; Delannoy, L.; Costentin, G.; Louis, C.; Casale, S.; Chantry, R.L.; Li, Z.; Thomas, C. Insights into the influence of the Ag loading on Al2O3 in the H2-assisted C3H6-SCR of NO. Appl. Catal. B: Environ. 2014, 156-157, 192–201. [Google Scholar] [CrossRef]
- Hernández-Terán, M.E.; Fuentes, G.A. Enhancement by H2 of C3H8-SCR of NOx using Ag/γ-Al2O3. Fuel 2014, 138, 91–97. [Google Scholar] [CrossRef]
- Ström, L.; Carlsson, P.-A.; Skoglundh, M.; Härelind, H. Surface Species and Metal Oxidation State during H2-Assisted NH3-SCR of NOx over Alumina-Supported Silver and Indium. Catalysts 2018, 8, 38. [Google Scholar] [CrossRef]
- Xu, G.; Ma, J.; Wang, L.; Lv, Z.; Wang, S.; Yu, Y.; He, H. Mechanism of the H2 Effect on NH3-Selective Catalytic Reduction over Ag/Al2O3: Kinetic and Diffuse Reflectance Infrared Fourier Transform Spectroscopy Studies. ACS Catal. 2019, 9, 10489–10498. [Google Scholar] [CrossRef]
- Shang, Z.; Cao, J.; Wang, L.; Guo, Y.; Lu, G.; Guo, Y. The study of C 3 H 8 -SCR on Ag/Al 2 O 3 catalysts with the presence of CO. Catal. Today 2017, 281, 605–609. [Google Scholar] [CrossRef]
- Gunnarsson, F.; Kannisto, H.; Skoglundh, M.; Härelind, H. Improved low-temperature activity of silver–alumina for lean NOx reduction – Effects of Ag loading and low-level Pt doping. Appl. Catal. B Environ. 2014, 152–153, 218–225. [Google Scholar] [CrossRef]
- He, H.; Wang, J.; Feng, Q.; Yu, Y.; Yoshida, K. Novel Pd promoted Ag/Al2O3 catalyst for the selective reduction of NOx. Appl. Catal. B: Environ. 2003, 46, 365–370. [Google Scholar] [CrossRef]
- Schott, F.J.P.; Balle, P.; Adler, J.; Kureti, S. Reduction of NOx by H2 on Pt/WO3/ZrO2 catalysts in oxygen-rich exhaust. Appl. Catal. B Environ. 2009, 87, 18–29. [Google Scholar] [CrossRef]
- Contreras, J.L.; Fuentes, G.A.; García, L.A.; Salmones, J.; Zeifert, B. WOx effect on the catalytic properties of Pt particles on Al2O3. Journal of Alloy and Compounds 2009, 483, 450–452. [Google Scholar] [CrossRef]
- Contreras, J.L.; Fuentes, G.A.; Zeifert, B.; Salmones, J. Stabilization of supported platinum nanoparticles on γ-alumina catalysts by addition of tungsten. J. Alloy. Compd. 2009, 483, 371–373. [Google Scholar] [CrossRef]
- González Hernández, N.N.; Contreras, J.L.; Pinto, M.; Zeifert, B.; Flores Moreno, J.L.; Fuentes, G.A.; Hernández-Terán, M.E.; Vázquez, T.; Salmones, J.; Jurado, J.M. Improved NOx Reduction Using C3H8 and H2 with Ag/Al2O3 Catalysts Promoted with Pt and WOx. Catalysts 2020, 10, 1212. [Google Scholar] [CrossRef]
- Valentini, M.; Groppi, G.; Cristiani, C.; Levi, M.; Tronconi, E.; Forzatti, P. The deposition of γ-Al2O3 layers on ceramic and metallic supports for the preparation of structured catalysts. Catal. Today 2001, 69, 307–314. [Google Scholar] [CrossRef]
- Jürgen, L., K. , Dieter, L., H., Egbert, L., H., Thomas, K., K., Wilfred, M., O. y Rainer, D., A. Diesel Catalytic. Converter. Patent No. 5, 928, 981.
- Shelef, M.; Montreuil, C.N.; Jen, H.W. NO2 formation over Cu-ZSM-5 and the selective catalytic reduction of NO. Catal. Lett. 1994, 26, 277–284. [Google Scholar] [CrossRef]
- Neimark, A.V.; Sing, K. W.; Thommes, M. Handbook of Heterogeneous Catalysis, 2nd Ed., G. Ertl., H. Knozinger, F. Schuth, J. Weitkamp. Eds., VCH-Wiley, 2008, 4.
- Contreras, J. L.; Fuentes, G. A. Study of the Pt/Al2O3-WOx Catalyst in the conversion of Heptane. Spanish Academic Editorial Ed., 2013.
- Sing, K.S.W.; Everett D., H.; Haul R. A., W.; Moscou, L.; Pierotti R., A.; Rouquerol, J.; Siemieniewska, T. Reporting physisorption data for gas/solid systems with special reference to the determination of surface area and porosity. Pure Appl. Chem. 1985, 57, 603–619. [Google Scholar] [CrossRef]
- Ascaso, M. S. Catalysts free of noble metals for the simultaneous elimination of soot and NOx in Diesel engines. Doctoral Thesis, University of Zaragoza, Spain, 2015. http://hdl.handle.net/10261/118009.
- Rojas, H.; Borda, G.; Reyes, P.; Brijaldo, M.; Valencia, J. Liquid-phase hydrogenation of m-dinitrobenzene over platinum catalysts. J. Chil. Chem. Soc. 2011, 56, 793–798. [Google Scholar] [CrossRef]
- Satterfield, C.N. , Heterogeneous Catalysis in Practice. McGraw Hill Inc. 1980, p.114. ISBN:0070548757.
- Mather, R.; McEnaney, B.; Mays, T. J.; Rouquerol, J.; Rodríguez-Reinoso, F.; Sing, K. S. W.; Unger, K. K. Characterization of Porous Solids IV. Royal Society of Chemistry. 1997, 213, 314–318. [Google Scholar]
- Johnson, C.A.; Thomas, K. Applications of Raman microprobe spectroscopy to the characterization of carbon deposits on catalysts. Fuel 1984, 63, 1073–1080. [Google Scholar] [CrossRef]
- Xu, X.; Zhang, Y.; Wu, J.; Hu, C.; Tang, Z. Preparation and performance study of cordierite/mullite composite ceramics for solar thermal energy storage. Int. J. Appl. Ceram. Technol. 2017, 14, 162–172. [Google Scholar] [CrossRef]
- Aguado, J.; Escola, J.; Castro, M. Influence of the thermal treatment upon the textural properties of sol–gel mesoporous γ-alumina synthesized with cationic surfactants. Microporous Mesoporous Mater. 2010, 128, 48–55. [Google Scholar] [CrossRef]
- Hernández-Terán, M.E.; Fuentes, G.A. Enhancement by H2 of C3H8-SCR of NOx using Ag/γ-Al2O3. Fuel 2014, 138, 91–97. [Google Scholar] [CrossRef]
- Richter, M.; Bentrup, U.; Eckelt, R.; Schneider, M.; Fricke, R. The effect of hydrogen on the selective catalytic reduction of NO in excess oxygen over Ag/Al2O3. Appl. Catal. B: Environ. 2004, 51, 261–274. [Google Scholar] [CrossRef]
- Govender, S.; Friedrich, H.B. Monoliths: A Review of the Basics, Preparation Methods and Their Relevance to Oxidation. Catalysts 2017, 7, 62. [Google Scholar] [CrossRef]
- Bueno-López, A.; Lozano-Castelló, D.; Such-Basáñez, I.; García-Cortés, J.; Illán-Gómez, M.; de Lecea, C.S.-M. Preparation of beta-coated cordierite honeycomb monoliths by in situ synthesis. Appl. Catal. B: Environ. 2005, 58, 1–7. [Google Scholar] [CrossRef]
- Kondratenko, V.; Bentrup, U.; Richter, M.; Hansen, T.; Kondratenko, E. Mechanistic aspects of N2O and N2 formation in NO reduction by NH3 over Ag/Al2O3: The effect of O2 and H2. Appl. Catal. B: Environ. 2008, 84, 497–504. [Google Scholar] [CrossRef]
- Gauthard, F. Palladium and platinum-based catalysts in the catalytic reduction of nitrate in water: effect of copper, silver, or gold addition. J. Catal. 2003, 220, 182–191. [Google Scholar] [CrossRef]
- Qu, Z.; Huang, W.; Cheng, M.; Bao, X. Restructuring and Redispersion of Silver on SiO2 under Oxidizing/Reducing Atmospheres and Its Activity toward CO Oxidation. J. Phys. Chem. B 2005, 109, 15842–15848. [Google Scholar] [CrossRef]
- Lieske, H. Reactions of platinum in oxygen- and hydrogen-treated Pt/$gamma;-Al2O3 catalysts I. Temperature-programmed reduction, adsorption, and redispersion of platinum. J. Catal. 1983, 81, 8–16. [Google Scholar] [CrossRef]
- Kim, S.S.; Lee, H.H.; Hong, S.C. A study on the effect of support's reducibility on the reverse water-gas shift reaction over Pt catalysts. Appl. Catal. A: Gen. 2012, 423-424, 100–107. [Google Scholar] [CrossRef]
- Hernández-Terán, M.E. Development of Ag/γ-Al2O3 and Ag/α-Al2O3 Catalytic Systems for H2-Assisted NO C3H8-SCR under Oxidizing Operation for Emission Control Systems for Diesel Engines or Stationary Sources. Ph.D.; Thesis, Universidad Au-tónoma Metropolitana-Iztapalapa, Ciudad de México, Mexico, 2020.
- Kannisto, H.; Arve, K.; Pingel, T.; Hellman, A.; Härelind, H.; Eränen, K.; Olsson, E.; Skoglundh, M.; Murzin, D.Y. On the performance of Ag/Al2O3as a HC-SCR catalyst – influence of silver loading, morphology and nature of the reductant. Catal. Sci. Technol. 2013, 3, 644–653. [Google Scholar] [CrossRef]
- Pallares-García, A.; Contreras, J.L.; Pérez-Cabrera, J.; Zeifert, B.; Vázquez, T.; Salmones, J.; Gutiérrez-Limón, M.A. Stabilization of Pt in SiO2–Al2O3 Microspheres at High Mechanical Resistance, Promoted with W Oxides for the Combustion of CO. Catalysts 2021, 11, 1320. [Google Scholar] [CrossRef]
- Lietz, G. Reactions of platinum in oxygen- and hydrogen-treated Pt/$gamma;-Al2O3 catalysts II. Ultraviolet-visible studies, sintering of platinum, and soluble platinum. J. Catal. 1983, 81, 17–25. [Google Scholar] [CrossRef]
- Arve, K.; Čapek, L.; Klingstedt, F.; Eränen, K.; Lindfors, L.-E.; Murzin, D.Y.; Dědeček, J.; Sobalik, Z.; Wichterlová, B. Preparation and characterisation of Ag/alumina catalysts for the removal of NO x emissions under oxygen rich conditions. Top. Catal. 2004, 30-31, 91–95. [Google Scholar] [CrossRef]
- Linjie Hu, Kenneth, A. ; Boateng, Josephine, M.; Hill, Sol–gel synthesis of Pt/Al2O3 catalysts: Effect of Pt precursor, Journal of Molecular Catalysis A: Chemical. 2006, 259, 51–60.
- Wichterlová, B.; Sazama, P.; Breen, J.; Burch, R.; Hill, C.; Čapek, L.; Sobalík, Z. An in situ UV–vis and FTIR spectroscopy study of the effect of H2 and CO during the selective catalytic reduction of nitrogen oxides over a silver alumina catalyst. J. Catal. 2005, 235, 195–200. [Google Scholar] [CrossRef]
- Xu, G.; Ma, J.; He, G.; Yu, Y.; He, H. An alumina-supported silver catalyst with high water tolerance for H2 assisted C3H6-SCR of NOx. Appl. Catal. B: Environ. 2017, 207, 60–71. [Google Scholar] [CrossRef]
- Contreras, J.; Salmones, J.; Colín-Luna, J.; Nuño, L.; Quintana, B.; Córdova, I.; Zeifert, B.; Tapia, C.; Fuentes, G. Catalysts for H 2 production using the ethanol steam reforming (a review). Int. J. Hydrogen Energy 2014, 39, 18835–18853. [Google Scholar] [CrossRef]
- Iglesias-Juez, A.; Hungrı́a, A.; Martı́nez-Arias, A.; Fuerte, A.; Fernández-Garcı́a, M.; Anderson, J.; Conesa, J.; Soria, J. Nature and catalytic role of active silver species in the lean NOx reduction with C3H6 in the presence of water. J. Catal. 2003, 217, 310–323. [Google Scholar] [CrossRef]
- Tamm, S.; Andonova, S.; Olsson, L. The Effect of Hydrogen on the Storage of NOx Over Silver, Platinum and Barium Containing NSR Catalysts. Catal. Lett. 2014, 144, 1101–1112. [Google Scholar] [CrossRef]
- Bligaard, T.; Nørskov, J.; Dahl, S.; Matthiesen, J.; Christensen, C.; Sehested, J. The Brønsted–Evans–Polanyi relation and the volcano curve in heterogeneous catalysis. J. Catal. 2004, 224, 206–217. [Google Scholar] [CrossRef]
- Shimizu, K.-I.; Shibata, J.; Yoshida, H.; Satsuma, A.; Hattori, T. Silver-alumina catalysts for selective reduction of NO by higher hydrocarbons: structure of active sites and reaction mechanism. Appl. Catal. B: Environ. 2007, 30, 151–162. [Google Scholar] [CrossRef]
- Gonçalves, F.; Figueiredo, J.L. Synergistic effect between Pt and K in the catalytic reduction of NO and N2O. Appl. Catal. B: Environ. 2006, 62, 181–192. [Google Scholar] [CrossRef]
- Singh, P.; Yadav, D.; Thakur, P.; Pandey, J.; Prasad, R. Studies on H2-Assisted Liquefied Petroleum Gas Reduction of NO over Ag/Al2O3 Catalyst. Bull. Chem. React. Eng. Catal. 2018, 13, 227–235. [Google Scholar] [CrossRef]
- Hayes, R.; Kolaczkowski, S. Mass and heat transfer effects in catalytic monolith reactors. Chem. Eng. Sci. 1994, 49, 3587–3599. [Google Scholar] [CrossRef]
- Leung, D.; Hayes, R.E.; Kolaczkowski, S.T. Diffusion limitation effects in the washcoat of a catalytic monolith reactor. Can. J. Chem. Eng. 1996, 74, 94–103. [Google Scholar] [CrossRef]
- Tomašić, V.; Gomzi, Z. Experimental and theoretical study of NO decomposition in a catalytic monolith reactor. Chem. Eng. Process. - Process. Intensif. 2004, 43, 765–774. [Google Scholar] [CrossRef]
- Hayes, R.E.; Kolaczkowski, S.T.; Li, P.K.; Awdry, S. The palladium catalysed oxidation of methane: reaction kinetics and the effect of diffusion barriers. Chem. Eng. Sci. 2001, 56, 4815–4835. [Google Scholar] [CrossRef]
- Chen, J.; Yang, H.; Wang, N.; Ring, Z.; Dabros, T. Mathematical modeling of monolith catalysts and reactors for gas phase reactions. Appl. Catal. A: Gen. 2008, 345, 1–11. [Google Scholar] [CrossRef]
- Kolaczkowski, S.T. Modelling catalytic combustion in monolith reactors – challenges faced. Catal. Today 1999, 47, 209–218. [Google Scholar] [CrossRef]
- Bhattacharya, M.; Harold, M.P.; Balakotaiah, V. Mass-transfer coefficients in washcoated monoliths. AIChE J. 2004, 50, 2939–2955. [Google Scholar] [CrossRef]
- Bennett, C.J. , Kolaczkowski, S. t. and Thomas, W.J. Determination of heterogeneous reaction kinetics and reaction rates under mass transfer controlled conditions for a monolith reactor. Trans. Instn. Chem. Engr. 1991, 69, part B, 209–220. [Google Scholar]
- Hayes, R.; Kolaczkowski, S. Mass and heat transfer effects in catalytic monolith reactors. Chem. Eng. Sci. 1994, 49, 3587–3599. [Google Scholar] [CrossRef]
- Holmgren, A.; Andersson, B. Mass transfer in monolith catalysts–CO oxidation experiments and simulations. Chem. Eng. Sci. 1998, 53, 2285–2298. [Google Scholar] [CrossRef]
- Tomašić, V.; Gomzi, Z.; Zrnčević, S. Reaction and mass transfer effects in a catalytic monolith reactor. React. Kinet. Catal. Lett. 2002, 77, 245–253. [Google Scholar] [CrossRef]
- Groppi, G.; Belloli, A.; Tronconi, E.; Forzatti, P. A comparison of lumped and distributed models of monolith catalytic combustors. Chem. Eng. Sci. 1995, 50, 2705–2715. [Google Scholar] [CrossRef]
- Gupta, N.; Balakotaiah, V. Heat and mass transfer coefficients in catalytic monoliths. Chem. Eng. Sci. 2001, 56, 4771–4786. [Google Scholar] [CrossRef]
- Fogler, S. H. Elements of Chemical Reaction Engineering, 3rd. Ed.; Prentice Hall Inc. New Jersey, USA, 1999; pp.738-758.
Figure 1.
Impregnation of cordierite monoliths to obtain structured catalyst by Dip-coating method.
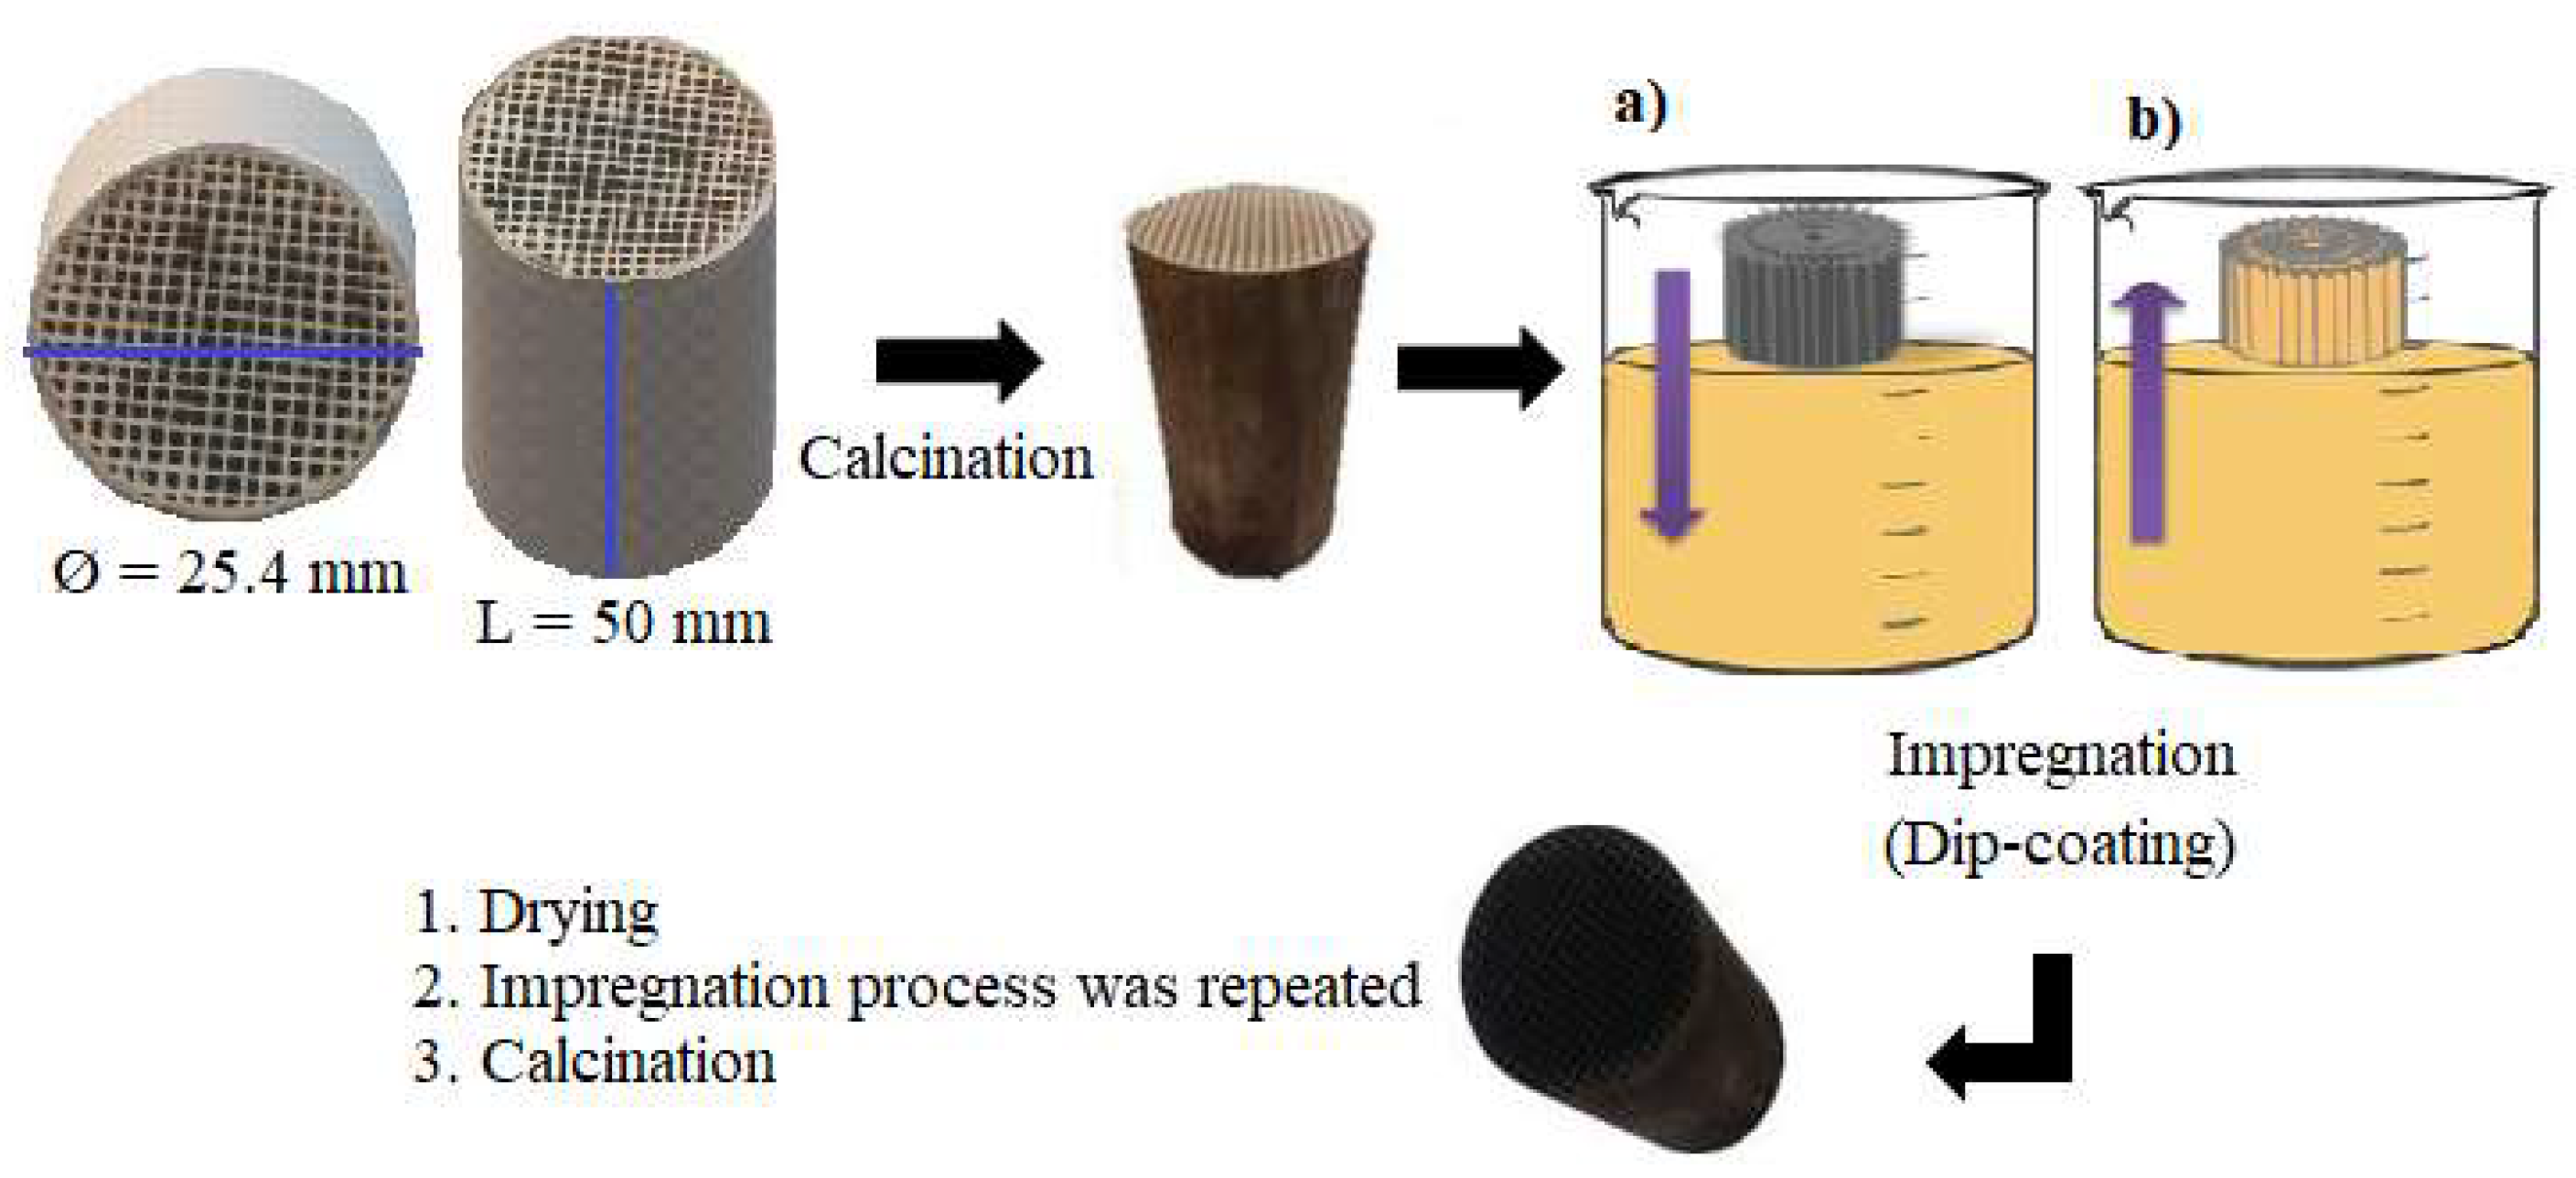
Figure 2.
Loading amount achieved from the various immersions as a function of the number of impregnations.
Figure 2.
Loading amount achieved from the various immersions as a function of the number of impregnations.
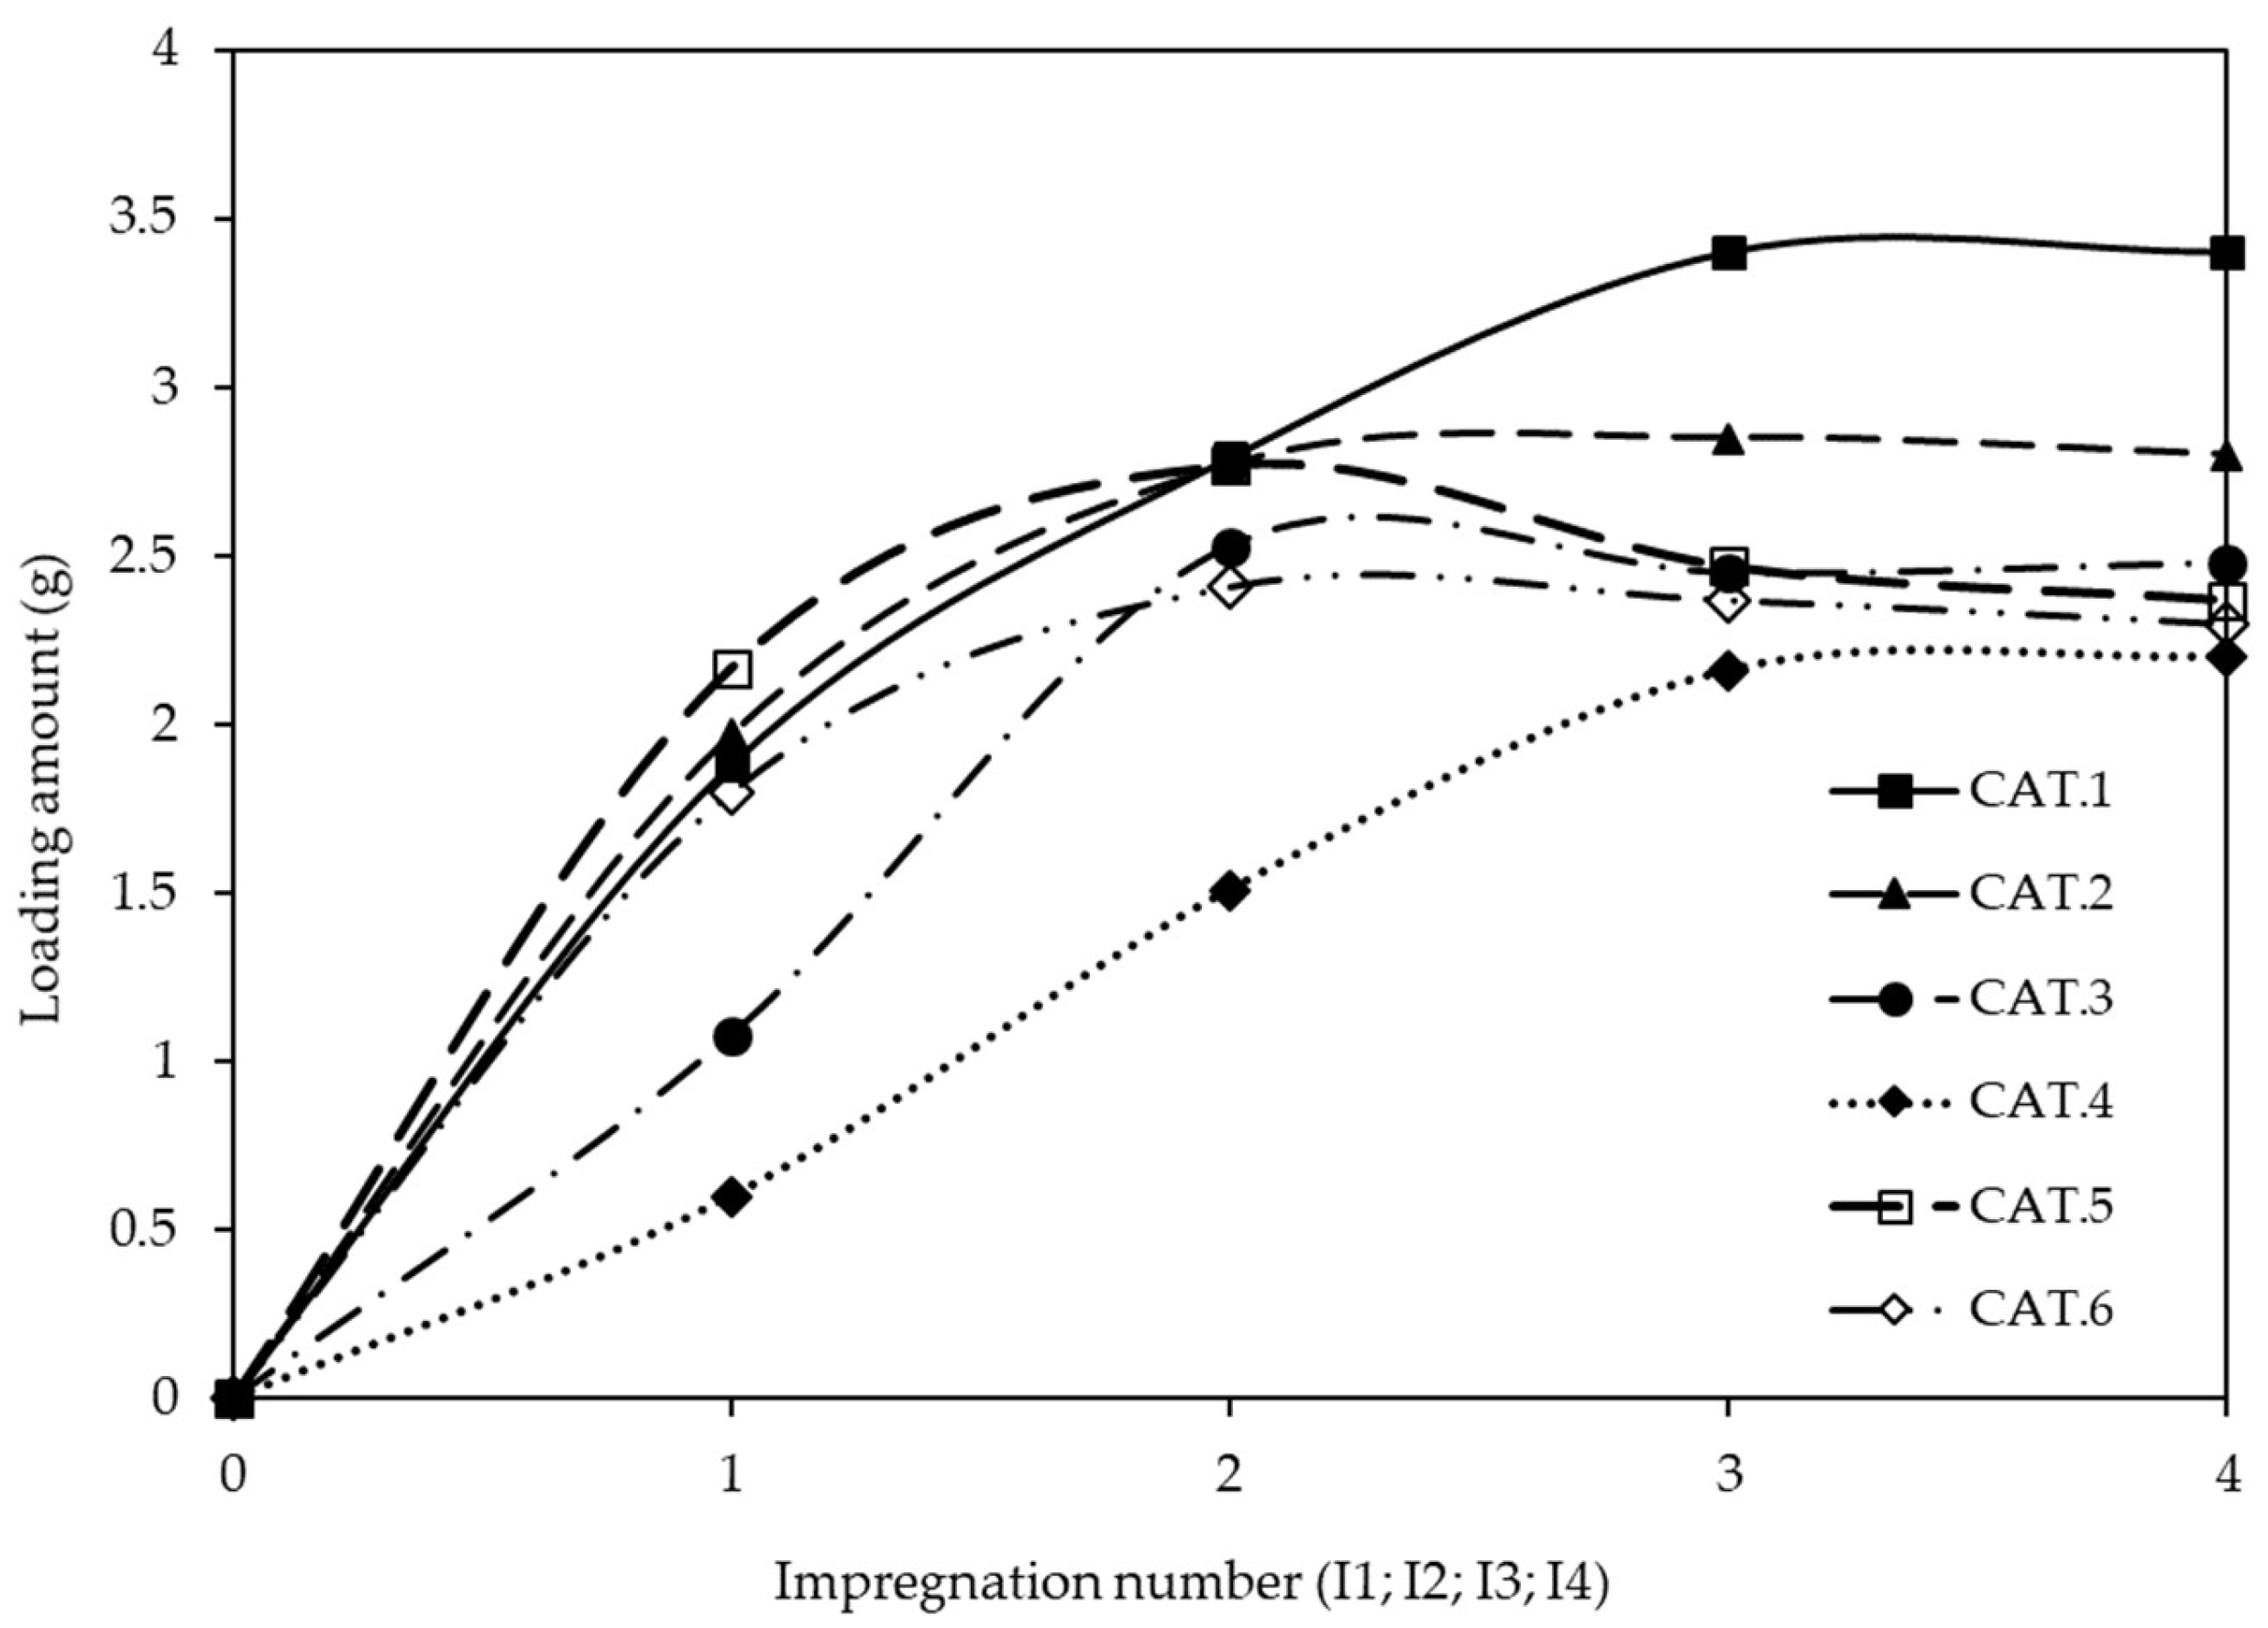
Figure 3.
Design of the stainless-steel cylindrical reactor containing the monolith and the position of the thermowells.
Figure 3.
Design of the stainless-steel cylindrical reactor containing the monolith and the position of the thermowells.
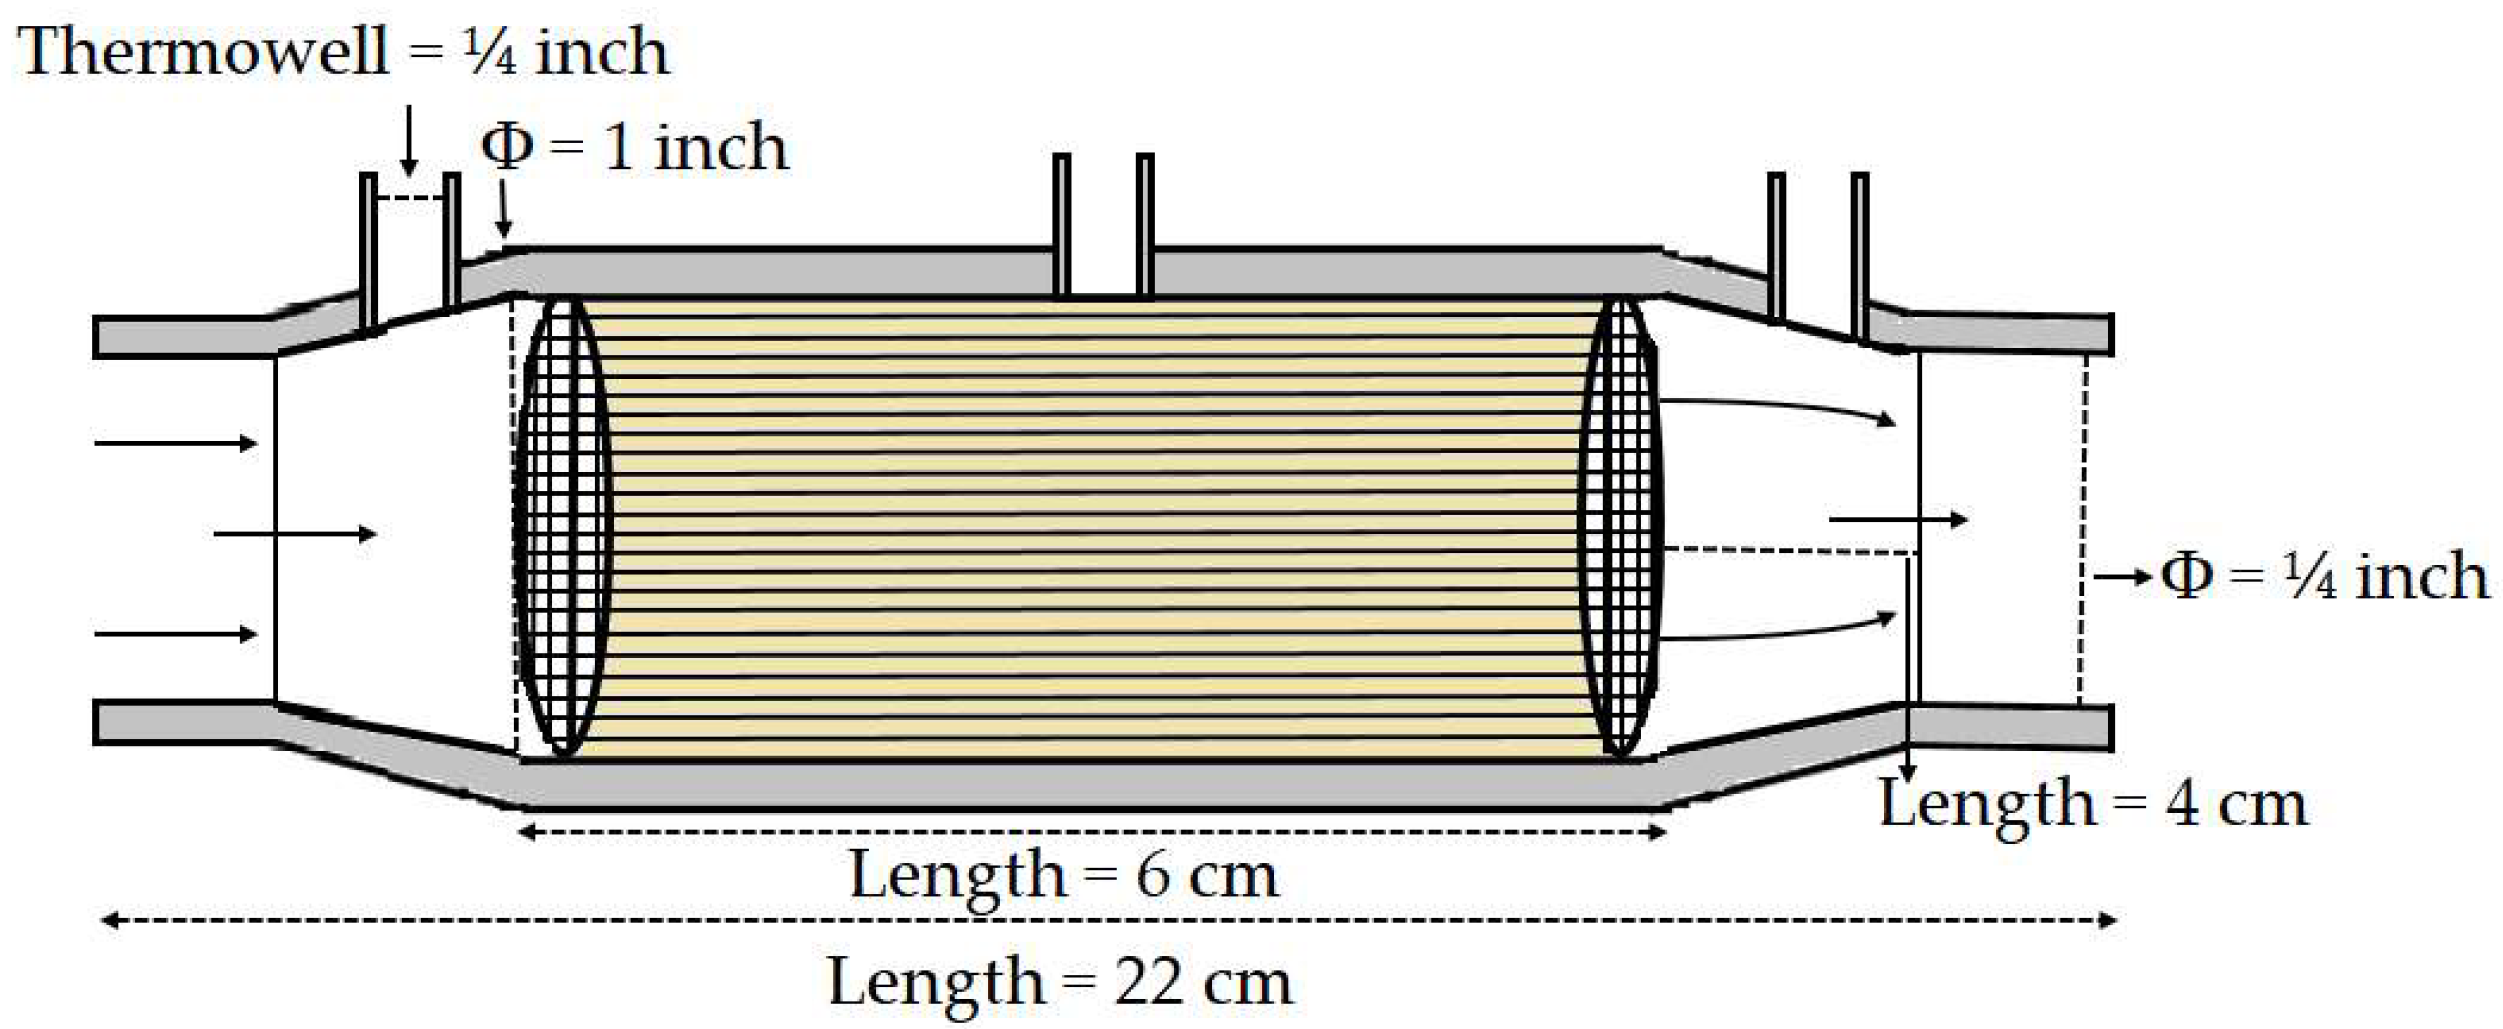
Figure 4.
Textural properties of the support (γ- Al2O3-WOx/Cordierite), CAT.1 and CAT.5 fresh catalysts calcined at 500°C. (a) N2 adsorption isotherms; (b) Pore size distribution.
Figure 4.
Textural properties of the support (γ- Al2O3-WOx/Cordierite), CAT.1 and CAT.5 fresh catalysts calcined at 500°C. (a) N2 adsorption isotherms; (b) Pore size distribution.
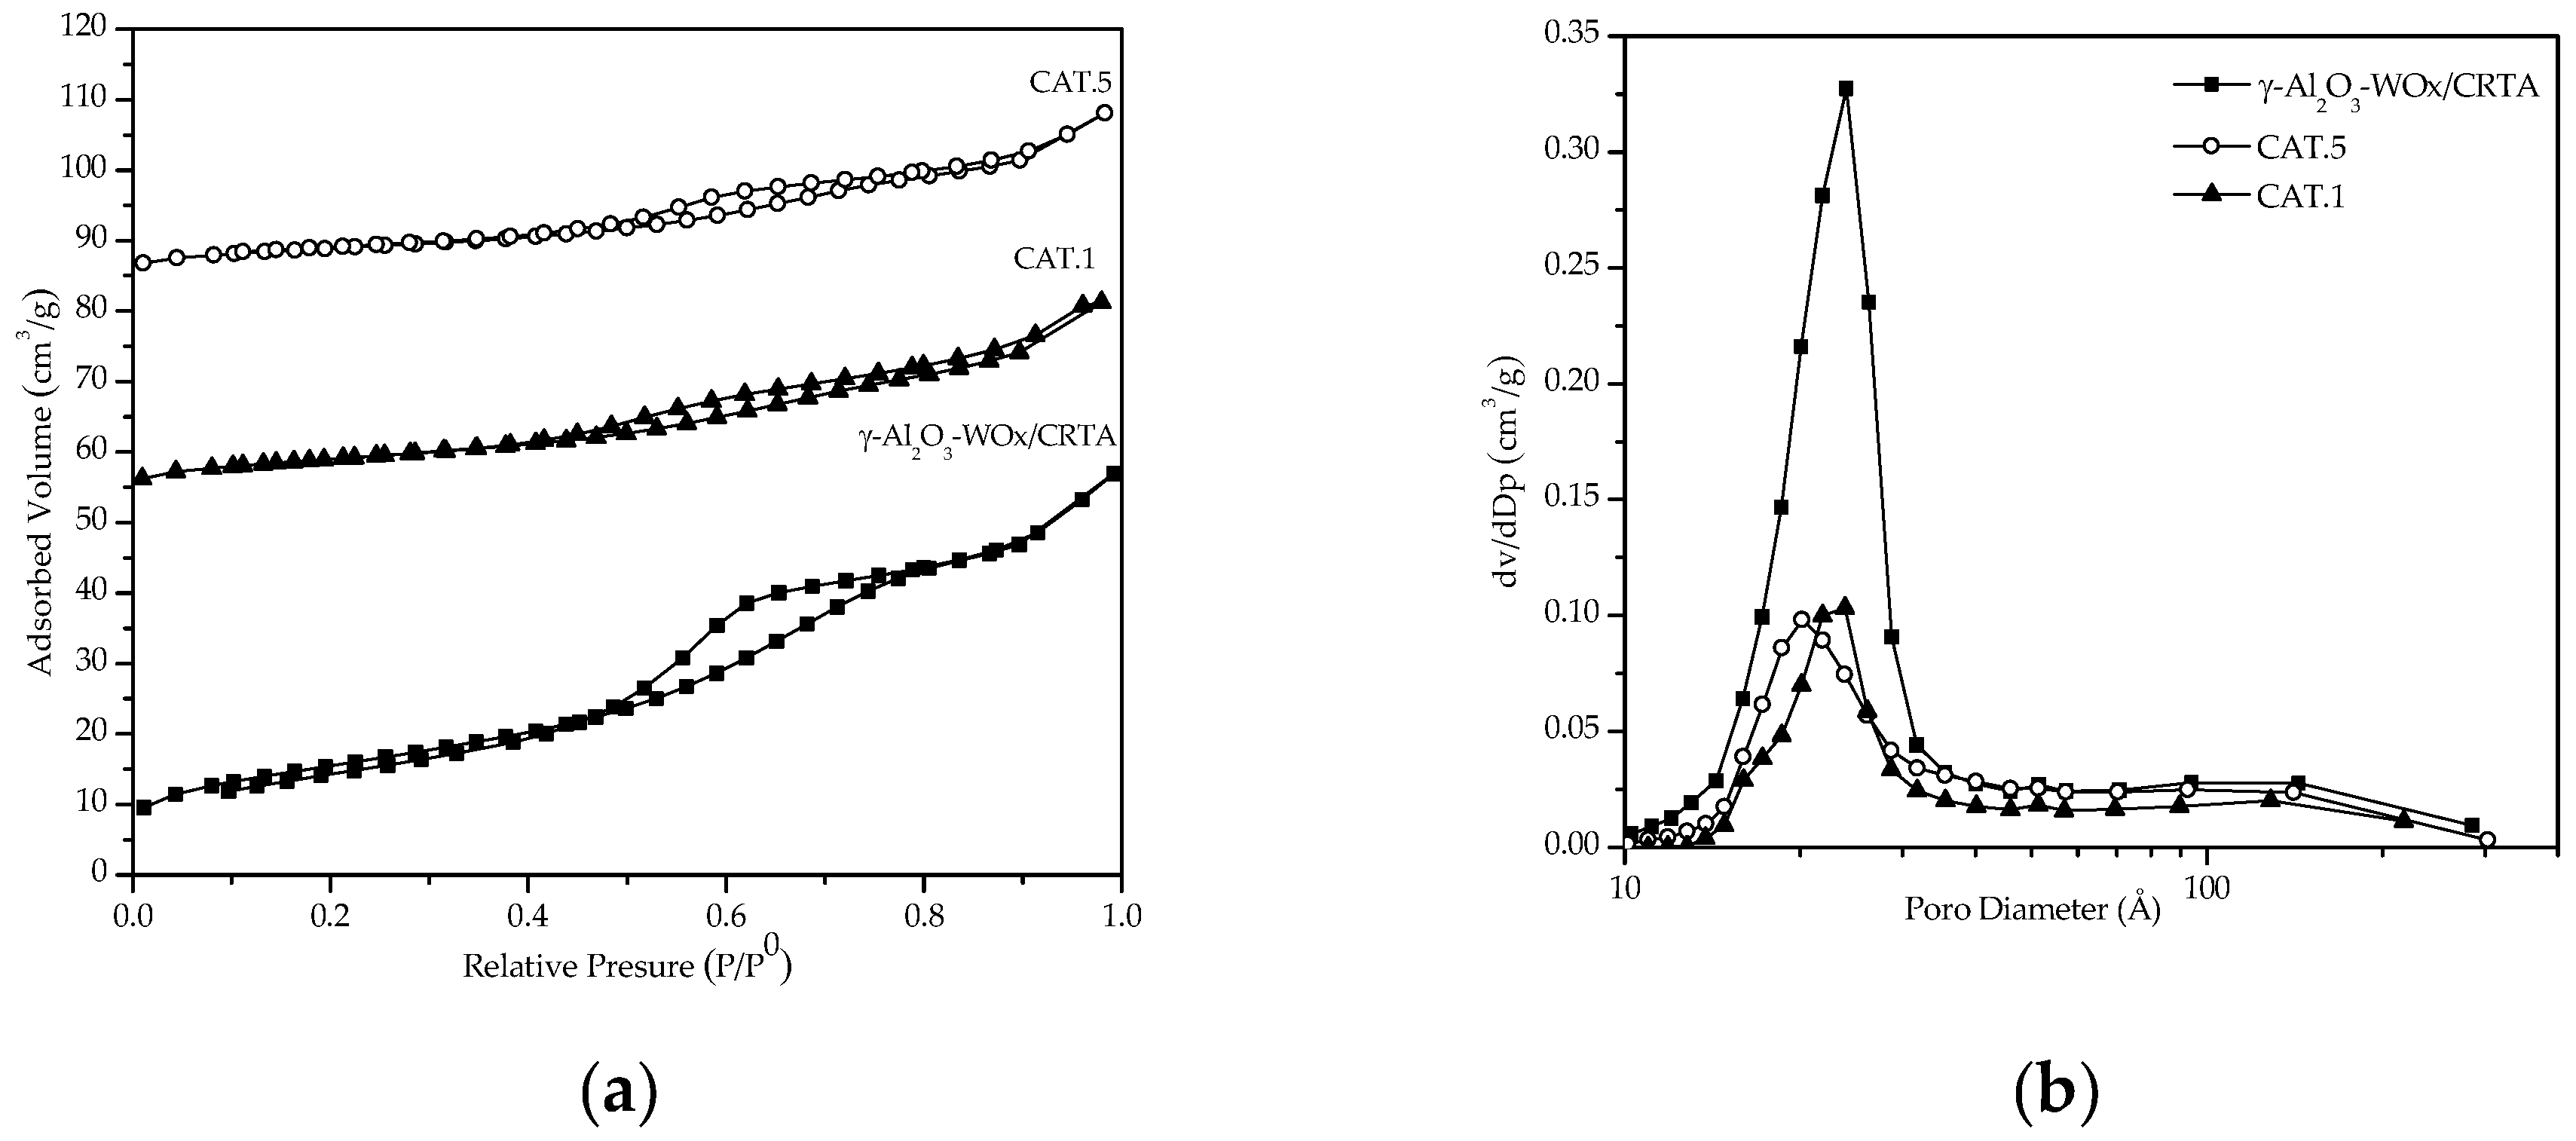
Figure 5.
Textural properties CAT.2, CAT.3, CAT.4 and CAT.6 catalysts after reaction at 350°C. (a) N2 adsorption isotherms; (b) Pore size distribution.
Figure 5.
Textural properties CAT.2, CAT.3, CAT.4 and CAT.6 catalysts after reaction at 350°C. (a) N2 adsorption isotherms; (b) Pore size distribution.
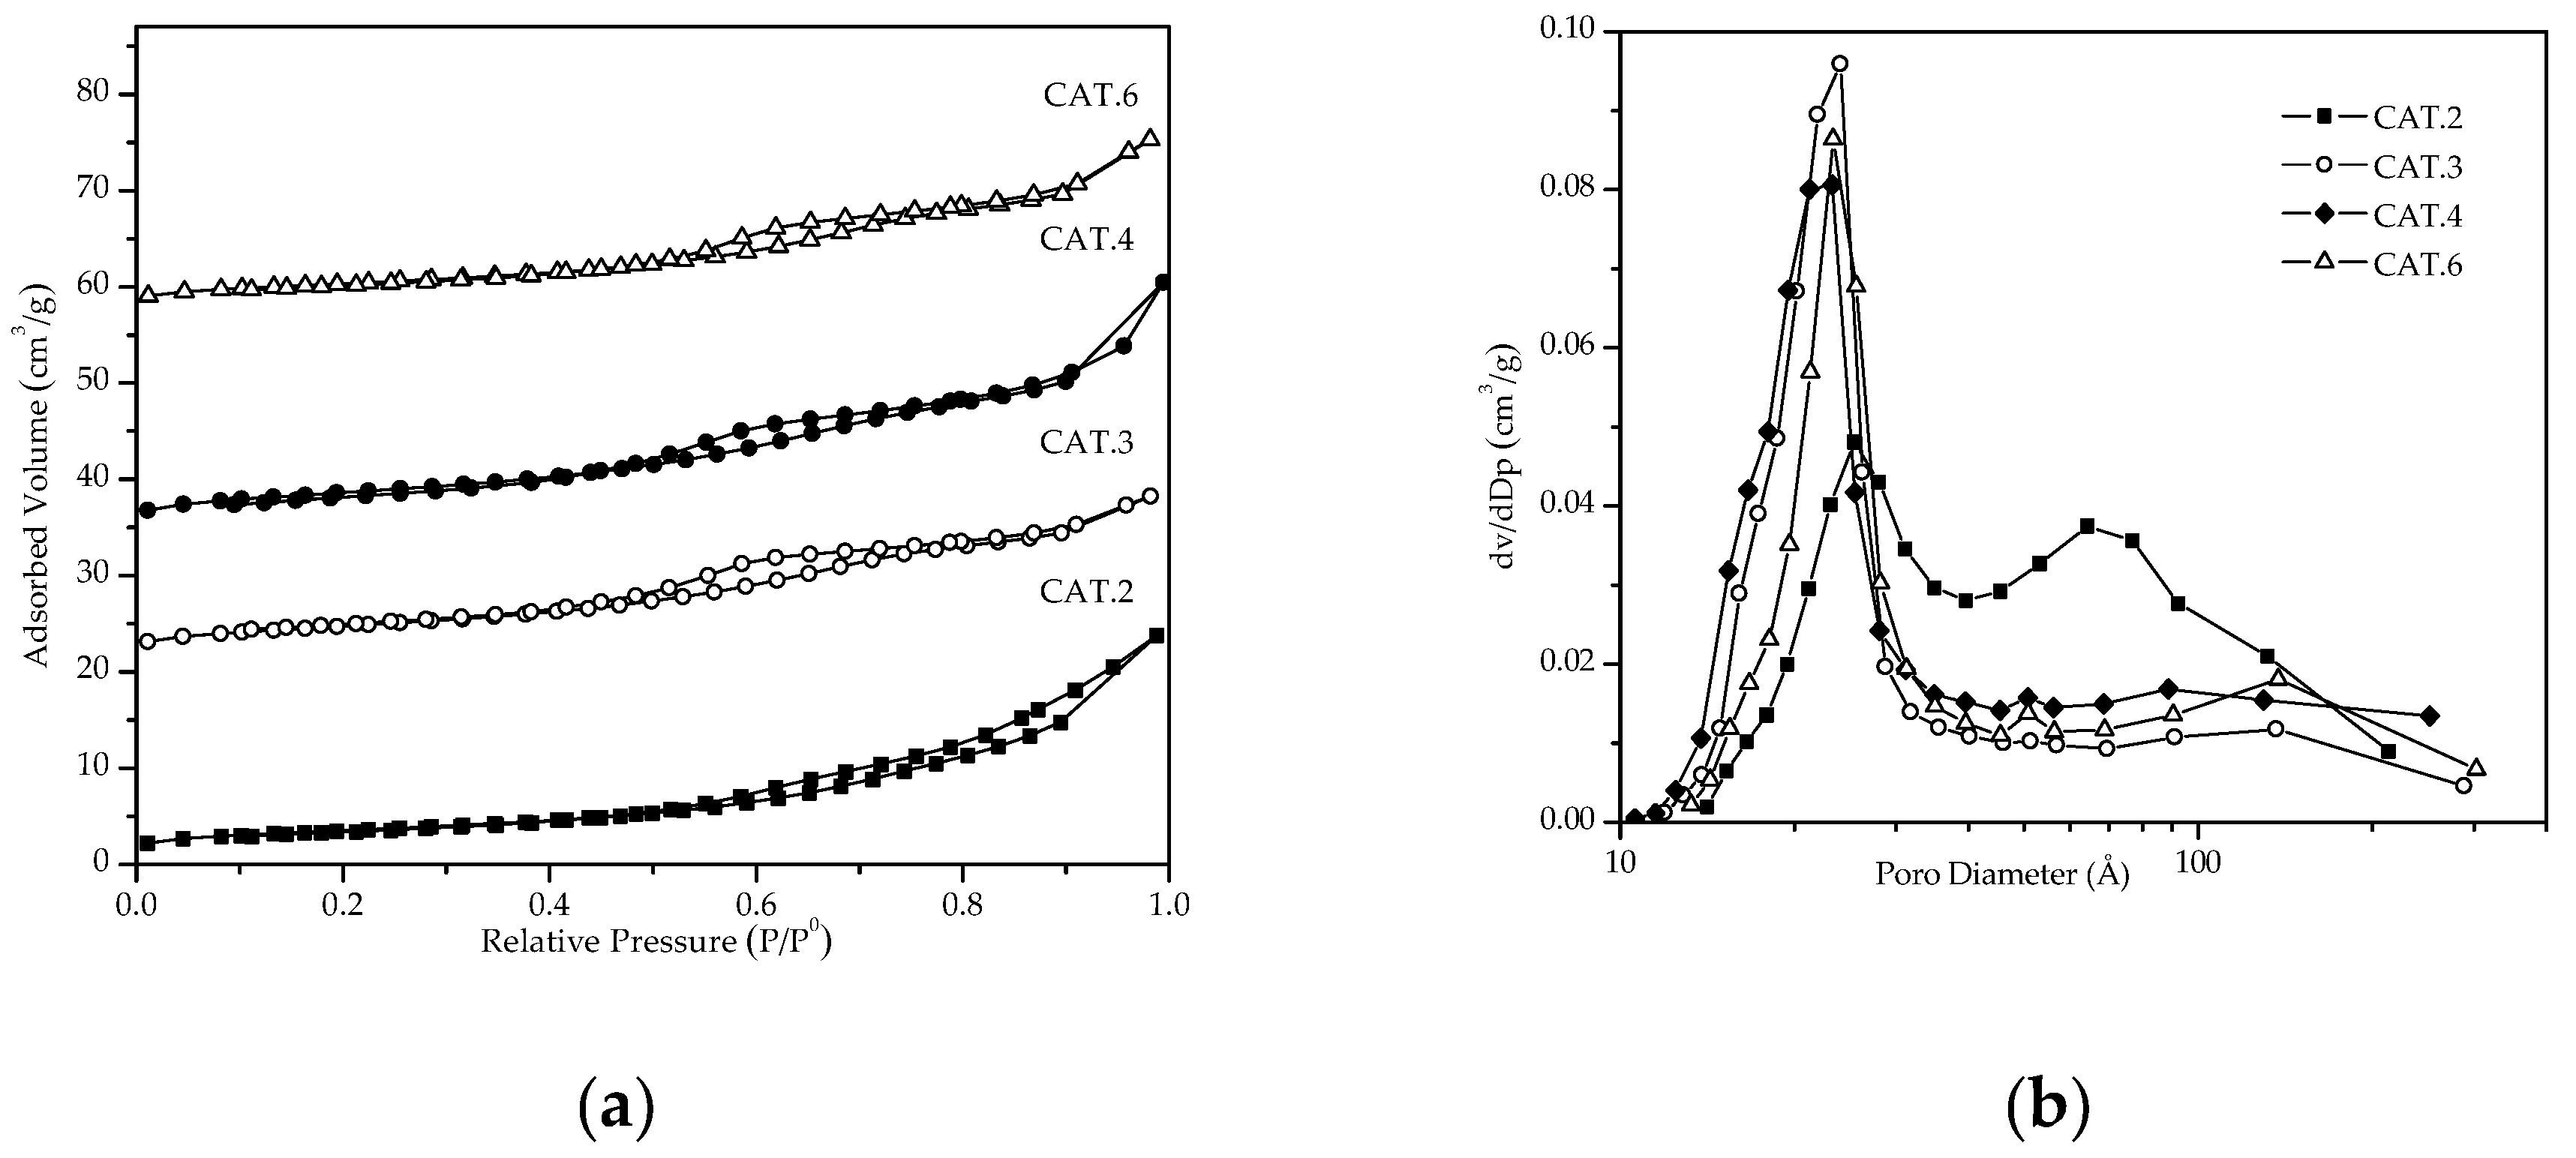
Figure 6.
X-ray diffraction pattern of catalysts on cordierite monoliths; (a) CAT.1 and powder catalysts (b) AW; (c) 0.1PtAg/AW; (d) 1PtAg/AW.
Figure 6.
X-ray diffraction pattern of catalysts on cordierite monoliths; (a) CAT.1 and powder catalysts (b) AW; (c) 0.1PtAg/AW; (d) 1PtAg/AW.
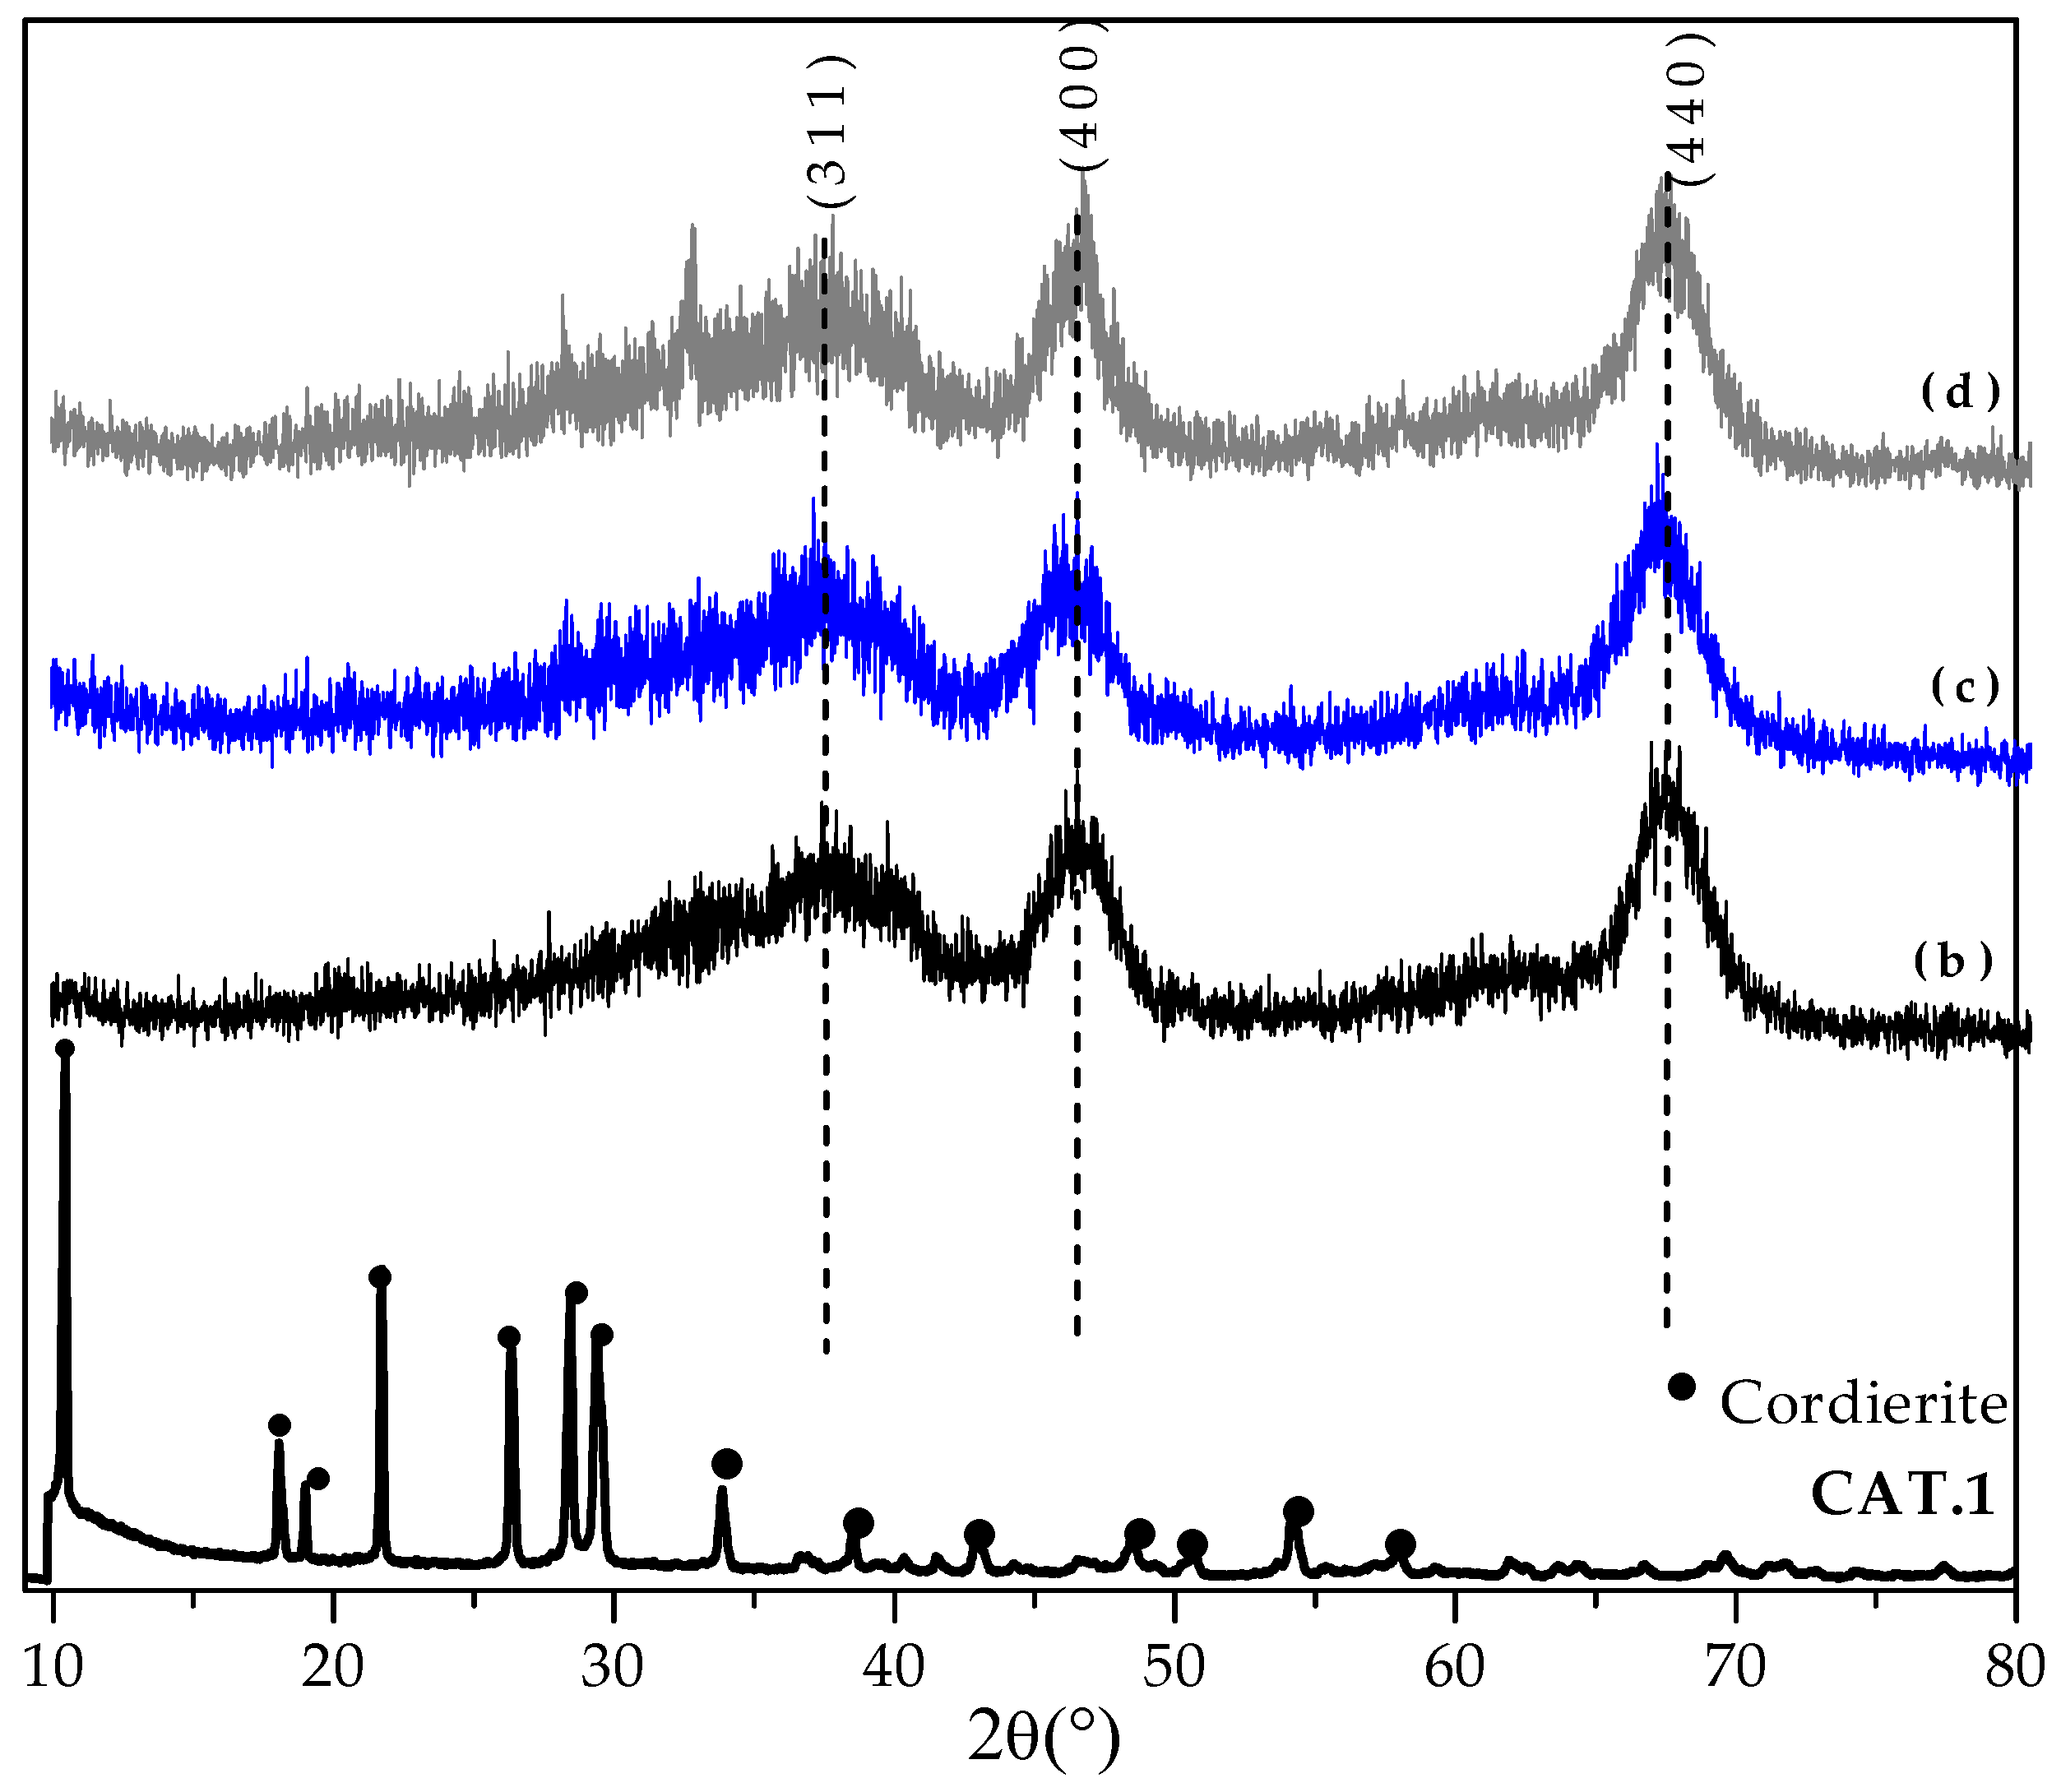
Figure 7.
SEM images of the clean cordierite monolith before catalytic evaluation (a-c) ; Al2O3-WOx/Cordierite (d-f), PtAg/ Al2O3-WOx/Cordierite (CAT.1) (g-i) and PtAg/ Al2O3-WOx/Cordierite (CAT.5) catalyst (j-l).
Figure 7.
SEM images of the clean cordierite monolith before catalytic evaluation (a-c) ; Al2O3-WOx/Cordierite (d-f), PtAg/ Al2O3-WOx/Cordierite (CAT.1) (g-i) and PtAg/ Al2O3-WOx/Cordierite (CAT.5) catalyst (j-l).
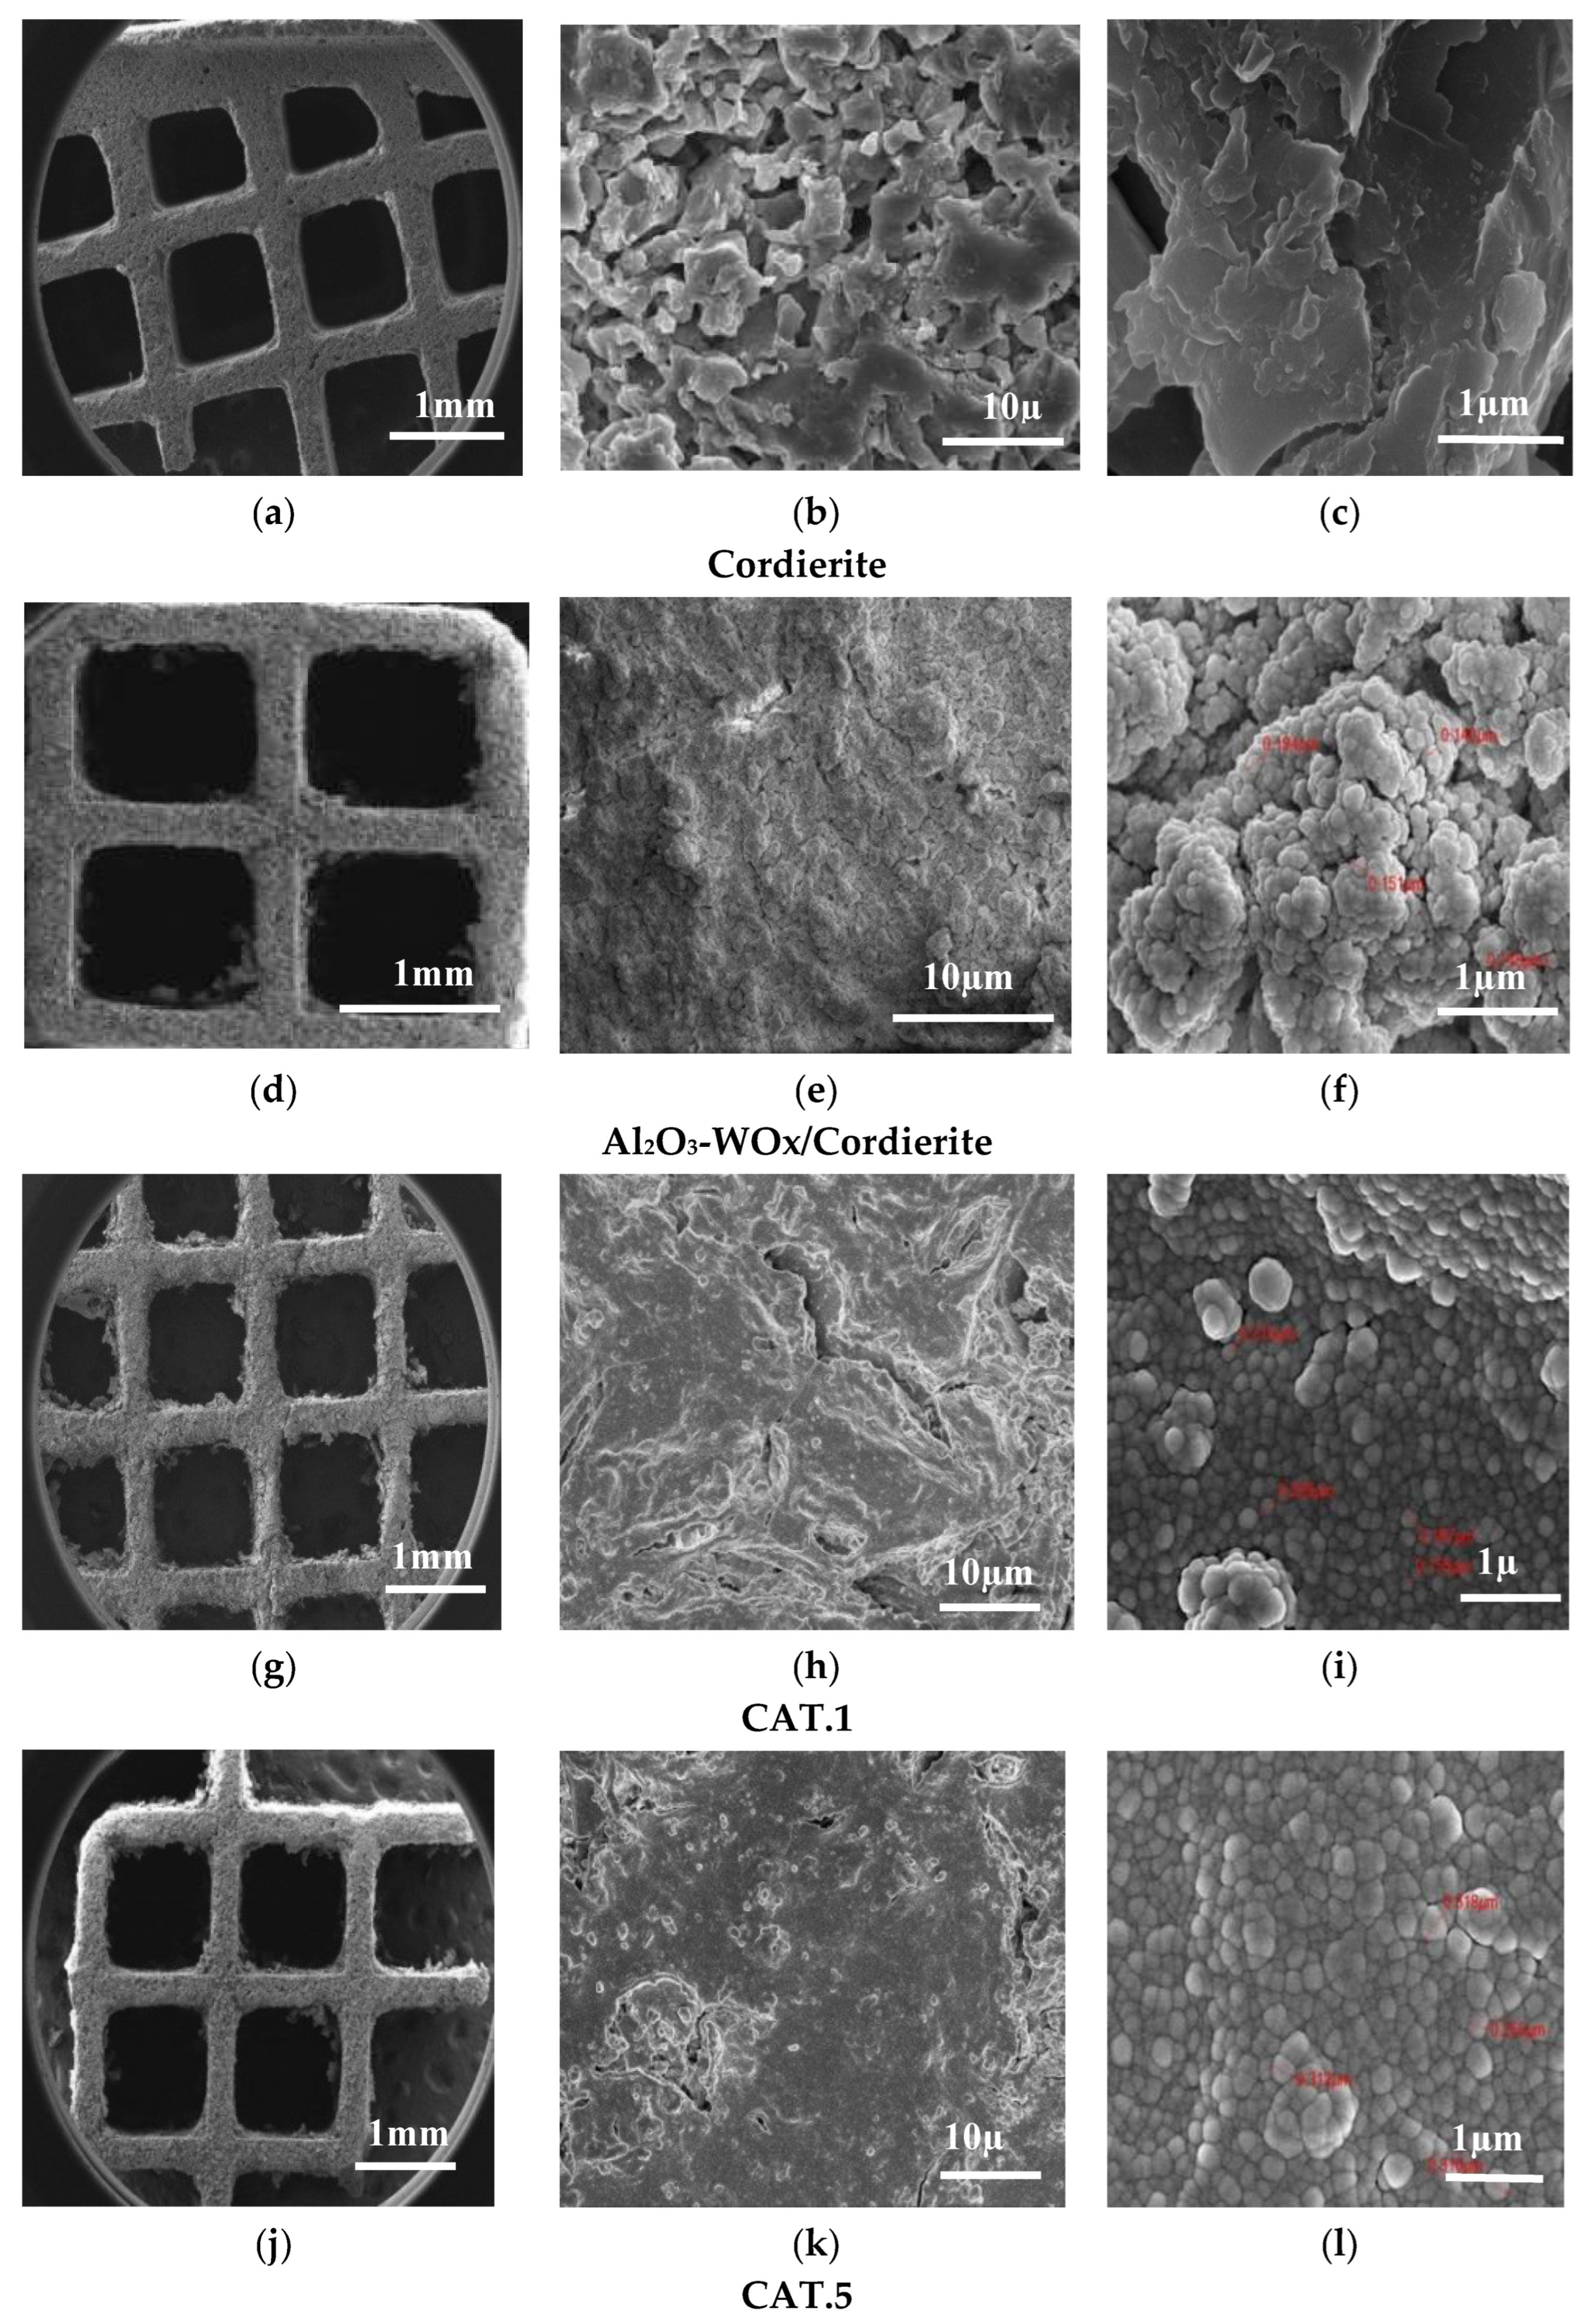
Figure 8.
Spectra of the chemical analysis by EDX of the (a) Cordierite monolith; (b) Al2O3-WOx/Cordierite, (c) Ag/Al2O3-WOx/Cordierite (CAT.5) and (d) AgPt/Al2O3-WOx/Cordierite (CAT.1).
Figure 8.
Spectra of the chemical analysis by EDX of the (a) Cordierite monolith; (b) Al2O3-WOx/Cordierite, (c) Ag/Al2O3-WOx/Cordierite (CAT.5) and (d) AgPt/Al2O3-WOx/Cordierite (CAT.1).
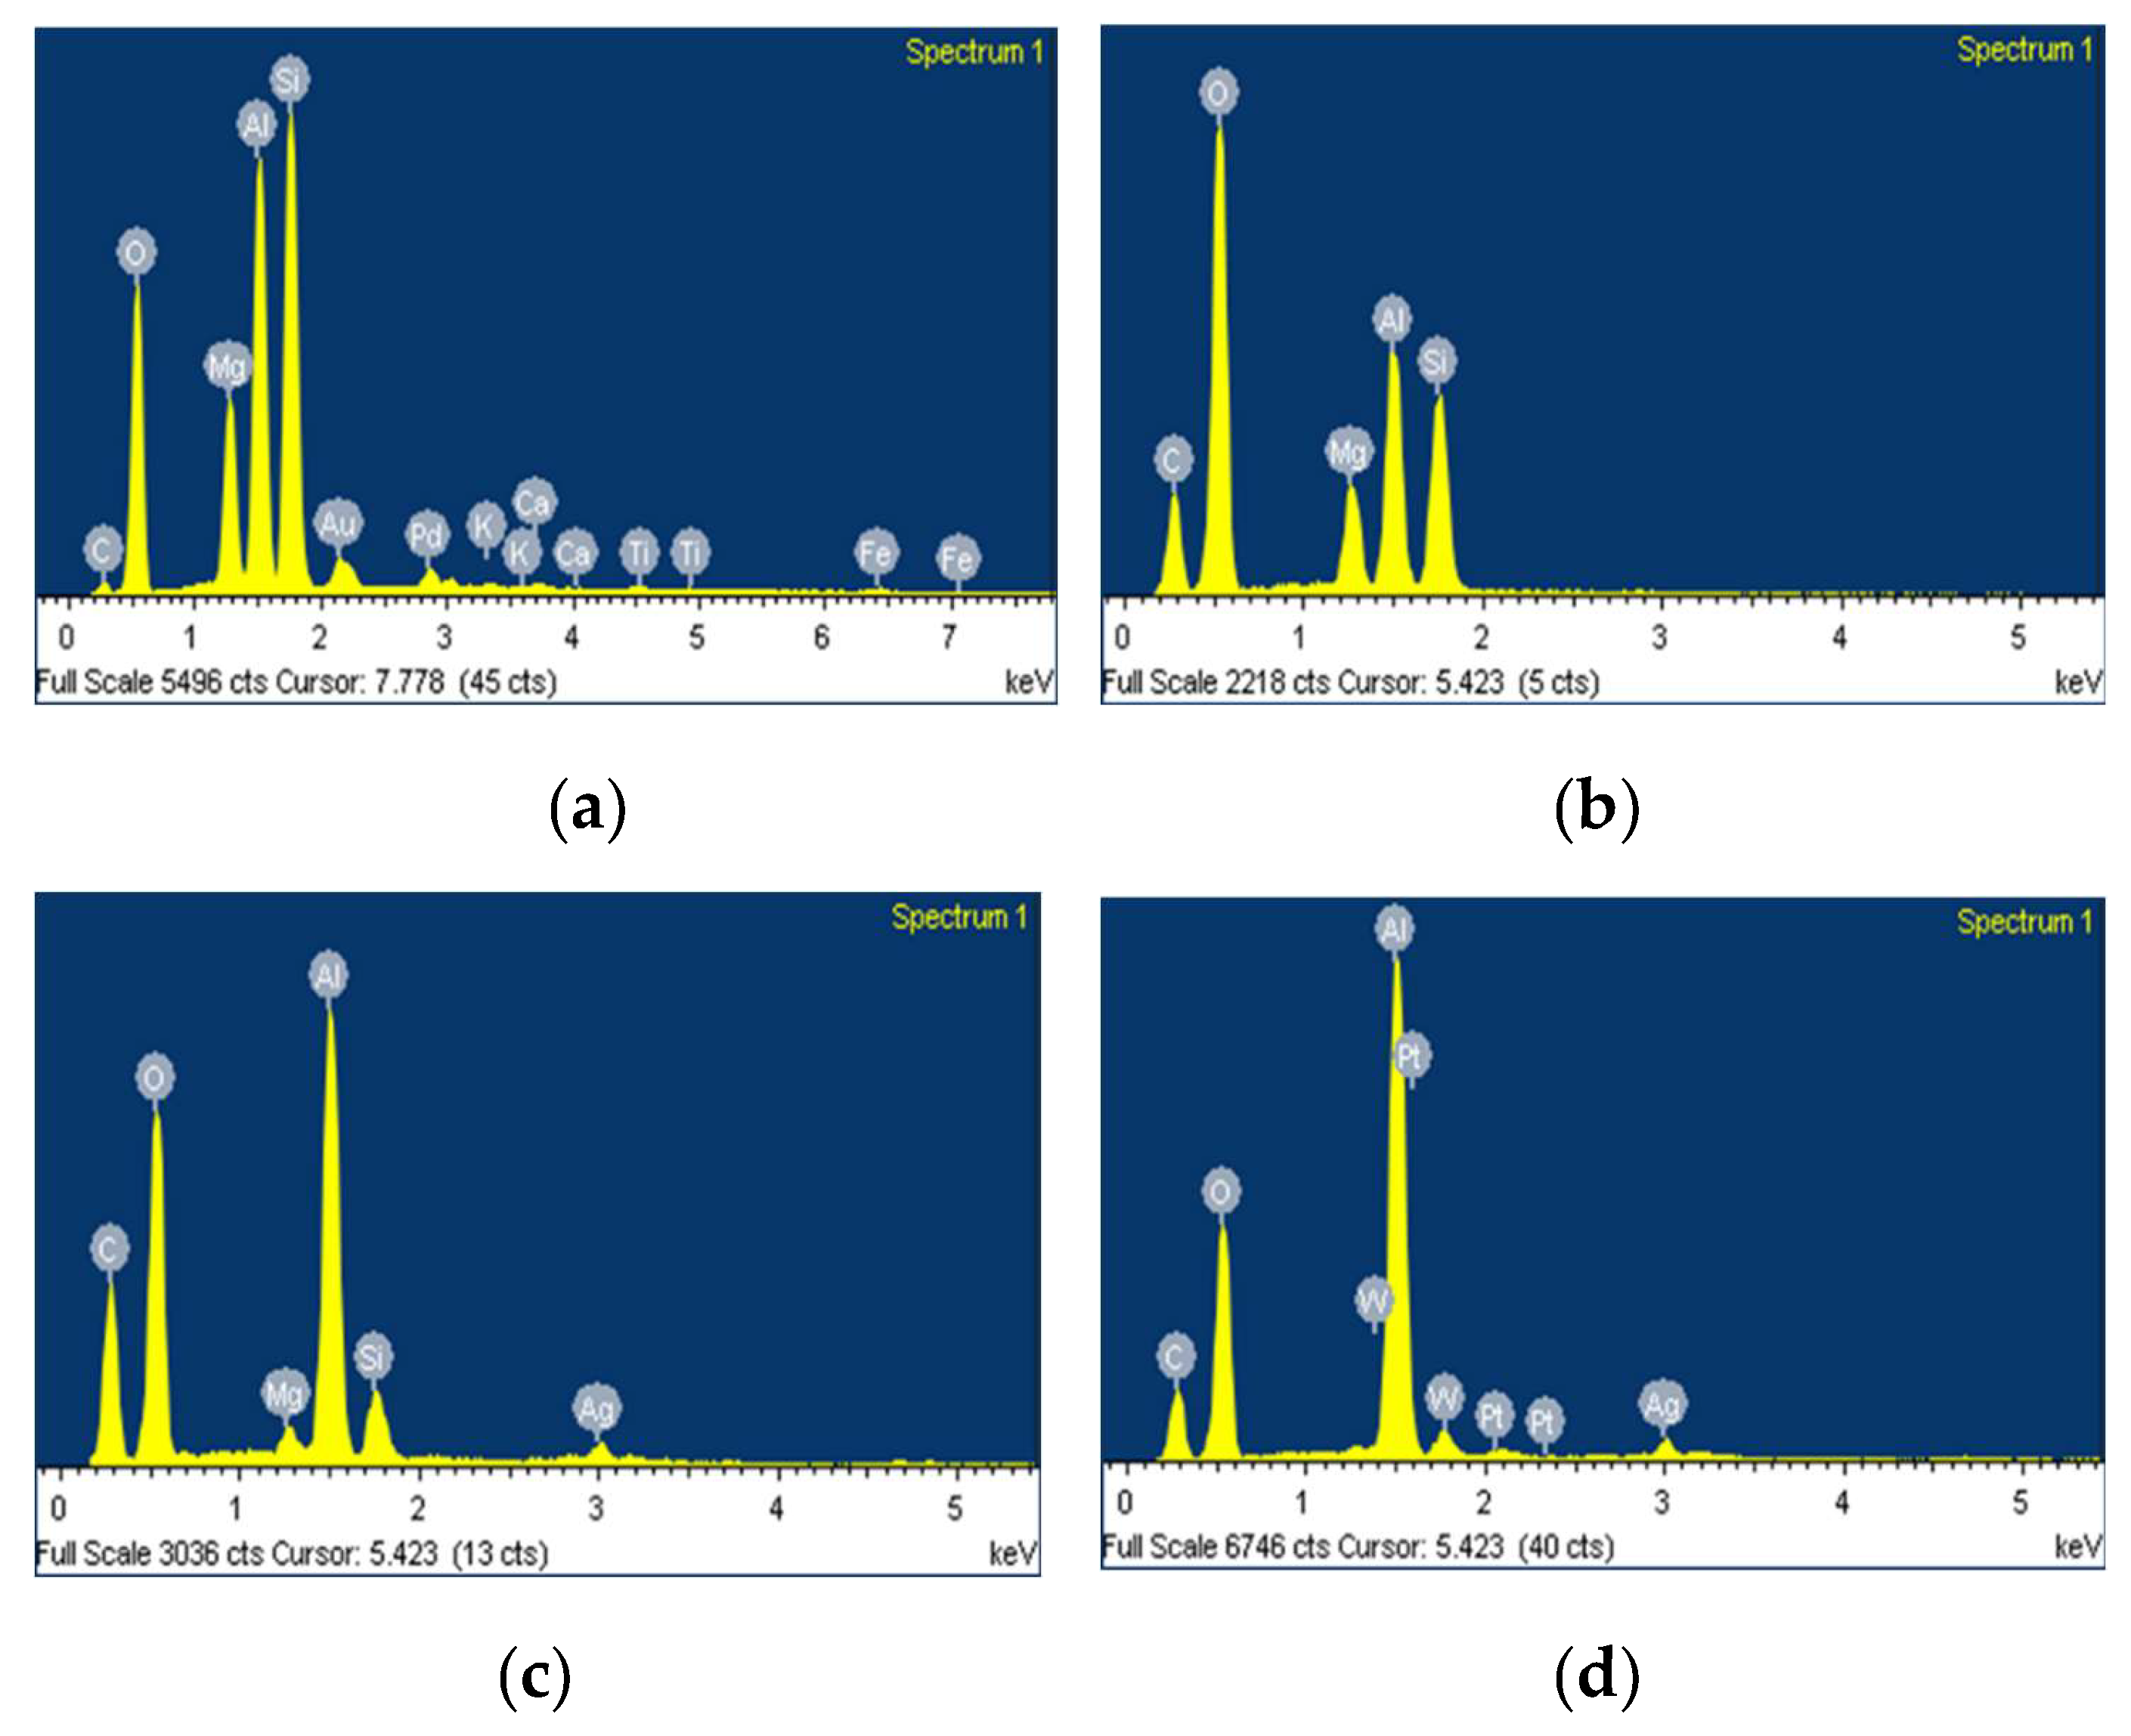
Figure 9.
Elemental map by EDX of the CAT.1 catalyst. (a) Analyzed area, (b) O2 atoms (c) Al atoms, (d) Ag atoms, (e) Pt atoms and (f) W atoms.
Figure 9.
Elemental map by EDX of the CAT.1 catalyst. (a) Analyzed area, (b) O2 atoms (c) Al atoms, (d) Ag atoms, (e) Pt atoms and (f) W atoms.
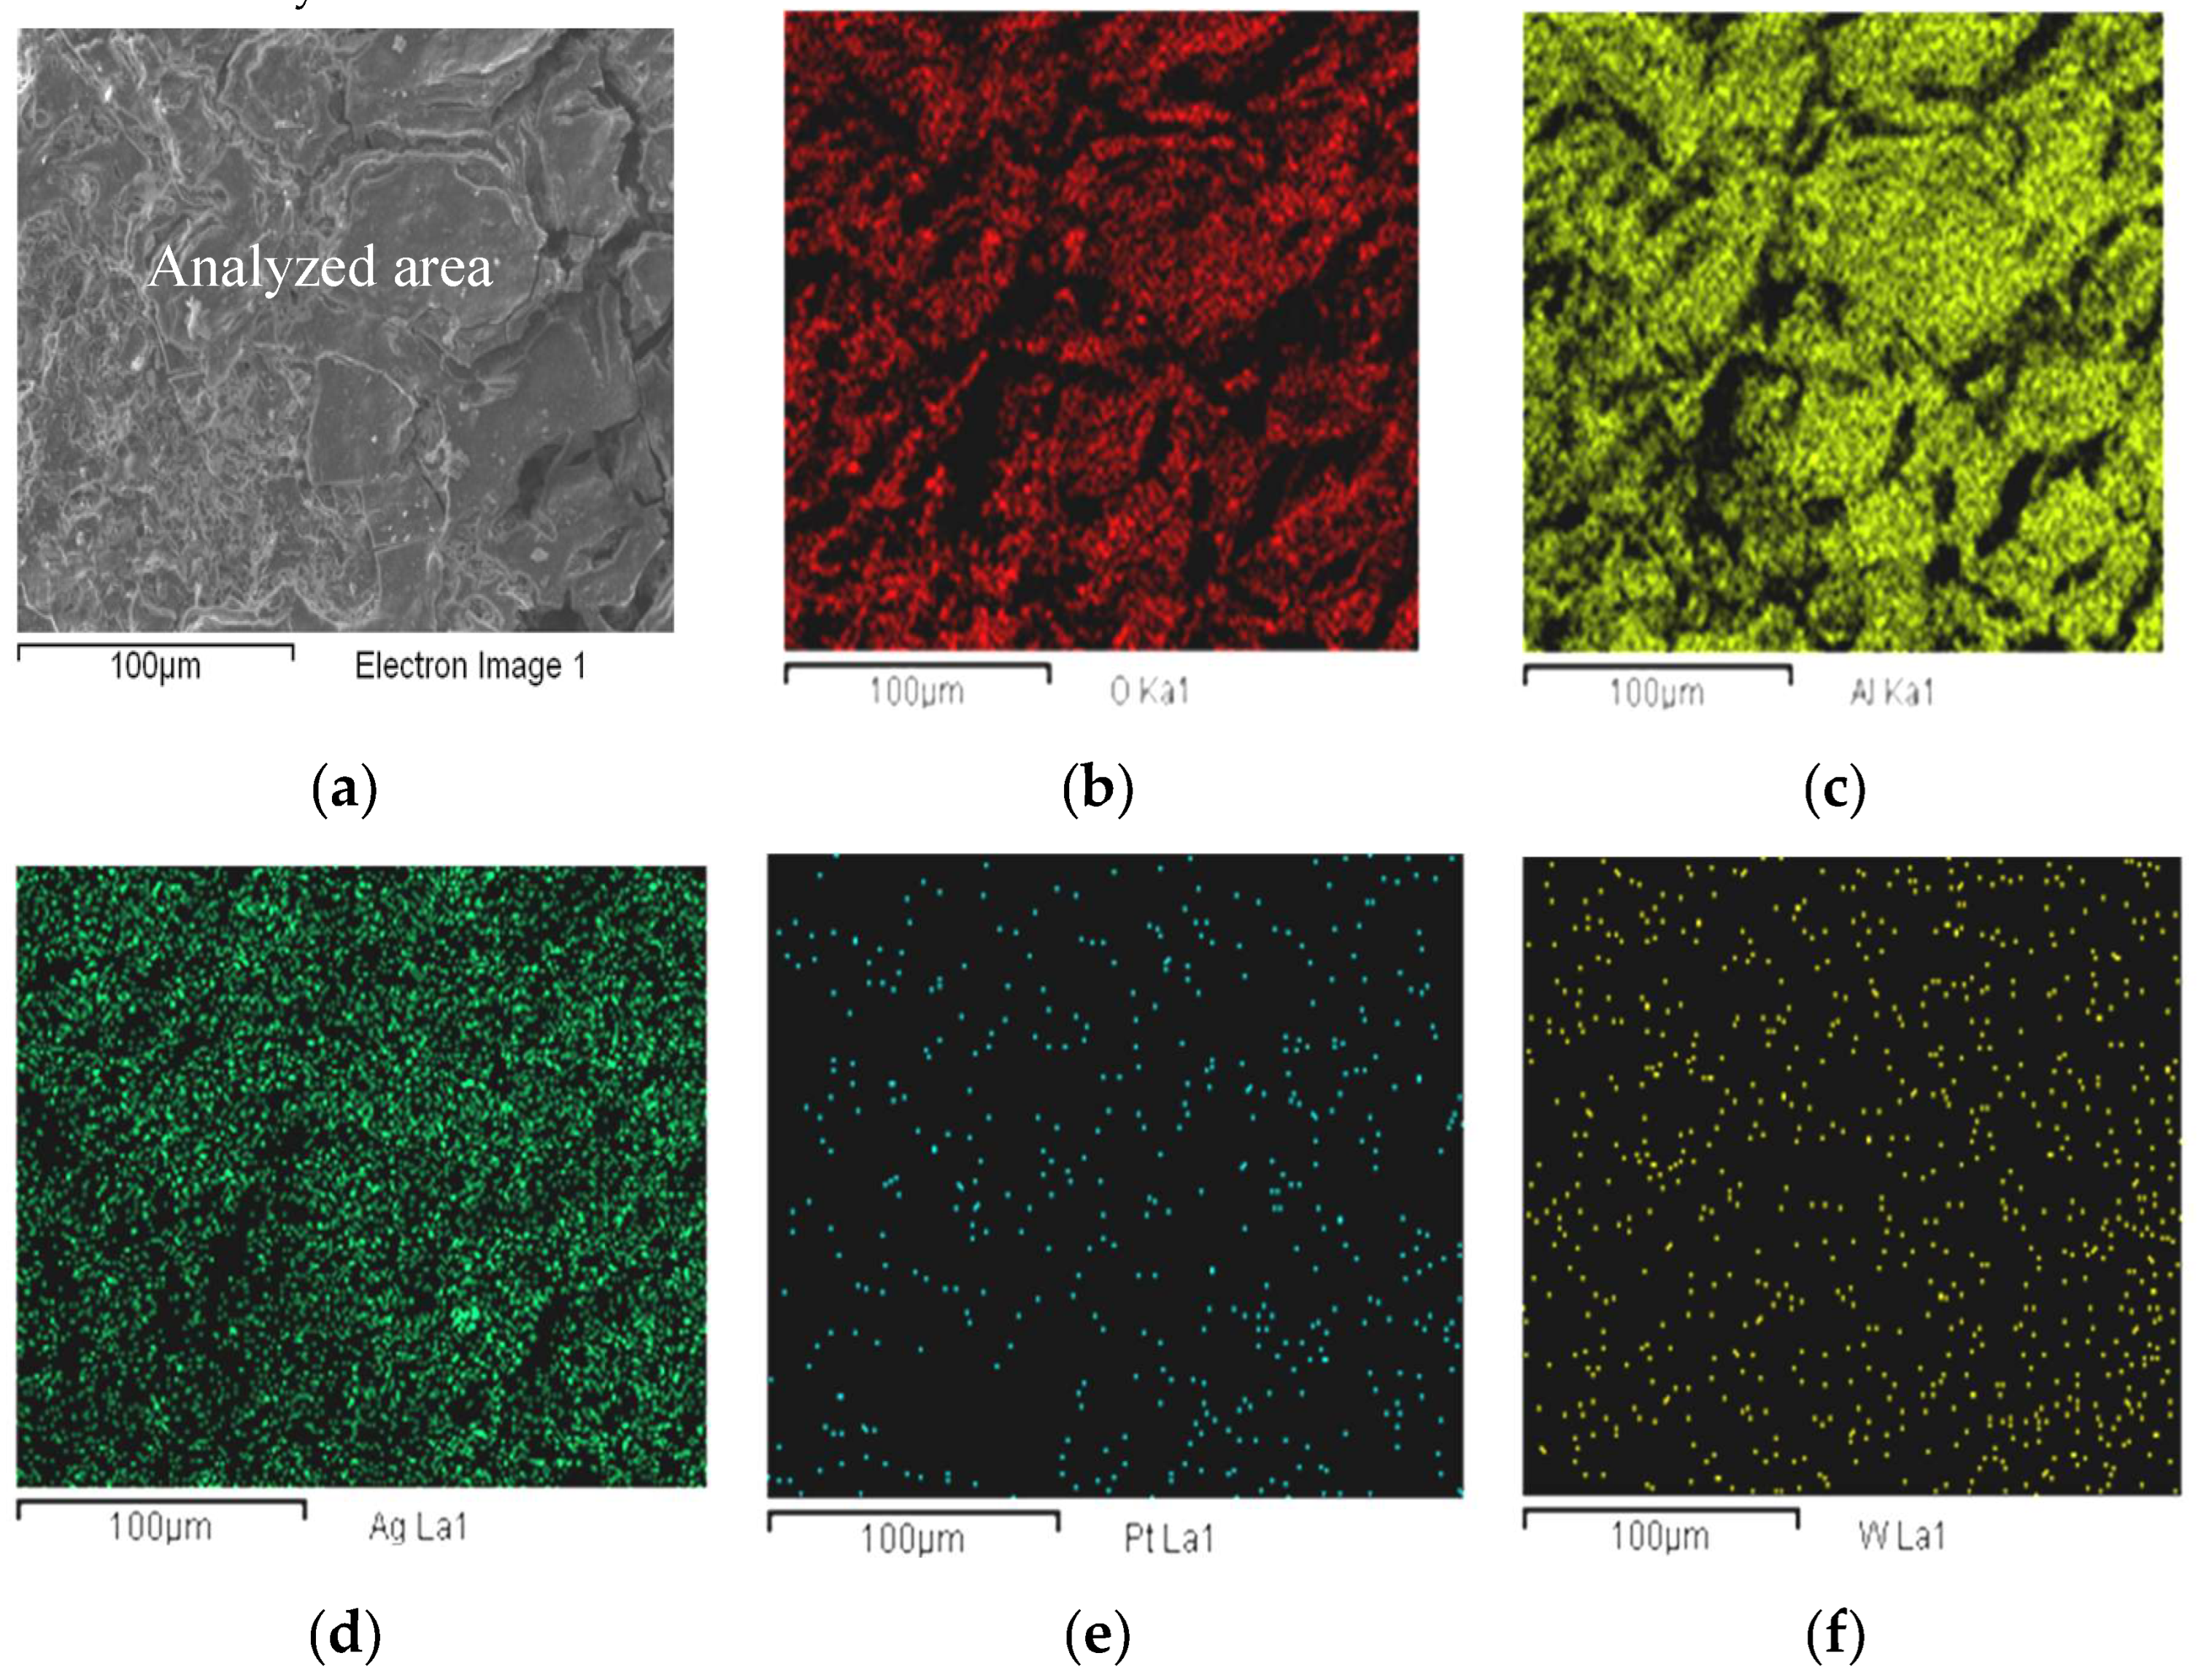
Figure 10.
STEM of the following catalysts: (a) 0.1PtAg/AW in powder form; (b) Particle size histogram; (c) 1PtAg/AW catalyst in powder form; (d) Particle size histogram; (e) CAT.1 catalyst (after reaction to 30,000 h-1), (f) Particle size histogram. The resolutions of the micrographs were 0.2 and 0.5µm.
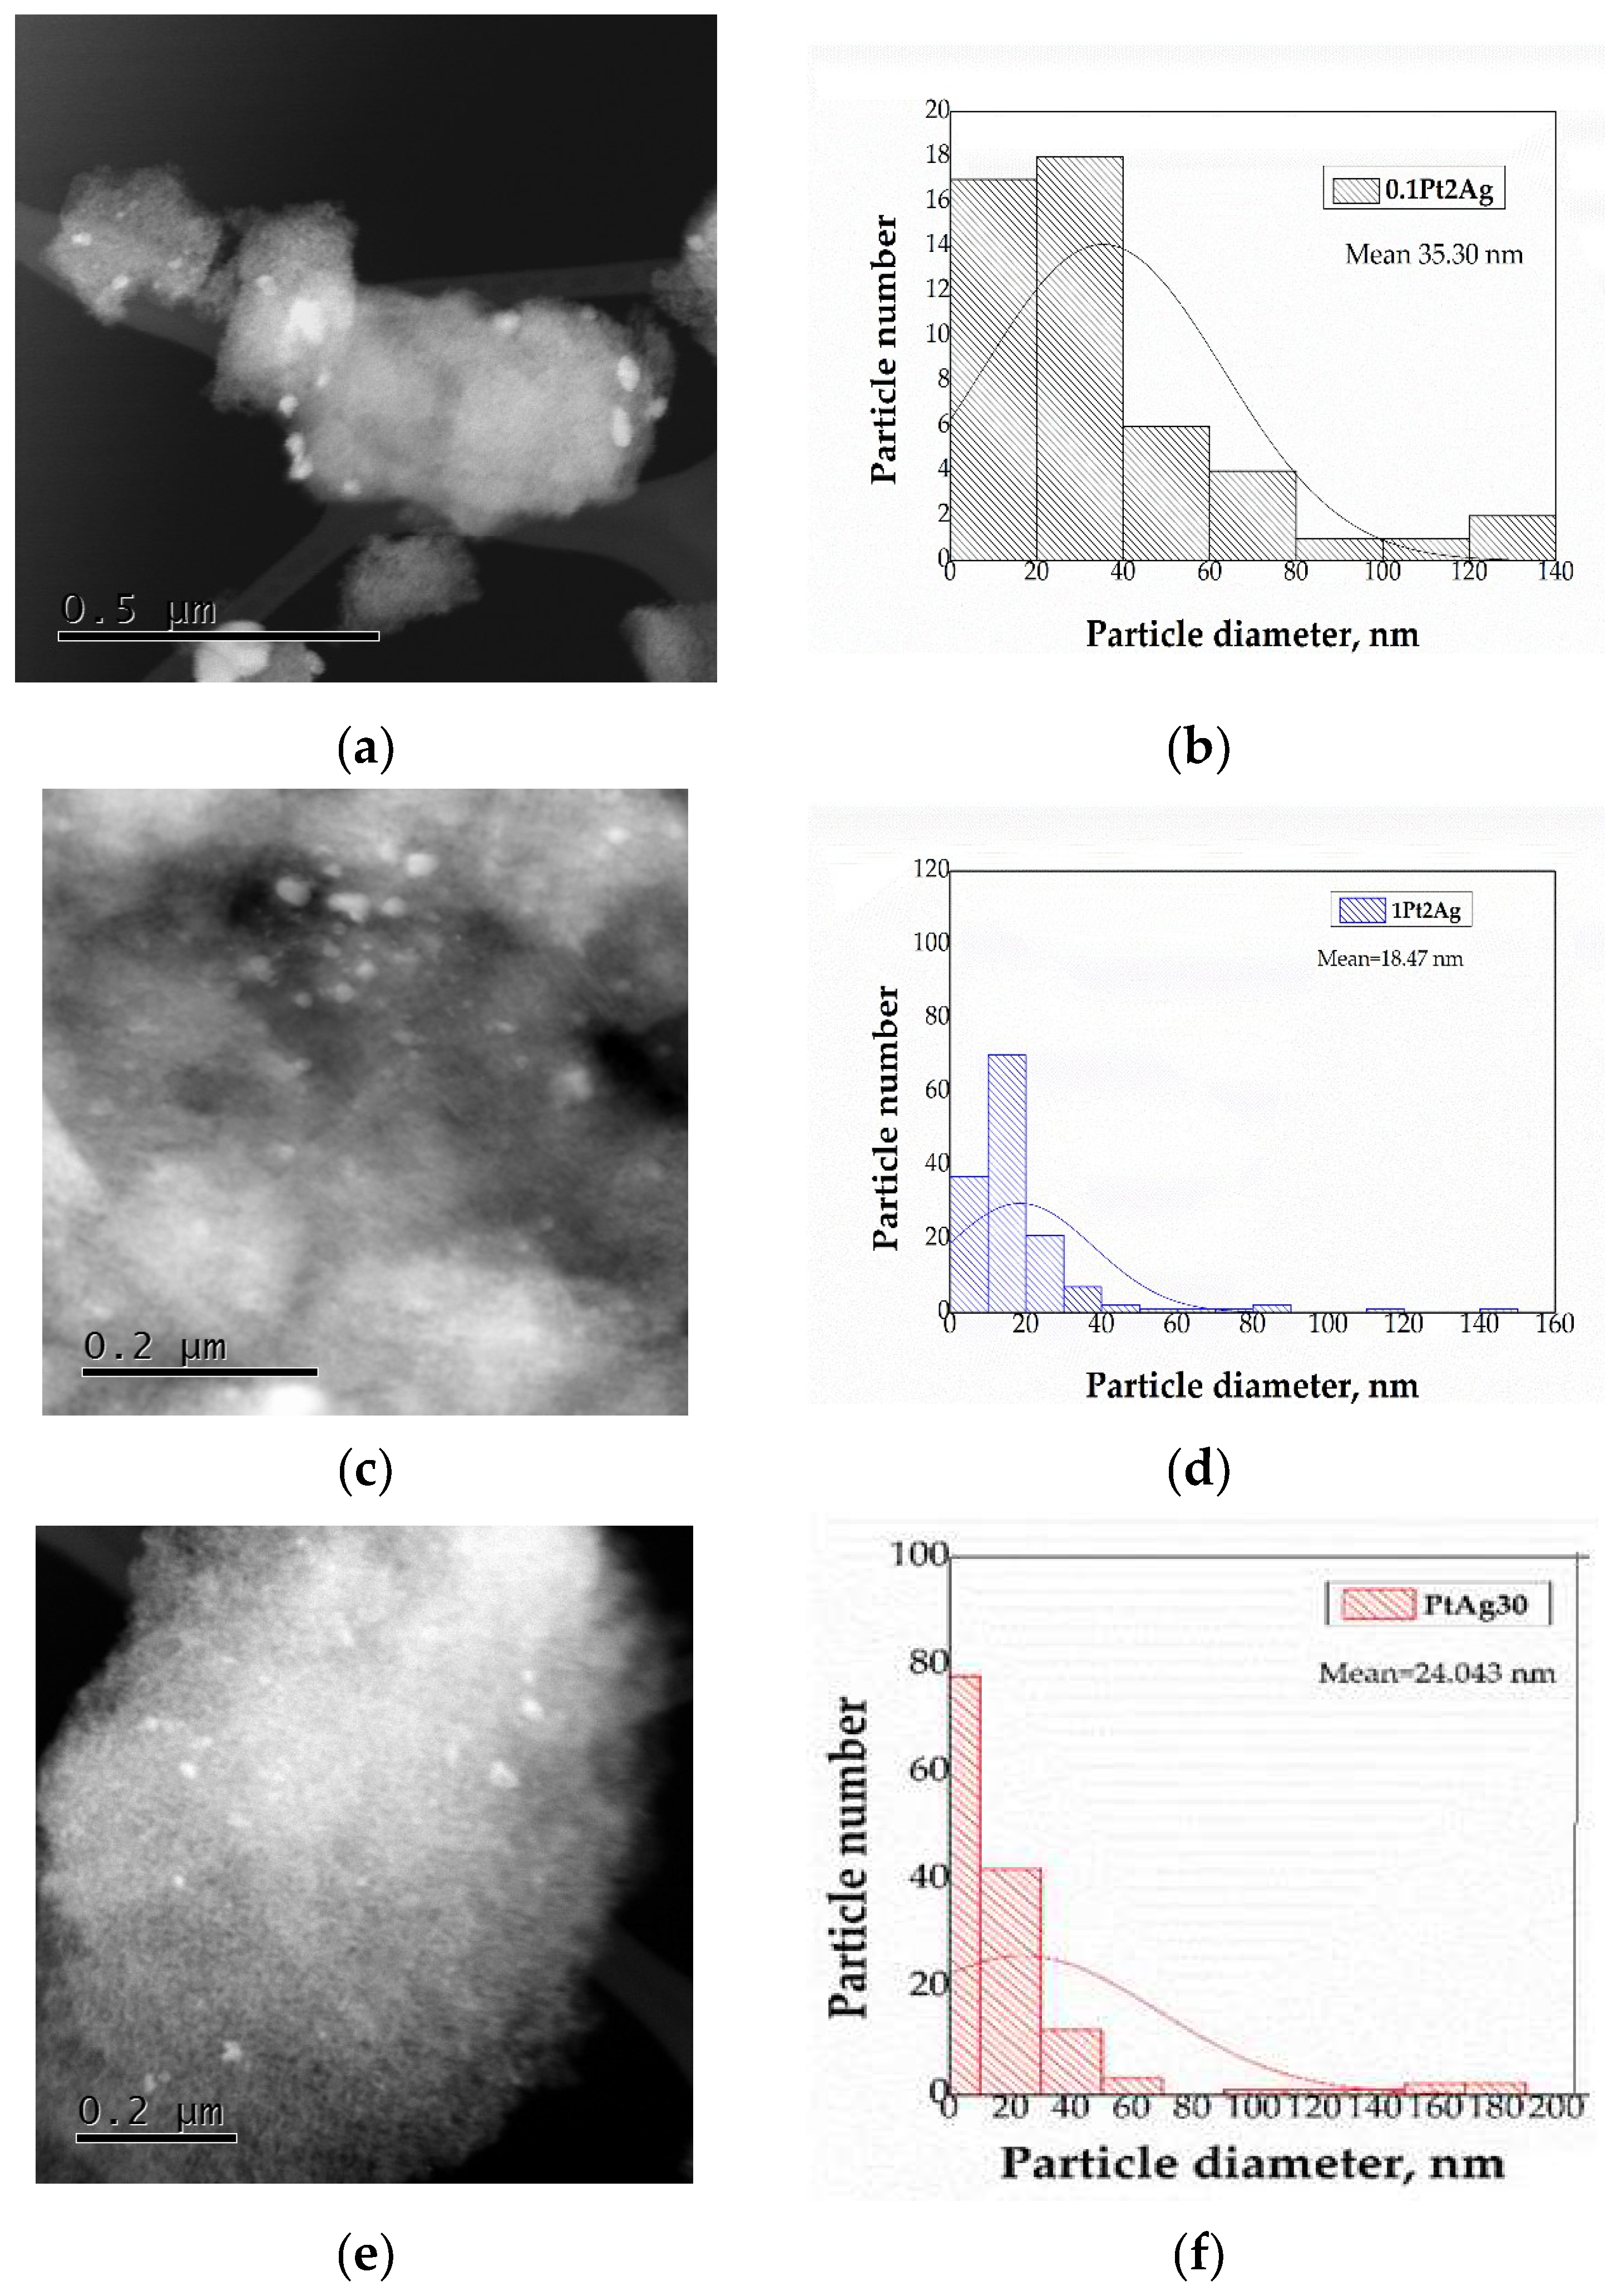
Figure 11.
TPR-H2 profiles of calcined catalysts. (a) 1PtAg/AW and (b) 0.1PtAg/AW.
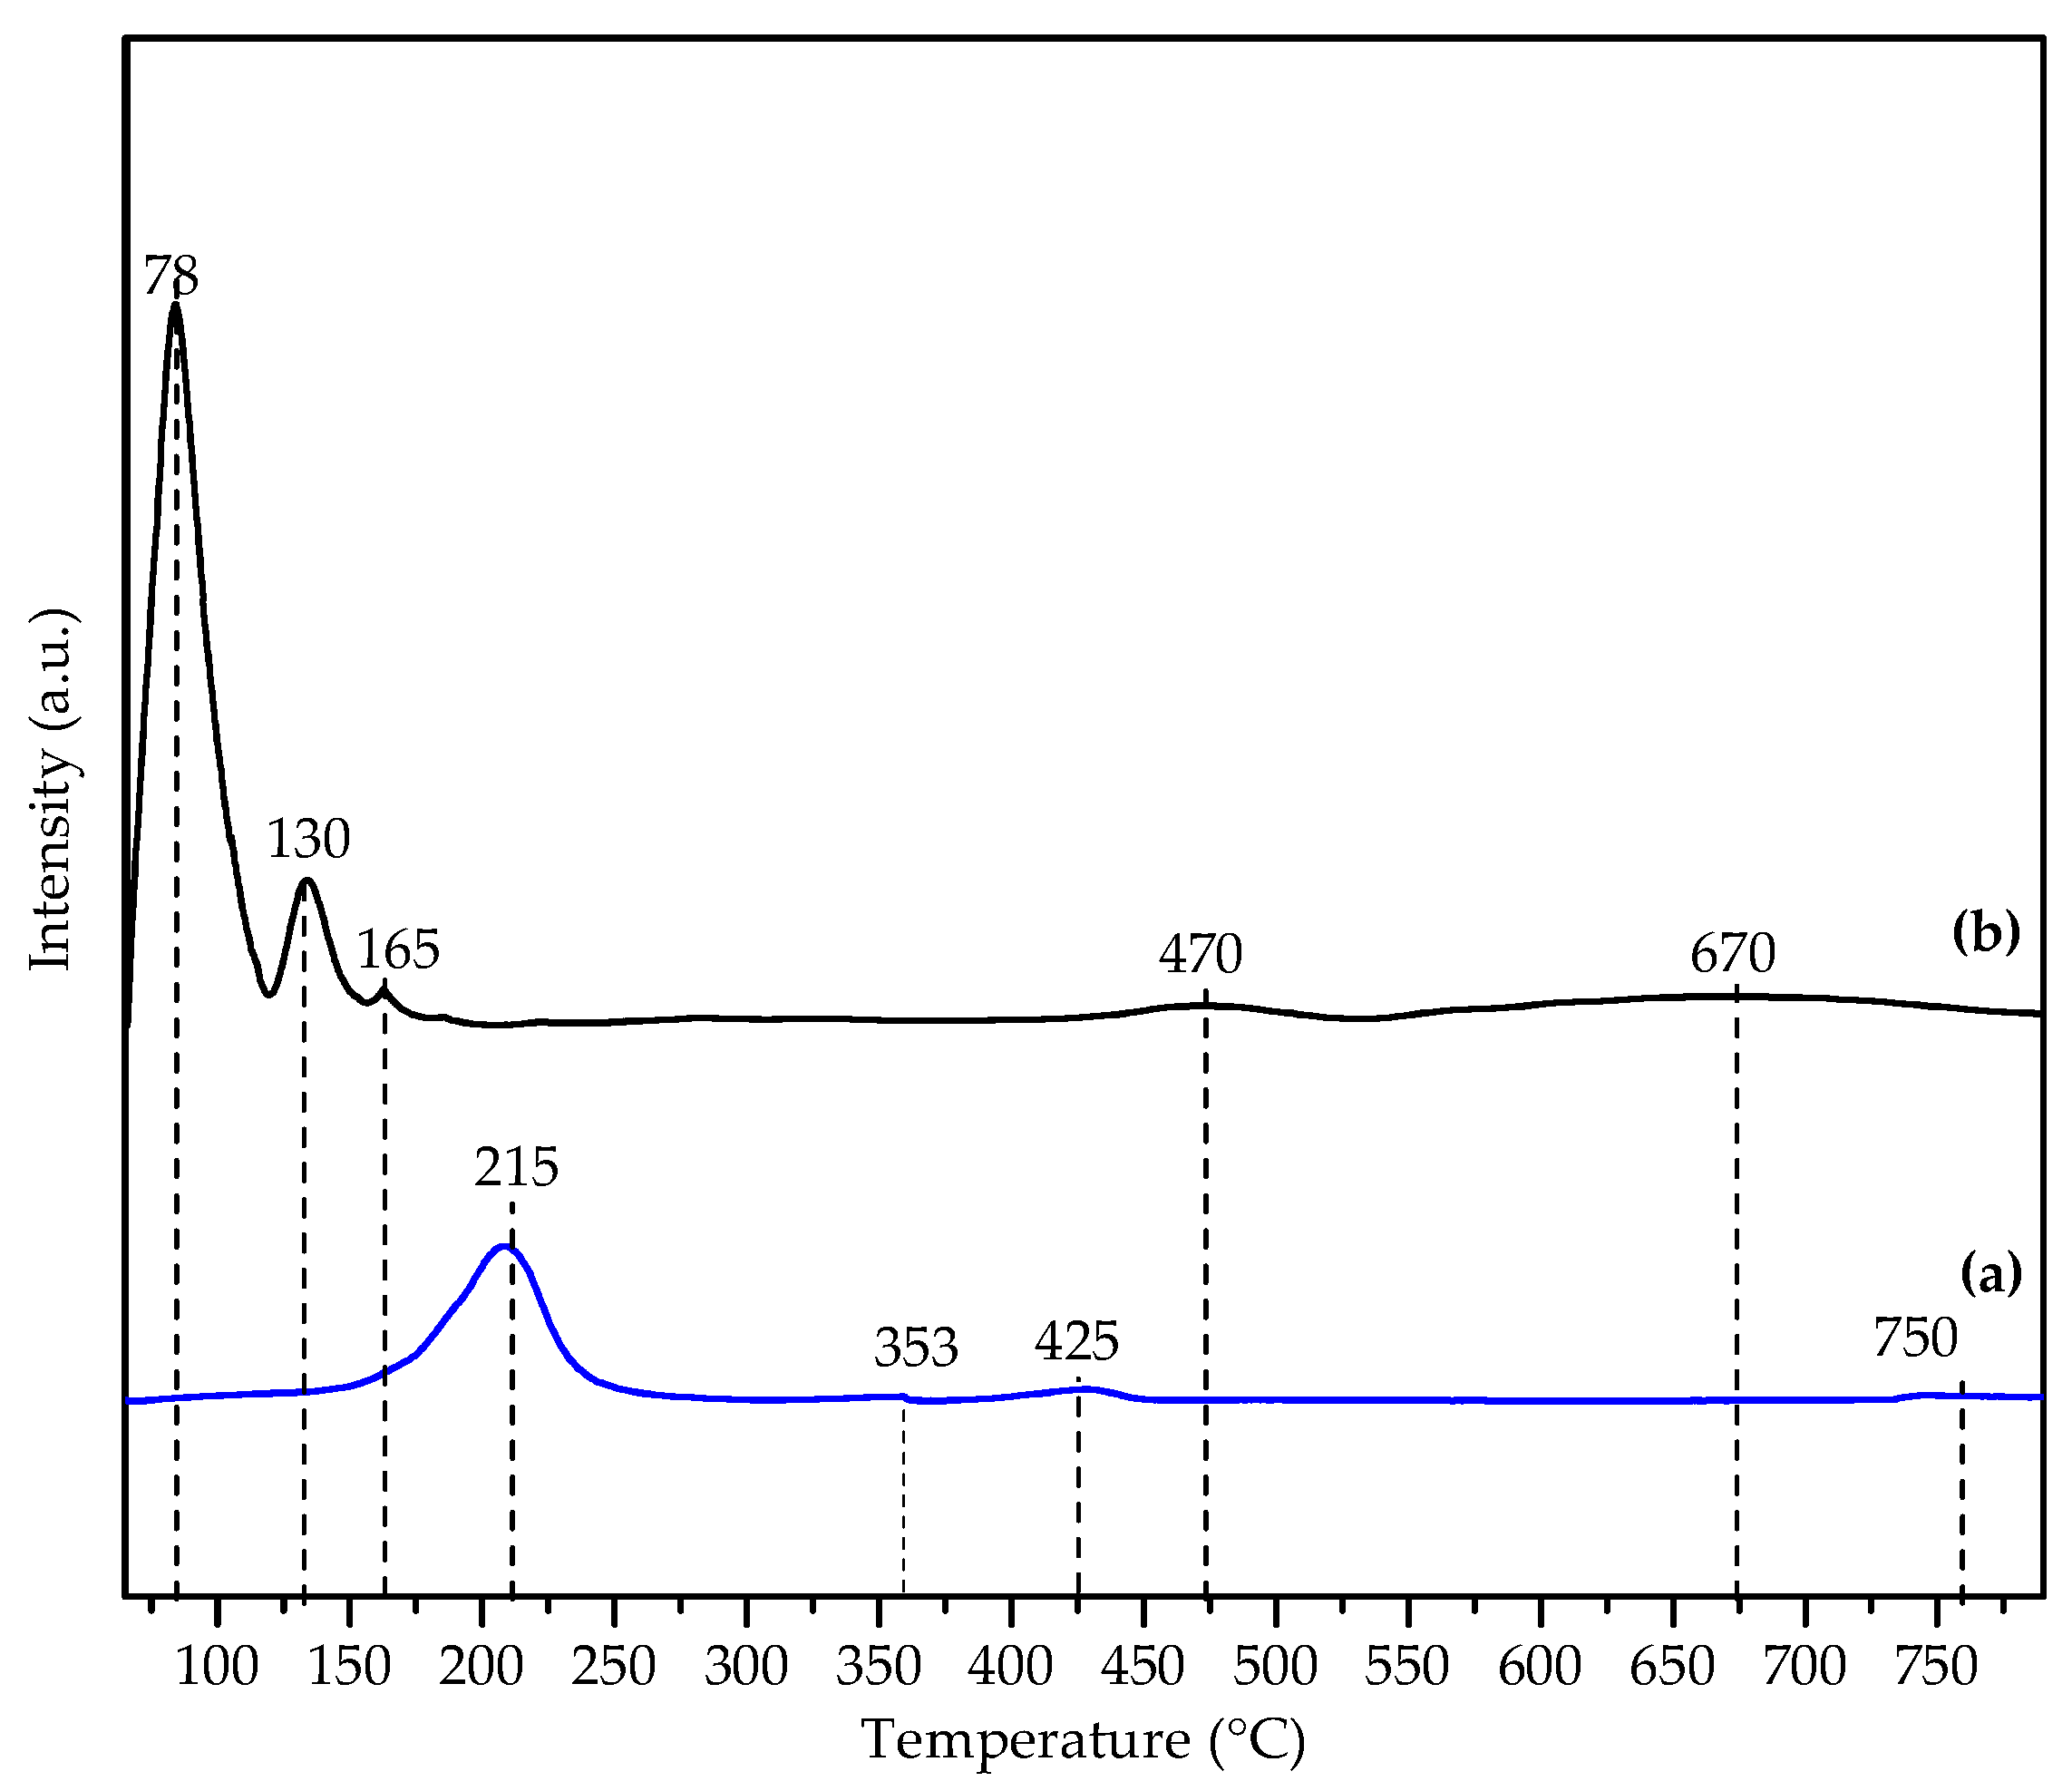
Figure 12.
Spectra UV-vis of the catalysts. (a) Pt-Ag/Al2O3-WOx/Cordierite fresh; (b) CAT.1 to CAT.6 after reaction ((a) CAT.1, (b) CAT.2, (c) CAT.3, (d) CAT.4, (e) CAT.5, (f) CAT.6). Reaction conditions: gas mixture 750ppm NO, 1750ppm C3H8, 6%vol O2, 600 ppm CO, 10%vol CO2, 12%vol H2O and N2 ; GHSV of 12,000 h-1 at 350°C for 4 h.
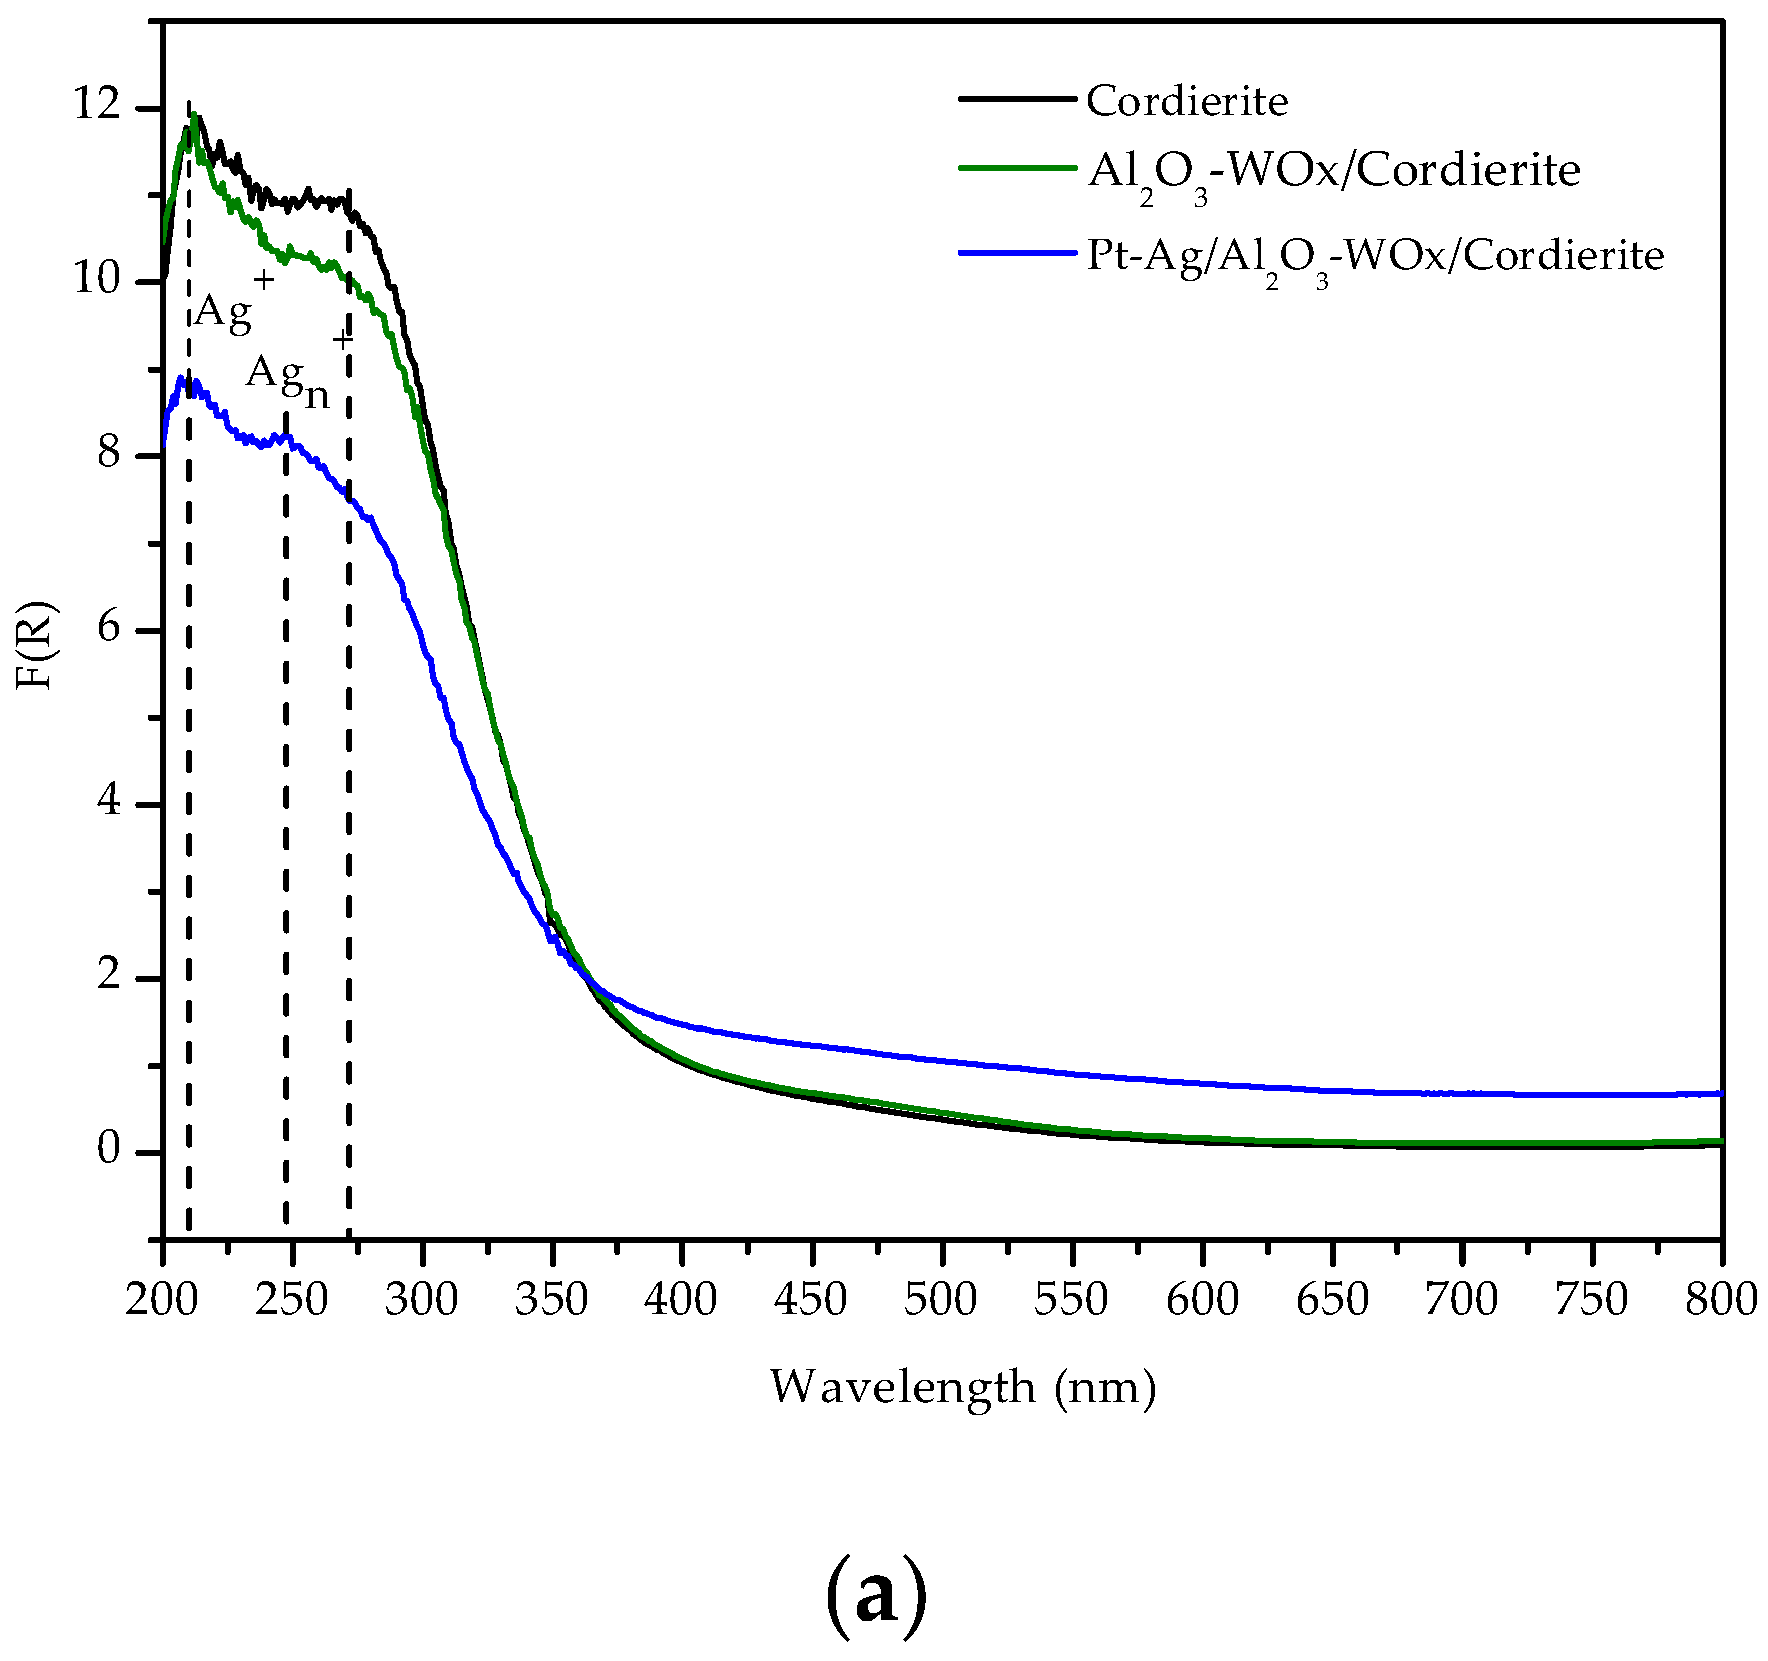
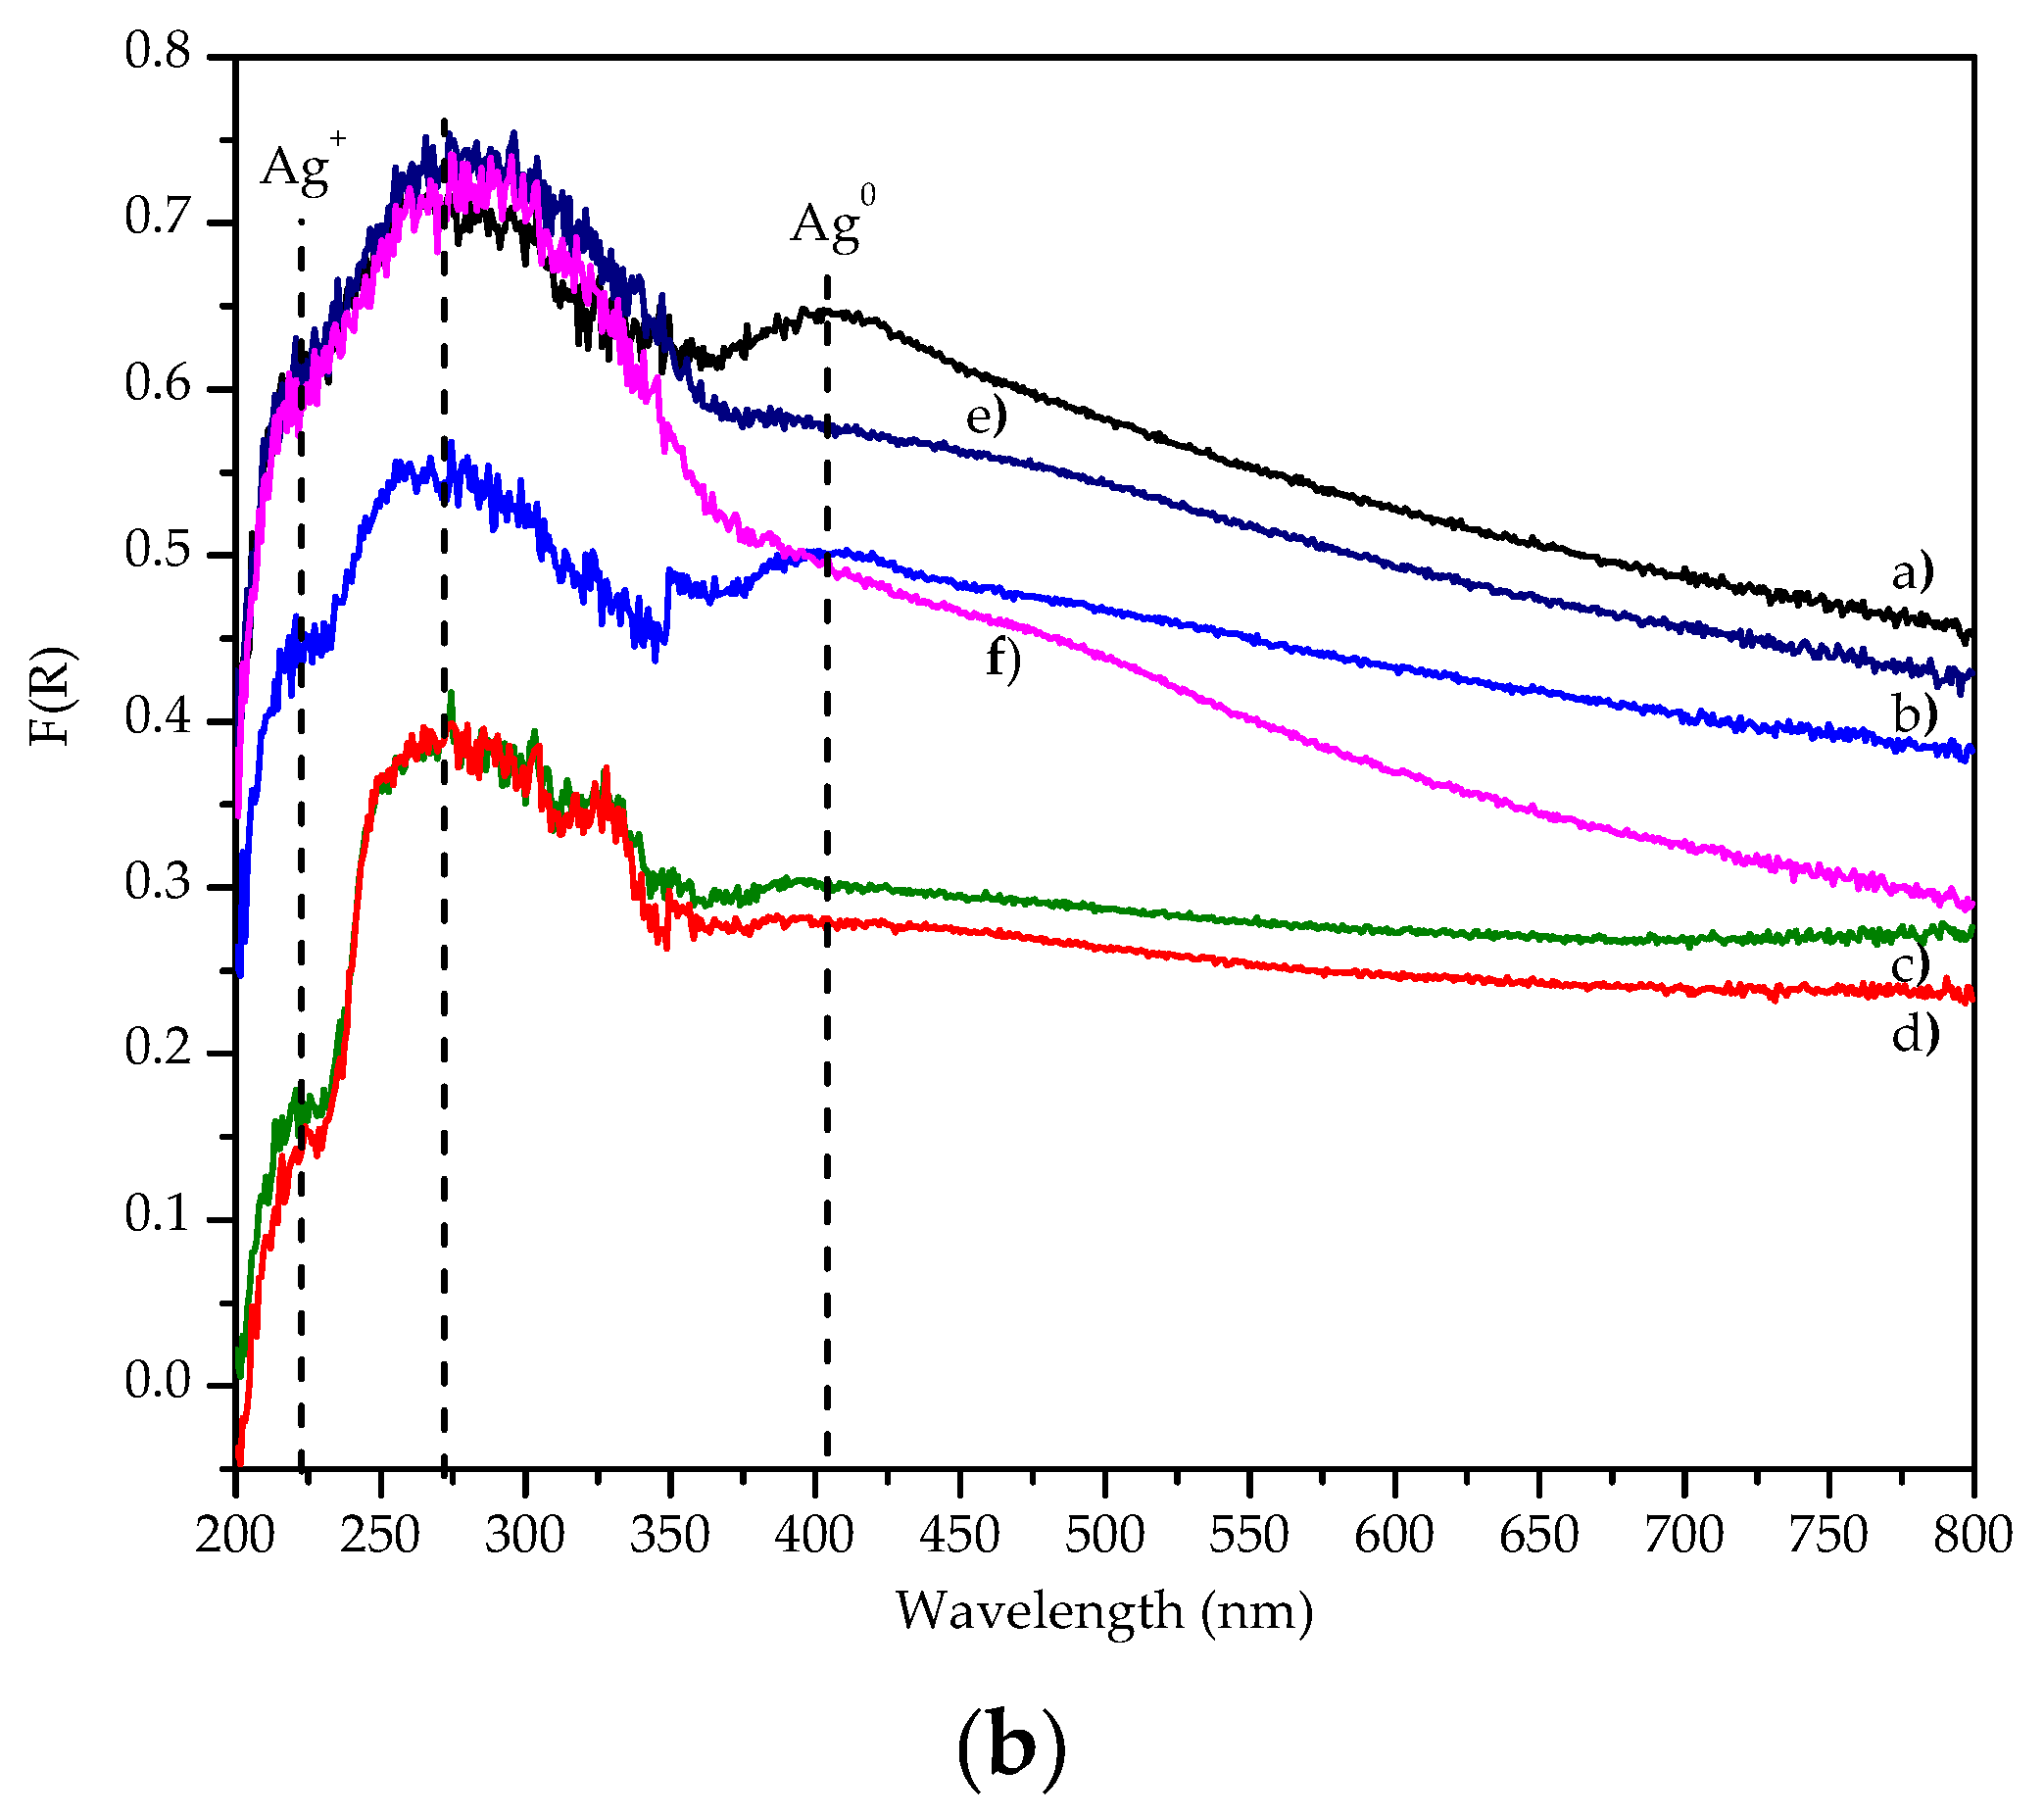
Figure 13.
Raman spectra the PtAg/Al2O3-WOx/Cordierite (CAT.1) catalyst after reaction with C3H8 and H2. Reaction conditions: gas mixture 750ppm NO, 1750ppm C3H8, 6%vol O2, 600 ppm CO, 10%vol CO2, 12%vol H2O and N2 ; GHSV of 30000, 70000 and 100,000 h-1 at 350°C for 4 h.
Figure 13.
Raman spectra the PtAg/Al2O3-WOx/Cordierite (CAT.1) catalyst after reaction with C3H8 and H2. Reaction conditions: gas mixture 750ppm NO, 1750ppm C3H8, 6%vol O2, 600 ppm CO, 10%vol CO2, 12%vol H2O and N2 ; GHSV of 30000, 70000 and 100,000 h-1 at 350°C for 4 h.
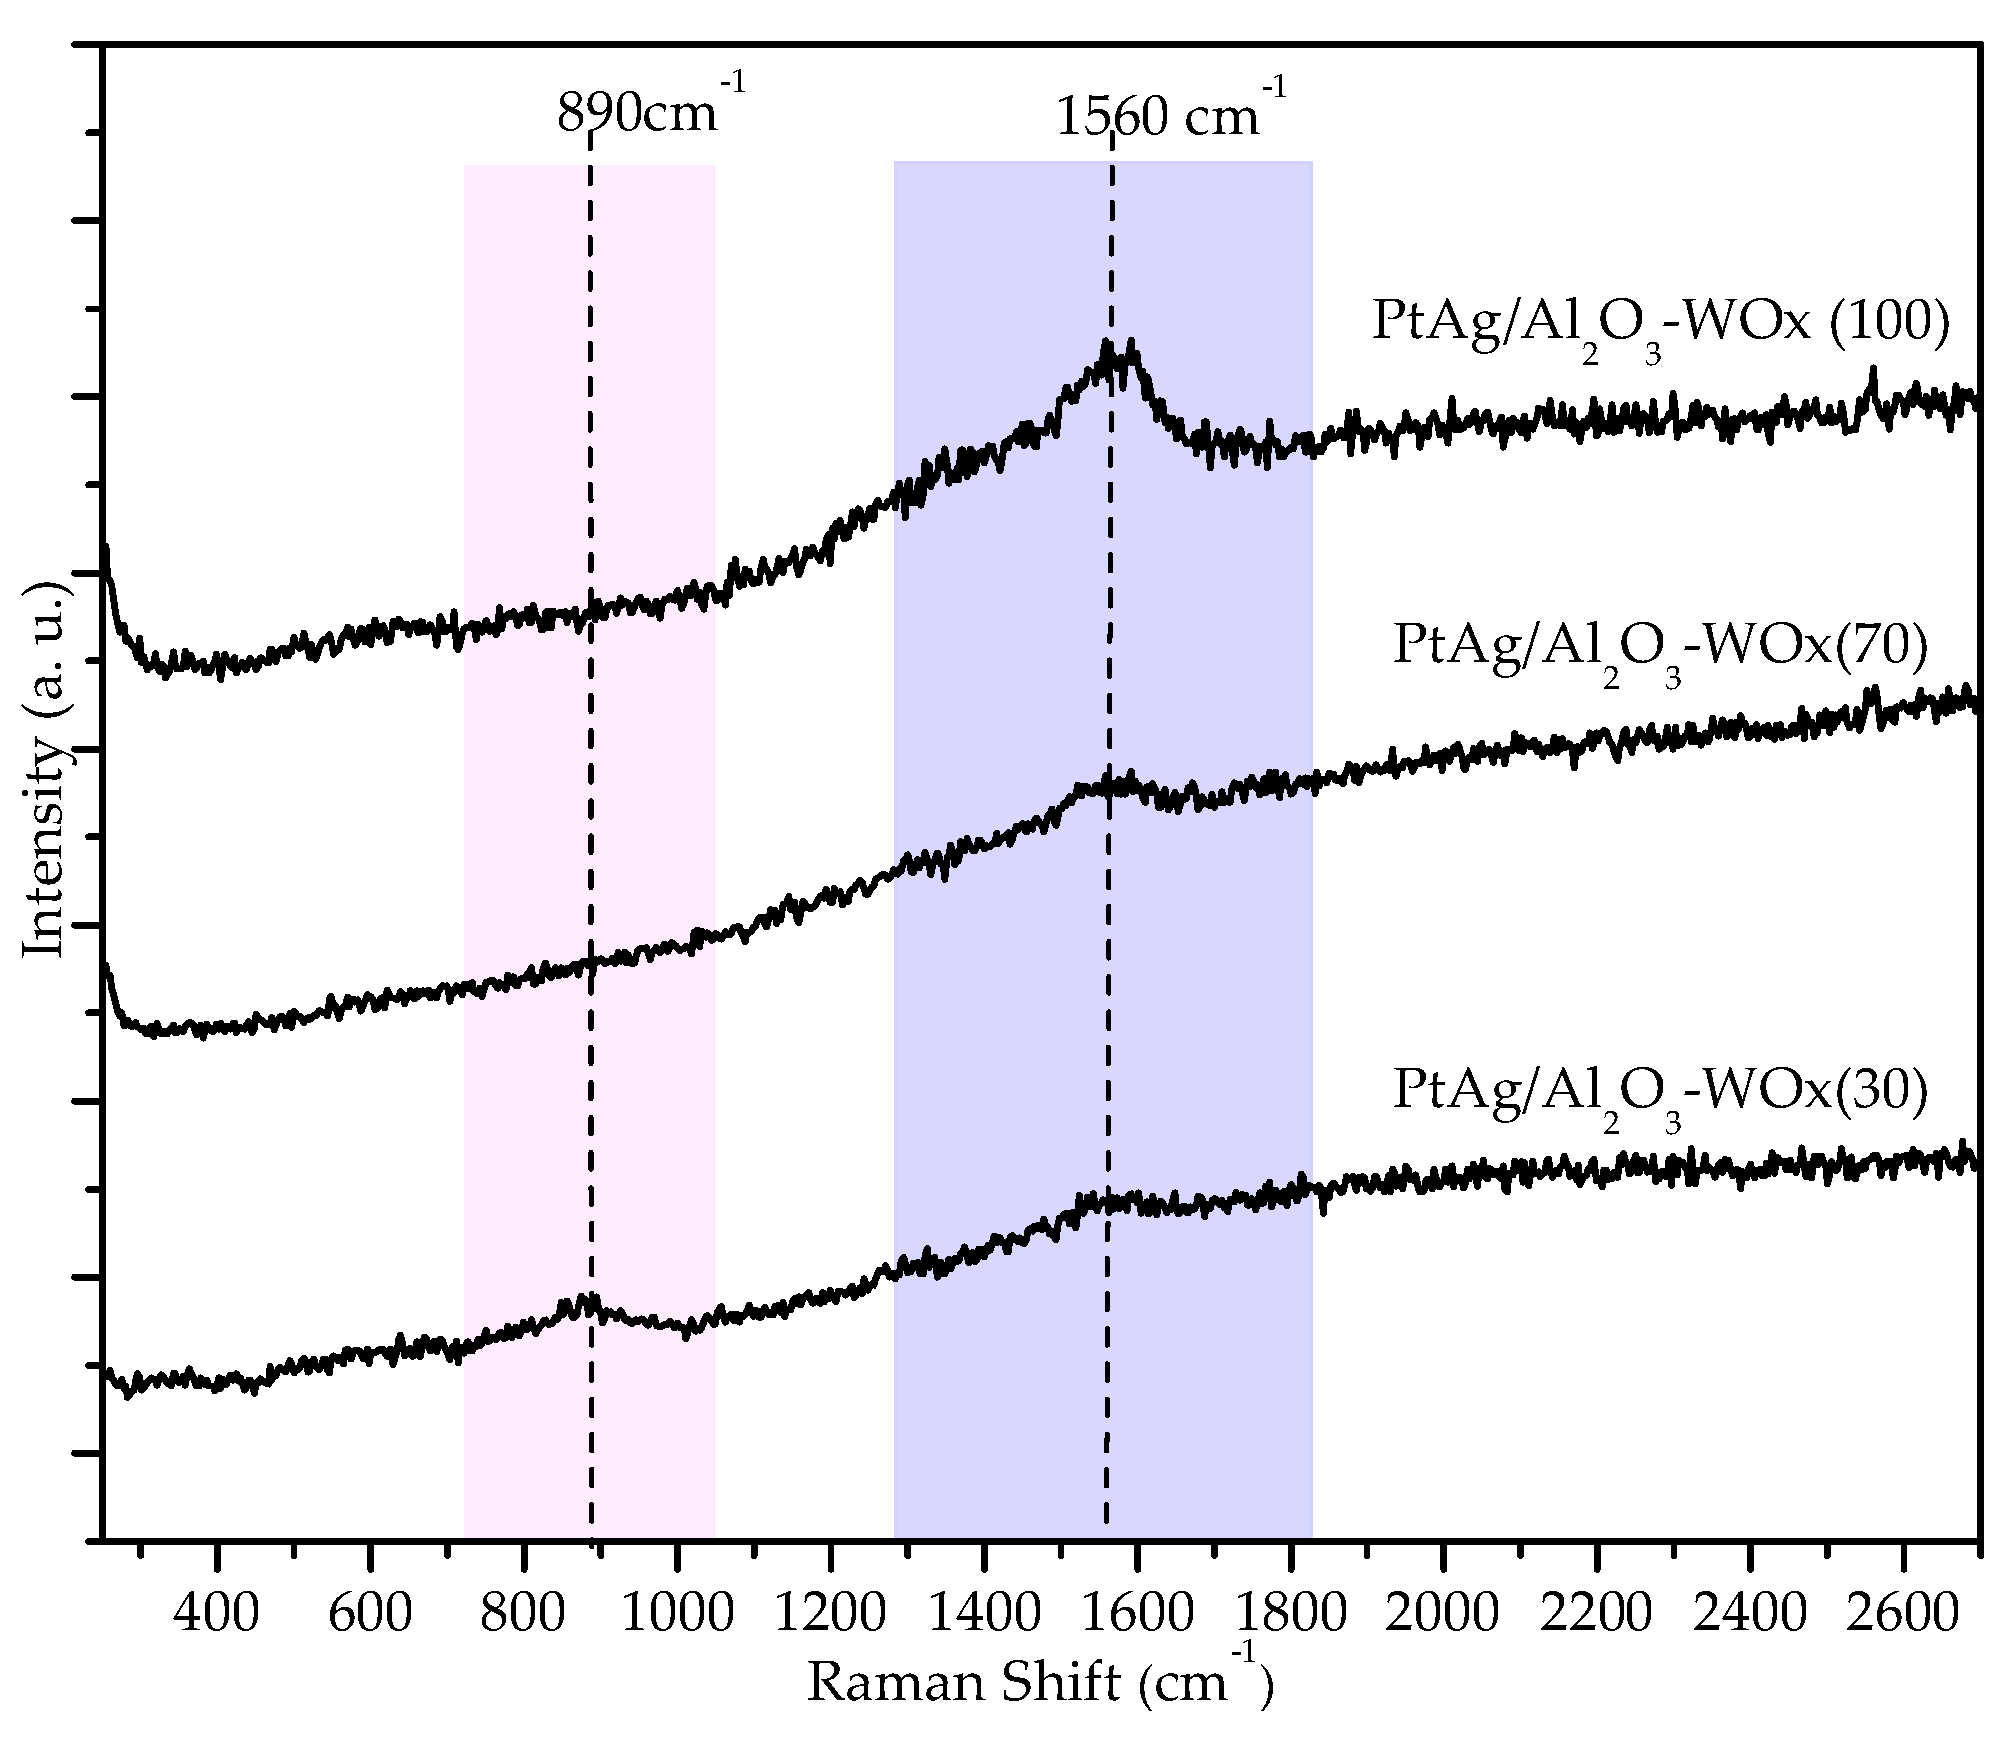
Figure 14.
(a) NO conversion on CAT.1 to CAT.6 catalysts; (b) Production of NO2 (ppm) for all the catalysts. Reaction conditions: gas mixture 750 ppm NO, 1750 ppm C3H8, 6%volO2, 600 ppm CO, 10%volCO2, 12%volH2O and N2. GHSV of 12,000 h-1 at 350°C for 4h.
Figure 14.
(a) NO conversion on CAT.1 to CAT.6 catalysts; (b) Production of NO2 (ppm) for all the catalysts. Reaction conditions: gas mixture 750 ppm NO, 1750 ppm C3H8, 6%volO2, 600 ppm CO, 10%volCO2, 12%volH2O and N2. GHSV of 12,000 h-1 at 350°C for 4h.
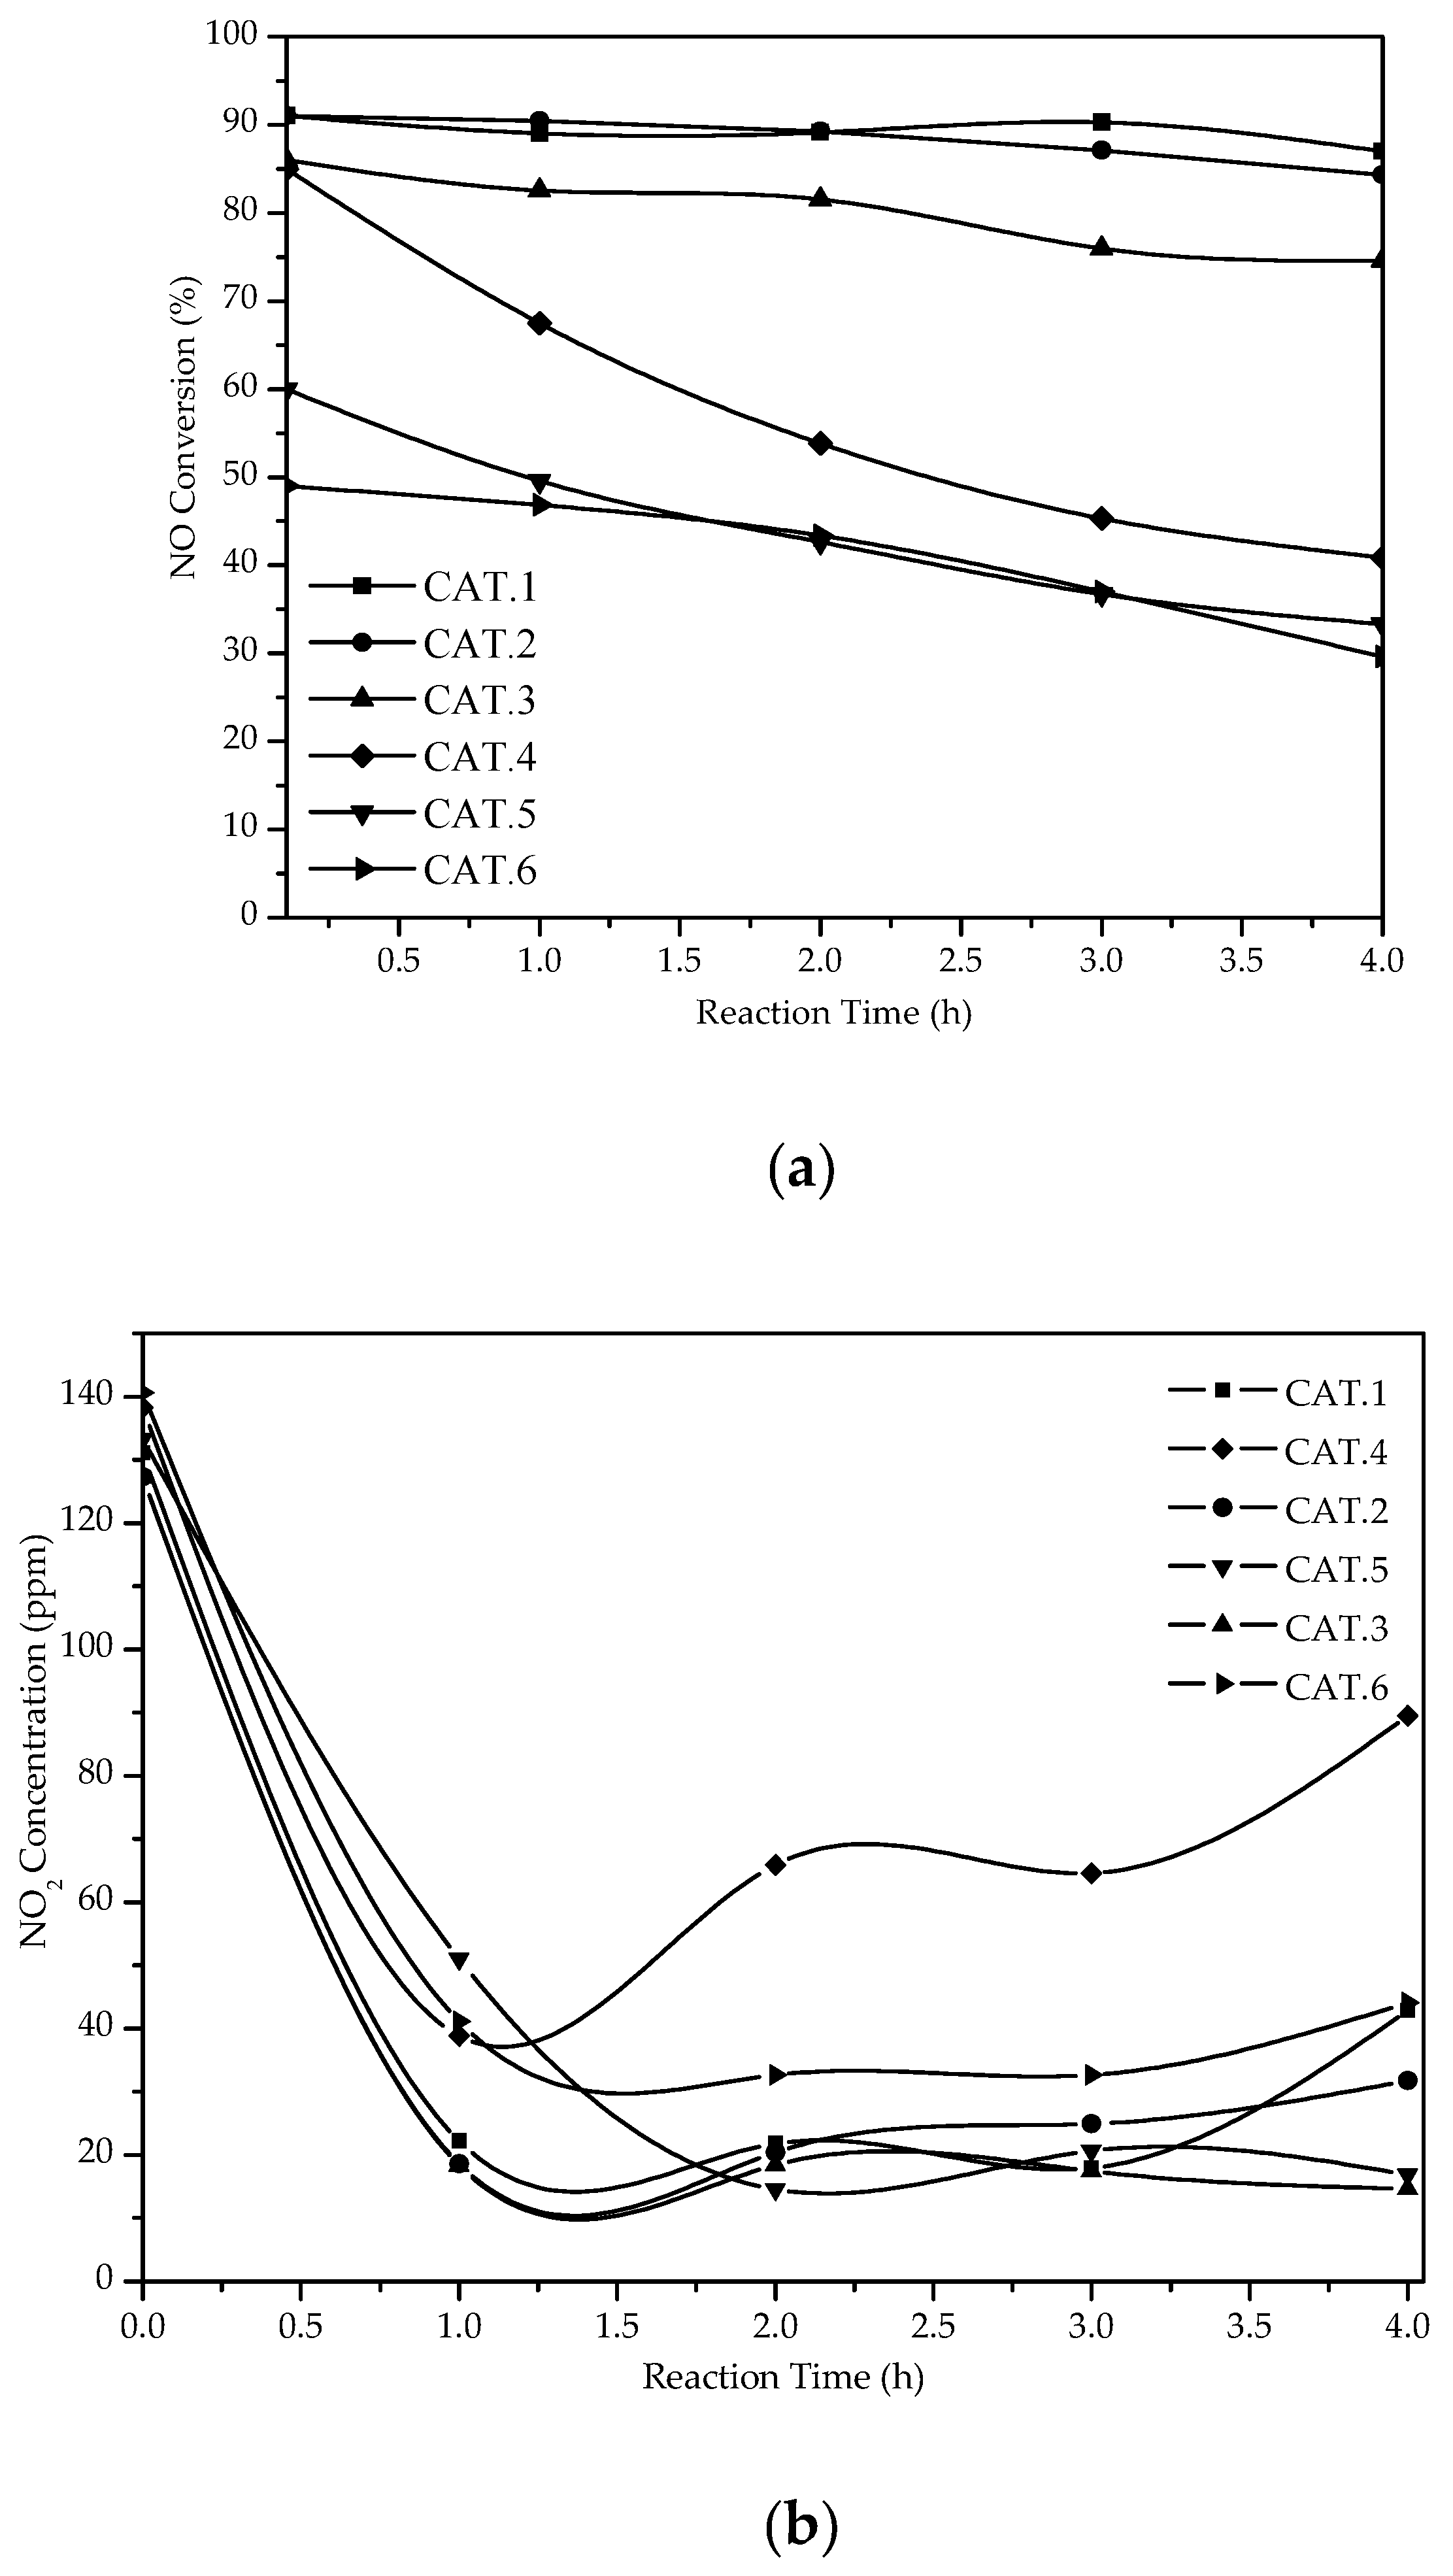
Figure 15.
Conversion of (a) NO, (b) C3H8 and (c) CO at the outlet of the monolithic reactor as a function of the reaction temperature using the CAT.1 catalyst. This catalyst was evaluated in the presence of 1%vol H2 in the inlet gas stream at three GHSV: 30,000 h-1, 70 000 h-1, and 100 000 h-1. Initial composition of the inlet gas: 750ppm of NO, 1750ppm of C3H8, 600ppm of CO, 10%vol CO2, 6%vol O2, 12%vol H2O.
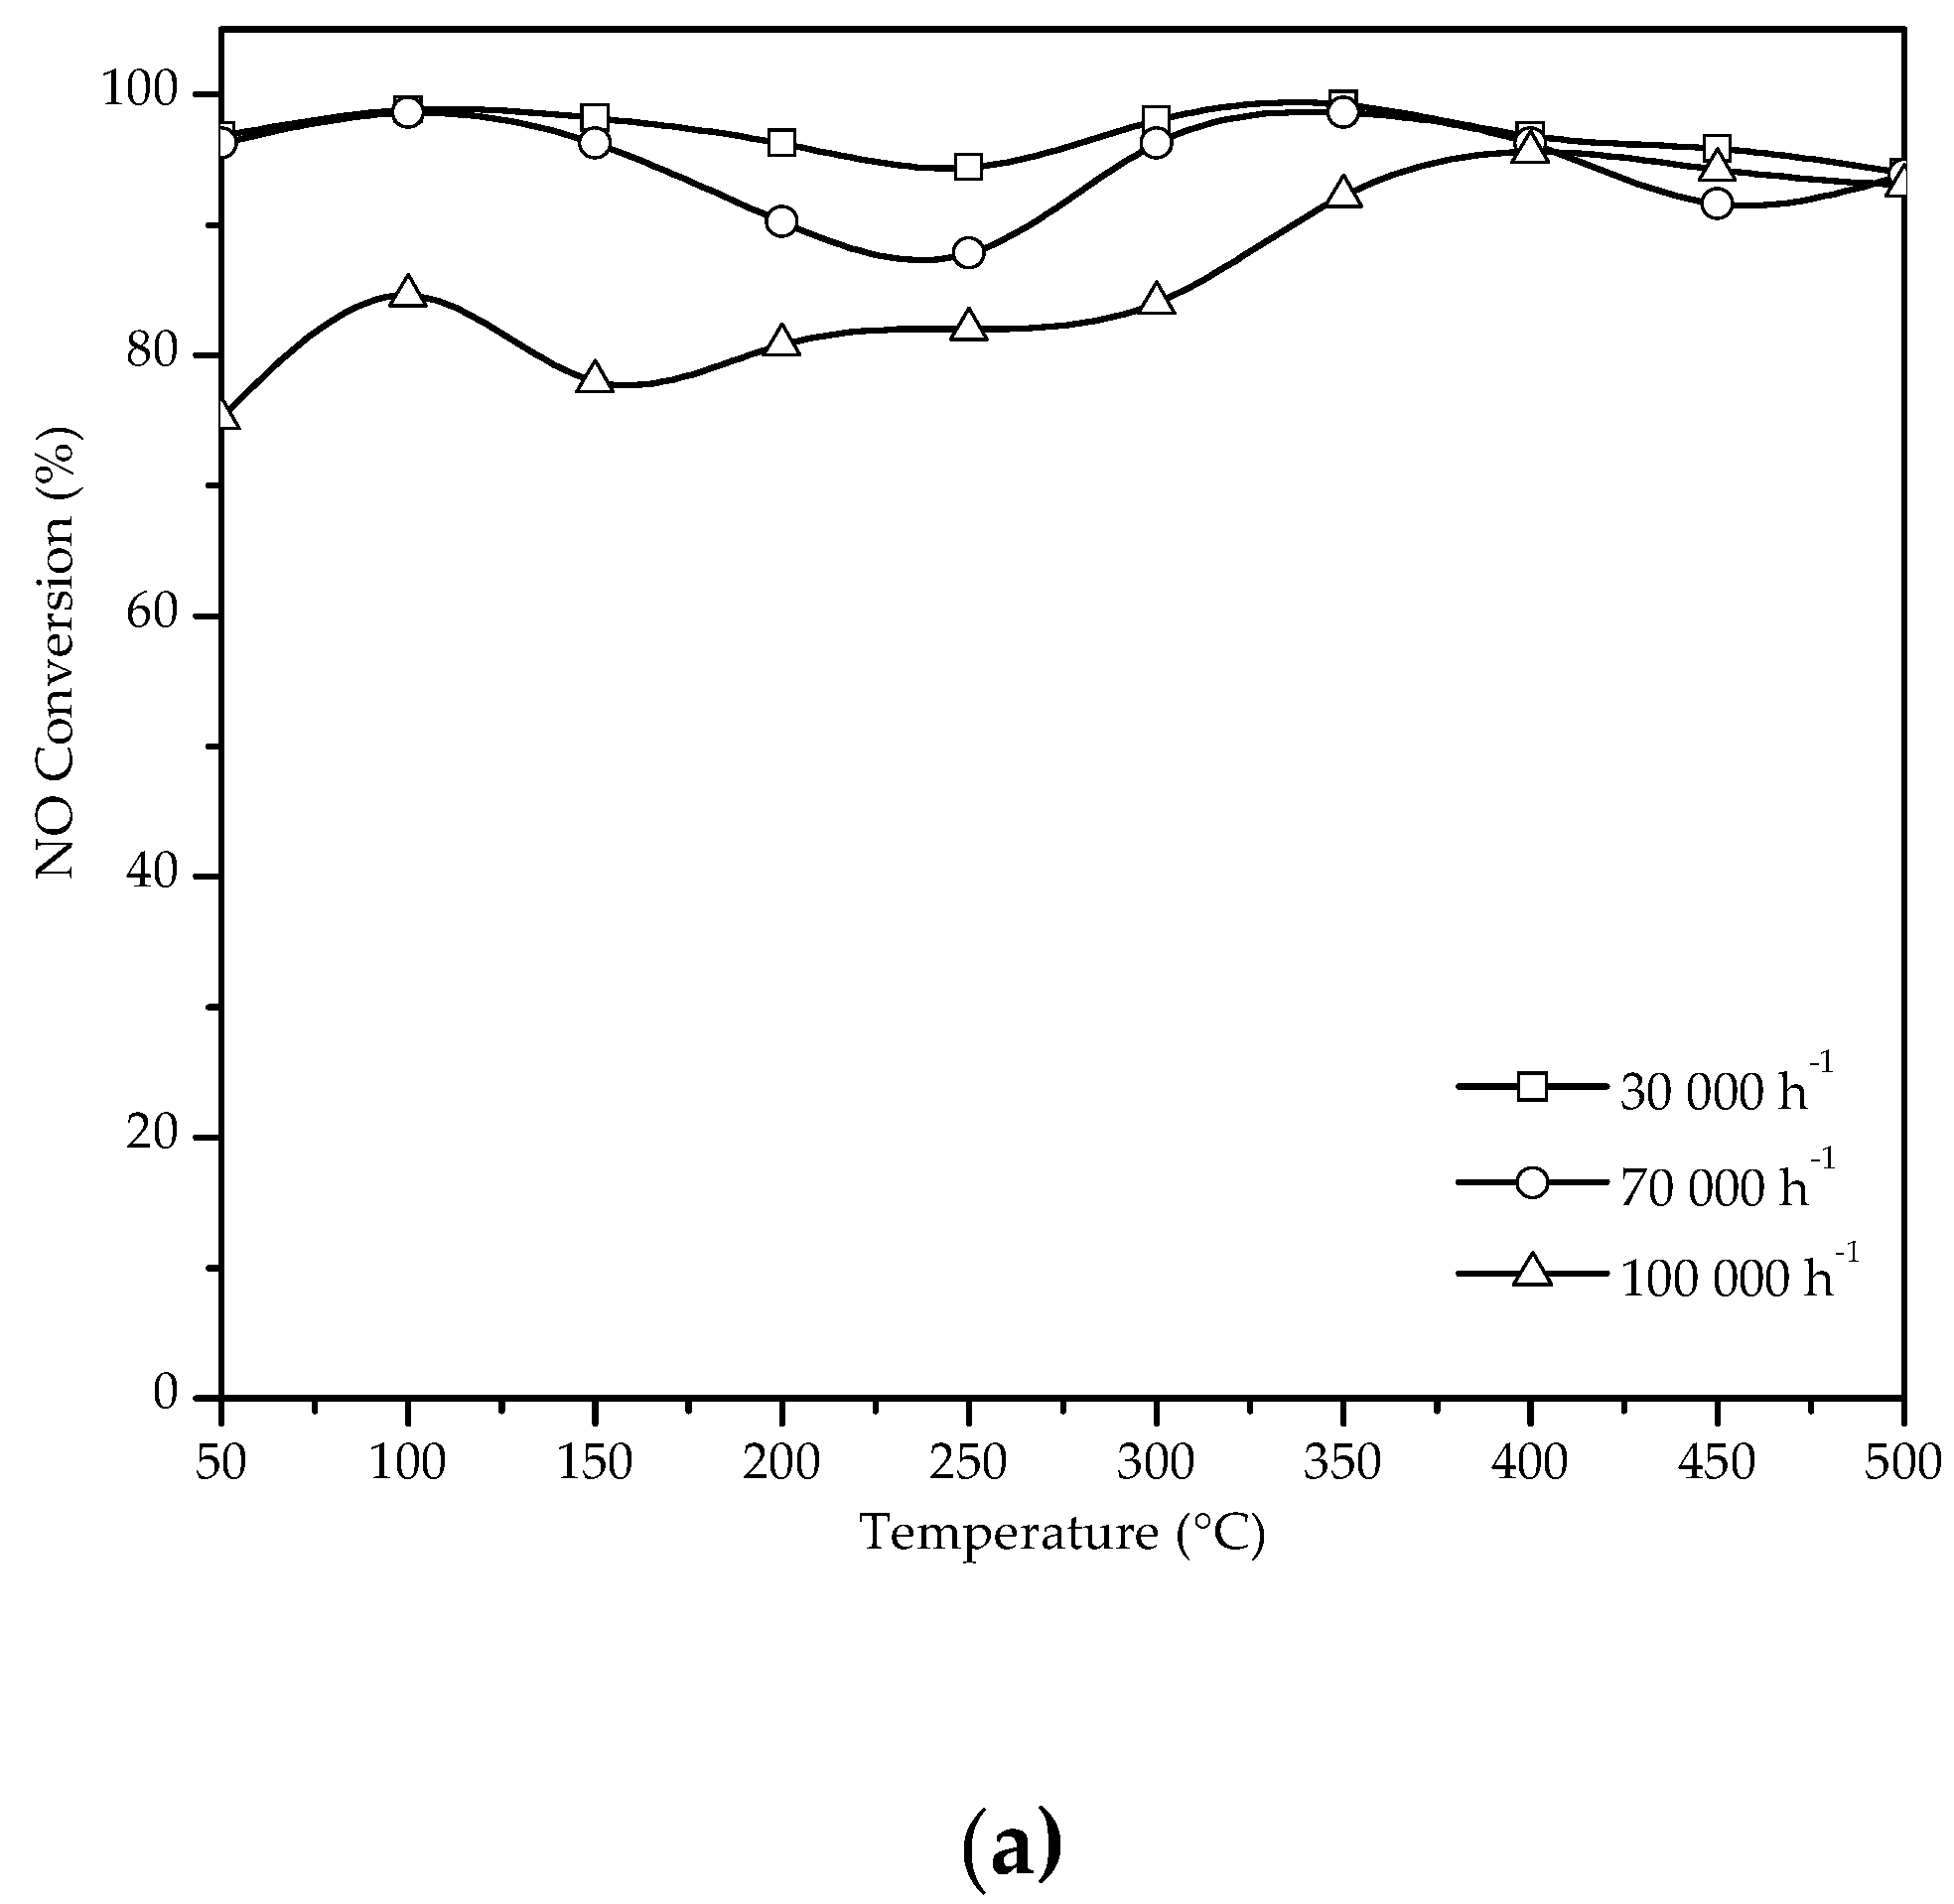
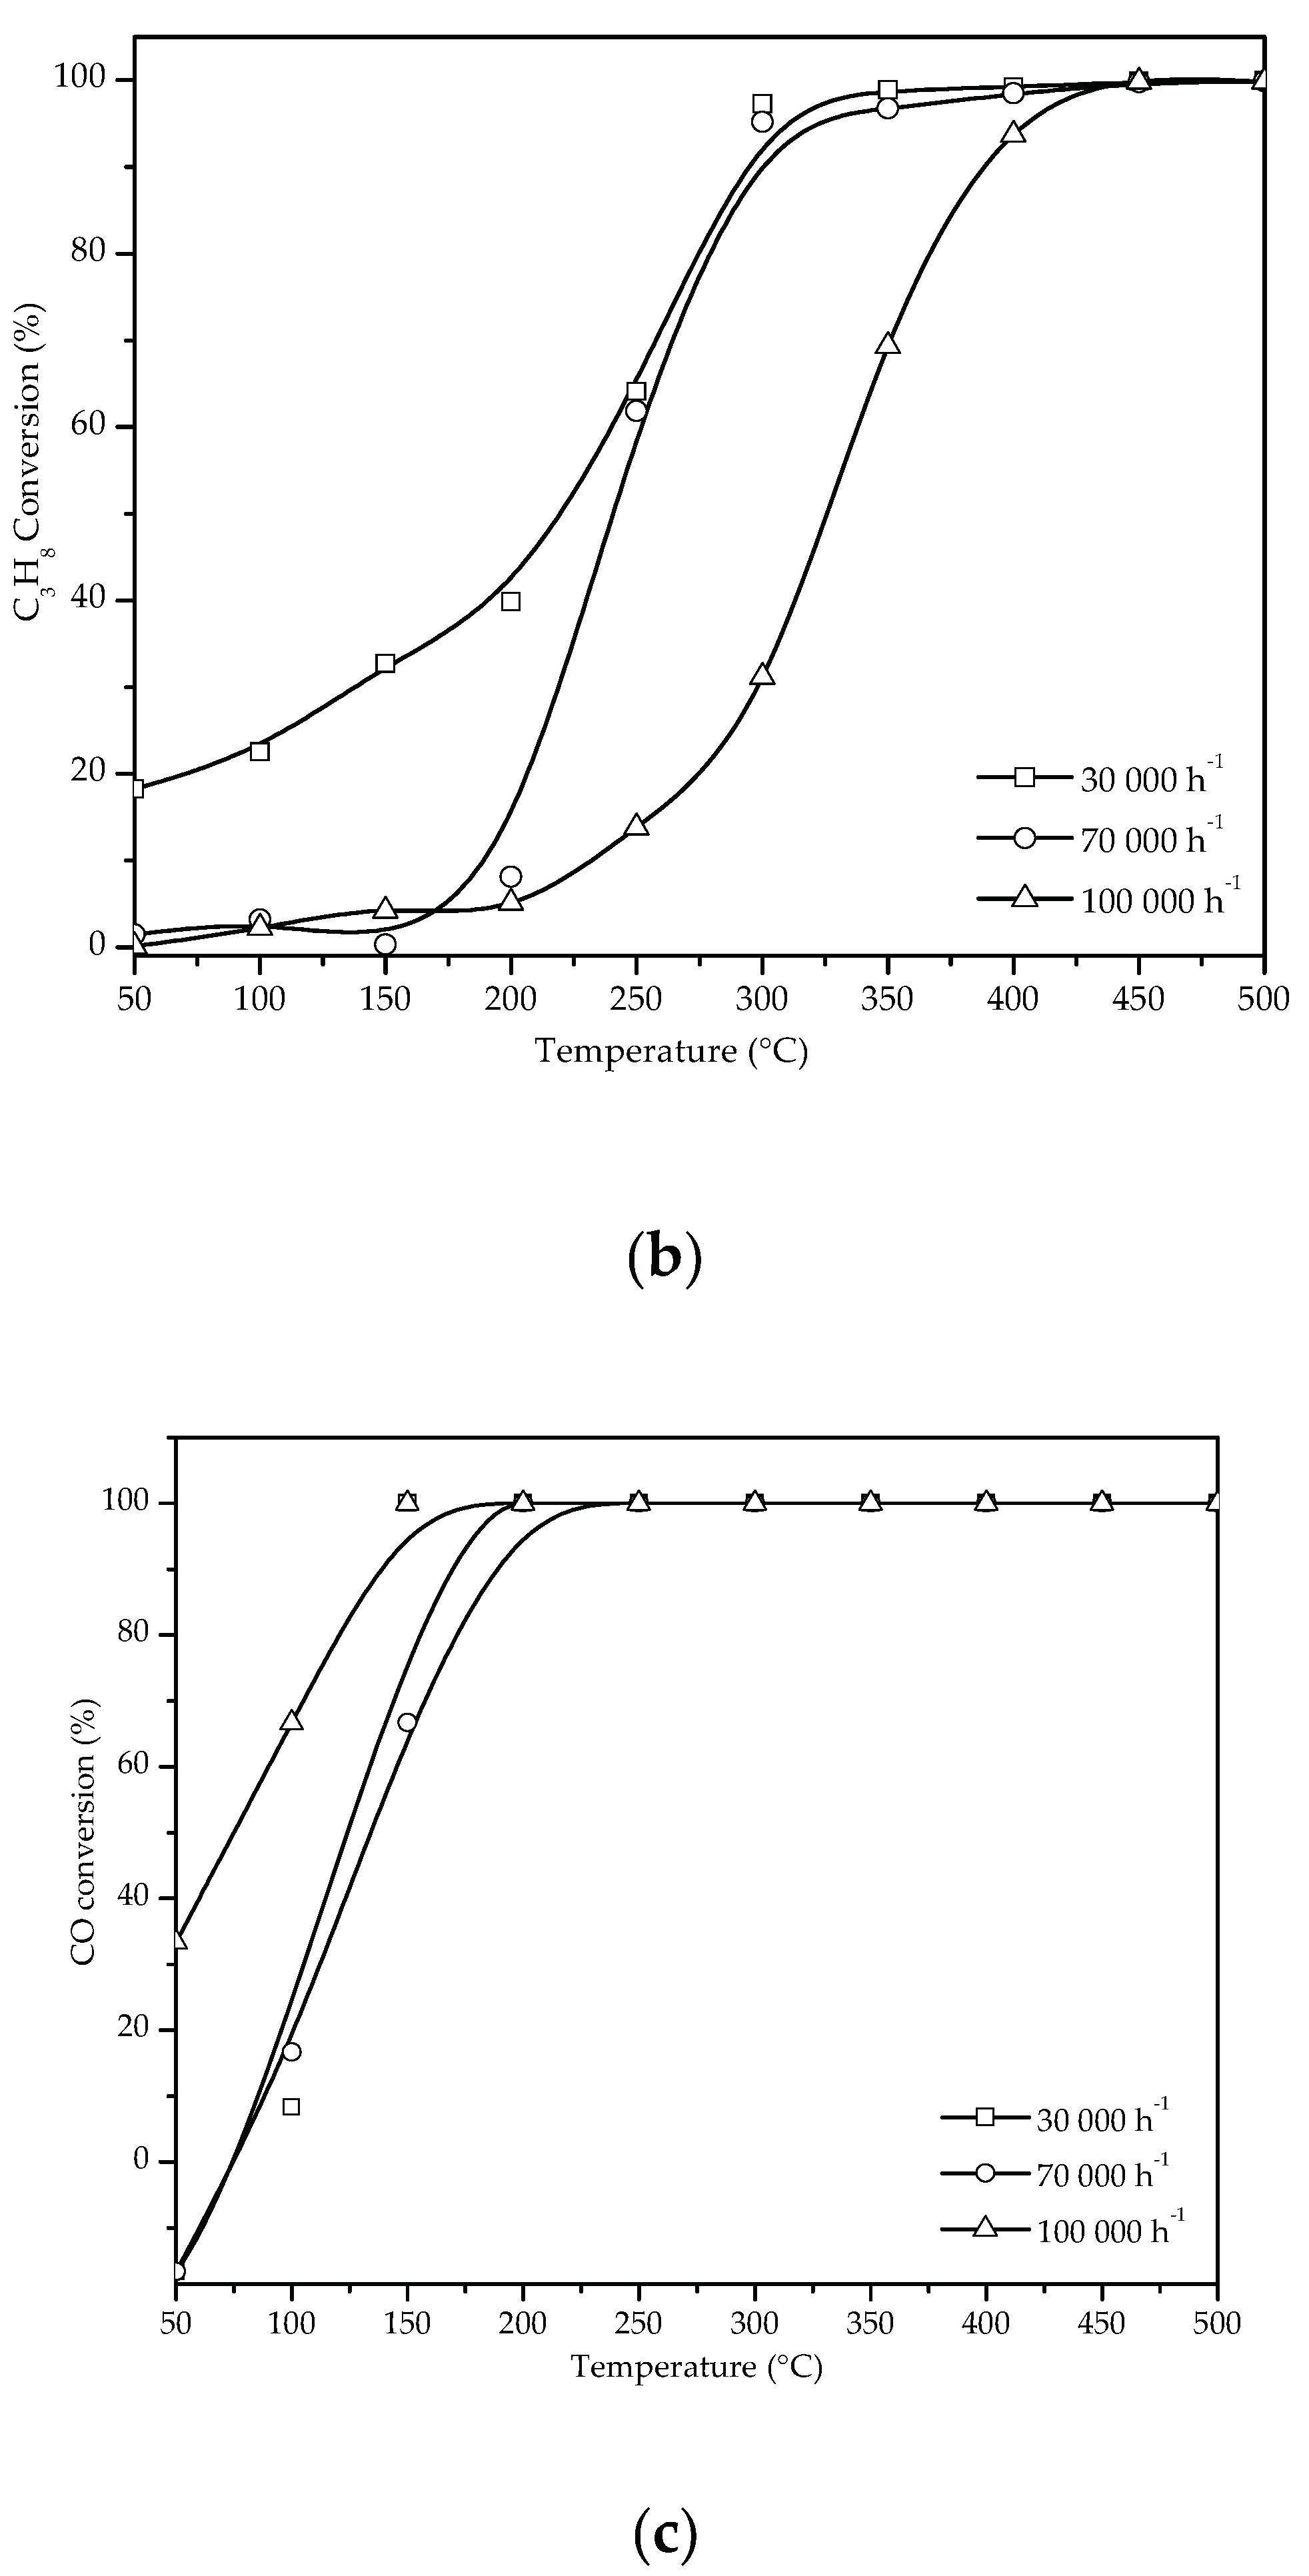

Table 1.
Texture and area properties of the catalysts/monoliths calcined at 500°C for 6 h, and after reaction in C3H8-SCR of NO at 350°C.
Table 1.
Texture and area properties of the catalysts/monoliths calcined at 500°C for 6 h, and after reaction in C3H8-SCR of NO at 350°C.
| Catalyst Name | Key | Calcined | Evaluated | ||||
|---|---|---|---|---|---|---|---|
| SBET(a) (m2/g) |
Vp(b) (cm3/g) |
Dp(c) (Å) |
SBET (m2/g) |
Vp (cm3/g) |
Dp (Å) |
||
| Al2O3-WOx/Cordierite | AW/CRTA | 55.89 | 0.09 | 28.59 | --- | --- | --- |
| 0.1Pt-2Ag/Al2O3-WOx /Cordierite | CAT.1 | 20.90 | 0.03 | 66.62 | 10.41 | 0.02 | 38.94 |
| 0.1Pt-2Ag/Al2O3-WOx /Cordierite | CAT.2 | 20.64 | 0.03 | 55.26 | 10.39 | 0.02 | 48.13 |
| 0.1Pt-2Ag/Al2O3-WOx /Cordierite | CAT.3 | 21.00 | 0.03 | 59.00 | 15.20 | 0.02 | 33.45 |
| 0.1Pt-2Ag/Al2O3-WOx /Cordierite | CAT.4 | 18.39 | 0.06 | 42.91 | 12.74 | 0.04 | 39.02 |
| 2Ag/Al2O3-WOx / Cordierite | CAT.5 | 47.55 | 0.07 | 63.58 | 26.33 | 0.04 | 32.43 |
| 0.1Pt-2Ag/Al2O3-WOx /Cordierite | CAT.6 | 25.54 | 0.04 | 39.00 | 12.91 | 0.03 | 36.65 |
Table 2.
Pt dispersion before and after catalytic evaluation. Reaction conditions: 750 ppm NO, 1750 ppm C3H8, 6%vol O2, 600 ppm CO, 10%vol CO2, 12%vol H2O and N2 mixture; GHSV of 12,000 h-1.
Table 2.
Pt dispersion before and after catalytic evaluation. Reaction conditions: 750 ppm NO, 1750 ppm C3H8, 6%vol O2, 600 ppm CO, 10%vol CO2, 12%vol H2O and N2 mixture; GHSV of 12,000 h-1.
| Catalysts | %DPt(a) | %DPt(b) |
| CAT.1 | 76.8 | 73.47 |
| CAT.2 | 70.8 | 34 |
| CAT.3 | 35.4 | 30.65 |
| CAT.4 | 25.3 | 23.41 |
| CAT.6(c) | 7.07 | 4.55 |
Disclaimer/Publisher’s Note: The statements, opinions and data contained in all publications are solely those of the individual author(s) and contributor(s) and not of MDPI and/or the editor(s). MDPI and/or the editor(s) disclaim responsibility for any injury to people or property resulting from any ideas, methods, instructions or products referred to in the content. |
© 2025 by the authors. Licensee MDPI, Basel, Switzerland. This article is an open access article distributed under the terms and conditions of the Creative Commons Attribution (CC BY) license (http://creativecommons.org/licenses/by/4.0/).
Copyright: This open access article is published under a Creative Commons CC BY 4.0 license, which permit the free download, distribution, and reuse, provided that the author and preprint are cited in any reuse.


