
Submitted:
02 November 2025
Posted:
03 November 2025
You are already at the latest version
Abstract
This study investigates the feasibility of incorporating shredded e-plastic waste as a partial replacement for coarse aggregates in unreinforced concrete such as concrete blocks. Cubes were produced with varying e-waste contents (0%, 10%, 15%, 20%, 25%, 30%) and tested for workability, density, compressive strength, thermal conductivity, water absorption, and dynamic modulus of elasticity. Results showed that increasing e-waste generally enhanced workability and thermal insulation while reducing density and stiffness. The 15% replacement mix demonstrated the most consistent overall performance, combining reliable mechanical strength with improved thermal resistance and reduced water absorption. At 30% replacement, significant weight reduction and insulation gains were observed, although structural integrity declined, making it more suitable for nonload-bearing or thermally focused applications. These findings highlight the potential of 15% e-waste replacement as an optimal solution for sustainable concrete, balancing strength, durability, and energy efficiency.
Keywords:
e-plastic waste
; coarse aggregate replacement
; concrete cubes
; workability
; density
; compressive strength
; thermal conductivity
1. Introduction
The issue of electronic waste (e-waste) presents a serious environmental challenge, driven by technological advancement and increasing demand for electronic devices. Discarded items, including phones and appliances, release toxic substances that threaten ecosystems and human health. Landfilling and incineration worsen these effects, while resource depletion reinforces the urgency for sustainable waste management solutions.
A promising approach involves incorporating e-waste components into concrete as partial replacements for conventional materials. This strategy diverts e-waste from landfills, reduces raw material consumption, and promotes environmental and economic sustainability. It aligns with circular economy principles and offers a practical solution within the construction sector.
Researchers have examined the integration of urban waste, such as rubber, brick, and e-waste, into concrete to enhance its performance. These materials have undergone rigorous testing, revealing improvements in strength, durability, and microstructural characteristics. Among them, plastic waste stands out for its capacity to enhance sustainability where recycling options are limited, reinforcing its value in modern construction.
The utilization of e-plastic waste as coarse aggregate in concrete has shown diminished bonding strength, leading to reductions in compressive, tensile, and flexural performance. However, 20% replacement yielded superior long-term tensile strength, and the inclusion of plastic enhanced ductility under extreme climatic conditions such as freeze–thaw cycles [1]. Life Cycle Assessment studies incorporating e-waste and ground granulated blast furnace slag (GGBS) reported lower mechanical strength due to poor interfacial bonding and increased porosity, though the addition of 10% fly ash significantly improved compressive strength. Optimal performance was observed with 20% e-waste aggregate replacement [2]. Similarly, partial substitution of coarse aggregate with 10% e-waste and the use of fly ash as a cementitious admixture enhanced 28-day compressive strength and ductility, in addition to increasing thermal stability across seasonal variations [3].
A mixture incorporating 5% e-plastic and 30% fly ash achieved optimum compressive strength, while fly ash notably improved split-tensile resistance, reduced water absorption, and lowered corrosion potential due to chloride penetration [4]. At 10–15% e-waste replacement levels, compressive, tensile, and flexural strengths were maintained or improved, with resistance to acid exposure also enhanced. However, beyond 15%, mechanical performance deteriorated sharply [5]. Polymer concrete, when infused with 15% e-waste, exhibited slightly reduced ultrasonic pulse velocity values and a sixfold increase in rapid chloride permeability, indicating elevated permeability levels. Sulfate attack resistance followed a similar trend of gradual decline with increasing e-waste content [6].
Concrete incorporating 0–10% e-waste as fine and coarse aggregates demonstrated decreased workability and density, primarily due to weak bonding and high water absorption. Nonetheless, the enhanced ductility enabled better performance in applications subject to thermal expansion or cyclic freezing [7]. Crushed printed circuit board (PCB) aggregates induced a progressive reduction in mechanical strength owing to reduced cohesion with the cement matrix, though mixes with up to 15% replacement exhibited satisfactory durability properties [8]. Flow characteristics were adversely affected by the sharp morphology of e-plastic waste (EPW), increasing viscosity and compaction demands. Nonetheless, fly ash improved workability, and overall density decreased with higher EPW content, albeit with compromised mechanical integrity and elevated thermal sensitivity due to plastic softening at high temperatures [9].
The impact of e-waste on slump behavior showed varied trends, contingent on the material type and morphology. While some e-waste inclusions improved flowability, others reduced it. Regardless, density consistently declined across mixes containing 10–50% plastic aggregates. Life Cycle Assessment studies were recommended to evaluate large-scale applicability [10]. Incorporating PCB fibers in M40-grade concrete significantly enhanced compressive, tensile, and flexural strength despite reduced workability. The resulting mix retained porosity and presented a cost-effective strategy for disposing of e-waste while enhancing structural performance [11]. Concrete integrating 30% e-waste aggregates and polypropylene fibers (PPF) experienced increased porosity and chloride penetration. While PPF enhanced mechanical strength, the e-waste reduced it. Pozzolanic additives were suggested to compensate for the adverse effects [12].
Carbon-fiber-reinforced polymer (CFRP) confinement significantly enhanced strength, axial strain, and ductility in e-waste concrete, particularly in circular specimens where stress concentration was minimized. Dual CFRP layers outperformed single wraps, offering robust structural reinforcement [13]. The complexity of recycling e-waste plastics, primarily due to the presence of brominated flame retardants (BFRs), necessitates alternative uses. Substituting conventional aggregates with these plastics presents a sustainable and cost-efficient solution. Small-scale upcycling plants producing high-value products like “Grenew carbon” reflect progress in this direction [14]. In the construction and demolition sector, e-waste items such as cables and solar panels present hazardous challenges. Integrative reviews emphasized the importance of policy development, stakeholder cooperation, and circularity frameworks for efficient e-waste management [15].
Incorporating polypropylene (PP) and polyvinyl chloride (PVC) fibers from e-waste into hybrid concrete mixtures led to a 56% increase in compressive strength, albeit with a 40% slump reduction. These fibers enhanced crack-bridging and overall durability [16]. Self-compacting mortars (SCM) reinforced with e-waste fibers and blended with para-wood ash and calcium carbonate revealed that 5% e-waste fiber content optimized mechanical performance. Elevated fiber content, however, led to fiber clustering, void formation, and reduced strength, as confirmed by SEM analysis [17]. Polypropylene structural fibers in e-waste concrete, when confined with GFRP and CFRP, significantly improved axial load-bearing capacity post-repair. CFRP wraps effectively mitigated spalling, core crushing, and bar buckling. A theoretical model accurately predicted these behaviors [18].
Acrylonitrile butadiene styrene (ABS) plastic from WEEE, when used to partially replace traditional aggregates, enhanced compressive strength up to a specific threshold, beyond which mechanical performance declined. Meanwhile, overall density decreased and water absorption rose due to the porous nature of e-waste [19]. E-waste, comprising approximately 60% metals, 15% plastics, and 5% composite materials, poses serious environmental and health hazards through the release of heavy metals and persistent organic pollutants. Mechanical recycling methods remain costly and inefficient, but incorporating e-plastics in concrete enhances durability and structural resilience while supporting circular economy principles [20].
2. Materials and Methods
This chapter is systematically organized into three main sections. The first section focuses on the preliminary testing of raw materials, incorporating procedures such as sieve analysis, Los Angeles abrasion, and sand equivalent tests, to ensure compliance with standard quality benchmarks. The second section outlines the core experimental procedures conducted on concrete specimens, guided by relevant ASTM standards, including compressive strength, thermal conductivity, and water absorption, among others, to evaluate the mechanical and durability performance of the mixes. The third section details the adopted concrete mix design methodology, specifying the types and proportions of materials used, the calculation of total masses and volumes, and the incorporation of varying e-waste replacement ratios to determine the optimal balance between performance efficiency and material sustainability.
2.1. Materials
Concrete is a composite material consisting of several essential components, each with a specific role in achieving desired properties. Cement serves as the primary binding agent, initiating the hydration process and forming the hardened matrix that holds the mix together. Fine aggregates fill the voids between coarse particles, improving density, strength, and overall workability. Coarse aggregates provide the main load-bearing capacity, contributing significantly to the compressive strength of the concrete. Water activates the chemical reactions necessary for hydration and ensures the proper consistency of the mix. Prior to use, all raw materials undergo detailed classification and testing to verify their compliance with engineering-grade quality requirements. The coarse aggregates and their e-waste replacements used in the mixtures are presented in Figure 1.
2.1.1. Sieve Analysis
The purpose of this test is to determine the particle size distribution of fine and coarse aggregates through a standard sieve analysis [21].
The moist gravel sample was oven-dried at 110 ± 5°C for three days until a constant mass was achieved, ensuring complete moisture removal. A 2 kg portion of the dried sample was sieved using a mechanical shaker for 10 minutes, with sieves arranged in descending mesh size. The cumulative mass retained and corresponding percentage passing were then calculated to establish the grain size distribution curve, as illustrated in Figure 2.
The characteristic diameters obtained were D₆₀ = 26.65 mm, D₃₀ = 24.92 mm, and D₁₀ = 22.91 mm, yielding a uniformity coefficient Cu = 1.16 and a coefficient of curvature Cc = 1.02. Despite Cc falling within the acceptable range (1–3), Cu < 4 indicates a narrow range of particle sizes, classifying the material as poorly graded gravel (GP). The calculated fineness modulus (FM) was 8.75, a value consistent with typical coarse aggregate gradation, further confirming the grading assessment.
As with the gravel, the moist sand was oven-dried at 110 ± 5°C until a constant mass was achieved, thereby ensuring the removal of excess moisture. A 2 kg sample of the dried sand was then subjected to a sieve analysis using a stack of sieves arranged in descending mesh sizes. The sample was vibrated for 10 minutes, after which the cumulative mass retained on each sieve and the corresponding percentage passing were calculated to construct the grain size distribution curve shown in Figure 3.
The results yielded D₆₀ = 0.694 mm, D₃₀ = 0.305 mm, and D₁₀ = 0.183 mm, with Cu = 3.79 and Cc = 0.73. Given that Cu < 6 and Cc < 1, the sand is considered poorly graded (SP), with a non-uniform and irregular gradation. The fineness modulus, calculated at 3.56, slightly exceeds the typical 2.3–3.1 range for standard sand, classifying it as coarse sand.
2.1.2. Water Absorption of Aggregates
This test method covers the determination of the water absorption of aggregates, defined as the increase in mass due to water penetration into the pores of particles over a prescribed period, excluding surface moisture [22,23]. To evaluate this, a 3.291 kg dry gravel sample was soaked and brought to Saturated Surface Dry (SSD) condition, yielding a mass of 3.321 kg and an absorption rate of 0.91%. Similarly, a 2.527 kg dry sand sample was fully saturated, surface-dried using cold air, and weighed 2.808 kg in SSD condition, corresponding to an absorption rate of 11.12%. In contrast, e-plastic waste was assumed to exhibit negligible or zero water absorption.
2.1.3. Sand Equivalent
The purpose of this test is to assess the relative presence of clay-sized particles or plastic fines in fine aggregates passing the 4.75 mm sieve. The Sand Equivalent Test specifically evaluates the proportion of usable sand compared to finer contaminants like silt and clay, thereby determining the material’s cleanliness and suitability for concrete applications [24]. Two oven-dried 120 g sand samples were tested, yielding sand equivalent (SE) values of 65% and 67.35%, based on the ratio of the sand layer height (h₁) to the total height of the sample (h₂). The calculated average SE was 66.18%, which is generally considered acceptable for most construction applications, though some standards may require a minimum SE value of 70–75% for critical or high-performance uses.
2.1.4. Cleanliness of Gravel
This test method determines the amount of material finer than a 75-µm sieve in aggregate by washing [25]. A 3.291 kg dry sample of gravel was thoroughly washed over a 1.7 mm sieve to eliminate surface fines and debris, then oven-dried to a constant mass. The final weight recorded was 3.280 kg, resulting in a fines content of 0.33%. As this value falls well below the typical 2% limit, the gravel is considered relatively clean and suitable for use in structural-grade concrete applications.
2.1.5. Los Angeles Test
The purpose of this test is to measure the degradation of mineral aggregates due to abrasion, impact, and grinding in a rotating steel drum containing steel spheres [26]. A 5 kg dry sample was prepared by combining 2.5 kg of gravel retained between the 25 mm and 12.5 mm sieves and 2.5 kg retained between the 12.5 mm and 9.5 mm sieves. The sample was placed in the Los Angeles abrasion machine along with 11 steel balls and subjected to 500 revolutions. Following the test, the material was sieved through a 1.7 mm sieve, washed, and oven-dried at 110 ± 5°C until a constant mass of 3.768 kg was achieved. The resulting mass loss was calculated as 24.64%, which places the aggregate in the category of good to average quality.
2.2. ASTM Standards
2.2.1. Slump Workability Test
The purpose of this test is to evaluate the consistency and workability of freshly mixed hydraulic cement concrete, in accordance with ASTM C143/C143M [27]. Workability influences how easily concrete can be placed, compacted, and finished. Concrete that is too stiff may hinder proper placement, while overly fluid mixes risk segregation and reduced durability. In this test, a dampened conical mold is placed on a flat, nonabsorbent surface and filled in three equal layers, each compacted with 25 strokes of a tamping rod. The top is leveled off, and the mold is lifted vertically in a steady motion over 5 ± 2 seconds without any twisting. The slump is determined by measuring the vertical distance between the top of the mold and the displaced center of the slumped concrete (see Figure 4). Slump classifications are as follows: S1 (10–40 mm), S2 (50–90 mm), S3 (100–150 mm), S4 (160–210 mm), and S5 (≥ 220 mm).
2.2.2. Density or Unit Weight of Concrete
The purpose of this test is to determine the density (unit weight) of fresh concrete and calculate its yield and cement content, in accordance with ASTM C138/C138M [28]. A metal container is filled in three layers, each compacted with 25 rods and tapped with a mallet to eliminate voids. After leveling the surface, the total mass is recorded. The density is then computed by dividing the net concrete mass by the container volume.
2.2.3. Compressive Strength Test
This test determines the compressive strength of cylindrical concrete specimens according to ASTM C39/C39M [29]. The specimen is positioned carefully in the testing machine, and load is gradually applied without shock. For hydraulically operated machines, the load increases at a controlled rate between 0.15 and 0.35 MPa per second until the specimen fails. The maximum load is recorded and used to calculate the compressive strength by dividing it by the specimen’s average cross-sectional area. This value is reported to the nearest 0.1 MPa, with observations made on the mode of failure and the concrete’s visual characteristics.
2.2.4. Thermal Conductivity Test
The purpose of this test is to determine the thermal conductivity (λ), which is the coefficient of proportionality between the heat flux (q) and the temperature gradient (∇T), expressed by the equation ∇T [30]. According to NF EN 12664, the test typically involves establishing a unidirectional heat flow by placing the specimen between two isothermal planes at different temperatures. Minimizing heat loss is essential and can be achieved using appropriate insulation or guard systems. One approach is the guarded hot plate method, where two identical samples are subjected to one-dimensional heat flow within a measurement zone surrounded by a guard zone. Alternatively, the flux metric method, which avoids guard zones, uses a single specimen to achieve thermal measurement. The experimental setup is shown in Figure 5.
2.2.5. Sorptivity of Concrete
The purpose of this test is to determine the rate of water absorption of concrete by measuring the increase in mass over time with one surface exposed to water, following ASTM C1585 [31]. Specimens are first conditioned for 15 days in a sealed environment, then sealed with epoxy on all surfaces except the bottom, as depicted in Figure 6. Following preparation, each specimen is partially immersed in water with its base in contact, and mass measurements are taken at regular intervals over a period of 7 days. The resulting data are used to calculate the absorption rate and plot its progression over time.
2.2.6. Dynamic Modulus of Elasticity
This test determines the velocity of longitudinal stress waves through concrete, which reflects its dynamic modulus of elasticity, based on ASTM C597 [32]. After verifying the equipment accuracy using a reference bar, a coupling agent is applied, and transducers are placed opposite each other on the specimen’s surface. The transit time is recorded while the distance between transducers is measured. The pulse velocity is then calculated as:
2.3. Mixture Design
The mixing process involved the preparation of conventional concrete cubes using a standard mix comprising cement, sand, gravel, and water. Coarse aggregates, specifically gravel, were progressively substituted with e-plastic waste by volume at varying replacement levels of 0%, 10%, 15%, 20%, 25%, and 30%. The e-plastic particles used passed through the 9.5 mm sieve, with a minor presence of associated fine powder, ensuring compatibility with the size range of the conventional gravel. All components were proportioned by weight, with each material individually weighed prior to mixing.
The compressive strength of the concrete mix, denoted as f’c, is targeted between 17.5 and 22.5 MPa using the conventional mix with 0% e-waste replacement. This mix establishes a baseline where the quantities of cement, sand, and water are fixed based on calculated proportions. Subsequently, the percentage of coarse aggregates is partially replaced with e-waste by volume. Table 1 presents the material quantities used per cubic meter for the standard concrete mix, based on a volumetric ratio of 1:1.5:3 (cement:sand:gravel), designed to achieve a compressive strength of approximately 20 MPa.
For each of the previously outlined procedures, a defined number of specimens with specific dimensions and volumes is prepared and tested. The slump test is conducted on fresh concrete without requiring volume calculations, as the same concrete batch is subsequently used to cast the test cubes. Compressive strength testing, particularly the determination of f’c, is carried out on three cubes per mixture at 7 and 28 days, totaling 36 specimens (15 cm × 15 cm × 15 cm; 0.003375 m³ each). Thermal conductivity tests are performed on two cubes per mixture after 28 days, resulting in 12 specimens of the same volume. Water absorption tests are conducted on two half-cubes per mixture after 28 days, producing 12 specimens with dimensions of 15 cm × 15 cm × 7.5 cm and a volume of 0.0016875 m³ each. To ensure an adequate supply of material and prevent shortages during testing, an additional 20% safety margin is applied to the calculated total volume required for each e-waste replacement level. The required aggregate masses for each concrete mixture per 1 m3 are determined based on the replacement level, as shown in Table 2.
During the mixing process, the absorption values and moisture content of sand and gravel are taken into account to determine the effective water-to-cement ratio. Since both aggregates are used in a moist condition, the amount of added water is reduced to bring them to a saturated surface dry state. The initial conventional mix begins with 4.4 kg of water, but after several trials, an acceptable slump of 7.5 cm is obtained using 8.9 kg. The final effective W/C ratio is calculated as 0.512, falling within the recommended range of 0.4 to 0.6 (see Table 3).
Finally, the total quantities of each component such as the masses of e-waste, gravel, sand, cement, and water are determined by summing their respective masses and volumes. The values in Table 4 represent the final material requirements for each concrete mix, ensuring accuracy in both proportioning and batching.
3. Results
A comprehensive series of tests was performed on concrete cube specimens incorporating e-plastic waste as a partial replacement for coarse aggregates to evaluate their physical and mechanical behavior under controlled laboratory conditions. Ambient temperature was maintained at 23 ± 5 °C with relative humidity of 50 ± 10%. To ensure accuracy and reliability, each test was repeated multiple times. The properties assessed include workability, fresh and cured density, compressive strength, dynamic elastic modulus, thermal conductivity, water absorption, and dynamic elastic modulus. These characteristics are essential for determining the suitability of the modified concrete for various construction applications, ensuring an optimal balance between strength and durability.
3.1. Slump Workability Test
As noted earlier, the initial water-to-cement (W/C) ratio was 0.3, but after several mixing trials and slump tests, an acceptable slump of 7.5 cm was achieved for the 0% control mix by adjusting the W/C ratio to 0.512. For each concrete mix with varying e-plastic waste replacement levels, multiple slump measurements were taken. The average slump and standard deviation were calculated to assess the consistency and workability of each mix, with the results illustrated in the bar chart in Figure 7.
The findings show that replacing coarse aggregates with e-plastic waste did not significantly affect the slump or workability of the fresh concrete. Slump values across all replacement levels remained close to the 0% control, indicating stable workability. A slight increase in workability was observed with higher e-waste content, except for the 15% replacement, which showed a noticeable dip, matching the control mix’s workability. This anomaly could be due to localized variations in mixing or aggregate distribution at that level.
3.2. Density or Unit Weight of Concrete
In the construction industry, concrete density is typically measured in two forms: fresh concrete density and cured concrete density. In this study, cured density was categorized using 15 cm × 15 cm × 15 cm cubes.
Fresh concrete density was determined by filling a container of known volume with concrete in three evenly rodded layers. The net weight of the concrete was divided by the container’s volume to calculate density. Several measurements were recorded, and averages with standard deviations were calculated to ensure reliability. Figure 8 shows a clear decrease in fresh concrete density as the e-plastic waste content increases. This reduction follows a near-linear trend up to 15–20%, where densities stabilize, then declines again for 25% and 30% replacements, which display similar values.
For cured concrete, cubes with a constant volume of 0.003375 m³ were weighed after 7 and 28 days of curing to observe density changes over time. After 7 days, the density trend mirrored that of fresh concrete, with similar behavior around the 15–20% and 25–30% e-waste ranges. However, at 28 days, a more pronounced density decrease was seen from 0% to 15%, followed by a slight increase at 20%, exceeding the 10% mix, before declining linearly to the lowest density at 30% replacement, as presented in Figure 9.
Notably, some 28-day density values were lower than those at 7 days, contrary to the expected increase in density with curing time. This irregularity may result from environmental influences such as temperature variations and atmospheric conditions during curing.
3.3. Compressive Strength Test
Concrete cubes were tested under compression following the same procedure used for concrete cylinders, ensuring that the loading plate fully covered the cube’s surface. A circular plate with a 20 cm diameter was used to cover the 15 cm × 15 cm faces of each cube. Given that each face has a surface area of 0.0225 m², the compressive strength (f’c) was calculated by dividing the ultimate load by this area. The 7- and 28-day results are displayed in the graph in Figure 10.
After 7 days of curing, the compressive strength showed a general decline with increasing e-waste content, although the 15% mix maintained a strength nearly identical to the 0% control. Mixtures with 20% and 25% e-waste recorded strengths close to the 10% mix, while the 30% mix had the lowest strength. Concrete cube failure patterns for different e-waste replacement levels are shown in Figure 11.
At 28 days, a clearer bell-shaped trend was observed. Both the 10% and 15% mixes exceeded the control mix in strength, with the 15% mix achieving the highest value. Beyond this point, compressive strength gradually declined, reaching its lowest level at 30% replacement.
3.4. Thermal Conductivity Test
The flux metric method was used to assess the thermal performance of the concrete cubes depicted in Figure 12. In this setup, a single sample is placed between two plates connected to water tanks—one heated to produce a hot plate and the other kept at room temperature to act as a cold plate. A thermocouple is attached to each surface of the specimen, along with a heat flux sensor on each side. The fluxmeters provide voltage readings, which are converted to heat flux (W/m²) using the sensor sensitivity: 62.51 μV/W·m² and 59.85 μV/W·m², depending on the wire type.
To reduce lateral heat losses and maintain unidirectional flow, an insulating sheet was wrapped around the sides of the specimen. The system was allowed to reach thermal steady state, with flux and temperature measurements taken at 10-minute intervals. Only the final 20% of these stabilized readings were used to calculate thermal resistance (R) and conductivity (λ).
The thermal resistance R (K.m2/W) of the sample is calculated using the equation below. This has to be calculated once the temperatures and heat flow stabilize and reach convergence.
For a sample with a thickness e (in m), the thermal conductivity λ (W/m.K) can be deduced using the following equation:
The graph in Figure 13 displays the thermal conductivity of concrete cubes after 28 days of curing. As e-waste content increased, thermal resistance also increased, reflecting a corresponding decline in conductivity due to their inverse relationship. Conductivity dropped nearly linearly from 0% to 15%, stabilized at 20%, and then decreased further to reach its lowest value at 30%. This progression mirrors the reduction in density, confirming that lighter concrete exhibits improved thermal insulation when e-plastic waste is used to partially replace coarse aggregates.
3.5. Sorptivity of Concrete
Due to equipment availability, the standard 10 cm diameter × 5 cm height cylinder was replaced with a rectangular prism measuring 15 cm × 15 cm × 7.5 cm, commonly referred to as a half-cube. Drying was carried out in a standard oven at 50 ± 5°C for three days and considered complete once the change in mass over 24 hours was less than 0.5% (see Figure 14). After drying, the specimens were stored in sealed plastic bags for three additional days to simulate environmental humidity conditions, as no humidity chambers were used.
The bottom surface of each specimen was coated with epoxy to define a 10 cm × 10 cm contact area, aligning with standard capillary absorption testing procedures. All four vertical sides were also coated to prevent lateral ingress, while the top surface remained uncoated for specimen identification.
Specimens were placed on a raised wire mesh, with water maintained at a constant level 2 cm above the mesh to ensure contact with only the bottom face. Absorption at each time interval was calculated by dividing the change in mass by the product of the contact area (100 cm²) and the density of water, taken as 1 g/cm³.
Water absorption results with varying e-waste replacement percentages are shown in the graph in Figure 15. Up to 20% e-waste, the initial absorption rates were relatively similar. However, the 25% and 30% mixtures exhibited higher absorption during the first 6 hours. After this stage, the 0%, 15%, and 20% mixes followed a similar trend, while the 10% mix recorded the lowest secondary absorption. The 25% mix stabilized around mid-range values, whereas the 30% mix showed the highest and most rapid absorption throughout the test.
3.6. Dynamic Modulus of Elasticity
The dynamic modulus of elasticity was measured for each concrete mix to evaluate the effect of e-waste replacement on stiffness under rapid or vibrational loading. Unlike static (Young’s) modulus, the dynamic modulus reflects the material’s elastic behavior under high-frequency stress, offering insight into internal structural changes resulting from variations in aggregate composition.
In this study, it was calculated using pulse velocity values obtained in accordance with ASTM C597. These velocities, combined with measured concrete density and an assumed Poisson’s ratio of 0.2, were applied in the elastic wave equation:
Where V is the velocity in km/s, ρ is the concrete density in kg/m3, and n is the Poisson ratio taken as 0.2.
Measurements were taken on multiple points and faces of each 15 cm × 15 cm × 15 cm cube, and the results were averaged to reduce local variability and ensure isotropic material behavior. A constant volume of 0.003375 m³ and a path length of 15 cm were considered for calculations. The resulting values were plotted in the chart above.
The results in Figure 16 show a clear decline in dynamic modulus with increasing e-waste content. From 0% to 25%, the modulus dropped steadily in an almost linear manner, indicating a gradual reduction in stiffness. Beyond 25%, the decrease slowed, converging toward the lowest modulus value at 30% replacement.
4. Discussion
This chapter presents a comprehensive discussion of the experimental findings, highlighting the performance of various e-waste replacement percentages across a range of tested properties. These include mechanical aspects such as compressive strength, thermal behavior including conductivity and resistance, and additional characteristics such as workability, density, and water absorption. The aim is to elucidate the strengths and limitations associated with each mix proportion while identifying general trends. Table 5 depicts the overall findings, illustrating the differences observed across the mixtures.
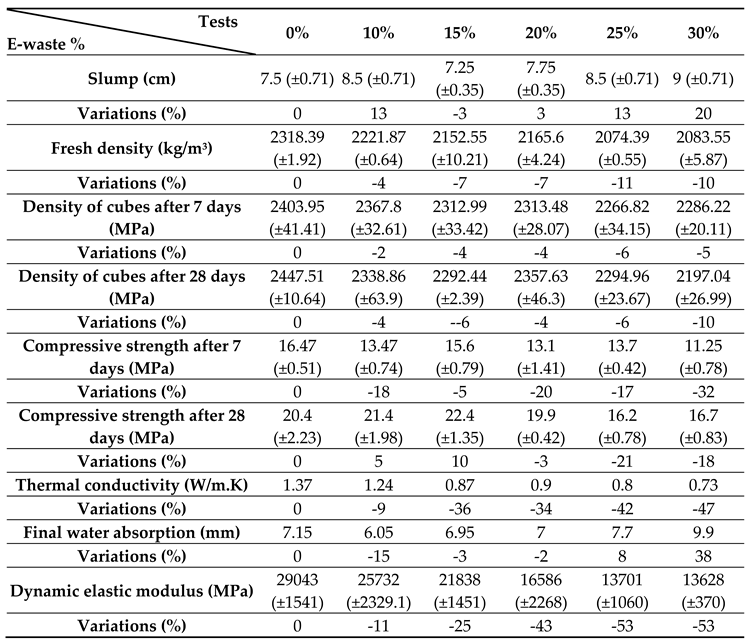
In terms of workability, the inclusion of e-waste exhibited a generally positive impact. The 10% and 25% mixes achieved a 13% improvement in slump relative to the control, while the 20% mix showed a modest 3% gain. A slight decline of 3% was recorded for the 15% mix. Most notably, the 30% replacement led to a 20% enhancement, marking the highest workability increase among all samples.
Regarding fresh density, the 10% replacement caused a 4% reduction compared to the control mix, attributed to the lower specific gravity of e-waste. Although the 15% and 20% mixes initially appeared denser during mixing, the fresh density trend ultimately declined with higher plastic content. Similarly, the cured density results showed a consistent decrease across all mixes. At 7 days, the cured density dropped by 2% for the 10% mix, 4% for both the 15% and 20% mixes, and approximately 5% for the 25% and 30% replacements. By 28 days, the reductions became more evident: the 10% and 20% mixes each exhibited a 4% decrease, the 15% and 25% replacements fell by 6%, and the 30% mix showed the most significant loss, with a 10% decline in cured density compared to the control.
The compressive strength outcomes reflected a similar balance of gains and losses. At 7 days, the 10%, 20%, and 25% mixes showed reductions between 17% and 20%, while the 30% replacement exhibited a 32% drop. The 15% mix was least affected, with only a 5% decrease. By 28 days, strength improved for certain mixes: the 10% replacement registered a 5% increase, and the 15% mix outperformed all others with a 10% gain over the control. In contrast, the 20% mix remained 5% below, and the 25% and 30% replacements recorded significant reductions of 21% and 18%, respectively. These results highlighted the 15% mix as the most structurally favorable composition.
Thermal properties improved consistently with the rise in e-waste content. A 9% increase in thermal resistance was observed at 10%, followed by a substantial 55% gain at both 15% and 20% levels. The 25% mix reached a 73% improvement, while the 30% replacement achieved the highest resistance, marking a 91% increase. This progression corresponded with a steady decrease in thermal conductivity. A 9% reduction occurred at 10%, dropping by 35% at 15% and 20%, and further declining to 42% and 47% for the 25% and 30% mixes, respectively. These findings affirm the insulating advantages of incorporating shredded plastic waste.
The water absorption behavior varied among mixes. The 10% e-waste concrete recorded the lowest absorption values throughout the test, indicating better resistance to moisture ingress. The 25% and 30% mixes exhibited higher initial absorption, although the 25% mix later aligned with the control during secondary absorption. Conversely, the 30% replacement consistently showed the highest absorption at all intervals, reflecting greater porosity and reduced compactness.
Finally, a clear reduction in the dynamic modulus of elasticity was observed with increased e-waste content. At 10%, 15%, and 20%, the modulus declined by 11%, 25%, and 43%, respectively. Beyond this point, the trend tapered, with both the 25% and 30% mixes converging at a 53% reduction. This steady decline in stiffness indicates that as e-waste content rises, the concrete becomes less capable of resisting elastic deformation, which may affect long-term structural performance.
It is important to note that while the findings of this study offer promising insights into the use of e-waste in concrete, they are based on specific laboratory conditions and material sources. Further large-scale and long-term testing is strongly recommended to validate the consistency and safety of these results. Practitioners should always consult relevant building codes, engineering standards, and local authorities before adopting such materials in construction projects. Responsible application and regulatory compliance are essential to ensure structural integrity and environmental sustainability.
5. Conclusions
This study explored the viability of substituting conventional coarse aggregates with e-waste at varying levels in concrete, assessing its effect on mechanical strength, thermal insulation, workability, density, water absorption, and dynamic modulus of elasticity. The results provide insight into the trade-offs and synergies introduced by e-waste incorporation across multiple performance parameters.
An inverse relationship between compressive strength and thermal conductivity was observed, as demonstrated in Figure 17, with the 15% substitution marking the point of optimal balance. At this level, compressive strength reached its peak while thermal conductivity showed a notable reduction, reflecting a highly efficient synergy between mechanical performance and insulation. Beyond 15%, both properties declined progressively, indicating a shift toward thermal efficiency at the expense of structural integrity.
The 15% and 10% mixes demonstrated the most favorable and balanced outcomes. The 15% mix showed remarkable compressive strength, strong thermal properties with a 55% increase in resistance and 35% drop in conductivity, modest workability, a beneficial density reduction, and a moderate 25% decline in dynamic modulus, highlighting its potential as a structurally reliable and sustainable alternative. The 10% mix offered improved workability, the lowest water absorption, minimal reduction in dynamic modulus, and moderate thermal performance, making it particularly appealing where cohesion, moisture resistance, and balanced stiffness are important.
Each percentage displayed specific strengths. The 20% mix provided excellent insulation, but with reduced modulus and moderate compressive strength. The 25% mix delivered the best workability, strong cube thermal performance, moderate absorption, and low dynamic modulus. The 30% mix excelled in thermal insulation with the highest resistance and lowest conductivity in cubes, the most improved workability, and the largest density reduction, but also showed the weakest compressive strength, highest absorption, and greatest modulus loss, making it more suitable for lightweight, non-structural applications.
As a reference, the 0% conventional mix served as the baseline, maintaining consistent mechanical properties but being surpassed in nearly all categories by e-waste mixes, particularly in thermal behavior and sustainability. In conclusion, the 15% mix stands out as the most well-rounded and structurally viable option, balancing strength, insulation, workability, and environmental value, and affirming the potential of e-waste as a functional and eco-conscious aggregate substitute in concrete production.
Author Contributions
Conceptualization, A.A and C.M.; methodology, A.A. and C.M.; software, A.A.; validation, A.A. and C.M.; formal analysis, A.A. and C.M.; investigation, A.A. and C.M.; resources, A.A. and C.M.; data curation, A.A. and C.M.; writing—original draft preparation, A.A. and C.M.; writing—review and editing, A.A. and C.M.; visualization, A.A.; project administration, A.A. and C.M. All authors have read and agreed to the published version of the manuscript.
Funding
This research received no external funding.
Institutional Review Board Statement
Not applicable.
Data Availability Statement
The original contributions presented in the study are included in the article, further inquiries can be directed to the corresponding author.
Acknowledgments
The authors would like to sincerely thank the Independent Works Regiment of the Lebanese Army, especially Brigadier General Youssef Haydar and Captain Mario Ibrahim, for their generous support, provision of facilities, and hands-on assistance throughout the concrete experimentation.
Conflicts of Interest
The authors declare no conflicts of interest.
Abbreviations
The following abbreviations are used in this manuscript:
| E-waste | Electronic waste |
| SEM | Scanning Electron Microscopy |
| ASTM | American Society for Testing and Materials |
| GGBS | Ground Granulated Blast Furnace Slag |
| PCB | Printed Circuit Board |
| EPW | Electrical Plastic Waste |
| LCA | Life Cycle Assessment |
| PPF | Polypropylene Fibers |
| CFRP | Carbon Fiber Reinforced Polymer |
| BFR | Brominated Flame Retardant |
| PP | Polypropylene |
| PVC | Polyvinyl Chloride |
| SCM | Self-Compacting Mortar |
| GFRP | Glass Fiber Reinforced Polymer |
| ABS | Acrylonitrile-Butadiene-Styrene |
| WEEE | Waste from Electrical and Electronic Equipment |
References
- Manjunath, B. T. A. (2016). Partial Replacement of E-plastic Waste as Coarse-Aggregate in Concrete. Procedia Environmental Sciences, 35, 731–739. [CrossRef]
- Goh, P. G., Maghfouri, M., Onn, C. C., & Loo, S. C. (2022). Life cycle assessment on recycled e-waste concrete. Case Studies in Construction Materials, 17, e01412. [CrossRef]
- Kumar, G., Bansal, T., Haq, M., Sharma, U., Kumar, A., Jha, P., Sharma, D., Kamyab, H., & Valencia, E. A. V. (2024). Utilizing E-Waste as a Sustainable Aggregate in Concrete Production: A Review. Buildings, 14(8). [CrossRef]
- Bamigboye, G. O., Effiong, J. U., Ede, A. N., Olukanni, D. O., Okoro, C. W., & Adebesin, J. A. (2024). Review of the use of E-waste in concrete production: Challenges and prospects. Emergent Materials, 7(3), 821–845. [CrossRef]
- Hinge, P., Shende, T., Ralegaonkar, R., Nandurkar, B., Raut, S., Kamath, M., Tantri, A., & Naganna, S. R. (2024). An assessment of workability, mechanical and durability properties of high-strength concrete incorporating nano-silica and recycled E-waste materials. Beni-Suef University Journal of Basic and Applied Sciences, 13(1), 65. [CrossRef]
- Aydın, M., & Bulut, H. A. (2024). Evaluation of the effect of E-waste on the permeability properties of polymer concrete composites and their behavior in aggressive environments. Archives of Civil and Mechanical Engineering, 24(3), 194. [CrossRef]
- Godihal, J. H. (2024). The Utilization of Electronic Waste to Produce Recycled E-Waste Aggregate Concrete. In R. K. Arya, G. D. Verros, O. P. Verma, & C. M. Hussain (Eds.), From Waste to Wealth (pp. 753–768). Springer Nature Singapore.
- Ramasamy, S., Soundararajan, E. K., Viswanathan, R., & Kaveripalayam Venkatachalam, B. K. (2024). An analysis of the durability features and strength of the E-waste concrete. Matéria (Rio de Janeiro), 29(2), e20240108. [CrossRef]
- Altawaiha, H. (2024). A review on the utilization of E-plastic waste in concrete production: A step towards sustainability. Journal of Building Pathology and Rehabilitation, 9(2), 131. [CrossRef]
- Danish, A., Mosaberpanah, M. A., Ozbakkaloglu, T., Salim, M. U., Khurshid, K., Bayram, M., Amran, M., Fediuk, R., & Qader, D. N. (2023). A compendious review on the influence of e-waste aggregates on the properties of concrete. Case Studies in Construction Materials, 18, e01740. [CrossRef]
- Marimuthu, V., & Ramasamy, A. (2023). Investigation of the Mechanical Properties of M40-Grade Concrete with PCB Fiber from Recycled Electronic Waste. Journal of Hazardous, Toxic, and Radioactive Waste, 27(1), 04022034. [CrossRef]
- Ahmad, Z., Alsulamy, S., Raza, A., Salmi, A., Abid, M., Deifalla, A. F., Khadimallah, M. A., & Elhadi, K. M. (2023). Life cycle assessment (LCA) of polypropylene fibers (PPF) on mechanical, durability, and microstructural efficiency of concrete incorporating electronic waste aggregates. Case Studies in Construction Materials, 18, e01979. [CrossRef]
- Ullah, S., Qureshi, M. I., Saingam, P., Hussain, Q., Khan, K., & Yooprasertchai, E. (2023). Axial stress versus strain responses of CFRP confined concrete containing electronic waste aggregates. Scientific Reports, 13(1), 23052. [CrossRef]
- Mtibe, A., Mokhena, T. C., & John, M. J. (2023). Sustainable valorization and conversion of e-waste plastics into value-added products. Current Opinion in Green and Sustainable Chemistry, 40, 100762. [CrossRef]
- Farjana, S. H., Mungombe, T. M., Gamage, H. M. K., Rajwani, A. S., Tokede, O., & Ashraf, M. (2023). Circulating the E-Waste Recovery from the Construction and Demolition Industries: A Review. Sustainability, 15(16). [CrossRef]
- Bhat, A. R., & Vikram, A. (2023). Performance of concrete with polypropylene fibre and polyvinyl chloride fibre. Materials Today: Proceedings. [CrossRef]
- Makul, N., Hussain, Q., Nawaz, A., Saingam, P., & Sua-iam, G. (2024). Effect of para-wood ash and calcium carbonate on the properties of eco-friendly self-compacting mortar reinforced with electronic waste fibers. Journal of Building Engineering, 95, 110353. [CrossRef]
- Elhadi, K. M., Abdellatif, S., Raza, A., & Arshad, M. (2023). Efficiency of rapid repairing for composites and structural fibre-reinforced plastic waste aggregate concrete members. Structures, 56, 105061. [CrossRef]
- Parsons, L. A., & Nwaubani, S. O. (2024). Abrasion-wear resistance of precarbonated and water-cured concrete made using ABS plastic derived from waste electrical and electronic equipment. Cement and Concrete Research, 179, 107470. [CrossRef]
- Elgarahy, A. M., Eloffy, M. G., Priya, A. K., Hammad, A., Zahran, M., Maged, A., & Elwakeel, K. Z. (2024). Revitalizing the circular economy: An exploration of e-waste recycling approaches in a technological epoch. Sustainable Chemistry for the Environment, 7, 100124. [CrossRef]
- ASTM International. (2019). ASTM C136/C136M-19: Standard test method for sieve analysis of fine and coarse aggregates. West Conshohocken, PA: ASTM International.
- ASTM International. (2018). ASTM C127-18: Standard test method for relative density (specific gravity) and absorption of coarse aggregate. West Conshohocken, PA: ASTM International.
- ASTM International. (2018). ASTM C128-18: Standard test method for relative density (specific gravity) and absorption of fine aggregate. West Conshohocken, PA: ASTM International.
- ASTM International. (2021). ASTM D2419-21: Standard test method for sand equivalent value of soils and fine aggregate. West Conshohocken, PA: ASTM International.
- ASTM International. (2017). ASTM C117-17: Standard test method for materials finer than 75-μm (No. 200) sieve in mineral aggregates by washing. West Conshohocken, PA: ASTM International.
- ASTM International. (2020). ASTM C131/C131M-20: Standard test method for resistance to degradation of small-size coarse aggregate by abrasion and impact in the Los Angeles machine. West Conshohocken, PA: ASTM International.
- ASTM International. (2020). ASTM C143/C143M-20: Standard test method for slump of hydraulic-cement concrete. West Conshohocken, PA: ASTM International.
- ASTM International. (2020). ASTM C138/C138M-20: Standard test method for density (unit weight), yield, and air content (gravimetric) of concrete. West Conshohocken, PA: ASTM International.
- ASTM International. (2020). ASTM C39/C39M-20: Standard test method for compressive strength of cylindrical concrete specimens. West Conshohocken, PA: ASTM International.
- European Committee for Standardization. (2001). EN 12664:2001: Thermal performance of building materials and products—Determination of thermal resistance by means of guarded hot plate and heat flow meter methods—Dry and moist products of medium and low thermal resistance. Brussels, Belgium: CEN.
- ASTM International. (2019). ASTM C1585-19: Standard test method for measurement of rate of absorption of water by hydraulic-cement concretes. West Conshohocken, PA: ASTM International.
- ASTM International. (2022). Standard test method for ultrasonic pulse velocity through concrete (ASTM C597-22). ASTM International.
Figure 1.
Concrete mix materials. (a) Coarse aggregates close-up; (b) Shredded e-waste close-up.
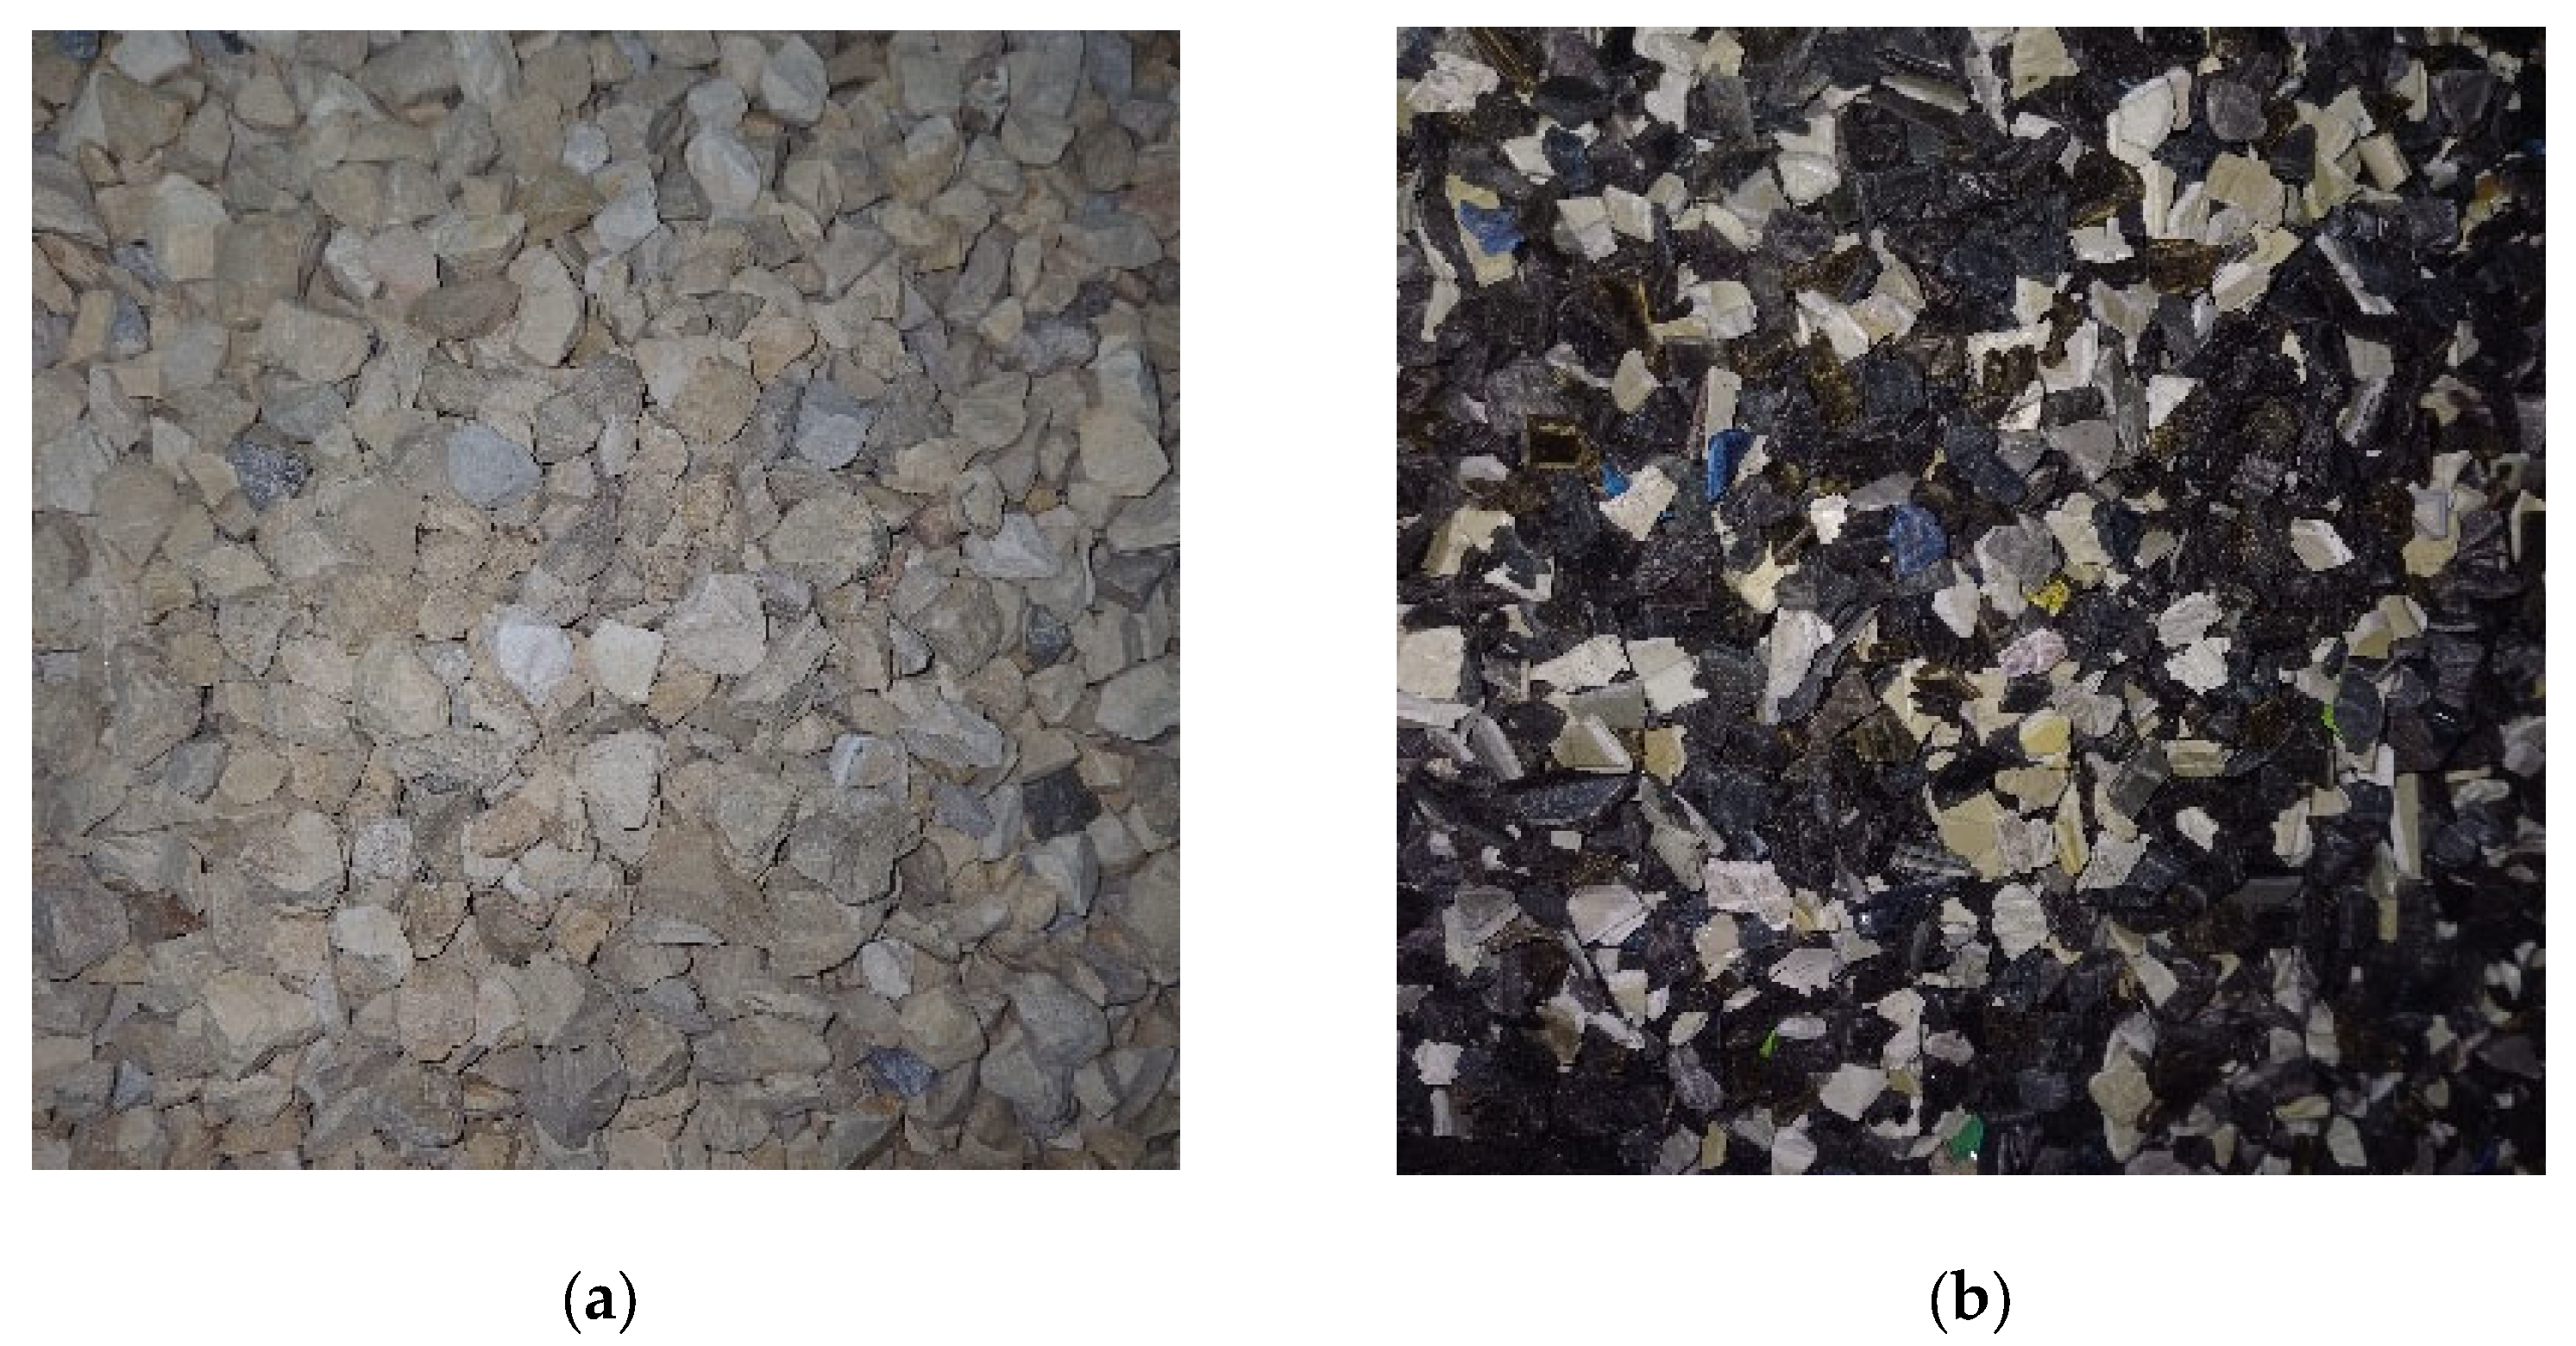
Figure 2.
Plot chart representing the particle size distribution curve of the used gravel.
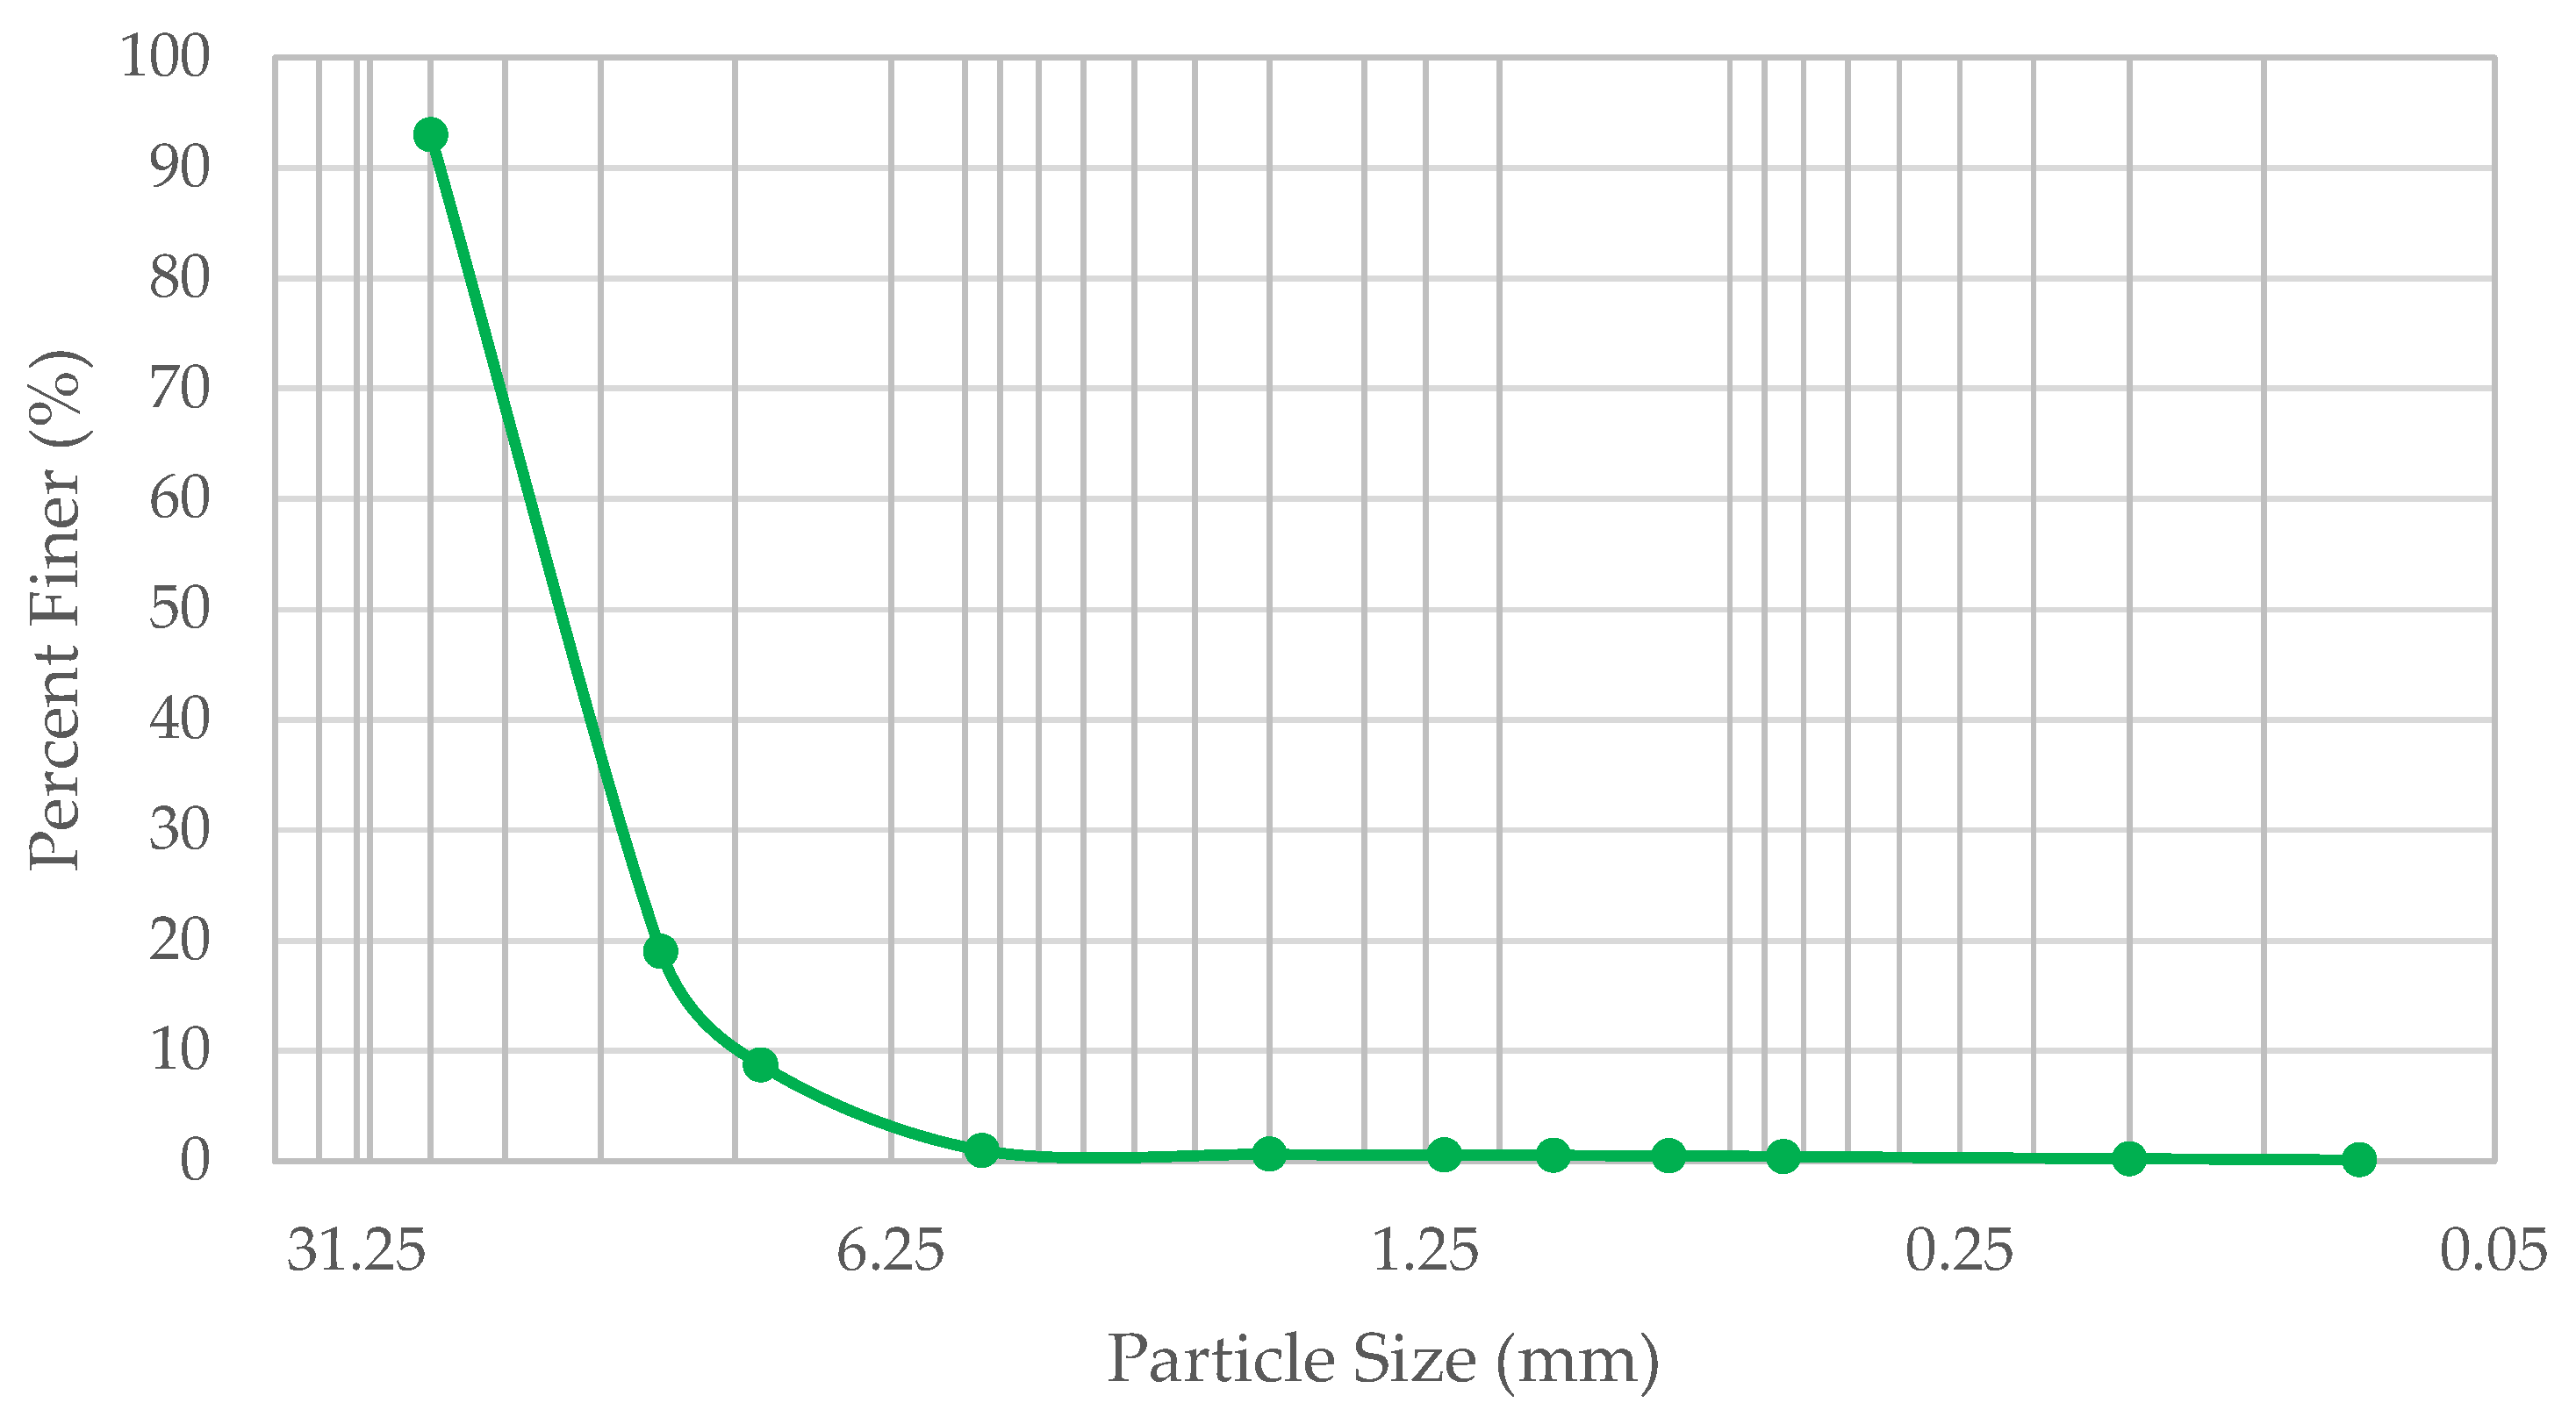
Figure 3.
Plot chart representing the particle size distribution curve of the used sand.
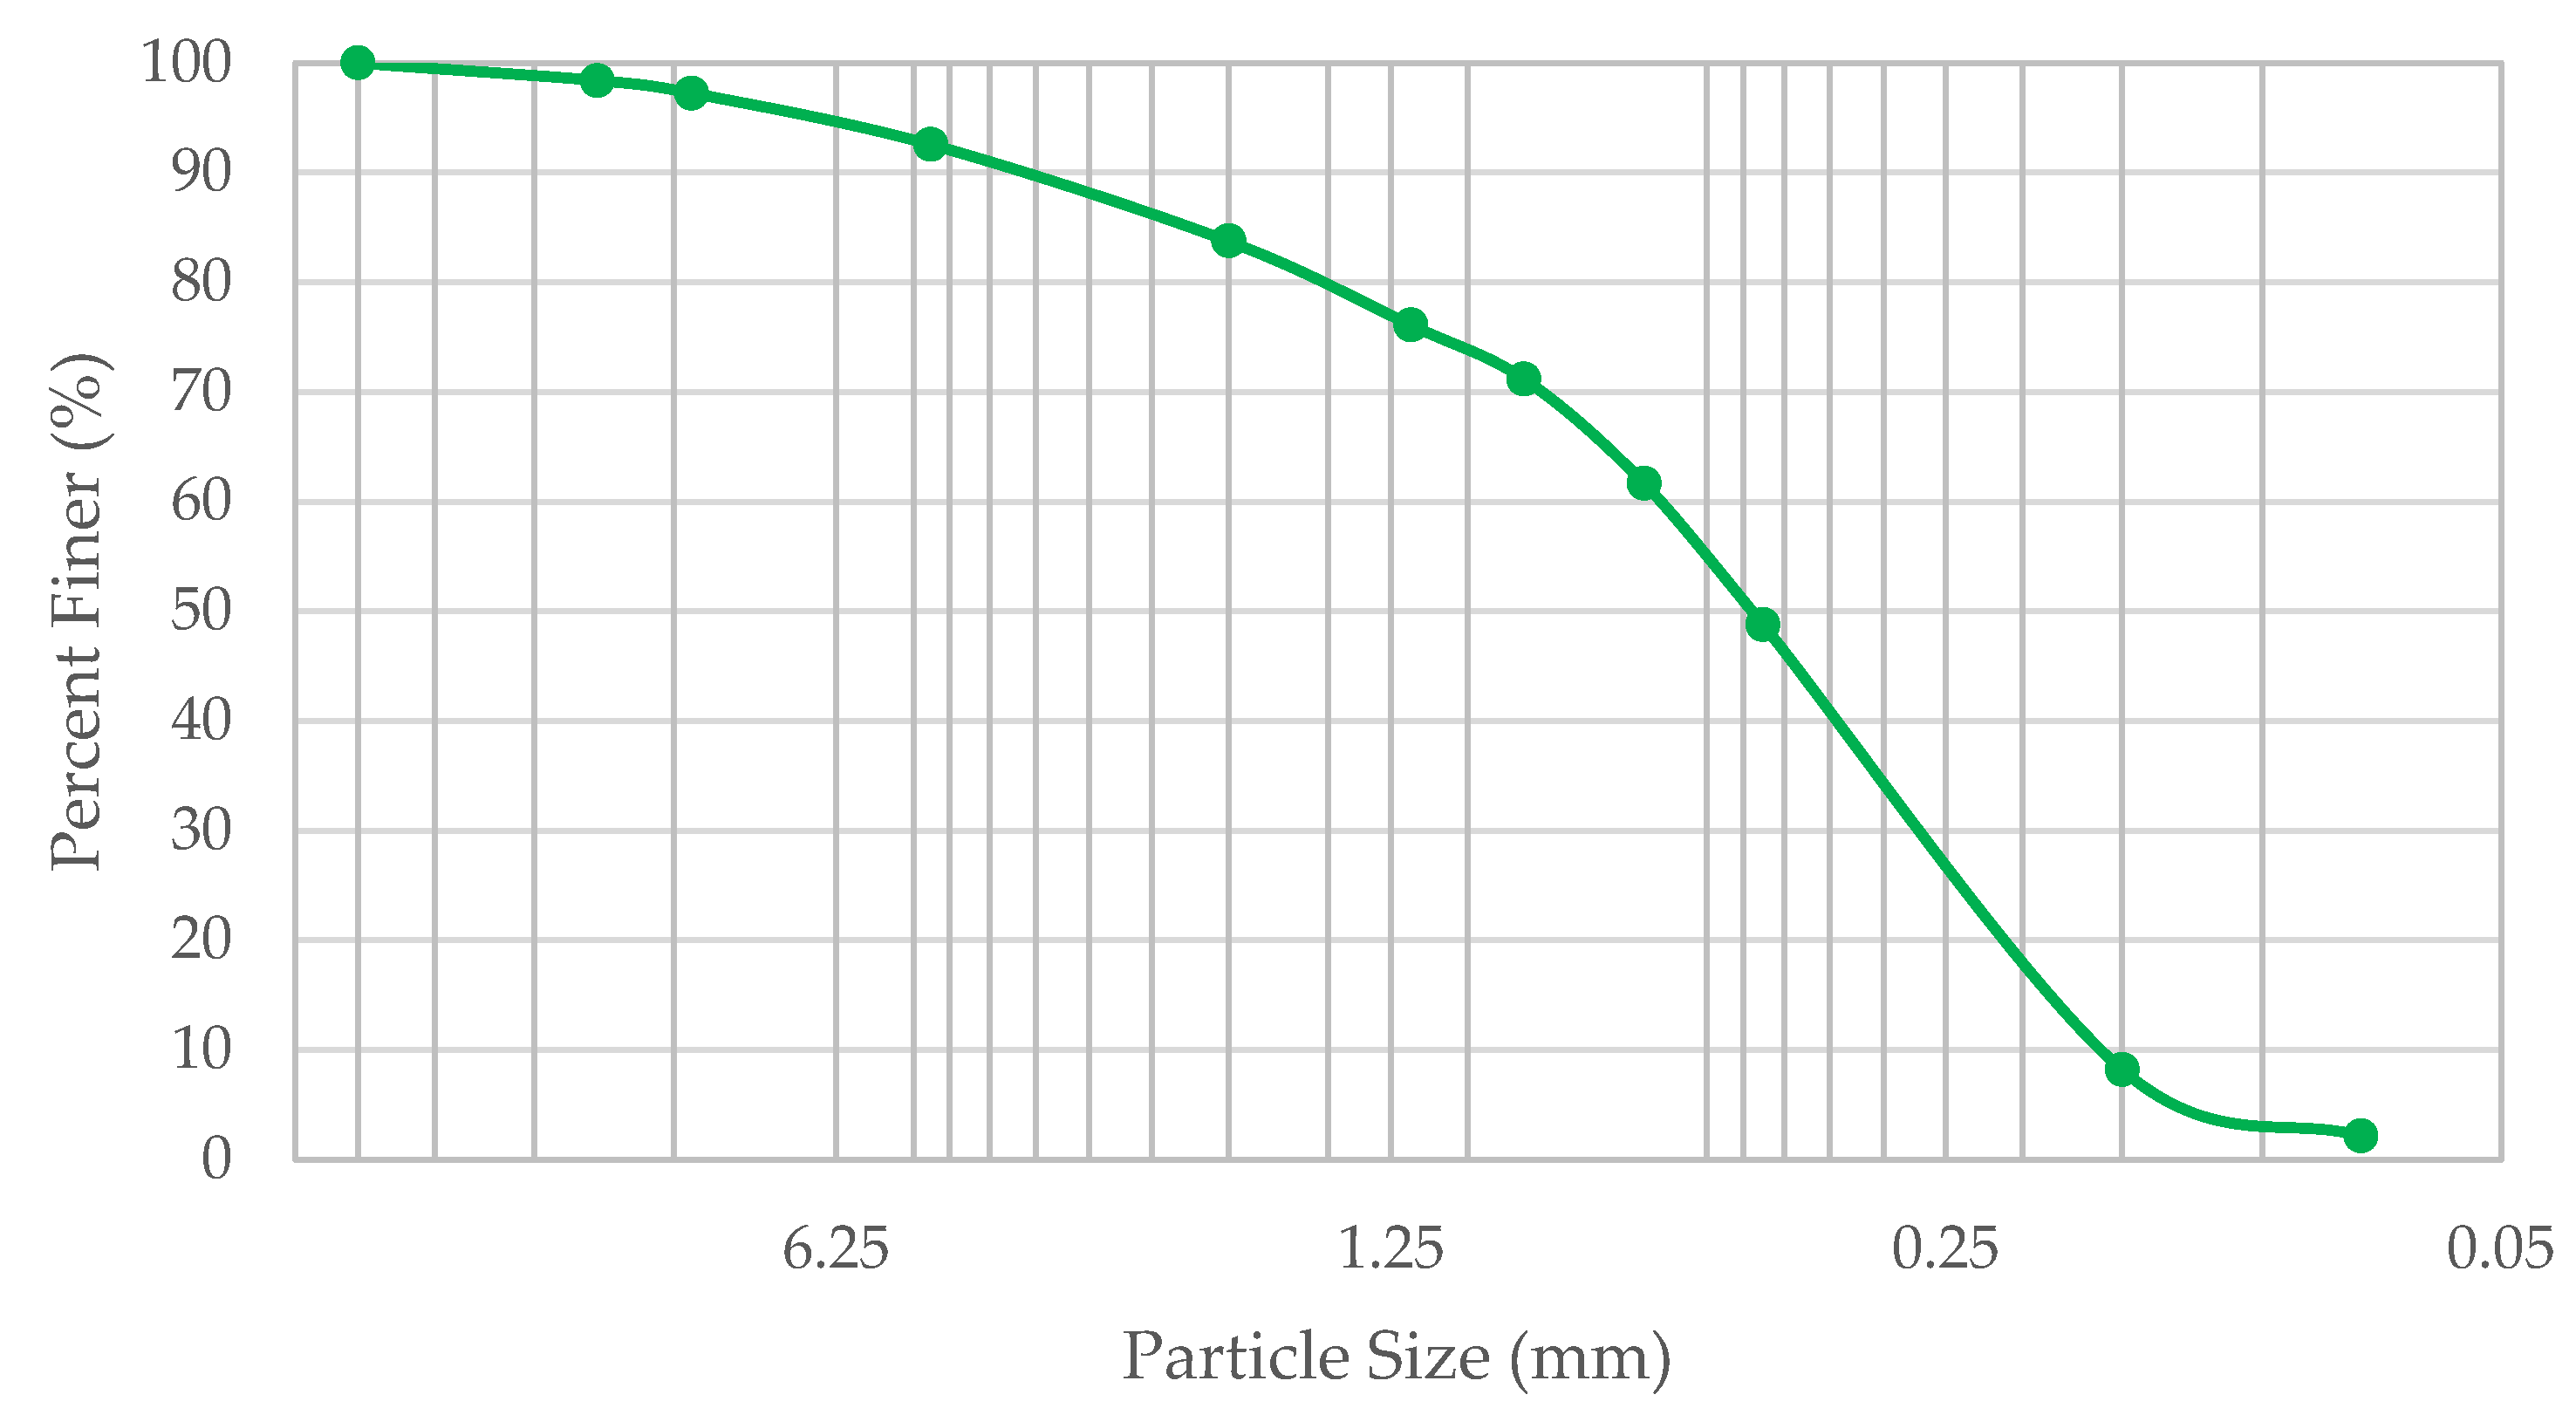
Figure 4.
Workability or slump value measurement.
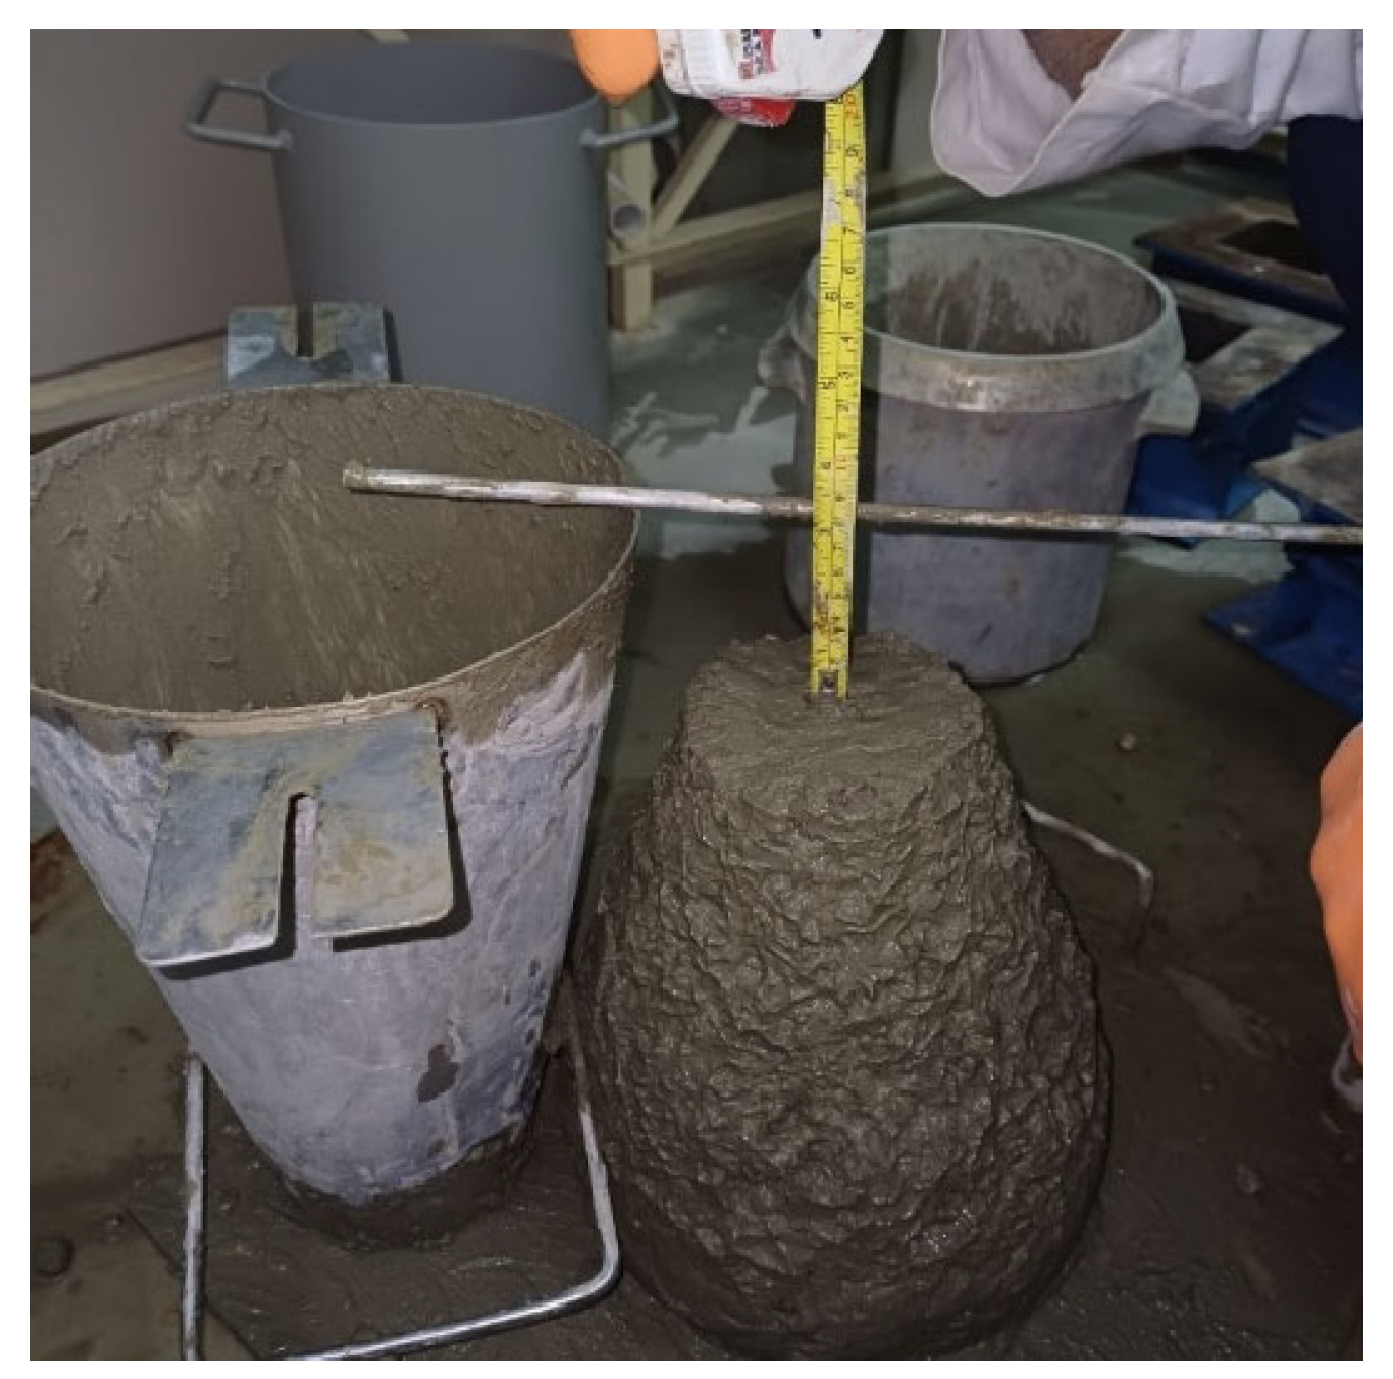
Figure 5.
The flux metric method thermal testing setup.

Figure 6.
Concrete specimen sides and bottom edges epoxy sealing.
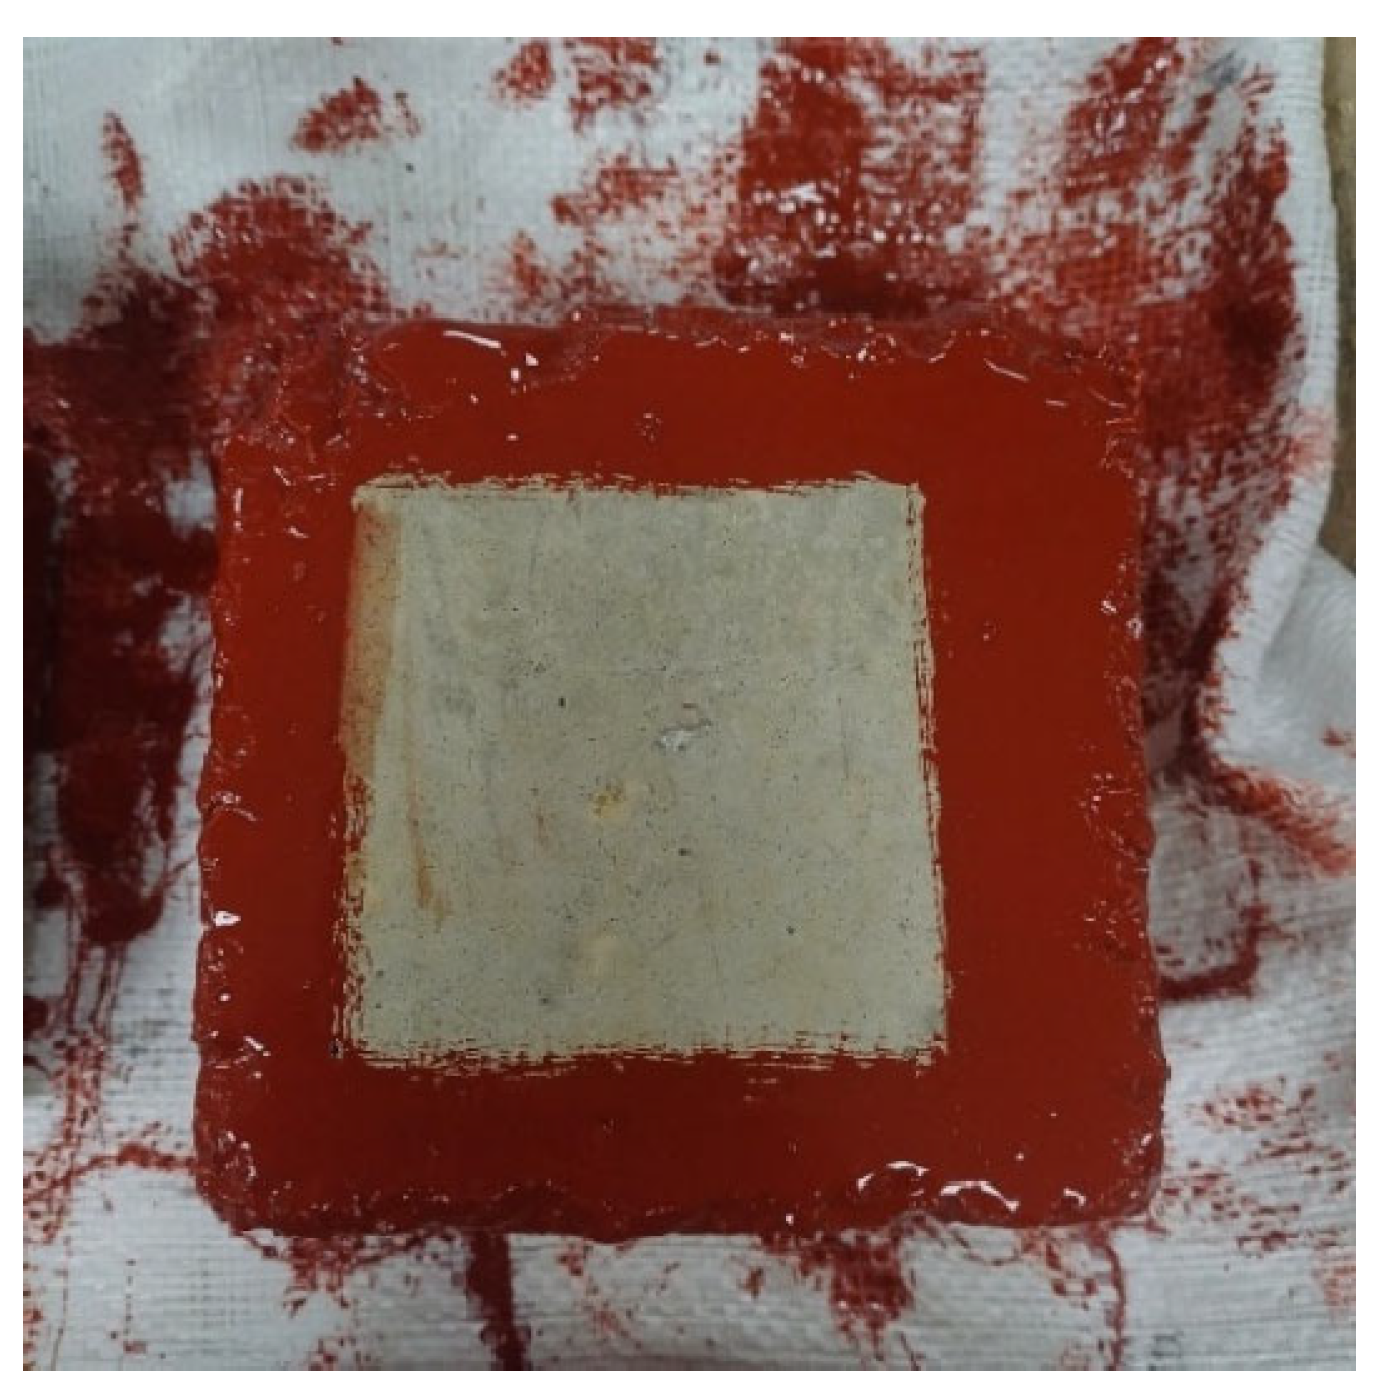
Figure 7.
Bar chart representing the slump values with increasing e-waste replacement percentages.
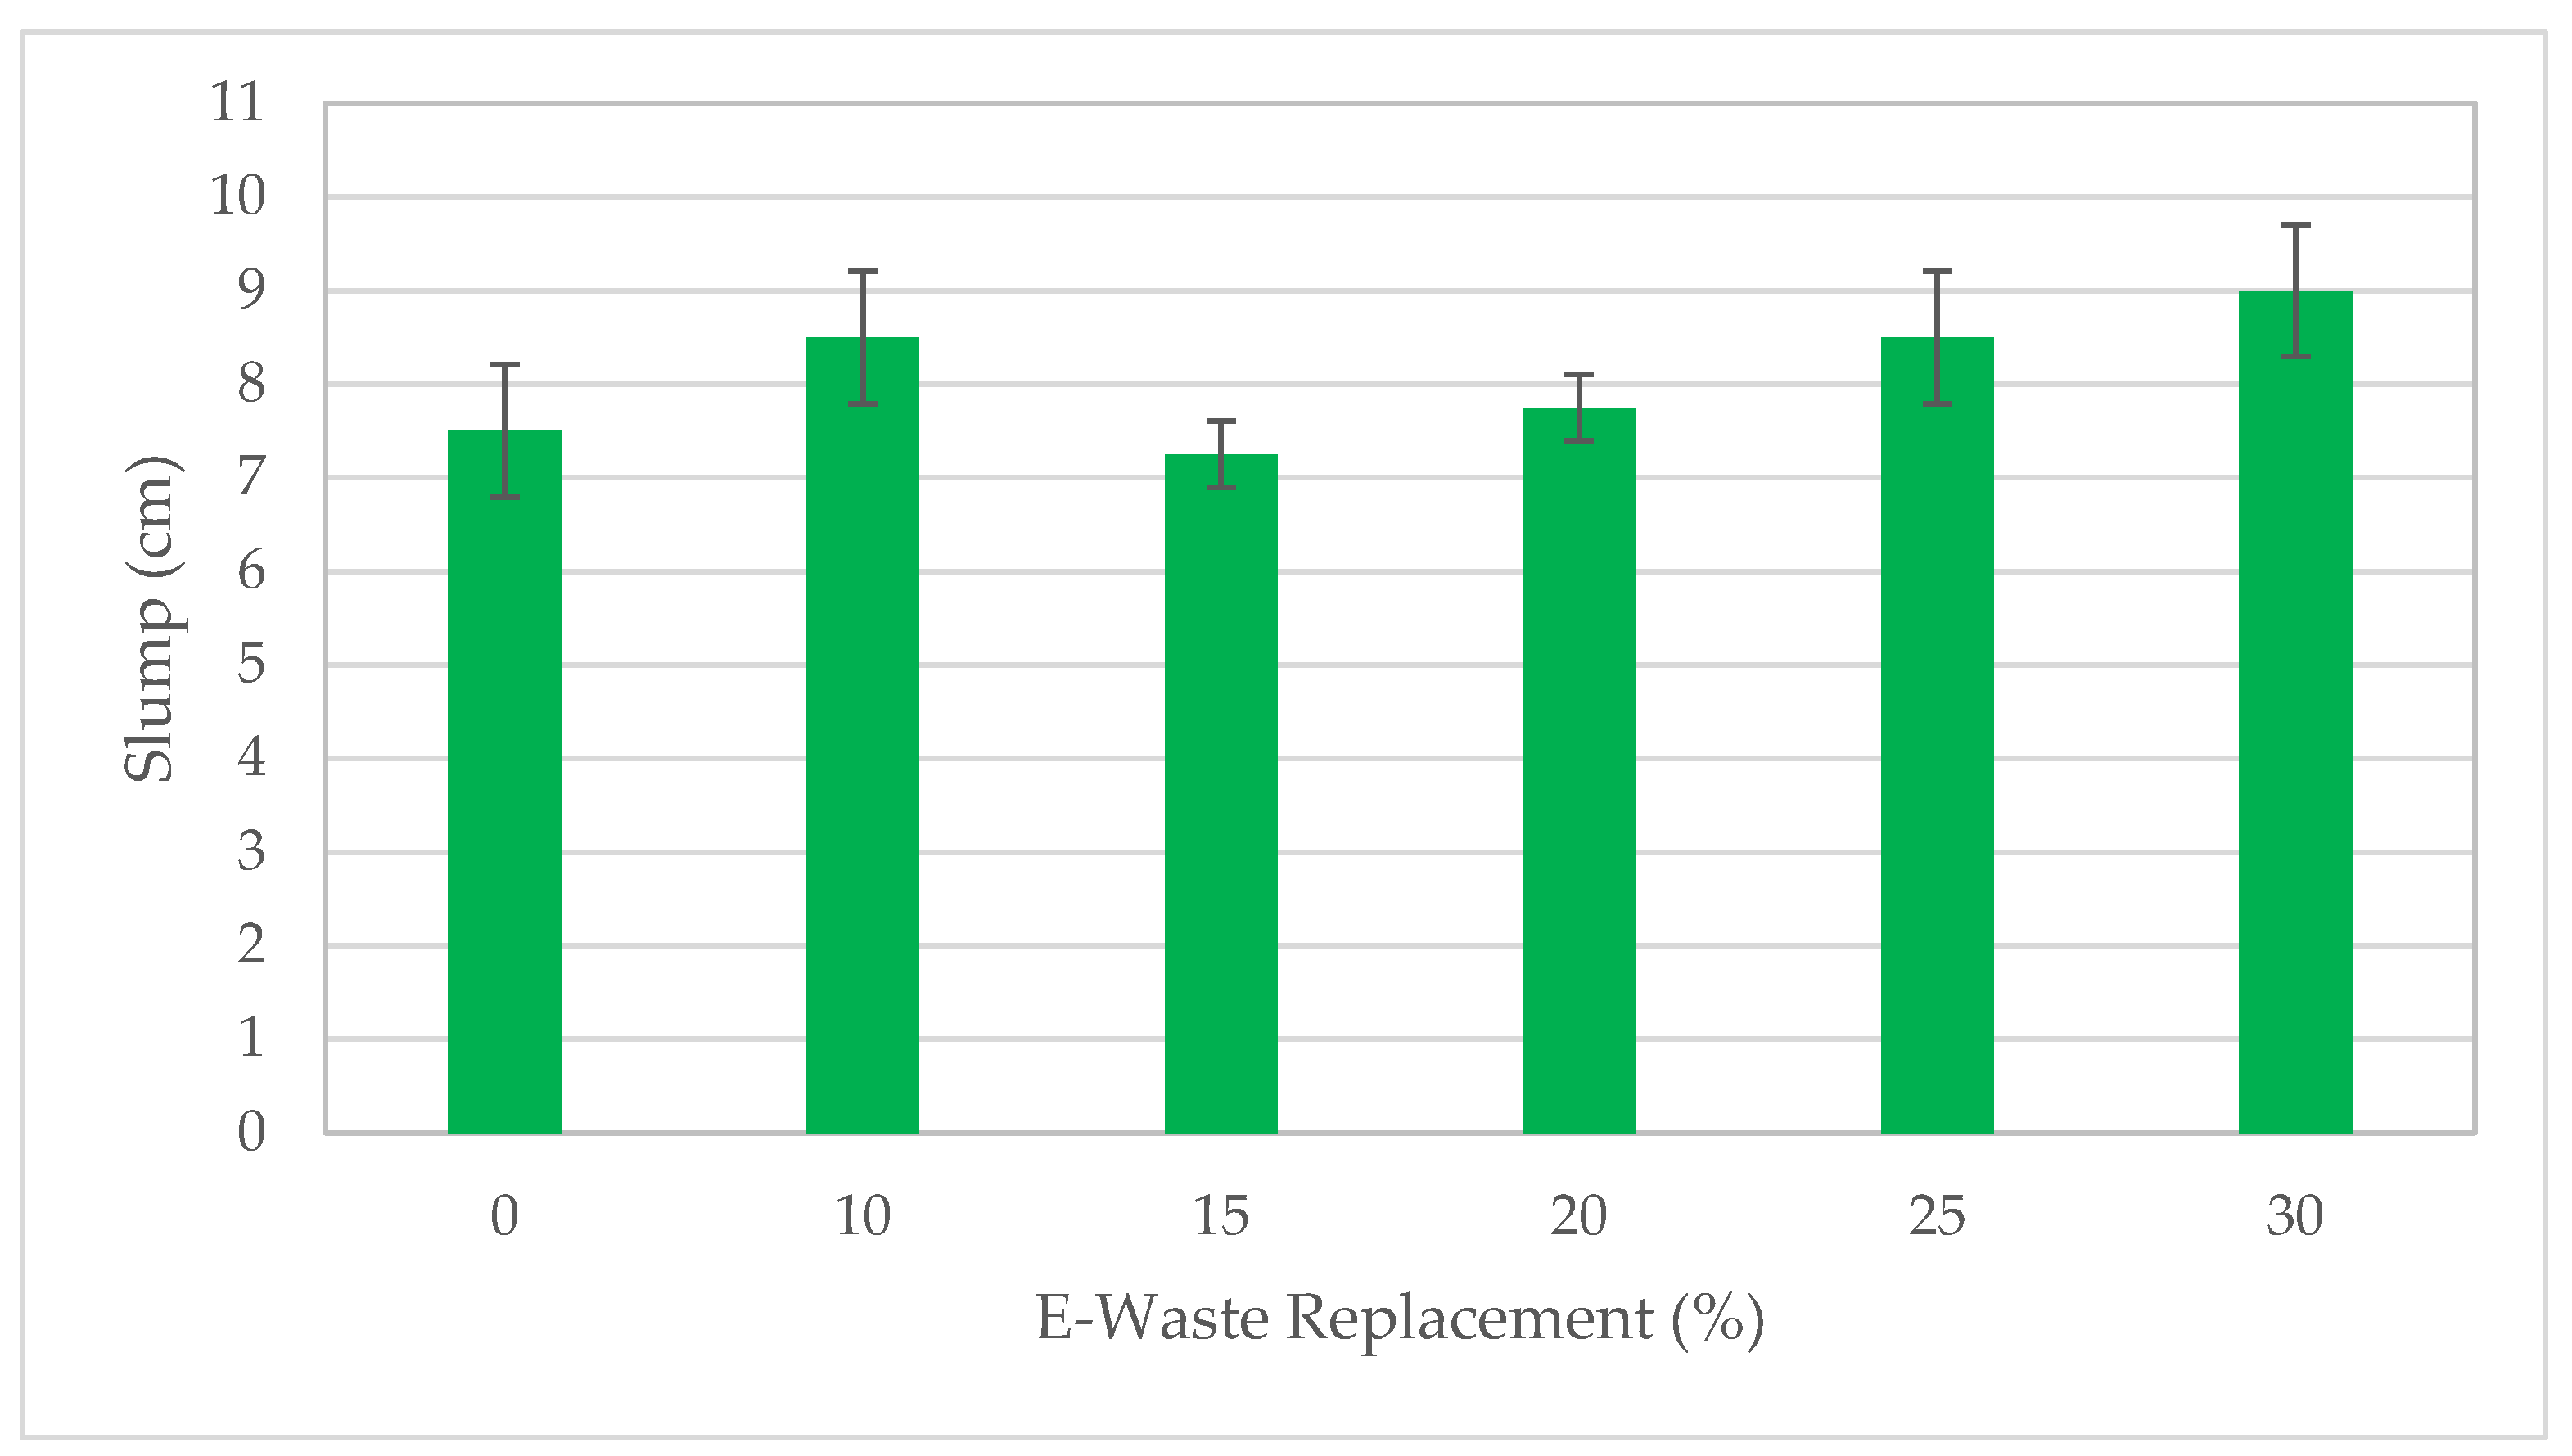
Figure 8.
Bar chart representing the fresh density values with increasing e-waste replacement percentages.
Figure 8.
Bar chart representing the fresh density values with increasing e-waste replacement percentages.
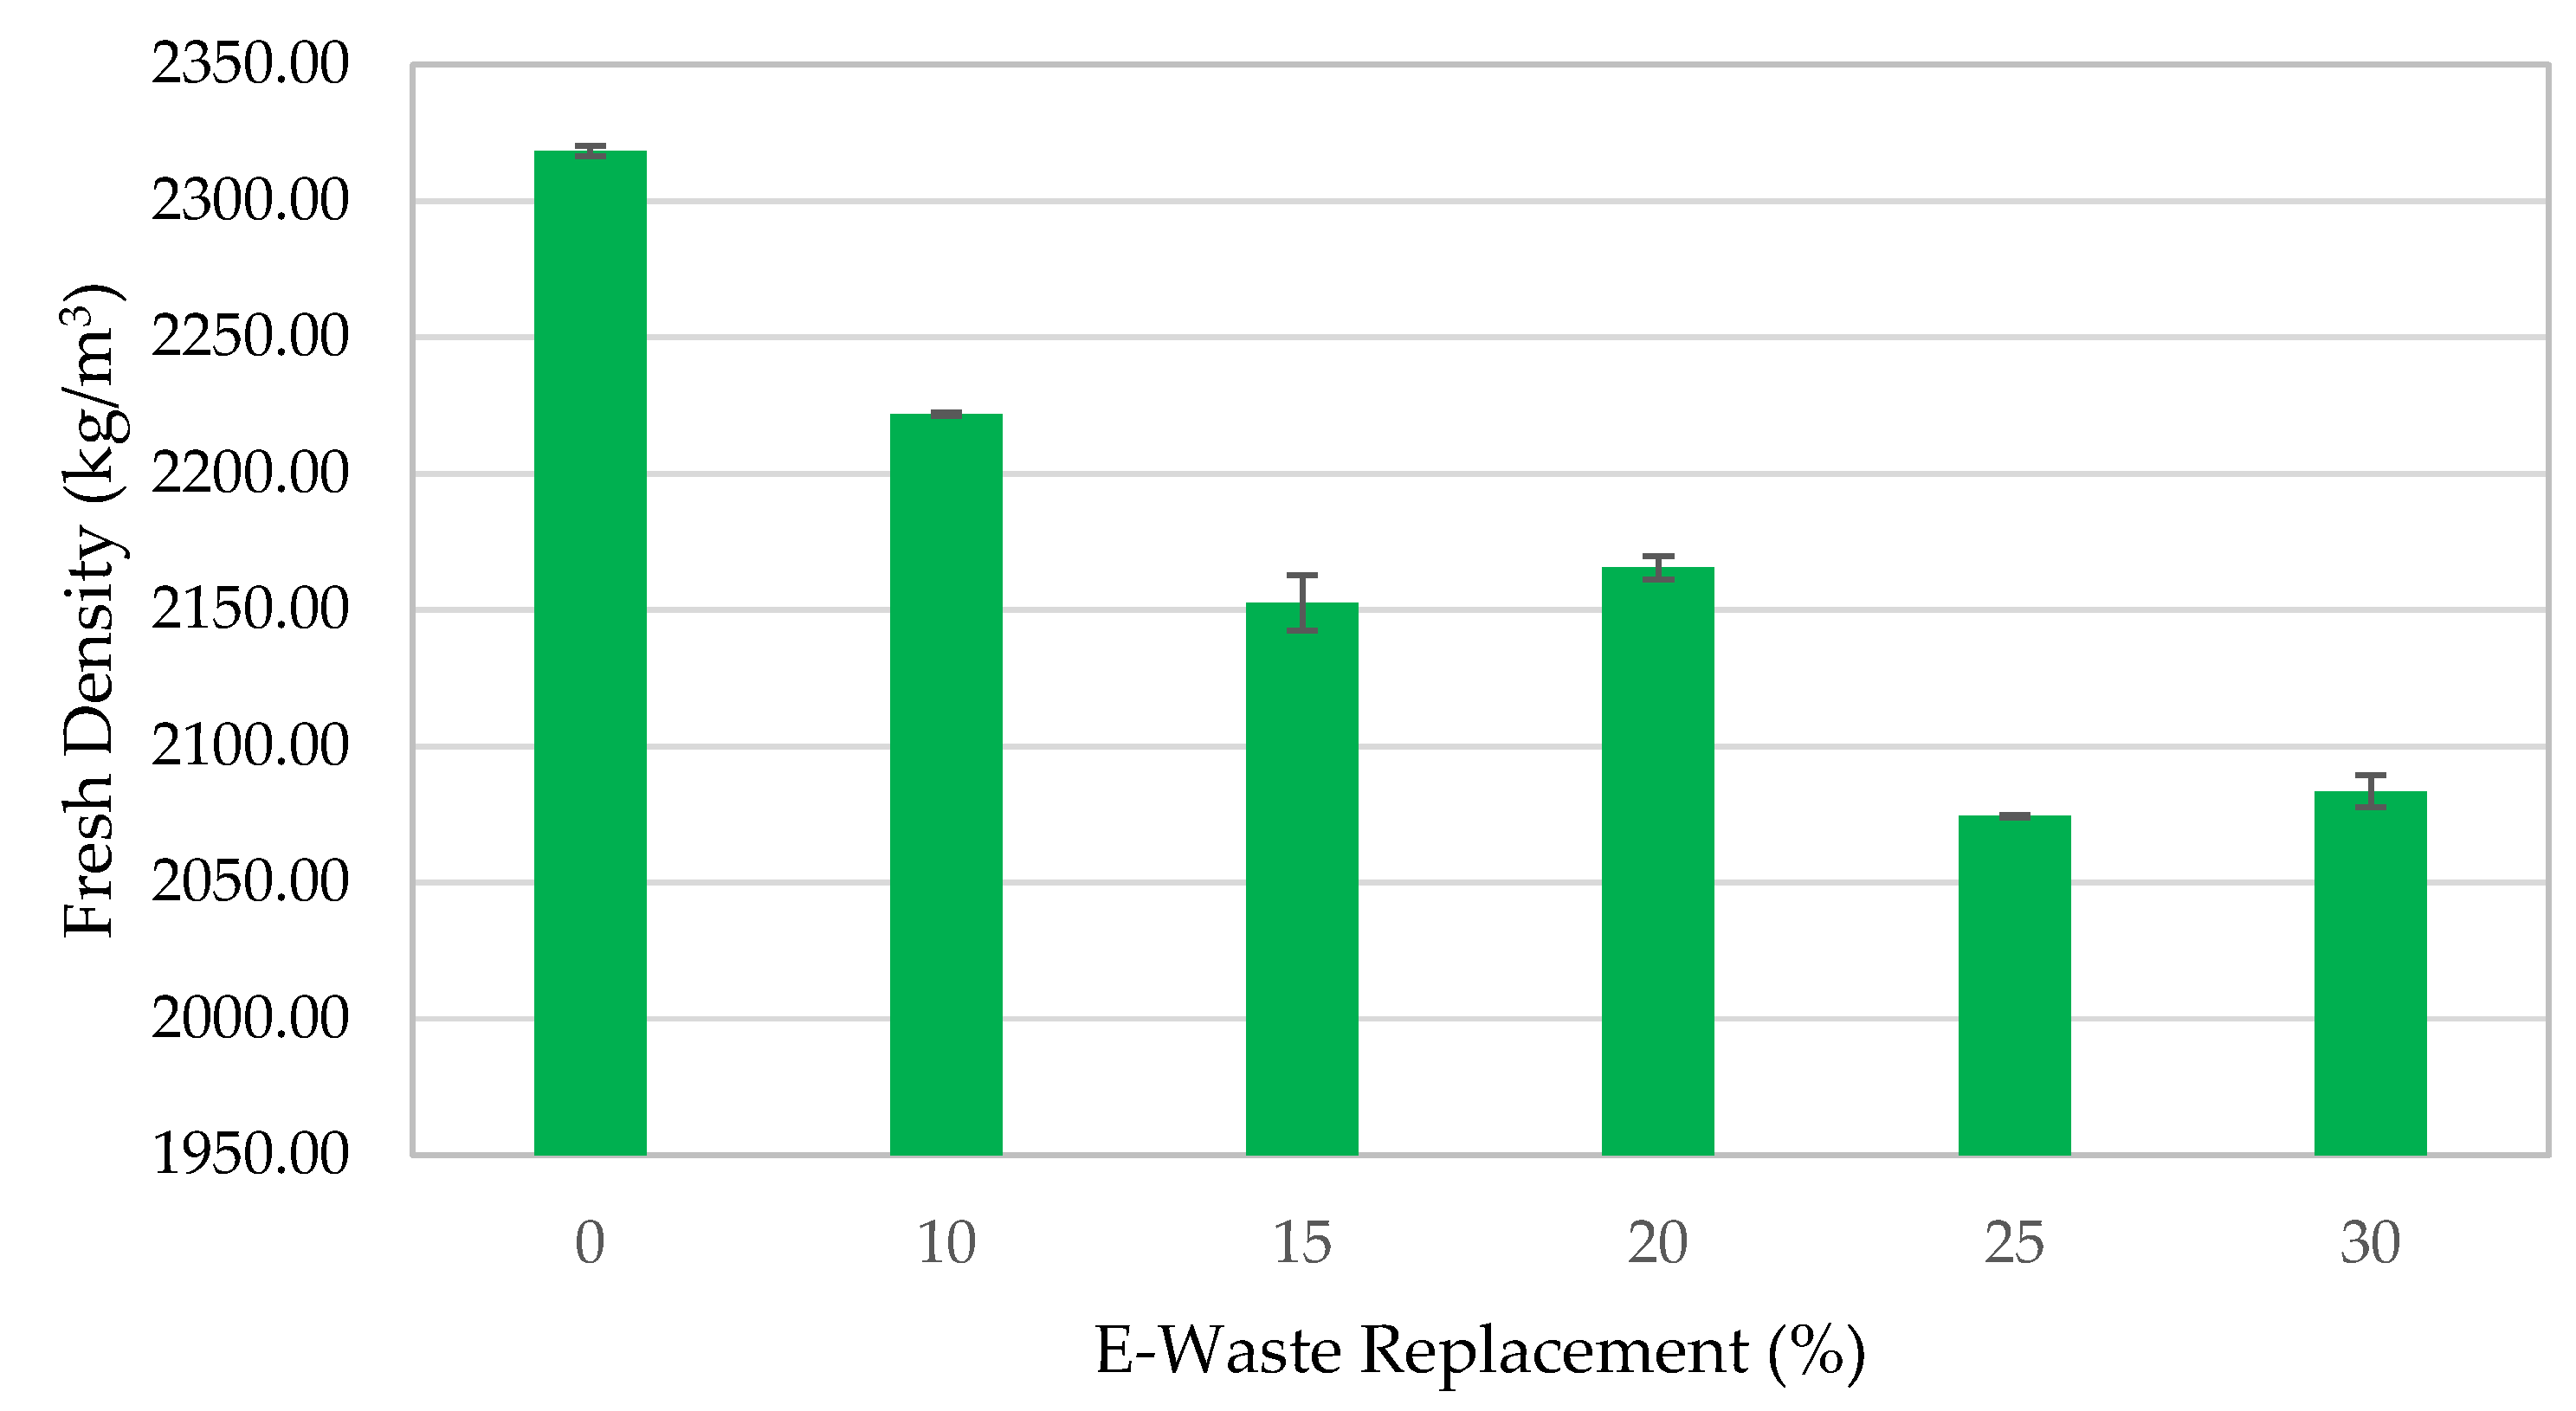
Figure 9.
Cured concrete density values with increasing e-waste replacement percentages at 7 and 28 days.
Figure 9.
Cured concrete density values with increasing e-waste replacement percentages at 7 and 28 days.
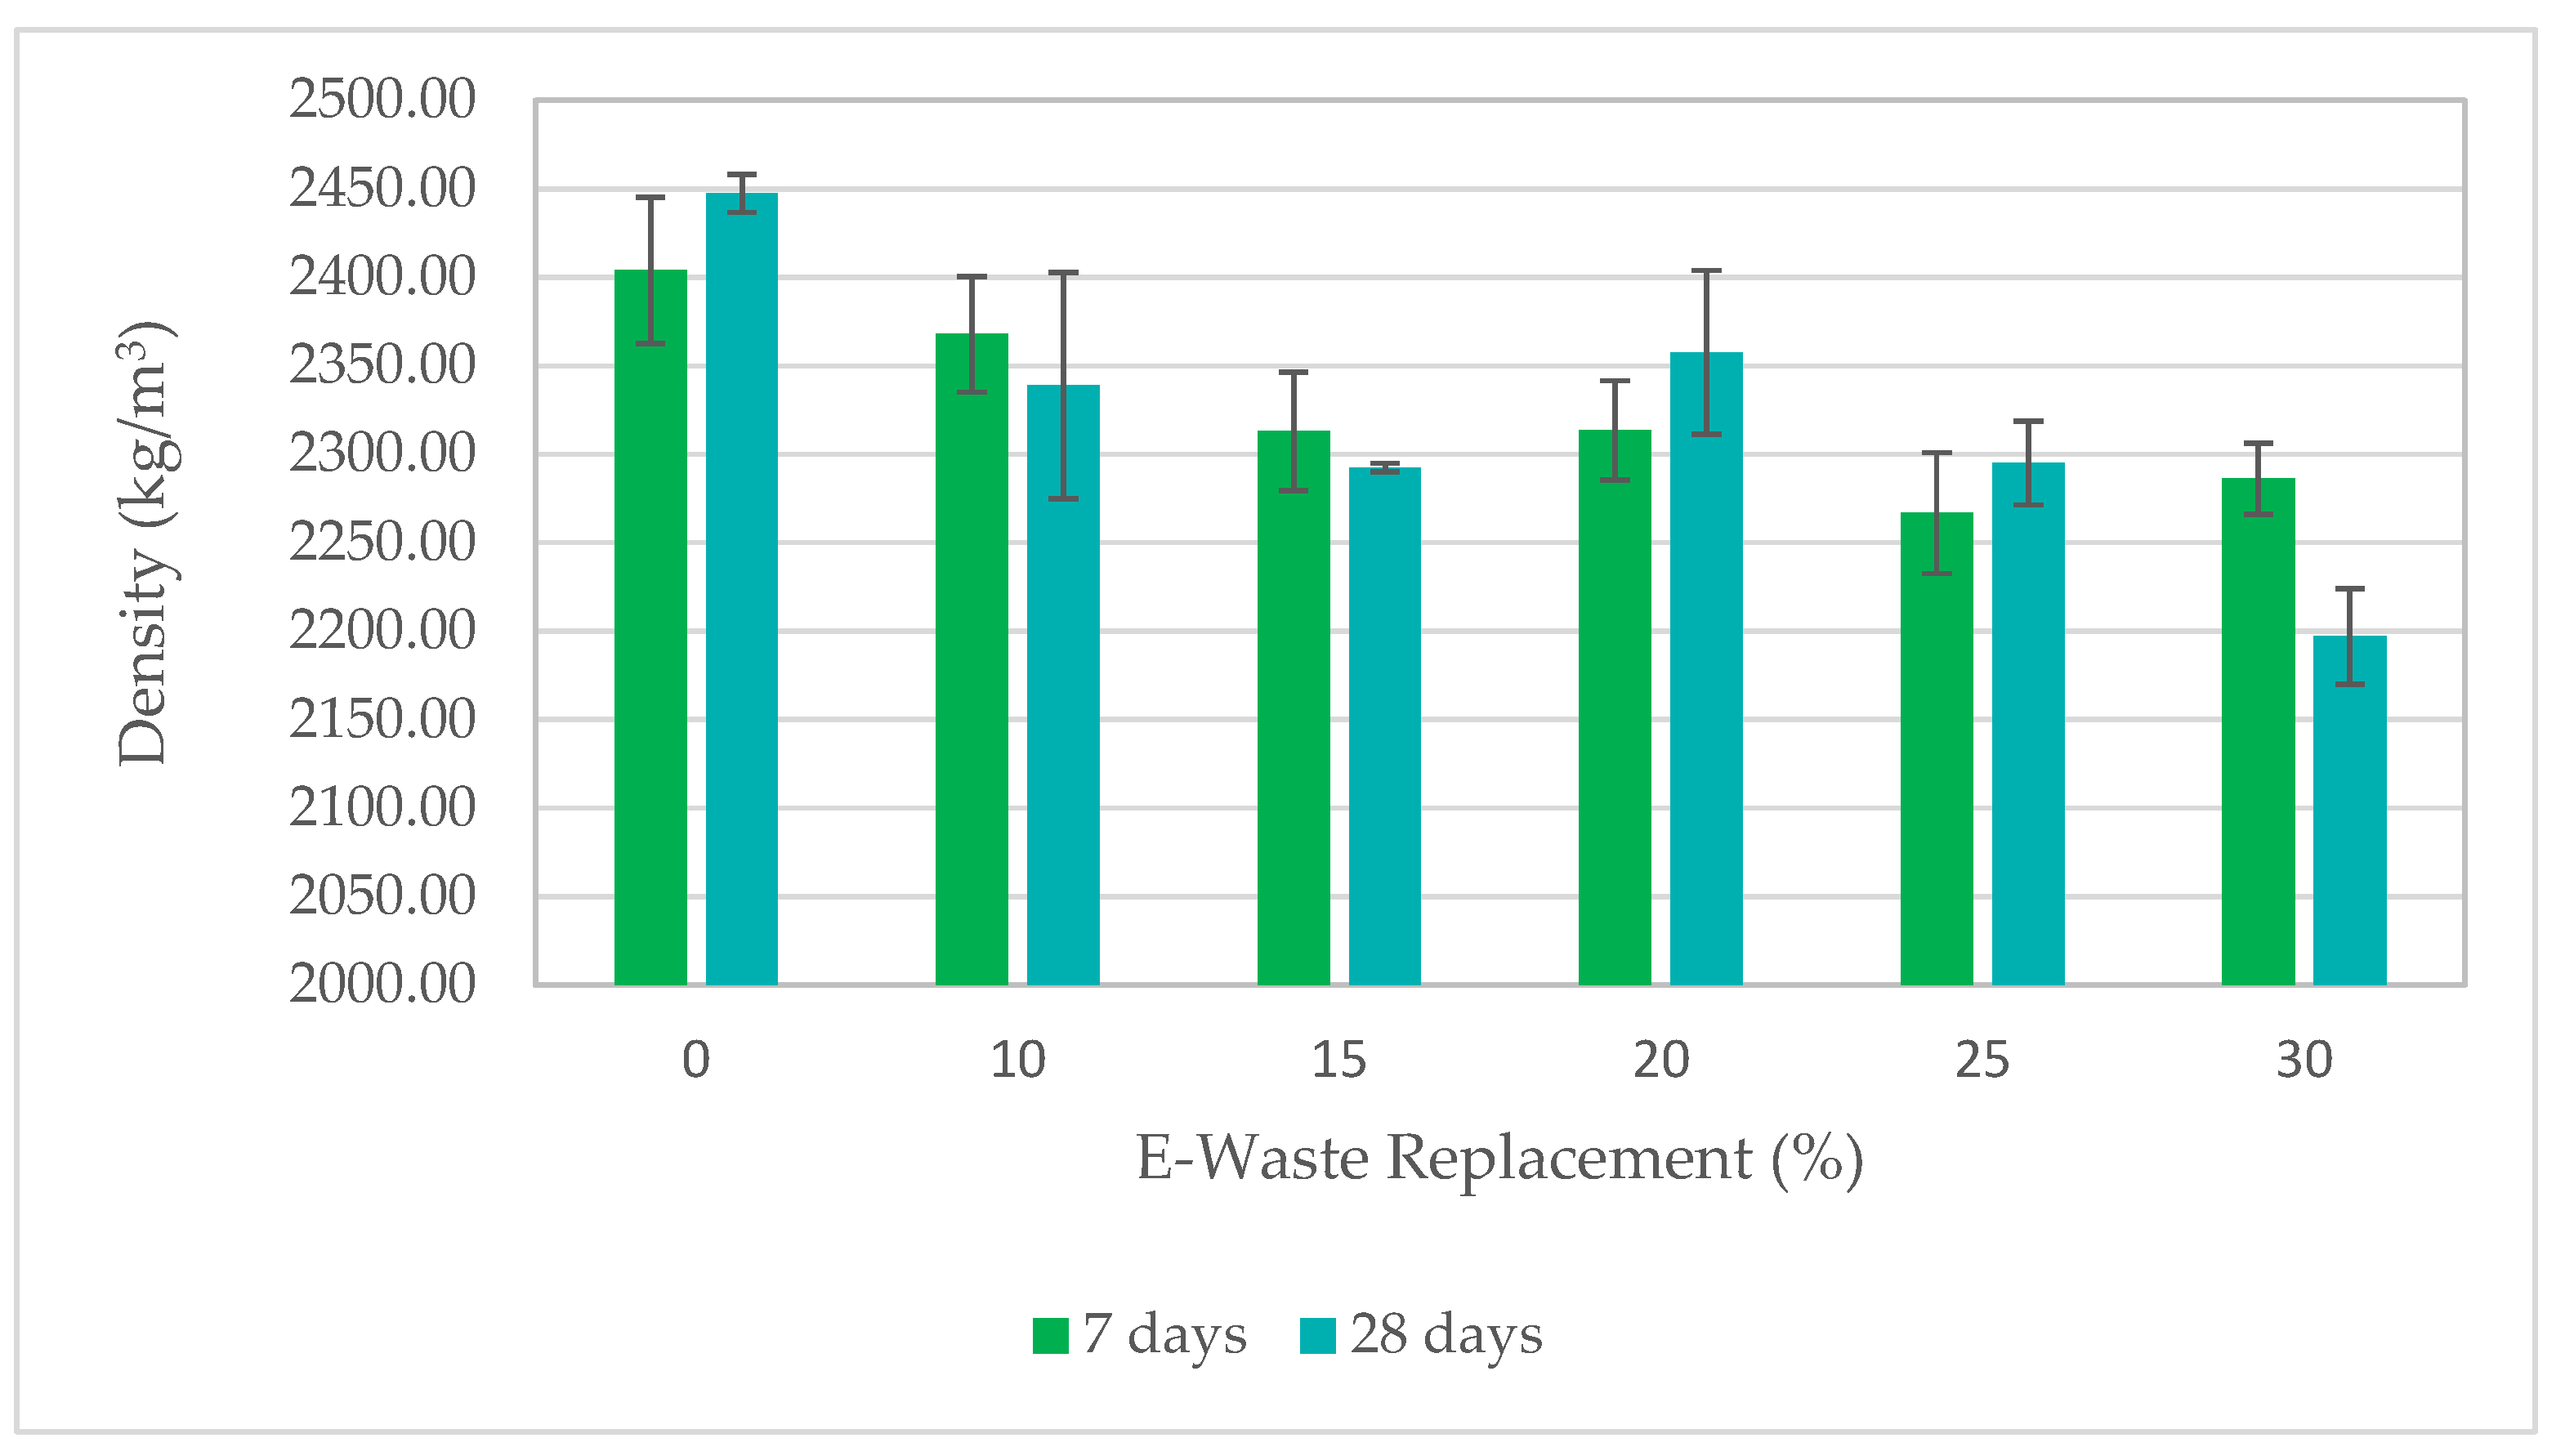
Figure 10.
Compressive strength of concrete 15cm × 15cm × 15cm cubes after 7 and 28 days of curing.
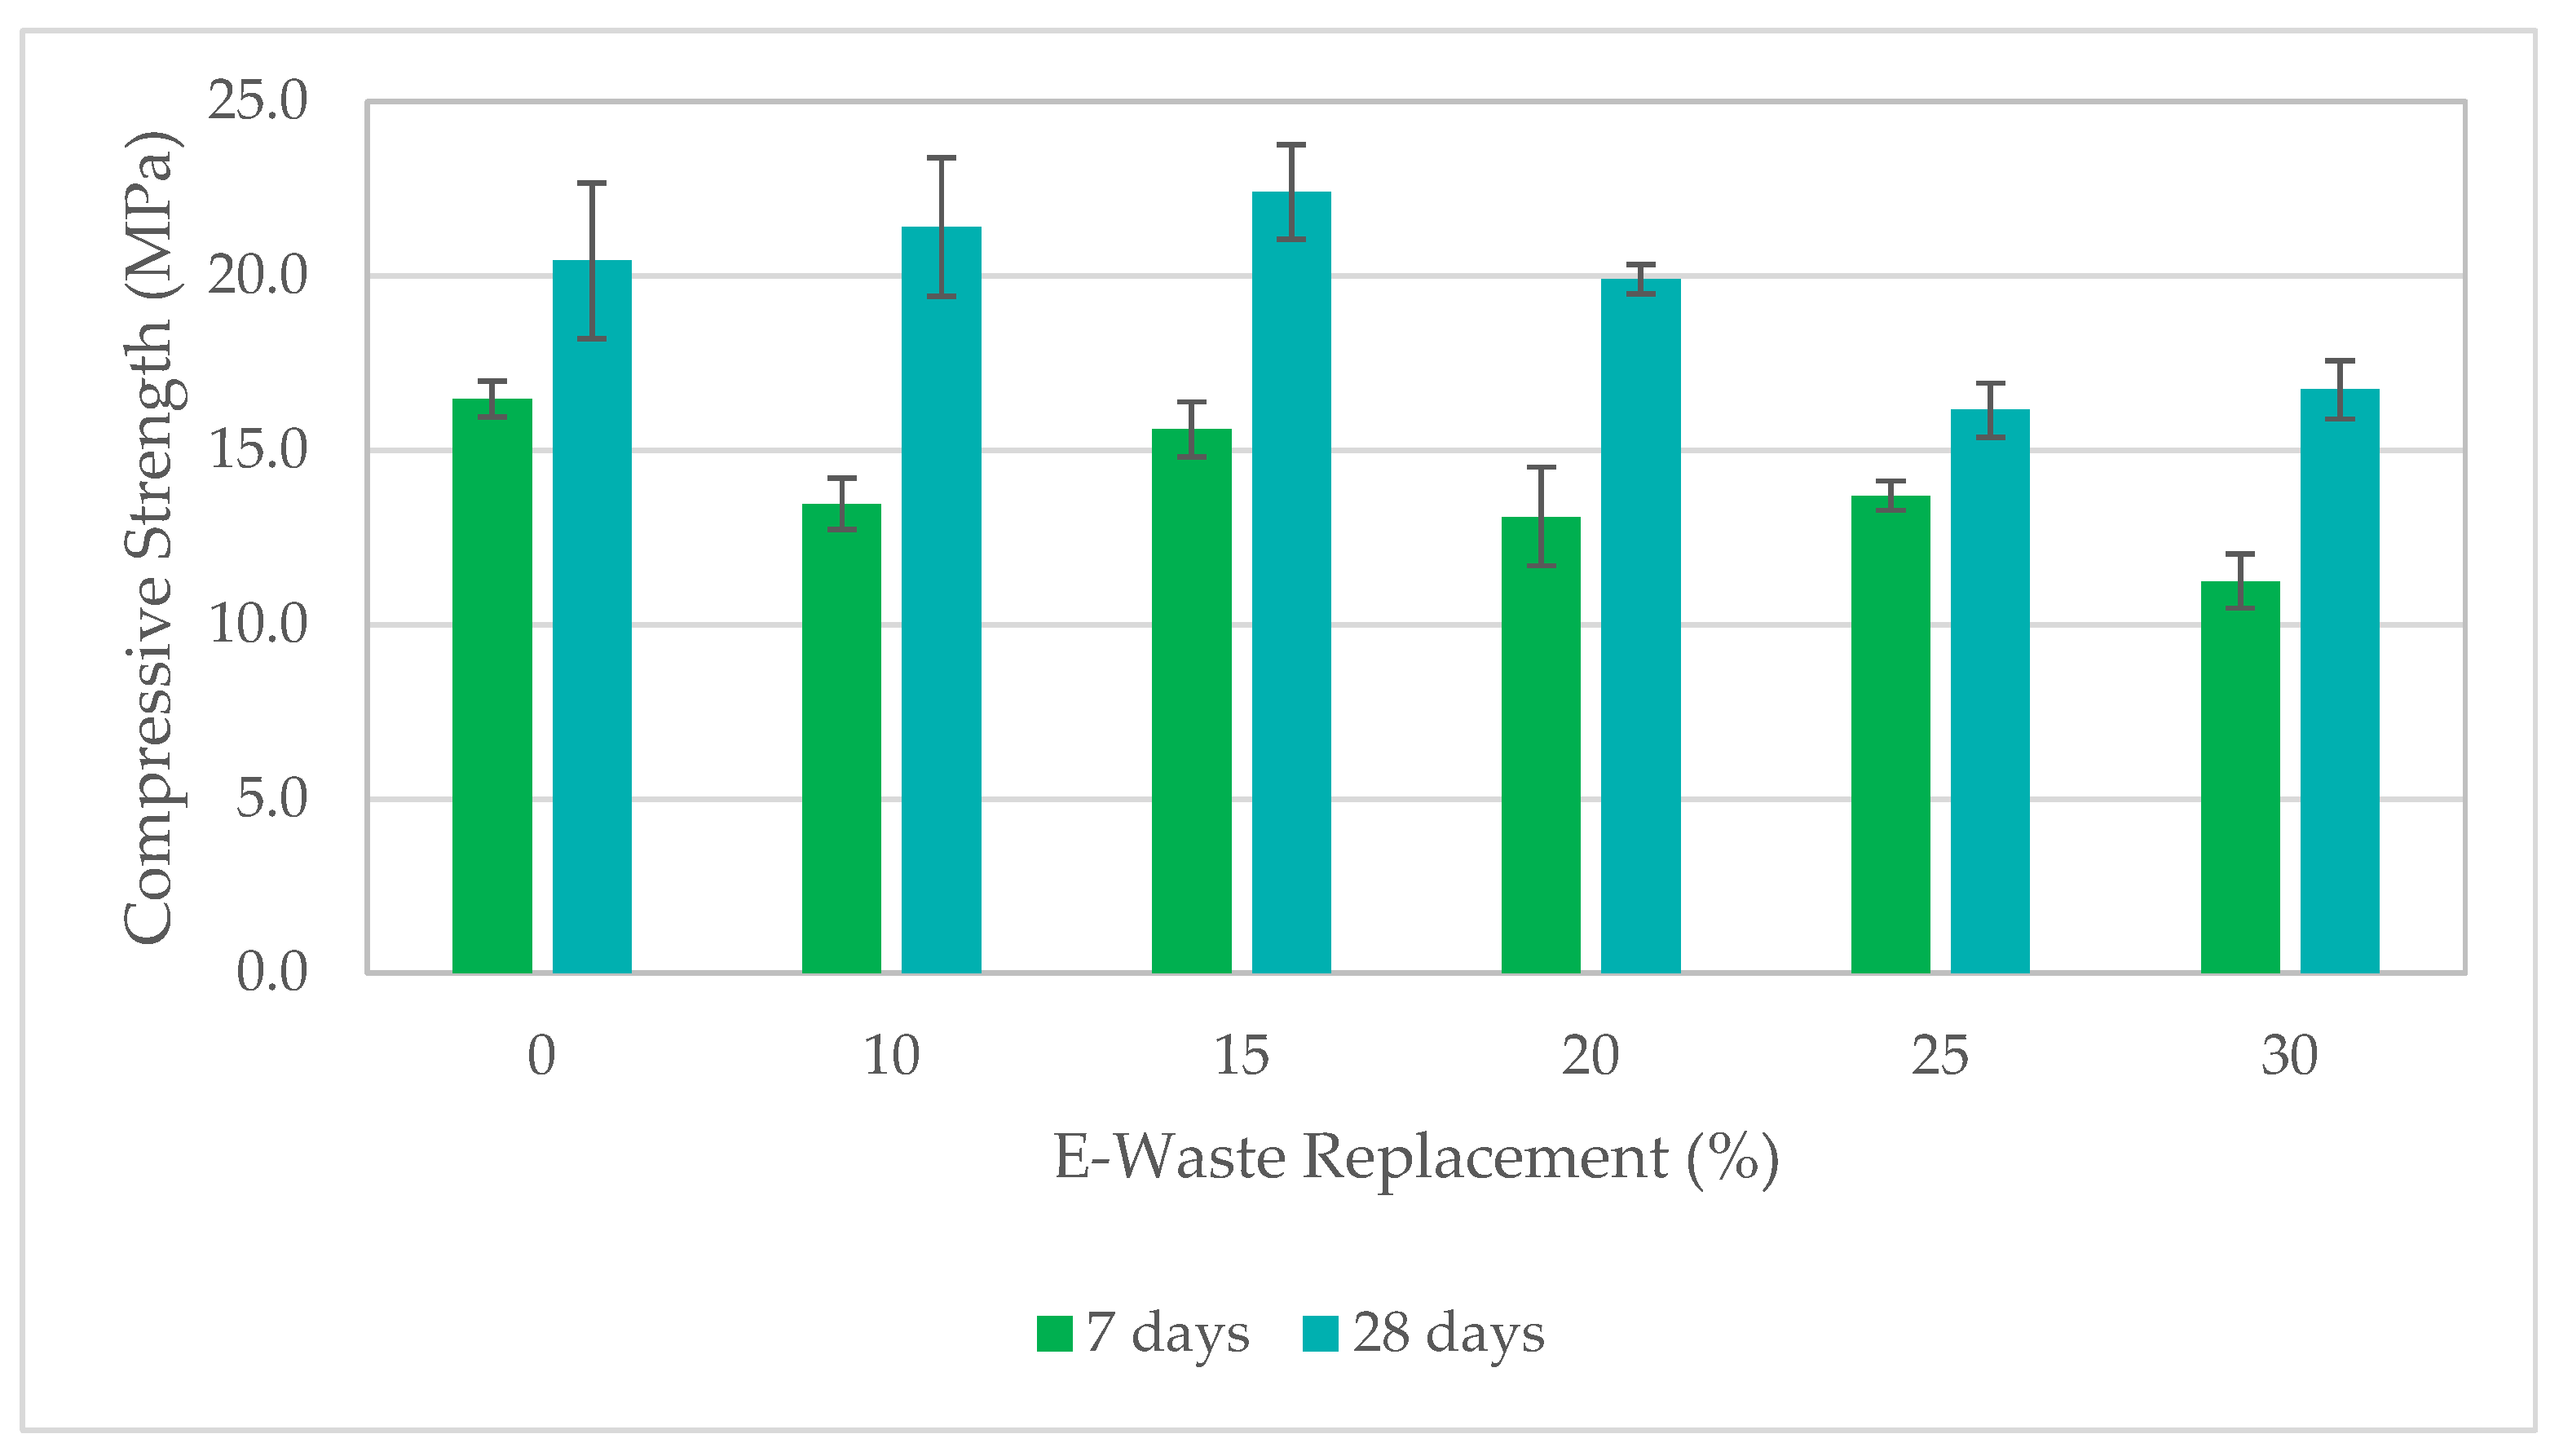
Figure 11.
Concrete cubes compressive test failure with increasing e-waste percentages.
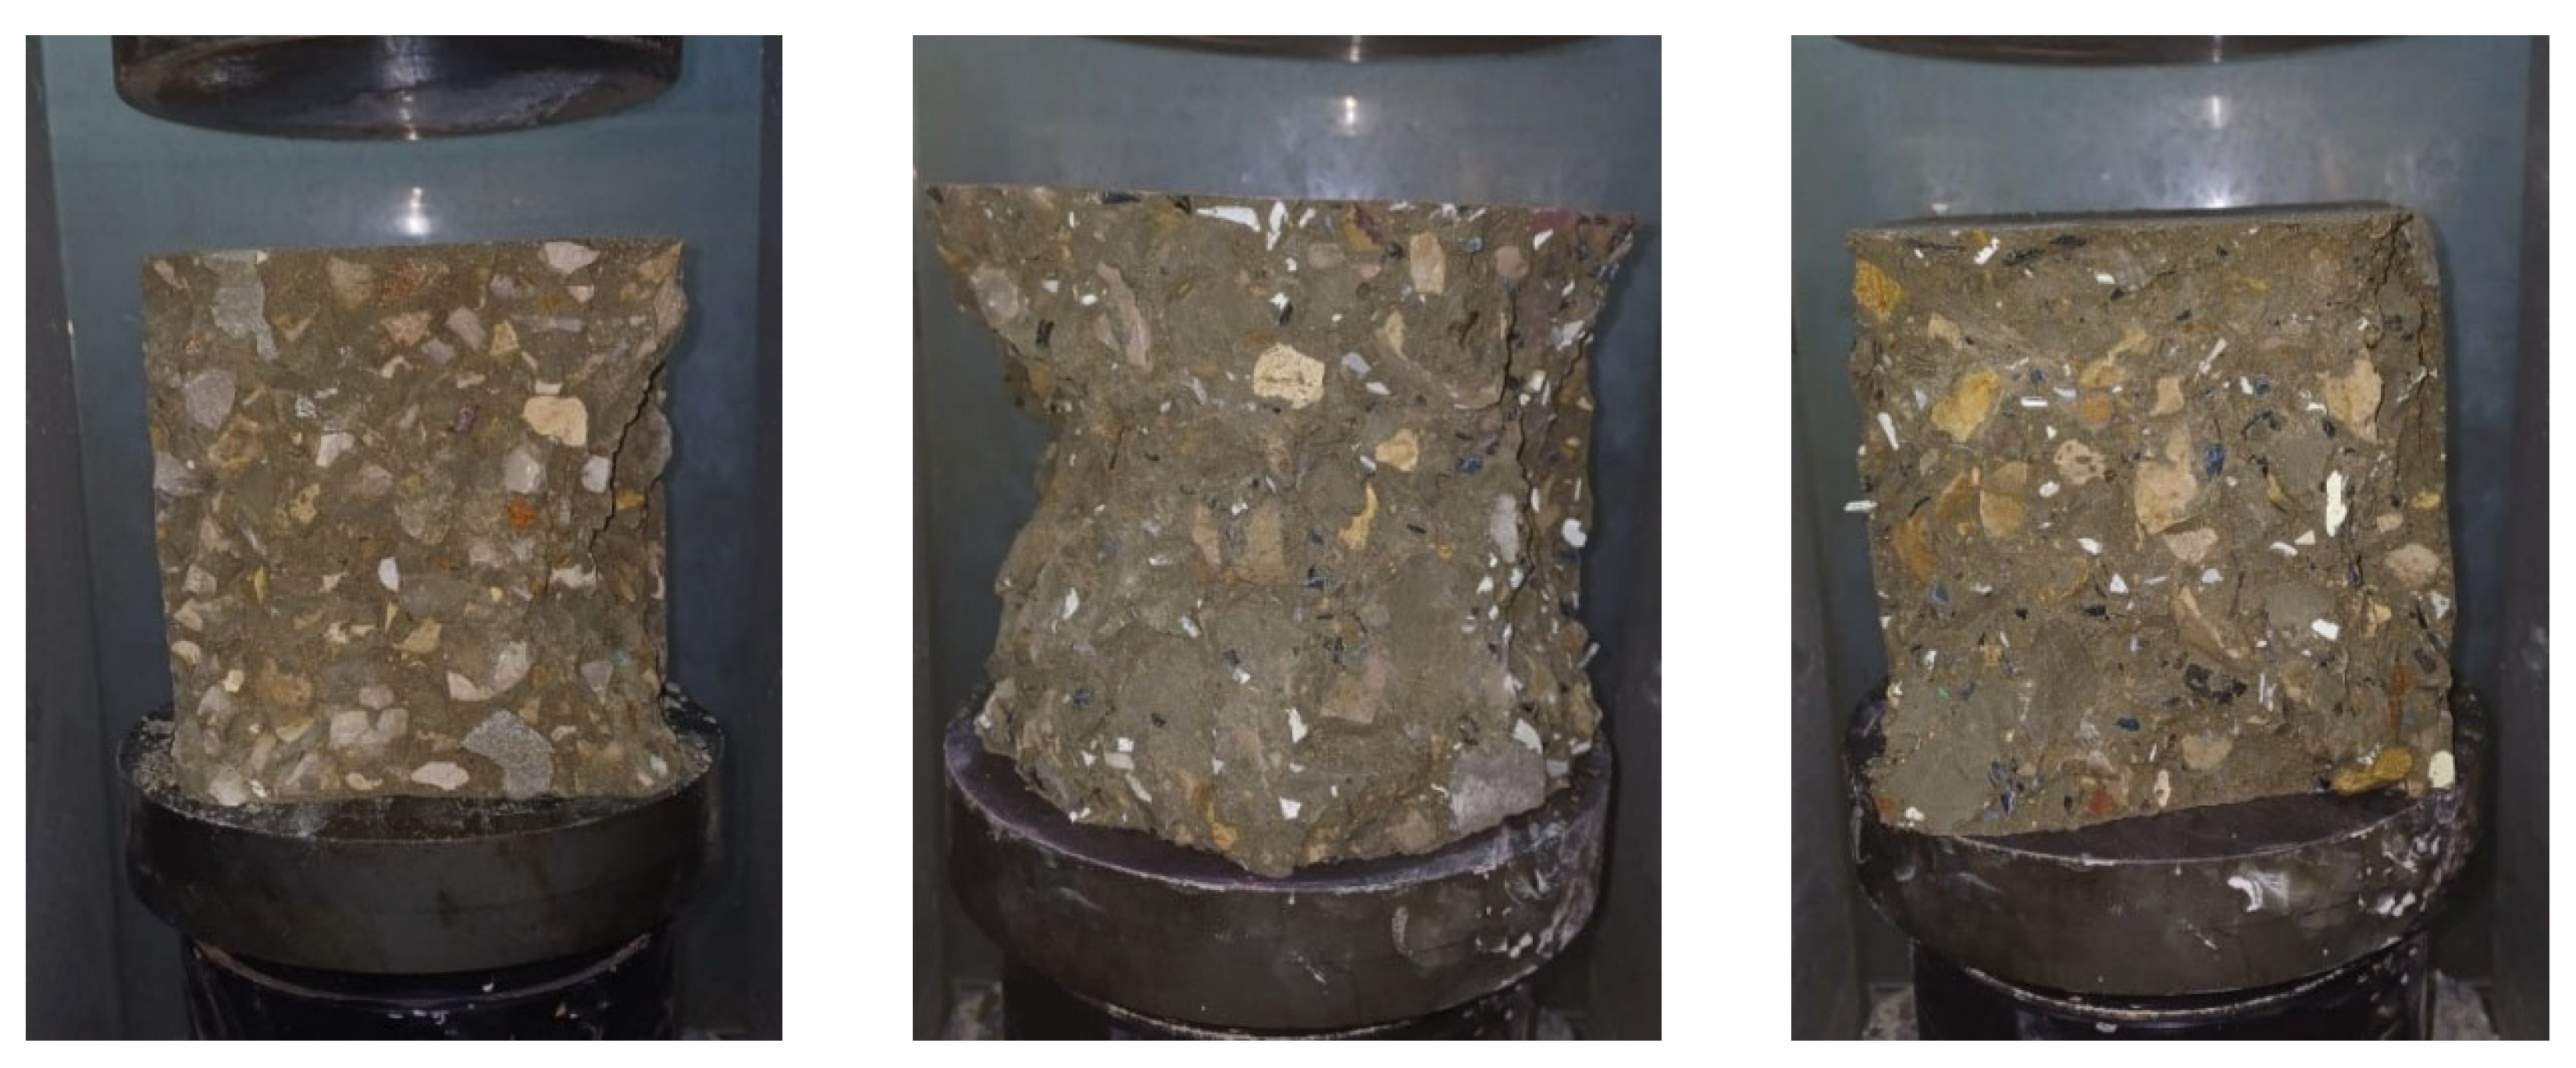
Figure 12.
Concrete cubes from each mixture with different e-waste percentages.
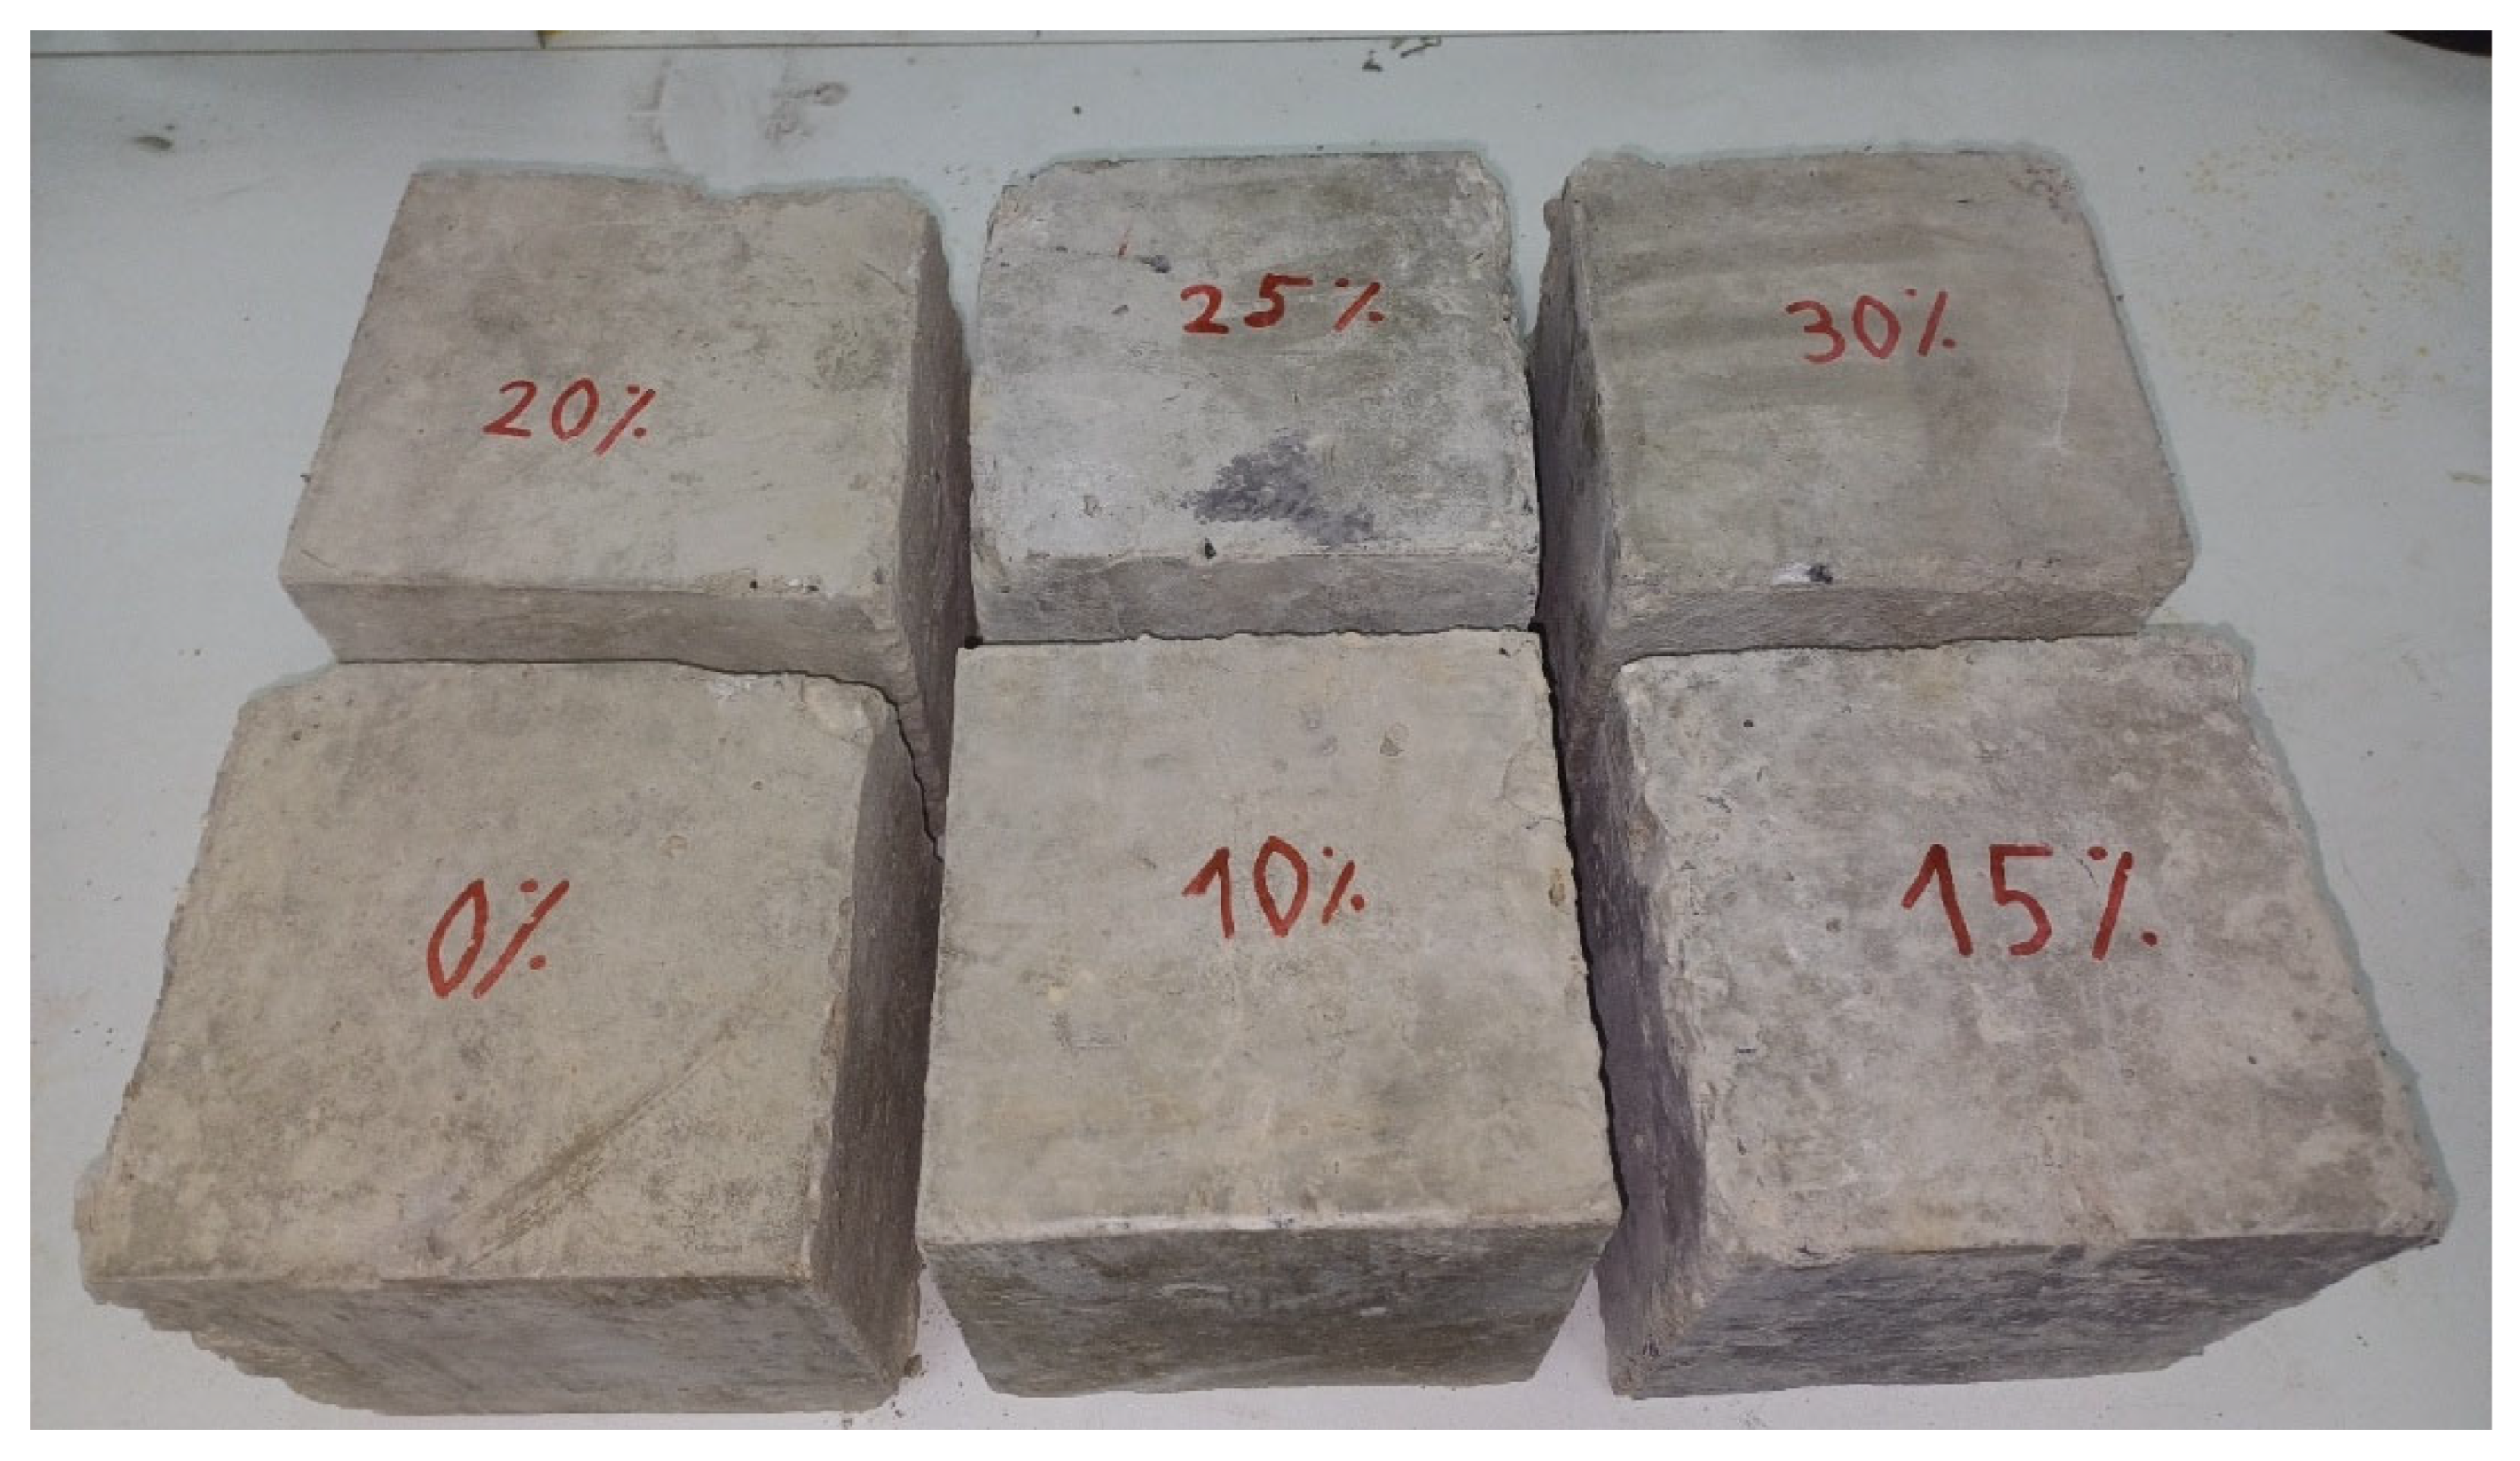
Figure 14.
The rectangular prisms or half-cube specimens in the oven.
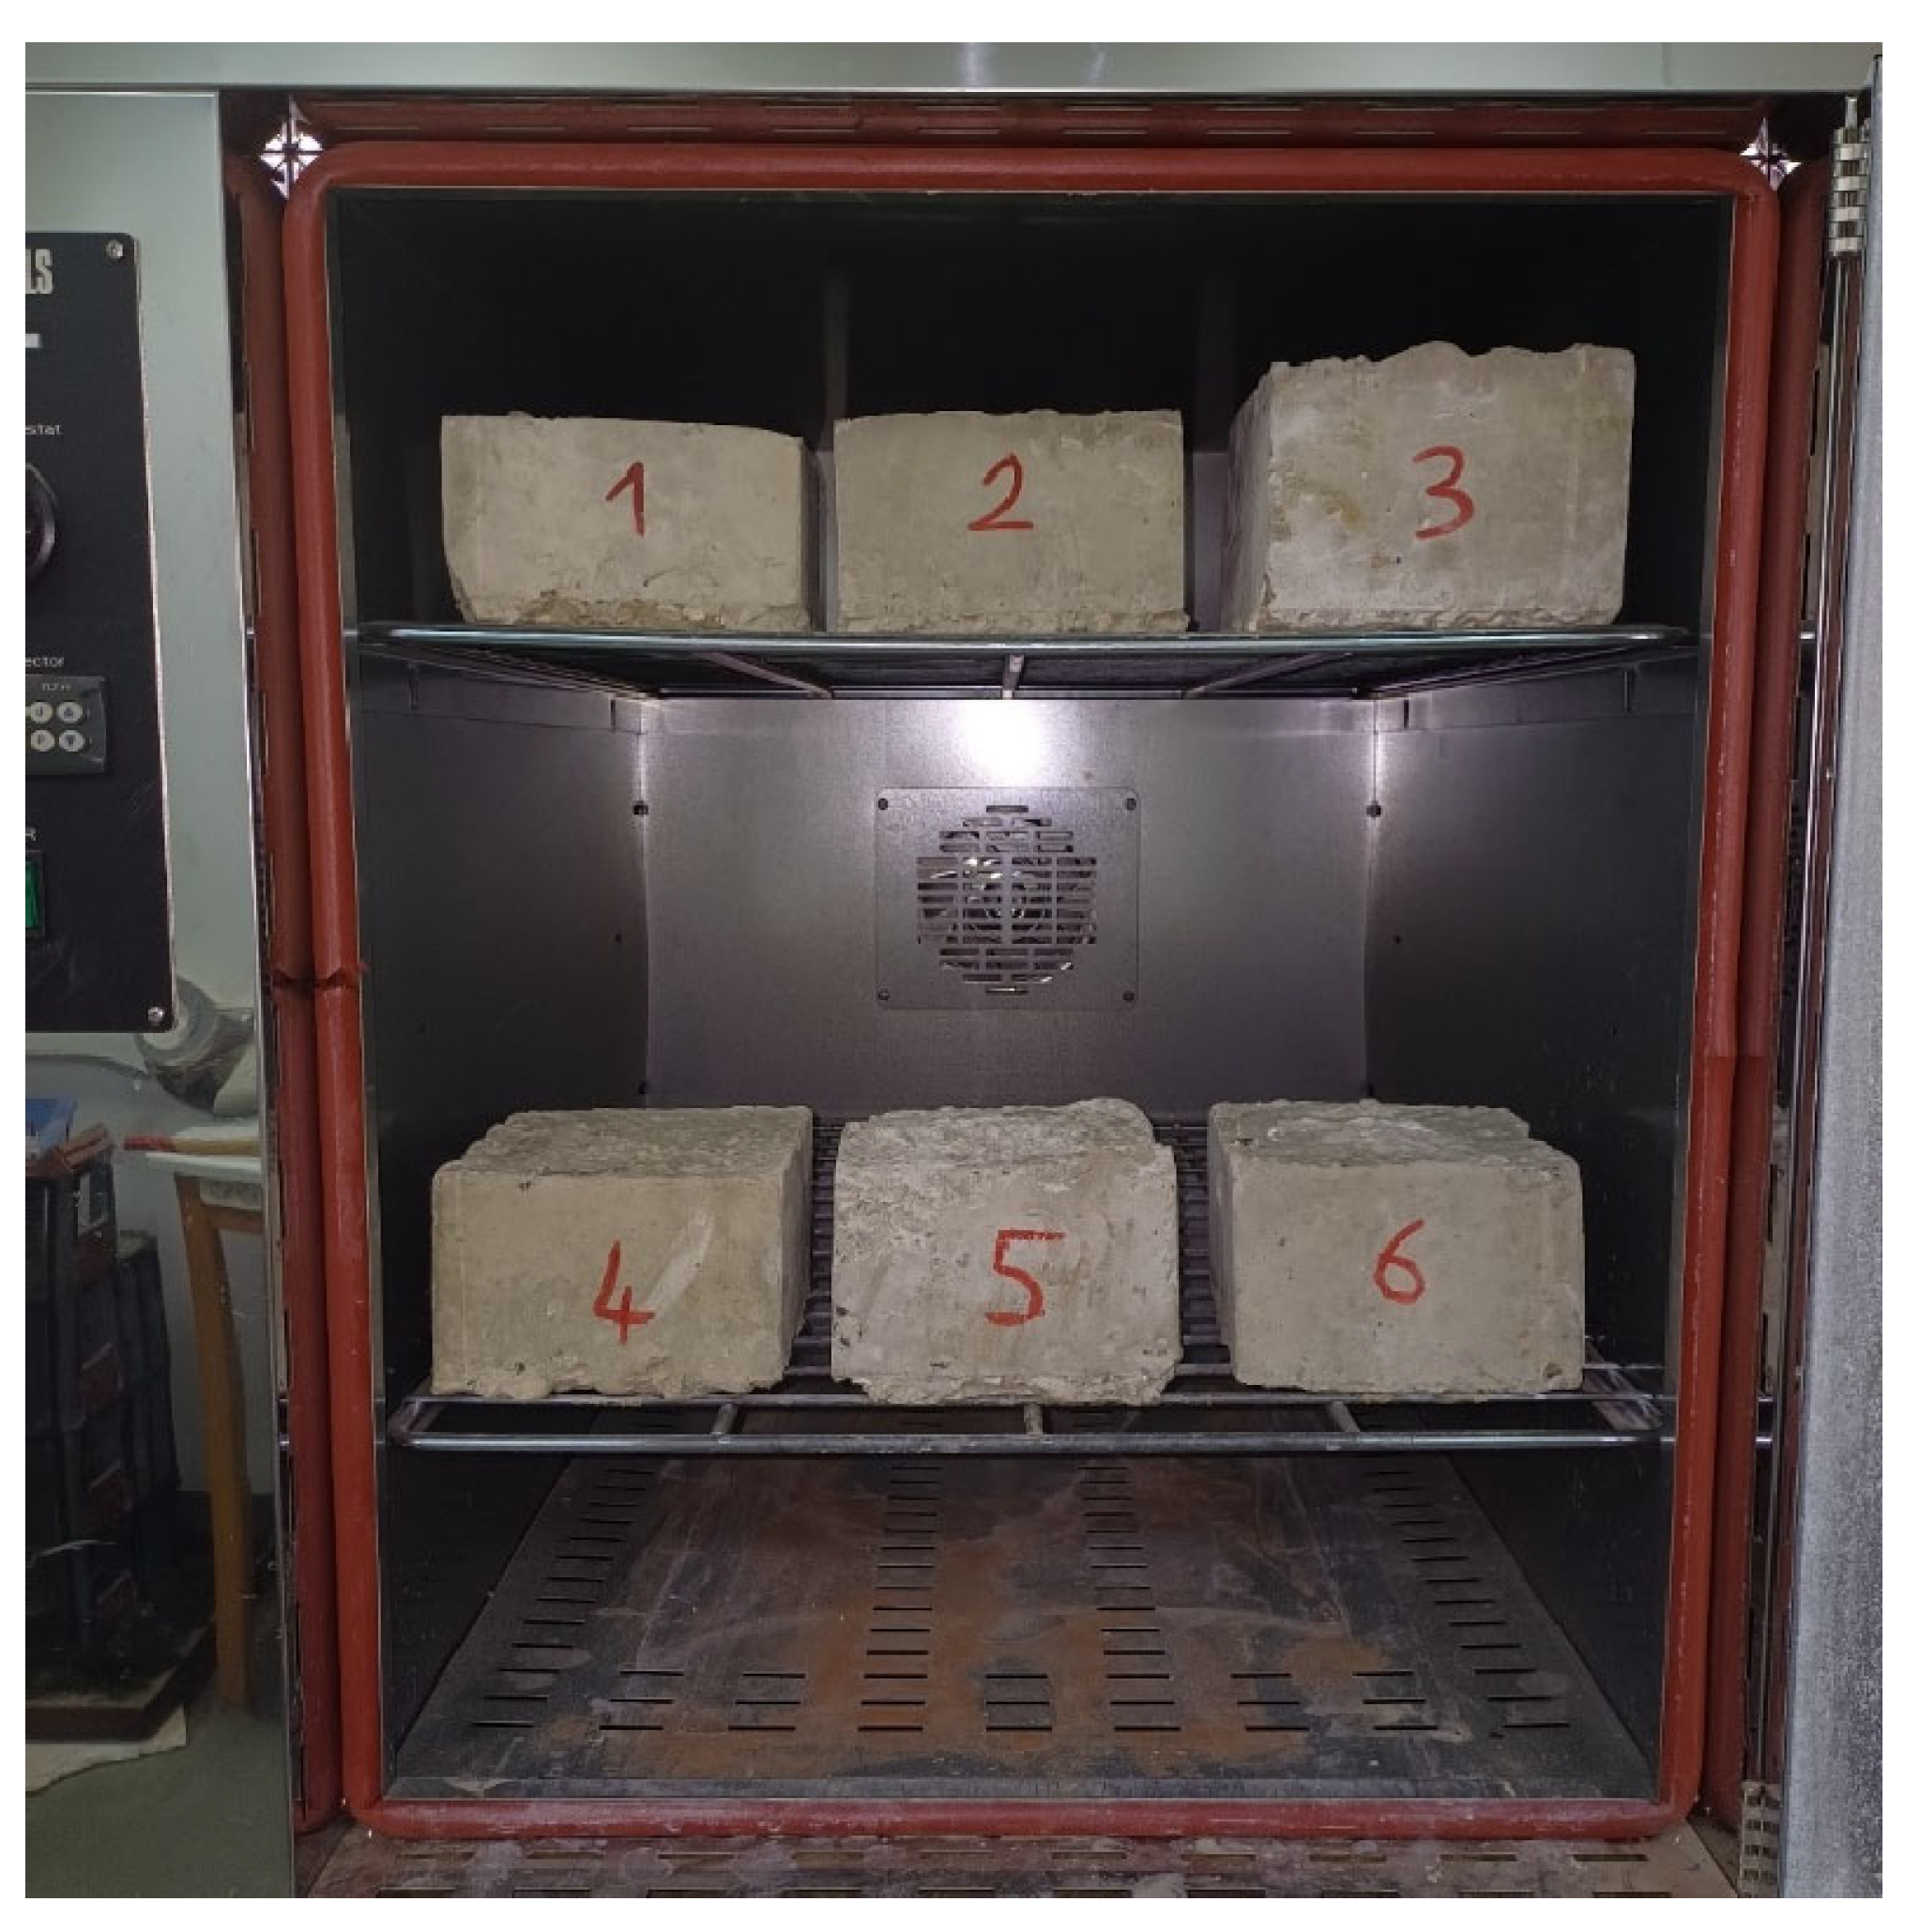
Figure 15.
Water absorption of concrete cubes with increasing e-waste percentages.
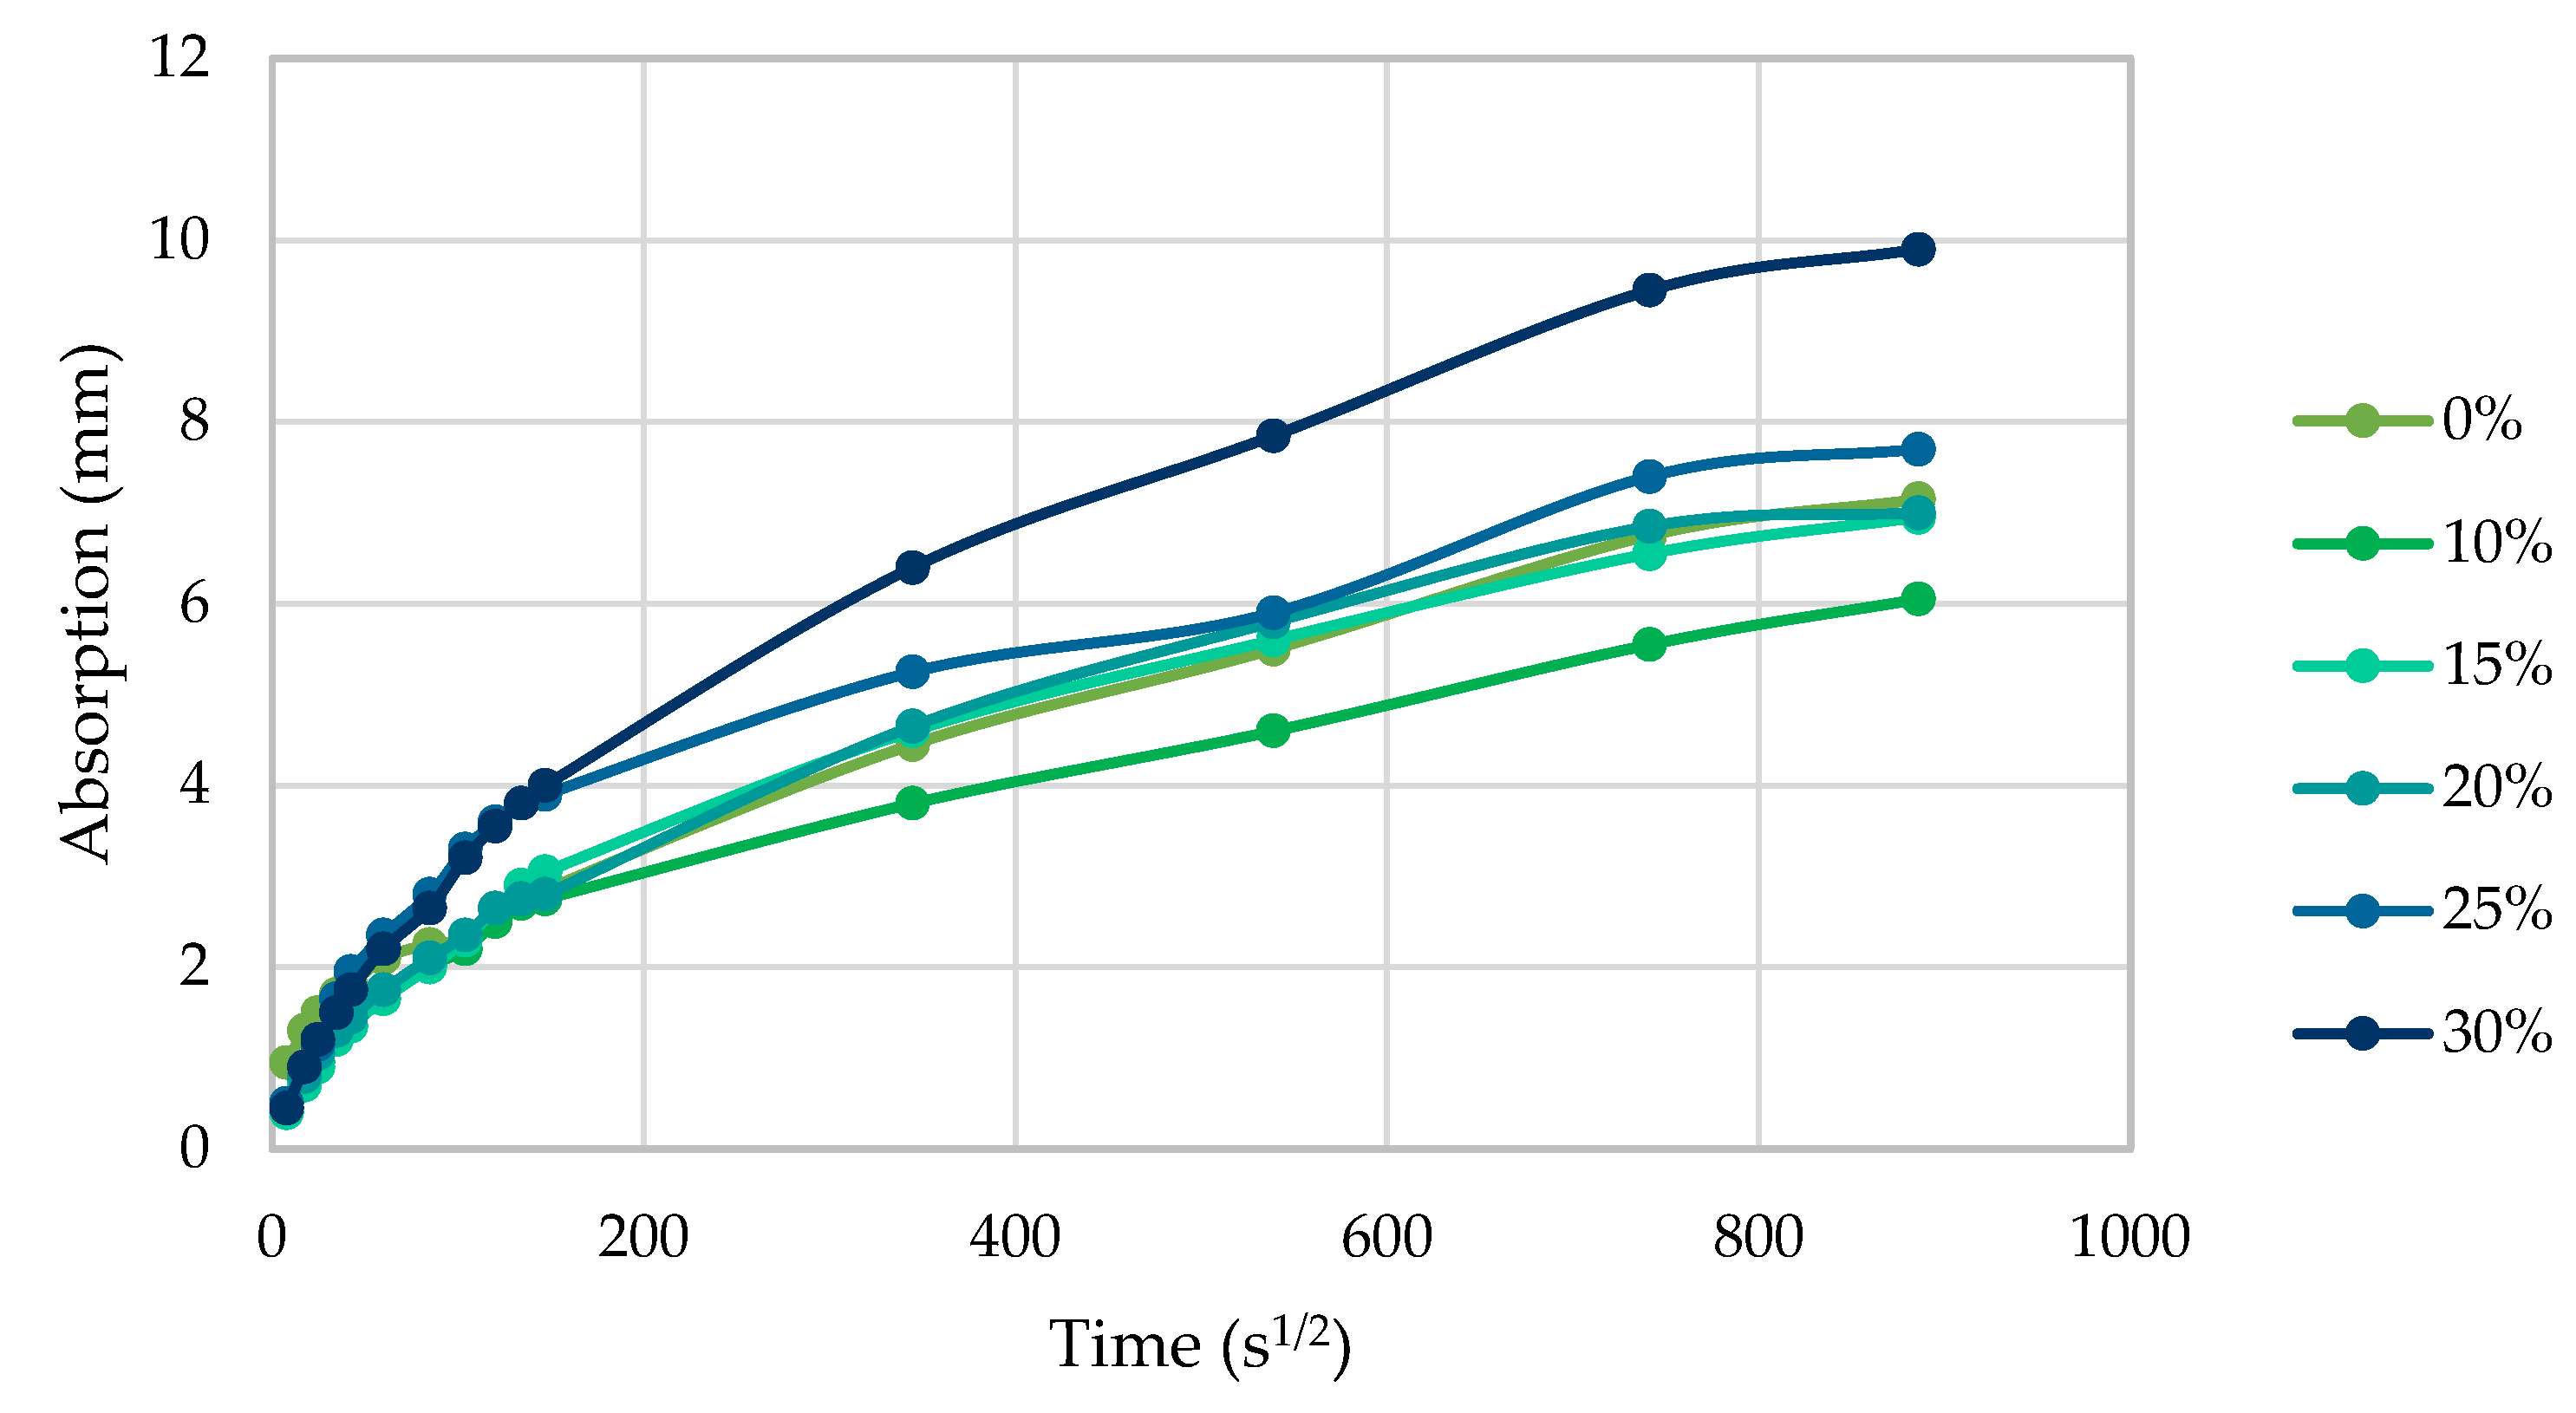
Figure 16.
Dynamic elastic modulus values with increasing e-waste percentages.
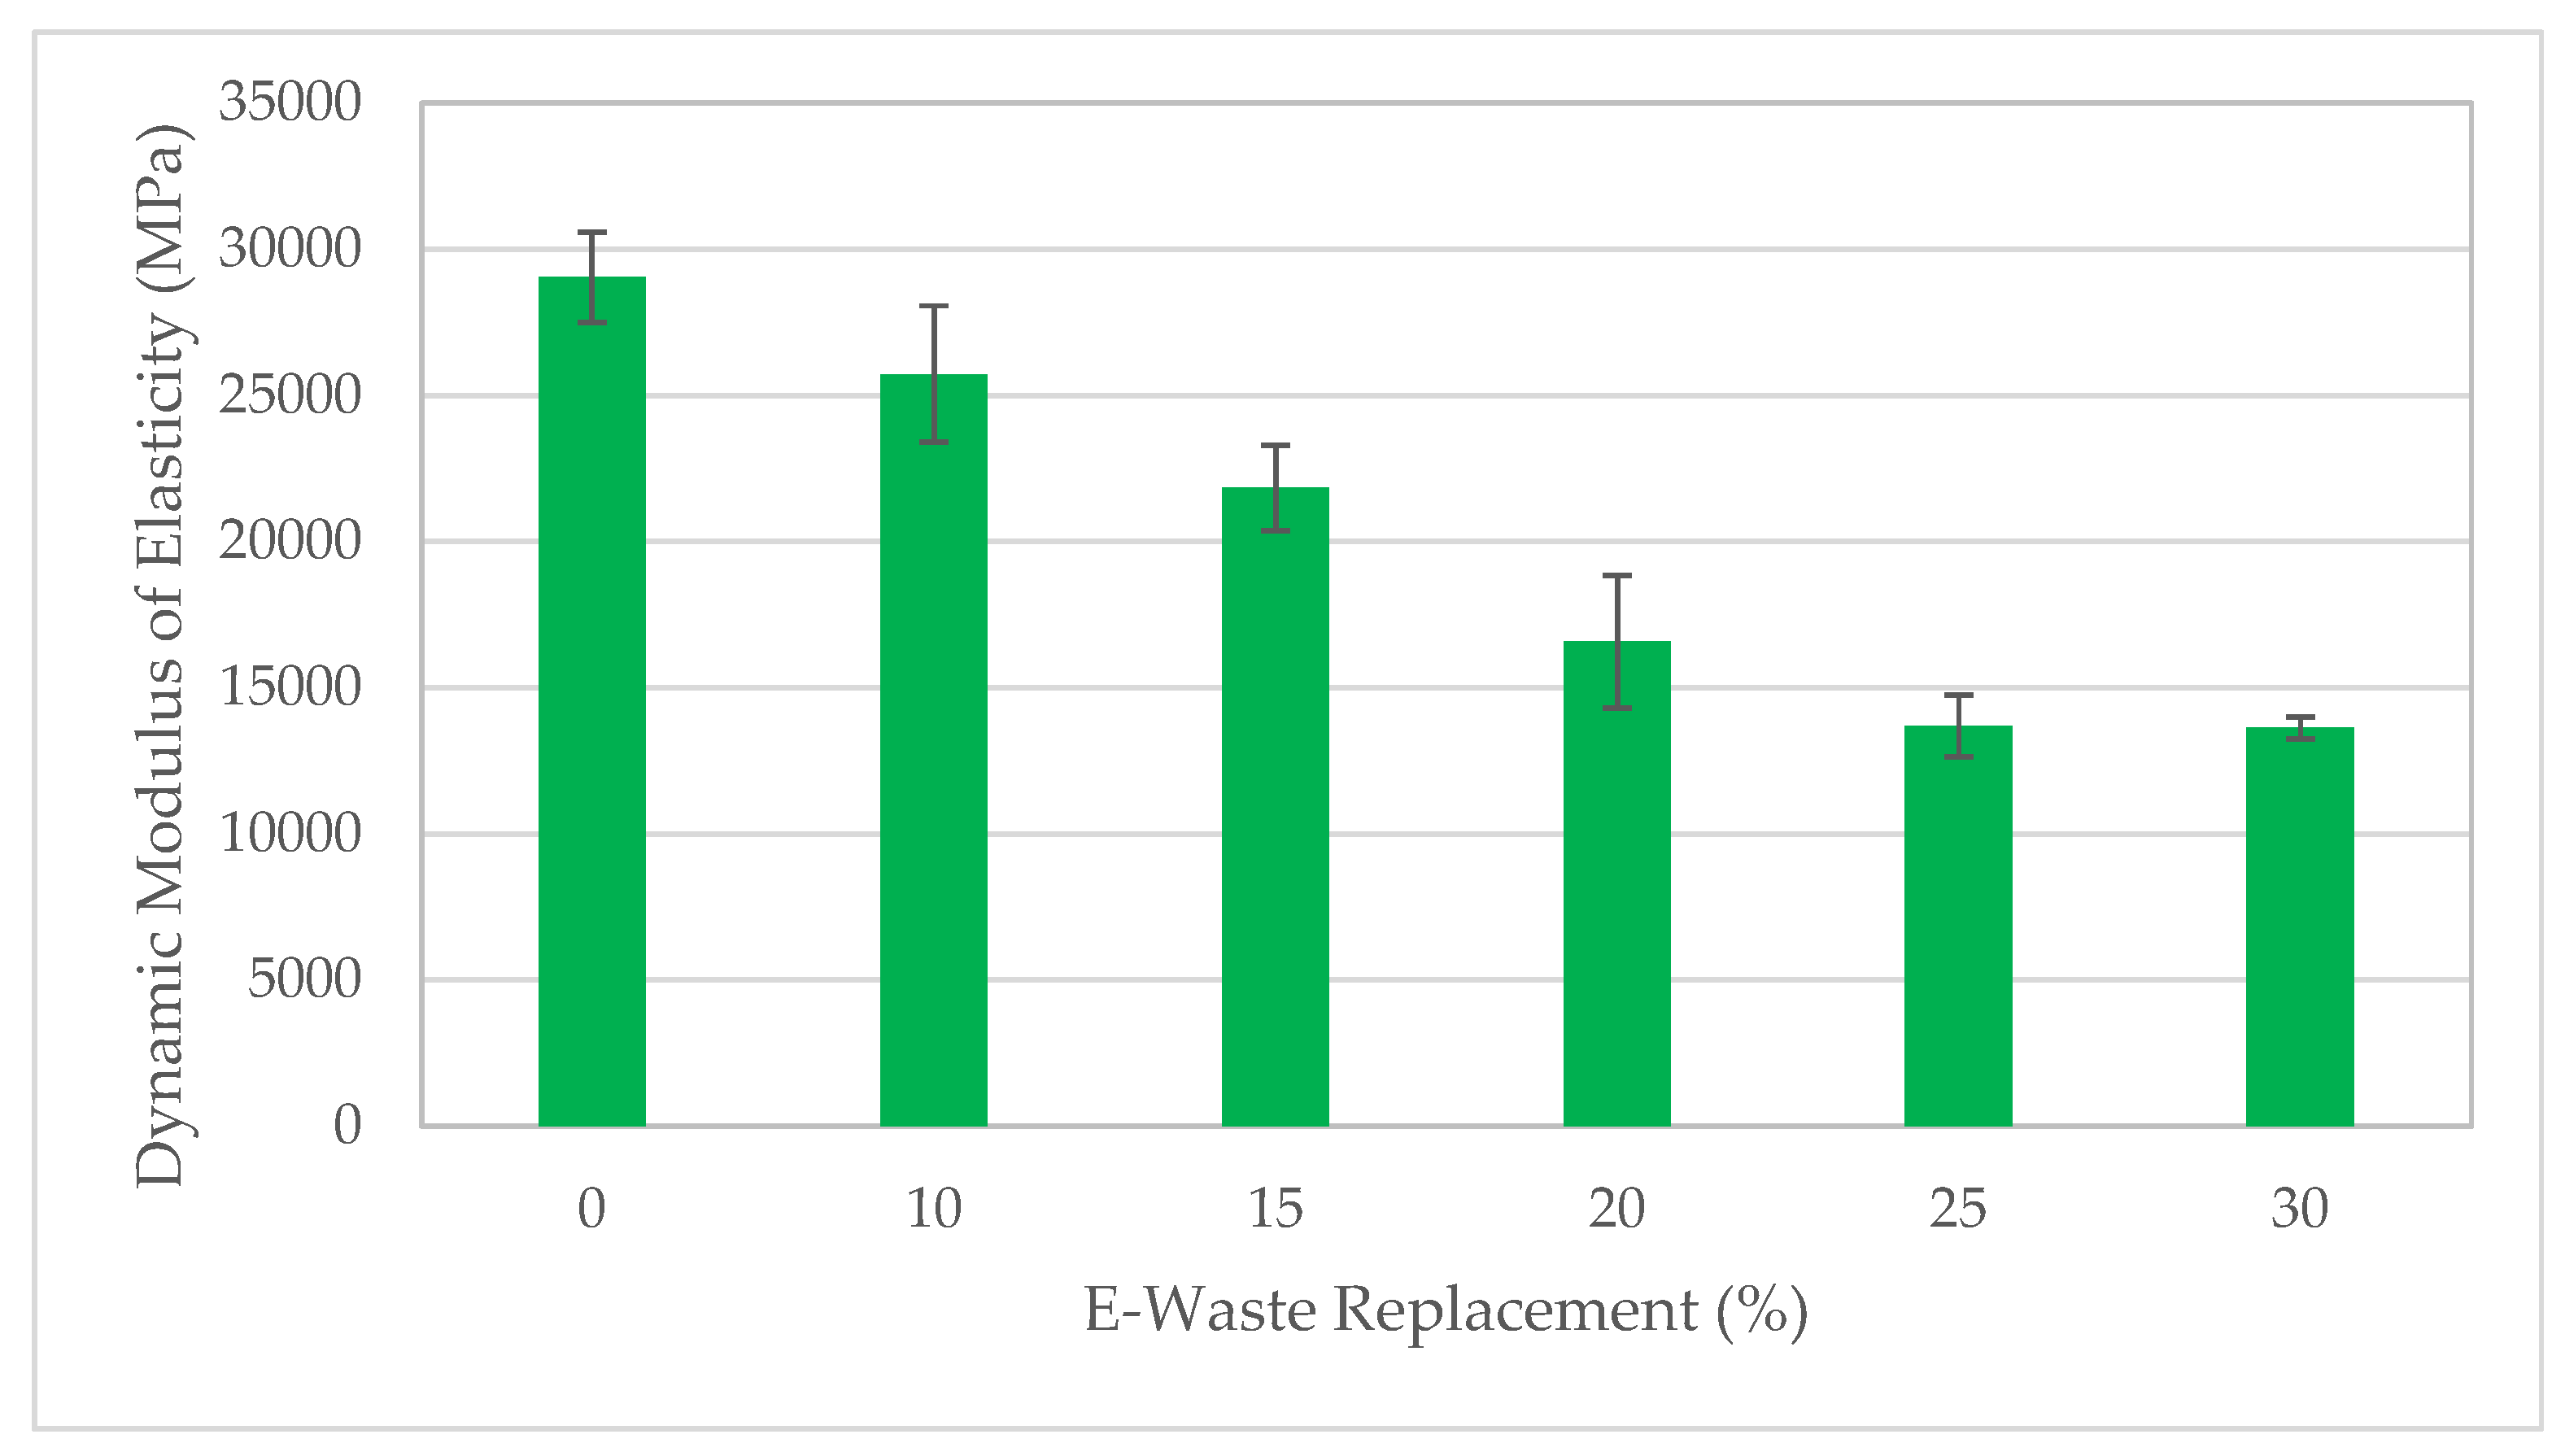
Figure 13.
Resistance and conductivity values of cubes with increasing e-waste percentages.
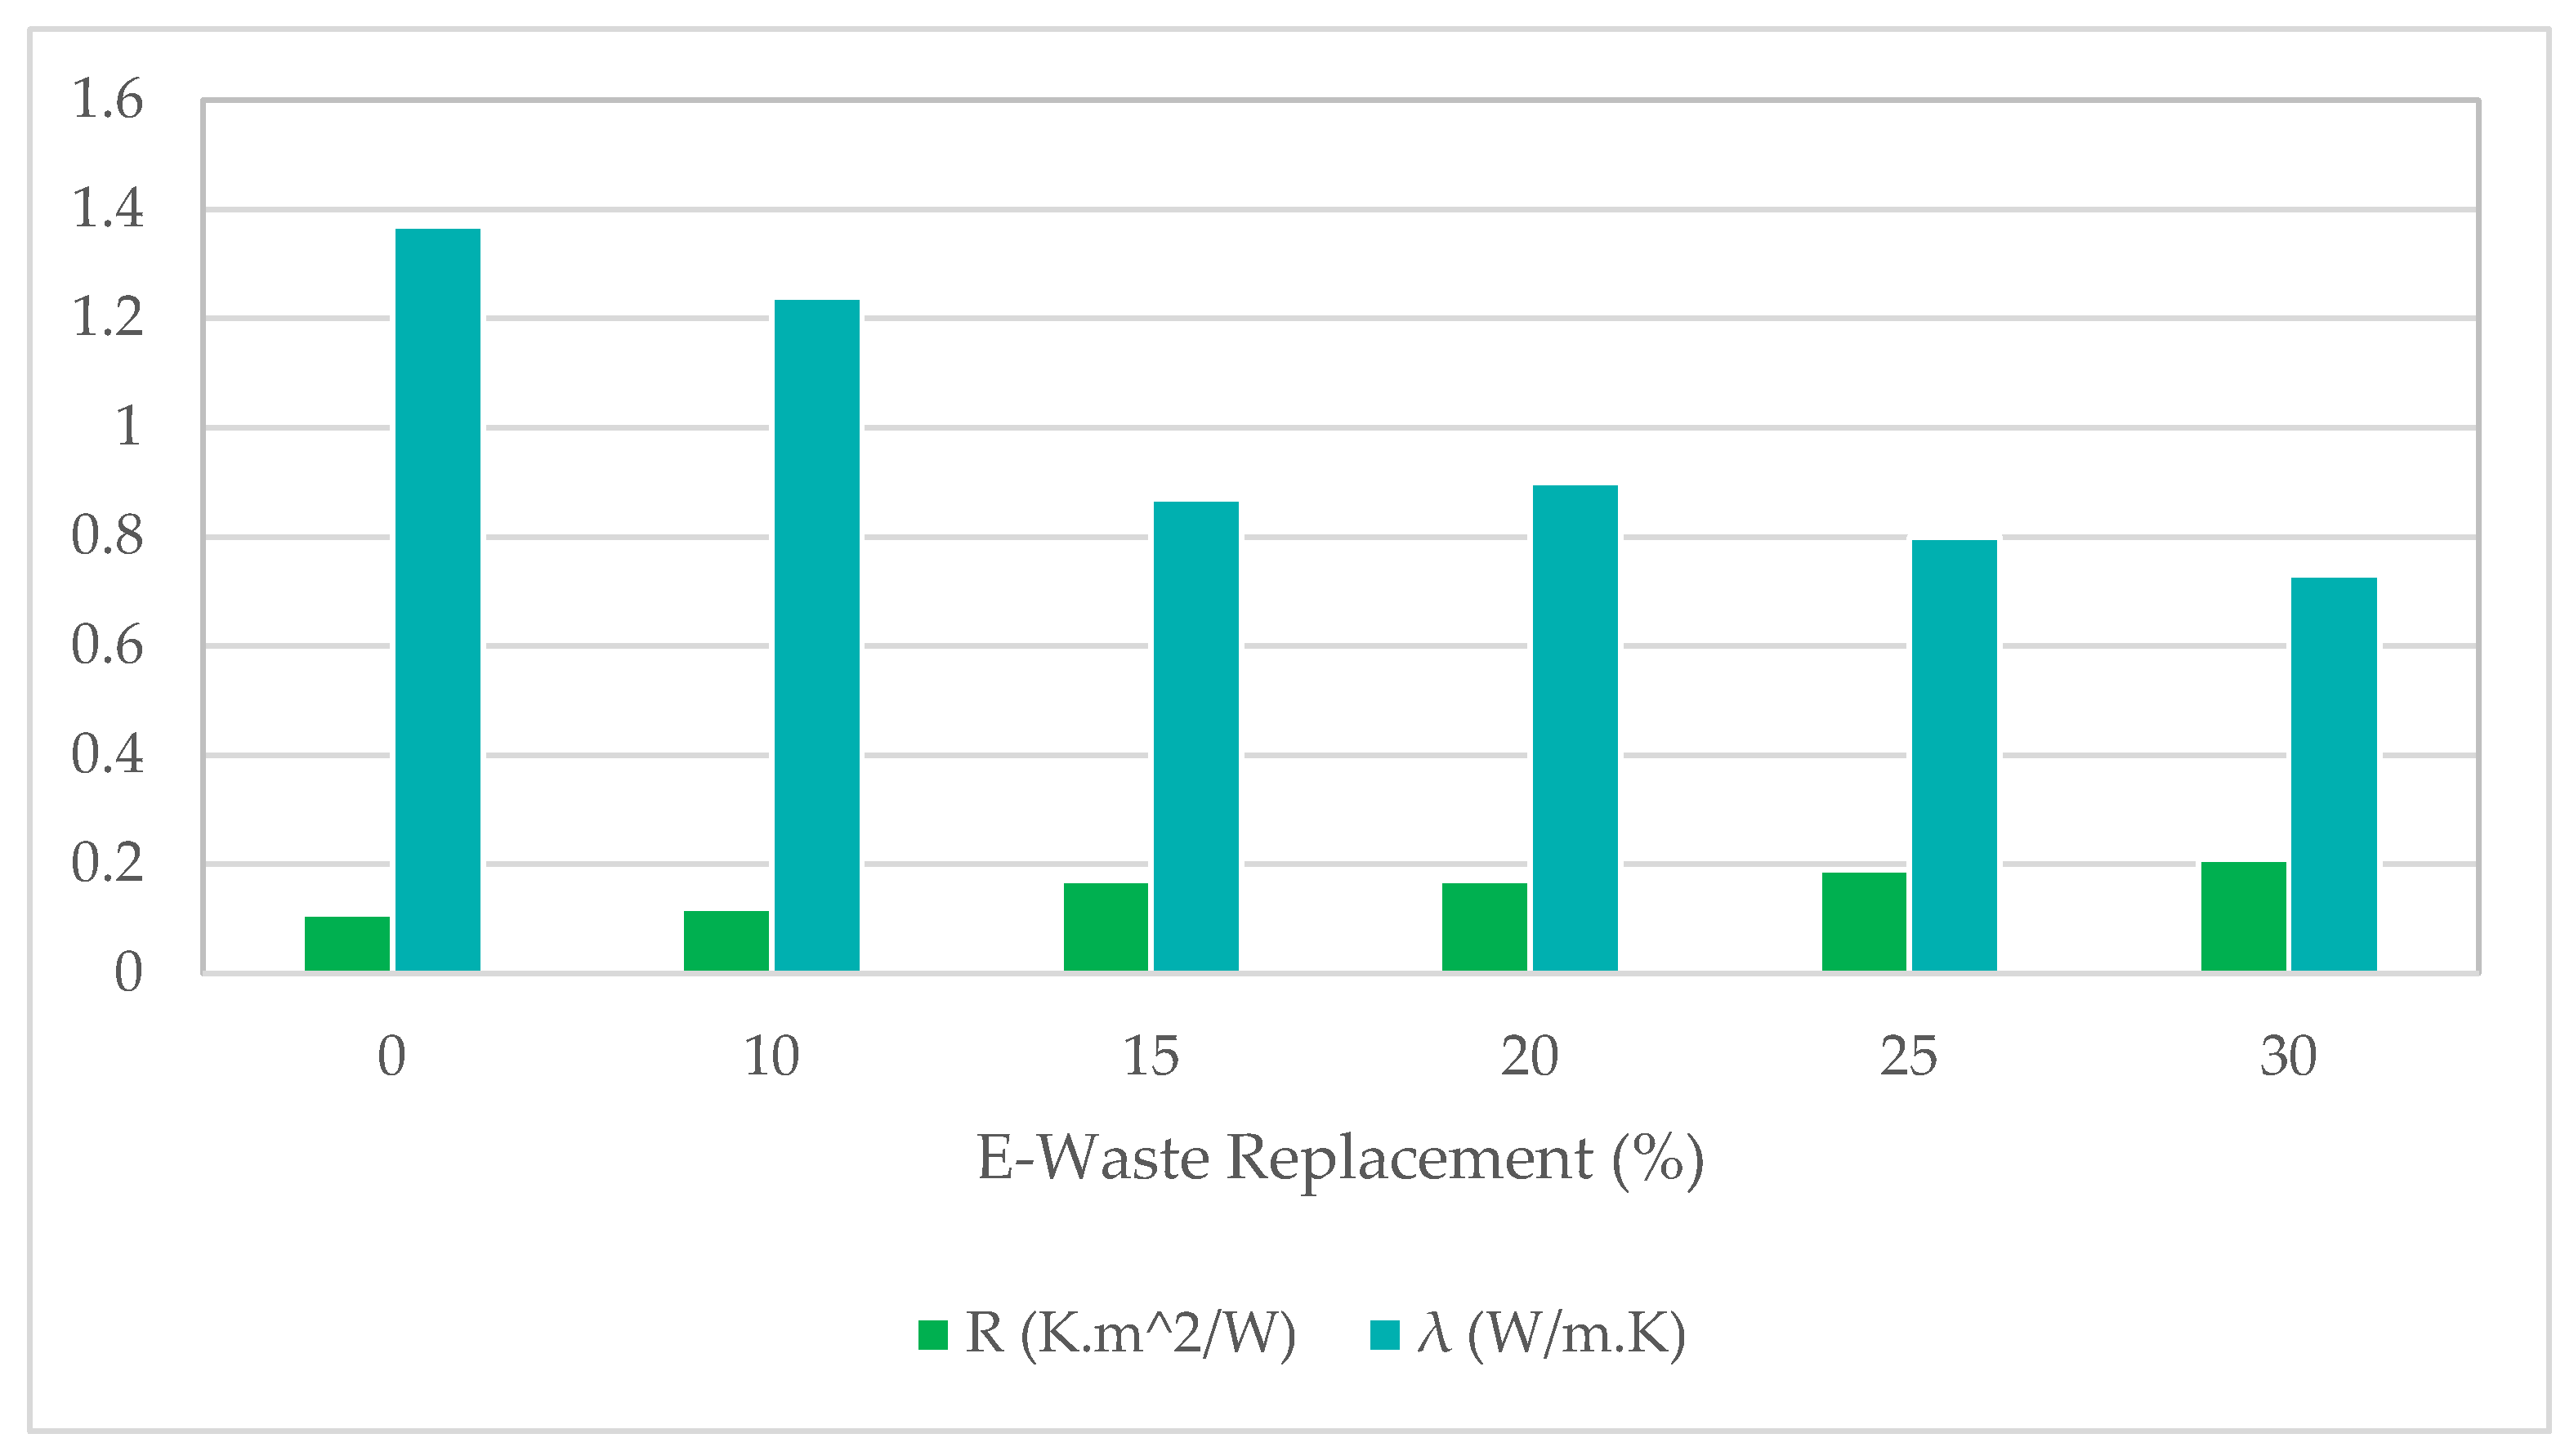
Figure 17.
Mechanical and thermal performance with increasing e-waste replacement levels.
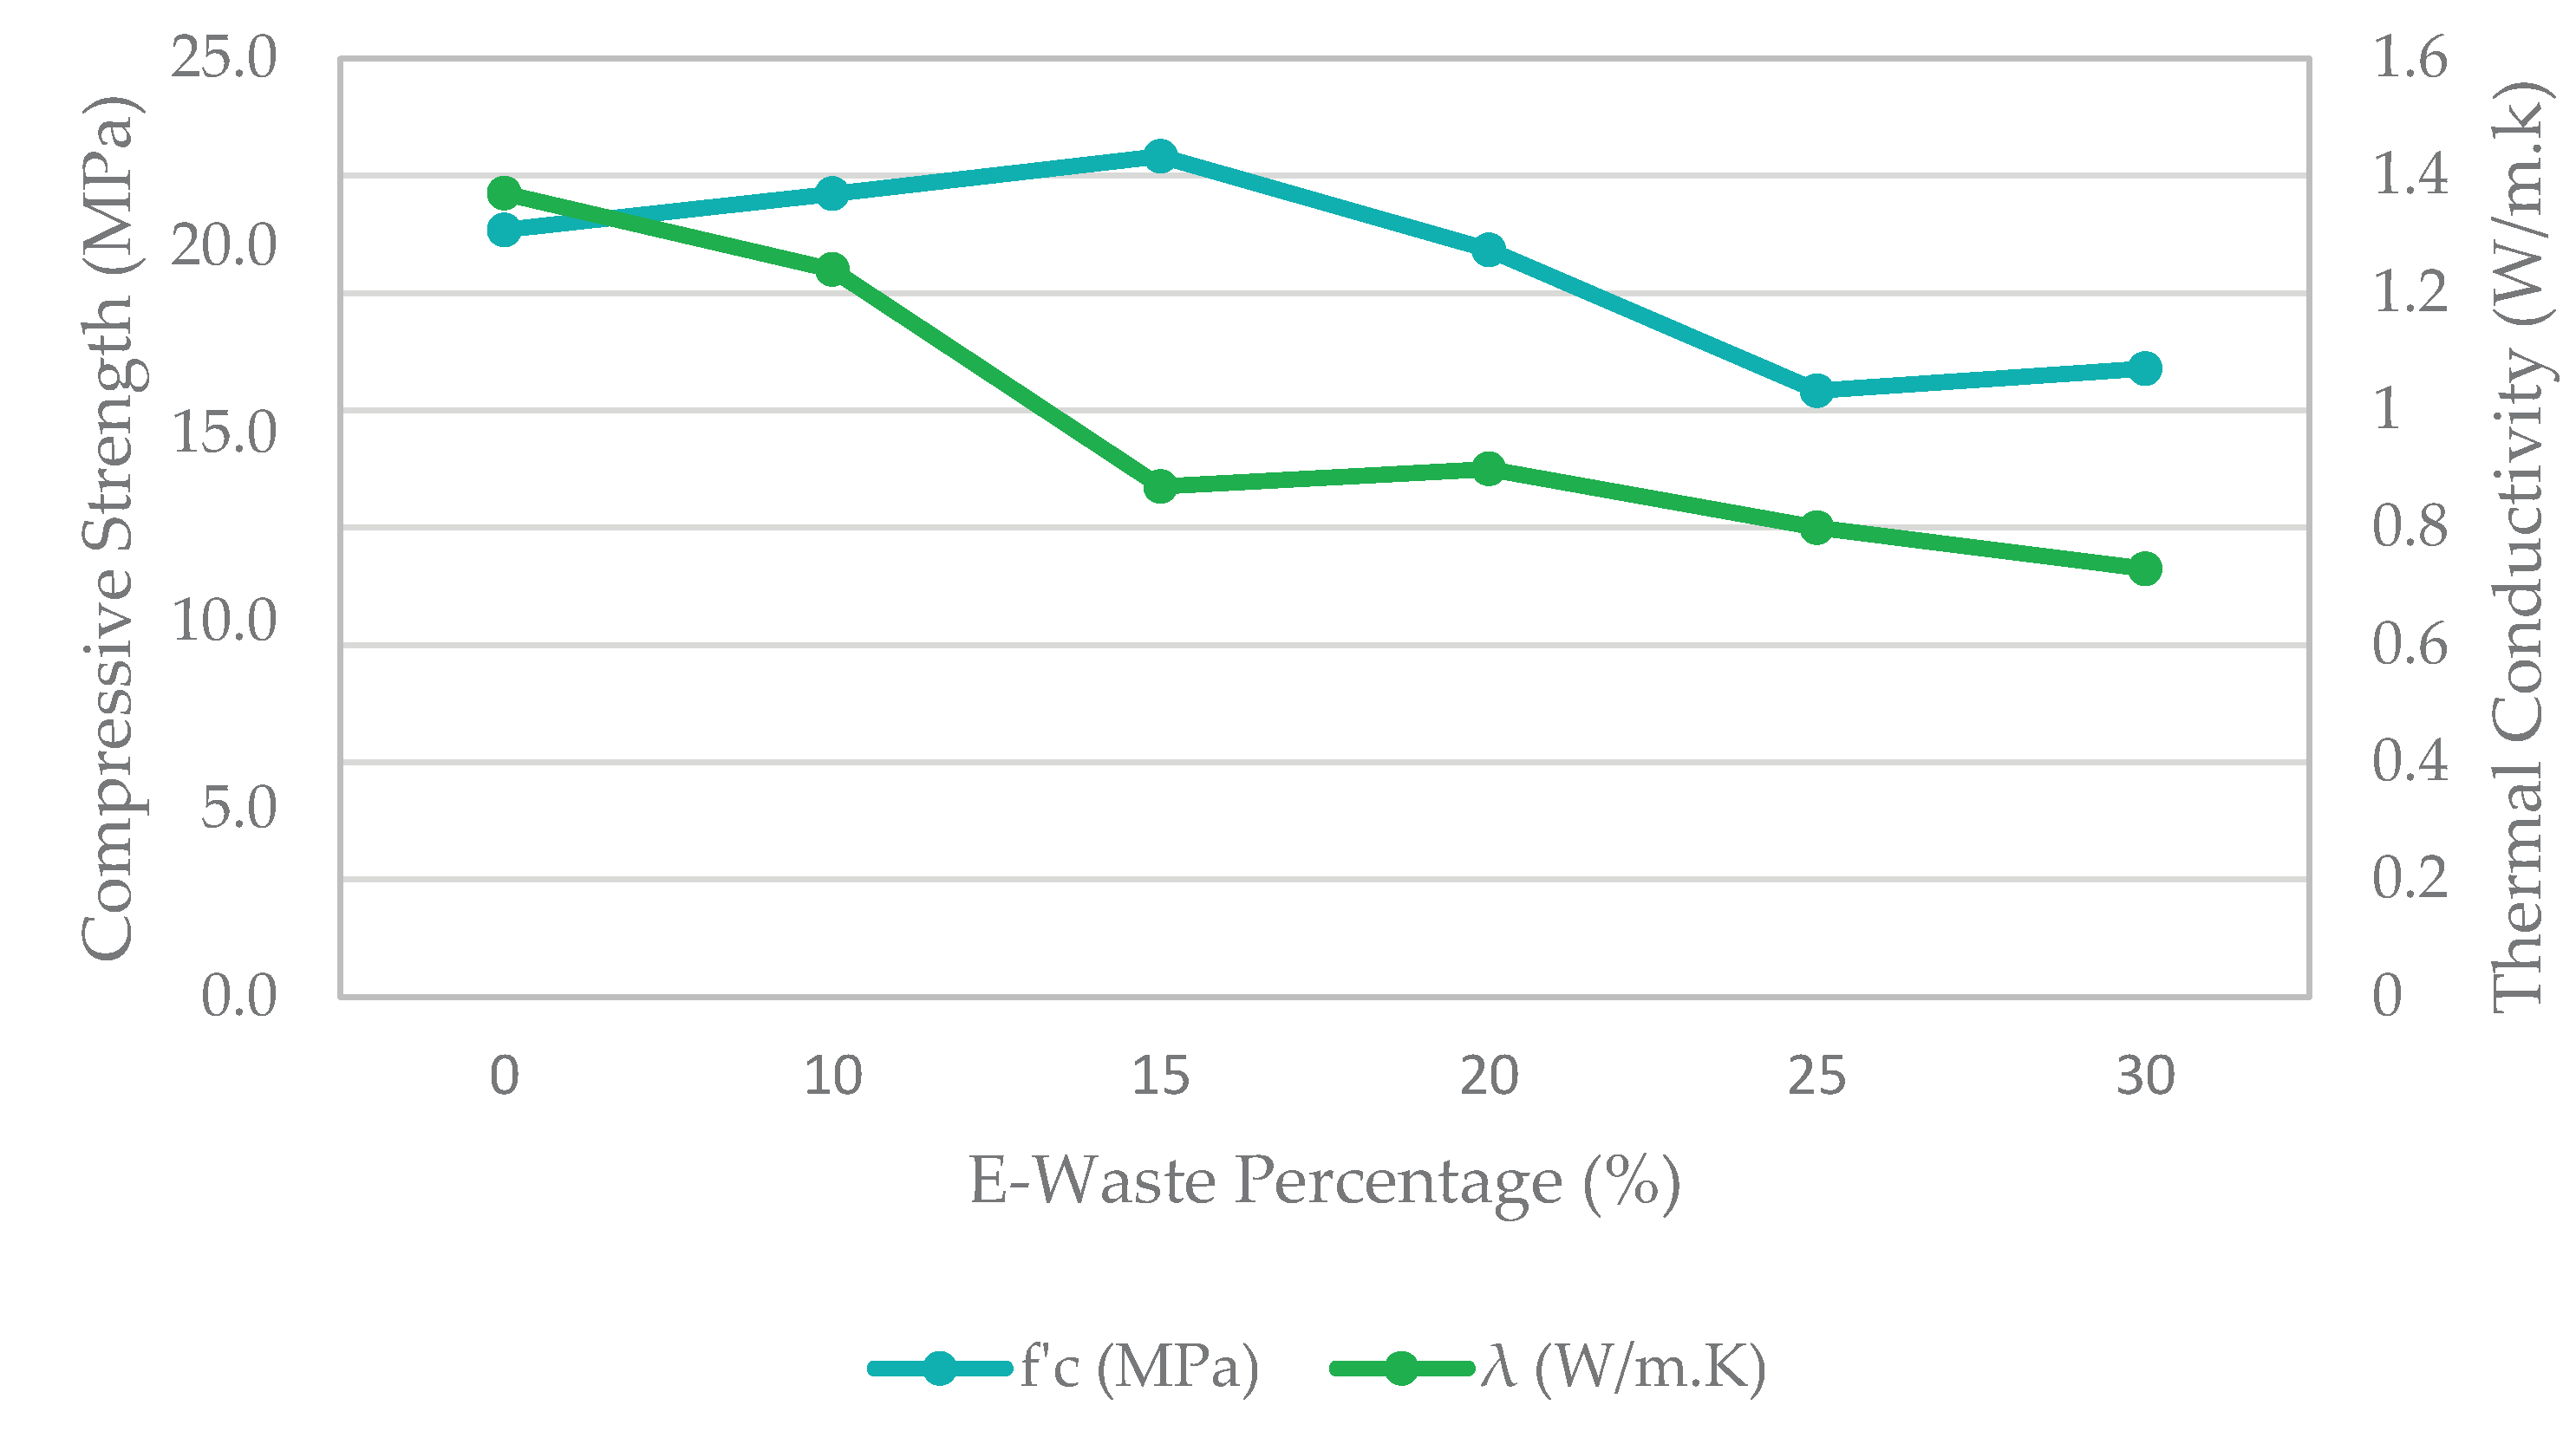

Table 1.
Conventional concrete mixture quantities and proportions.
| Parameters for 1 m3 of concrete | Values |
|---|---|
| W/C | 0.3 |
| Mass of cement (kg) | 400 |
| Mass of water (kg) | 120 |
| Density of water (kg/m3) | 997 |
| Volume of water (m3) | 0.12 |
| Volume of gravel (m3) | 0.8 |
| Volume of sand (m3) | 0.4 |
| Density of gravel (kg/m3) | 1530 |
| Density of sand (kg/m3) | 1555 |
| Mass of gravel (kg) | 1224 |
| Mass of sand (kg) | 622 |
| Density of e-waste (kg/m3) | 570 |
Table 2.
Required quantities of materials for 1 m3 of concrete mixtures in relation to e-waste percentage.
Table 2.
Required quantities of materials for 1 m3 of concrete mixtures in relation to e-waste percentage.
| Percentage of e-waste (%) | 0 | 10 | 15 | 20 | 25 | 30 |
|---|---|---|---|---|---|---|
| Volume of concrete mix (m3) | 1 | 1 | 1 | 1 | 1 | 1 |
| W/C | 0.3 | 0.3 | 0.3 | 0.3 | 0.3 | 0.3 |
| Volume of gravel (m3) | 0.8 | 0.72 | 0.68 | 0.64 | 0.6 | 0.56 |
| Mass of gravel (kg) | 1224 | 1101.6 | 1040.4 | 979.2 | 918 | 856.8 |
| Volume of e-waste (m3) | 0 | 0.08 | 0.12 | 0.16 | 0.2 | 0.24 |
| Mass of e-waste (kg) | 0 | 45.6 | 68.4 | 91.2 | 114 | 136.8 |
| Mass of sand (kg) | 622 | 622 | 622 | 622 | 622 | 622 |
| Mass of cement (kg) | 400 | 400 | 400 | 400 | 400 | 400 |
| Mass of water (kg) | 120 | 120 | 120 | 120 | 120 | 120 |
Table 3.
Updated volumes and quantities required for each e-waste concrete mixture.
| Percentage of e-waste (%) | 0 | 10 | 15 | 20 | 25 | 30 |
|---|---|---|---|---|---|---|
| Volume of concrete mix (m3) | 0.03645 | 0.03645 | 0.03645 | 0.03645 | 0.03645 | 0.03645 |
| W/C | 0.512 | 0.512 | 0.512 | 0.512 | 0.512 | 0.512 |
| Mass of gravel (kg) | 46 | 41.3 | 39 | 36.7 | 34.425 | 32.13 |
| Mass of e-waste (kg) | 0 | 1.71 | 2.565 | 3.42 | 4.23 | 5.13 |
| Mass of sand (kg) | 22.7 | 22.7 | 22.7 | 22.7 | 22.7 | 22.7 |
| Mass of cement (kg) | 14.6 | 14.6 | 14.6 | 14.6 | 14.6 | 14.6 |
| Mass of water (kg) | 8.9 | 8.9 | 8.9 | 8.9 | 8.9 | 8.9 |
Table 4.
Updated volumes and quantities required for each e-waste concrete mixture.
| Total volume and masses | Values |
|---|---|
| Volume of concrete mix (m3) | 0.22 |
| Mass of e-waste (kg) | 17.06 |
| Mass of gravel (kg) | 229.56 |
| Mass of sand (kg) | 136.2 |
| Mass of cement (kg) | 87.6 |
| Mass of water (kg) | 53.4 |
Table 5.
Summary of all results with percentages of variations with respect to the control sample.
 |
Disclaimer/Publisher’s Note: The statements, opinions and data contained in all publications are solely those of the individual author(s) and contributor(s) and not of MDPI and/or the editor(s). MDPI and/or the editor(s) disclaim responsibility for any injury to people or property resulting from any ideas, methods, instructions or products referred to in the content. |
© 2025 by the authors. Licensee MDPI, Basel, Switzerland. This article is an open access article distributed under the terms and conditions of the Creative Commons Attribution (CC BY) license (https://creativecommons.org/licenses/by/4.0/).
Copyright: This open access article is published under a Creative Commons CC BY 4.0 license, which permit the free download, distribution, and reuse, provided that the author and preprint are cited in any reuse.


