
Submitted:
26 August 2025
Posted:
27 August 2025
You are already at the latest version
Abstract
Lifestyle-related diseases, such as overweight/obesity, diabetes mellitus type 2 (T2DM), cardiovascular disease, or osteoarthritis, are a major health burden in Western societies. Due to common risk factors, most patients suffer from multimorbidity, i.e. have been diagnosed with more than one of these diseases. Physical activity (PA) is known to have a positive effect on all of these diseases, however, little is known on the effects of PA on patients with multimorbidity. In particular, so far, there are no reliable biomarkers to predict and monitor the effects of PA-based lifestyle intervention programs on these subjects. Here, employing a “mini metabolomics” approach with dried blood spots, we analyzed concentrations of different metabolites in subjects with multimorbidity in the course of the lifestyle intervention program MultiPill-Exercise. We found increasing concentrations of all tested amino acids (AAs) and acylcarnitines (ACs) after 12 weeks (t1) and 24 weeks (t2) of the intervention. When correlating baseline (t0) metabolite concentrations with changes in physiological and clinical parameters, we observed strong associations of acylcarnitine levels and changes in metabolic and cardiovascular parameters. When analyzing metabolite acute reactions in response to exhaustive exercise (ergometer test), however, there were little overall changes. Nevertheless, there was a significant negative correlation between mobilization of medium-chain acylcarnitines (MC-ACs) at t2 and changes in peak power output (PPO) between t0 and t2. Taken together, these data suggest that AAs and ACs might be promising biomarkers to predict and monitor the effects of PA-based lifestyle intervention programs in subjects with multimorbidity.
Keywords:
lifestyle-related diseases
; multimorbidity
; exercise
; metabolomics
; dried blood spots
1. Introduction
Lifestyle-related diseases, specifically overweight/obesity, diabetes mellitus type 2 (T2DM), cardiovascular disease, or osteoarthritis, represent a major health threat in Western societies. Inactivity and an unhealthy diet, excess alcohol consumption, smoking and psychosocial factors such as stress, are important risk factors. Most patients with lifestyle-related disease suffer from multimorbidity, mainly due to similar risk factors. Physical exercise is considered “poly-“ or “multipill” in the context of lifestyle-related diseases. While a range of studies could clearly demonstrate preventive, therapeutic and rehabilitative efficacy of sports and everyday-life physical activity in a broad variety of settings, studies focusing on the aspect of multimorbidity are still scarce (for review, see Nicholson et al., 2023).
The “MultiPill-Exercise” study aimed at filling this gap. Organized as a pilot study, followed by a large-scale randomized controlled trial, it focused on enhancing sport and physical activity commitment in subjects with more than one lifestyle-related disease (for details, see Schweda et al., 2022). Since a healthier lifestyle is known to yield metabolic benefits, we hypothesized that we might be able to detect changes in subjects’ metabolomes throughout the intervention, which might be associated with individuals’ health benefits and which might be employed as biomarkers for training adaptation and/or tools for individual training management in the future.
The most central players in a person’s metabolome are amino acids (AAs) and acylcarnitines (ACs). Indeed, literature data suggest effects of both acute exercise and exercise training on AA plasma profiles, since AA turnover adapts to physical activity in multiple ways and might reflect metabolic changes in response to sports (for review, see Sakaguchi et al., 2019; Schranner et al., 2020; Tian et al., 2021; Khoramipour et al., 2022). Consequently, AAs are interesting candidate biomarkers in the context of exercise, namely aromatic and branched-chain AAs (BCAAs). Nevertheless, little is known on AA patterns in subjects with multimorbidity. Interestingly, BCAAs, glucagon secretion and insulin sensitivity are mutually connected in a complex manner, suggesting associations with metabolic syndrome and T2DM pathogenesis (for review, see Flynn et al., 2020). Consistently, data by Hansen et al., 2015, suggest differential responses to exercise in people with T2DM with regard to their AA profiles. Similarly, ACs are intermediates of fatty acid metabolism, but can also be generated as by-products of BCAA metabolism or derivates of other organic acids (Rinaldo et al., 2008). Exercise and training are known to affect both AC and free carnitine concentrations in the circulation. Acute exercise is known to enhance concentrations of most ACs paralleled by decreases in free carnitine levels (Adeva-Andany et al., 2017; Schranner et al., 2020). In addition, several authors demonstrated increased AC concentrations in the context of overweight/obesity, insulin resistance and T2DM. Their pro-inflammatory activity is associated with decreased fatty acid oxidation and a low level of metabolic flexibility, rendering them important candidate biomarkers in subjects with multimorbidity (Rutkowsky et al., 2014; McCoin et al., 2015). Interestingly, Huffman et al., 2011, demonstrated decreased concentrations of circulating ACs in parallel to activity-induced improvements in insulin sensitivity. Consistently, data of a large study by the same group suggest that skeletal muscle metabolic signatures of subjects at risk of metabolic disease change during a six-months training intervention – and that they are associated with changes in cardiovascular parameters and might be indicators of metabolic flexibility and plasticity (Huffman et al., 2014).
These data suggest that metabolic parameters might be important biomarkers in the context of exercise-based lifestyle intervention programs for subjects with multimorbidity, such as MultiPill-Exercise. For routine applications, however, easy and cost-effective procedures are required, such as analysis of metabolites from dried spots of capillary blood via tandem mass spectrometry (MS/MS), a method that has been established for the detection of metabolic diseases in newborns for a long time (Skogvold et al., 2023). Here, we employed this method to detect changes in AA and AC profiles in selected MultiPill-Exercise subjects and correlated patterns with the development of physiological and clinical data throughout the intervention.
2. Materials and Methods
2.1. MultiPill-Exercise Pilot Study
The study was conducted in accordance with the Declaration of Helsinki, approved by the “Ethics Committee of the Medical Faculty, University of Tübingen” (reference number: 298/2019BO2, 04.05.2019) and registered at the German clinical trial register (DRKS00016702). Written informed consent was obtained from all subjects. The lifestyle intervention program was designed as a 24-week schedule, split up into two twelve-week blocks, the first of which was more closely supervised and the second more self-directed. Subjects were required to meet “multimorbidity characteristics”, which meant that they had to have been diagnosed with at least two of four lifestyle diseases (T2DM/manifest or risk thereof, overweight/obesity, cardiovascular disease/ hypertension or osteoarthritis (OA)). Diagnostics, including blood sampling, was carried out at baseline (t0), after the first twelve-week block (t1) and at the end of the intervention (t2). (for details, see Schweda et al., 2022). Altogether, n=39 subjects were included in the study, which were analyzed in two “waves”, one starting in late August of 2019 (n=20; MP1901-1925) and the other in mid-January of 2020 (n=19; MP1927-1953). Missing numbers were assigned to potential subjects that had to be excluded from the study during diagnostics. Due to the COVID19 pandemic, t1 diagnostics for all subjects of “wave 2” had to be cancelled, in addition, for this group, the intervention program had to be significantly modified according to contact restrictions associated with the pandemic (for details, see Schweda et al., 2022). Finally, there were some dropouts from the study (for details, see Table 1). As a consequence, “at rest” data for all three time points (t0, t1 and t2) were only available for n=6 subjects, all of them female, with a mean age of 59.67 years, were available. For subject MP1902 (female, age 54 years), at least t0 and t1 data were available. At t2, metabolomics patterns were also assessed in response to acute exercise, i.e., dried blood spots were sampled before and after spiroergometry diagnostics. Here, data for n=26 subjects were available.
2.2.“. Mini Metabolomics”: Metabolomics Analysis from Dried Blood Spots
Capillary blood was taken from subjects’ earlobes, immediately spotted on “Guthrie” paper cards and allowed to dry. Metabolomics patterns were determined by the “Screening Labor Hannover” using MS/MS, for some metabolites, for example BCAAs, coupled to liquid chromatography (LC) (LC-MS/MS). Table 2 lists all metabolites analyzed and abbreviations used in this paper. Usually, ACs are classified as short-chain (SC-ACs, C2-C6), medium-chain (MC-ACs, C8-C12) and long-chain (LC-ACs, > C12).
2.3. Statistical Analysis
Statistical analysis was carried out using software SPSS for Macintosh, Version 26.0 (IBM Corporation, Armonk, New York). After compiling all data in a comprehensive table, metabolite baseline concentrations (t0) as well as changes in physiological and clinical parameters after 12 weeks (t0-t1) were tested for normal distribution using Kolmogorov-Smirnov and Shapiro-Wilk statistical tests. In case of normal distribution, t-tests for paired samples were applied, otherwise, Wilcoxon testing for differences was carried out. Potential correlations were tested using Spearman rank correlation coefficients. Significance was defined as p < 0.05 (*), p < 0.01 (**) and p < 0.001 (***). The MultiPill-Exercise pilot study represents an explorative, hypothesis-generating approach. Therefore, no correction factors for multiple testing were introduced.
3. Results
3.1. Individual Metabolite Kinetics Throughout the Intervention
To characterize individual metabolite patterns, we first determined time courses for individual subjects throughout the intervention. Unfortunately, for various reasons, mainly technical issues and dropout from the study, complete data sets consisting of t0, t1 and t2 data were only available for n=6 subjects (MP1915, MP1916, MP1922, MP1923, MP1924, and MP1925), for one additional participant (MP1902), at least t0 and t1 data could be obtained. Both t0 and t2 data were available for n=21 participants (MP1915, MP1916, MP1922, MP1923, MP1924, MP1925, MP1927, MP1930, MP1932, MP1934, MP1937, MP1940, MP1942, MP1946-MP1953) (Table 1). As shown in Figure 1 and Table 3, there was a general increase in all AAs and ACs throughout the study, whereas free carnitine showed a moderate decline. In addition, there were some individual variations, specifically with regard to Cit, Phe, free carnitine and MC-ACs.
3.2. Correlation Analysis
Against this background, we analyzed potential correlations between metabolite patterns and physiological and clinical parameters. For this purpose, using Spearman correlation analysis, we first examined potential associations between t0 metabolite concentrations and changes in physiological and clinical parameters between t0 and t1, i.e., after 12 weeks of training intervention. As shown in Table 4 and Figure 2, we found a few significant correlations between AA t0 concentrations and clinical parameters. Specifically, we could detect positive correlations between Cit concentrations and changes in fasting blood glucose as well as between tyrosine concentrations and changes in systolic RR. However, when analyzing carnitine and AC concentrations, we found a range of significant correlations with changes in clinical parameters, specifically relating to inflammation, glucose as well as lipid metabolism and blood pressure / cardiovascular disease. In particular, there was a positive correlation between free carnitine and ΔCRP, as well as of SC- and MC-ACs with ΔHbA1c, fasting glucose and cholesterol. In addition, t0 concentrations of free and total carnitine negatively correlated with ΔdiastRR und ΔsysRR. These data indicate that baseline concentrations of carnitine and ACs might represent promising biomarkers in the context of training adaptation in this cohort.
3.3. Individual Acute Response at t2
In addition, we studied individual acute responses at t2 (n=26). As shown in Table 5 and Figure 3, on average, there were significant increases in SC- and MC-ACs in responses to exercise. All other metabolites did not show significant changes. However, still, there were large individual differences, suggesting that metabolite patterns might be suitable markers in the context of exercise adaptation. When assessing potential correlations between metabolite mobilization and changes in physiological or clinical parameters between t0 and t2, we found a significant negative correlation between MC-AC acute response and changes in PPO (peak power output), indicating that subjects with lower rates of MC-AC mobilization had higher gains in PPO (Table 6).
4. Discussion
Physical exercise is known to modulate AA plasma profiles, reflecting metabolic adaptations (for review, see Kelly et al., 2020). Our data indicate that the 24-week exercise-based lifestyle intervention program “MultiPill-Exercise” continuously upregulated concentrations of all tested AAs in the circulation. In 2010, Kamaura et al. carried out a similar study on subjects with metabolic syndrome undergoing a six-week lifestyle intervention program. Our results are in part consistent with theirs, specifically, they could also detect increased concentrations of valine, tyrosine and citrulline after the intervention. In contrast to our data, however, decreased concentrations of leucine and phenylalanine were observed. These discrepancies might be due to differences with regard to study population, exact nature of the intervention and also methodological differences, since Kamaura et al., 2010, analyzed plasma samples, whereas in this study, dried whole-blood samples were employed. Interestingly, high AA concentrations in plasma can stimulate muscle protein synthesis, which might be a mechanism of training adaptation (Wolfe et al., 1999).
When considering AAs as potential biomarkers in the context of training adaptation, particularly associations between AA patterns and changes in clinical and physiological parameters are interesting. Thus, we correlated baseline AA concentrations with changes in such parameters between t0 and t1. Interestingly, we could detect positive correlations between valine, leucine / isoleucine, tyrosine and phenylalanine and changes in clinical parameters such as BMI, waist circumference, systolic and diastolic blood pressure, fasting glucose and LDL, as well as negative correlations with changes in HDL. In addition, we observed strong negative correlations between baseline citrulline and valine concentrations and changes in V̇O2max, indicating that high concentrations of these AAs might be predictors of a weaker response to the lifestyle intervention program. These data confirm the results published by Kamaura et al., 2010, who had also demonstrated several correlations between low baseline concentrations of various AAs and beneficial training outcomes.
By contrast, when analyzing AA mobilization in the context of acute exercise, there was almost no overall effect, despite partially huge inter-individual difference. A possible explanation might be that AA mobilization might be less pronounced in subjects with low muscle mass, such as MultiPill-Exercise participants. In addition, it is possible that timing might have played a role: Spiroergometry tests in MultiPill-Exercise subjects, which were organized as incremental tests till exhaustion, might, due to subjects’ comparatively low fitness, not have been long enough to detect significant AA mobilization.
When analyzing carnitine and ACs levels throughout the intervention, we found a moderate increase in total carnitine and a non-significant decrease in free carnitine. Levels of all classes of ACs also increased, despite the fact that data for medium-chain ACs did not reach significance.
Interestingly, there was a strong negative correlation between baseline concentrations of free and total carnitine and RR changes – both systolic and diastolic – suggesting that subjects with high levels of these metabolites at the start of the study had a higher cardiovascular benefit from the intervention.
Several studies could demonstrate distinct AC profiles in subjects with obesity, insulin resistance and non-alcoholic fatty liver disease, when compared to healthy controls (Mihalik et al., 2010; Zelijkovic et al., 2023). In this paper, we show that subjects with high concentrations of MC- and SC-ACs at inclusion had less positive effects with regard to fasting blood glucose and HbA1c amelioration when compared to subjects with lower baseline AC concentrations. In addition, high t0 concentrations of SC-ACs positively correlated with changes in cholesterol levels after 12 weeks. These data suggest that high AC concentrations might be negative predictors of training adaptation. Data presented by Carrard et al., 2022, who, in a systematic review, analyzed correlations of different metabolic markers with regard to their association with individual cardiorespiratory fitness, support this assumption: The authors clearly demonstrate that high AC concentrations, independently of chain length, are negatively associated with cardiorespiratory fitness, supporting the hypothesis that accumulation of circulating ACs reflects a state of compromised mitochondrial fatty acid oxidation, indicating poor metabolic health (for review, see McCoin et al., 2015). On the other hand, skeletal muscle ACs appear to be associated with a high degree of cardiovascular fitness, probably because they are linked to efficient fatty acid oxidation (Purdom et al., 2018). This is supported by results indicating that exercise can enhance mitochondrial fatty acid oxidation in skeletal muscle tissue (Lundsgaard et al., 2018).
Interestingly, we observed a significant increase in SC- and MC-ACs during acute exercise. A similar effect was previously described by Lehmann et al., 2010, who demonstrated increases particularly in MC-ACs during 60 min runs, suggesting that these metabolites are released as byproducts / intermediates of partial β oxidation. Since there was a negative correlation between medium-chain AC mobilization and PPO after 24 weeks, suggesting that subjects with a high degree of medium-chain AC mobilization were characterized by poor training effects. By contrast, short- and long-chain AC mobilization were positively related to V̇O2max, suggesting that these subjects showed efficient training adaptation.
Finally, despite the fact that a light breakfast, consisting of pretzels, apples and cereal bars, was offered to subjects on testing days, their diets were not completely standardized, which might have influenced our results. However, this was an intended effect, since, when installing metabolomics diagnostics in clinical routine in the future, it will also not be possible to do this in the context of fully standardized diets, i.e., useful biomarkers will be required to function in a real-world scenario of heterogeneous diets.
Taken together, our data data demonstrate that both AA and AC profiles are responsive to the lifestyle intervention program “MultiPill-Exercise” and might serve as biomarkers for clinical and physiological adaptation reactions in subjects with multimorbidity in the context of lifestyle intervention programs.
5. Conclusions
Our data indicate that “mini metabolomics”, employing dried blood spots, might be an easy-to-perform, cost-effective and minimally invasive strategy to assess basic metabolomics patterns in subjects with multimorbidity. The fact that this method has been well standardized and extensively validated in the context of newborn screening guarantees a high degree of reliability and reproducibility of the data. In addition, our results indicate that metabolomics patterns might indeed be linked to changes in clinical and/or physiological data in the context of lifestyle intervention programs in subjects with multimorbidity. Further studies should focus on validation of the data in larger cohorts.
6. Study Limitations
A major limitation of our study is the fact that due to restrictions in the context of the COVID 19 pandemic, complete sets of t0, t1 and t2 data were only available for n=6 subjects of wave 1, all of which were female. In addition, also due to COVID 19, the MultiPill-Exercise intervention design had to be substantially modified for subjects of wave 2, limiting comparability of results obtained of data obtained for the two waves. Furthermore, due to technical limitations, acute response data could only be collected at t2 (and not at t0), limiting the predictive value of these results. Finally, to maximize the number of subjects for which data were available, correlations of baseline metabolomics data with changes in clinical and physiological parameters were carried out only for deltas between t0 and t1, i.e., at 12 weeks into the intervention. By contrast and also aiming at maximizing the number of analyzable data, acute response data were studied in the context of changes between t0 and t2, despite the fact that, as mentioned above, the second phase of the intervention had to be substantially modified for subjects of wave 2.
This was an exploratory, hypothesis-generated study, thus, no correction for multiple testing was introduced. Future studies should focus on validation of metabolomics data in larger cohorts, potentially also considering differences between male and female subjects and also different (co)morbidities. In addition, long-term longitudinal studies and multidisciplinary approaches, encompassing for example genetic or endocrinological data, would be interesting – and also mechanistic approaches, allowing a deeper understanding of metabolic pathways reflected in metabolomics patterns. Eventually, metabolomics screening in subjects with multimorbidity could constitute a tool in personalized sports medicine, allowing the design of efficient, individual training regimens and lifestyle intervention programs. Finally, an important point is that in this study, only metabolites that are part of the standard newborn screening program, were quantified. In the future, it will also be interesting to establish procedures also allowing analysis of more specific metabolites, such as N-lactoylphenylalanine, which has recently been demonstrated to be an important modulator of exercise-induced weight loss in subjects with obesity (for review, see Naja et al., 2025), from dried blood spots.
Conflicts of Interest statement
The authors declare no conflict of interest.
Author Contributions statement
Conceptualization. AMN, IK and BM. Methodology. RB, SiS and BM. Software. RB and BM. Validation. RB and BM. Formal analysis. RB and BM. Investigation. RB and SiS. Resources. RB, SiS, AMN, IK and BM. Data curation. RB and BM. Writing – original draft. BM. Writing – review & editing. BM. Visualization. RB and BM. Supervision. AMN, IK and BM. Project administration. AMN, IK and BM. Funding acquisition. AMN, IK and BM.
Acknowledgments
We thank all members of the MultiPill-Exercise team for support. I.K. and B.M. were funded by the intramural AKF grant 445-0-0 (University Medicine Tübingen). R.B. and B.M. were funded by the intramural graduation program “Promotionskolleg Medizin” (University Medicine Tübingen). The MultiPill-Exercise study was supported by the AOK Baden-Württemberg. We acknowledge support by the Open Access Publication Fund of University of Tübingen.
References
- Adeva-Andany MM, Calvo-Castro I, Fernández-Fernández C, Donapetry-García C, Pedre-Piñeiro AM. Significance of l-carnitine for human health. IUBMB Life. 2017 Aug;69(8):578-594. Epub 2017 Jun 26. [CrossRef] [PubMed]
- Carrard J, Guerini C, Appenzeller-Herzog C, Infanger D, Königstein K, Streese L, Hinrichs T, Hanssen H, Gallart-Ayala H, Ivanisevic J, Schmidt-Trucksäss A. The Metabolic Signature of Cardiorespiratory Fitness: A Systematic Review. Sports Med. 2022 Mar;52(3):527-546. Epub 2021 Nov 10. [CrossRef] [PubMed] [PubMed Central]
- Flynn NE, Shaw MH, Becker JT. Amino Acids in Health and Endocrine Function. Adv Exp Med Biol. 2020;1265:97-109. [CrossRef] [PubMed]
- Hansen JS, Zhao X, Irmler M, Liu X, Hoene M, Scheler M, Li Y, Beckers J, Hrabĕ de Angelis M, Häring HU, Pedersen BK, Lehmann R, Xu G, Plomgaard P, Weigert C. Type 2 diabetes alters metabolic and transcriptional signatures of glucose and amino acid metabolism during exercise and recovery. Diabetologia. 2015 Aug;58(8):1845-54. Epub 2015 Jun 12. [CrossRef] [PubMed]
- Huffman KM, Slentz CA, Bateman LA, Thompson D, Muehlbauer MJ, Bain JR, Stevens RD, Wenner BR, Kraus VB, Newgard CB, Kraus WE. Exercise-induced changes in metabolic intermediates, hormones, and inflammatory markers associated with improvements in insulin sensitivity. Diabetes Care. 2011 Jan;34(1):174-6. Epub 2010 Oct 4. [CrossRef] [PubMed] [PubMed Central]
- Huffman KM, Koves TR, Hubal MJ, Abouassi H, Beri N, Bateman LA, Stevens RD, Ilkayeva OR, Hoffman EP, Muoio DM, Kraus WE. Metabolite signatures of exercise training in human skeletal muscle relate to mitochondrial remodelling and cardiometabolic fitness. Diabetologia. 2014 Nov;57(11):2282-95. Epub 2014 Aug 5. [CrossRef] [PubMed] [PubMed Central]
- Kamaura M, Nishijima K, Takahashi M, Ando T, Mizushima S, Tochikubo O. Lifestyle modification in metabolic syndrome and associated changes in plasma amino acid profiles. Circ J. 2010 Nov;74(11):2434-40. Epub 2010 Sep 8. [CrossRef] [PubMed]
- Kelly RS, Kelly MP, Kelly P. Metabolomics, physical activity, exercise and health: A review of the current evidence. Biochim Biophys Acta Mol Basis Dis. 2020 Dec 1;1866(12):165936. Epub 2020 Aug 19. [CrossRef] [PubMed] [PubMed Central]
- Khoramipour K, Sandbakk Ø, Keshteli AH, Gaeini AA, Wishart DS, Chamari K. Metabolomics in Exercise and Sports: A Systematic Review. Sports Med. 2022 Mar;52(3):547-583. Epub 2021 Oct 30. [CrossRef] [PubMed]
- Lehmann R, Zhao X, Weigert C, Simon P, Fehrenbach E, Fritsche J, Machann J, Schick F, Wang J, Hoene M, Schleicher ED, Häring HU, Xu G, Niess AM. Medium chain acylcarnitines dominate the metabolite pattern in humans under moderate intensity exercise and support lipid oxidation. PLoS One. 2010 Jul 12;5(7):e11519. [CrossRef] [PubMed] [PubMed Central]
- Lundsgaard AM, Fritzen AM, Kiens B. Molecular Regulation of Fatty Acid Oxidation in Skeletal Muscle during Aerobic Exercise. Trends Endocrinol Metab. 2018 Jan;29(1):18-30. Epub 2017 Dec 5. [CrossRef] [PubMed]
- McCoin CS, Knotts TA, Adams SH. Acylcarnitines--old actors auditioning for new roles in metabolic physiology. Nat Rev Endocrinol. 2015 Oct;11(10):617-25. Epub 2015 Aug 25. [CrossRef] [PubMed] [PubMed Central]
- Mihalik SJ, Goodpaster BH, Kelley DE, Chace DH, Vockley J, Toledo FG, DeLany JP. Increased levels of plasma acylcarnitines in obesity and type 2 diabetes and identification of a marker of glucolipotoxicity. Obesity (Silver Spring). 2010 Sep;18(9):1695-700. Epub 2010 Jan 28. [CrossRef] [PubMed] [PubMed Central]
- Naja K, Hedaya L, Elashi AA, Rizzo M, Elrayess MA. N-Lactoyl Amino Acids: Emerging Biomarkers in Metabolism and Disease. Diabetes Metab Res Rev. 2025 Jul;41(5):e70060. [CrossRef] [PubMed] [PubMed Central]
- Nicholson K, Makovski TT, Nagyova I, van den Akker M, Stranges S. Strategies to improve health status among adults with multimorbidity: A scoping review. Maturitas. 2023 Jan;167:24-31. Epub 2022 Sep 14. [CrossRef] [PubMed]
- Purdom T, Kravitz L, Dokladny K, Mermier C. Understanding the factors that effect maximal fat oxidation. J Int Soc Sports Nutr. 2018 Jan 12;15:3. [CrossRef] [PubMed] [PubMed Central]
- Rinaldo P, Cowan TM, Matern D. Acylcarnitine profile analysis. Genet Med. 2008 Feb;10(2):151-6. [CrossRef] [PubMed]
- Rutkowsky JM, Knotts TA, Ono-Moore KD, McCoin CS, Huang S, Schneider D, Singh S, Adams SH, Hwang DH. Acylcarnitines activate proinflammatory signaling pathways. Am J Physiol Endocrinol Metab. 2014 Jun 15;306(12):E1378-87. Epub 2014 Apr 22. [CrossRef] [PubMed] [PubMed Central]
- Sakaguchi CA, Nieman DC, Signini EF, Abreu RM, Catai AM. Metabolomics-Based Studies Assessing Exercise-Induced Alterations of the Human Metabolome: A Systematic Review. Metabolites. 2019 Aug 9;9(8):164. [CrossRef] [PubMed] [PubMed Central]
- Schranner D, Kastenmüller G, Schönfelder M, Römisch-Margl W, Wackerhage H. Metabolite Concentration Changes in Humans After a Bout of Exercise: a Systematic Review of Exercise Metabolomics Studies. Sports Med Open. 2020 Feb 10;6(1):11. [CrossRef] [PubMed] [PubMed Central]
- Schweda S, Munz B, Burgstahler C, Niess AM, Roesel I, Sudeck G, Krauss I. Proof of Concept of a 6-Month Person-Oriented Exercise Intervention ‘MultiPill-Exercise’ among Patients at Risk of or with Multiple Chronic Diseases: Results of a One-Group Pilot Trial. Int J Environ Res Public Health. 2022 Aug 2;19(15):9469. [CrossRef] [PubMed] [PubMed Central]
- Skogvold HB, Rootwelt H, Reubsaet L, Elgstøen KBP, Wilson SR. Dried blood spot analysis with liquid chromatography and mass spectrometry: Trends in clinical chemistry. J Sep Sci. 2023 Aug;46(15):e2300210. Epub 2023 Jun 3. [CrossRef] [PubMed]
- Tian Q, Corkum AE, Moaddel R, Ferrucci L. Metabolomic profiles of being physically active and less sedentary: a critical review. Metabolomics. 2021 Jul 10;17(7):68. [CrossRef] [PubMed] [PubMed Central]
- Wolfe RR, Miller SL. Amino acid availability controls muscle protein metabolism. Diabetes Nutr Metab. 1999 Oct;12(5):322-8. [PubMed]
- Zeljkovic A, Mihajlovic M, Vujcic S, Guzonjic A, Munjas J, Stefanovic A, Kotur-Stevuljevic J, Rizzo M, Bogavac-Stanojevic N, Gagic J, Kostadinovic J, Vekic J. The Prospect of Genomic, Transcriptomic, Epigenetic and Metabolomic Biomarkers for The Personalized Prevention of Type 2 Diabetes and Cardiovascular Diseases. Curr Vasc Pharmacol. 2023;21(3):185-196. [CrossRef] [PubMed]
Figure 1.
Spaghetti plots of individual metabolite concentrations. Graphs depict changes in individual metabolite concentrations at rest at t0, t1 and t2, as assessed for the six individual subjects for which data for each time point were available.
Figure 1.
Spaghetti plots of individual metabolite concentrations. Graphs depict changes in individual metabolite concentrations at rest at t0, t1 and t2, as assessed for the six individual subjects for which data for each time point were available.
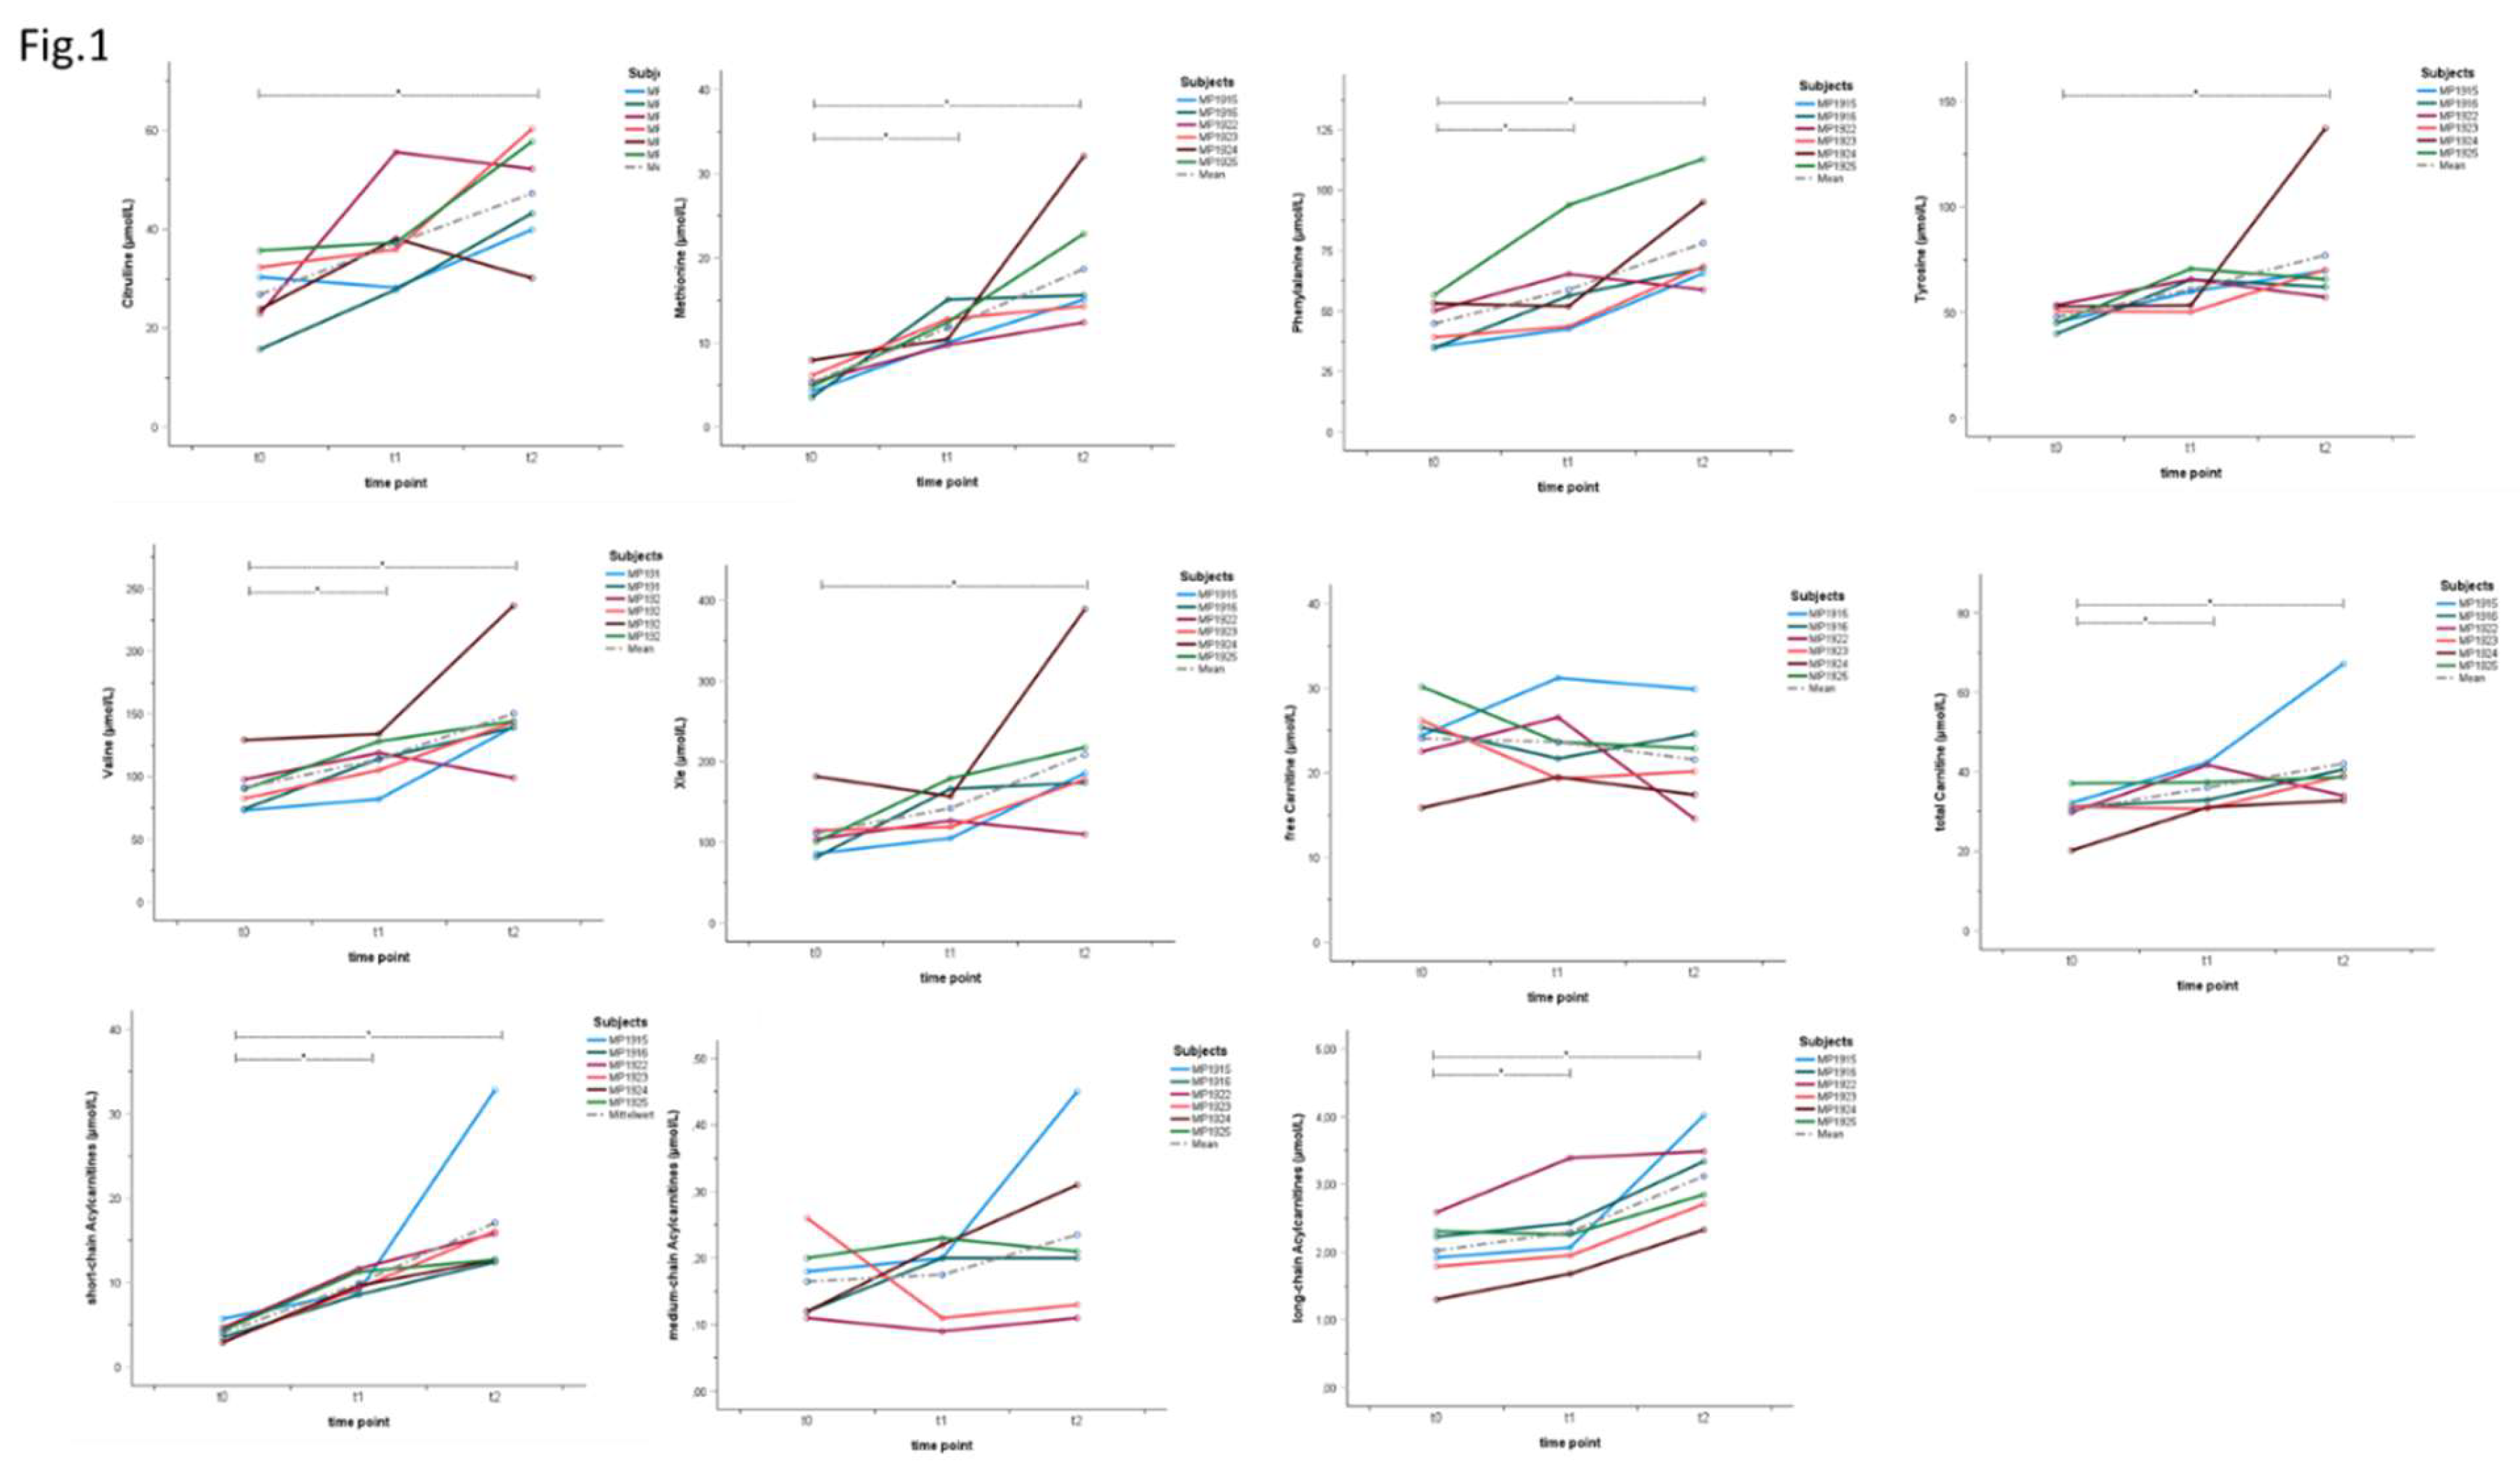
Figure 2.
Correlations of baseline metabolite parameters and the development of physiological and clinical parameters between t0 and t1. Graphs depict significant correlations between baseline (t0) metabolite concentrations and changes between different physiological / clinical parameters between t0 and t1 as indicated.
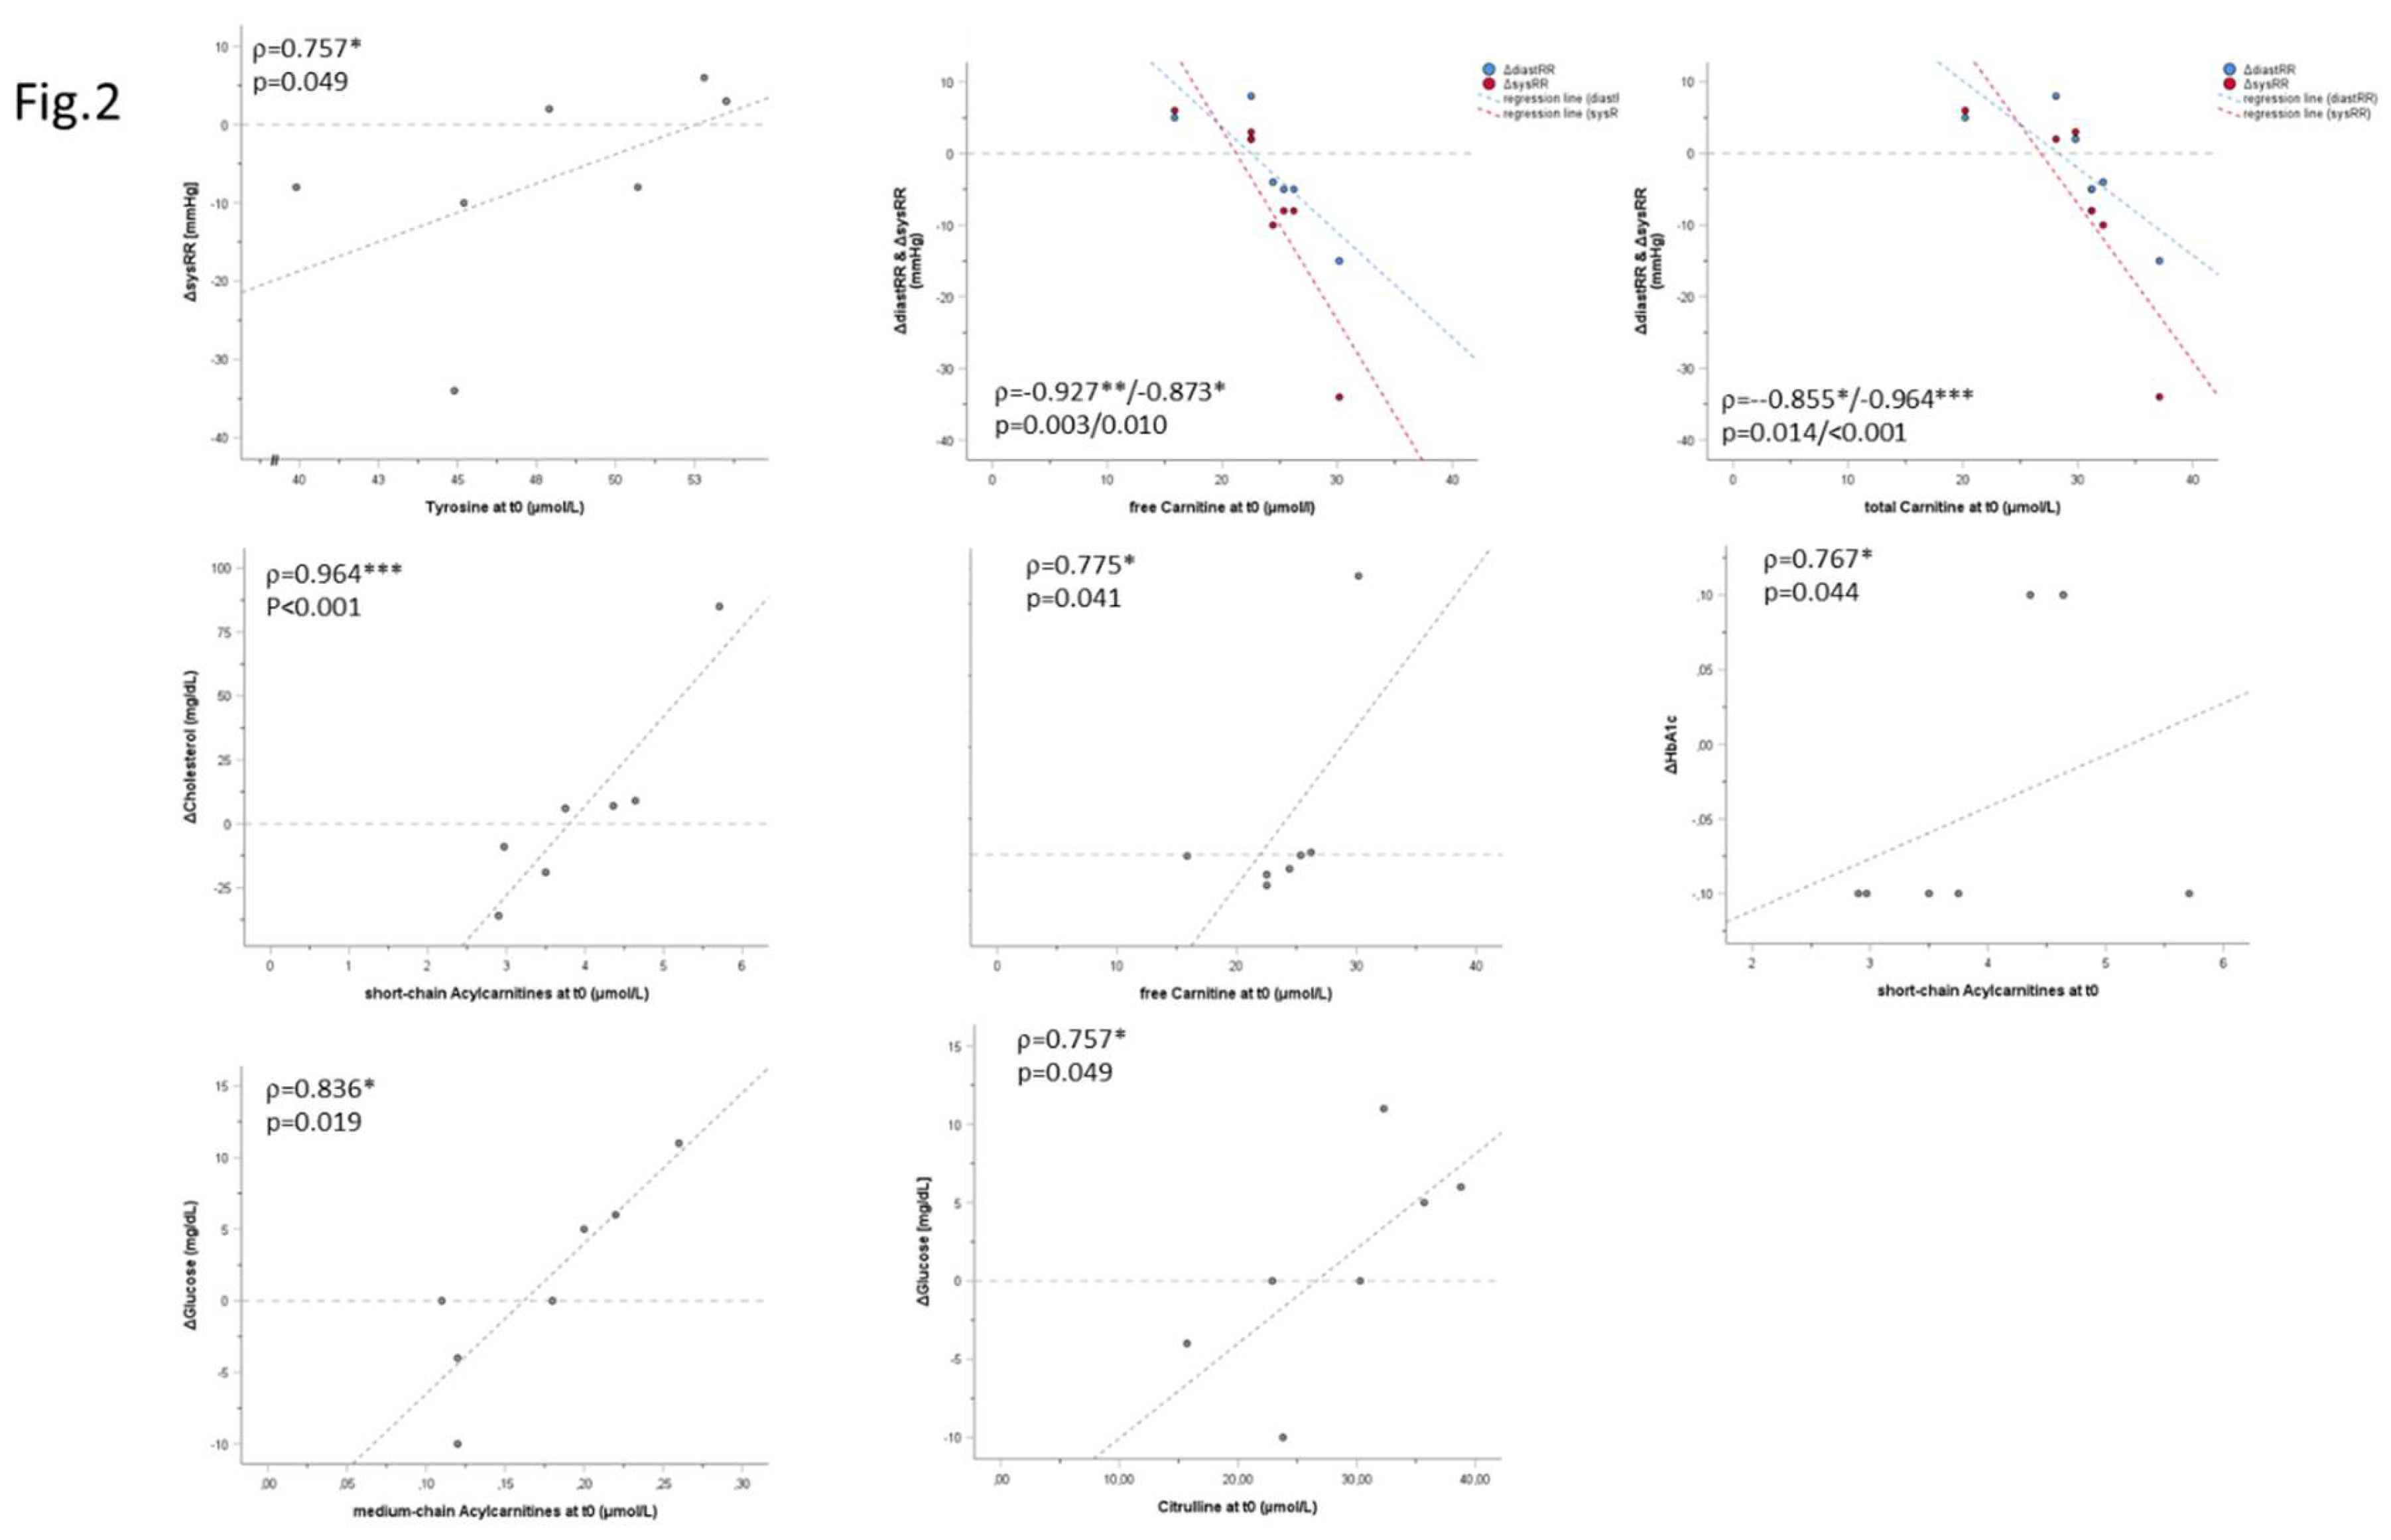
Figure 3.
Spaghetti plots of individual acute responses at t2. Plots depict changes in individual metabolite concentrations during spiroergometry at t2 (acute response) as indicated.
Figure 3.
Spaghetti plots of individual acute responses at t2. Plots depict changes in individual metabolite concentrations during spiroergometry at t2 (acute response) as indicated.
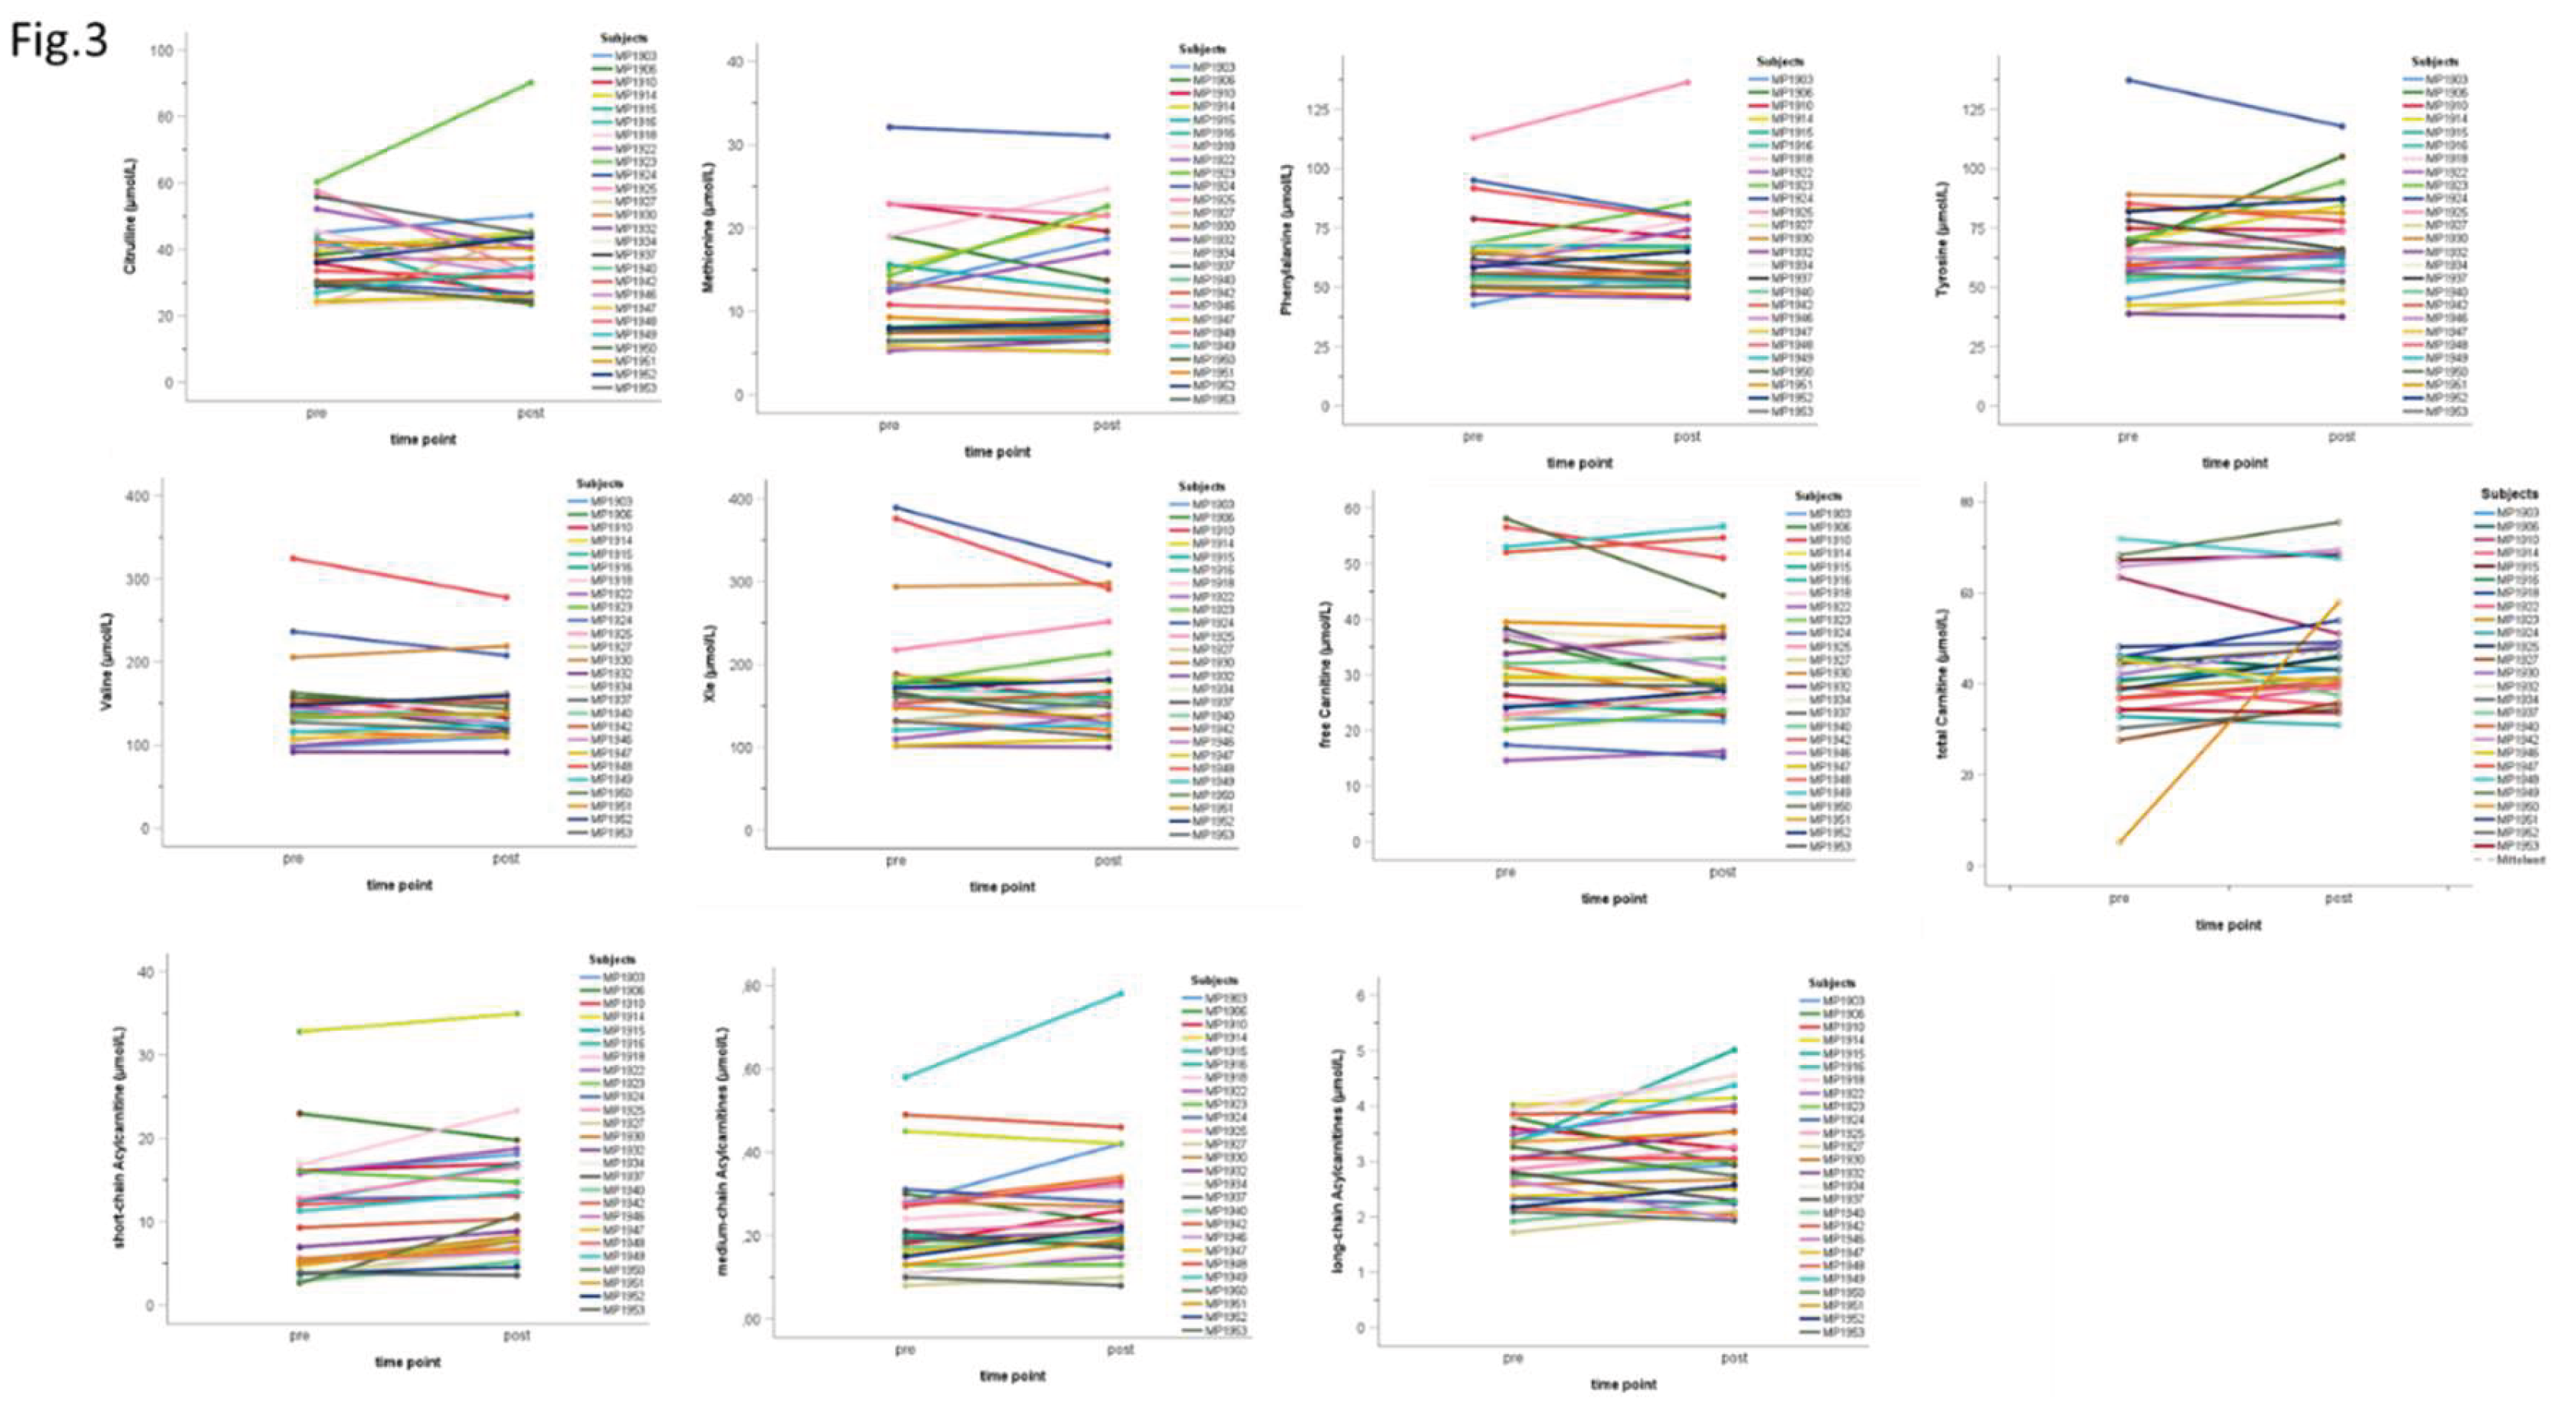

Table 1.
Subjects and data.
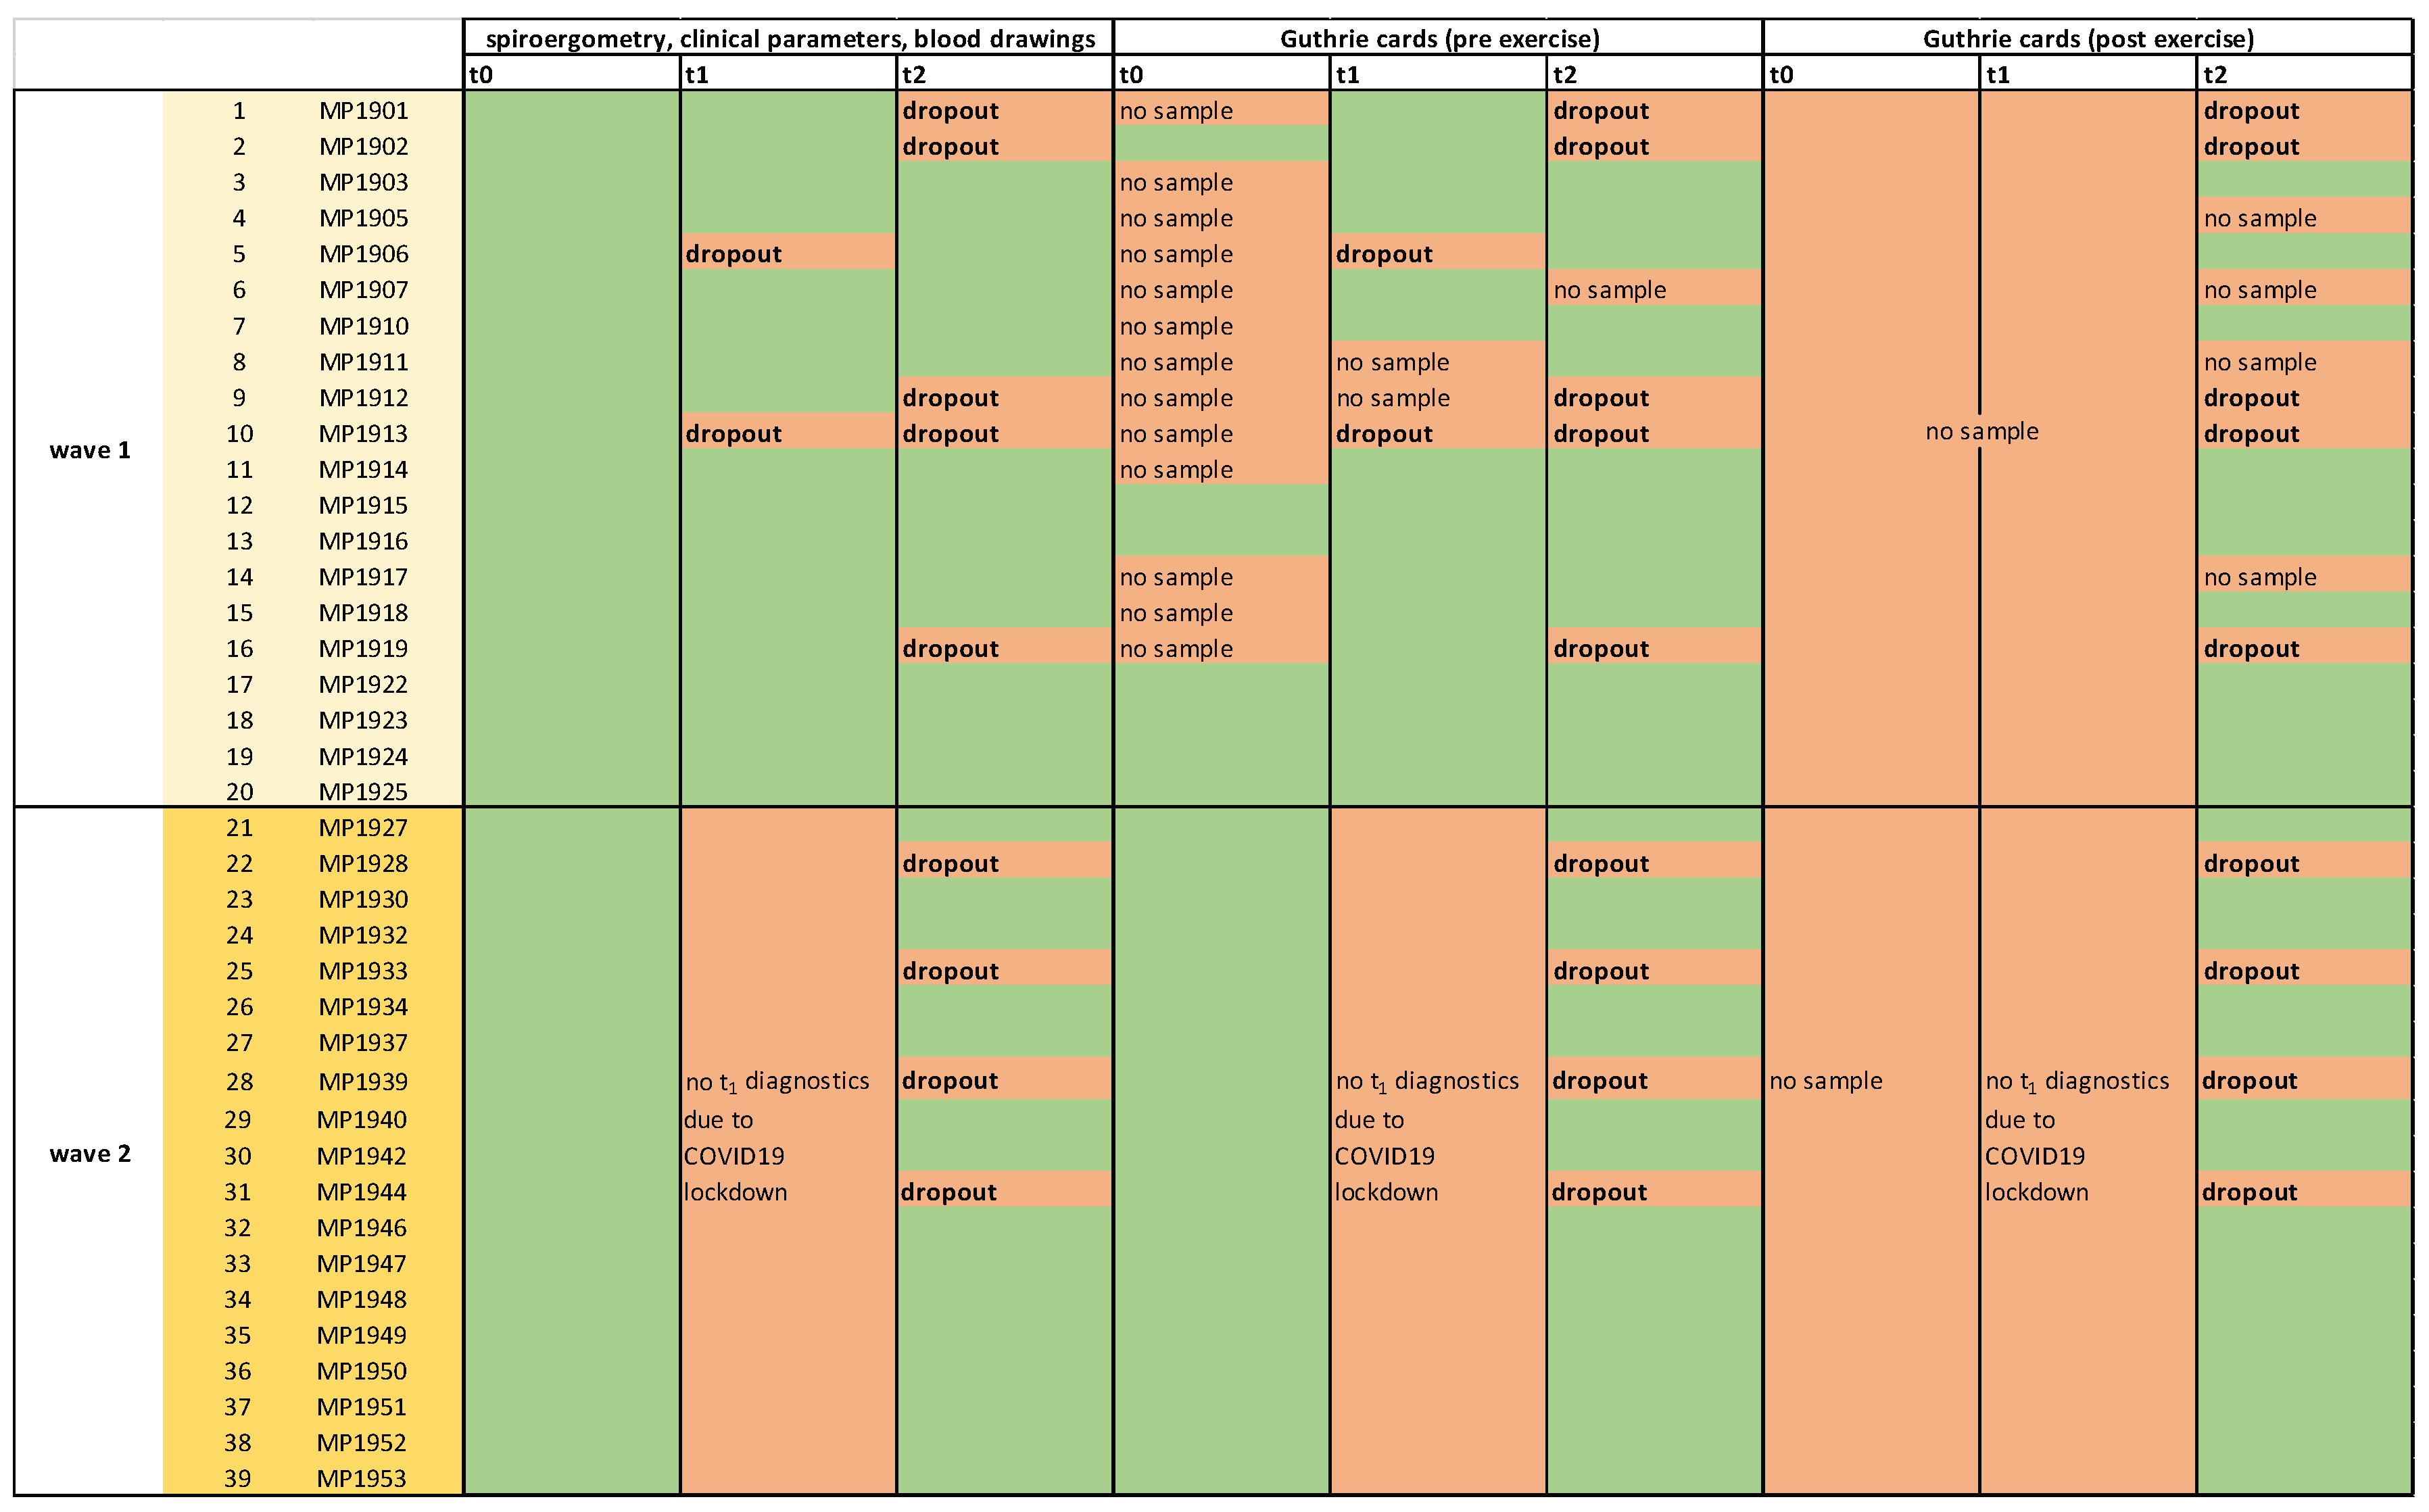 |
Table lists subjects of both waves and available data and samples (green shading). Red shading indicates that the respective piece of data or sample was not available.
Table 2.
Metabolomics and abbreviations.
| Abbreviations | Metabolites |
| Carnitine-u, C0 | free / unconjugated carnitine |
| Cx | total carnitine |
| C2-u | acetylcarnitine |
| C3-DC+C4-OH-u | malonylcarnitine (C3-DC) + 3-hydroxybutyrylcarnitine (C4-OH) |
| C3-u | propionylcarnitine (C3) |
| C4-u | butyrylcarnitine + isobutyrylcarnitine (C4) |
| C4-DC+C5-OH-u | methylmalonylcarnitine (C4-DC) + 3-hydroxyisovalerylcarnitine (C5-OH) |
| C5-u | isovalerylcarnitine + methylbutyrylcarnitine (C5) |
| C5-DC+C6-OH-u | glutarylcarnitine (C5-DC) + 3-hydroxyhexanoylcarnitine (C6-OH) |
| C6-u | hexanoylcarnitine (C6) |
| C6-DC-u | methylglutarylcarnitine (C6-DC) |
| C8 | octanoylcarnitine (C8) |
| C10-u | decanoylcarnitine (C10) |
| C10:1-u | decenoylcarnitine (C10:1) |
| C12-u | dodecanoylcarnitine (C12) |
| C12:1-u | dodecenoylcarnitine (C12:1) |
| C14-u | tetradecanoylcarnitine (C14) |
| C14-OH-u | 3-hydroxytetradecanoylcarnitine (C14-OH) |
| C14:1-OH-u | 3-hydroxytetradecenoylcarnitine (C14:1-OH) |
| C14:1-u | tetradecenoylcarnitine (C14:1) |
| C14:2-u | tetradecadienoylcarnitine (C14:2) |
| C16-u | palmitoylcarnitine (C16) |
| C18-u | stearoylcarnitine (C18) |
| C18:1-u | oleoylcarnitine (C18:1) |
| C18:2-u | linoleoylcarnitine (C18:2) |
| C16-OH-u | 3-hydroxypalmitoylcarnitine (C16-OH) |
| C18:1-OH-u | 3-hydroxyoleoylcarnitine (C18:1-OH) |
| C18:2-OH-u | 3-hydroxylinoleoylcarnitine (C18:2-OH) |
| SC-ACs | short-chain acylcarnitines |
| MC-ACs | medium-chain acylcarnitines |
| LC-ACs | long-chain acylcarnitines |
| Cit | citrulline |
| Met | methionine |
| Phe | phenylalanine |
| Tyr | tyrosine |
| Val | valine |
| Xle | leucine + isoleucine |
Table lists all metabolites analyzed in this study and their abbreviations.
Table 3.
Individual kinetics of metabolite concentrations (t0, t1, t2).
| t | n | min | max | MD | ME | SD |
Δ (t0-t1) p |
Δ (t0-t2) p |
||
| amino acids | Cit (µmol/L) |
t0 | 6 | 15.7 | 35.7 | 27.05 | 26.78 | 7.34 | 10.37 .156 |
20.45 .031* |
| t1 | 6 | 27.8 | 55.6 | 36.60 | 37.15 | 10.10 | ||||
| t2 | 6 | 30.1 | 60.3 | 47.70 | 47.23 | 11.56 | ||||
| Met (µmol/L) |
t0 | 6 | 3.5 | 7.9 | 5.05 | 5.30 | 1.56 | 6.43 .016* |
13.43 .031* |
|
| t1 | 6 | 9.7 | 15.1 | 11.40 | 11.73 | 2.09 | ||||
| t2 | 6 | 12.4 | 32.1 | 15.35 | 18.73 | 7.47 | ||||
| Phe (µmol/L) |
t0 | 6 | 34.8 | 56.6 | 44.65 | 44.83 | 9.63 | 14.10 .031* |
33.27 .013* |
|
| t1 | 6 | 42.6 | 93.8 | 54.15 | 58.93 | 19.04 | ||||
| t2 | 6 | 58.8 | 112.9 | 68.10 | 78.10 | 21.11 | ||||
| Tyr (µmol/L) |
t0 | 6 | 39.9 | 53.5 | 47.95 | 47.83 | 5.36 | 13.07 .109 |
29.20 .031* |
|
| t1 | 6 | 50.2 | 70.7 | 62.70 | 60.90 | 7.91 | ||||
| t2 | 6 | 57.2 | 137.2 | 67.75 | 77.03 | 29.88 | ||||
| Val (µmol/L) |
t0 | 6 | 73.1 | 129.2 | 86.25 | 91.12 | 20.87 | 22.60 .016* |
59.17 .031* |
|
| t1 | 6 | 82.0 | 134.0 | 116.55 | 113.72 | 18.58 | ||||
| t2 | 6 | 99.0 | 236.4 | 141.55 | 150.28 | 45.54 | ||||
| Xle (µmol/L) |
t0 | 6 | 81.4 | 181.6 | 102.15 | 111.32 | 36.50 | 30.75 .109 |
97.63 .031* |
|
| t1 | 6 | 104.9 | 179.1 | 141.75 | 142.07 | 29.43 | ||||
| t2 | 6 | 109.9 | 389.1 | 181.80 | 208.95 | 94.96 | ||||
| (acyl)carnitines | Carnitine-u (µmol/L) |
t0 | 6 | 15.9 | 30.2 | 24.88 | 24.09 | 4.76 | -0.43 .844 |
-2.50 .313 |
| t1 | 6 | 19.3 | 31.2 | 22.68 | 23.66 | 4.59 | ||||
| t2 | 6 | 14.6 | 29.9 | 21.53 | 21.59 | 5.44 | ||||
| Cx (µmol/L) |
t0 | 6 | 20.2 | 37.1 | 31.20 | 30.28 | 5.54 | 5.75 .047* |
11.78 .031* |
|
| t1 | 6 | 30.7 | 42.4 | 35.15 | 36.03 | 5.24 | ||||
| t2 | 6 | 32.8 | 67.2 | 38.90 | 42.07 | 12.69 | ||||
| SC-ACs (µmol/L) |
t0 | 6 | 2.9 | 5.7 | 3.93 | 4.01 | 1.09 | 5.88 .016* |
13.07 .031* |
|
| t1 | 6 | 8.6 | 11.7 | 9.47 | 9.89 | 1.27 | ||||
| t2 | 6 | 12.4 | 32.8 | 14.26 | 17.08 | 7.87 | ||||
| MC-ACs (µmol/L) |
t0 | 6 | 0.1 | 0.3 | 0.15 | 0.17 | 0.06 | 0.01 .484 |
0.07 .313 |
|
| t1 | 6 | 0.1 | 0.2 | 0.20 | 0.18 | 0.06 | ||||
| t2 | 6 | 0.1 | 0.5 | 0.21 | 0.24 | 0.13 | ||||
| LC-ACs (µmol/L) |
t0 | 6 | 1.3 | 2.6 | 2.08 | 2.02 | 0.45 | 0.27 .031* |
1.10 .031* |
|
| t1 | 6 | 1.7 | 3.4 | 2.17 | 2.30 | 0.59 | ||||
| t2 | 6 | 2.3 | 4.0 | 3.10 | 3.12 | 0.61 |
Table shows concentrations of individual metabolites at the three different time points and their changes (D) between t0 and t1 and between t0 and t2. t: time point, n: number of subjects, min: minimum value, max: maximum value, MD: median, ME: mean, SD: standard deviation.
Table 4.
Baseline metabolomics (t0): correlation analysis.
| Δphysiological / clinical parameters (t0-t1) | statistics | AA concentration (t0) | AC concentration (t0) | ||||||||||
| Cit | Met | Phe | Tyr | Val | Xle | C0 | Cx | SC-ACs | MC-ACs | LC-ACs | |||
| sports | ΔrelVO2max [mL/kgxmin] | correlation [ρ] | -0.624 | -0.459 | -0.532 | -0.184 | -0.716 | -0.514 | 0.019 | 0.167 | 0.239 | -0.278 | 0.184 |
| p (2-sided) | 0.134 | 0.300 | 0.219 | 0.694 | 0.070 | 0.238 | 0.969 | 0.721 | 0.606 | 0.546 | 0.694 | ||
| n | 7 | 7 | 7 | 7 | 7 | 7 | 7 | 7 | 7 | 7 | 7 | ||
| ΔPPO [W/kg] | correlation [ρ] |
-0.144 | 0.180 | -0.487 | 0.487 | -0.054 | 0.018 | -0.245 | -0.373 | 0.108 | -0.055 | 0.162 | |
| p (2-sided) | 0.758 | 0.699 | 0.268 | 0.268 | 0.908 | 0.969 | 0.596 | 0.41 | 0.818 | 0.908 | 0.728 | ||
| n | 7 | 7 | 7 | 7 | 7 | 7 | 7 | 7 | 7 | 7 | 7 | ||
| body weight | ΔBMI [kg/m2] | correlation [ρ] |
-0.679 | 0.107 | -0.036 | 0.214 | -0.036 | 0.071 | -0.577 | -0.360 | -0.179 | -0.577 | -0.321 |
| p (2-sided) | 0.094 | 0.819 | 0.939 | 0.645 | 0.939 | 0.879 | 0.175 | 0.427 | 0.702 | 0.175 | 0.482 | ||
| n | 7 | 7 | 7 | 7 | 7 | 7 | 7 | 7 | 7 | 7 | 7 | ||
| inflammation | ΔIL6 [ng/L] | correlation[ρ] | 0.643 | -0.250 | 0.071 | -0.143 | 0.036 | -0.214 | 0.342 | 0.414 | 0.643 | 0.306 | 0.464 |
| p (2-sided) | 0.119 | 0.589 | 0.879 | 0.760 | 0.939 | 0.645 | 0.452 | 0.355 | 0.119 | 0.504 | 0.294 | ||
| n | 7 | 7 | 7 | 7 | 7 | 7 | 7 | 7 | 7 | 7 | 7 | ||
| ΔCRP [mg/dL] | correlation[ρ] | 0.000 | -0.071 | 0.536 | -0.429 | -0.071 | 0.143 | .775* | 0.595 | -0.321 | 0.270 | 0.179 | |
| p (2-sided) | 1.000 | 0.879 | 0.215 | 0.337 | 0.879 | 0.76 | 0.041 | 0.159 | 0.482 | 0.558 | 0.702 | ||
| n | 7 | 7 | 7 | 7 | 7 | 7 | 7 | 7 | 7 | 7 | 7 | ||
| Δfibrinogen [mg/dL] | correlation[ρ] | 0.257 | 0.086 | -0.029 | 0.429 | 0.029 | 0.086 | 0.261 | 0.174 | 0.429 | 0.116 | 0.486 | |
| p (2-sided) | 0.623 | 0.872 | 0.957 | 0.397 | 0.957 | 0.872 | 0.618 | 0.742 | 0.397 | 0.827 | 0.329 | ||
| n | 6 | 6 | 6 | 6 | 6 | 6 | 6 | 6 | 6 | 6 | 6 | ||
| diabetes | Δinsulin [pmol/L] | correlation[ρ] | 0.000 | 0.107 | -0.250 | 0.321 | 0.000 | 0.036 | 0.144 | -0.072 | 0.143 | 0.090 | 0.429 |
| p (2-sided) | 1.000 | 0.819 | 0.589 | 0.482 | 1.000 | 0.939 | 0.758 | 0.878 | 0.76 | 0.848 | 0.337 | ||
| n | 7 | 7 | 7 | 7 | 7 | 7 | 7 | 7 | 7 | 7 | 7 | ||
| ΔHbA1c [%] | correlation[ρ] | 0.356 | -0.225 | 0.337 | -0.019 | 0.206 | -0.131 | 0.198 | 0.415 | 0.767* | -0.076 | 0.636 | |
| p (2-sided) | 0.434 | 0.628 | 0.460 | 0.968 | 0.658 | 0.78 | 0.67 | 0.354 | 0.044 | 0.872 | 0.125 | ||
| n | 7 | 7 | 7 | 7 | 7 | 7 | 7 | 7 | 7 | 7 | 7 | ||
| Δglucose [mg/dL] | correlation[ρ] | 0.757* | 0.090 | -0.180 | 0.000 | -0.234 | 0.054 | 0.500 | 0.291 | 0.126 | 0.836* | 0.018 | |
| p (2-sided) | 0.049 | 0.848 | 0.699 | 1.000 | 0.613 | 0.908 | 0.253 | 0.527 | 0.788 | 0.019 | 0.969 | ||
| n | 7 | 7 | 7 | 7 | 7 | 7 | 7 | 7 | 7 | 7 | 7 | ||
| lipoprotein and fatty acid metabolism | Δcholesterol [mg/dL] | correlation[ρ] | 0.214 | -0.357 | 0.000 | 0.000 | -0.286 | -0.321 | 0.180 | 0.523 | 0.964*** | -0.018 | 0.571 |
| p (2-sided) | 0.645 | 0.432 | 1.000 | 1.000 | 0.535 | 0.482 | 0.699 | 0.229 | <.001 | 0.969 | 0.18 | ||
| n | 7 | 7 | 7 | 7 | 7 | 7 | 7 | 7 | 7 | 7 | 7 | ||
| Δtriglycerides [mg/dL] | correlation[ρ] | -0.018 | 0.270 | -0.450 | 0.468 | -0.198 | 0.126 | -0.073 | -0.245 | 0.000 | 0.209 | 0.018 | |
| p (2-sided) | 0.969 | 0.558 | 0.31 | 0.289 | 0.67 | 0.788 | 0.877 | 0.596 | 1 | 0.653 | 0.969 | ||
| n | 7 | 7 | 7 | 7 | 7 | 7 | 7 | 7 | 7 | 7 | 7 | ||
| ΔLDL [mg/dL] | correlation[ρ] | 0.679 | -0.214 | -0.143 | -0.071 | 0.000 | -0.250 | 0.180 | 0.234 | 0.607 | 0.342 | 0.321 | |
| p (2-sided) | 0.094 | 0.645 | 0.76 | 0.879 | 1 | 0.589 | 0.699 | 0.613 | 0.148 | 0.452 | 0.482 | ||
| n | 7 | 7 | 7 | 7 | 7 | 7 | 7 | 7 | 7 | 7 | 7 | ||
| ΔHDL [mg/dL] | correlation[ρ] | 0.144 | -0.108 | 0.360 | -0.018 | 0.559 | -0.036 | -0.018 | 0.027 | 0.324 | -0.309 | 0.505 | |
| p (2-sided) | 0.758 | 0.818 | 0.427 | 0.969 | 0.192 | 0.939 | 0.969 | 0.954 | 0.478 | 0.5 | 0.248 | ||
| n | 7 | 7 | 7 | 7 | 7 | 7 | 7 | 7 | 7 | 7 | 7 | ||
| cardiovascular parameters | ΔdiastRR [mmHg] | correlation[ρ] | 0.072 | 0.414 | -0.360 | 0.577 | 0.342 | 0.198 | -0.927** | -0.855* | -0.090 | -0.191 | -0.541 |
| p (2-sided) | 0.878 | 0.355 | 0.427 | 0.175 | 0.452 | 0.67 | 0.003 | 0.014 | 0.848 | 0.682 | 0.21 | ||
| n | 7 | 7 | 7 | 7 | 7 | 7 | 7 | 7 | 7 | 7 | 7 | ||
| ΔsysRR [mmHg] | correlation[ρ] | -0.324 | 0.667 | -0.036 | 0.757* | 0.631 | 0.523 | -0.873* | -0.964*** | -0.450 | -0.445 | -0.396 | |
| p (2-sided) | 0.478 | 0.102 | 0.939 | 0.049 | 0.129 | 0.229 | 0.01 | <.001 | 0.31 | 0.317 | 0.379 | ||
| n | 7 | 7 | 7 | 7 | 7 | 7 | 7 | 7 | 7 | 7 | 7 | ||
| Δresting HR [bpm] | correlation[ρ] | -0.074 | -0.296 | -0.111 | -0.037 | 0.111 | -0.296 | 0.187 | 0.112 | 0.408 | -0.224 | 0.741 | |
| p (2-sided) | 0.875 | 0.518 | 0.812 | 0.937 | 0.812 | 0.518 | 0.688 | 0.811 | 0.364 | 0.629 | 0.057 | ||
| n | 7 | 7 | 7 | 7 | 7 | 7 | 7 | 7 | 7 | 7 | 7 | ||
Correlation of baseline (t0) metabolite concentrations and changes in physiological and clinical parameters between t0 and t1 as indicated. ρ: correlation coefficient (Spearman).
Table 5.
Acute response at t2.
| t2 | n | min | max | MD | ME | SD | p | ||
| amino acids | Cit (µmol/L) | pre | 26 | 23.3 | 60.3 | 36.00 | 37.20 | 10.76 | |
| post | 26 | 23.5 | 90.2 | 32.60 | 36.03 | 13.70 | |||
| Δ | 26 | -24.6 | 29.9 | -0.85 | -1.17 | 11.40 | .464 | ||
| Met (µmol/L) | pre | 26 | 5.3 | 32.1 | 8.70 | 11.89 | 6.73 | ||
| post | 26 | 5.1 | 31.0 | 9.20 | 12.57 | 7.13 | |||
| Δ | 26 | -5.3 | 8.3 | 0.00 | 0.67 | 3.20 | .579 | ||
| Phe (µmol/L) | pre | 26 | 42.6 | 112.9 | 59.30 | 63.22 | 15.97 | ||
| post | 26 | 45.5 | 136.3 | 58.45 | 64.23 | 18.47 | |||
| Δ | 26 | -15.4 | 23.4 | -0.30 | 1.00 | 9.67 | .886 | ||
| Tyr (µmol/L) | pre | 26 | 38.9 | 137.2 | 62.90 | 65.99 | 20.07 | ||
| post | 26 | 37.6 | 117.8 | 64.85 | 69.34 | 18.76 | |||
| Δ | 26 | -19.4 | 37.5 | 0.75 | 3.35 | 11.32 | .210 | ||
| Val (µmol/L) | pre | 26 | 91.7 | 324.5 | 139.35 | 145.65 | 48.15 | ||
| post | 26 | 91.4 | 277.7 | 137.15 | 144.50 | 39.17 | |||
| Δ | 26 | -46.8 | 32.7 | 0.45 | -1.14 | 18.37 | .920 | ||
| Xle (µmol/L) | pre | 26 | 101.8 | 389.1 | 161.00 | 175.87 | 72.28 | ||
| post | 26 | 100.0 | 320.3 | 155.85 | 171.62 | 58.62 | |||
| Δ | 26 | -84.8 | 37.5 | -2.80 | -4.26 | 29.30 | .745 | ||
| (acyl-)carnitines | C0 (µmol/L) | pre | 26 | 14.6 | 58.1 | 30.64 | 32.57 | 11.77 | |
| post | 26 | 15.3 | 56.7 | 27.98 | 31.35 | 10.67 | |||
| Δ | 26 | -13.8 | 4.9 | -0.40 | -1.22 | 4.76 | .437 | ||
| Cx (µmol/L) | pre | 26 | 5.1 | 71.9 | 41.55 | 43.66 | 14.52 | ||
| post | 26 | 30.9 | 75.5 | 44.35 | 47.12 | 12.03 | |||
| Δ | 26 | -12.4 | 52.8 | 3.20 | 3.46 | 11.35 | .070 | ||
| SC-ACs (µmol/L) | pre | 26 | 2.6 | 32.8 | 8.12 | 10.16 | 7.29 | ||
| post | 26 | 3.6 | 35.0 | 10.55 | 12.36 | 7.06 | |||
| Δ | 26 | -3.2 | 8.1 | 2.19 | 2.20 | 2.27 | <.001** | ||
| MC-ACs (µmol/L) | pre | 26 | 0.1 | 0.6 | 0.21 | 0.23 | 0.12 | ||
| post | 26 | 0.1 | 0.8 | 0.23 | 0.26 | 0.14 | |||
| Δ | 26 | -0.1 | 0.2 | 0.03 | 0.03 | 0.06 | .027* | ||
| LC-ACs (µmol/L) | pre | 26 | 1.7 | 4.0 | 2.95 | 2.96 | 0.67 | ||
| post | 26 | 1.9 | 5.0 | 2.98 | 3.13 | 0.90 | |||
| Δ | 26 | -0.9 | 1.7 | 0.15 | 0.17 | 0.54 | .147 |
Table shows changes in concentrations of individual metabolites during spiroergometry at t2. pre: before spiroergometry, post: after spiroergometry, : difference, n: number of subjects, min: minimum value, max: maximum value, MD: median, ME: mean, SD: standard deviation.
Table 6.
Correlation between acute response and changes in physiological / clinical parameters.
| Δphysiological / clinical parameters (t0-t2) | statistics | amino acid mobilization during acute bout of exercise at t2 | (acyl-)carnitine mobilization during acute bout of exercise at t2 | ||||||||||
| Cit | Met | Phe | Tyr | Val | Xle | C0 | Cx |
SC- ACs |
MC-ACs |
LC- ACs |
|||
| sports | ΔrelVO2max [mL/kgxmin] | correlation [ρ] | -0.047 | 0.012 | -0.002 | -0.034 | 0.014 | -0.087 | -0.079 | -0.040 | 0.230 | -0.170 | 0.124 |
| p (2-sided) | 0.819 | 0.955 | 0.993 | 0.867 | 0.945 | 0.672 | 0.703 | 0.846 | 0.258 | 0.407 | 0.547 | ||
| n | 26 | 26 | 26 | 26 | 26 | 26 | 26 | 26 | 26 | 26 | 26 | ||
| ΔPPO [W/kg] | correlation [ρ] | 0.024 | -0.073 | -0.170 | -0.077 | -0.121 | -0.158 | -0.001 | -0.011 | 0.044 | -0.480* | 0.113 | |
| p (2-sided) | 0.910 | 0.735 | 0.427 | 0.719 | 0.573 | 0.460 | 0.997 | 0.960 | 0.838 | 0.018 | 0.599 | ||
| n | 24 | 24 | 24 | 24 | 24 | 24 | 24 | 24 | 24 | 24 | 24 | ||
| body weight | ΔBMI [kg/m2] | correlation [ρ] | -0.090 | -0.324 | -0.080 | 0.015 | -0.169 | -0.032 | 0.017 | -0.028 | -0.266 | -0.124 | -0.240 |
| p (2-sided) | 0.663 | 0.107 | 0.699 | 0.941 | 0.409 | 0.875 | 0.935 | 0.893 | 0.188 | 0.545 | 0.238 | ||
| n | 26 | 26 | 26 | 26 | 26 | 26 | 26 | 26 | 26 | 26 | 26 | ||
Correlation of acute changes in metabolite concentrations during spiroergometry at the t2 and changes in physiological and clinical parameters between t0 and t2 as indicated. ρ: correlation coefficient (Spearman).
Disclaimer/Publisher’s Note: The statements, opinions and data contained in all publications are solely those of the individual author(s) and contributor(s) and not of MDPI and/or the editor(s). MDPI and/or the editor(s) disclaim responsibility for any injury to people or property resulting from any ideas, methods, instructions or products referred to in the content. |
© 2025 by the authors. Licensee MDPI, Basel, Switzerland. This article is an open access article distributed under the terms and conditions of the Creative Commons Attribution (CC BY) license (http://creativecommons.org/licenses/by/4.0/).
Copyright: This open access article is published under a Creative Commons CC BY 4.0 license, which permit the free download, distribution, and reuse, provided that the author and preprint are cited in any reuse.


