Submitted:
26 August 2025
Posted:
27 August 2025
You are already at the latest version
Abstract
This article presents analyses and computational simulations conducted to validate the developed design of a mounting structure for an Agro PV (Agro Photovoltaic) system. In addition to assessing the structural strength of the proposed mounting system, the study also assessed the potential for electricity generation using the suggested design configuration. Modeling the structural strength and efficiency of Agro PV installations is crucial for optimizing their design and performance. This article provides an introduction to the key parameters and methodologies used in modeling these complex systems. The authors analyzed the structural resistance of the proposed Agro PV installation to environmental loads such as wind and snow, and how to assess the performance of the investment process itself. Accurate modeling of these factors can significantly reduce project risk, lower costs, and ensure a harmonious relationship between energy generation and food production. The results may be useful for designers of Agro PV farms, especially in Polish environmental and regulatory systems. The conducted simulation studies are the starting point for experimental research on real facilities, where agricultural aspects will be verified under real conditions.
Keywords:
Agro PV farm
; Agro Photovoltaic
; PV installation design
; economic aspects of Agro PV
1. Introduction
The growing demand for energy generated from PV sources is expected to lead to increased competition for land use, potentially resulting in economic and social conflicts. A solution to this challenge lies in the simultaneous production of food and electricity through Agro Photovoltaic systems (Agro PV). Since 2017, the governments of Japan, France, the USA, South Korea, and China have implemented policies supporting the deployment of Agro PV systems. Consequently, numerous pilot installations have been established [1,19,20].
In 2000, the first pilot Agro PV installations were built and studied, initially in Japan, followed by Germany and France. Japan introduced the first government support program in 2013 and reported over 1,900 Agro Photovoltaics power plants by 2018. Following Japan’s lead, China, France, the United States, and South Korea implemented government subsidies for AgroPV systems, increasing the global average installed capacity from 5 MW in 2012 to over 14 GW by 2021. The largest Agro PV project to date, focused on goji berry cultivation, has been implemented in China on the edge of the Gobi Desert and is currently being expanded to 1 GWp. Ongoing climate change is forcing Polish farmers to seek solutions to protect their crops. One potential method for safeguarding yields is the installation of Agro Photovoltaic systems [2].
Figure 1 shows the idea of the Agro PV system.
Figure 2 shows the Agro PV installation in the Oława Energy Cluster, a pilot project based on the Agro-Hydro-Energy (AHE) technology developed by the Wrocław University of Environmental and Life Sciences and the Oława Energy Cluster. This shows that despite legal and regulatory constraints, research and projects are underway in Poland to implement optimal Agro PV technology. This article is also an example of these efforts.
Table 1 identifies key challenges identified based on the literature review and proposes appropriate solutions, emphasizing that the design of Agro PV systems is inherently multifaceted and requires a deeply interdisciplinary approach. Each of these solutions, such as flexible height and spacing, translucent modules, shading dynamics, and intelligent irrigation control, directly addresses two objectives - energy generation and agricultural production - and requires expertise from multiple disciplines. This inherent complexity is why design calculations for Agro PV systems are significantly more complex than those for traditional PV installations. Effective implementation of Agro PV systems is therefore not simply an engineering problem but a complex, interdisciplinary challenge requiring the integration of knowledge from structural engineering, agronomy, microclimatology, and economics. Applying this to the situation in Poland, the Ministry of Climate and Environment and the Ministry of Agriculture and Rural Development are currently discussing new regulations aimed at realizing the potential of Agro PV. However, no specific legislation has been formally proposed by the end of 2024. This legislative stalemate in Poland poses a significant barrier to investment and large-scale implementation Agro PV [37,38].
This solution, adapted to the Polish climate, would enable crops and livestock to benefit from simultaneous electricity generation and agricultural production on the same land. An additional advantage of this approach is the potential to enhance the electromobility of agricultural machinery while contributing to climate protection. At present, there is a lack of such installations in Poland.
Analyzing the cost-effectiveness of investments in Agro PV systems, it can be concluded that when comparing the costs of electricity generation in smaller agrivoltaic systems with those of ground-mounted and rooftop systems, it becomes clear that they are not higher than conventional solar energy generation methods. Compared to ground-mounted photovoltaic installations, the costs appear higher, especially when accounting for the need to accommodate the passage of tall agricultural machinery. However, this comparison does not take into account the profits from crop cultivation, which can simultaneously be realized on the same land [20].
In the Agro PV guide published in October 2020 by Fraunhofer ISE, an average land coverage of 600 kWp per hectare is indicated for arable crops, and 700 kWp per hectare for permanent crops, such as berries. While specific costs are not provided, the guide highlights electricity prices for photovoltaic power plants in berry cultivation in the Netherlands ranging from €0.085 to €0.09 per kWh. For pears, cherries, or apples, the costs vary between €0.09 and €0.105 per kWh [21].
Fraunhofer’s guide is somewhat more optimistic regarding the average electricity production costs for permanent crops and grasslands, estimating them at €0.072 per kWh. For arable lands with higher and wider mounting systems, costs reach up to €0.10 per kWh [22].
Currently, most investors believe it is not feasible to finance an Agro PV system solely through fruit cultivation without a guaranteed tariff or appropriate premium. For instance, Solverde Project Company, which develops Agro PV projects for power purchase agreements, considers them economically viable only at scales above 10 MW [8,10,11,14].
The issue of Agro PV costs is particularly significant given that this integration with agriculture concerns the energy production sector, which has experienced the largest cost reductions compared to all other energy generation technologies. In the Polish context, investment costs aren’t the only factor. Poland is among the top ten countries with the worst seasonal water shortages. In times of regular drought, photovoltaic panels can help improve crop quality by improving water retention during droughts and protecting crops from extreme weather events. Ember estimates that this can bring significant benefits to shade-loving crops. Analysis shows that an Agro PV system on raspberries increases yields by up to 16% while producing 63% of the electricity that a traditional PV farm would provide. When combined with wheat, revenues per hectare can be twelve times higher than from wheat alone. This translates into a potential annual profit of PLN 5,400 per hectare from combined electricity and wheat sales in Poland [39].
The Agro PV market is expected to grow rapidly over the next few years. It is expected to reach $7.83 billion in 2029, at a compound annual growth rate (CAGR) of 10.9%. Growth over the forecast period can be attributed to growing concerns about food security, improved crop yields, public awareness and perception, corporate sustainability goals, and increasing rural development. Key trends during the forecast period include the integration of PV modules into agriculture, Agro PV microgrids, global expansion, and advances in agricultural technologies (Figure 3) [36].
A review of the scientific literature clearly indicates that design calculations for Agro PV systems are significantly more complex than those for traditional photovoltaic installations. They require an interdisciplinary approach combining knowledge from structural engineering, agronomy, microclimatology, and economics. Key areas of current research include [3,4,5,6,7,24]:
- Precise modeling of AgroPV load-bearing structures: Adapting Eurocodes to specific AgroPV geometries, including advanced wind and snow load analyses for tall and complex structures.
- Dual-function design optimization: Designing systems that are not only stable but also actively support agricultural production by optimizing shading, water management, and providing access for agricultural machinery.
- Materials research: Development and testing of materials resistant to specific agricultural environmental conditions (e.g., ammonia, moisture).
- Economic analysis and social acceptance: Developing cost-effective design solutions that increase investment profitability and address farmers’ concerns.
- Development of national regulations: There is an urgent need to create a specific Polish regulatory framework for AgroPV that will provide clear guidelines on structural design, permits and land classification, thereby reducing investment risks and accelerating their implementation.
2. Materials and Methods
The purpose of the conducted analysis is to verify whether the designed four-frame support structure for photovoltaic panels meets the requirements of Eurocode 1 – Actions on Structures – PN-EN 1991-1-4: “Wind Actions” and PN-EN 1991-1-3: “Snow Loads”. Additionally, a static strength analysis was performed to assess the structure’s resistance to wind and snow loads acting on the panels and the supporting structure.
Designing Agro PV systems requires a thorough understanding and consideration of dynamic environmental loads that can impact their stability and longevity. Wind and snow loads are key factors, as well as other atmospheric factors [7,8,9,10].
The subject of the structural analysis is a four-frame support structure designed specifically for photovoltaic panels. This particular design choice suggests a deliberate effort to balance robust structural stability with practical agricultural requirements, such as providing adequate space for agricultural machinery. The subject of the analysis was a four-frame support structure for photovoltaic panels, with its main structural elements made of S235 steel. The mechanical properties and chemical composition of the steel are summarized in Table 3 and Table 4.
This chemical composition directly influences the steel’s mechanical properties and its suitability for various environmental conditions, including potential corrosion in agricultural applications where exposure to factors such as ammonia or high humidity levels may occur. This detailed material specification provides the basis for the reliability of subsequent strength calculations. The mechanical properties of S235 steel are crucial for assessing its resistance to deformation and cracking under load.
Figure 4 presents fundamental technical parameters of Agro PV system technology.
Figure 5 presents the geometric model of the designed structure, detailing the load-bearing elements and their dimensions. Each of the four load-bearing segments accommodates 10 photovoltaic panels, each with dimensions of 1000 x 2000 mm.
The study involved analytically determining the maximum deflection value and the stress levels at the ultimate limit state for individual structural elements and specific load cases in accordance with the aforementioned standards. The calculations were performed using Graitec Advance Design software, designed for the analysis and design of steel, reinforced concrete, and timber structures, as well as for the automated generation of design reports. Wind loads were calculated based on the PN-EN 1991-1-4 standard, which defines wind actions on structures. The calculation process included determining wind speed, pressure, and forces acting on the structure, taking into account local climatic and geographical conditions. Terrain categories were also established, and factors such as roughness and topography were considered. Snow loads were analyzed in accordance with the PN-EN 1991-1-3 standard. The load values depend on the snow zones in Poland, with specific loads per square meter assigned to each zone.
2.1. Wind Calculations
Wind is considered the most significant load that must be considered when designing support structures for photovoltaic systems, including Agro PV. Aerodynamic forces acting on panels can generate significant stresses and bending moments in structural elements, which in extreme cases can lead to deformation, damage, or even complete failure of the installation. The height of the structure and the angle of the panels directly influence the magnitude and distribution of these loads. Taller structures and those with a larger surface area exposed to wind are naturally more susceptible to its damaging effects [9,10,11,12,13].
The calculations covered both permanent and exceptional load cases, taking into account the roof shape, wind exposure, and other factors. The structural response calculations begin with determining the basic wind speed using the following equation:
where: vb – basic wind speed, v(b,0) – fundamental value of the basic wind speed according to Table 3 of the aforementioned standard, cdir – directional factor selected according to Table 4 of the aforementioned standard, cseason – seasonal factor (for movable structures intended for year-round use, it is recommended to assume a value of 1).
The values of the above factors are also determined based on the geographic zone. The standard divides the territory of Poland into three zones: the first pertains to the central belt of the country, the second to the northwestern region, and the third to the southern border area. Along the zone boundaries, within a 10 km wide strip, average values specified in the standard for the respective geographic zones may be adopted. For the analysis, it was assumed that the designed structure would be used within the first geographic zone.
The assumed altitude above sea level for the designed structure is 100 m. Based on this, from Table 3 of the standard, the value of = 22 m/s was selected. The seasonal factor for the adopted wind direction of 0° was determined from Table 4 to be 0.8. Substituting the above values, the result is:
Determining the basic wind speed is the first step toward calculating the wind load on the structure. The procedure can be outlined as the following sequential steps:
- Determination of the basic wind speed;
- Determination of the reference height;
- Selection of the terrain category;
- Selection of the topography and roughness coefficients;
- Calculation of the mean wind speed;
- Calculation of turbulence intensity;
- Determination of the peak velocity pressure;
- Calculation of the structural factor;
- Determination of the wind force acting on the entire structure or its elements.
According to the above algorithm, the next step is to determine the reference height using the equation below.
where: Ze – reference height, Zg – distance from ground level to the considered element, h – height of the considered element.
For the analyzed case of the lattice element forming the ring connecting the load-bearing columns, the values of Zg and h are 5 m and 0.5 m, respectively. Thus, the reference height for this element is Zₑ = 5.25 m.
Roughness and topography of the terrain affect the value of the mean wind speed at the reference height. According to the national annex NA.6 of the standard 1991-1-4, the roughness coefficient is determined as follows:
The topography coefficient for the analyzed terrain was assumed to be due to the absence of slopes or elevations in the vicinity of the designed structure’s intended use. Knowing the basic wind speed and accounting for the roughness and topography coefficients, the mean wind speed can be determined:
In the next step, the turbulence intensity value was determined using the following formula:
where: – turbulence intensity at the reference height, – turbulence coefficient (recommended value: 1), – roughness length, with a value of 0.05 as specified in Table 4.1 of standard 1991-1-4.
This allows for the calculation of the turbulence intensity at the reference height, which is:
With all the above data, the peak velocity pressure value at the reference height can be determined:
where: – peak velocity pressure, – air density, assumed as 1.25 kg/m³ according to the standard.
Given that the height of the analyzed structure does not exceed 15 m, the structural coefficient was assumed to be equal to . With the above analytically determined values, the wind force can be calculated using the equation:
where: – wind force, – aerodynamic force coefficient (maximum value assumed as 2), – reference area of the structure or its element.
2.2. Snow Load Calculations
In the areas of Lower Silesian and Lubusz Voivodeships, as well as a small part of Greater Poland Voivodeship, a snow load of 70 kg/m² is assumed. The second zone, covering central Poland, includes the voivodeships of Kuyavian-Pomeranian, Masovian, Silesian, Greater Poland, West Pomeranian, and Łódź. The snow load in this area is 90 kg/m². The third zone, where the snow load reaches 120 kg/m², includes the voivodeships of Pomeranian, Subcarpathian, Lesser Poland, Świętokrzyskie, Lublin, the northern part of Kuyavian-Pomeranian, and parts of Warmian-Masurian. The fourth zone, covering the northeastern part of the country, is characterized by a snow load of up to 160 kg/m². The fifth zone, with the most challenging snow conditions, is located in the northern part of Lesser Poland Voivodeship, primarily covering the Podhale region and the Tatra Mountains. Depending on the area where the analyzed structure is located, the characteristic snow load value is determined based on Table NB.1 of the referenced standard. For the calculations, it was assumed that the designed structure, which is the subject of this study, would be located in the third snow zone at an altitude of 80 m. In this case, the characteristic value will be:
where: A – altitude above sea level.
Snow load must be determined for two cases: the permanent and transient design situations, based on the following equation:
and in the exceptional design situation, where snow load is considered an accidental action, based on the following equation:
where: – oof shape coefficient; for the designed structure, the slope of the single-pitch roof is 30° so , – exposure coefficient; it is assumed that the designed structure will be exposed to wind, as it is located in open, unobstructed flat terrain – in this case , – thermal coefficient; since the analyzed structure is a supporting structure without a roofed enclosure, no heat escapes through the roof surface, and the thermal coefficient takes a value of 1, – design value of the exceptional snow load on the ground for the given location, determined by the equation: ; – exceptional snow load coefficient for the given location and designed structure, assumed to be 1.
Using the above values, the snow load is determined for: a) the permanent and transient design situations, and b) the exceptional design situation.
3. Results
The load cases considered during the analysis of the structure’s strength under various wind and snow conditions, in accordance with PN-EN 1991-1-4 and PN-EN 1991-1-3 standards, are presented in Table 7.
For the listed wind and snow load cases, the structure met the strength requirements. Additionally, the structure was subjected to static loads. Figure 8 illustrates the load cases along with stress maps for the load-bearing elements – the columns.
The results for the load-bearing columns of the structure showed that the maximum stress was 84%, and the maximum deflection was 93%. Figure 9 presents the load cases along with stress maps for the lower chord elements of the structure PV.
The results for the load-bearing columns of the structure showed that the maximum stress was 72%, and the maximum deflection was 32%. Figure 10 presents the load cases along with stress maps for the upper chord elements.
The results for the load-bearing columns of the structure showed that the maximum stress was 29%, and the maximum deflection was 31%. Figure 11 presents the load cases along with stress maps for purlin-type elements.
The results for the load-bearing columns of the structure showed that the maximum stress was 84%, and the maximum deflection was 52%. Figure 12 presents the load cases along with stress maps for bracket-type elements.
The results for the load-bearing columns of the structure showed that the maximum stress was 95%, and the maximum deflection was 33%. All the presented loads for the structural components are within the permissible limits, allowing the structure to be used in the analyzed wind and snow load zone.
For the analysis, a photovoltaic system with a total capacity of 100 kWp was designed using PVsyst software. The main goal of this analysis is to determine the annual energy efficiency of the farm located in the Kuyavian-Pomeranian Voivodeship. The designed installation includes 200 sample photovoltaic modules AE 500ME-T150 (dimensions: 2176x1096x35 mm) with a power of 500 Wp, arranged vertically at a 30° angle facing south, and four inverters SUN2000-20KTL-M3 220Vac. In the simulation, the module mounting height was set at 5 m, with a row spacing of 1 m.
The key simulation results for the farm are presented in Table 8. For the study location, the annual global irradiance on the horizontal plane is 1056.8 kWh/m². The annual DC energy generated by the system and the annual AC energy fed into the grid are 102.95 MWh and 99.57 MWh, respectively.
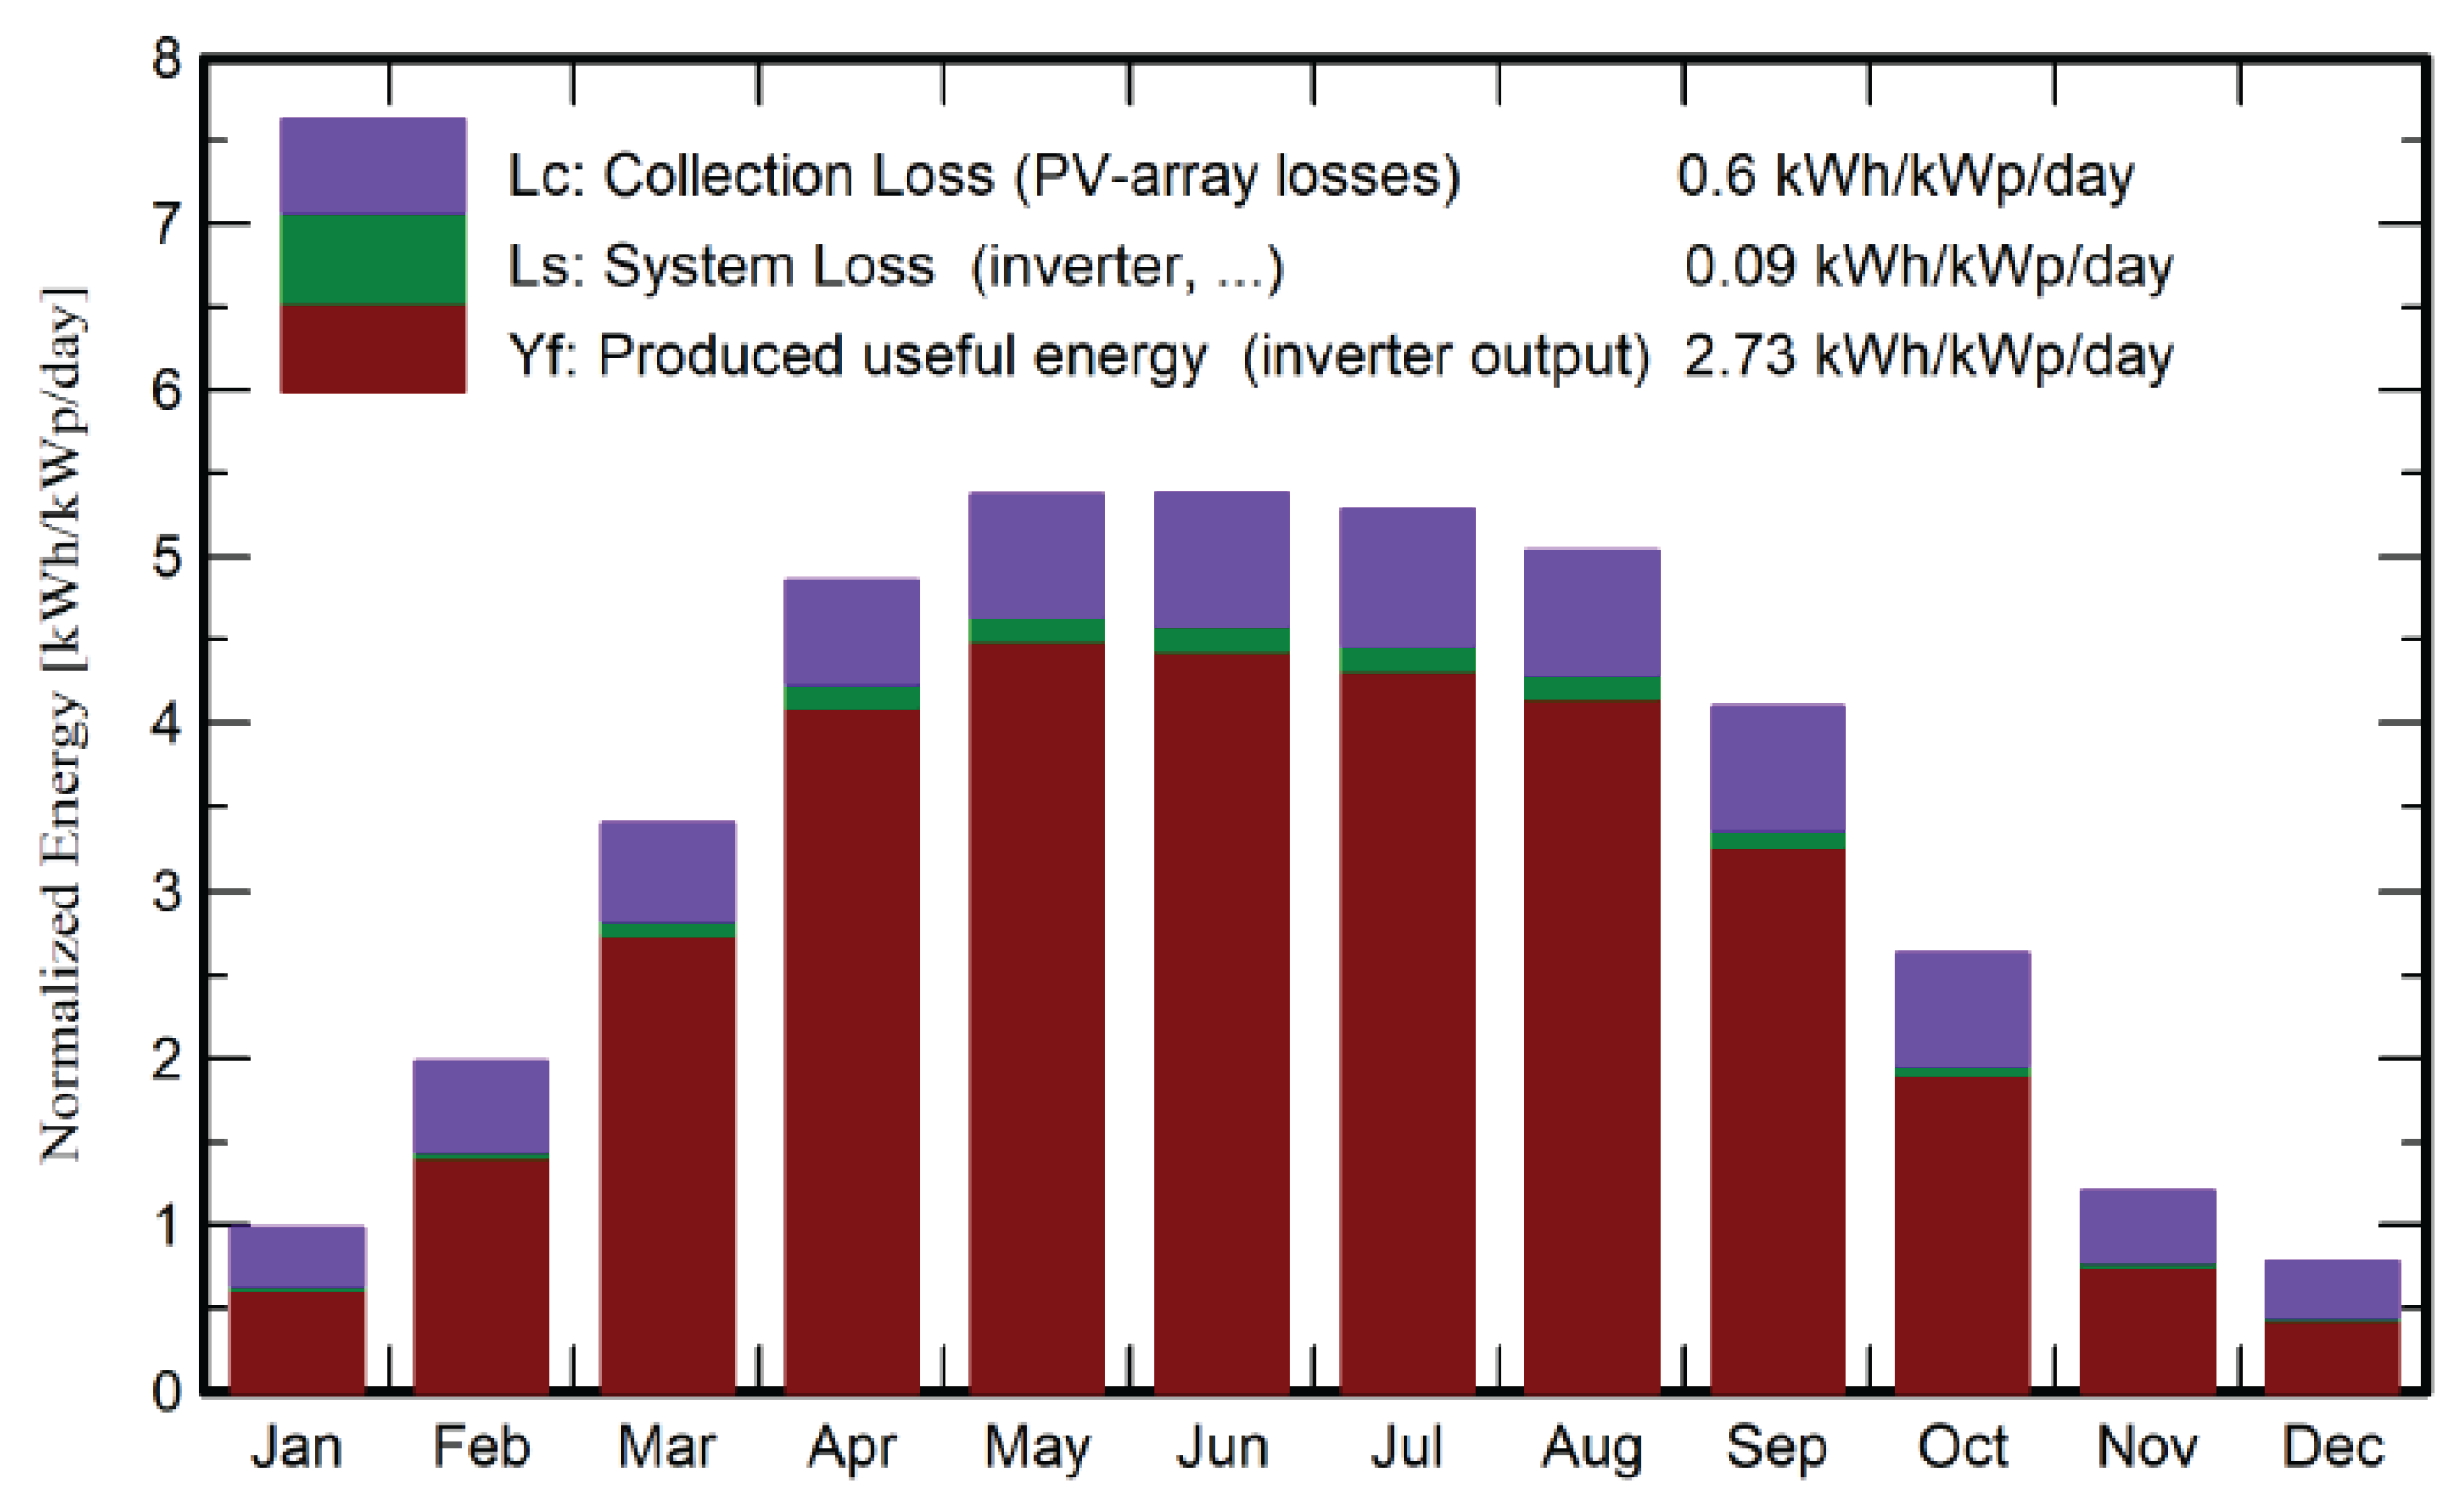
As part of the simulation, normalized productions were determined, including capture losses, system losses, and useful energy generated per installed kWp/day (Figure 13). Lc represents the capture losses of the photovoltaic panel, which amount to 0.6 kWh/kWp/day. Ls refers to system losses, which amount to 0.09 kWh/kWp/day, while Yf represents the useful energy generated, amounting to 2.73 kWh/kWp/day.
The simulated performance of a 100 kWp photovoltaic system is conducted in this study using the PVsyst software.
4. Discussion
4.1. Simulation Analysis
The article describes research on the design and optimization of a support structure for AgroPV systems, which combine electricity generation with agricultural activities. The aim of the study was to verify whether the developed four-frame support structure meets the requirements of Eurocode standards PN-EN 1991-1-3 (snow loads) and PN-EN 1991-1-4 (wind loads), as well as to evaluate the system’s energy efficiency under Polish climatic conditions. The main structural elements were made of durable S235 steel. The structural analysis included calculations of maximum deflection and stress values for various load cases, taking into account local climatic and geographical conditions. The simulations were conducted using Graitec Advance Design software.
The structure was designed to withstand both permanent and exceptional load scenarios, including wind and snow loads. The analysis results showed that the maximum stress in the structural elements ranged from 29% to 95%, depending on the component analyzed, leaving a safe margin relative to the material’s strength (in relation to the reference value - yield strength of S235 steel). The photovoltaic system was designed and analyzed using PVsyst software, assuming a 100 kWp installation in the Kuyavian-Pomeranian Voivodeship. The photovoltaic modules were arranged vertically at a 30° angle facing south, with a spacing of 1 m between panel rows. Simulation results indicated that the annual energy fed into the grid was 99.57 MWh, with the system performance ratio (PR) reaching 79.93%. The highest energy production was recorded in May (13.93 MWh), and the lowest in December (1.34 MWh). System and capture losses were minimal, highlighting the efficiency of the designed system. The research emphasizes the benefits of integrating AgroPV systems in Poland, where their development is primarily hindered by legal barriers and a lack of technical knowledge. The design enables simultaneous land use for energy production and agricultural activities, such as crop cultivation or livestock rearing, increasing economic efficiency per unit of area and supporting ecological initiatives.
Agro PV systems can also help protect crops from adverse weather conditions and promote the use of electric agricultural machinery. The study confirms that the designed structure meets strength requirements and can be effectively used in AgroPV systems. Furthermore, energy simulations demonstrate a high potential for energy production under Polish climatic conditions. This research provides valuable insights for designers and investors interested in developing Agro PV systems, especially in the European and Polish legal and environmental contexts. The article makes a significant contribution to the advancement of AgroPV technology, highlighting both the challenges and opportunities of integrating agriculture with solar energy. Future research could focus on analyzing new construction materials, optimizing business models, and testing under various environmental conditions.
In the existing literature, such as studies by Fraunhofer ISE, it is emphasized that the support structures of Agro PV systems must be designed with consideration for the specific climatic requirements of a given region, such as wind and snow loads. The findings presented in the article confirm the compliance of the designed structure with European standards, aligning with recommendations in the literature. Energy Efficiency: Fraunhofer ISE research indicates that the average annual efficiency of Agro PV systems in Europe is approximately 70-80%, consistent with the PR (Performance Ratio) of 79.93% achieved in the conducted simulation. Additionally, the global irradiance simulations in Fraunhofer’s studies align with the results obtained in the article under Polish conditions. Costs and Business Models: The literature highlights the higher initial costs of AgroPV systems compared to traditional ground-mounted installations, particularly in countries with limited subsidies, such as Poland. However, studies like those by Schindele (BayWa re) point to the advantages of simultaneous farming and energy production. The article’s findings align with these observations, emphasizing that the profitability of AgroPV depends on optimal design and legislative support. Impact on Agriculture: The study results demonstrate that AgroPV can help protect crops from extreme weather conditions, consistent with the literature, which highlights improvements in the microclimate under PV installations (e.g., reduced evaporation and protection from hail, as noted in studies conducted in China and Japan).
Legal Barrier in Poland: As noted in international studies, for example, in the context of Japan or France, the lack of appropriate regulations can significantly delay the development of AgroPV. The article accurately reflects this issue, emphasizing the need for legal changes to enable broader adoption of the technology in Poland. In summary, the findings presented in the article are consistent with the existing literature, while also complementing it with a detailed analysis specific to Polish conditions. Future research could focus on adapting AgroPV systems to the unique needs and challenges associated with Poland’s climate and legislation.
4.2. The Impact of Agro PV Design Parameters on Energy and Agricultural Efficiency
4.2.1. PV Module Inclination Angle
Tilt angle is a fundamental parameter affecting the direct energy efficiency of a photovoltaic installation. In Poland’s climatic conditions, the optimal tilt angle for photovoltaic panels, which ensures the highest annual PV system efficiency under typical solar radiation conditions, typically ranges from 30 to 40 degrees. Many installers and industry experts often recommend a 35-degree angle, considering it the “gold standard,” which provides the optimal compromise between summer and winter solar radiation, ensuring the most uniform energy production throughout the year. Research conducted by the Institute of Energy has shown that the difference in annual energy production between panels positioned at the optimal angle and those with an improper tilt can be up to 25%. Improper panel orientation can reduce energy production by 10-15%.
The optimal tilt angle for photovoltaic panels must be precisely adjusted to the latitude of the installation location. Differences in the optimal tilt angle between Polish regions (north vs. south) result from differences in the sun’s altitude above the horizon. For south-facing installations in southern Poland, a panel tilt angle of approximately 30 to 35 degrees will be more efficient. However, for northern Poland, the optimal tilt angle ranges from 35 to 40 degrees. This is not just an academic curiosity, but a practical guideline. Designing an Agro PV farm in northern Poland with an optimal south-facing angle would result in suboptimal energy production. This demonstrates that “optimization” is a highly contextual process and requires a detailed analysis of local solar conditions.
Tilt angle is a multifunctional parameter, influencing both optimal solar energy harvesting and minimizing losses resulting from environmental impacts. Snow accumulation on photovoltaic panels can significantly reduce their efficiency and even completely block electricity production.
The tilt angle of the panels also affects their ability to self-clean from dust, dirt, and other contaminants caused by rain. Steeper angles promote more efficient water and dirt runoff, which helps keep the panel surfaces clean and therefore highly efficient. Vertical structures are less susceptible to dirt accumulation, which also contributes to maintaining high efficiency year-round.
The tilt angle of PV modules in Agro PV systems is a dynamic interaction with wind, where wind can be both a structural threat and a factor in improving efficiency. Designing the tilt angle must take this duality into account: on the one hand, it minimizes aerodynamic loads in extreme conditions to ensure safety, and on the other hand, in everyday conditions, it allows for efficient cooling of the panels to increase efficiency. This requires advanced aerodynamic simulations and testing during the design phase.
4.2.2. Density of PV Modules
The designer must consider not only maximizing energy production and agricultural functionality, but also legal and financial aspects, such as insurance costs and compliance with their requirements. This may lead to the need to increase the land area designated for the installation, which is particularly important in the case of Agro PV due to the dual use of the land. Panel density is a key parameter for managing the microclimate under the installation, allowing Agro PV to be tailored to the specific needs of different crops and climatic conditions. Studies have shown that solar irradiance under PV installations is inversely correlated with panel density. In the open field, the average irradiance was 336 W/m². Under panels with 50%, 75%, and 100% density, these values were lower by 42.6–188.3 W/m², 59.8–246 W/m², and 72.2–361.4 W/m², respectively. A 50% density maximizes light penetration, reaching 113.8 W/m² compared to 66.4 W/m² at 100% density. The central zone under the panels consistently received more irradiance than the peripheral zones, due to less shading at midday [25,26,27,28,41].
Higher panel density promotes a greater cooling effect during the day. The average daytime temperature in the open field was 33.7∘C, and under panels with 50%, 75%, and 100% density, it was 1.4–2.5∘C lower, respectively. Nighttime temperature variations were minimal, less than 0.3∘C. Soil temperatures under the panels were consistently lower than in the open field (28.7∘C vs. 27.4–28.3∘C). Reducing panel density led to higher soil temperatures, with 50% density resulting in temperatures 0.5–1.1∘C higher than 100% density. The central zone showed less temperature fluctuation, which is ideal for plant root development [41].
Adopting intermediate panel densities (e.g., 50–75%) can optimize conditions for shade-tolerant crops, such as leafy vegetables and berries. Shading can be beneficial for some crops, protecting them from excessive sunlight, sunburn, and drought stress. In Poland, where some regions experience excessive sunlight, partial shading is even desirable for some plant species.
Microclimatic changes beneath the panels, such as cooling and increased humidity, can paradoxically increase the energy efficiency of the panels themselves, creating a positive feedback loop. PV panels operate more efficiently at lower temperatures. Studies show that higher panel densities lead to cooling during the day. Additionally, lower panel temperatures, resulting from lower air temperatures and higher humidity beneath the panels, lead to higher electricity production. This is an example of positive synergy, where benefits for crops (lower temperature, increased humidity) directly translate into benefits for photovoltaic energy production.
4.3. An Integrated Approach to Modeling Agro PV Systems
The complexity of Agro PV systems requires a shift from modeling individual components to holistic simulation frameworks that consider their interactions. The complex interactions between PV modules, crops, and local microclimate require integrated modeling platforms to accurately predict both crop and energy yields prior to installation. A siloed approach focusing solely on energy or agriculture is insufficient and can lead to suboptimal designs. The shift from single-discipline modeling to integrated, multi-criteria simulation frameworks is a hallmark of advanced Agro PV research. This shift confirms that the true value of Agro PV lies in its synergies, which can only be fully realized and optimized through a holistic understanding of interconnected physical, biological, and economic processes. Early Agro PV research may have focused on PV efficiency or agricultural yields in isolation. However, the fundamental premise of Agro PV is dual use, which implies a synergistic relationship. This synergy is complex and involves trade-offs.
Therefore, a model that only predicts energy production or yield will miss critical interactions (e.g., how crop shading affects panel temperature, or how panel height affects wind loads). A holistic framework is essential to capture these interdependencies and enable true multi-objective optimization, leading to designs that maximize combined benefits, not just individual components [7,8].
- Shading models: To quantify the distribution of photosynthetically active radiation (PAR).
- Microclimate models (CFD): To simulate airflow, temperature, humidity, and their effects on plants and panels.
- Electrical performance models: To predict PV energy yield under variable conditions.
- Crop growth models: To quantify yield potential based on light, temperature, and water availability.
- Structural models (FEM): To ensure the physical integrity of the system under varying loads.
Integrated models aim to optimize system performance across multiple dimensions, including economic returns, operational emission reductions, and water use efficiency. This involves balancing conflicting requirements, such as maximizing solar energy production versus maximizing yield.
Table 9 presents overview of recommended modeling and simulation tools for Agro PV research.
Artificial intelligence (AI) and big data, as shown in Table 9, are increasingly being used to develop predictive models for Agro PV systems, providing information for design, control, and monitoring. This can include predicting food and energy yields before installation. AI can also enable the creation of dynamic control algorithms for trackers, optimizing panel positioning based on current crop needs and weather conditions [24].
5. Conclusions
This article presents a comprehensive analysis of the structural strength and energy efficiency of the proposed Agro photovoltaic system. Simulation studies conducted using Graitec Advance Design and PVsyst software allowed for the formulation of key conclusions relevant to the design, implementation, and future development of this technology.
The main conclusions from the research include:
- Structural strength: Numerical simulations demonstrated that the proposed Agro PV system support structure, taking into account wind and snow loads in accordance with Eurocode standards, is capable of withstanding Polish climatic conditions. Stress and displacement analysis demonstrated that even in the most extreme scenarios, the structure maintains an adequate safety margin. This is crucial for ensuring the reliability and longevity of the installation, which has a direct impact on the profitability of the investment.
- Energy efficiency: Studies have shown that Agro PV systems, despite the need to adjust the orientation and tilt of the panels to suit the crops, can achieve high energy efficiency. Optimizing installation parameters, such as module spacing and tilt, minimizes energy losses while ensuring adequate light for plants. This confirms that combining agricultural production with photovoltaic energy is technically feasible and effective.
- Impact on crops: Although modeling strength and energy efficiency was the primary goal, this analysis also highlights important implications for agriculture. Designing a structure that minimizes shading and provides adequate space for agricultural machinery is fundamental to the success of the entire Agro PV concept. The results suggest that flexibility in the selection of design parameters is possible without significantly compromising stability and energy efficiency.
Based on the conducted research, it is concluded that implementing Agro PV installations in Poland is technically and economically viable. However, further research is needed, which should focus on:
- Field studies: Studies on actual Agro PV installations are necessary to verify the simulation results and provide empirical data on both energy production and the impact on long-term yields.
- Economic optimization: Further analyses should incorporate complex economic models that integrate construction and maintenance costs, energy production, market prices, and the impact on crop value and yield.
- Integration with the energy system: Research should also address the impact of agro-PV systems on local distribution networks and the potential for energy storage, which is crucial for increasing the stability and reliability of the energy system.
In summary, this article provides a solid foundation for considering the future of agro-photovoltaics in Poland. The results clearly indicate that, with appropriate design, food production can be effectively combined with clean energy generation, creating sustainable solutions for agriculture and the energy sector.
6. Future Research Directions
Based on the above analysis, the following recommendations for further research and development in the field of modeling the structural strength and operational efficiency of Agro PV systems are presented:
- Development of advanced aerodynamic and material models of Agro PV systems: It is necessary to deepen research into the complex aerodynamic phenomena affecting Agro PV structures, especially in high-rise and tracker systems. Fluid-Structure Interaction (FSI) models should be developed and innovative methods for mitigating wind loads should be explored. Further modeling of long-term material degradation under the influence of environmental factors (UV, temperature, moisture, corrosion) is equally important to increase the predictability of structure life.
- In regions with heavy snowfall, models should more precisely account for dynamic structural loading phenomena and their impact on panel performance (verification by using sensors to measure deflections and stresses in real time under various weather conditions), including the energy gain resulting from snow reflection by double-sided panels.
- More advanced optimization models are needed that integrate structural, energy, agronomic, and economic aspects into a single framework. These models should be able to effectively manage trade-offs between competing objectives and adapt to local conditions, translating expert knowledge into quantitative guidelines.
- Conduct a controlled experiment to measure crop yield, soil moisture, and microclimate parameters (temperature, humidity, light distribution) under the photovoltaic panels compared to a control plot. It is also necessary to develop and implement an integrated, multi-criteria modeling framework, as proposed by the authors in the discussion. This approach would allow for simulating the complex interactions between all system components and conducting true optimization.
- Promote and develop hybrid models combining physical simulations with machine learning for yield and energy yield prediction. It is also crucial to collect and share more empirical data from real-world Agro PV projects, in various climates and configurations, for model validation and benchmarking. Conducting a comprehensive techno-economic analysis that goes beyond simple LCOE and considers the full financial picture, including crop revenues, maintenance costs and potential subsidies, to ensure a solid business case for Agro PV in Poland.
- Further development of Agro PV requires close collaboration between scientists, engineers, farmers, and policymakers. Governments should actively create a clear and coherent legal framework that supports the implementation of Agro PV, eliminating regulatory barriers and offering economic incentives that reflect the dual benefits of these systems.
Implementing these recommendations will contribute to the further development of Agro PV technology, increasing its reliability, efficiency and cost-effectiveness, which is crucial for a sustainable future of energy and agriculture.
Author Contributions
Conceptualization, A.M., M.W., M.A. and P.W.; methodology, A.M., M.W., M.A.; software, M.W., M.A., P.W.; validation, A.M., M.W., M.A. and P.W.; formal analysis, A.M., M.W., M.A.. and P.W.; investigation, A.M., M.W., M.A. and P.W.; resources, A.M., M.W., M.A.; writing - original draft preparation, A.M., M.W., M.A. and P.W.; writing—review and editing, A.M., M.W., M.A. and P.W.; visualization, M.W., M.A. and P.W. All authors have read and agreed to the published version of the manuscript.
Funding
The work presented in this paper was financed by a grant to maintain the research potential of Bydgoszcz University of Science and Technology and Kazimierz Wielki University.
Acknowledgments
The authors of the article would like to thank company: Grupa MND Sp. z o. o. Działdowo Polska (www.grupamnd.pl) for the opportunity to jointly conduct research and implement the structure and for presenting the research results in this publication.
Conflicts of Interest
The authors declare no conflicts of interest.
Nomenclature
| Agro PV | Agro Photovoltaic |
| AI | Artificial Intelligence |
| APyV | Agrivoltaic System Planning with Python - Python-based tool designed to optimize the design of Agro PV facilities |
| bPV | Bifacial Photovoltaic |
| CAGR | Compound Annual Growth Rate |
| CAPEX | capital expenditures |
| CFD | Computational Fluid Dynamics |
| DiffHor | Horizontal diffuse irradiation |
| EArray | Effective energy at the output of the array |
| E_Grid | Energy injected into grid |
| FSI | Fluid-Structure Interaction |
| FEM | Finite Element Modeling |
| FP | Functional Programming |
| GlobEff | Effective Global, corr. for IAM and shadings |
| GlobHor | Global horizontal irradiation |
| GlobInc | Global incident in coll. plane |
| IoT | Internet of Things |
| kWh | kilowatt hours |
| kWp | kilowatt-peak |
| LCOE | Levelized Cost of Electricity |
| Lc | Collection Loss (PV-array losses) |
| Ls | System Loss (inverter, ...) |
| MINLP | Mixed-Integer Nonlinear Programming |
| NPV | Net Present Value |
| PAR | Photosynthetically Active Radiation |
| PV | Photovoltaics |
| PR | Performance Ratio |
| ROI | Return On Investment |
| SAM | System Advisor Model |
| T_Amb | Ambient Temperature |
| Yf | Produced useful energy (inverter output) |
| $ | United States dollars |
References
- Kumpanalaisatit, M.; Setthapun, W.; Sintuya, H.; Pattiya, A.; Jansri, S.N. Current status of agrivoltaic systems and their benefits to energy, food, environment, economy, and society. Sustain. Prod. Consum. 2022, 33, 952–963. [Google Scholar] [CrossRef]
- Ghosh, A. Nexus between agriculture and photovoltaics (agrivoltaics, agriphotovoltaics) for sustainable development goal: A review. Solar Energy 2023, 266, 112146. [Google Scholar] [CrossRef]
- Bosman, L.; Kádár, J.; Yonnie, B.; LeGrande, A. How Market Transformation Policies Can Support Agrivoltaic Adoption. Sustainability 2024, 16, 11172. [Google Scholar] [CrossRef]
- Chalgynbayeva, A.; Gabnai, Z.; Lengyel, P.; Pestisha, A.; Bai, A. Worldwide Research Trends in Agrivoltaic Systems—A Bibliometric Review. Energies 2023, 16, 611. [Google Scholar] [CrossRef]
- Al Mamun, M.A.; Dargusch, P.; Wadley, D.; Zulkarnain, M.A.; Aziz, A.A. A review of research on agrivoltaic systems. Renewable and Sustainable Energy Reviews 2022, 161, 112351. [Google Scholar] [CrossRef]
- Zahrawi, A.A.; Aly, A.M. A Review of Agrivoltaic Systems: Addressing Challenges and Enhancing Sustainability. Sustainability 2024, 16, 8271. [Google Scholar] [CrossRef]
- Mehta, K.; Zörner, W. Optimizing Agri-PV System: Systematic Methodology to Assess Key Design Parameters. Energies 2025, 18, 3877. [Google Scholar] [CrossRef]
- Birchall, M.; Hussain, S.N.; Ghosh, A. Review of agrivoltaic demonstration site studies with comparable configurations for a UK-based application. Solar Compass 2025, 15, 100135. [Google Scholar] [CrossRef]
- Zainali, S.; Qadir, O.; Parlak, S.C.; Ma Lu, S.; Avelin, A.; Stridh, B.; Campana, P.E. Computational fluid dynamics modelling of microclimate for a vertical agrivoltaic system. Energy Nexus 2023, 9, 100173. [Google Scholar] [CrossRef]
- Li, Y.; Armstrong, A.; Simmons, C.; Krasner, N.Z.; Hernandez, R.R. Ecological impacts of single-axis photovoltaic solar energy with periodic mowing on microclimate and vegetation. Front. Sustain. 2025, 6, 1497256. [Google Scholar] [CrossRef]
- Schindele, S.; Trommsdorff, M.; Schlaak, A.; Obergfell, T.; Bopp, G.; Reise, Ch.; Braun, Ch.; Weselek, A.; Bauerle, A.; Högy, P.; Goetzberger, A.; Weber, E. Implementation of agrophotovoltaics: Techno-economic analysis of the price-performance ratio and its policy implications, Applied Energy 2020, 265, 114737. [CrossRef]
- Riaz, M.H.; Younas, R.; Imran, H.; Butt, N.Z. Module Technology for Agrivoltaics: Vertical Bifacial vs. Tilted Monofacial Farms. 47th IEEE Photovoltaic Specialists Conference (PVSC), Calgary, AB, Canada, 2020; pp. 1349–1352. [CrossRef]
- Schuck, F.; Bach, H.; Bousi, E.; Schindele, S. Agrivoltaics Crop Yield Modeling: Quantifying the Effects of Light Limitations on Crop Growth. AgriVoltaics Conf Proc 2025, 3. [Google Scholar] [CrossRef]
- Khan, M.R.; Hanna, A.; Sun, X.; Alam, M.A. Vertical bifacial solar farms: Physics, design, and global optimization, Applied Energy 2017, 206, 240–248. [CrossRef]
- Bruno, M.; Gfüllner, J.J.; Matthew, F. Enhancing agrivoltaic synergies through optimized tracking strategies. Berwind J. Photonics Energy 2025, 15, 032703. [Google Scholar] [CrossRef]
- Sollazzo, L.; Mangherini, G.; Diolaiti, V.; Vincenzi, D. A Comprehensive Review of Agrivoltaics: Multifaceted Developments and the Potential of Luminescent Solar Concentrators and Semi-Transparent Photovoltaics. Sustainability 2025, 17, 2206. [Google Scholar] [CrossRef]
- Simonenko, S.; Loya, J.A.; Rodriguez-Millan, M. An Experimental and Numerical Study on the Influence of Helices of Screw Piles Positions on Their Bearing Capacity in Sandy Soils. Materials 2024, 17, 525. [Google Scholar] [CrossRef]
- Kumdokrub, T.; Fengqi, Y. Techno-economic and environmental optimization of agrivoltaics: A case study of Cornell University, Applied Energy 2025, 384, 125436. [CrossRef]
- Ryyan, K.M.; Sacr, E.; Sun, X.; Bermel, P. , Alam, M.A.: Ground sculpting to enhance energy yield of vertical bifacial solar farms. Applied Energy 2019, 241, 592–598. [Google Scholar] [CrossRef]
- Dinesh, H.; Pearce, J. M. The potential of agrivoltaic systems. Renewable and Sustainable Energy Reviews 2016, 54, 299–308. [Google Scholar] [CrossRef]
- Agostini, A.; Colauzzi, M.; Amaducci, S. Innovative agrivoltaic systems to produce sustainable energy: An economic and environmental assessment. Applied Energy 2021, 281, 116102. [Google Scholar] [CrossRef]
- Amaducci, S.; Yin, X. , Colauzzi, M. Agrivoltaic systems to optimise land use for electric energy production. Applied energy 2018, 220, 545–561. [Google Scholar] [CrossRef]
- Schindele, S.; Trommsdorff, M.; Schlaak, A.; Obergfell, T.; Bopp, G.; Reise, C.; Braun, C.; Weselek, A.; Bauerle, A.; Högy, P. Implementation of agrophotovoltaics: Techno-economic analysis of the price-performance ratio and its policy implications. Appl. Energy 2020, 265, 114737. [Google Scholar] [CrossRef]
- Rojek, I.; Mroziński, A.; Kotlarz, P.; Macko, M.; Mikołajewski, D. AI-Based Computational Model in Sustainable Transformation of Energy Markets. Energies 2023, 16, 8059. [Google Scholar] [CrossRef]
- Walichnowska, P. ; Mroziński; A.; Idzikowski, A.; Fröhlich, S.R. Energy efficiency analysis of 1 MW PV farm mounted on fixed and tracking systems, Construction of Optimized Energy Potential, (CoOEP), 11, 2022, 75-83. [CrossRef]
- Walichnowska, P.; Mroziński, A.; Idzikowski, A. : The impact of selected parameters on the efficiency of PV installations - simulation test of the 1 MW PV farm in the PVSYST program. CzOTO 2022, 4, 179–185. [Google Scholar] [CrossRef]
- Flizikowski, J.; Mroziński, A. Photovoltaic installation engineering. Wydawnictwo Grafpol, Bydgoszcz, 2016. https://scholar.google.com/scholar?cluster=17366722294280522267&hl=en&oi=scholarr.
- Mroziński, A. . Poradnik dobrych praktyk wdrażania instalacji odnawialnych źródeł energii. 1studio. pl Arkadiusz Bartnik, Bydgoszcz, 2015. Available online: https://scholar.google.com/scholar?cluster=13900899847970099663&hl=en&oi=scholarr.
- Rahman, M.M.; Khan, I.; Field, D.L.; Techato, K.; Alameh, K. Powering agriculture: Present status, future potential, and challenges of renewable energy applications. Renewable Energy 2022, 188, 731–749. [Google Scholar] [CrossRef]
- Reina, G.P.; De Stefano, G. Computational evaluation of wind loads on sun-tracking ground-mounted photovoltaic panel arrays, Journal of Wind Engineering and Industrial Aerodynamics 2017, 170, 283–293. [CrossRef]
- Aly, A.M.; Whipple, J. Wind Forces on Ground-Mounted Photovoltaic Solar Systems: A Comparative Study. Appl. Sol. Energy 2021, 57, 444–471. [Google Scholar] [CrossRef]
- Asa’a, S.; Reher, T.; Rongé, J.; Diels, J.; Poortmans, J.; Radhakrishnan, H.S.; Van der Heide, A.; Van de Poel, B.; Daenen, M. A multidisciplinary view on agrivoltaics: Future of energy and agriculture. Renewable and Sustainable Energy Reviews 2024, 200, 114515. [Google Scholar] [CrossRef]
- Özdemir, Ö.E.; Bretzel, T.; Gfüllner, L.; Gorjian, S.; Katircioglu, Y.; Dur, B.; Trommsdorff, M. Design, simulation, and experimental evaluation of an agrivoltaic greenhouse in Turkey. Results in Engineering 2025, 26, 105278. [Google Scholar] [CrossRef]
- Zainol Abidin, M.A.; Mahyuddin, M.N.; Mohd Zainuri, M.A.A. Solar Photovoltaic Architecture and Agronomic Management in Agrivoltaic System: A Review. Sustainability 2021, 13, 7846. [Google Scholar] [CrossRef]
- Sarr, A.; Soro, Y.M.; Tossa, A.K.; Diop, L. Agrivoltaic, a Synergistic Co-Location of Agricultural and Energy Production in Perpetual Mutation: A Comprehensive Review. Processes 2023, 11, 948. [Google Scholar] [CrossRef]
- Agrivoltaics Global Market Report 2025. Available online: https://www.thebusinessresearchcompany.com/report/agrivoltaics-global-market-report (accessed on 8 August 2025).
- Czechia introduces first rules for agrivoltaics. Available online: https://www.pv-magazine.com/2024/05/10/czechia-introduces-first-rules-for-agrivoltaics/ (accessed on 8 August 2025).
- The Ministry of Agriculture does not plan to change regulations regarding agrovoltaics. Available online: https://www.agropolska.pl/zielona-energia/energia-sloneczna/ministerstwo-rolnictwa-nie-planuje-zmian-przepisow-pod-katem-agrowoltaiki,167.html (accessed on 8 August 2025).
- Poland has the potential for 119 GW of agrivoltaics, but the government does not plan to facilitate. Available online: https://wysokienapiecie.pl/103676-polska-ma-potencjal-na-119-gw-agrowoltaiki-ale-rzad-nie-planuje-ulatwien/ (accessed on 8 August 2025).
- Windloads on agrivoltaic PV-systems. Available online: https://ifi-ac.com/en/news/details/windloads-on-agrivoltaic-pv-systems (accessed on 8 August 2025).
- Impact of Solar Panel Density on the Photothermal Environment of Photovoltaic Arrays. Available online: https://www.voltcoffer.com/impact-of-solar-panel-density-on-the-photothermal-environment-of-photovoltaic-arrays/ (accessed on 8 August 2025).
Figure 1.
Idea of Agro PV system [19].
Figure 1.
Idea of Agro PV system [19].
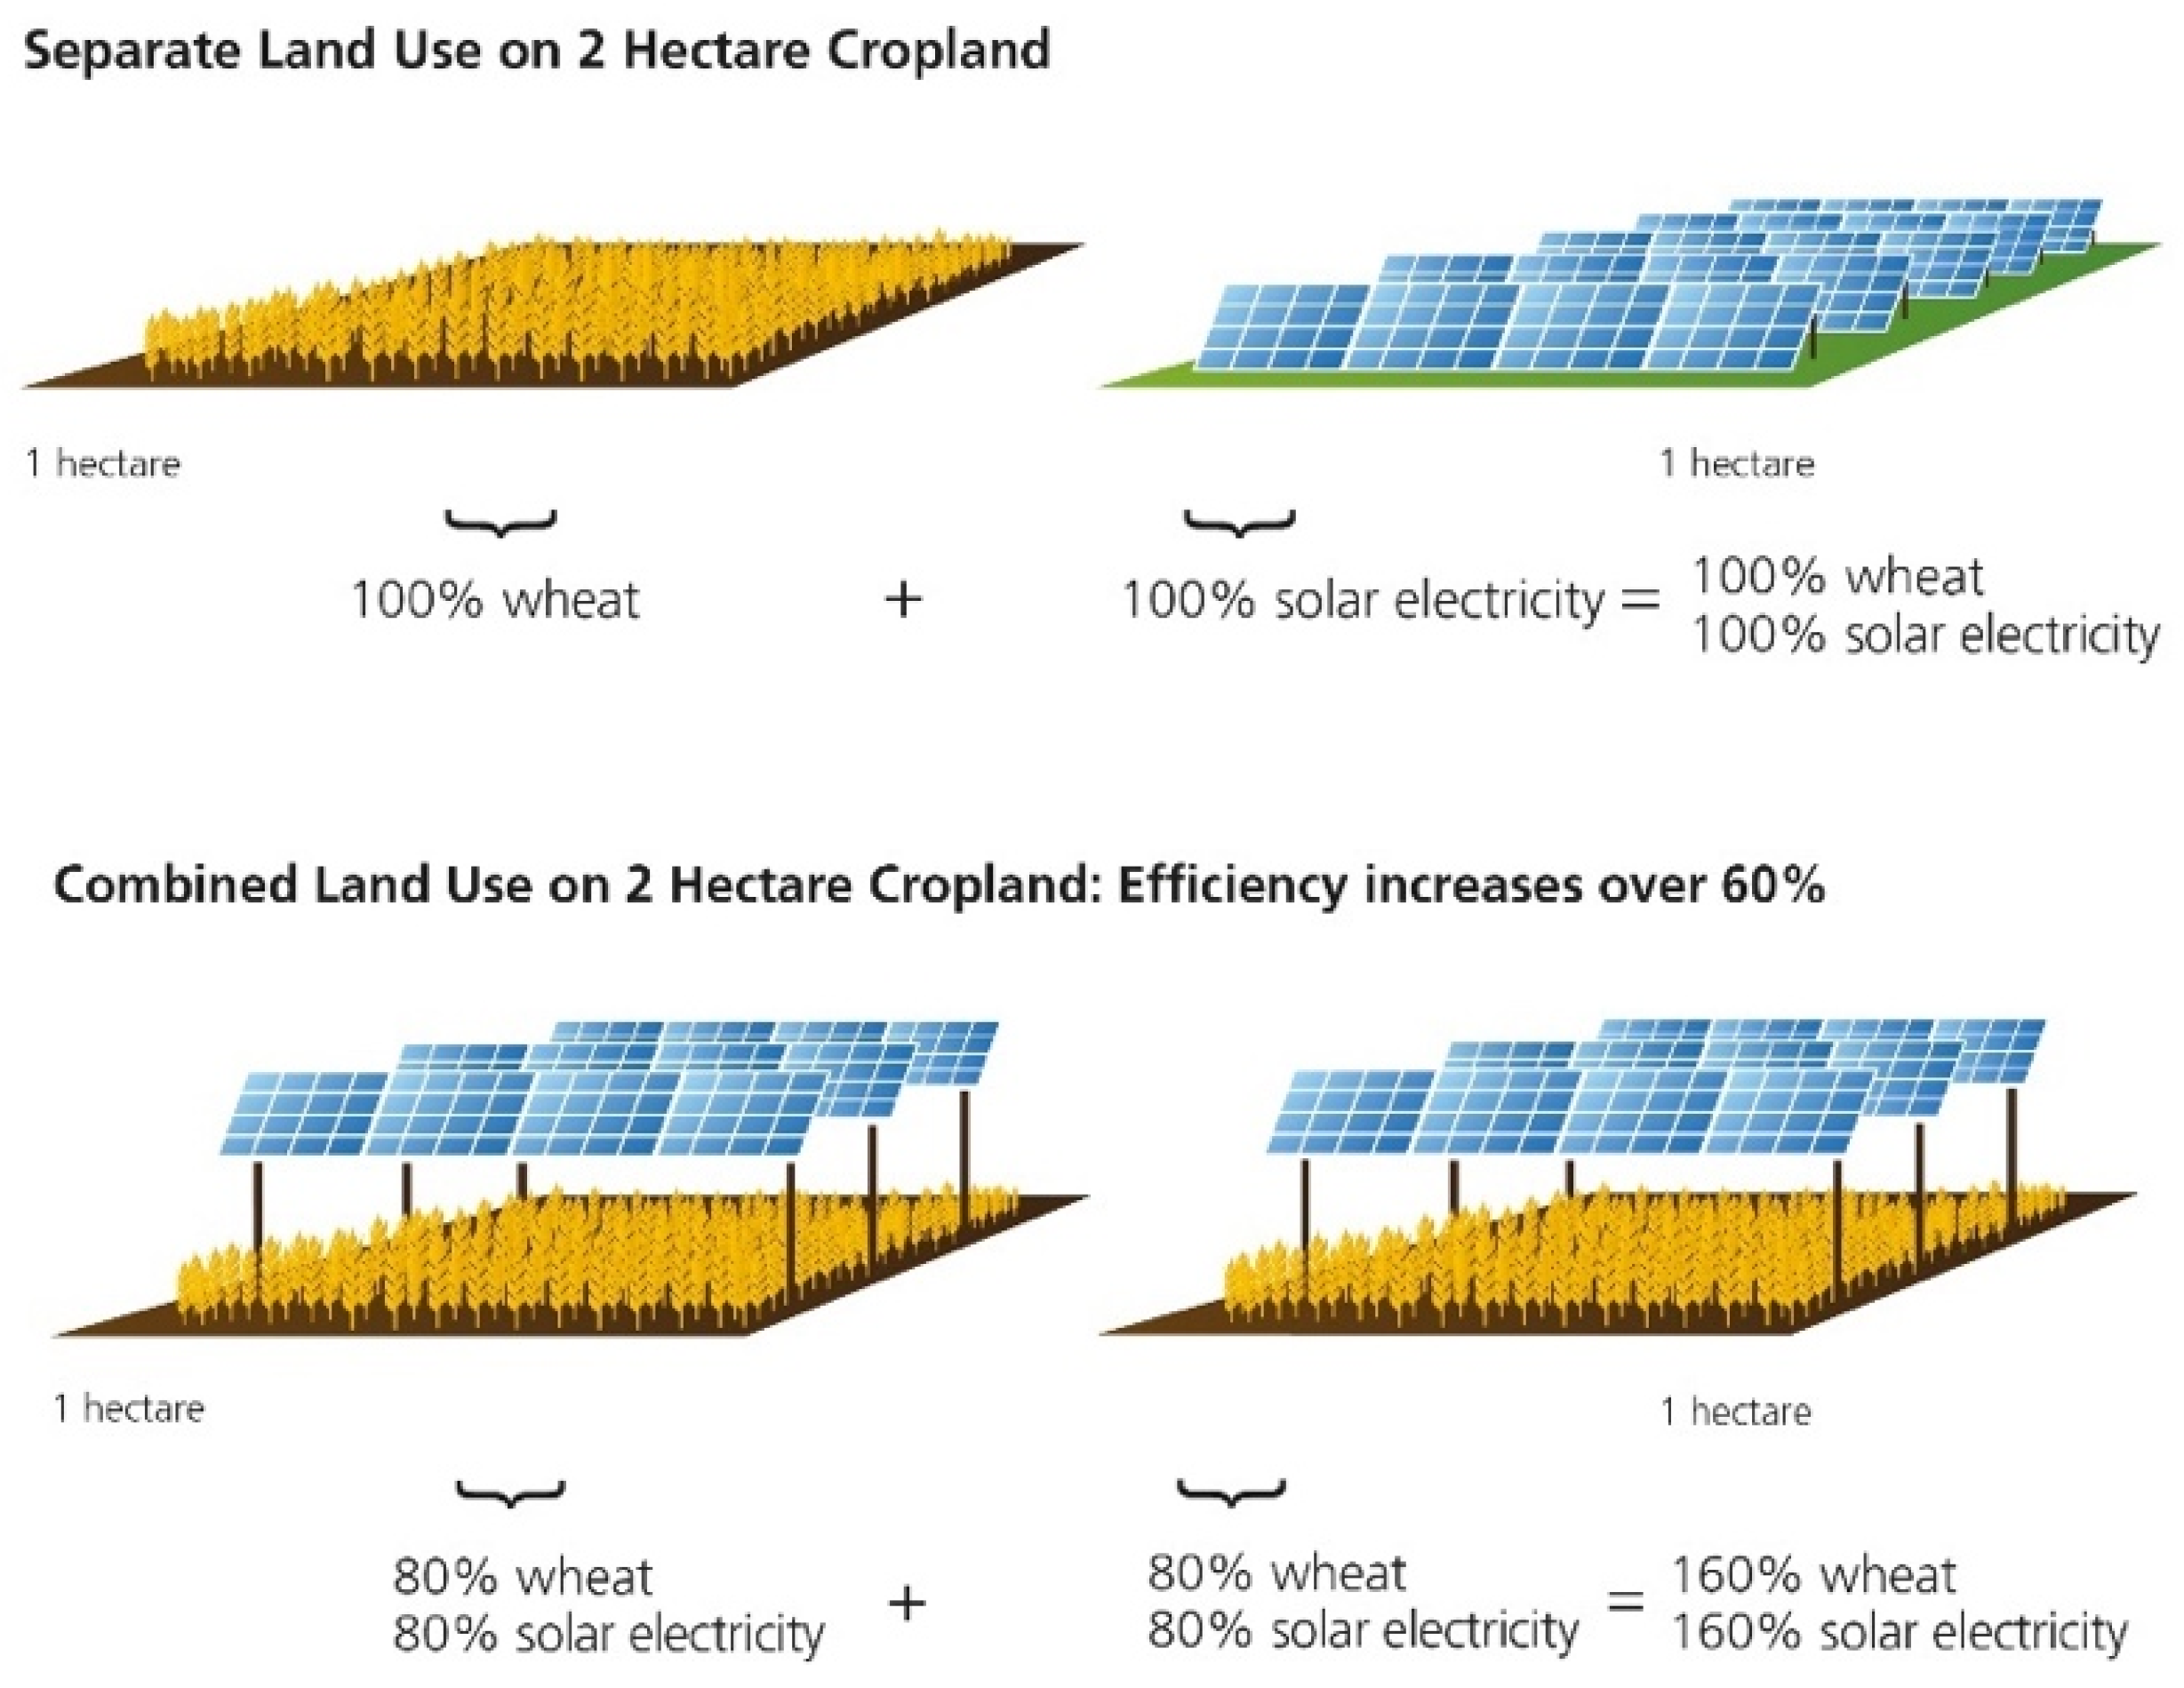
Figure 2.
Agro PV installation in the Oława Energy Cluster in Poland.
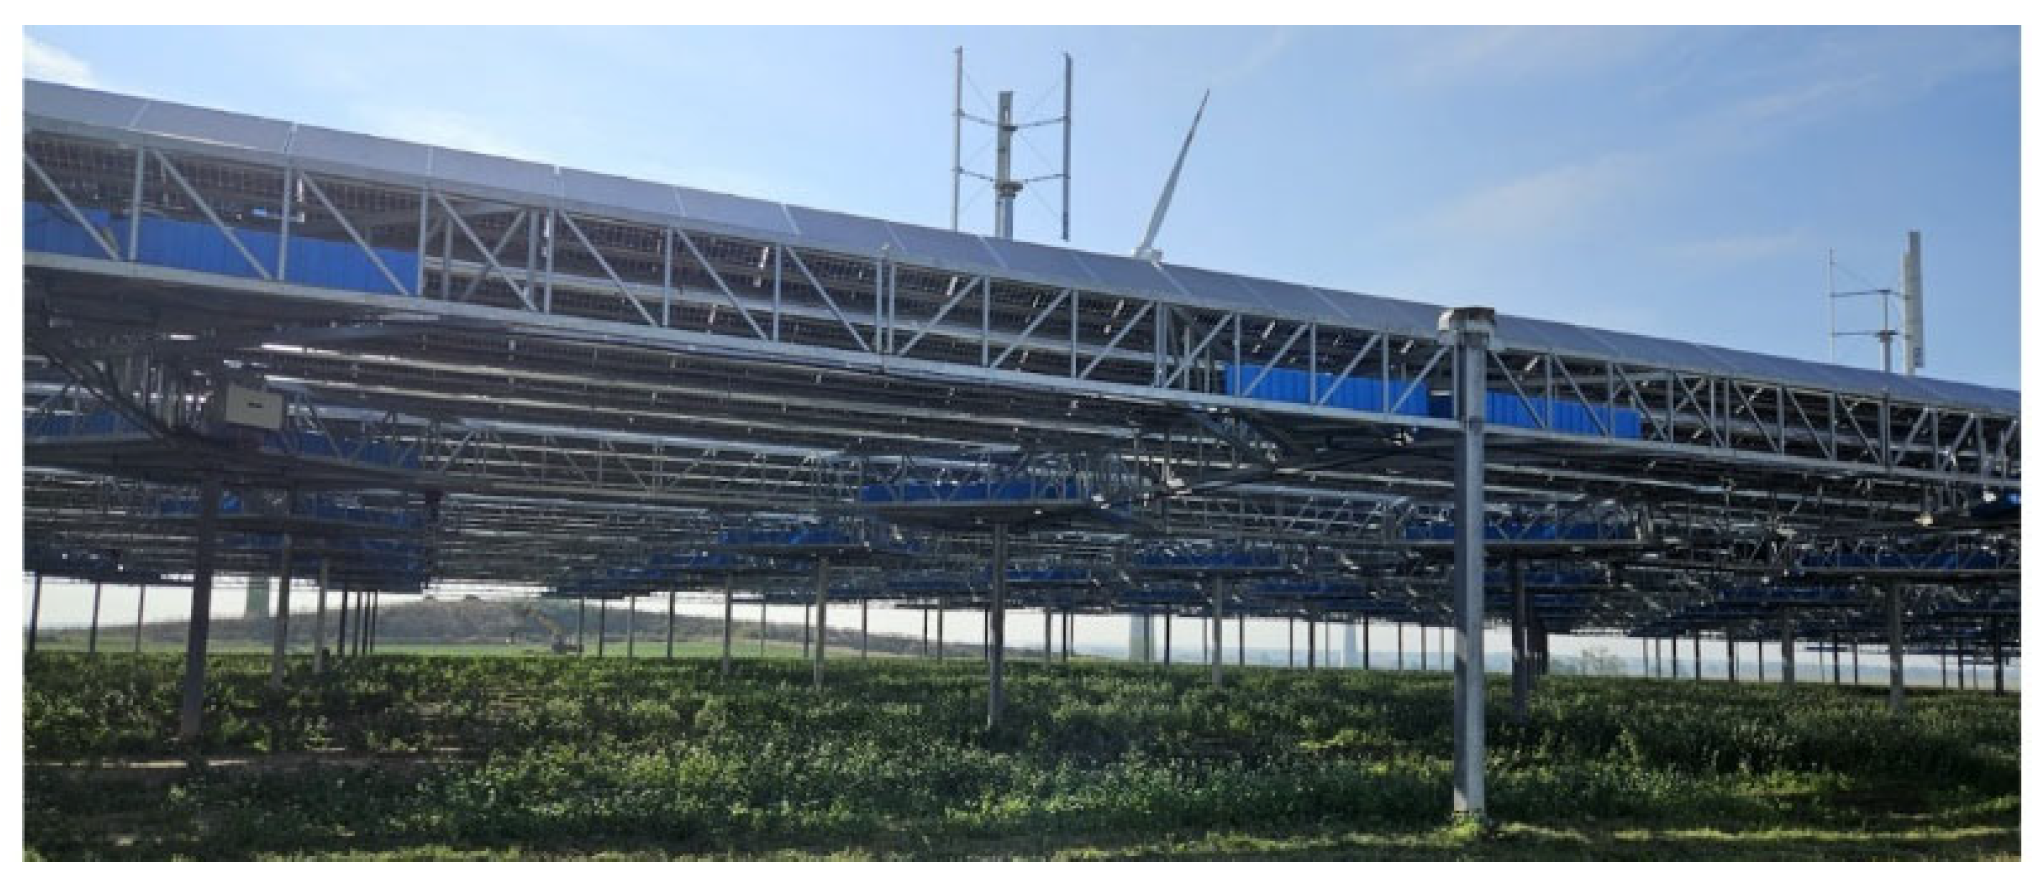
Figure 3.
Agro PV global market report [36].
Figure 3.
Agro PV global market report [36].
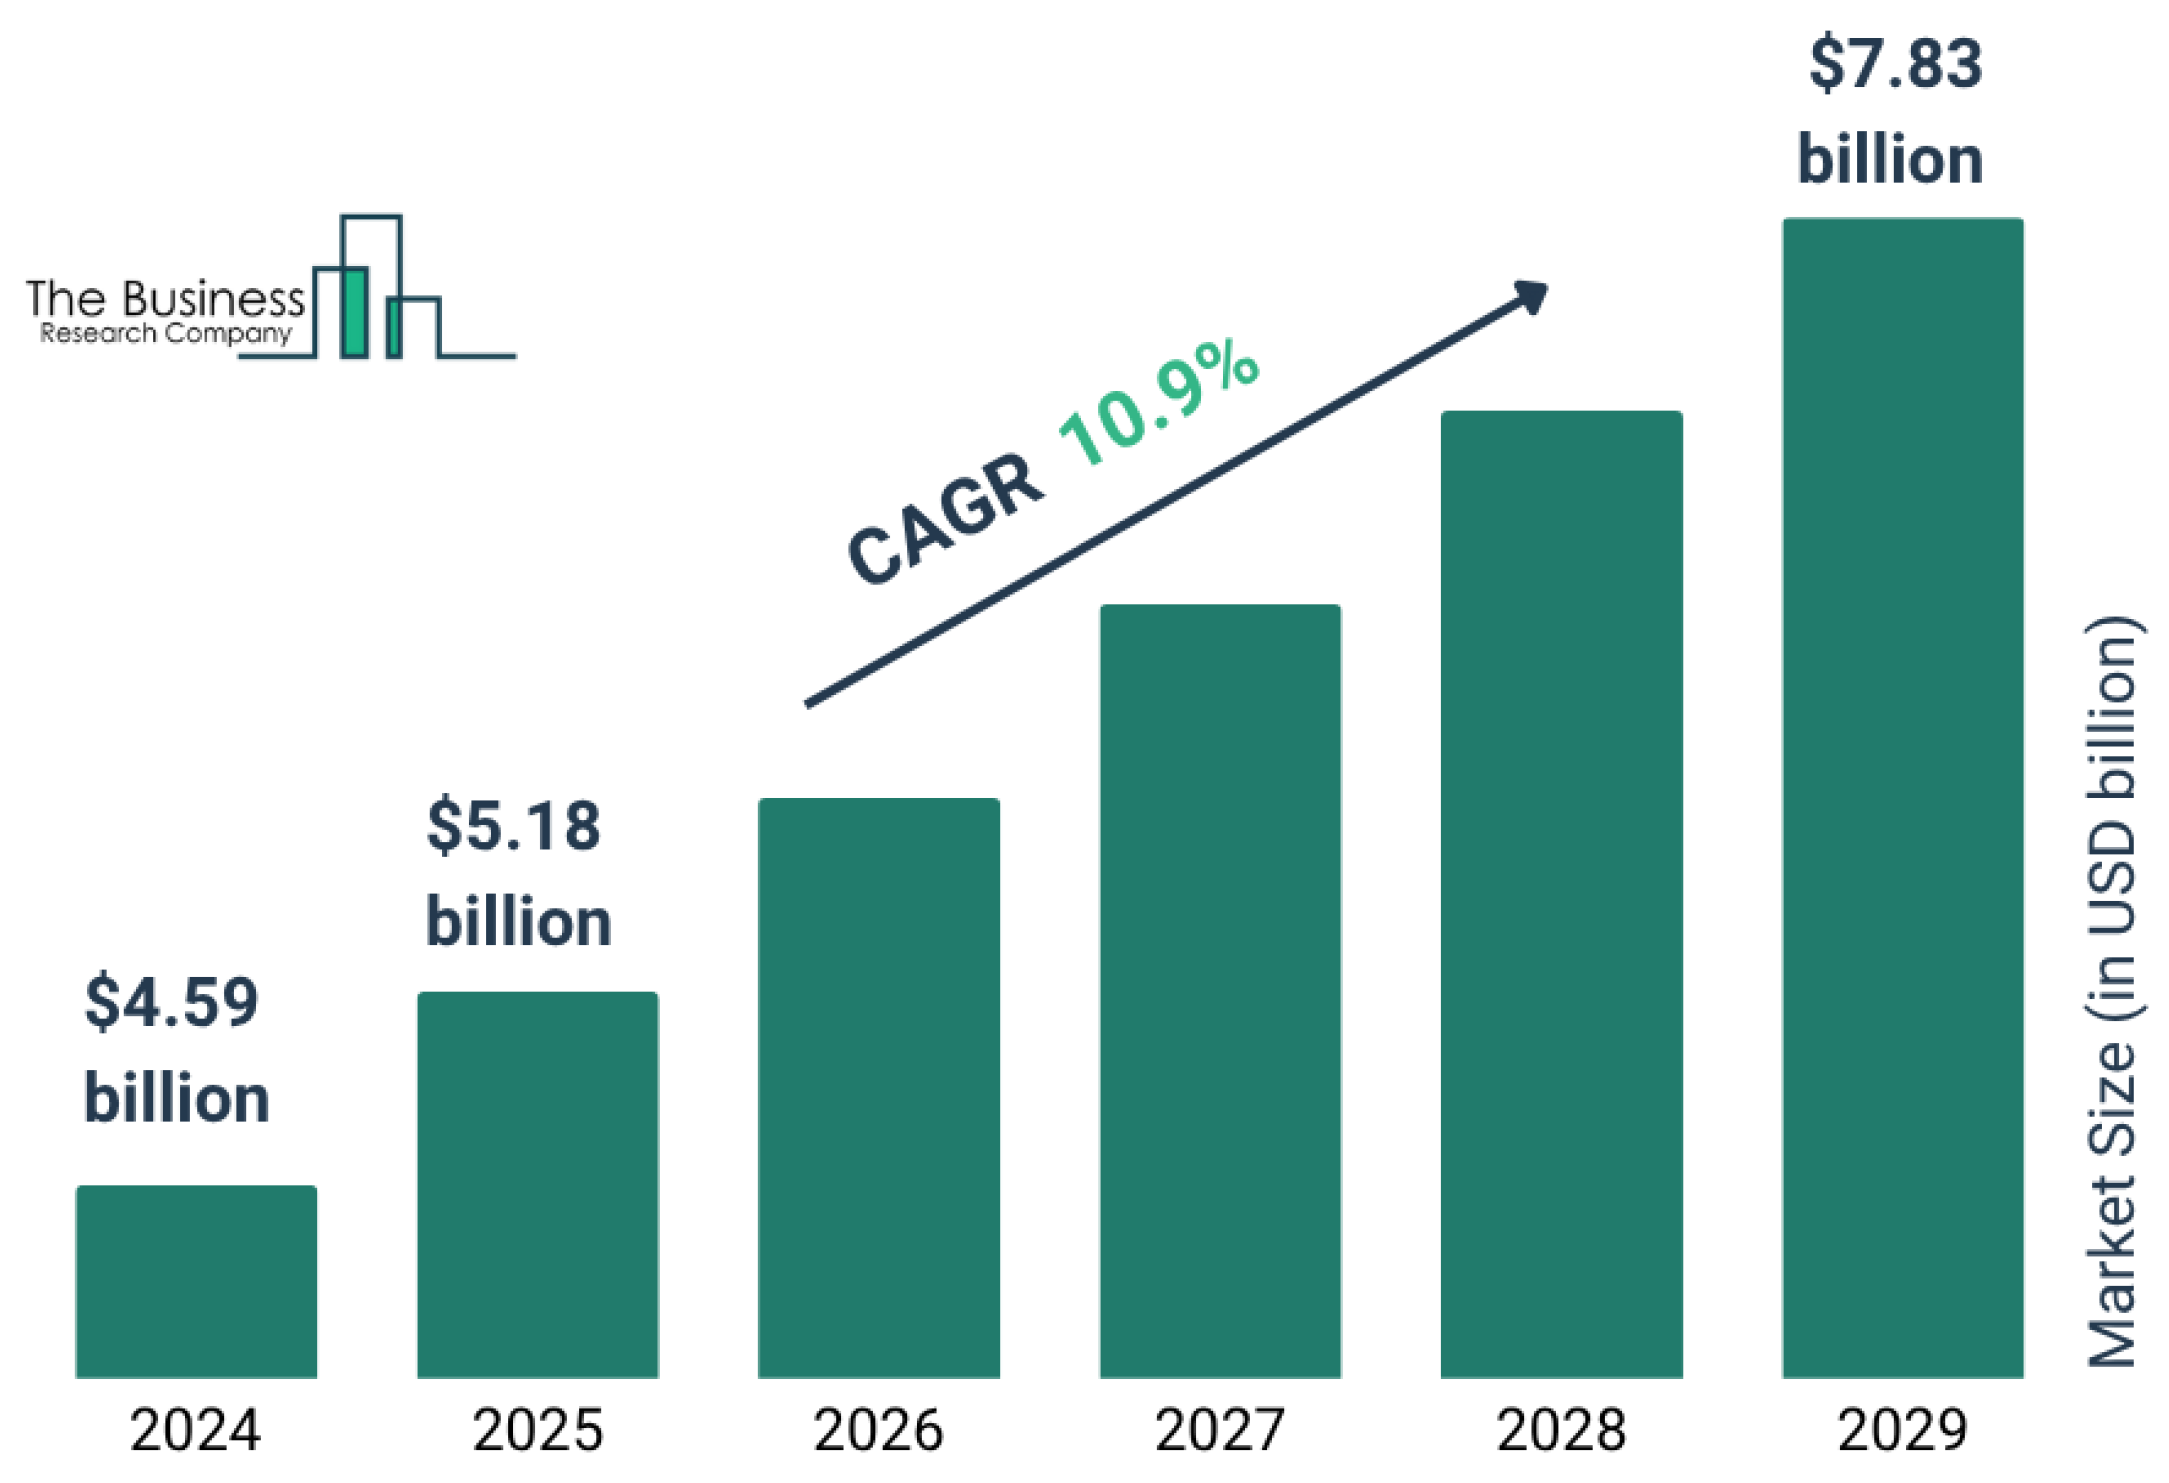
Figure 4.
Fundamental technical parameters of Agro PV system technology [11].
Figure 4.
Fundamental technical parameters of Agro PV system technology [11].
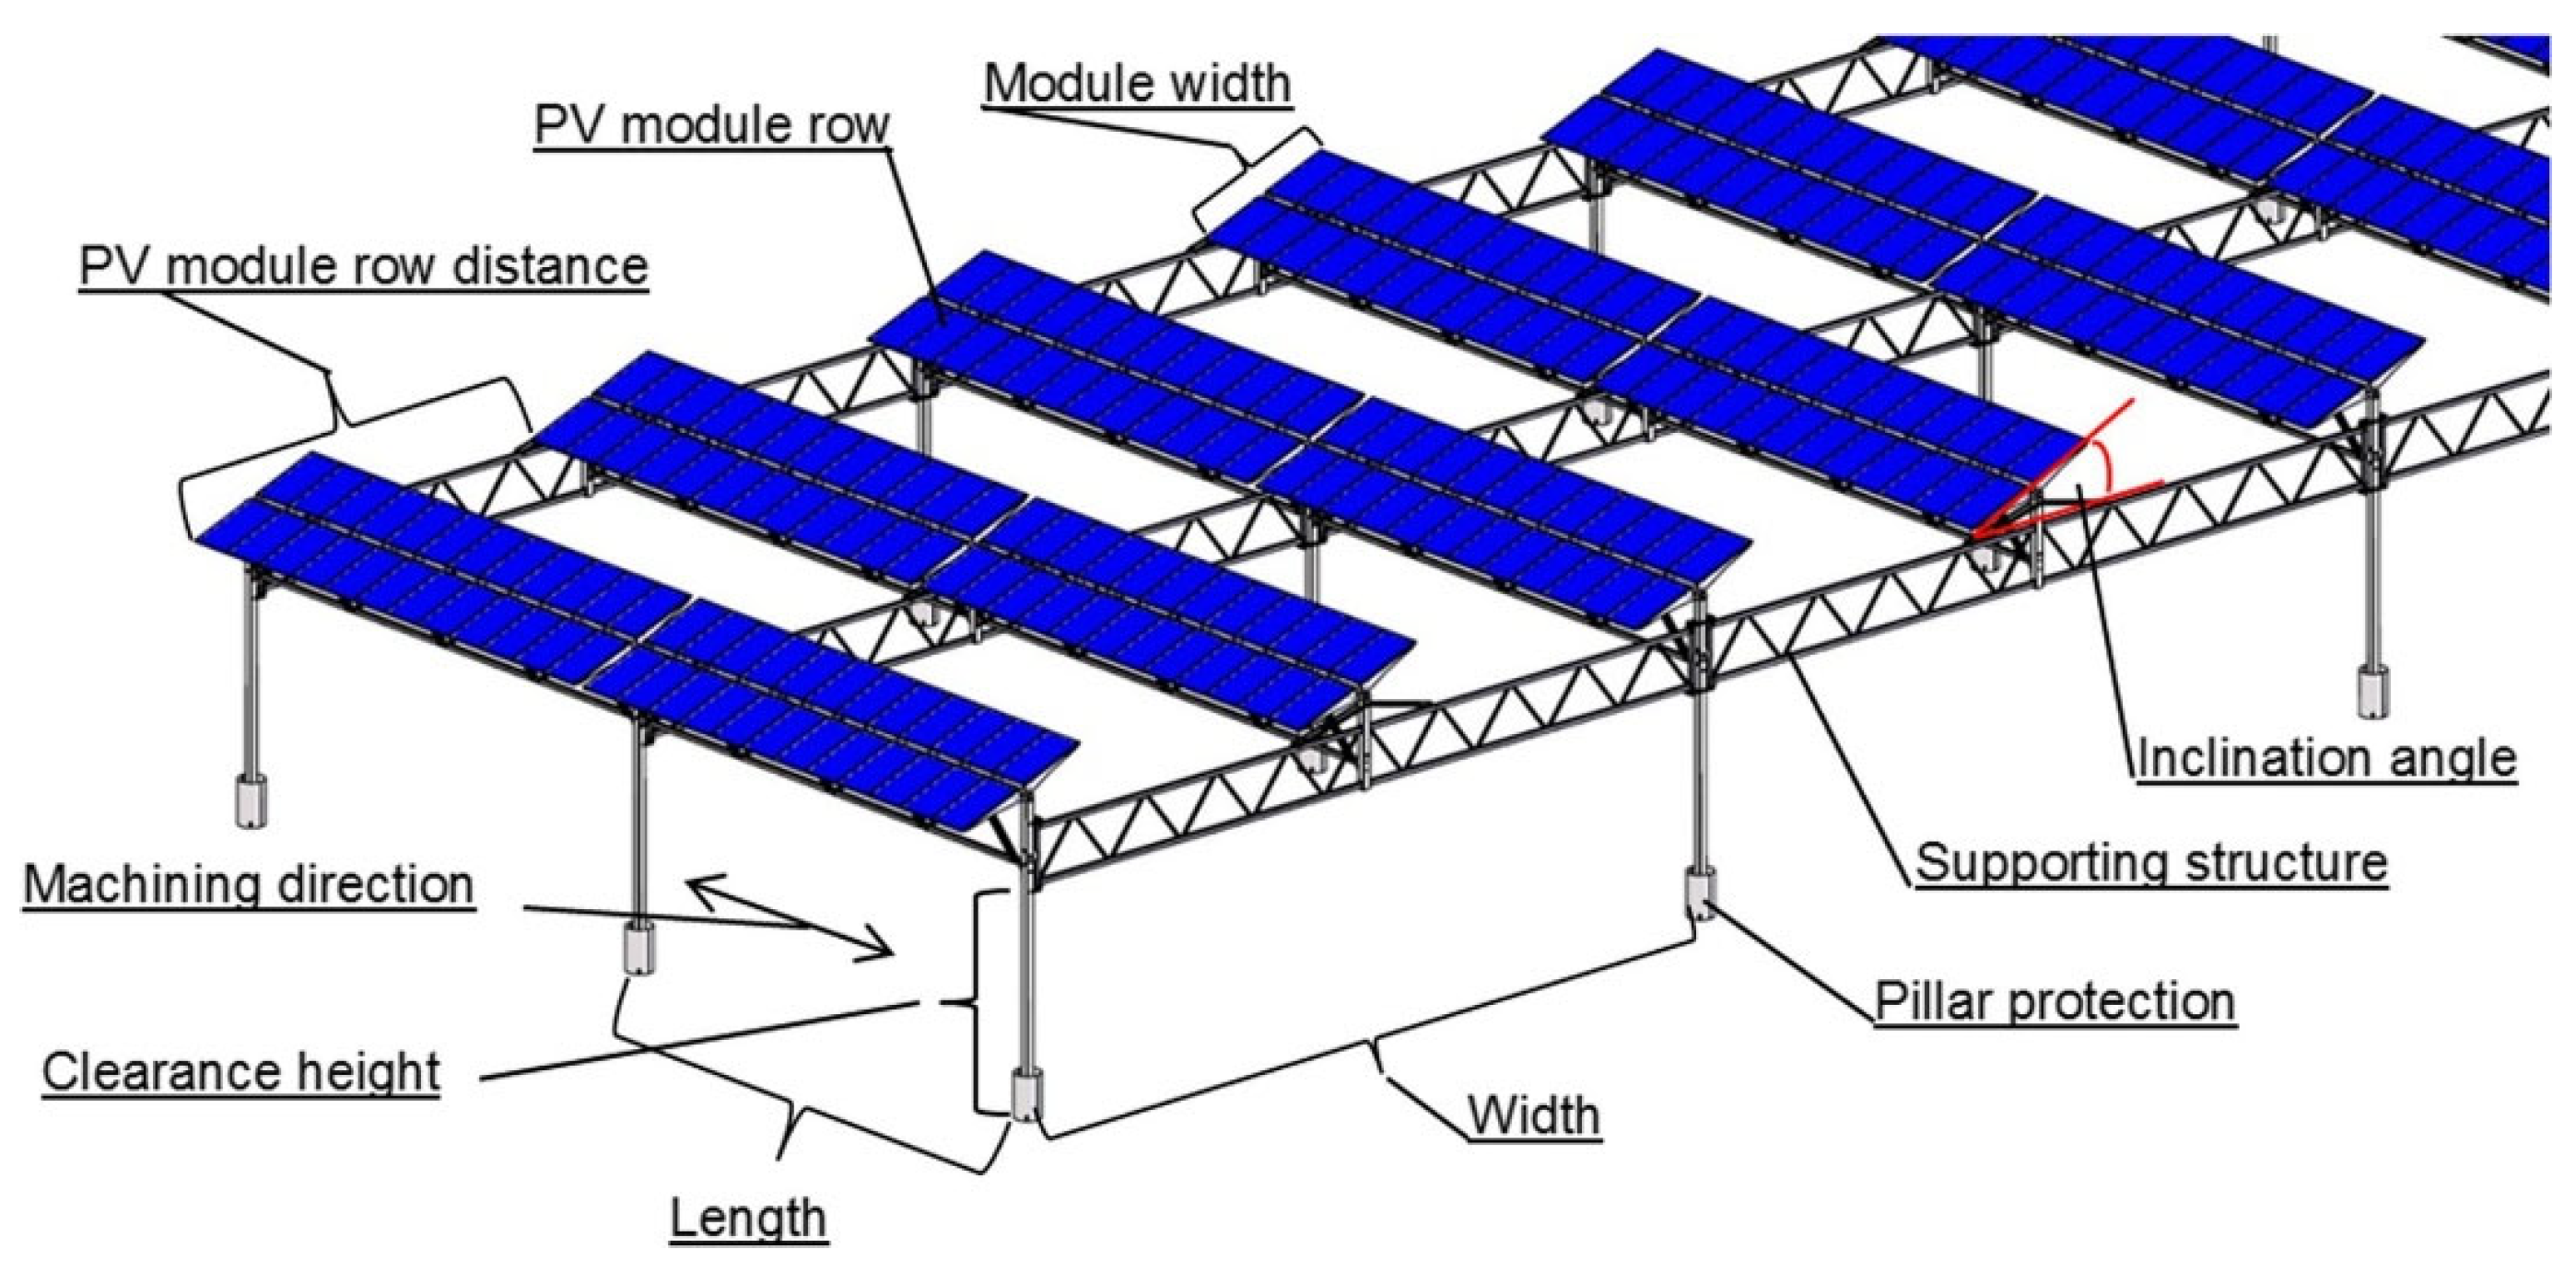
Figure 5.
Structural segment with marked main load-bearing elements and their characteristic dimensions.
Figure 5.
Structural segment with marked main load-bearing elements and their characteristic dimensions.
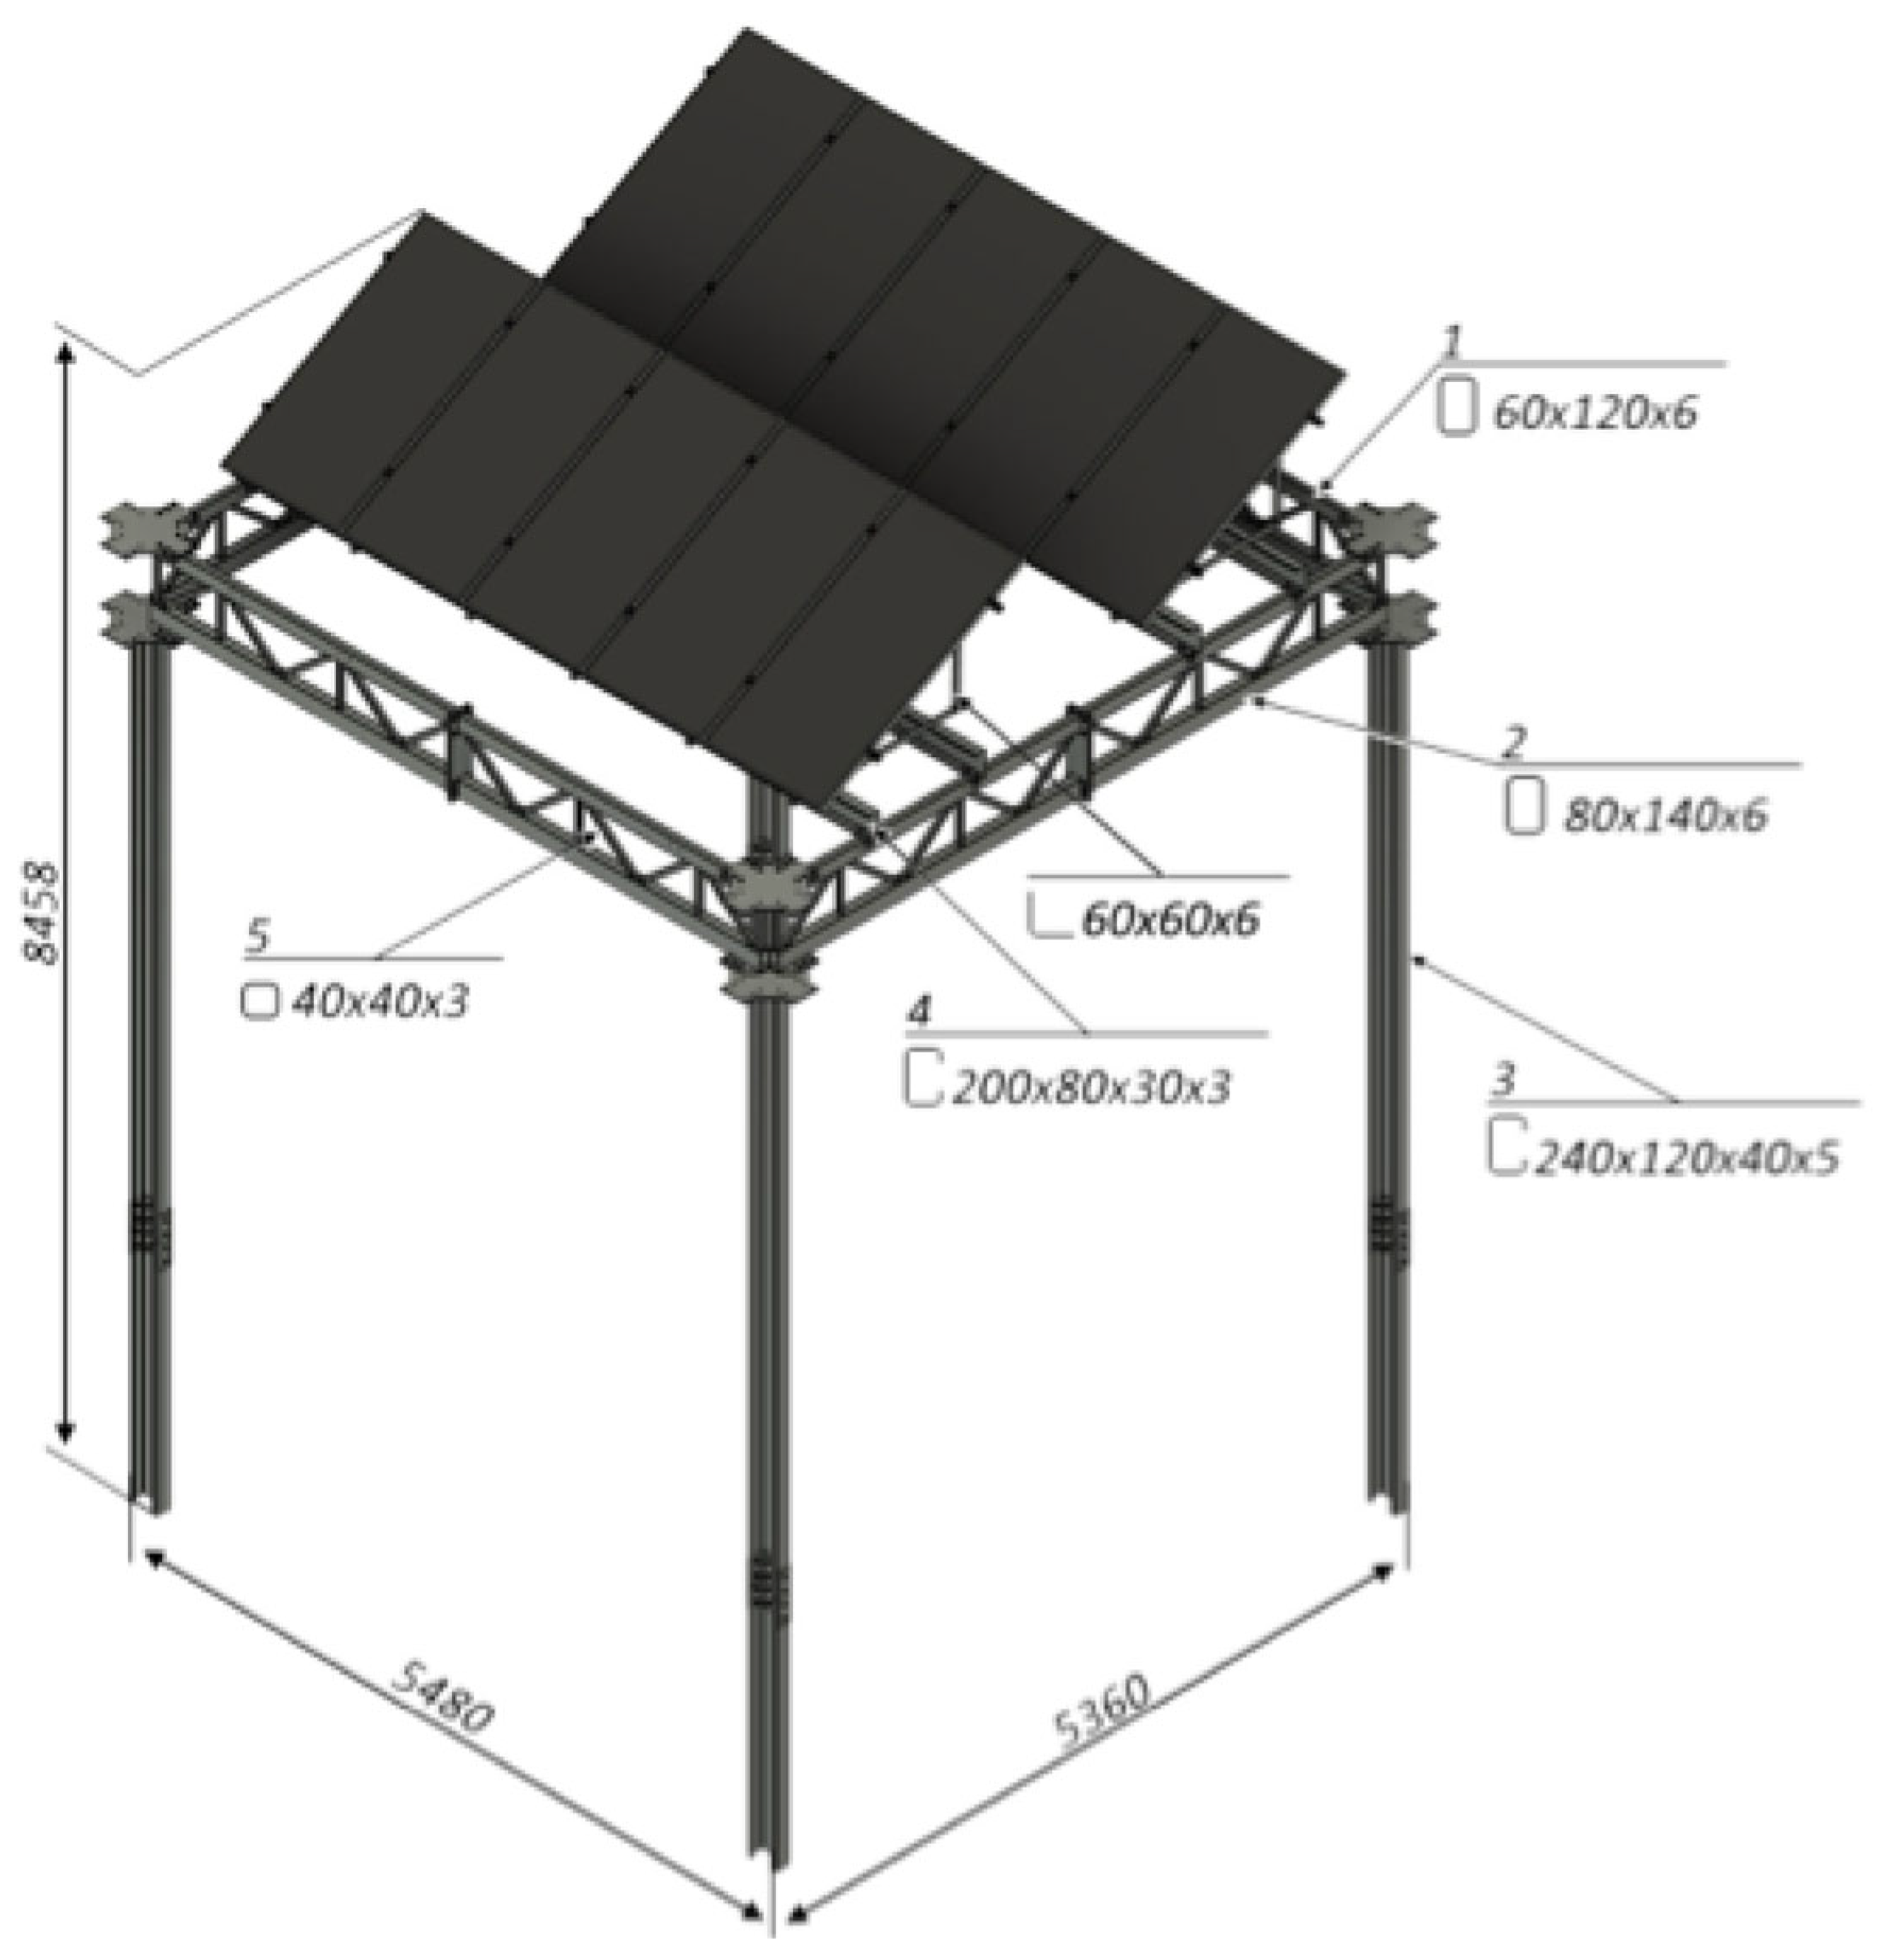
Figure 7.
Application of forces for selected load combinations according to PN-EN 1991-1-4: a) 28th load case, b) 6th load case, c) 23rd load case, d) 23rd load case.
Figure 7.
Application of forces for selected load combinations according to PN-EN 1991-1-4: a) 28th load case, b) 6th load case, c) 23rd load case, d) 23rd load case.
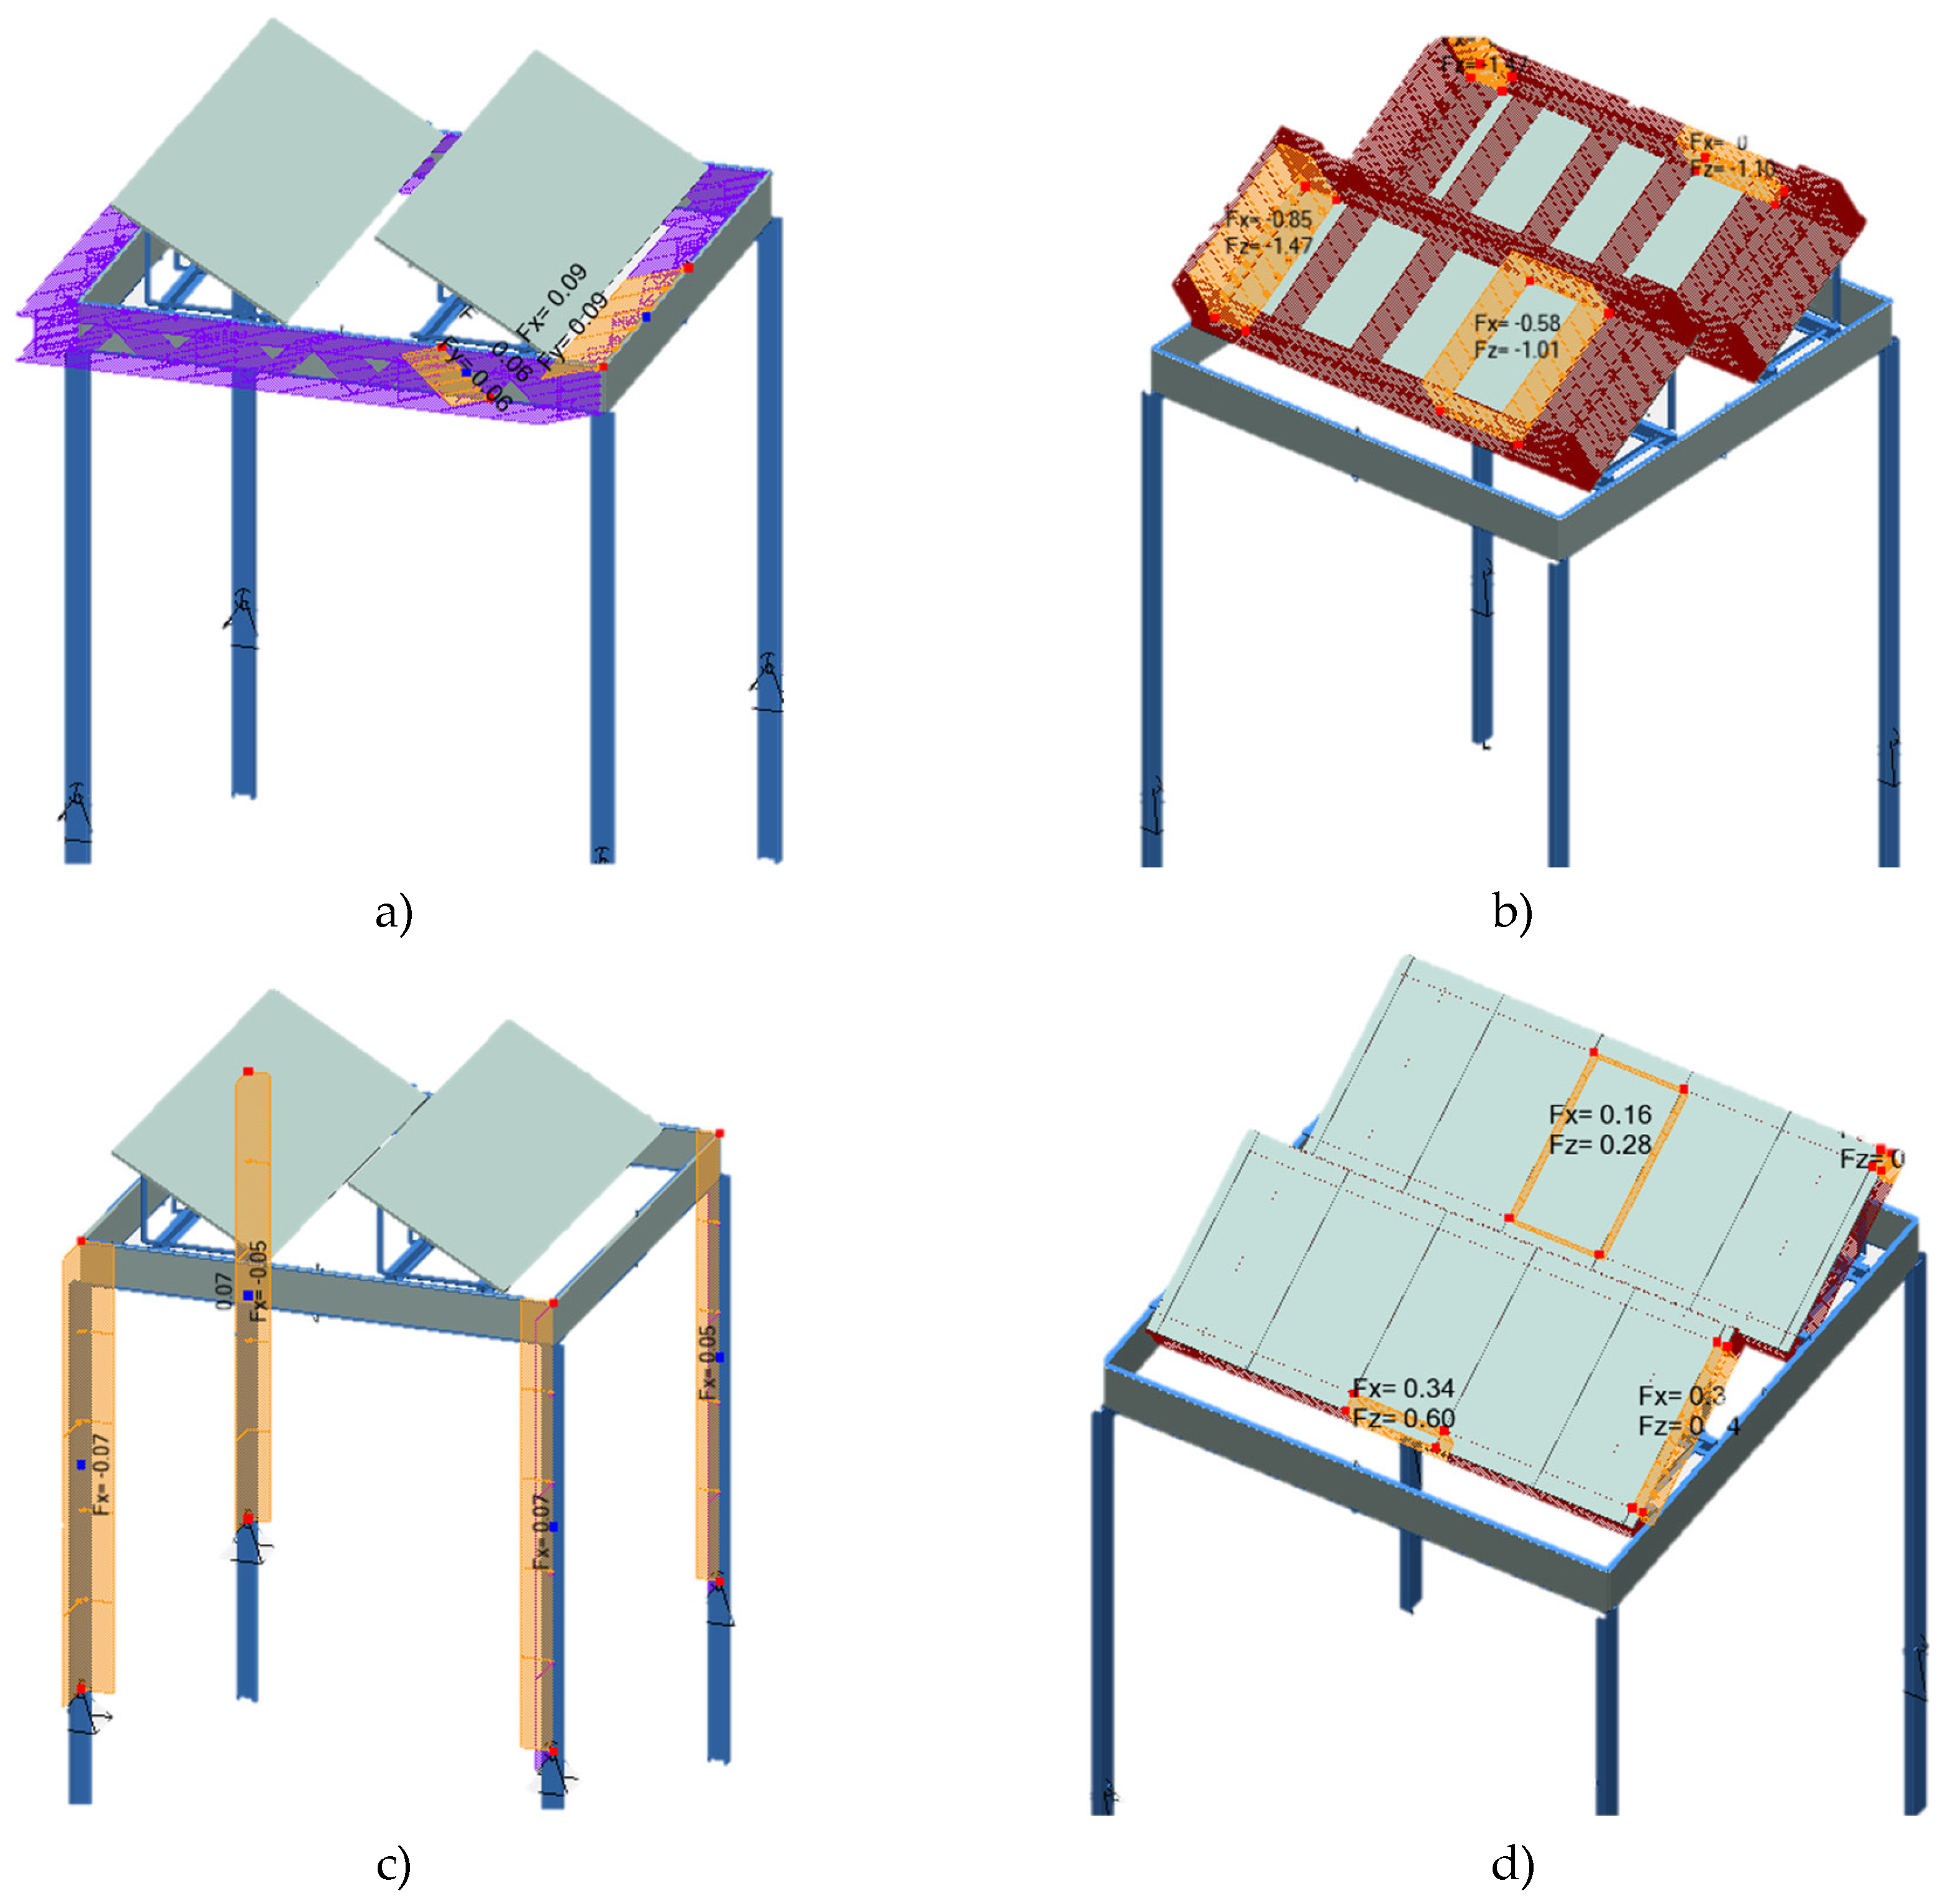
Figure 8.
Boundary conditions adopted for the snow load analysis of the analyzed structure.
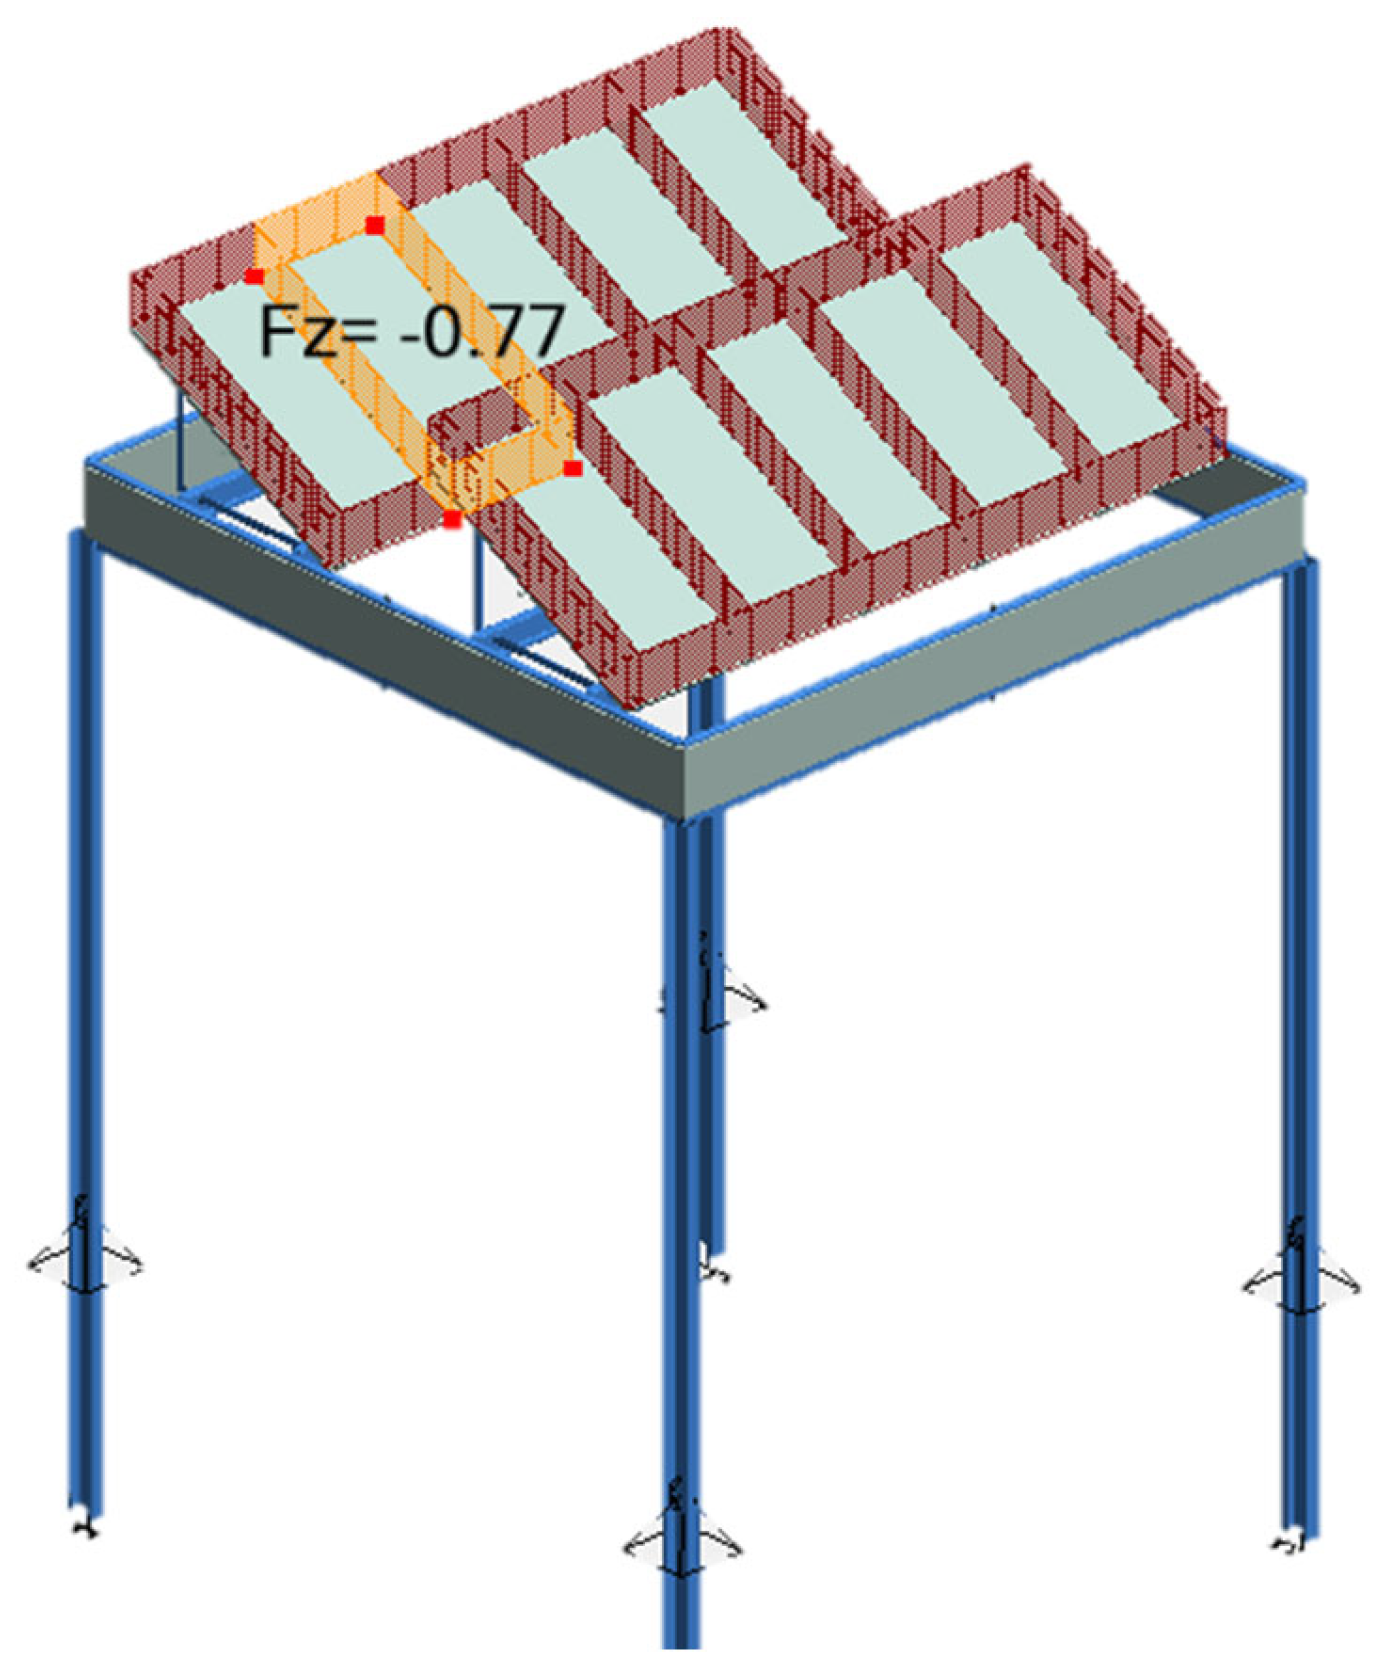
Figure 9.
Stress map for load-bearing columns: a) maximum stress, b) maximum deflection.
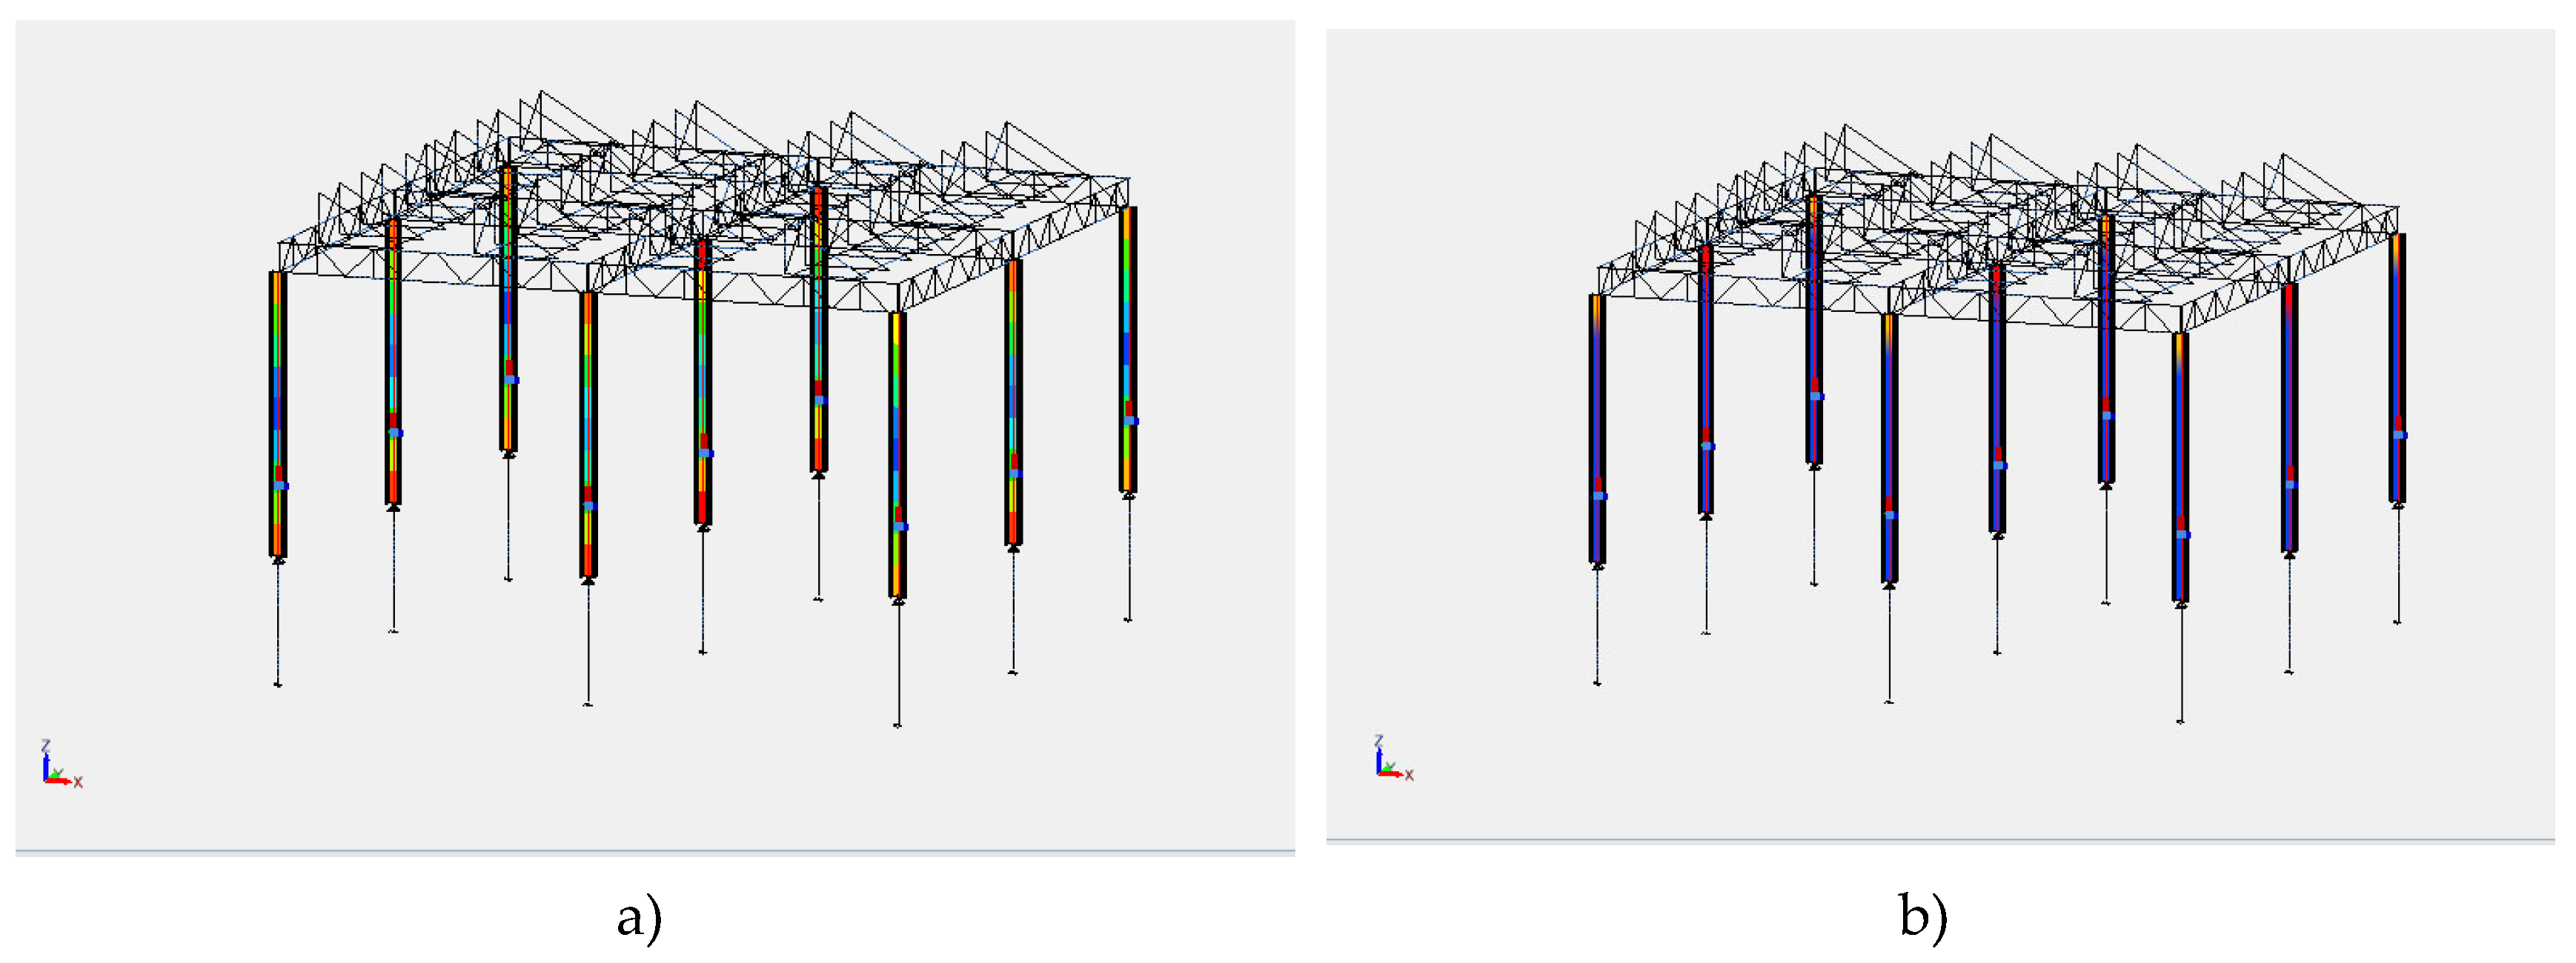
Figure 10.
Stress map for lower chord elements: a) Maximum stress, b) Deflection.
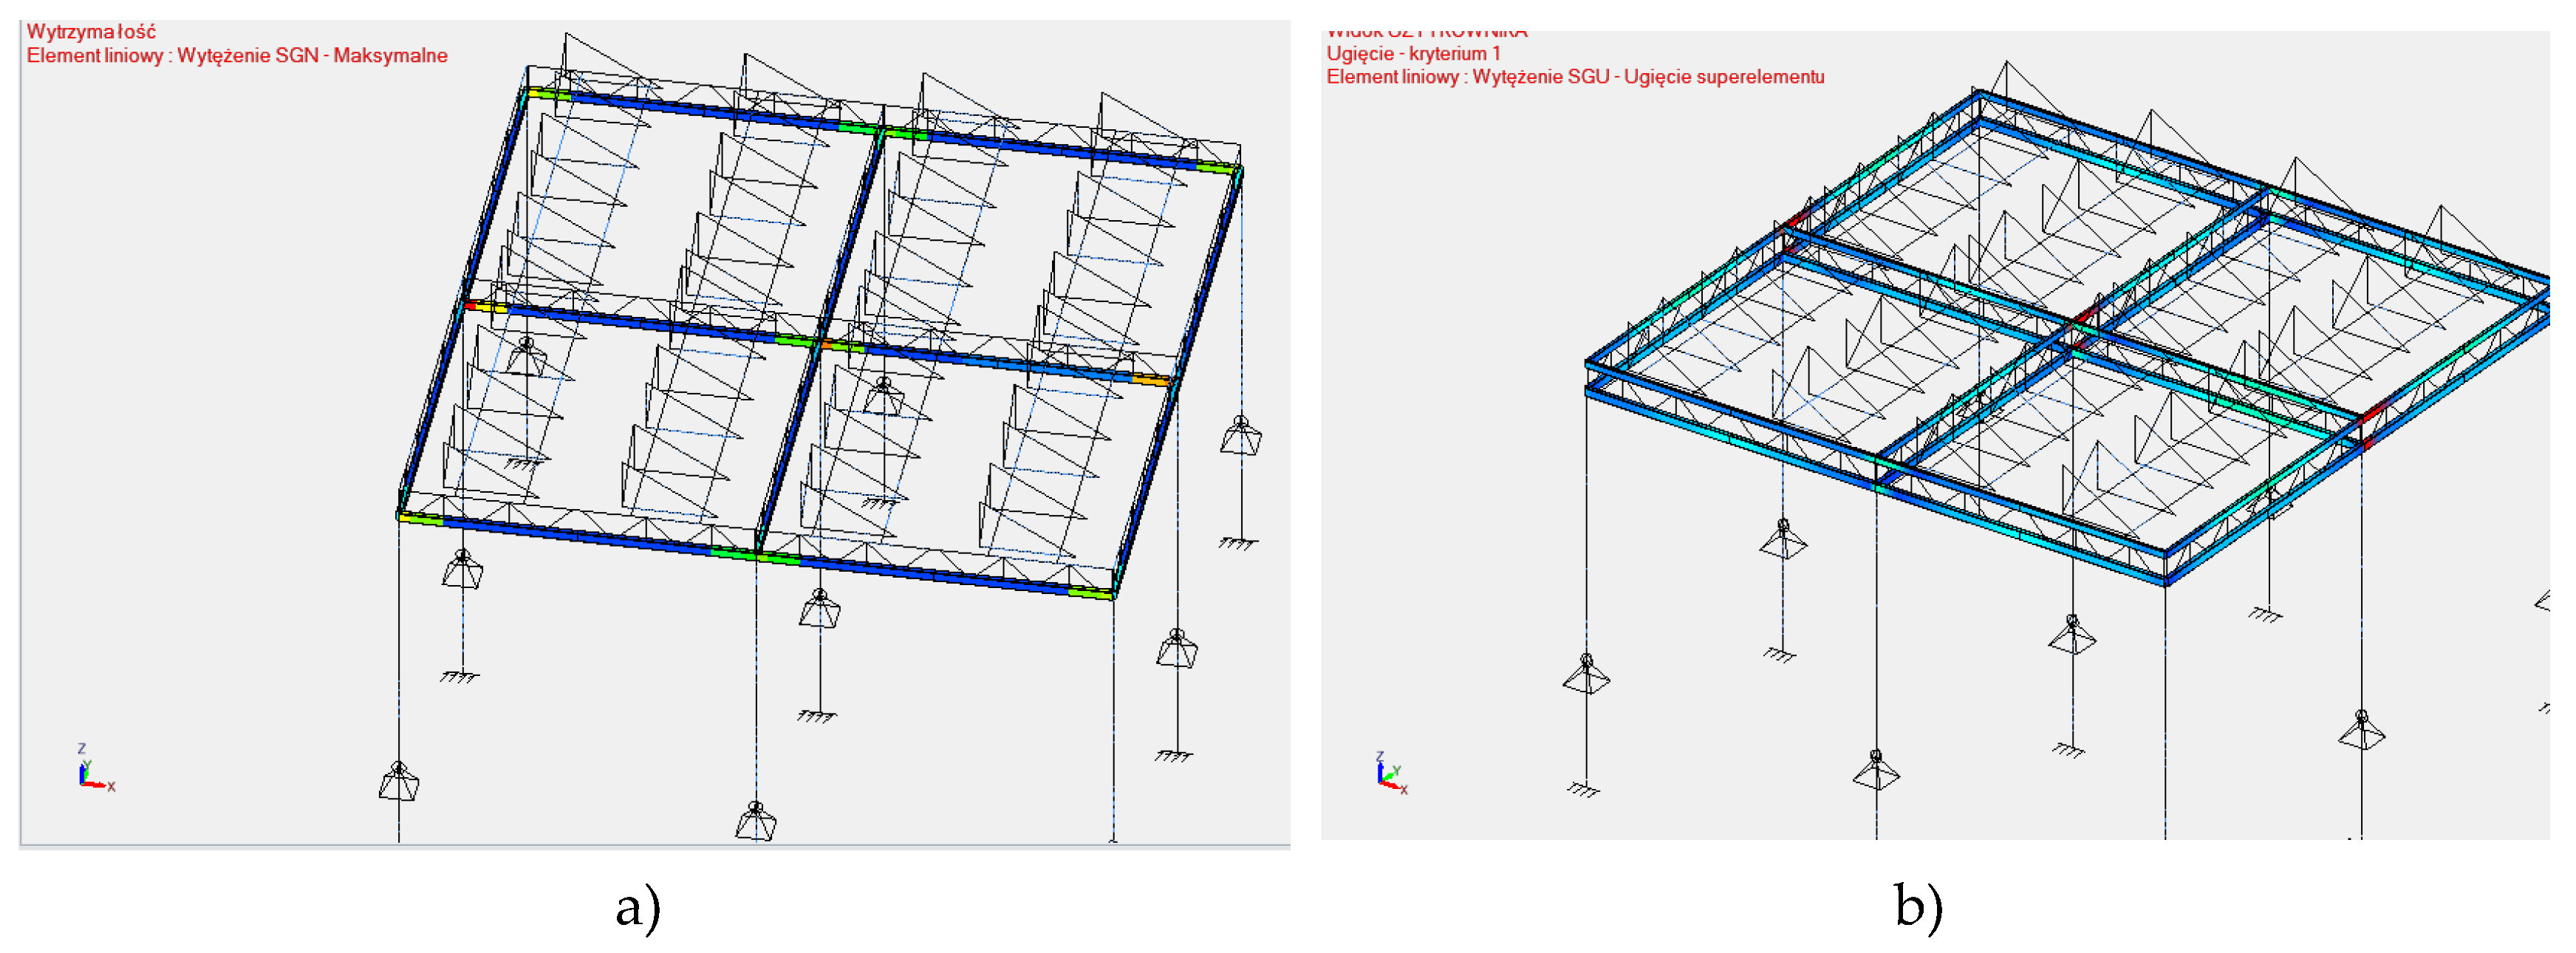
Figure 11.
Stress map for upper chord elements: a) Maximum stress, b) Maximum deflection.
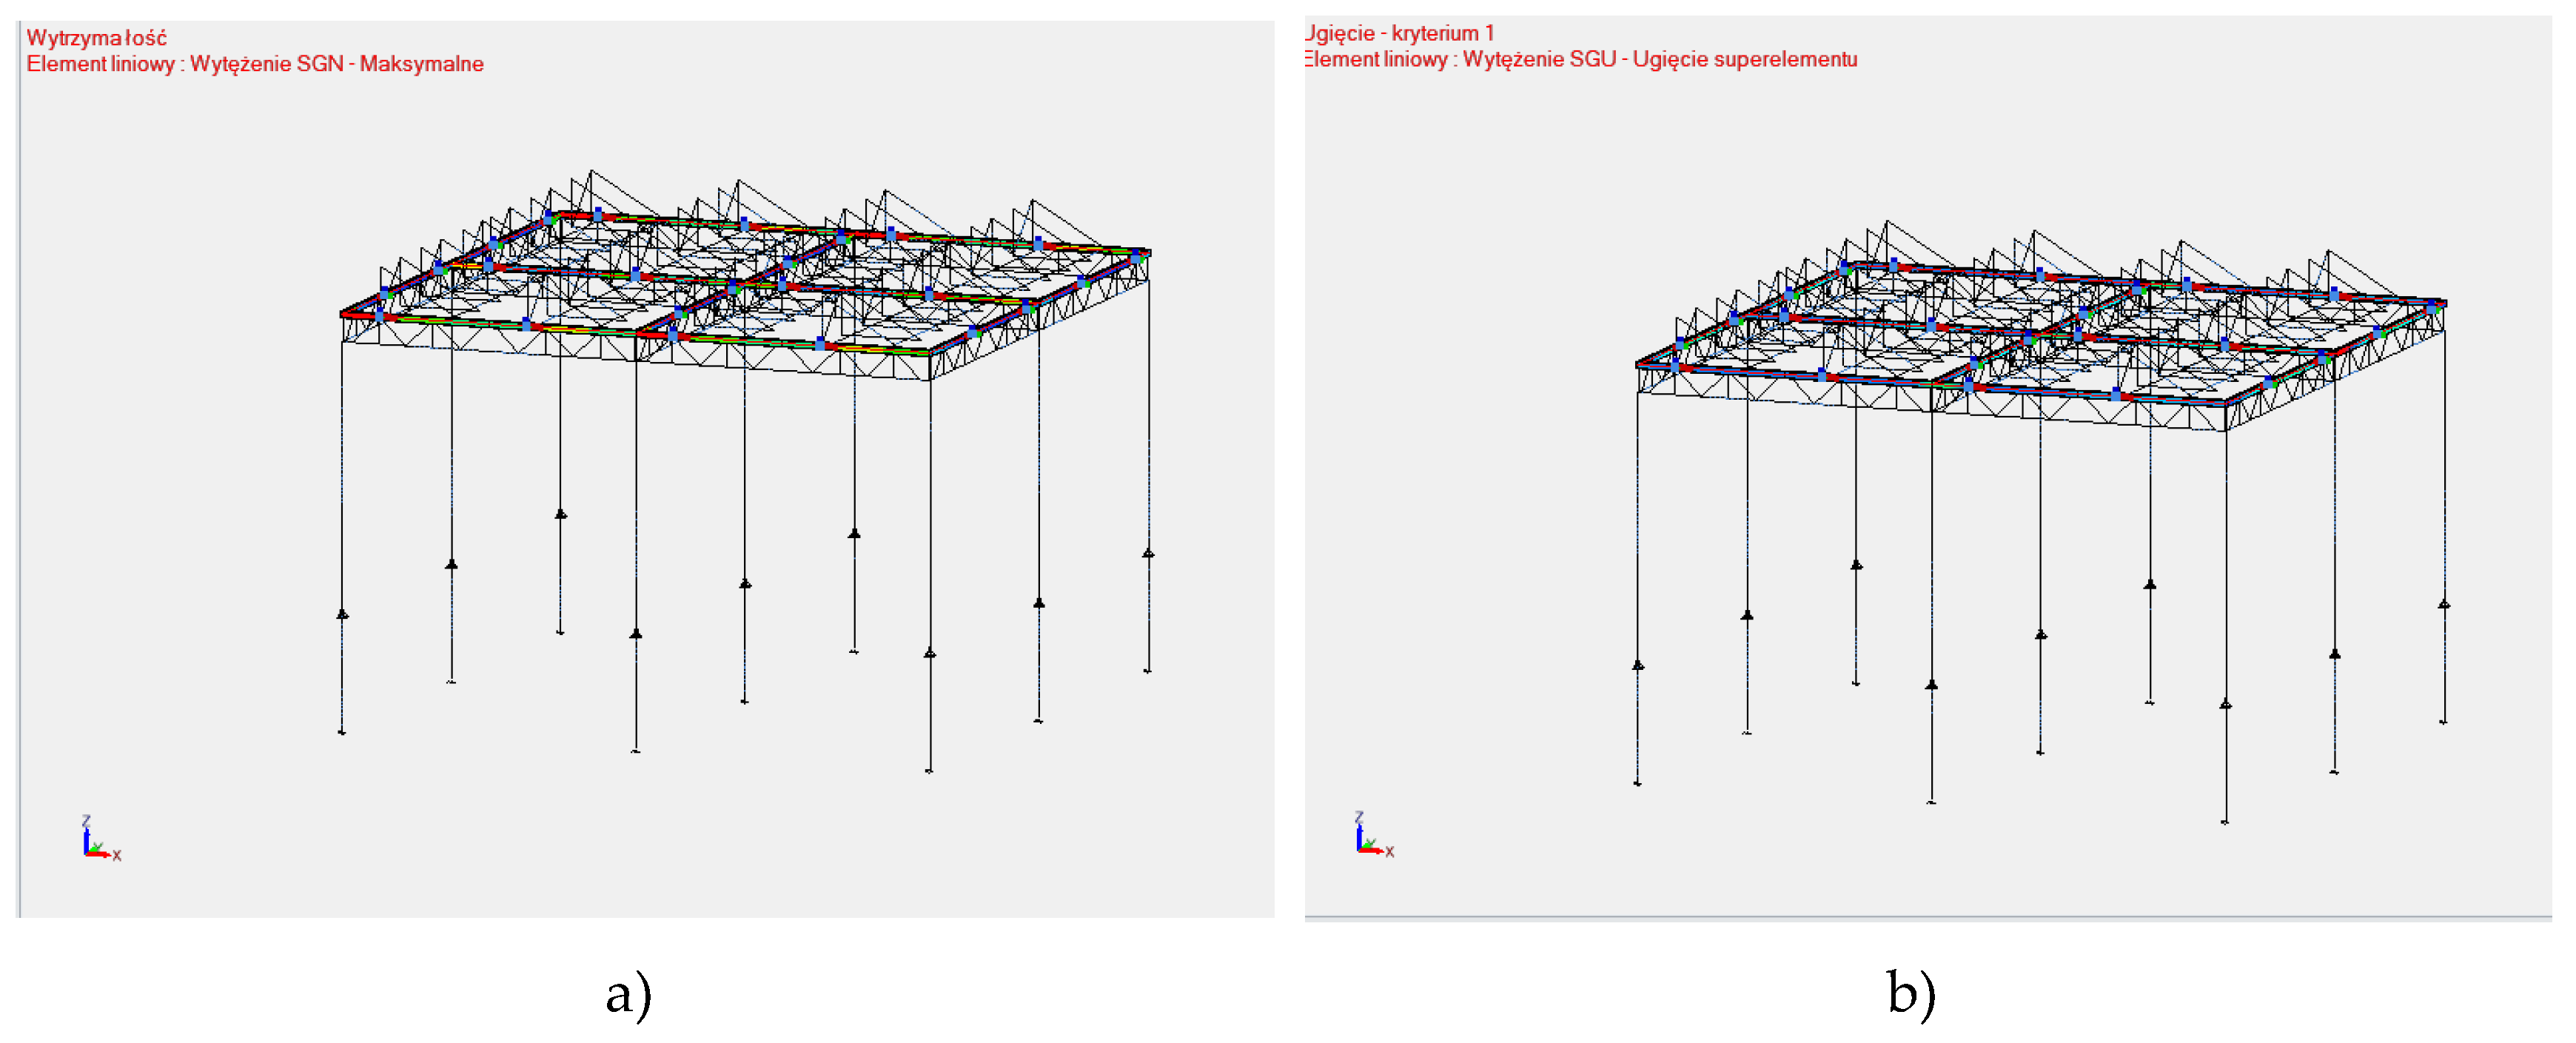
Figure 12.
Stress map for purlin-type elements: a) Maximum stress, b) Maximum deflection.
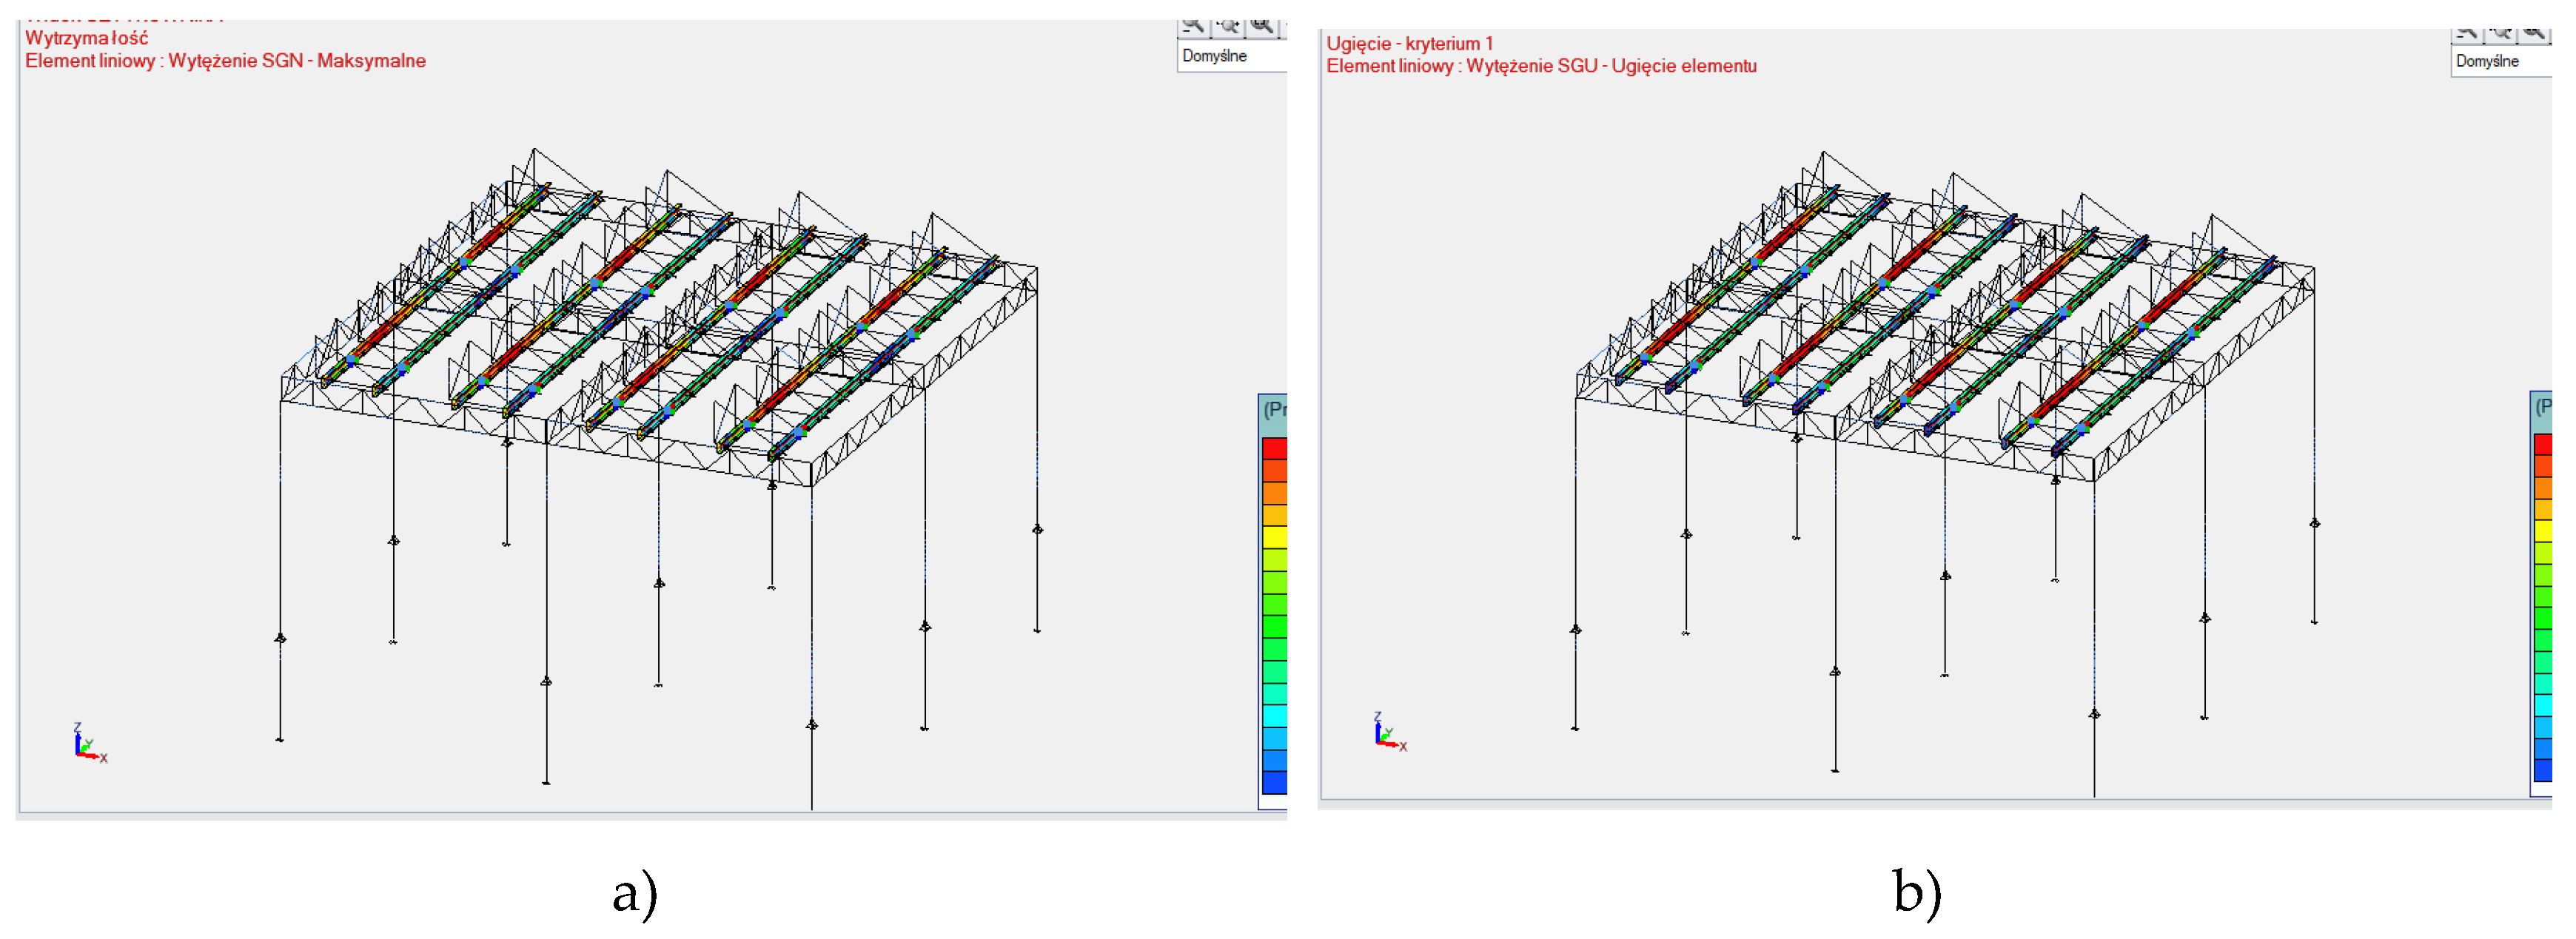
Figure 13.
Stress map for bracket-type elements: a) Maximum stress, b) Maximum deflection.
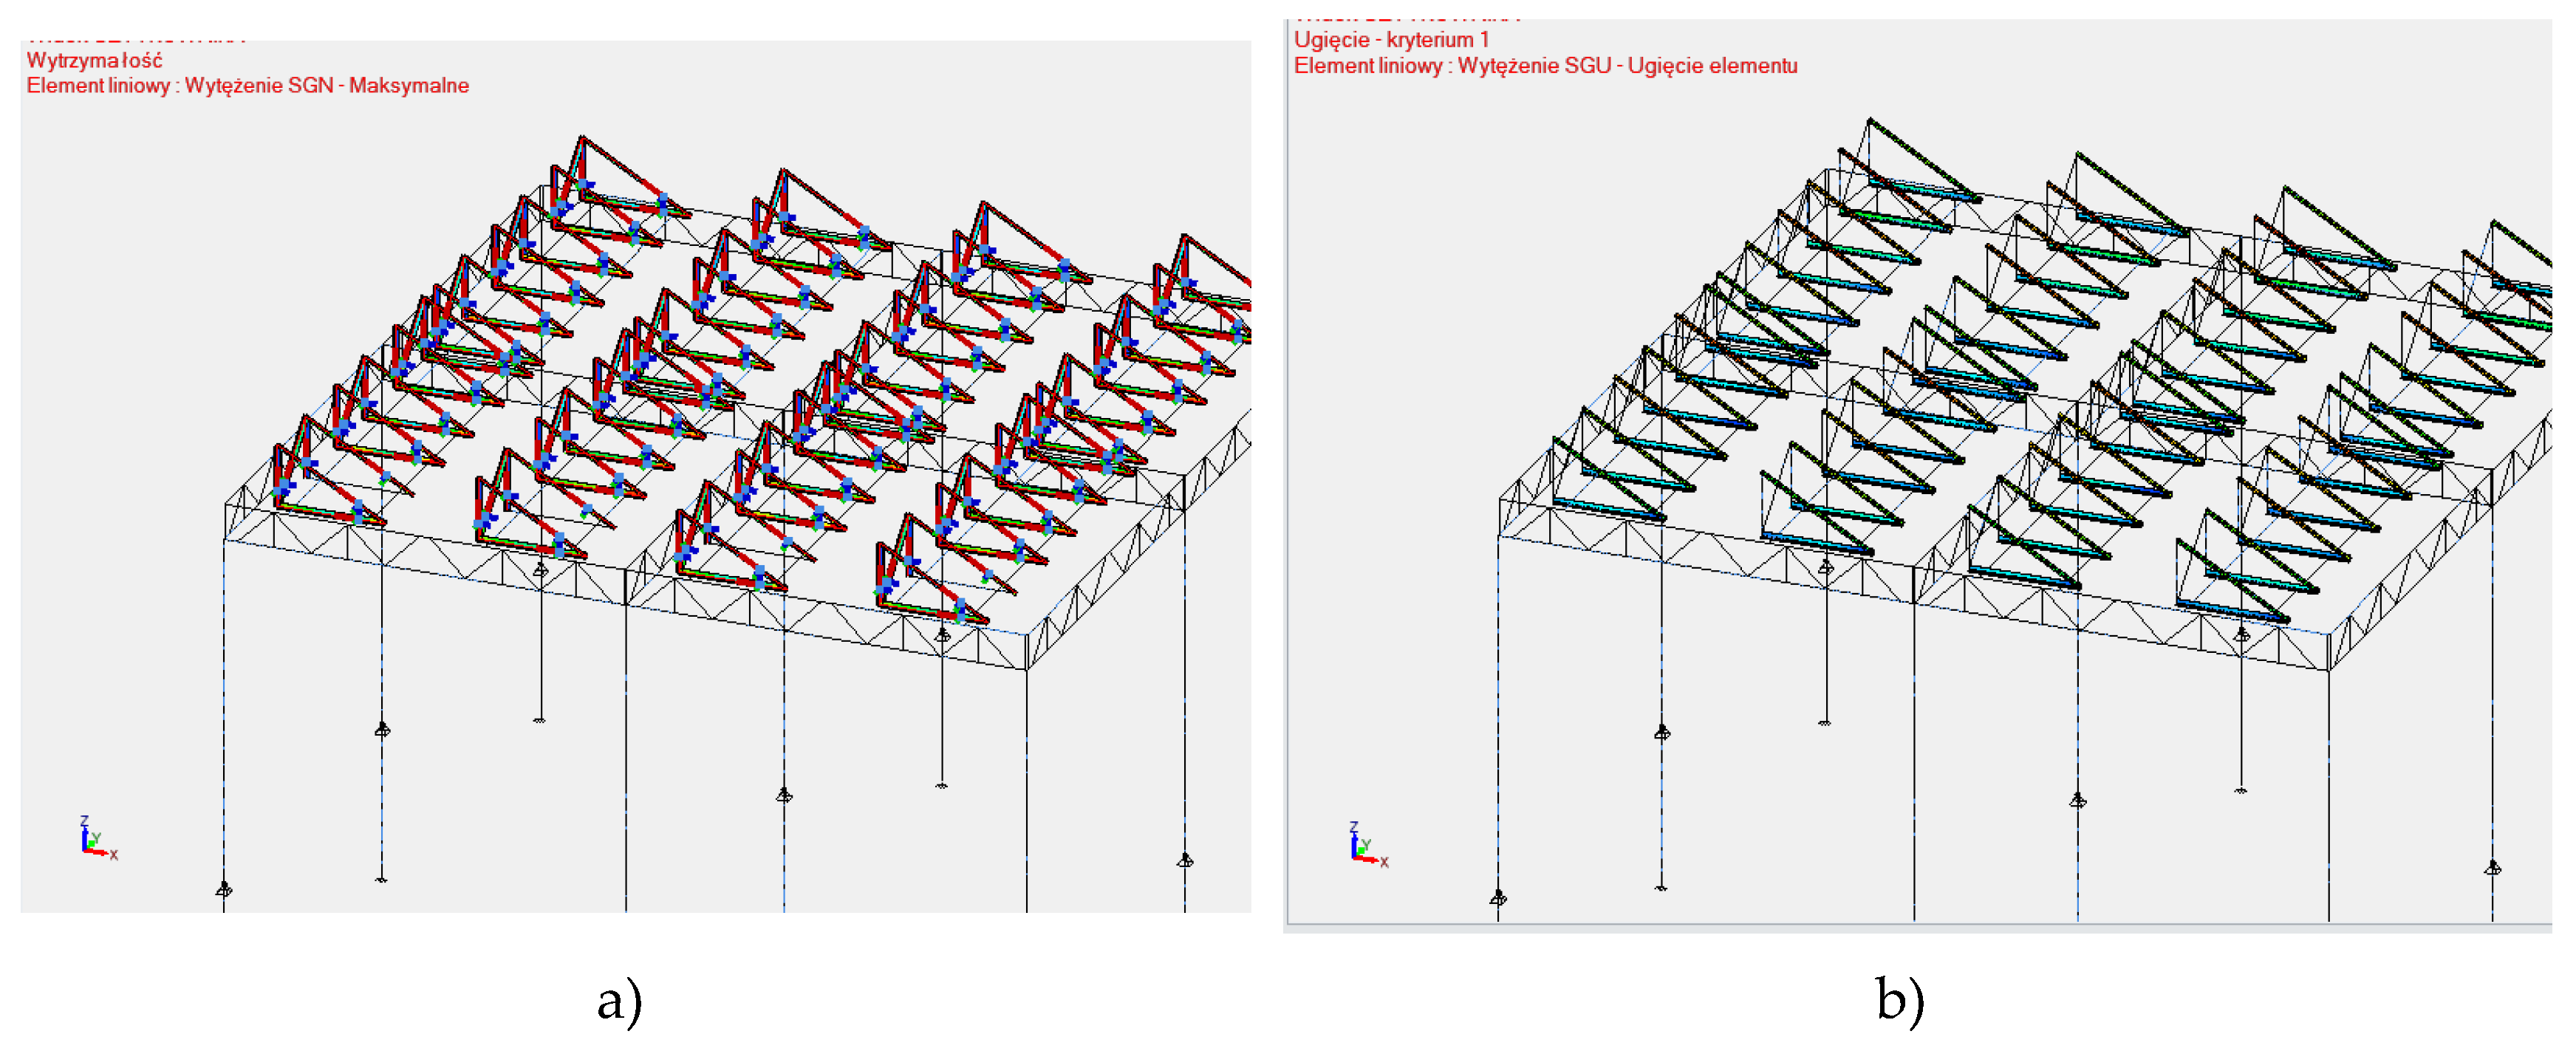
Figure 14.
Normalized Production of the Analyzed Photovoltaic Farm.

| Barrier | Design-Related Solution | Technology-Related Solution |
|---|---|---|
| The need to adapt PV construction to agricultural needs |
Flexible height and spacing: PV module constructions adapted to the requirements of agricultural machinery. Adequate row spacing: Sufficient space between rows of PV modules to allow for mechanized harvesting and free access to crops. |
Semi-transparent modules: The use of PV modules that let some light through allows for photosynthesis and plant growth. |
| Optimization of PV construction for sunlight for crops |
Orientation and tilt angle of PV modules: Adjusting the orientation (e.g., east-west) and tilt angle of the panels to minimize shading - uniform access to light for crops. Shading dynamics: Projects that take into account the plant growth cycles and light requirements. |
Tracking systems: The use of movable structures that follow the sun can optimize both energy production and light access for plants. |
| Financial and profitability issues |
Hybrid systems: Designing Agro PV as an integral part of the agricultural economy, where revenues from crops and energy sales complement each other. Cooperation with local communities: Creating projects that involve the participation of local farmers and investors. |
Efficient modules: The use of panels with higher efficiency, which generate more energy from a smaller area, which increases profitability. High-Efficiency Modules or Technologies (e.g., Bifacial Module - bPV Technology) Energy storage systems: Integration of batteries that allow for storing surplus energy and using it on the farm or selling it during peak hours. |
| Water and microclimate management |
Rainwater harvesting systems: Designing structures in such a way as to collect rainwater flowing from the panels and direct it to irrigate crops. | Intelligent irrigation control: Systems that monitor soil moisture and automatically start irrigation based on the data collected. Integration of Internet of Things (IoT) - enabled sensors and wireless sensor networks to provide real-time data on key parameters such as crop health, soil health (including moisture and nutrient levels), and solar energy production. |
| Impact on soil and the environment |
Minimal invasiveness: The use of structures that require a minimal number of foundations and allow for the protection of soil structure. | Ecological materials: The use of materials that are durable, but at the same time can be easily recycled. |
| Maintenance and servicing | Easy access: Designing structures that facilitate the servicing of PV modules. | The use of automatic cleaning robots that independently remove dirt from PV modules. |
Table 2.
Assumptions regarding electricity production costs in Agro PV systems [21].
Table 2.
Assumptions regarding electricity production costs in Agro PV systems [21].
| Type of PV Installation | Open Space > 20 MWp |
Agro PV > 5 MWp |
Rooftop Installations > 10 kWp |
|||
|---|---|---|---|---|---|---|
| Min. | Max | Min | Max | Min | Max | |
| Investment Costs (EUR/kWp) | 550 | 800 | 700 | 1100 | 750 | 1200 |
| Financing Costs | 5% | 5% | 5% | 5% | 6% | 6% |
| Lifespan (years) | 25 | 25 | 25 | 25 | 25 | 25 |
| Operational Costs (EUR/kWp/year) | 10 | 14 | 9 | 16 | 12 | 18 |
| Revenue (kWh/kWp/year) | 950 | 890 | 920 | 870 | 950 | 860 |
| Capital Costs (EUR/year) | 39 | 57 | 50 | 78 | 59 | 94 |
| Electricity Production Costs (ct/kWh) | 5.16 | 7.95 | 6.38 | 10.81 | 7.44 | 13.01 |
Table 3.
Chemical composition of S235 steel.
| C% | Si% | Mn% | P% | S% | N% | Cu% |
|---|---|---|---|---|---|---|
| 0.170 | - | 1.400 | 0.040 | 0.040 | 0.012 | 0.550 |
Table 4.
Mechanical properties of S235 steel.
| Dimension (mm) |
Nominal Yield Strength | Tensile Strength | Elongation at Break |
|---|---|---|---|
| Rp0.2 N/mm2 | Rm | A% | |
| ≥ 5 ≤ 10 | 355 | 470 ÷ 840 | 8 |
| > 10 ≤ 16 | 300 | 420 ÷ 770 | 9 |
| > 16 ≤ 40 | 260 | 390 ÷ 730 | 10 |
| > 40 ≤ 63 | 235 | 380 ÷ 670 | 11 |
| > 63 ≤ 100 | 215 | 360 ÷ 640 | 11 |
Table 5.
Wind load characteristics adopted for the structural strength analysis.
| Wind load characteristics | |
| Direction | All directions |
| Wind zone | 1 |
| Fundamental value of basic wind speed | 22.00 m/s |
| Directional factor | X+:1.00 X-:1.00 ; Y+:1.00 Y-:1.00 |
| Seasonal factor | 1.00 |
| Terrain category | III |
| Orographic factor | 1.00 |
| Turbulence coefficient | 1.00 |
| Basic wind pressure | 0.30 kN/m2 |
| Exposure coefficient | 1.75 |
Table 6.
Snow load characteristics adopted for the structural strength analysis.
| Snow Load Characteristics | |
| Snow Zone | 3 |
| Snow Pressure | 1.20 kN/m2 |
| Exceptional Snow Load Coefficient | 1.20 kN/m2 |
| Exposure Coefficient | 0.80 |
| Thermal Coefficient | 1.00 |
| Height | 80.00 m |
Table 7.
Presentation of various load cases in accordance with PN-EN 1991-1-4 and PN-EN 1991-1-3 standards.
Table 7.
Presentation of various load cases in accordance with PN-EN 1991-1-4 and PN-EN 1991-1-3 standards.
| List of Load Cases | |
| Designation | List of Load Cases |
| Permanent Load | 1 |
| Wind (PN-EN 1991-1-4) | 23; 24; 25; 26; 2; 3; 4; 5; 6; 7; 8; 9; 10; 11; 12; 13; 14; 15; 16; 17; 18; 19; 20; 21; 22; 27; 28; 29; 30; 31 |
| Snow (PN-EN 1991-1-3) | 32; 33; 34 |
Table 8.
Simulation results for the analyzed installation.
| Month | GlobHor (kWh/m²) | DiffHor (kWh/m²) | T_Amb (°C) | GlobInc (kWh/m²) | GlobEff (kWh/m²) | EArray (MWh) | E_Grid (MWh) | PR ratio |
|---|---|---|---|---|---|---|---|---|
| January | 18.6 | 13.74 | -1.42 | 30.3 | 19.7 | 1.98 | 1.90 | 0.628 |
| February | 35.5 | 21.44 | -0.34 | 55.4 | 40.3 | 4.07 | 3.94 | 0.712 |
| March | 78.8 | 41.53 | 3.24 | 105.8 | 89.8 | 8.80 | 8.53 | 0.806 |
| April | 122.4 | 59.18 | 8.95 | 145.6 | 134.5 | 12.72 | 12.31 | 0.846 |
| May | 158.2 | 73.17 | 14.22 | 165.5 | 155.9 | 14.41 | 13.93 | 0.837 |
| June | 161.1 | 80.76 | 17.05 | 161.3 | 150.2 | 13.78 | 13.33 | 0.829 |
| July | 159.2 | 79.51 | 19.42 | 161.4 | 153.1 | 13.81 | 13.47 | 0.817 |
| August | 132.8 | 68.48 | 18.82 | 155.6 | 143.0 | 13.31 | 12.95 | 0.828 |
| September | 94.2 | 54.70 | 13.69 | 122.8 | 108.1 | 10.16 | 9.84 | 0.801 |
| October | 54.3 | 26.98 | 8.92 | 81.6 | 63.4 | 6.10 | 5.91 | 0.725 |
| November | 21.5 | 13.77 | 4.55 | 36.0 | 23.9 | 2.35 | 2.26 | 0.627 |
| December | 13.3 | 9.40 | 0.79 | 24.1 | 14.2 | 1.41 | 1.34 | 0.558 |
| Year | 1056.8 | 542.57 | 9.05 | 1248.8 | 1096.0 | 102.95 | 99.57 | 0.797 |
|
Legends: GlobHor: Global horizontal irradiation DiffHor: Horizontal diffuse irradiation T_Amb: Ambient Temperature GlobInc: Global incident in coll. plane |
GlobEff: Effective Global, corr. for IAM and shadings EArray: Effective energy at the output of the array E_Grid: Energy injected into grid PR: Performance Ratio |
|||||||
Table 9.
Overview of recommended modeling and simulation tools for Agro PV research [7,8,9,10,13,15,18].
| Tool - Modeling Methodology / Category of actions |
Application in Agro PV | Key benefits |
|---|---|---|
| Computational Fluid Dynamics (CFD) / Structural - Microclimate |
Analysis of wind loads on tall PV structures; Simulation of air flow, temperature, and humidity distribution under panels [40]; Informs structural design and microclimate management [9]. |
Quantifies complex aerodynamic forces on the Agro PV mounting structure; Predicts microclimate changes (soil/air temperature, wind speed) [10]; Provides information on construction design and microclimate management |
| Finite Element Method (FEM) / Structural - Geotechnical |
Structural analysis of support frames under various loads (wind, snow); Modeling the behavior of screw piles and other foundations under axial and lateral loads [17]. |
Assesses structural integrity and deformations; Optimizes material use and foundation design; Predicts mounting stability in different soil conditions. |
| Ray Tracing - Radiation Models (e.g., APyV) / Agricultural - Energy |
Quantifying the distribution of photosynthetically active radiation (PAR) on crops [7]; Simulating shading patterns [13]; Optimizing light management for crops and PV panels [15]. |
Provides highly accurate data on light distribution; Key for understanding the impact on yields; Informs dynamic tracking strategies for light sharing. |
| Crop Growth Models / Agricultural |
Predicting crop yields under Agro PV shading and microclimate conditions [13]; Assessing the impact of light limitations on crop growth [13]. |
Quantifies agricultural productivity; Enables yield prediction before Agro PV installation; Helps identify suitable crop types for specific Agro PV projects. |
| Techno-Economic Models (e.g., SAM, MINLP, FP) / Economic |
Cost-benefit analysis, ROI, NPV, LCOE for Agro PV projects [7,8]; Optimizing economic profits and operational costs [18]. |
Assesses financial viability and profitability; Compares different design scenarios; Supports investment decisions by quantifying revenue streams and costs. |
| Artificial Intelligence (AI) - Big Data / Integrated |
Predictive analytics for energy and crop yields [7,8]; Smart control systems for dynamic PV module tracking [15]; Monitoring and optimizing system performance. |
Increases prediction accuracy; Enables real-time optimization and adaptive control; Supports data-driven decision-making in complex systems. |
Disclaimer/Publisher’s Note: The statements, opinions and data contained in all publications are solely those of the individual author(s) and contributor(s) and not of MDPI and/or the editor(s). MDPI and/or the editor(s) disclaim responsibility for any injury to people or property resulting from any ideas, methods, instructions or products referred to in the content. |
© 2025 by the authors. Licensee MDPI, Basel, Switzerland. This article is an open access article distributed under the terms and conditions of the Creative Commons Attribution (CC BY) license (http://creativecommons.org/licenses/by/4.0/).
Copyright: This open access article is published under a Creative Commons CC BY 4.0 license, which permit the free download, distribution, and reuse, provided that the author and preprint are cited in any reuse.


