
Submitted:
26 August 2025
Posted:
27 August 2025
You are already at the latest version
Abstract
Background: The bone mineral density is closely related to the risk of fracture, and maintaining the bone mineral density is important for maintaining health in older adults. Metabolic syndrome has been shown to be related to fracture, and the associations between metabolic indicators and reduced bone mineral density have been established. However, few studies have investigated bone mineral density or osteoporosis in men. Aim: In this study, we examined whether metabolic indicators and their changes over four years are associated with a decline in bone mineral density in men aged 65 and older. Methods: A total of 86 community-dwelling men aged ≥65 years from M City and O Town who participated in health check-ups were included. all subjects were examined twice (first and 4 years later) for or physical characteristics (height, body weight, BMI) and blood markers of metabolic syndrome. Statistical analysis: The multiple regression analysis was conducted by considering the baseline indicators of metabolic syndrome. BMD (g/cm²) was set as the objective variable. Additionally, another multiple regression analysis was performed by considering changes in the indicators of metabolic syndrome over four years. In this analysis, BMD (g/cm²) was set as the objective variable. Results: As a result, the bone mineral density after 4 years was negatively correlated with baseline systolic blood pressure and HbA1c levels during after 4 years. Conclusions: Thus, it is important to prevent hypertension and elevation of HbA1c by an appropriate lifestyle for maintaining a high bone mineral density.
Keywords:
bone mineral density
; older men
; metabolic syndrome
1. Introduction
According to the Ministry of Health, Labour and Welfare of Japan, the percentage of people aged 65 and older in the Japanese population is currently approaching 30% and is estimated to reach 39% in 2070 [1]. In an aging society, transition into a state in need of assistance must be avoided as much as possible for extend healthy longevity of older adults. Among the causes of transition into a state in need of assistance, fracture/falling accounts for 16.1% [2]. A previous study reported that a decrease in bone mineral density (BMD) increases the risk of fracture [3], and maintaining the BMD is also vital for the prevention of fracture. Osteoporosis induced by a decrease in BMD is observed more often in women, but the prevalence of osteoporosis increases with age in men as well as women [4]. In addition, as the outcome of osteoporotic fracture is worse in men than in women [5,6], maintenance of BMD is an important also in men.
Obesity is considered a risk factor of metabolic syndrome and osteoporosis. However, some studies have shown that body mass index (BMI) is positively correlated with a high BMD [7,8]. This correlation is interpreted as resulting from promotion of osteogenesis by higher mechanical stress on the bone in heavier individuals [9]. There is also a report that increases in BMI exceed those in BMD in severe obesity [10]. If thyroid fat percentage is higher than a certain level, there is a significant negative correlation between the fat percentage and BMD [11]. Obesity exerts effects on bone metabolism in various ways including hormone signals of insulin, estrogen, inflammation, and pathways of fat metabolism, and the mechanism of the effects need to be elucidated. Leenders et al [12]. reported greater declines in skeletal muscle mass and muscle strength in type 2 diabetic patients than in healthy individuals in a study of older men. A review of the literature revealed that the relationship between obesity and bone homeostasis is complicated and remains controversial as multiple factors and different molecular mechanisms are involved. In addition, Otobe et al [13]. reported that, in patients in maintenance period of stage 4-5 chronic kidney disease, the grip strength may be reduced to about 70-80%, and knee extension strength to about 85-90%, compared with healthy individuals. These findings suggest that metabolic syndrome decrease muscle strength simultaneously with decreases in BMD. However, in men, few studies have examined the relationship between metabolic syndrome and BMD, partly because the prevalence of osteoporosis is low at 1.4%. Clarification of the relationship between metabolic syndrome and BMD may lead to the prediction of the future risk of osteoporosis from the history of metabolic syndrome and early initiation of preventive measures against osteoporosis. Therefore, in this study, we evaluated whether indicators of metabolic syndrome and their changes over a period of 4 years are associated with the BMD in community-dwelling older men aged 65 years and older for promoting early detection and early prevention of osteoporosis.
2. Materials and Methods
2.1. Subjects
Flyers of invitation to this study were distributed with the announcement of a special medical examination sponsored by M City and O Town in Hiroshima Prefecture, and those who were interested were recruited to participate in the study on the day of the medical examination. After explaining about the study to the applicants using explanation documents, written consent to participation in the study was obtained. Measurements were performed in 2016 and 2020 in M City and in 2019 and 2023 in O Town. Of the participants, 86 men aged 65 years and older with data of indicators of metabolic syndrome both at the beginning of the study and after 4 years with data of BMD measurements after 4 years were included in the analysis. Physical and mental conditions of the participants were examined before the beginning of the measurement or during the measurement, and the measurement was immediately discontinued if they reported any discomfort. This study was carried out in compliance with the Helsinki Declaration and with approval by the Prefectural Hiroshima University Ethical Review Board (Approval No. 20MH017-1). A flow diagram of the participants included in the analysis is shown in Figure 1, and the characteristics of the subjects (mean±standard deviation) are shown in Table 1.
2.2. Examination Procedure
Between 2016 and 2023, all subjects were examined twice (first and 4 years later) for or physical characteristics (height, body weight, BMI) and blood markers of metabolic syndrome. In 2020 and 2023, the BMD was measured in addition to the above.
(1) Measurement of indicators of metabolic syndrome
The height (cm) and body weight (kg) of all participants were measured, and BMI (kg/m²) was calculated from these values. Indicators of metabolic syndrome, including triglycerides (mg/dL), HDL cholesterol (mg/dL), LDL cholesterol (mg/dL), systolic blood pressure (mmHg), diastolic blood pressure (mmHg), and HbA1c (%), were also measured. The measurements were conducted using Determiner-C-TG for triglycerides, MetaboLead HDL-C for HDL cholesterol, and MetaboLead LDL-C for LDL cholesterol (all products of Minaris Medical Co., Ltd.), as well as with the BioMajesty JCA-BM8060 and JCA-BM9130 autoanalyzers (JEOL Ltd.). The 4-year changes the parameters were calculated by subtracting the baseline values from the values measured after 4 years.
(2) Measurement of BMD
The density (g/cm2) of the left forearm bone was measured using an X-ray bone densitometer (ALPHYS A, FUJIFILM Corporation). If the participant was lefthanded or had a metallic object implanted in the left forearm, the measurement was performed in the right forearm. During the study period, the apparatus was calibrated 27 times with the results being mean=1.001 g/cm2, SD=0.009 g/cm2, and cv=0.97%, all of which were within the normal ranges established by FUJIFILM Corporation.
2.3. Statistical Analyses
The sample size was selected according to the relationship between grip strength and BMD using G power. Based on the results of W C Bevier et al [14]. on the relationship between grip strength and forearm BMD considering a correlation coefficient=0.47, two-sided α=0.05, and power=0.8, the minimum number of participants was 33[15,16]. The number of participants included in the analysis was 86 and was above the minimum sample size. Age, physical characteristics, and metabolic syndrome factors, including triglyceride, HDL cholesterol, LDL cholesterol, and HbA1c (%), as well as systolic and diastolic pressures were recorded, with the normality of the initial test values confirmed by use of a histogram and Kolmogorov-Smirnov test results (p>0.05). Values from the initial measurements were subtracted from those obtained four years later for determining changes, with normality tested and confirmed in the same manner (p>0.05). Mean and standard deviation values were calculated. Furthermore, age, height, weight, BMI and triglyceride, HDL cholesterol, LDL cholesterol, and HbA1c, and diastolic and systolic pressure were compared between included and excluded subjects using paired t test. The basic characteristics of the subjects were compared between the baseline of the study and after 4 years using a paired t-test. Multiple regression analysis was performed to examine indicators of metabolic syndrome that affect BMD. First, multiple regression analysis was conducted by considering the baseline indicators of metabolic syndrome. BMD (g/cm²) was set as the objective (dependent) variable, while baseline BMI, age after four years, and the baseline values of the indicators of metabolic syndrome were set as explanatory (independent) variables. Additionally, another multiple regression analysis was performed by considering changes in the indicators of metabolic syndrome over four years. In this analysis, BMD (g/cm²) was set as the objective (dependent) variable, and age at baseline, baseline BMI, baseline values of the indicators of metabolic syndrome, and the changes in these indicators over the four-year period were set as explanatory (independent) variables. A p-value of less than 5% was considered significant for all analyses. Statistical analyses were performed using EZR.
3. Results
Table 2 shows the results of multiple regression analysis performed by setting the BMD (g/cm²) as the objective variable (dependent variable) and baseline BMI, age after 4 years, and baseline values of indicators of metabolic syndrome as the explanation variables. The baseline systolic blood pressure showed a significant correlation (β=-0.0011, p=0.0208) and was a risk factor. Table 3 shows the results of multiple regression analysis performed by setting the BMD (g/cm²) as the objective variable (dependent variable) and age, BMI, the values of indicators of metabolic syndrome at the beginning of the study, and changes in these values during the 4 years as the explanation variables. The increase in the Hb1Ac level during the 4 years showed a significant correlation (β=-0.0462, p=0.0499) and was a risk factor.
4. Discussion
In this study, a high baseline systolic blood pressure was found to be a risk factor of a low BMD. Yang et al [17]. reported that the femoral neck BMD in individuals aged 50 years and older was lower in those with a history of hypertension than in healthy individuals. In this study, also, a significant negative correlation was observed between the baseline systolic pressure and the BMD after 4 years. Pramusita et al [18]. found that TNF-α, which is known to exacerbate inflammation, was increased in hypertensive patients and that bone resorption is accelerated due to an increase in osteoclasts, which are bone-resorbing cells, as TNF-α increases RANKL, which is involved in osteoclastogenesis.
In addition, a significant negative correlation was observed between the 4-year changes in HbA1c and the BMD after 4 years, and the BMD was shown to decrease more notably as the increase in HbA1c during the 4 years was greater. Iki et al [19]. carried out a cohort study in older Japanese men and reported that those who were hyperglycemic at baseline had a significantly higher risk of osteoporotic fracture during the subsequent 5-year follow-up period. Regarding HbA1c, the fracture risk was significantly higher in the 5.7%≤HbA1c<6.5% group than in the group with normal HbA1c after adjustment of confounding factors including the use of insulin. Conway et al [20]. also found by a prospective study in older adults that the future risk of fracture was higher in those with poorly controlled diabetes with a HbA1c level exceeding 7%. However, these studies did not clarify causes of fracture included falls due to symptoms of diabetes such as retinopathy and neuropathy and hypoglycemia due to strict blood sugar control, and whether a low BMD exerted any effect. Regarding the relationship between diabetes and BMD, BMD has been reported to be higher in diabetic patients than in healthy individuals in some reports [21] but lower in others [22]. Thus, many previous studies evaluated the relationships of diabetes with fracture risk and osteoporosis, and there is no consensus about the relationship between diabetes and BMD per se. Therefore, the significance of this study lies in that it focused on their relationship and changes in HbA1c levels during a 4-year period. In this study, a significant negative correlation was observed between the 4-year increase in HbA1c and BMD after 4 years, and the BMD tended to be lower as the increase in HbA1c during the 4 years was greater. On the other hand, no significant relationship was observed between the baseline HbA1c level and BMD. Therefore, the results suggest that a low BMD is related to increases in HbA1c, i.e., the changes in glycometabolism rather than a history of diabetes or hyperglycemia (absolute value of HbA1c). Previous studies have shown that advanced glycation end-products (AGEs) increase and accumulate at a high blood sugar level and that they promote bone resorption and suppress bone formation, leading to a loss of bone mass [23,34]. Ferron et al. [25] using osteoblast-specific insulin receptor knockout mice, found that reduced insulin signaling lead to a decrease in the number of osteoblasts, and subsequent decreases in bone formation and BMD. Also, bone resorption by osteoclasts is increased by accumulation of intracellular sorbitol in patients with type 2 diabetes [26]. In this study, imbalance of bone remodeling is considered to have been caused by impairment of osteoblast differentiation/maturation and promotion of osteoclast differentiation, resulting in the significant negative correlation between the changes in the HbA1c level and bond density.
The negative correlation observed between the baseline systolic blood pressure and BMD after 4 years in this study indicates the importance of prevention of hypertension for the maintenance of an appropriate BMD. In addition, although the increase in the HbA1c level, which is an indicator of diabetes, during a 4-year period was negatively correlated with BMD after 4 years, no correlation was observed between the baseline HbA1c level and BMD after 4 years. This result urges prevention of a rapid increase in HbA1c as it leads to a decrease in BMD, even if elevated blood sugar level does not suggest a diagnosis of diabetes.
Moreover, in the constructed multiple regression models, the standardized β values for systolic blood pressure and HbA1c were small, indicating that their direct effects on bone mineral density were limited. Nevertheless, the coefficient of determination (R²) ranged from 0.12 to 0.13, which can be interpreted as a moderate effect size. This suggests that the selection of explanatory variables was appropriate, and this statistical robustness can be regarded as one of the strengths of the present study.
Regarding limitations of this study, the physical characteristics of the participants of this study were close to the mean values of the subjects comparable in age in another study in Japan [27], suggesting the external validity of the results of this study in the general older men at least from the viewpoint of physical characteristics. A limitation of this study is that the participants may be biased towards those who are in good health or more conscious about health because of their voluntary entry into a health examination rather than enrolment of those admitted to medical or care facilities. In addition, as we did not perform an individual dietary survey, possible heterogeneity of the participants in terms of lifestyle factors cannot be excluded. Changes in BMD during the 4-year period are also unclear, because the BMD was not measured at baseline. Therefore, analysis was performed using the BMD data after 4 years, but the possibility that the BMD was low at baseline cannot be excluded. These are issues that need to be addressed in the future. However, this 4-year longitudinal study in older men newly revealed significant negative correlations of the BMD after 4 years with the baseline systolic blood pressure and the 4-year increase in the HbA1c level.
5. Conclusions
In this study, the baseline systolic blood pressure and increases in the HbA1c level during a 4-year period were found to show significant negative correlations with the BMD after 4 years, indicating that they are risk factors for a decline of BMD. This suggests that it is important to prevent not only hypertension but also increases in HbA1c by adequate lifestyle regardless of the initial HbA1c level for maintaining the BMD for the future.
Author Contributions
T.I. conceived the original idea for the study, performed analyses of the data, and drafted the manuscript. R.T. N.H. and A.O. performed the survey and analyzed the measured data and visualized the data. Y.I. measured the metabolic indicator and provided comments regarding the manuscript. S.A., H.I. and Y.O. contributed to the interpretation of data and critical comments and revised the manuscript. R.M. K.K. Y.C. and A.O. commented on results from the metabolic indicators and revised the manuscript. All authors have read and agreed to the published version of the manuscript.
Funding
This work was supported by JSPS KAKENHI Grant Numbers JP 21K11007 and JP 24K14175.
Institutional Review Board Statement
The study was conducted in accordance with the Decla-ration of Helsinki and approved by the Ethics Committee of the Prefectural University of Hiroshima (approval no. 20MH017 and October 1, 2020).
Informed Consent Statement
Informed consent was obtained from all subjects involved in the study. All participants in the present study consented to the publication of their results before they responded to the survey.
Data Availability Statement
Obtained data cannot be shared publicly because the datasets have ethical or legal restrictions for public deposition owing to inclusion of sensitive information from human participants. Based on regulations regarding ethical guidelines in Japan, the ethical review board of the Faculty of Health and Welfare, Prefectural University of Hiroshima imposed re-strictions on the data collected in this study. The data that support the findings of this study are available from the corresponding author upon reasonable request.
Acknowledgments
We would like to express our deepest gratitude to the residents of Mihara city and Osaki-Kamishima town for their cooperation with this research. This publication was partially supported by PUH Scientific Research Promotion Grant.
Conflicts of Interest
The authors declare no conflicts of interest.
References
- Ministry of Health, Labour and Welfare. Age of the 100-Year Life – Current State of Employment Measures for the Elderly. https://www.mhlw.go.jp/content/10500000/001086776.pdf (accessed on 05 April 2025).
- Ministry of Health, Labour and Welfare. Summary Report of Comprehensive Survey of Living Conditions 2019. https://www.mhlw.go.jp/english/database/db-hss/dl/report_gaikyo_2019.pdf (accessed on 05 April 2025).
- Marshall D, Johnell O, Wedel H. Meta-analysis of how well measures of bone mineral density predict occurrence of osteoporotic fractures. BMJ. 1996, 312:1254-9. [CrossRef]
- Yoshimura N, Muraki S, Oka H, Mabuchi A, En-Yo Y, Yoshida M, Saika A, Yoshida H, Suzuki T, Yamamoto S, Ishibashi H, Kawaguchi H, Nakamura K, Akune T. Prevalence of knee osteoarthritis, lumbar spondylosis, and osteoporosis in Japanese men and women: the research on osteoarthritis/osteoporosis against disability study. J Bone Miner Metab. 2009, 27: 620-8. [CrossRef]
- Diamond TH, Thornley SW, Sekel R, Smerdely P. Hip fracture in elderly men: prognostic factors and outcomes. Med J Aust. 1997, 167: 412-5. [CrossRef]
- Forsén L, Sogaard AJ, Meyer HE, Edna T, Kopjar B. Survival after hip fracture: short- and long-term excess mortality according to age and gender. Osteoporos Int. 1999, 10: 73-8. [CrossRef]
- Palermo A, Tuccinardi D, Defeudis G, Watanabe M, D'Onofrio L, Lauria Pantano A, Napoli N, Pozzilli P, Manfrini S. BMI and BMD: The Potential Interplay between Obesity and Bone Fragility. Int J Environ Res Public Health. 2016, 13: 544. [CrossRef]
- Kang DH, Guo LF, Guo T, Wang Y, Liu T, Feng XY, Che XQ. Association of body composition with bone mineral density in northern Chinese men by different criteria for obesity. J Endocrinol Invest. 2015, 38: 323-31. [CrossRef]
- Iwaniec UT, Turner RT. Influence of body weight on bone mass, architecture and turnover. J Endocrinol. 2016, 230: R115-30. [CrossRef]
- Zhang Y, Pu J. The Saturation Effect of Obesity on Bone Mineral Density for Older People: The NHANES 2017-2020. Front Endocrinol (Lausanne). 2022, 13: 883862. [CrossRef]
- Jiao Y, Sun J, Li Y, Zhao J, Shen J. Association between Adiposity and Bone Mineral Density in Adults: Insights from a National Survey Analysis. Nutrients. 2023, 15: 3492. [CrossRef]
- Leenders M, Verdijk LB, van der Hoeven L, Adam JJ, van Kranenburg J, Nilwik R, van Loon LJ. Patients with type 2 diabetes show a greater decline in muscle mass, muscle strength, and functional capacity with aging. J Am Med Dir Assoc. 2013, 14: 585-92. [CrossRef]
- Otobe Y, Hiraki K, Hotta C. The Comparizon of Muscle Strength in Pre-dialysis Chronic Kindney Disease Patients and the Average Levels in healthy Individuals. Physical Therapy Japan. 2017, 44:401-7. (in Japanese).
- W C Bevier, R A Wiswell, G Pyka, K C Kozak, K M Newhall, R Marcus: Relationship of body composition, muscle strength, and aerobic capacity to bone mineral density in older men and women. J Bone Miner Res. 1989, 4: 421-32. 10.1002/jbmr.5650040318.
- O'Brien RG and Muller KE. Unified power analysis for t-tests through multivariate hypotheses, in Applied analysis of variance in behavioral science, ed. Edwards LK. New York: Marcel Dekker; 1993, 297–344.
- Nagashima K. A sample size determination tool for the paired t-test [Internet]. 2013 Jun 19 [cited 2021 July 24]; Available from: https://nshi.jp/contents/js/pairedmean/ (in Japanese).
- Yang S, Nguyen ND, Center JR, Eisman JA, Nguyen TV. Association between hypertension and fragility fracture: a longitudinal study. Osteoporos Int. 2014, 25: 97-103. [CrossRef]
- Pramusita A, Kitaura H, Ohori F, Noguchi T, Marahleh A, Nara Y, Kinjo R, Ma J, Kanou K, Tanaka Y, Mizoguchi I. Salt-Sensitive Hypertension Induces Osteoclastogenesis and Bone Resorption via Upregulation of Angiotensin II Type 1 Receptor Expression in Osteoblasts. Front Cell Dev Biol. 2022, 10: 816764. [CrossRef]
- Iki M, Fujita Y, Kouda K, Yura A, Tachiki T, Tamaki J, Sato Y, Moon JS, Hamada M, Kajita E, Okamoto N, Kurumatani N. Hyperglycemic status is associated with an elevated risk of osteoporotic fracture in community-dwelling elderly Japanese men: The Fujiwara-kyo osteoporosis risk in men (FORMEN) cohort study. Bone. 2019, 121: 100-106. [CrossRef]
- Conway BN, Long DM, Figaro MK, May ME. Glycemic control and fracture risk in elderly patients with diabetes. Diabetes Res Clin Pract. 2016, 115: 47-53. [CrossRef]
- Vestergaard P. Discrepancies in bone mineral density and fracture risk in patients with type 1 and type 2 diabetes--a meta-analysis. Osteoporos Int. 2007, 18:427-44. [CrossRef]
- Ogata M, Ide R, Takizawa M, Tanaka M, Tetsuo T, Sato A, Iwasaki N, Uchigata Y. Association between basal metabolic function and bone metabolism in postmenopausal women with type 2 diabetes. Nutrition. 2015, 31:1394-401. [CrossRef]
- Sanguineti R, Storace D, Monacelli F, Federici A, Odetti P. Pentosidine effects on human osteoblasts in vitro. Ann N Y Acad Sci. 2008, 166-72. [CrossRef]
- Hein G, Wiegand R, Lehmann G, Stein G, Franke S. Advanced glycation end-products pentosidine and N epsilon-carboxymethyllysine are elevated in serum of patients with osteoporosis. Rheumatology (Oxford). 2003, 42: 1242-6. [CrossRef]
- Ferron M, Wei J, Yoshizawa T, Del Fattore A, DePinho RA, Teti A, Ducy P, Karsenty G. Insulin signaling in osteoblasts integrates bone remodeling and energy metabolism. Cell. 2010, 142: 296-308. [CrossRef]
- Takizawa M, Suzuki K, Matsubayashi T, Kikuyama M, Suzuki H, Takahashi K, Katsuta H, Mitsuhashi J, Nishida S, Yamaguchi S, Yoshimoto K, Itagaki E, Ishida H. Increased bone resorption may play a crucial role in the occurrence of osteopenia in patients with type 2 diabetes: Possible involvement of accelerated polyol pathway in its pathogenesis. Diabetes Res Clin Pract. 2008, 82: 119-26. [CrossRef]
- Public welfare statistics handbook. Mean of Height, the Weight, Sex, Annual× Age distinction [Internet]. Ministry of Health, Labour and Welfare, 2017. Available from: https://www.mhlw.go.jp/toukei/youran/indexyk_2_1.html (accessed on 05 April 2025).
Figure 1.
Flowchart of the analyzed subjects.
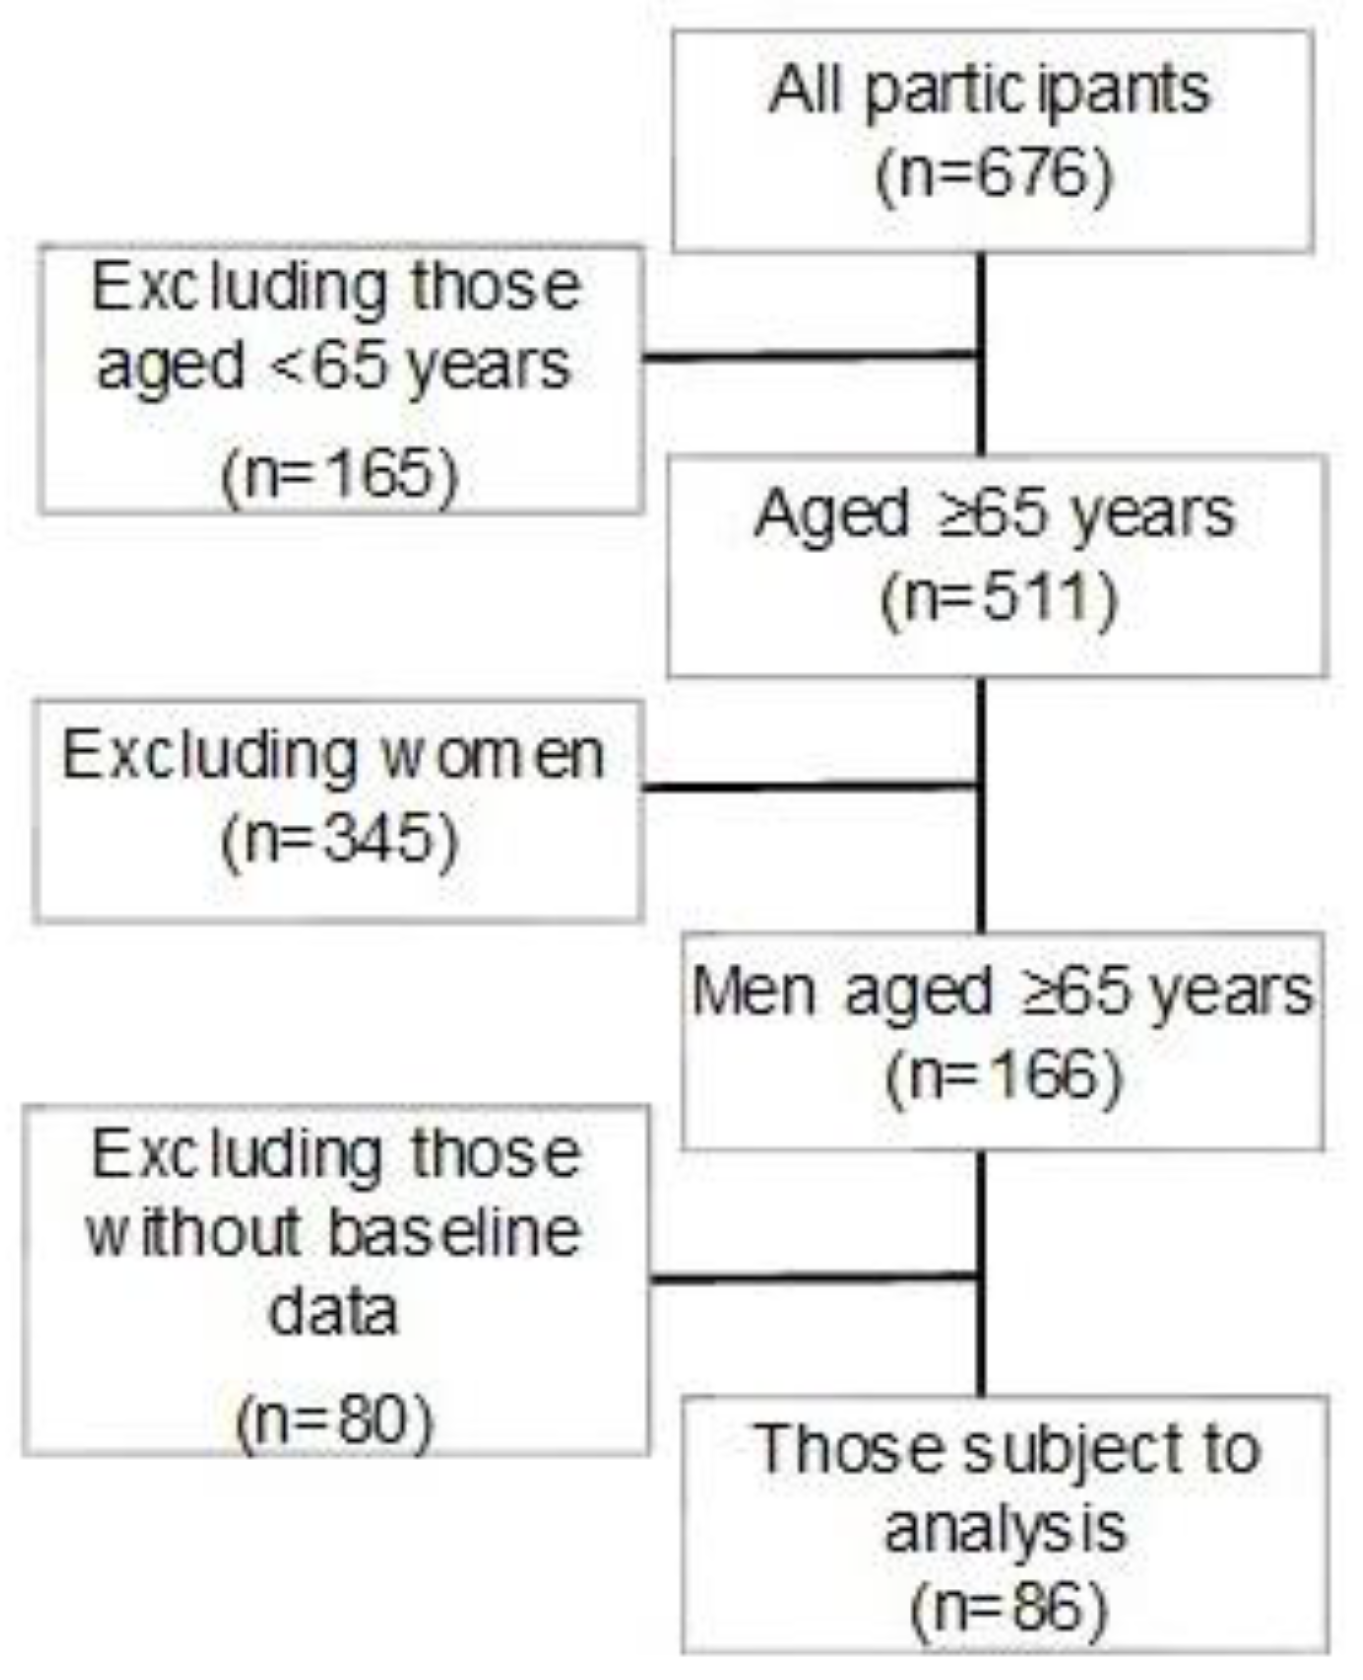

Table 1.
Physical characteristics and metabolic indicators of the study participants.
| Baseline | 4 Years Later | ||||
| Mean | (SD) | Mean | (SD) | p-value | |
| Age (y) | 71.8 | (6.4) | 76.0 | (6.3) | <0.001 |
| Height (cm) | 164.7 | (6.2) | 163.9 | (6.4) | <0.001 |
| Weight (kg) | 62.6 | (8.4) | 62.3 | (8.8) | 0.076 |
| Body Mass Index (kg/m²) | 23.1 | (2.7) | 23.2 | (2.9) | 0.632 |
| Triglycerides (mg/dL) | 112.2 | (48.1) | 112.4 | (58.9) | 0.980 |
| HDL cholesterol (mg/dL) | 59.6 | (14.2) | 63.6 | (13.9) | <0.001 |
| LDL cholesterol (mg/dL) | 122.9 | (28.7) | 119.7 | (27.8) | 0.167 |
| HbA1c (%) | 5.6 | (0.5) | 5.8 | (0.6) | <0.001 |
| Systolic blood pressure (mmHg) | 127.3 | (15.1) | 134.4 | (15.5) | <0.001 |
| Diastolic blood pressure (mmHg) | 76.1 | (10.0) | 76.1 | (8.8) | 0.908 |
| Bone mineral density (g/cm²) | ー | 0.711 | (0.07) | ー | |
Table 2.
Relationship between baseline metabolic indicators and bone mineral density.
| Baseline indicator | β | p-value | R² |
| Age (y) | -0.0024 | 0.036 | 0.074 |
| Body Mass Index (kg/m²) | 0.0020 | 0.467 | |
| Triglycerides (mg/dL) | 0.0001 | 0.435 | |
| Age (y) | -0.0025 | 0.030 | 0.069 |
| Body Mass Index (kg/m²) | 0.0019 | 0.511 | |
| HDL cholesterol (mg/dL) | -0.0002 | 0.663 | |
| Age (y) | -0.0022 | 0.053 | 0.089 |
| Body Mass Index (kg/m²) | 0.0022 | 0.407 | |
| LDL cholesterol (mg/dL) | 0.0003 | 0.164 | |
| Age (y) | -0.0024 | 0.032 | 0.072 |
| Body Mass Index (kg/m²) | 0.0026 | 0.336 | |
| HbA1c (%) | -0.0092 | 0.520 | |
| Age (y) | -0.0025 | 0.022 | 0.126 |
| Body Mass Index (kg/m²) | 0.0035 | 0.188 | |
| Systolic blood pressure (mmHg) | -0.0011 | 0.021 | |
| Age (y) | -0.0025 | 0.033 | 0.069 |
| Body Mass Index (kg/m²) | 0.0025 | 0.357 | |
| Diastolic blood pressure (mmHg) | -0.0003 | 0.716 |
Table 3.
Relationship between 4-year changes in metabolic indicators and bone density.
| Indicator | β | p-value | R² |
| Age at baseline (y) | 0.0016 | 0.052 | 0.078 |
| BMI at baseline (kg/m²) | 0.0002 | 0.560 | |
| Triglycerides at baseline (mg/dL) | 0.0002 | 0.357 | |
| 4-year change in triglycerides (mg/dL) | 0.0001 | 0.565 | |
| Age at baseline (y) | -0.0025 | 0.030 | 0.071 |
| BMI at baseline (kg/m²) | 0.0023 | 0.451 | |
| HDL-cho at baseline (mg/dL) | -0.0001 | 0.816 | |
| 4-year change in HDL-cho (mg/dL) | 0.0004 | 0.687 | |
| Age at baseline (y) | -0.0020 | 0.079 | 0.097 |
| BMI at baseline (kg/m²) | 0.0024 | 0.365 | |
| LDL-cho at baseline (mg/dL) | 0.0005 | 0.105 | |
| 4-year change in LDL-cho (mg/dL) | 0.0003 | 0.391 | |
| Age at baseline (y) | -0.0024 | 0.032 | 0.115 |
| BMI at baseline (kg/m²) | 0.0023 | 0.398 | |
| HbA1c at baseline (%) | -0.0116 | 0.414 | |
| 4-year change in HbA1c (%) | -0.0462 | 0.050 | |
| Age at baseline (y) | -0.0026 | 0.019 | 0.130 |
| BMI at baseline (kg/m²) | 0.0037 | 0.169 | |
| Systolic blood pressure at baseline (mmHg) | -0.0009 | 0.086 | |
| 4-year change in systolic blood pressure (mmHg) | 0.0003 | 0.574 | |
| Age at baseline (y) | -0.0027 | 0.025 | 0.082 |
| BMI at baseline (kg/m²) | 0.0030 | 0.281 | |
| Diastolic blood pressure at baseline (mmHg) | 0.0002 | 0.849 | |
| 4-year change in diastolic blood pressure (mmHg) | 0.0011 | 0.279 |
Disclaimer/Publisher’s Note: The statements, opinions and data contained in all publications are solely those of the individual author(s) and contributor(s) and not of MDPI and/or the editor(s). MDPI and/or the editor(s) disclaim responsibility for any injury to people or property resulting from any ideas, methods, instructions or products referred to in the content. |
© 2025 by the authors. Licensee MDPI, Basel, Switzerland. This article is an open access article distributed under the terms and conditions of the Creative Commons Attribution (CC BY) license (http://creativecommons.org/licenses/by/4.0/).
Copyright: This open access article is published under a Creative Commons CC BY 4.0 license, which permit the free download, distribution, and reuse, provided that the author and preprint are cited in any reuse.


