
Submitted:
25 August 2025
Posted:
26 August 2025
You are already at the latest version
Abstract
Background/Objectives: Peritonitis remains a leading cause of morbidity and mortality in patients undergoing peritoneal dialysis and those with cirrhotic ascites. Neutrophil gelatinase-associated lipocalin (NGAL) is a promising early biomarker. We conducted a systematic review and meta-analysis to determine NGAL's diagnostic performance for peritoneal dialysis-associated peritonitis (PDAP) and spontaneous bacterial peritonitis (SBP). Methods: Following PRISMA-DTA guidelines and PROSPERO registration (CRD420251105563), six databases were searched to 30 June 2025. Studies with extractable 2×2 data reporting peritoneal or ascitic fluid NGAL measurements against standard reference criteria were included. Pooled sensitivity, specificity, diagnostic odds ratio (DOR), and HSROC AUC were estimated using bivariate random-effects models. Heterogeneity was explored through prespecified subgroup analyses. Results: Thirteen studies (2013–2024) met inclusion; ten (573 cases, 833 controls) entered metaanalysis. Pooled sensitivity was 0.948 (95% CI 0.901–0.973) and specificity 0.864 (0.704–0.944); HSROC AUC was 0.95 and DOR 90.59. Likelihood ratios were LR⁺ 6.96 and LR⁻ 0.06. Accuracy was similar for PDAP vs SBP (Se 0.964 vs 0.932; Sp 0.882 vs 0.849; subgroup pvalues >0.3), with heterogeneity concentrated in specificity. By platform, ELISA showed balanced performance (Se 0.947; Sp 0.910), pointofcare (POC) tests the highest sensitivity (0.977) with wider specificity uncertainty, and automated immunoassays lower specificity (0.691); a global LRT supported platform differences (p=0.0098). Conclusions: Peritoneal/ascitic NGAL provides rapid, accurate discrimination of peritonitis across SBP and PDAP, with particularly strong rule‑out capability. Implementation should prioritize assay‑specific (two‑threshold) decision points, standardized dwell time and pre‑analytics, and prospective multicenter impact studies to embed NGAL within guideline‑concordant diagnostic pathways.
Keywords:
neutrophil gelatinase–associated lipocalin
; peritonitis
; diagnostic accuracy
; meta-analysis
; peritoneal dialysis
; ascites
1. Introduction
Peritonitis represents a significant clinical burden in both dialysis patients and those with cirrhosis [1,2,3,4]. Among individuals receiving peritoneal dialysis (PD), peritoneal dialysis-associated peritonitis (PDAP) is the most frequent infectious complication [1]. Although incidence rates vary across programs, current benchmarks recommend rates not exceeding 0.5 episodes per patient-year, with many centers achieving rates below 0.33 and some as low as 0.20 episodes per patient-year [1,5]. In the United States, recent data indicate an incidence of 0.26 episodes per patient-year, consistent with global figures [5]. Approximately 28% of patients experience at least one episode of peritonitis during the first year of PD [5]. PDAP is associated with considerable morbidity: nearly 50% of episodes result in hospitalization, and peritonitis-attributable mortality ranges from 3% to 10% [1,6,7,8]. Furthermore, the risk of death remains elevated for up to 120 days following an episode [1].
Among patients with cirrhosis, spontaneous bacterial peritonitis (SBP) is the most prevalent and clinically significant infection, accounting for 27% of infections in this group [9]. SBP is a major driver of morbidity and mortality: infections in cirrhosis increase the risk of death fourfold; in-hospital mortality among cirrhotic patients with sepsis may exceed 50% [3,9,10]. The burden of infection in cirrhosis is further compounded by the high prevalence of multidrug-resistant organisms, particularly in nosocomial and healthcare-associated settings [9,11]. In patients with both cirrhosis and end-stage kidney disease receiving PD, the risk of peritonitis is slightly higher than in non-cirrhotic PD patients (odds ratio, 1.10; 95% CI, 1.03–1.18), but overall mortality is not significantly increased, and outcomes are comparable to those with hemodialysis [12].
Neutrophil gelatinase–associated lipocalin (NGAL) in peritoneal fluid has emerged as a promising biomarker for the diagnosis of peritonitis, encompassing both spontaneous bacterial peritonitis (SBP) in cirrhotic patients and peritonitis in patients receiving peritoneal dialysis [13,14]. NGAL is an acute-phase protein released by neutrophils and mesothelial cells in response to infection and inflammation, and its concentration in peritoneal fluid increases substantially during episodes of peritonitis [15,16,17]. Mechanistically, NGAL is a component of the innate immune response, limiting bacterial growth by sequestering iron and modulating neutrophil function [18,19]. Its rapid induction in peritoneal fluid reflects both neutrophil influx and local mesothelial cell activation in response to infection [18].
In cirrhotic patients with ascites, elevated ascitic NGAL levels are strongly associated with SBP [13,20]. Studies have demonstrated that NGAL concentrations are significantly higher in patients with SBP than in those without, and NGAL correlates with the absolute neutrophil count in ascitic fluid [21,22]. Receiver operating characteristic (ROC) analysis shows that ascitic NGAL has good diagnostic performance for SBP, with an area under the curve (AUC) of approximately 0.89 and clinically meaningful accuracy (e.g., sensitivity, 96%; specificity, 75% at a threshold of 120 ng/mL) [13,21]. Furthermore, ascitic NGAL levels are independent predictors of in-hospital mortality in cirrhotic patients, even after adjustment for SBP and the Model for End-Stage Liver Disease (MELD) score [13].
In the context of peritoneal dialysis, NGAL in peritoneal dialysis effluent (PDE) is a sensitive early marker of PDAP [23,24]. NGAL levels in PDE rise rapidly during PDAP and correlate with peritoneal white blood cell (WBC) counts [15]. NGAL may also help distinguish bacterial from nonbacterial or culture-negative peritonitis, as levels are typically higher in bacterial infections [15]. NGAL may also help differentiate bacterial from non-bacterial or culture-negative peritonitis, as levels are typically higher in bacterial infections [15]. Additionally, NGAL concentrations in peritoneal fluid may decline earlier than WBC counts during the resolution of peritonitis, suggesting a role in monitoring treatment response [24].
Despite these promising data, several factors have limited the adoption of NGAL as a standard diagnostic tool [21]. A lack of standardization in assay methods, cutoff values, and sampling time points complicates clinical implementation and interpretation [21,23]. Most studies to date are single-center, observational, or case-control in design, and there is a paucity of large, prospective, multicenter validation studies demonstrating clear clinical benefit [13,21]. Accordingly, this study aims to synthesize existing evidence on NGAL concentrations in peritoneal dialysis effluent and ascitic fluid and to provide robust estimates of its diagnostic performance for PDAP and SBP.
2. Materials and Methods
This systematic review and meta-analysis adhered to the PRISMA (Preferred Reporting Items for Systematic Reviews and Meta-Analyses) of diagnostic test accuracy guidelines (PRISMA-DTA) [25]. It was prospectively registered in PROSPERO (CRD420251105563).
2.1. Eligibility Criteria
We included studies in which human subjects of any age had undergone peritoneal fluid sampling—either dialysis effluent or ascitic fluid—to evaluate neutrophil gelatinase–associated lipocalin as a biomarker for peritonitis. For peritoneal dialysis–associated peritonitis, the reference standard was defined according to International Society for Peritoneal Dialysis (ISPD) criteria, requiring at least two of the following: clinical features consistent with peritonitis (abdominal pain and/or cloudy dialysis effluent), dialysis effluent WBC count > 100 cells/µL or > 0.1 × 10⁹ L⁻¹ with > 50 % polymorphonuclear leukocytes after a dwell time of at least two hours, and positive dialysis effluent culture [26]. For SBP in patients with cirrhosis and ascites, the reference standard was defined according to International Ascites Club consensus and incorporated in subsequent guidelines by the American Association for the Study of Liver Diseases (AASLD) and the European Association for the Study of the Liver (EASL), requiring an ascitic fluid polymorphonuclear leukocyte count ≥ 250 cells/mm³ irrespective of culture status [27,28]. To enable construction of 2 × 2 contingency tables, studies were required to report or facilitate derivation of true positives, false positives, false negatives, and true negatives for NGAL versus the reference standard.
We included prospective and retrospective cohort studies, cross-sectional surveys, and case–control designs published as full-text articles, as well as abstracts from scientific congresses published in indexed journals. We excluded case series with fewer than ten patients, narrative reviews, editorials, and non–human investigations. No language restrictions were imposed, and unpublished or gray-literature reports were considered when they provided sufficient diagnostic performance data. For the quantitative analysis, studies were excluded if they had not measured NGAL in peritoneal fluid, had not applied a peritonitis definition based on ISPD criteria, or had failed to report sufficient data to construct a 2 × 2 contingency table.
2.2. Search Strategy
On June 30, 2025, we systematically searched six bibliographic databases—PubMed/MEDLINE, Embase, the Cochrane Library (CLIB), LILACS, Scopus, and the Web of Science Core Collection—using combined keywords and subject headings for neutrophil gelatinase–associated lipocalin (NGAL; “lipocalin-2”) and peritonitis (including “peritoneal dialysis,” “ascites,” and related terms). The complete search strategies for each platform are detailed in Table 1.
No language or publication-status restrictions were imposed. To capture additional reports, we hand-searched reference lists of included studies and relevant reviews, screened Google Scholar for conference abstracts and dissertations, and queried ClinicalTrials.gov and the WHO ICTRP for unpublished or ongoing diagnostic studies.
2.3. Study Selection
After duplicate removal, two reviewers (M.L.P-M and G.A.G.-F.) independently screened titles and abstracts against the eligibility criteria. Full texts of potentially relevant articles were subsequently assessed. Reference lists of included studies were also hand-searched. Disagreements were resolved by discussion or consultation with a third reviewer (J.D.G.-B).
2.4. Data Extraction and Quality Assessment of Studies
Two reviewers (M.L.P-M. and V.A.C.-A.) independently extracted study-level characteristics (first author, publication year, study design, and geographic setting), patient demographics (mean or median age, sex distribution, and peritonitis subtype), index-test details (NGAL assay method and cut-off values), reference standard criteria, and 2×2 contingency data (true positives, false positives, false negatives, true negatives). Discrepancies were resolved by discussion and, when necessary, adjudicated by a third investigator (B.D.-V). Risk of bias and applicability concerns were evaluated using the QUADAS-2 tool, with each domain (patient selection, index test, reference standard, and flow and timing) rated as “low,” “high,” or “unclear” risk [29]. A summary QUADAS-2 is presented to illustrate the methodological quality across included studies in Table 2.
2.5. Statistical Analysis
For each study, we obtained a 2×2 table (true positives, false positives, false negatives, true negatives). When raw 2×2 data were unavailable, we reconstructed cell counts from reported accuracy metrics (sensitivity, specificity, and group totals) using internally consistent algebraic solutions. If a study reported multiple NGAL thresholds, we preferentially extracted the prespecified clinical cutoff; when not prespecified, we selected the threshold used in the primary analysis of the article. Unit inconsistencies (e.g., ng/dL vs ng/mL) were corrected per protocol and documented. For studies with any zero cell, we applied a Haldane–Anscombe continuity correction (adding 0.5 to all four cells) in primary analyses and repeated key analyses with a 0.1 correction as sensitivity analysis.
The primary outcomes were pooled sensitivity and specificity and the area under the hierarchical summary ROC (HSROC) curve (including the partial AUC restricted to observed false-positive rates). Secondary summaries included likelihood ratios (LR⁺, LR⁻), the diagnostic odds ratio (DOR), and predictive values (PPV/NPV) calculated at pre-specified pre-test probabilities (15%, 20%, 25%, 30%, and 40%) via Fagan analysis.
Diagnostic accuracy was synthesized using the bivariate random-effects model of Reitsma/Rutter–Gatsonis, which jointly models logit-transformed sensitivity and the logit-transformed false-positive rate (FPR = 1 − specificity) under a bivariate normal distribution, allowing between-study heterogeneity in both parameters and in their correlation. Models were fitted by restricted maximum likelihood (REML). Summary sensitivity and specificity on the probability scale were obtained by back-transforming the model’s logit-scale means. On the hierarchical summary receiver operating characteristic (HSROC) plot, we displayed the summary operating point with its 95% confidence and prediction regions, derived from the model’s variance–covariance components; in addition, we reported 95% prediction intervals for sensitivity and specificity to express expected variability in a new setting. For nested comparisons (e.g., adding subgroup covariates), models were re-estimated by maximum likelihood (ML) and compared using likelihood-ratio tests (LRTs). Between-study heterogeneity was described by the between-study variances (reported as logit-scale standard deviations for sensitivity and FPR) and their random correlation (rho, ρ).
Small-study effects were evaluated with Deeks’ funnel plot asymmetry test, regressing ln(DOR) on 1/√ESS (ESS = 4n₁n₂/n), after Haldane–Anscombe correction. We used weighted least-squares with weights proportional to ESS and considered p < 0.10 as suggestive of asymmetry, acknowledging the limited power with small k.
We examined prespecified subgroups by (i) clinical context (spontaneous bacterial peritonitis [SBP] vs peritoneal dialysis–associated peritonitis [PDAP]), (ii) assay method (e.g., ELISA, automated immunoassay, rapid H-NGAL), (iii) testing platform (laboratory-based vs point-of-care), and (iv) study size (<100 vs ≥100 participants). For each factor, group differences in sensitivity and specificity were tested on the logit scale using random-effects meta-regressions with Knapp–Hartung small-sample adjustment; pooled Se/Sp are reported on the probability scale. In parallel, we fitted a bivariate Reitsma model including the subgroup as a covariate and compared it to the intercept-only model via a maximum-likelihood likelihood-ratio test to assess the joint effect on logit-sensitivity and logit-FPR. As a secondary summary, between-group differences in diagnostic odds ratio were evaluated with random-effects meta-regression of log(DOR) using REML with Knapp–Hartung inference. Given the small number of studies in several strata, subgroup models were fitted one factor at a time (no multi-covariate adjustments), results were shown only when k≥3 per stratum, and zero-cell studies used a 0.5 continuity correction (with 0.1 in sensitivity analyses).
The certainty of evidence for sensitivity, specificity, and HSROC AUC was appraised with GRADE for test accuracy, considering risk of bias (QUADAS-2), inconsistency (between-study heterogeneity), imprecision (width of 95% CIs), and publication bias (Deeks’ test). We did not downgrade for indirectness because all studies directly evaluated NGAL in peritoneal or ascitic fluid against accepted reference standards for peritonitis.
2.6. Data Visualization and Tabulation
We tabulated study-level characteristics (design, setting, patient population), assay details (method/platform, matrix, and positivity threshold), reference standards, and diagnostic 2×2 data with 95% CIs. Forest plots displayed individual and pooled estimates for sensitivity and specificity (and, as a secondary summary, DOR). HSROC plots showed the summary operating point with 95% confidence and prediction regions. Subgroups (SBP vs PDAP) were visualized with stratified forest plots and separate HSROCs. Small-study effects were visualized with Deeks’ funnel plots (log-DOR vs 1/√ESS).
2.7. Software and Statistical Packages
All analyses were performed in R (version 4.3.1) using RStudio. The mada package was used for the bivariate Reitsma model, HSROC summaries, Deeks’ test, and prediction intervals; metafor supported logit-scale random-effects meta-regressions with REML and Knapp–Hartung adjustments and provided influence diagnostics for log-DOR analyses. We used meta for complementary univariate summaries and forest plotting where appropriate, readxl for data import, dplyr for data management, and ggplot2 for figures. All code is available upon request.
3. Results
3.1. Study Selection
An electronic search of PubMed, Embase, Scopus, Web of Science, Cochrane Library, and LILACS retrieved 147 records. After removal of 101 duplicates, 46 unique titles and abstracts were screened, leading to the exclusion of 31 studies for ineligible population, intervention, or design. We obtained 15 articles for detailed assessment; of these, 1 were not accessible, and 1 lacked a valid reference standard or comparator. Ultimately, 13 full text studies satisfied our inclusion criteria and were incorporated into the qualitative synthesis, with 10 studies providing sufficient data for the quantitative meta-analysis. A PRISMA flow diagram summarizing the selection process is shown in Figure 1.
3.2. Characteristics of Included Studies
Between 2013 and 2024, 13 studies met our inclusion criteria (Table 2), comprising two cross-sectional investigations, five case–control studies, two retrospective analyses (one incorporating cross-sectional elements), one prospective observational study, two prospective cohort studies, and one case–cohort study with longitudinal follow-up. Collectively, these studies enrolled 1642 adult participants (sample sizes, 30–301; mean or median age, approximately 45–65 years; sex distributions, approximately balanced) across two primary clinical contexts: spontaneous bacterial peritonitis in cirrhotic ascites and peritoneal dialysis–associated peritonitis. Studies were conducted in diverse geographic settings including Egypt, Italy, China, and the United States.
Ascitic or peritoneal neutrophil gelatinase–associated lipocalin (NGAL) was quantified using established assay platforms: enzyme-linked immunosorbent assay (ELISA; n = 5), immunoturbidimetric assay (n = 5), chemiluminescent microparticle immunoassay (n = 2), rapid immunochromatographic test (n = 1), and lateral-flow dipstick (n = 2). Reported diagnostic thresholds ranged from approximately 85 ng/mL to 300 ng/mL. Across studies, sensitivities ranged from 90% to 100%, specificities from 75% to 99%, and areas under the receiver-operating characteristic curve from 0.68 to 0.99. All investigations employed standardized diagnostic reference criteria (e.g., polymorphonuclear leukocyte count ≥ 250 cells/mm³ for SBP, and International Society for Peritoneal Dialysis [ISPD] guidelines for PDAP). The characteristics of the included studies, along with the QUADAS-2 risk-of-bias assessment, are summarized in Table 2.
3.3. Performance of Neutrophil Gelatinase-Associated Lipocalin for Detection of SBP and PDAP
Ten studies evaluated NGAL for peritonitis diagnosis, encompassing 573 cases and 833 controls. In the bivariate random-effects model, NGAL showed excellent sensitivity, with pooled sensitivity 0.948 (95% CI, 0.901–0.973) and specificity 0.864 (95% CI, 0.704–0.944). Forest plots for sensitivity, specificity, and diagnostic odds ratio (DOR) are shown in Figure 2a–c, and the HSROC curve in Figure 2d. The pooled DOR was 90.59 (95% CI, 18.84–435.61), indicating strong overall discrimination (Figure 2c). The HSROC AUC was 0.95 (partial AUC restricted to observed FPRs 0.932), confirming excellent global performance (Figure 2d).
Between-study heterogeneity concentrated in specificity rather than sensitivity. In the overall bivariate model, the between-study SDs on the logit scale were 0.721 for sensitivity and 1.377 for the FPR, implying relatively stable sensitivity but markedly more variable specificity across settings. Translating this to clinical terms using 95% PIs, a future study would be expected to observe sensitivity between 0.75–0.98 and specificity between 0.23–0.99.
For threshold and small-study effects, in the bivariate model, the random-effects correlation between sensitivity and the false-positive rate was negative (ρ≈−0.63), consistent with a threshold effect across studies. The scatter of logit-sensitivity versus logit-FPR also showed a negative Spearman correlation that did not reach statistical significance overall (ρ=−0.43; p=0.218). Using our prespecified Deeks’ funnel test on the primary dataset, we observed significant asymmetry (p=0.003), suggesting small-study effects. In sensitivity analyses that applied alternative continuity/weighting definitions, the association attenuated and the test was not significant (p=0.27; Supplementary Figure S1). Given the small number of studies and the influence of individual high-leverage studies, we interpret small-study effects as possible but not definitive.
Leave-one-out analyses of the pooled DOR supported robustness: estimates remained high across iterations (range, 58.43–124.71). Excluding Liu et al. [22] yielded the highest DOR (124.71; 95% CI, 32.51–478.45), whereas excluding Chen et al. [32] yielded the lowest (58.43; 95% CI, 14.96–228.18), without materially altering the conclusion (Figure 3).
For decision support, pooled likelihood ratios were LR⁺ 6.96 and LR⁻ 0.06 overall—consistent with good confirmatory value and strong rule-out capability, respectively. Example Fagan updates: at 20% pre-test probability, a positive test increases post-test probability to ~63.5%, while a negative reduces it to ~1.5%.
3.4. Subgroup Analysis by Peritonitis Type
Of the 10 studies with quantitative data, 6 evaluated spontaneous bacterial peritonitis (n = 278 cases; n = 394 controls) and 4 evaluated peritoneal dialysis–associated peritonitis (n = 295 cases; n = 439 controls). Pooled accuracy was similar between groups (Figure 4), SBP: sensitivity 0.932 (95% CI, 0.859–0.969), specificity 0.849 (95% CI, 0.676–0.938), AUC 0.949. PDAP: sensitivity 0.964 (95% CI, 0.883–0.989), specificity 0.882 (95% CI, 0.504–0.982), AUC 0.936.
Formal subgroup tests found no evidence of a difference by peritonitis type. On the logit scale with REML and Knapp–Hartung adjustments, the difference in pooled sensitivity was p = 0.333 and in specificity p = 0.819. The DOR ratio (PDAP/SBP) was 1.90 (95% CI, 0.07–52.42; p = 0.666), and a global LRT in the bivariate model ML detected no subgroup effect (p = 1.00).
Heterogeneity patterns were consistent but more extreme in PDAP. The between-study SDs were 0.310 (logit-sensitivity) and 1.935 (logit-FPR) for PDAP, yielding 95% PIs of Se 0.84–0.97 and Sp 0.07–>0.99 (the very wide Sp PI reflects the small k and boundary estimation). For SBP, SDs were 0.831 (logit-sensitivity) and 1.144 (logit-FPR), with PIs Se 0.68–0.99 and Sp 0.31–0.98. Deeks’ test indicated small-study effects in SBP (p = 0.0043) but not in PDAP (p = 0.164). Spearman’s correlations were negative but non-significant in both subgroups (SBP ρ = −0.66; p = 0.175; PDAP ρ = −0.80; p = 0.333).
Subgroup influence analyses mirrored the overall pattern (Figure 5). For PDAP, the pooled DOR was 133.17 (95% CI, 5.08–9509.62) with broader leave-one-out variation (30.74–315.59); excluding Chen et al. [32] gave the most conservative estimate (30.74; 95% CI, 5.12–184.54), while excluding Morisi et al. [35] produced the highest DOR (315.59; 95% CI, 0.28–353,806), with very wide CIs. For SBP, the pooled DOR was 77.32 (95% CI, 8.36–715.47) with tighter leave-one-out range (47.12–127.89); excluding Liu et al. [22] yielded the highest DOR (127.89; 95% CI, 36.84–443.95), and excluding Biomy et al. [31] the lowest (47.12; 95% CI, 4.87–455.78).
For clinical translation, subgroup LR estimates were PDAP LR⁺ 8.15 / LR⁻ 0.04 and SBP LR⁺ 6.16 / LR⁻ 0.08, supporting strong rule-out value in both groups and moderate confirmatory value that is sensitive to the local threshold and assay format (e.g., rapid dipsticks versus quantitative platforms).
3.5. Subgroup Analysis by NGAL Assay Method
We examined whether assay methodology modifies diagnostic performance using a bivariate random-effects (Reitsma/HSROC) model stratified by assay type—ELISA (four studies), point-of-care/rapid tests (three studies), and automated immunoassays (three studies). Heterogeneity was summarized with 95% prediction intervals (PI) for sensitivity and specificity on the probability scale, and by assessing the influence of individual studies on the diagnostic odds ratio. Between-group differences were evaluated with a bivariate meta-regression and a likelihood-ratio test (LRT).
In the bivariate model, ELISA yielded a pooled sensitivity of 0.947 (95% CI, 0.900–0.973) and specificity of 0.910 (0.840–0.951), corresponding to a DOR of 159.06 (55.33–457.25) and an HSROC AUC of 0.967. POC/rapid assays showed the highest pooled sensitivity, 0.977 (0.939–0.992), but with wide uncertainty in specificity, 0.90 (0.380–0.992); the resulting DOR was 242.91 (6.23–9475.85) and AUC 0.974. Automated immunoassays displayed lower overall accuracy, with sensitivity 0.881 (0.749–0.944), specificity 0.691 (0.492–0.843), DOR 18.04 (2.27–143.36), and AUC 0.871 (Figure 6).
Prediction intervals illustrated the extent of between-study dispersion. For sensitivity, the 95% PIs were narrow for ELISA (approximately 0.89–0.96) and POC/rapid (0.93–0.98), but wide for automated assays (0.58–0.97). For specificity, dispersion was modest for ELISA (about 0.79–0.95) and very large for both POC/rapid (0.03–0.99) and automated platforms (0.25–0.94), consistent with threshold variation across studies and explaining the broad HSROC prediction regions for these subgroups (Figure 6d).
To facilitate clinical translation, we collapsed platforms into two groups: laboratory-based assays (ELISA plus automated immunoassays) and point-of-care (POC) tests (Figure S2). The comparison included 10 studies overall: 7 laboratory-based studies (358 cases, 496 controls) and 3 POC studies (215 cases, 337 controls). Pooled estimates were obtained from a bivariate random-effects (Reitsma/HSROC) model; heterogeneity is described using prediction-region behavior and by leave-one-out (LOO) influence on the diagnostic odds ratio (DOR). Laboratory-based assays showed sensitivity 0.92 (95% CI 0.86–0.96) and specificity 0.84 (0.70–0.92), with DOR 67.54 (16.05–284.24) and AUC = 0.94. POC tests yielded sensitivity 0.97 (0.94–0.99) and specificity 0.90 (0.38–0.99), with DOR 242.91 (6.23–9475.85) and AUC = 0.97 (Figure S2a–d). Thus, POC tests tend to provide higher sensitivity while maintaining broadly comparable specificity, albeit with much wider uncertainty for specificity.
Prediction regions from the HSROC display a narrow band for sensitivity in the POC subgroup and a broader band for specificity in both groups—extremely wide for POC, reflecting threshold dispersion across studies (Figure S2d). This pattern mirrors the subgroup results by individual assay type and explains the large uncertainty around the POC DOR despite a high point estimate. A bivariate meta-regression likelihood-ratio test confirmed that overall diagnostic accuracy differs between laboratory-based and POC tests (χ²=9.26, df=2, p=0.0098). In keeping with the HSROC, this difference is driven primarily by the spread in specificity across POC studies and by the lower/heterogeneous specificity of automated assays within the laboratory group. (For reference, univariate subgroup tests on sensitivity and specificity alone did not reach conventional significance: χ²≈3.79, p≈0.052 for sensitivity; χ²≈0.14, p≈0.71 for specificity.)
As detailed in Figure S3, POC results are highly sensitive to individual studies: omitting Chen et al. [32] reduced the POC DOR to 31.6, whereas omitting Morisi et al. [35], increased it to 1253.0 and omitting Virzi et al. [36] raised it to 351.8. Within the laboratory group, influence is concentrated in the automated-assay subset: excluding Liu et al. [22], increased the automated DOR to 46.1, while excluding Lippi et al. [21], and Martino et al. [23] lowered it to 10.4 and 12.3, respectively. ELISA-based estimates were comparatively robust, with smaller LOO shifts. Together, these findings reinforce that assay choice and study-level thresholds materially affect observed performance.
Deeks’ funnel asymmetry tests showed no evidence of small-study effects for POC (p=0.727) and a borderline signal for the laboratory group (p=0.062), advising cautious interpretation of between-group contrasts.
3.6. Subgroup Analysis by Sample Size
To assess whether study size affects diagnostic performance, we stratified studies by total sample size using a threshold of 100 participants (Figure 7). Four studies with <100 participants contributed 135 peritonitis cases and 132 controls, and six studies with ≥100 participants contributed 438 cases and 701 controls. Pooled estimates were obtained with a bivariate random-effects (Reitsma/HSROC) model; heterogeneity was described via the HSROC prediction regions and leave-one-out (LOO) influence on the diagnostic odds ratio (DOR). The pooled accuracy in the bivariate model for small studies (<100) showed sensitivity 0.957 (95% CI 0.905–0.981) and specificity 0.916 (0.855–0.958), yielding DOR 245.81 (82.78–729.96) and AUC 0.972. Large studies (≥100) showed sensitivity 0.952 (0.859–0.971) and specificity 0.807 (0.506–0.937), with DOR 50.22 (7.80–323.55) and AUC 0.943 (Figure S4a–d).
A bivariate meta-regression did not detect a significant effect of sample size on overall accuracy (χ²=1.76, df=2, p=0.415). Thus, while point estimates suggest better performance among smaller studies, this contrast is not supported when sensitivity and specificity are modeled jointly.
The HSROC display shows a narrower prediction region for sensitivity in small studies and a markedly broader region for specificity—especially among larger studies—indicating substantial threshold dispersion for specificity (Figure 7d). These patterns overlap widely across size strata, consistent with the non-significant LRT.
LOO analyses indicated moderate influence within the <100 group (baseline DOR = 245.81): omitting Biomy et al. [31] lowered the DOR to 174.1, whereas omitting Ahmed et al [30], Hassan et al. [20], or Virzi et al. [37] raised it to 269.9, 353.5, and 260.6, respectively. In the ≥100 group (baseline DOR = 50.22), omitting Chen et al. [32] reduced the DOR to 22.7; excluding Liu et al. [22] increased it to 84.5; other omissions had smaller effects (e.g., Martino et al. [34] 57.0, Morisi et al. [35], 67.6, Lippi et al. [34], 50.0, Khalil et al. [33] 51.2). Overall, large-study results are more sensitive to single influential studies, largely through specificity.
Deeks’ funnel asymmetry tests did not suggest small-study effects within either stratum (p=0.585 for <100; p=0.460 for ≥100). Hence, although smaller studies show higher pooled DOR and AUC, these features are not explained by publication bias in the Deeks sense.
Smaller studies yielded higher sensitivity, specificity, DOR, and AUC, but sample size per se was not a statistically significant modifier of accuracy in the bivariate framework. The wider HSROC prediction region for specificity among larger studies—and the pronounced LOO shifts when omitting certain large studies—suggest that between-study threshold differences and assay mix (e.g., inclusion of low-specificity automated platforms) likely contribute to the observed patterns.
3.7. Risk of Bias
During the screening process, four independent authors (J.C.D.A.-J, J.B.-R, M.L.P-M. and J.D.G.-B) demonstrated a high degree of agreement, as supported by a Cohen’s kappa coefficient of 0.95. The methodological quality of the included studies was assessed using the QUADAS-2 tool, with detailed results presented in Table 2. Overall, the risk of bias was judged to be low to moderate across the included studies. The primary concerns identified were related to the 'Patient Selection' domain, particularly in studies employing a case-control design, which may introduce a risk of selection bias.
Deeks’ funnel plot for all studies showed evidence of small-study effects (slope test p = 0.003; Figure 8a). In subgroup analyses by assay method, no asymmetry was detected for ELISA (k = 4, p = 0.56), automated immunoassays (k = 3, p = 0.67), or point-of-care (POC) tests (k = 3, p = 0.73) (Figure 8b). Grouping by platform indicated borderline asymmetry among laboratory-based assays (k = 7, p = 0.062), whereas POC tests again showed no signal (k = 3, p = 0.73) (Figure 8c). Stratifying by study size revealed no asymmetry within either stratum (<100 participants: k = 4, p = 0.585; ≥100 participants: k = 6, p = 0.46) (Figure 8d). Taken together, the significant overall result appears to be driven by the set of laboratory-based studies; all subgroup findings should be interpreted cautiously given the small number of studies per stratum (k ≤ 4) and the conventional p < 0.10 threshold used for Deeks’ test.
3.8. Certainty of the Evidence
The GRADE–DTA evaluation, conducted independently by four authors (J.A.G.-F., A.M.L.-Y., J.C.D.A.-J., and J.B.-R.), of thirteen diagnostic performance studies assessing NGAL in peritoneal effluent and ascitic fluid is summarized in Table 3. The risk of bias was generally moderate across studies, with inconsistency, indirectness, and publication bias judged as not serious. However, serious imprecision—due largely to wide or unreported confidence intervals—resulted in moderate overall certainty for most studies. Only Chen et al., achieved high certainty on the basis of narrow estimates and rigorous design, while Lippi et al. [21] maintained moderate certainty despite the absence of serious imprecision, likely reflecting their moderate risk of bias assessment.
4. Discussion
In this systematic review and meta-analysis, peritoneal/ascitic neutrophil gelatinase–associated lipocalin (NGAL) showed excellent overall diagnostic accuracy for peritonitis. In the bivariate random-effects model, pooled sensitivity and specificity were 0.948 and 0.864, respectively; the HSROC AUC was ≈0.95 (partial AUC within the observed FPRs 0.932), and the pooled DOR was 90.6, with likelihood ratios LR⁺ ≈ 6.96 and LR⁻ ≈ 0.06. At a pre-test probability of 20%, a positive NGAL raises the post-test probability to ~63–64%, whereas a negative result lowers it to ~1.5%, supporting strong rule-out capability alongside meaningful confirmatory value. Heterogeneity concentrated in specificity rather than sensitivity; between-study SDs on the logit scale were larger for the false-positive rate, and 95% prediction intervals suggested that future studies might see sensitivity around 0.75–0.98 and specificity 0.23–0.99, underscoring threshold dispersion across settings.
Diagnostic performance was comparable between peritonitis types. For PDAP, pooled sensitivity was 0.964 and specificity 0.882 (AUC 0.936); for SBP, sensitivity 0.932 and specificity 0.849 (AUC 0.949). Formal subgroup tests detected no significant differences (logit-scale meta-regressions: sensitivity p = 0.333; specificity p = 0.819; DOR ratio PDAP/SBP 1.90, p = 0.666; global LRT in the bivariate model p = 1.00). Taken together with the narrow prediction band for sensitivity, these findings support broad applicability of NGAL as an early adjunct across PDAP and SBP.
Assay methodology modified observed accuracy. ELISA studies showed sensitivity ~0.95 and specificity ~0.91 (HSROC AUC ~0.97; DOR ~159), point-of-care/rapid tests had the highest pooled sensitivity (~0.98) with broadly comparable but more uncertain specificity (AUC ~0.97; DOR ~243 with very wide CIs), while automated immunoassays performed lower overall (AUC ~0.87; DOR ~18). Collapsing platforms into laboratory-based (ELISA + automated) versus POC, a bivariate meta-regression confirmed platform-level differences (LRT χ²≈9.26, p≈0.0098), largely driven by specificity dispersion among POC studies and the lower/heterogeneous specificity of automated assays. These data support a two-threshold strategy tailored to the local platform (low cut-off for rule-out, high cut-off for rule-in).
Risk of bias was generally low-to-moderate by QUADAS-2, with anticipated concerns in case-control designs. At the meta-level, Deeks’ funnel plot suggested small-study effects overall (p = 0.003), though this attenuated in a prespecified sensitivity analysis using an alternative continuity/weighting scheme (p = 0.27), indicating that the asymmetry signal is sensitive to analytic choices in a small corpus. A sample-size meta-regression found no significant effect of study size on joint accuracy (LRT p = 0.415), despite higher point estimates in smaller studies, and leave-one-out analyses showed the main conclusions were robust to single-study influence. Overall certainty by GRADE-DTA was moderate (imprecision and design limitations), with one high-certainty multicenter POC study.
Current guidelines for peritoneal dialysis–associated peritonitis and spontaneous bacterial peritonitis rely on clinical features, peritoneal/ascitic polymorphonuclear cell thresholds (≥250/mm³ for SBP; effluent WBC >100/µL with ≥50% PMN after ≥2 h dwell for PDAP), and cultures—tests that can be delayed or confounded by prior antibiotics and variable dwell times [26,27,28]. The present results support NGAL as a rapid adjunct to guideline criteria—particularly attractive for rule-out given the consistently high sensitivity and very low LR⁻—and as a potential tool for early triage and time-to-antibiotics reduction while confirmatory testing is pending. Given the platform-dependent behavior of specificity and the wide prediction intervals, implementation should pre-specify assay-specific cut-offs, harmonize pre-analytics (e.g., ≥2-h dwell time for PD effluent; standardized handling), and favor impact evaluations (diagnostic- and management-change studies, decision-curve analyses) to document real-world benefit. Moreover, NGAL may rise early and decline during effective therapy, warranting evaluation as a monitoring biomarker; however, potential elevations in non-infectious inflammatory states should be anticipated and managed via a two-threshold or composite-algorithm approach [15,18,22,24,32]. In head-to-head comparisons, peritoneal NGAL outperformed CRP and procalcitonin for early discrimination of PDAP and performed comparably to WBC count, supporting its role as a front-line adjunct rather than a replacement biomarker [23,34].
Despite robust performance, several limitations warrant acknowledgment. Substantial heterogeneity was observed, particularly for specificity. Small-study effects were evident, with studies enrolling fewer than 100 participants demonstrating significantly higher diagnostic odds ratios and remarkable homogeneity compared with larger studies. Limited peer review in some data sources and potential spectrum bias in case–control designs further temper the strength of the conclusions [35,37]. Another inherent limitation in the measurement of NGAL in peritoneal fluid is that NGAL levels can be elevated in non-infectious inflammatory conditions, which may reduce specificity in certain clinical contexts [18].
Future research should target both methodological optimization and broader clinical validation of NGAL testing. Priorities are: (i) multicenter, prospective validations that pre-specify platform-specific two-threshold (rule-out/rule-in) cut-offs and calibrate them to local prevalence/spectrum, with blinded adjudication; (ii) pre-analytical standardization—uniform dwell time for PD effluent (≥2 h), harmonized sampling/transport/storage SOPs, handling of bloody/viscous samples, and external quality assurance (including lot-to-lot and inter-operator checks for POC); (iii) comprehensive analytical reporting (LoD/LoQ, imprecision across the decision range, linearity, unit harmonization/traceability, and matrix effects) to enable inter-laboratory comparability; (iv) head-to-head comparisons versus PMN counts, CRP, procalcitonin, and composite algorithms, quantifying incremental value with decision-curve and reclassification metrics; (v) focused evaluations in challenging phenotypes—culture-negative neutrocytic ascites, partially treated PD-associated peritonitis, and short dwell times—where adjunctive tests are most needed; and (vi) explicit documentation of false-positive contexts (e.g., non-infectious peritoneal inflammation) and conditions that preclude or distort testing (e.g., grossly bloody effluent), coupled with reflex pathways for indeterminate/gray-zone results. These priorities will directly respond to the meta-analytic pattern of stable sensitivity, heterogeneous specificity, and platform-level differences observed in our synthesis.
Integration with guideline-based diagnostic criteria (PMN thresholds and cultures) will be essential. If validated, early diagnosis using NGAL dipsticks at the bedside could shorten delays compared with conventional methods, enabling prompt antibiotic initiation while confirmatory tests are processed [23,36]. Finally, exploring NGAL in combination with other biomarkers represents another promising avenue [21]. Given its reported association with adverse outcomes in cirrhosis cohorts, prognostic modeling—such as adding NGAL to MELD-Na or infection-related risk scores—also warrants investigation.
5. Conclusions
Peritoneal/ascitic NGAL demonstrates high diagnostic accuracy for peritonitis across PDAP and SBP (pooled Se 0.95, Sp 0.86, HSROC AUC ~0.95, LR⁻ ~0.06), with no material differences between etiologies. Clinical use should emphasize rapid rule-out and platform-specific two-threshold decision-making, embedded within guideline-concordant algorithms alongside PMN counts and cultures. Standardization of pre-analytics and assay-specific cut-offs, coupled with prospective, multicenter impact studies, will determine how best to integrate NGAL—particularly POC formats—to accelerate diagnosis and improve care pathways.
Supplementary Materials
The following supporting information can be downloaded at the website of this paper posted on Preprints.org, Table S1: Table 1. PRISMA 2020 checklist for systematic reviews and meta-analyses: items and manuscript locations.; Figure S1. (a) Study level sensitivity vs specificity with linear fit and Pearson correlation. (b) Deeks’ funnel plots under an alternative coding scheme (Haldane–Anscombe +0.5 per cell; ESS defined as 4/(1/TP+1/FN+1/FP+1/TN); weighted least squares regression of ln(DOR) on 1/√ESS; Figure S2. Subgroup analysis of NGAL diagnostic performance by NGAL test type: (a) Forest plot of sensitivity by NGAL test type; (b) Forest plot of specificity by NGAL test type: (c) Forest plot of diagnostic odds ratio (DOR) by NGAL test type; (d) Summary receiver operating characteristic (SROC) curves by NGAL test type.; Figure S3. Leave-one-out influence analysis of the diagnostic odds ratio across NGAL assay platforms and testing contexts: (a) ELISA — leave-one-out DOR; (b) Point-of-care/rapid tests — leave-one-out DOR; (c) Automated immunoassays — leave-one-out DOR; (d) Laboratory-based assays (ELISA + automated), collapsed vs POC — leave-one-out DOR; (e) POC/rapid tests, collapsed vs laboratory — leave-one-out DOR. Figure S4. Leave-one-out influence analysis of the diagnostic odds ratio across NGAL assay studies by sample size: (a) Studies with less than 100 patients— leave-one-out DOR; (b) Studies with more than 100 patients— leave-one-out DOR.
Author Contributions
Conceptualization, M.L.P-M., J.B.-R.; methodology, M.L.P-M., J.D.G.-B. and J.B.-R., R.R.-M.; software, J.B.-R., J.C.D.A.-J., M.L.P-M. and B.D.-V.; validation, M.L.P-M., J.C.D.A.-J. and J.B.-R.; formal analysis, J.B.-R., J.C.D.A.-J. and M.L.P-M.; investigation, B.D.-V., M.L.P-M., J.D.G.-B., J.A.G.-F. and V.A.C.-A.; resources, J.B.-R., M.L.P-M. and J.D.G.-B.; data curation, J.D.G.-B., M.L.P-M., J.A.G.-F., V.A.C.-A., A.M.L.-Y. , R.R.-M, B.D.-V., J.C.D.A-J. and J.B-R.; writing—original draft preparation, M.L.P-M., J.D.G.-B., J.A.G.-F., V.A.C.-A., A.M.L.-Y. and B.D.-V.; writing—review and editing, J.B.-R. and J.C.D.A.-J.; visualization, R.R.-M, V.A.C.-A., A.M.L.-Y., J.D.G.-B. and B.D.-V.; supervision, J.B.-R. and J.C.D.A.-J.; project administration, M.L.P-M., J.B.-R., J.C.D.A.-J. and J.B.-R. All authors have read and agreed to the published version of the manuscript.
Funding
This research received no external funding.
Institutional Review Board Statement
Ethical review and approval were waived for this study due to its design as a systematic review and meta-analysis of previously published data, which did not involve individual patient information; accordingly, patient consent was waived.
Informed Consent Statement
Patient consent was waived due to the nature of this study as a systematic review and meta-analysis of previously published, aggregate data without any collection of individual-level or identifiable patient information; therefore, individual consent was not applicable.
Data Availability Statement
The raw data supporting the conclusions of this article will be made available by the authors without undue reservation.
Acknowledgments
The authors have no acknowledgments to report.
Conflicts of Interest
The authors declare no conflicts of interest.
Abbreviations
The following abbreviations are used in this manuscript:
| AASLD ANC |
American Association for the Study of Liver Diseases Absolute Neutrophil Count |
| APD | Automated Peritoneal Dialysis |
| AUC | Area Under the Curve |
| CAPD | Continuous Ambulatory Peritoneal Dialysis |
| CBC | Complete Blood Count |
| CI | Confidence Interval |
| CNNA | Culture-Negative Neutrocytic Ascites |
| CRP | C-Reactive Protein |
| CVD | Cardiovascular Disease |
| EASL ELISA |
European Association for the Study of the Liver Enzyme-Linked Immunosorbent Assay |
| DOR GI |
Diagnostic odds ratio Gastrointestinal |
| HCC | Hepatocellular Carcinoma |
| HSROC INR |
Hierarchical summary receiver operating characteristic International Normalized Ratio |
| IRB | Institutional Review Board |
| ISPD | International Society for Peritoneal Dialysis |
| LDH | Lactate Dehydrogenase |
| NGALds | NGAL Dipstick Test |
| NGALlab | Laboratory-based NGAL Test |
| NPV | Negative Predictive Value |
| PCT | Procalcitonin |
| PD | Peritoneal Dialysis |
| PDAP | Peritoneal Dialysis-Associated Peritonitis |
| PMN | Polymorphonuclear Neutrophils |
| PMNL | Polymorphonuclear Leukocytes |
| POC PPV |
Point-of-care Positive Predictive Value |
| QUADAS-2 | Quality Assessment of Diagnostic Accuracy Studies-2 |
| ROC | Receiver Operating Characteristic |
| SBP | Spontaneous Bacterial Peritonitis |
| SROC UTI |
Summary receiver operating characteristic Urinary Tract Infection |
References
- Teitelbaum, I. Peritoneal Dialysis. New England Journal of Medicine 2021, 385, 1786–1795. [CrossRef]
- Tay, P.W.L.; Xiao, J.; Tan, D.J.H.; Ng, C.; Lye, Y.N.; Lim, W.H.; Teo, V.X.Y.; Heng, R.R.Y.; Yeow, M.W.X.; Lum, L.H.W.; et al. An Epidemiological Meta-Analysis on the Worldwide Prevalence, Resistance, and Outcomes of Spontaneous Bacterial Peritonitis in Cirrhosis. Front Med (Lausanne) 2021, 8, 693652. [CrossRef]
- Abu-Freha, N.; Michael, T.; Poupko, L.; Estis-Deaton, A.; Aasla, M.; Abu-Freha, O.; Etzion, O.; Nesher, L. Spontaneous Bacterial Peritonitis among Cirrhotic Patients: Prevalence, Clinical Characteristics, and Outcomes. J Clin Med 2021, 11, 227. [CrossRef]
- Young, E.W.; Zhao, J.; Pisoni, R.L.; Piraino, B.M.; Shen, J.I.; Boudville, N.; Schreiber, M.J.; Teitelbaum, I.; Perl, J.; McCullough, K. Peritoneal Dialysis-Associated Peritonitis Trends Using Medicare Claims Data, 2013-2017. Am J Kidney Dis 2023, 81, 179–189. [CrossRef]
- Flythe, J.E.; Watnick, S. Dialysis for Chronic Kidney Failure: A Review. JAMA 2024, 332, 1559–1573. [CrossRef]
- Nardelli, L.; Scalamogna, A.; Ponzano, F.; Sikharulidze, A.; Tripodi, F.; Vettoretti, S.; Alfieri, C.; Castellano, G. Peritoneal Dialysis Related Peritonitis: Insights from a Long-Term Analysis of an Italian Center. BMC Nephrol 2024, 25, 163. [CrossRef]
- Davenport, A. Peritonitis Remains the Major Clinical Complication of Peritoneal Dialysis: The London, UK, Peritonitis Audit 2002-2003. Perit Dial Int 2009, 29, 297–302.
- Pérez Fontan, M.; Rodríguez-Carmona, A.; García-Naveiro, R.; Rosales, M.; Villaverde, P.; Valdés, F. Peritonitis-Related Mortality in Patients Undergoing Chronic Peritoneal Dialysis. Perit Dial Int 2005, 25, 274–284.
- Bajaj, J.S.; Kamath, P.S.; Reddy, K.R. The Evolving Challenge of Infections in Cirrhosis. New England Journal of Medicine 2021, 384, 2317–2330. [CrossRef]
- Hung, T.-H.; Wang, C.-Y.; Tsai, C.-C.; Lee, H.-F. Short and Long-Term Mortality of Spontaneous Bacterial Peritonitis in Cirrhotic Patients. Medicine (Baltimore) 2024, 103, e40851. [CrossRef]
- Santoiemma, P.P.; Dakwar, O.; Angarone, M.P. A Retrospective Analysis of Cases of Spontaneous Bacterial Peritonitis in Cirrhosis Patients. PLoS One 2020, 15, e0239470. [CrossRef]
- Mekraksakit, P.; Suppadungsuk, S.; Thongprayoon, C.; Miao, J.; Leelaviwat, N.; Thongpiya, J.; Qureshi, F.; Craici, I.M.; Cheungpasitporn, W. Outcomes of Peritoneal Dialysis in Cirrhosis: A Systematic Review and Meta-Analysis. Perit Dial Int 2025, 45, 93–105. [CrossRef]
- Cullaro, G.; Kim, G.; Pereira, M.R.; Brown, R.S.; Verna, E.C. Ascites Neutrophil Gelatinase-Associated Lipocalin Identifies Spontaneous Bacterial Peritonitis and Predicts Mortality in Hospitalized Patients with Cirrhosis. Dig Dis Sci 2017, 62, 3487–3494. [CrossRef]
- Virzì, G.M.; Mattiotti, M.; Milan Manani, S.; Gnappi, M.; Tantillo, I.; Corradi, V.; de Cal, M.; Giuliani, A.; Carta, M.; Giavarina, D.; et al. Peritoneal NGAL: A Reliable Biomarker for PD-Peritonitis Monitoring. J Nephrol 2023, 36, 2139–2141. [CrossRef]
- Leung, J.C.K.; Lam, M.F.; Tang, S.C.W.; Chan, L.Y.Y.; Tam, K.Y.; Yip, T.P.S.; Lai, K.N. Roles of Neutrophil Gelatinase-Associated Lipocalin in Continuous Ambulatory Peritoneal Dialysis-Related Peritonitis. J Clin Immunol 2009, 29, 365–378. [CrossRef]
- Karlsen, J.R.; Borregaard, N.; Cowland, J.B. Induction of Neutrophil Gelatinase-Associated Lipocalin Expression by Co-Stimulation with Interleukin-17 and Tumor Necrosis Factor-Alpha Is Controlled by IkappaB-Zeta but Neither by C/EBP-Beta nor C/EBP-Delta. J Biol Chem 2010, 285, 14088–14100. [CrossRef]
- Jaberi, S.A.; Cohen, A.; D’Souza, C.; Abdulrazzaq, Y.M.; Ojha, S.; Bastaki, S.; Adeghate, E.A. Lipocalin-2: Structure, Function, Distribution and Role in Metabolic Disorders. Biomed Pharmacother 2021, 142, 112002. [CrossRef]
- Nasioudis, D.; Witkin, S.S. Neutrophil Gelatinase-Associated Lipocalin and Innate Immune Responses to Bacterial Infections. Med Microbiol Immunol 2015, 204, 471–479. [CrossRef]
- Moschen, A.R.; Adolph, T.E.; Gerner, R.R.; Wieser, V.; Tilg, H. Lipocalin-2: A Master Mediator of Intestinal and Metabolic Inflammation. Trends Endocrinol Metab 2017, 28, 388–397. [CrossRef]
- Mohamed Hassan, R.; Abd Elghafar Salem, G.; Mohamed ALsayed Refaat Mohamed, B.; Ahmed Zidan, A.; El-Gebaly, A.M. Prognostic Value of Ascitic Neutrophil Gelatinase-Associated Lipocalin in Decompensated Liver Cirrhosis with Spontaneous Bacterial Peritonitis Patients; The Egyptian Journal of Hospital Medicine; 2023; Vol. 91, pp. 4511–4511;
- Lippi, G.; Caleffi, A.; Pipitone, S.; Elia, G.; Ngah, A.; Aloe, R.; Avanzini, P.; Ferrari, C. Assessment of Neutrophil Gelatinase-Associated Lipocalin and Lactate Dehydrogenase in Peritoneal Fluids for the Screening of Bacterial Peritonitis. Clin Chim Acta 2013, 418, 59–62. [CrossRef]
- Liu, H.; Zhu, P.; Nie, C.; Ye, Q.; Gao, Y.; Liu, H.; Pang, G.; Han, T. The Value of Ascitic Neutrophil Gelatinase-Associated Lipocalin in Decompensated Liver Cirrhosis with Spontaneous Bacterial Peritonitis. Journal of Clinical Laboratory Analysis 2020, 34. [CrossRef]
- Martino, F.; Scalzotto, E.; Giavarina, D.; Rodighiero, M.P.; Crepaldi, C.; Day, S.; Ronco, C. The Role of NGAL in Peritoneal Dialysis Effluent in Early Diagnosis of Peritonitis: Case-Control Study in Peritoneal Dialysis Patients. Perit Dial Int 2015, 35, 559–565. [CrossRef]
- Lacquaniti, A.; Chirico, V.; Mondello, S.; Buemi, A.; Lupica, R.; Fazio, M.R.; Buemi, M.; Aloisi, C. Neutrophil Gelatinase-Associated Lipocalin in Peritoneal Dialysis Reflects Status of Peritoneum. J Nephrol 2013, 26, 1151–1159. [CrossRef]
- Page, M.J.; M., Joanne E.;. Bossuyt, Patrick M.M.;. Boutron, Isabelle; Hoffmann, Tammy; Mulrow, Cynthia D.;. Shamseer, Larissa; Tetzlaff, Jennifer; Akl, Elie A.;. Brennan, Sue E.;. Chou, Roger; Glanville, Julie; Grimshaw, Jeremy M.;. Hróbjartsson, Asbjørn; Lalu, Manoj M.;. Li, Tianjing; Loder, Elizabeth; Mayo-Wilson, Evan; McDonald, Steve; McGuinness, Luke A; Stewart, Lesley A.;. Thomas, James; Tricco, Andrea C.;. Welch, Vivian; Whiting, Penny; Moher, David The PRISMA 2020 Statement: An Updated Guideline for Reporting Systematic Reviews. International journal of surgery (London, England) 2021, 88, 105906–105906. [CrossRef]
- Li, P.K.-T.; Chow, K.M.; Cho, Y.; Fan, S.; Figueiredo, A.E.; Harris, T.; Kanjanabuch, T.; Kim, Y.-L.; Madero, M.; Malyszko, J.; et al. ISPD Peritonitis Guideline Recommendations: 2022 Update on Prevention and Treatment. Perit Dial Int 2022, 42, 110–153. [CrossRef]
- Biggins, S.W.; Angeli, P.; Garcia-Tsao, G.; Ginès, P.; Ling, S.C.; Nadim, M.K.; Wong, F.; Kim, W.R. Diagnosis, Evaluation, and Management of Ascites, Spontaneous Bacterial Peritonitis and Hepatorenal Syndrome: 2021 Practice Guidance by the American Association for the Study of Liver Diseases. Hepatology 2021, 74, 1014. [CrossRef]
- EASL Clinical Practice Guidelines on the Management of Ascites, Spontaneous Bacterial Peritonitis, and Hepatorenal Syndrome in Cirrhosis. Journal of Hepatology 2010, 53, 397–417. [CrossRef]
- QUADAS-2: A Revised Tool for the Quality Assessment of Diagnostic Accuracy Studies | Annals of Internal Medicine Available online: https://www.acpjournals.org/doi/10.7326/0003-4819-155-8-201110180-00009?url_ver=Z39.88-2003&rfr_id=ori:rid:crossref.org&rfr_dat=cr_pub%20%200pubmed (accessed on 7 August 2025).
- Alshymaa A. Ahmed, Maha Roushdy Abd El Wahed, Marwan Elgohary, Fatma Atef Ibrahim,Rehab Mohamed Ateya Ahmed_ 2023_Value of Neutrophil Gelatinase-Associated Lipocalin in Serum and Peritoneal Fluids in the Diagnosis of Spontaneous Bacterial Peritonitis and the Prediction of in Hospital Mortality. J Popul Ther Clin Pharmacol 2023, 30, e934–e955.
- Biomy, H.A.; Ramadan, N.E.; Ameen, S.G.; Kandil, A.E.D.I.; Galal, Z.W. Evaluation of Ascitic Fluid Neutrophil Gelatinase Associated Lipocalin in Patients with Spontaneous Bacterial Peritonitis. Benha Medical Journal 2021, 38, 951–961. [CrossRef]
- Chen, Y.; Zhang, T.; Kong, G.; Lyu, X.; Wang, J.; Zhang, K.; Chen, Q. Utility of Homodimer Neutrophil Gelatinase-Associated Lipocalin Rapid Test Kit for the Diagnosis of Peritoneal Dialysis-Associated Peritonitis. Chinese Journal of Nephrology 2024, 40, 868–874. [CrossRef]
- Khalil, F.O.; Mandour, S.S.M.S.; Bedira, I.S.; Elkhadry, S.; Ibrahim, A.R.; Abdelmageed, N.; El -shemy, E.; El-refai, H.A. Neutrophil Gelatinase-Associated Lipocalin-2 and Macrophage Antigen -1 in Cirrhotic Patients Infected with Carbapenem Resistant Enterobacteriaceae. Egyptian Journal of Medical Microbiology 2023, 32, 1–11. [CrossRef]
- Martino, F.K.; Filippi, I.; Giavarina, D.; Kaushik, M.; Rodighiero, M.P.; Crepaldi, C.; Teixeira, C.; Nadal, A.F.; Rosner, M.H.; Ronco, C. Neutrophil Gelatinase-Associated Lipocalin in the Early Diagnosis of Peritonitis: The Case of Neutrophil Gelatinase-Associated Lipocalin. Contrib Nephrol 2012, 178, 258–263. [CrossRef]
- Morisi, N.; Virzì, G.M.; Barajas, J.D.G.; Diaz-Villavicencio, B.; Manani, S.M.; Zanella, M. Validation of Peritoneal Neutrophil Gelatinase-Associated Lipocalin as a Biomarker for Peritonitis: A Comparison between Laboratory-Base Method and Rapid Stick Test. Journal of Translational Critical Care Medicine 2023, 5. [CrossRef]
- Virzì, G.M.; Milan Manani, S.; Marcello, M.; Costa, E.; Marturano, D.; Tantillo, I.; Lerco, S.; Corradi, V.; De Cal, M.; Martino, F.K.; et al. Neutrophil Gelatinase-Associated Lipocalin (NGAL) in Peritoneal Dialytic Effluent: Preliminary Results on the Comparison between Two Different Methods in Patients with and without Peritonitis. Applied Sciences (Switzerland) 2022, 12. [CrossRef]
- Virzi, G.M.; Morisi, N.; Manani, S.M.; de Cal, M.; Tantillo, I.; Donati, G.; Ronco, C.; Zanella, M. #996 Validation of Peritoneal NGAL as a Biomarker for Peritonitis: A Comparison between Laboratory-Base Method and Rapid Stick Test. Nephrol Dial Transplant 2024, 39, gfae069-0927–0996. [CrossRef]
Figure 1.
PRISMA flow diagram.
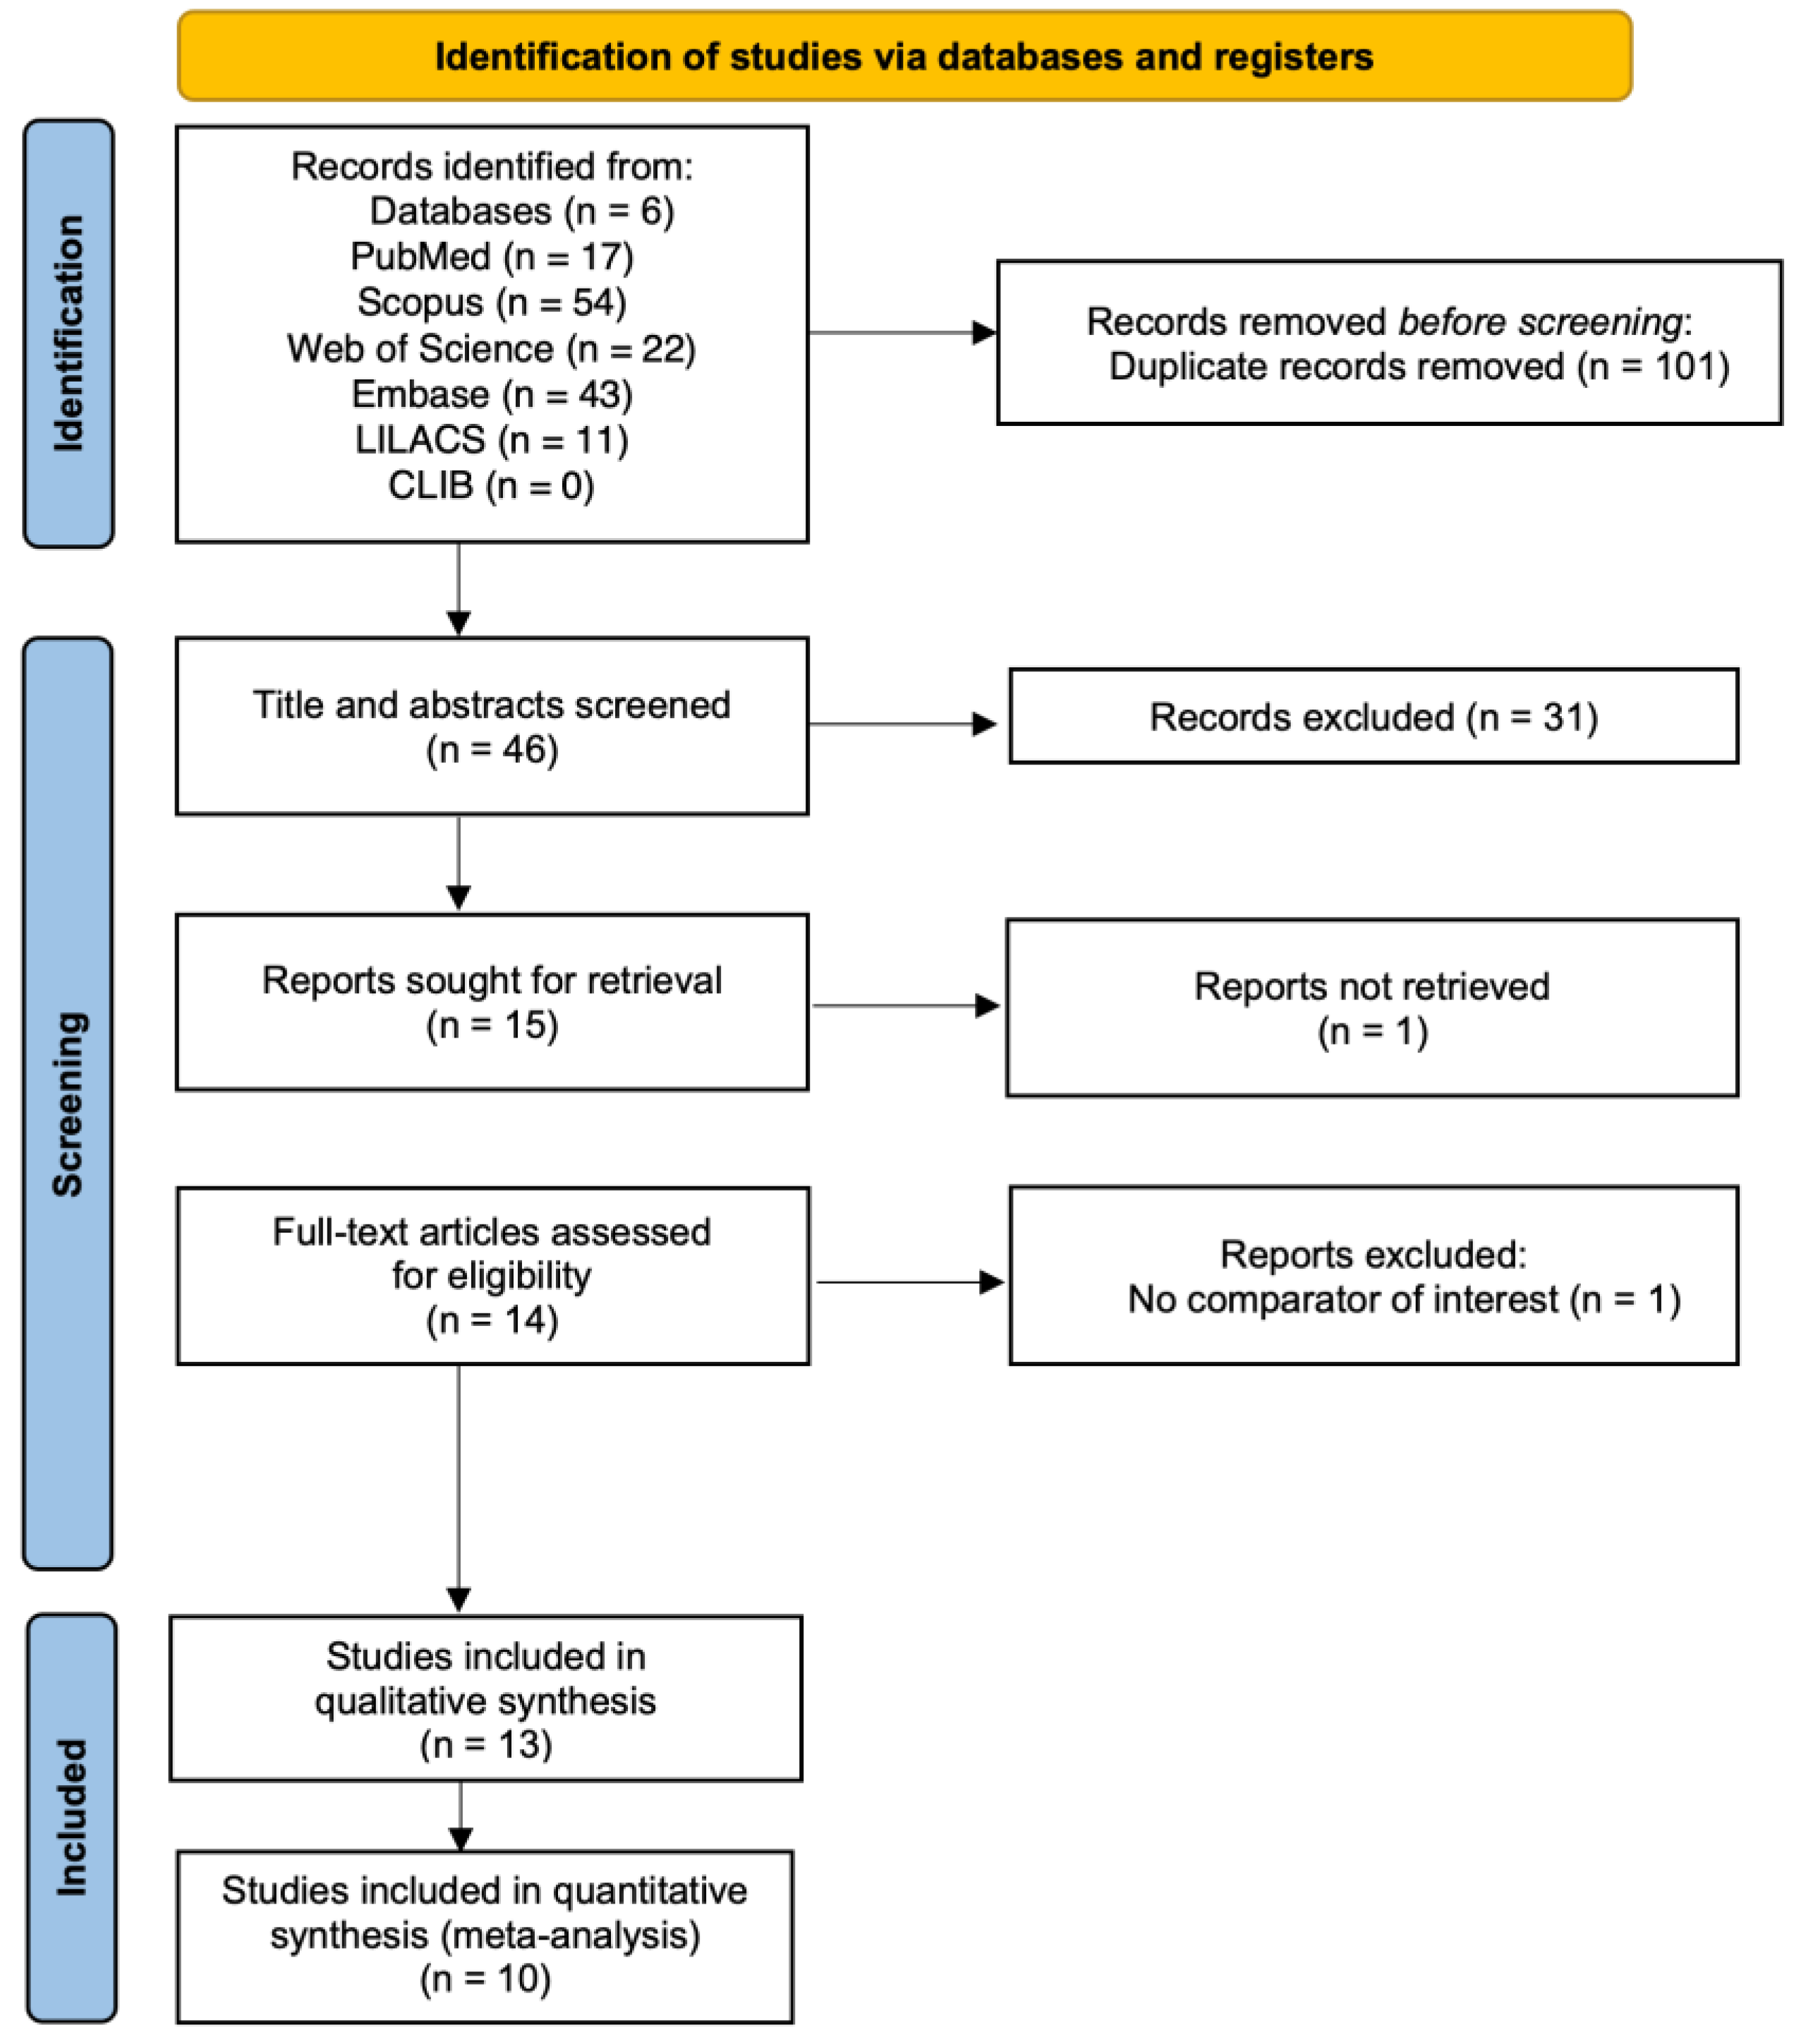
Figure 2.
Forest plots of diagnostic performance metrics for NGAL in peritonitis diagnosis: (a) Sensitivity; (b) Specificity; (c) Diagnostic odds ratio; (d) Summary receiver operating characteristic curve for NGAL diagnostic performance.
Figure 2.
Forest plots of diagnostic performance metrics for NGAL in peritonitis diagnosis: (a) Sensitivity; (b) Specificity; (c) Diagnostic odds ratio; (d) Summary receiver operating characteristic curve for NGAL diagnostic performance.
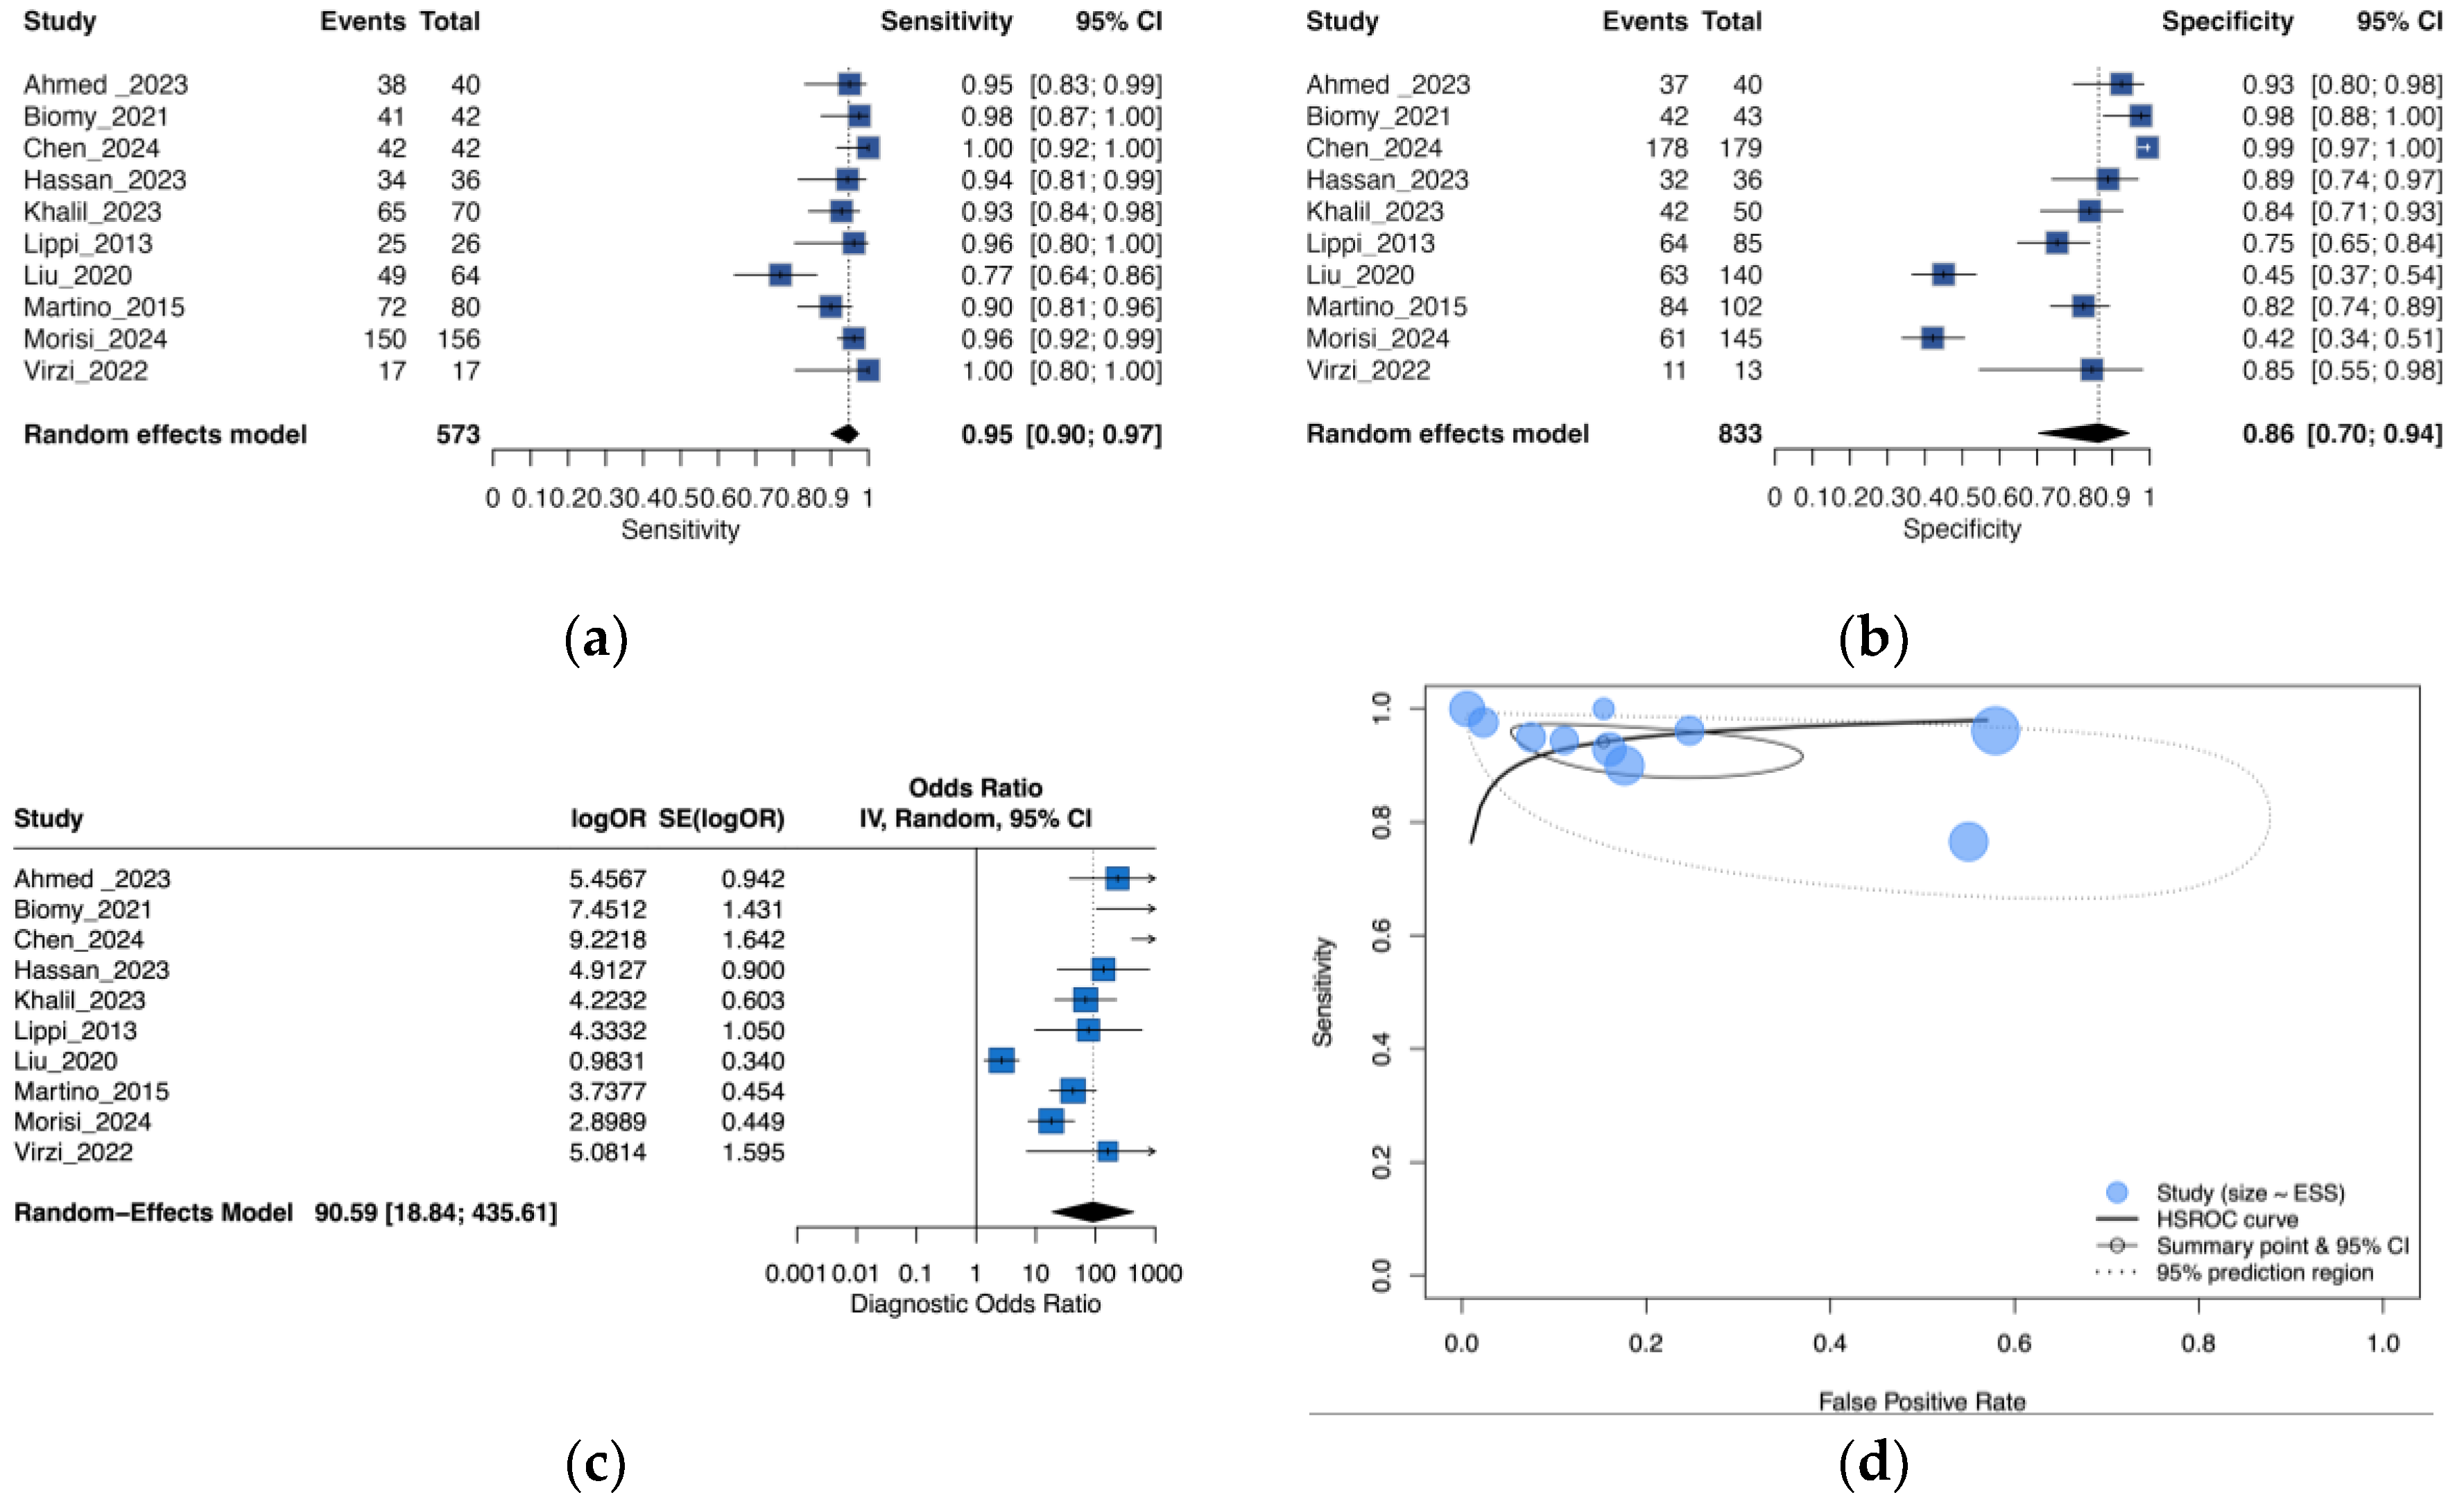
Figure 3.
Leave-One-Out sensitivity analysis of the pooled diagnostic odds ratio for NGAL in peritonitis diagnosis.
Figure 3.
Leave-One-Out sensitivity analysis of the pooled diagnostic odds ratio for NGAL in peritonitis diagnosis.
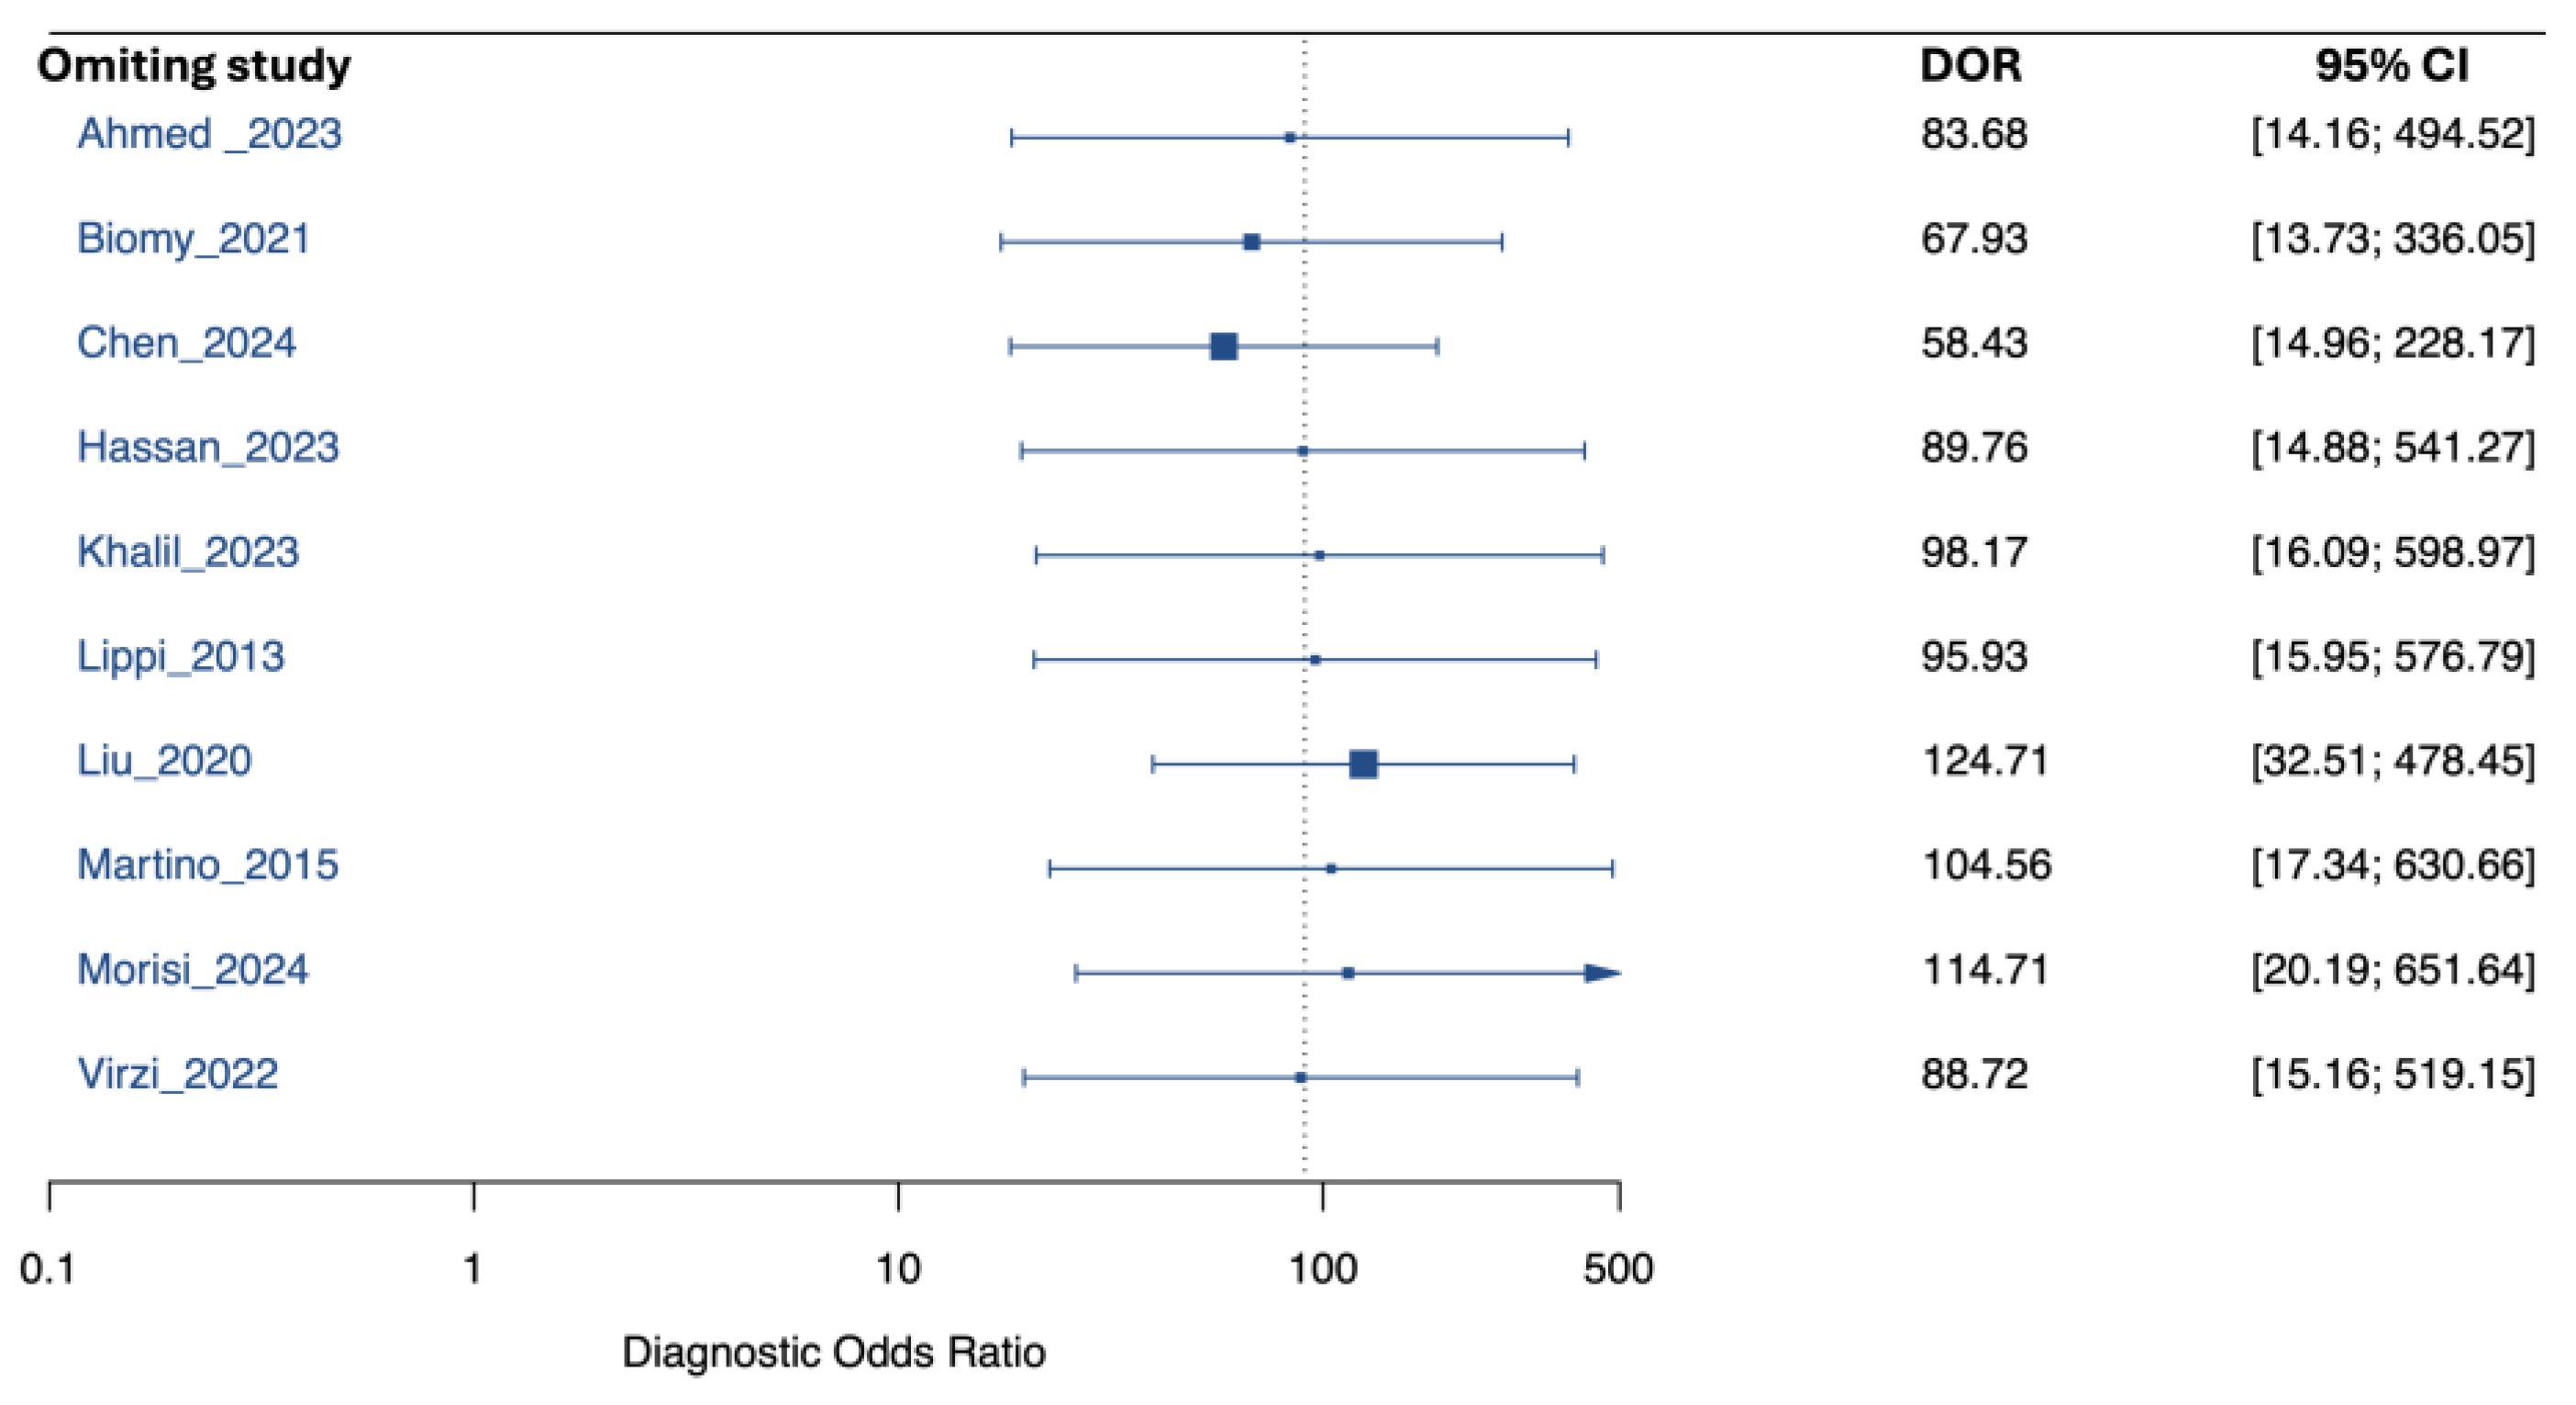
Figure 4.
Subgroup analysis of NGAL diagnostic performance by peritonitis type: (a) Forest plot of sensitivity by peritonitis type; (b) Forest plot of specificity by peritonitis type; (c) PDAP diagnostic odds ratios; (d) SBP diagnostic odds ratios; (e) Summary of receiver operating characteristic curves in PDAP; (f) Summary of receiver operating characteristic curves in SBP.
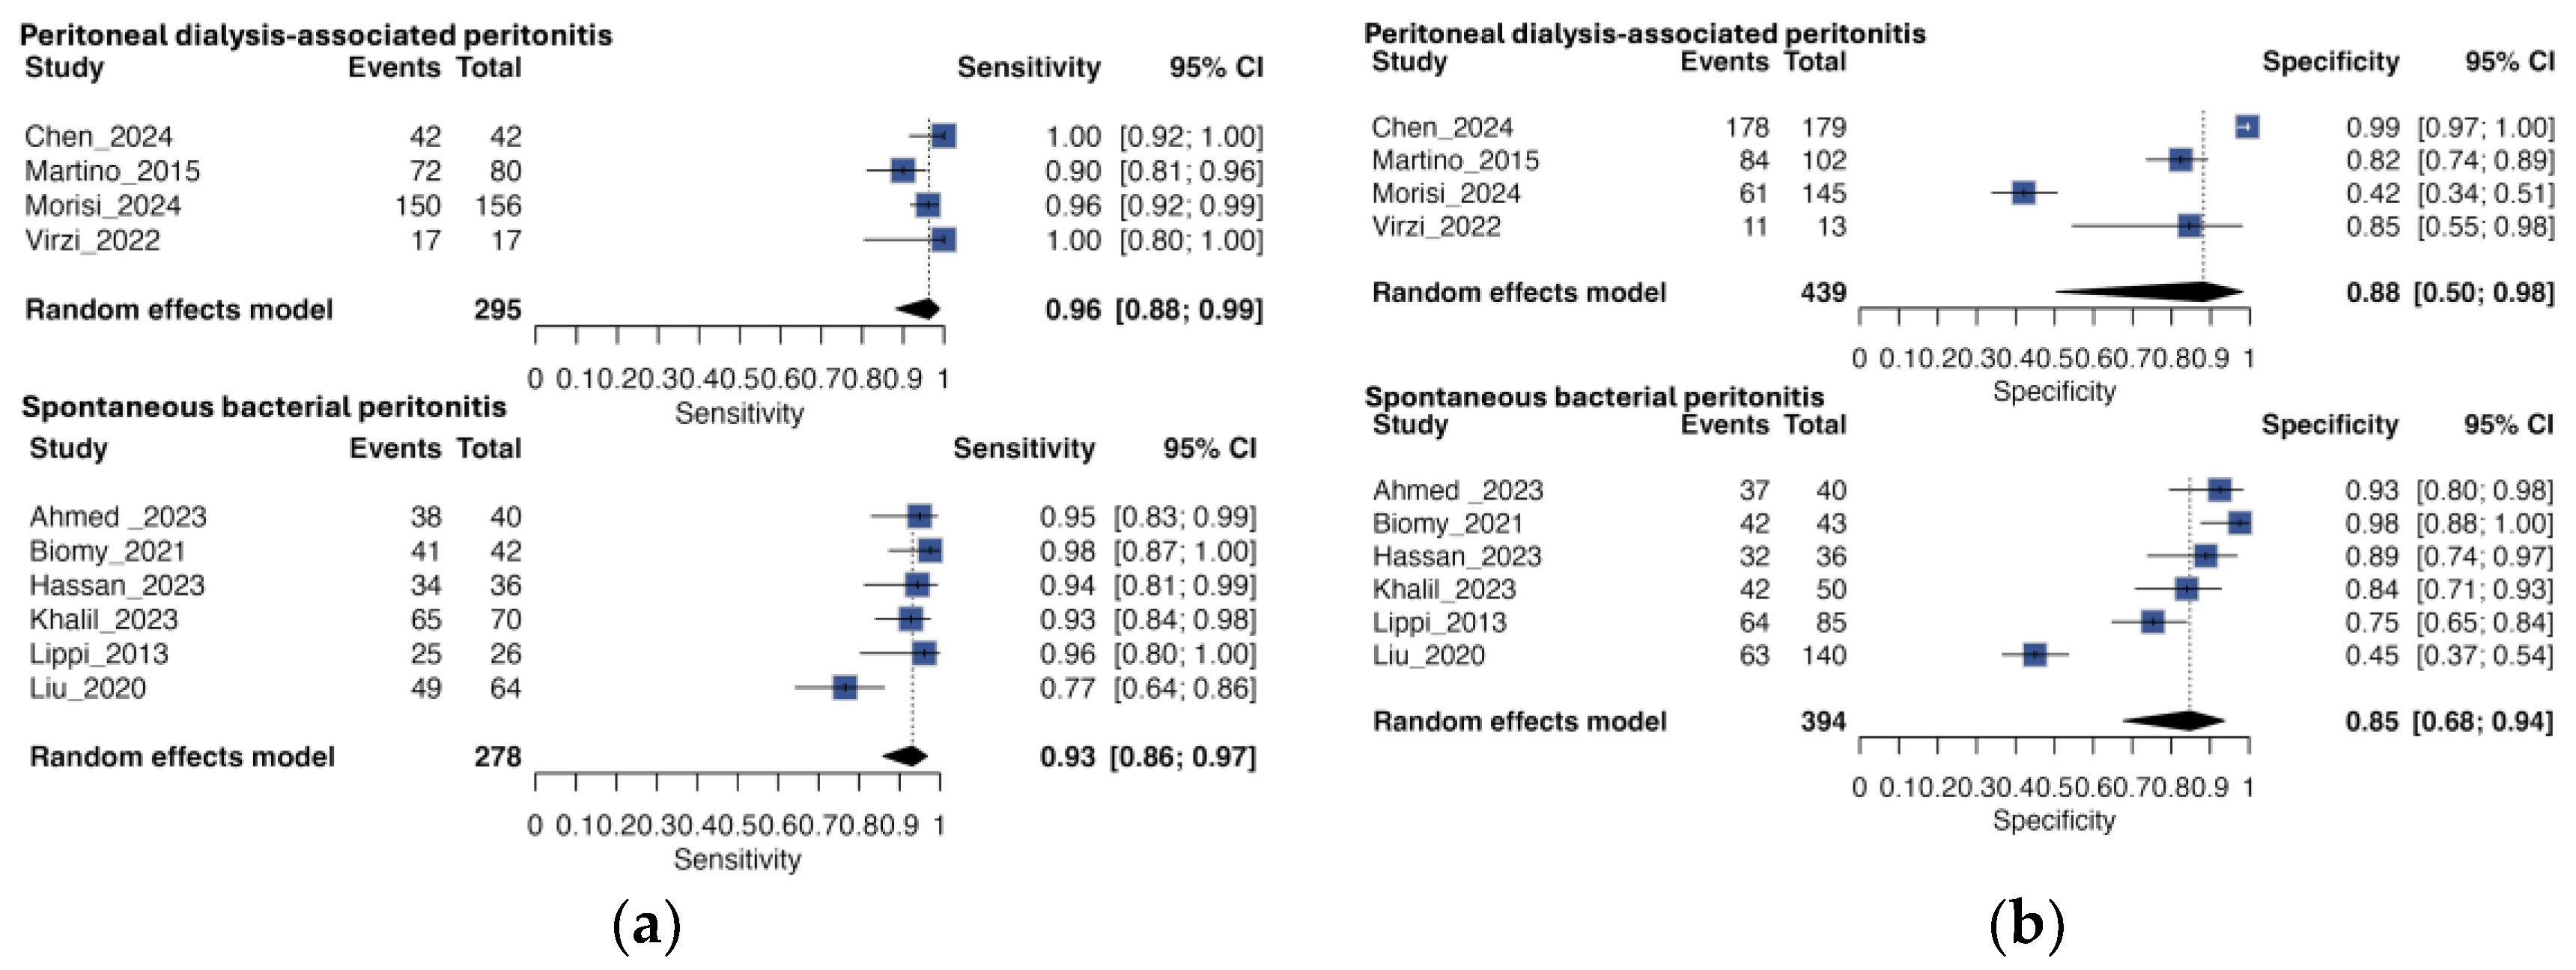
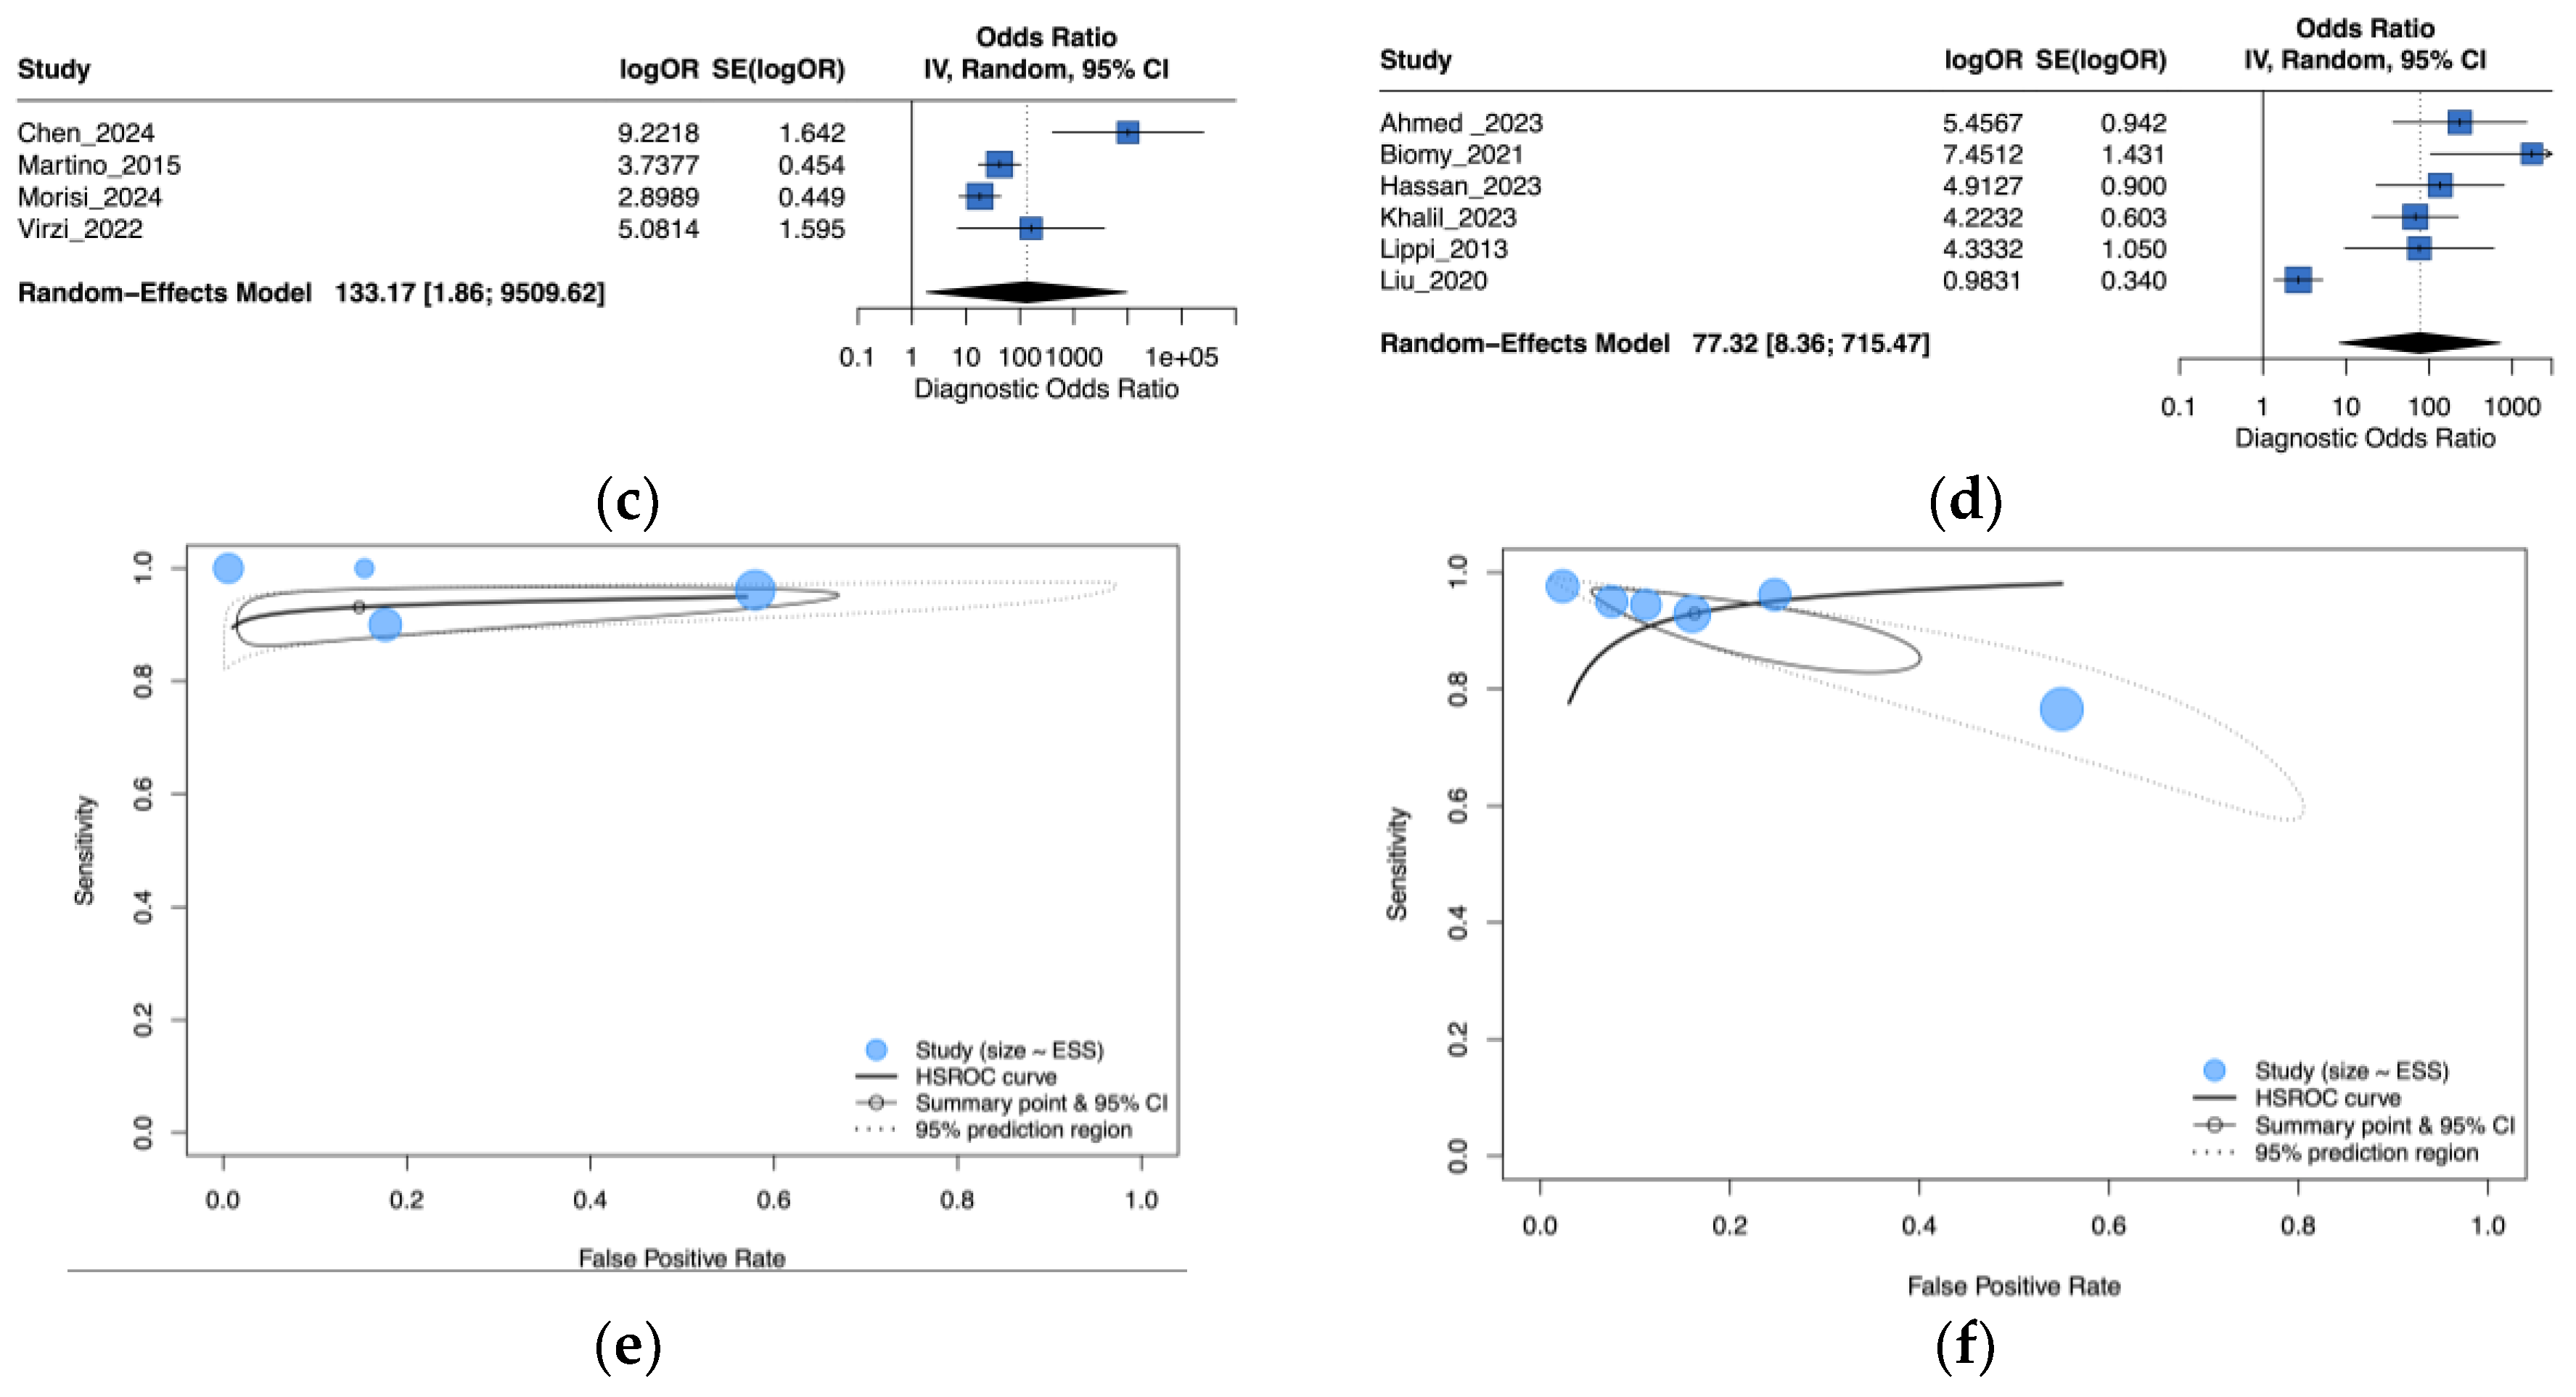
Figure 5.
Leave-One-Out sensitivity analysis of the pooled diagnostic odds ratio for NGAL in peritonitis diagnosis: (a) Peritoneal dialysis-associated peritonitis; (b) Spontaneous bacterial peritonitis.
Figure 5.
Leave-One-Out sensitivity analysis of the pooled diagnostic odds ratio for NGAL in peritonitis diagnosis: (a) Peritoneal dialysis-associated peritonitis; (b) Spontaneous bacterial peritonitis.
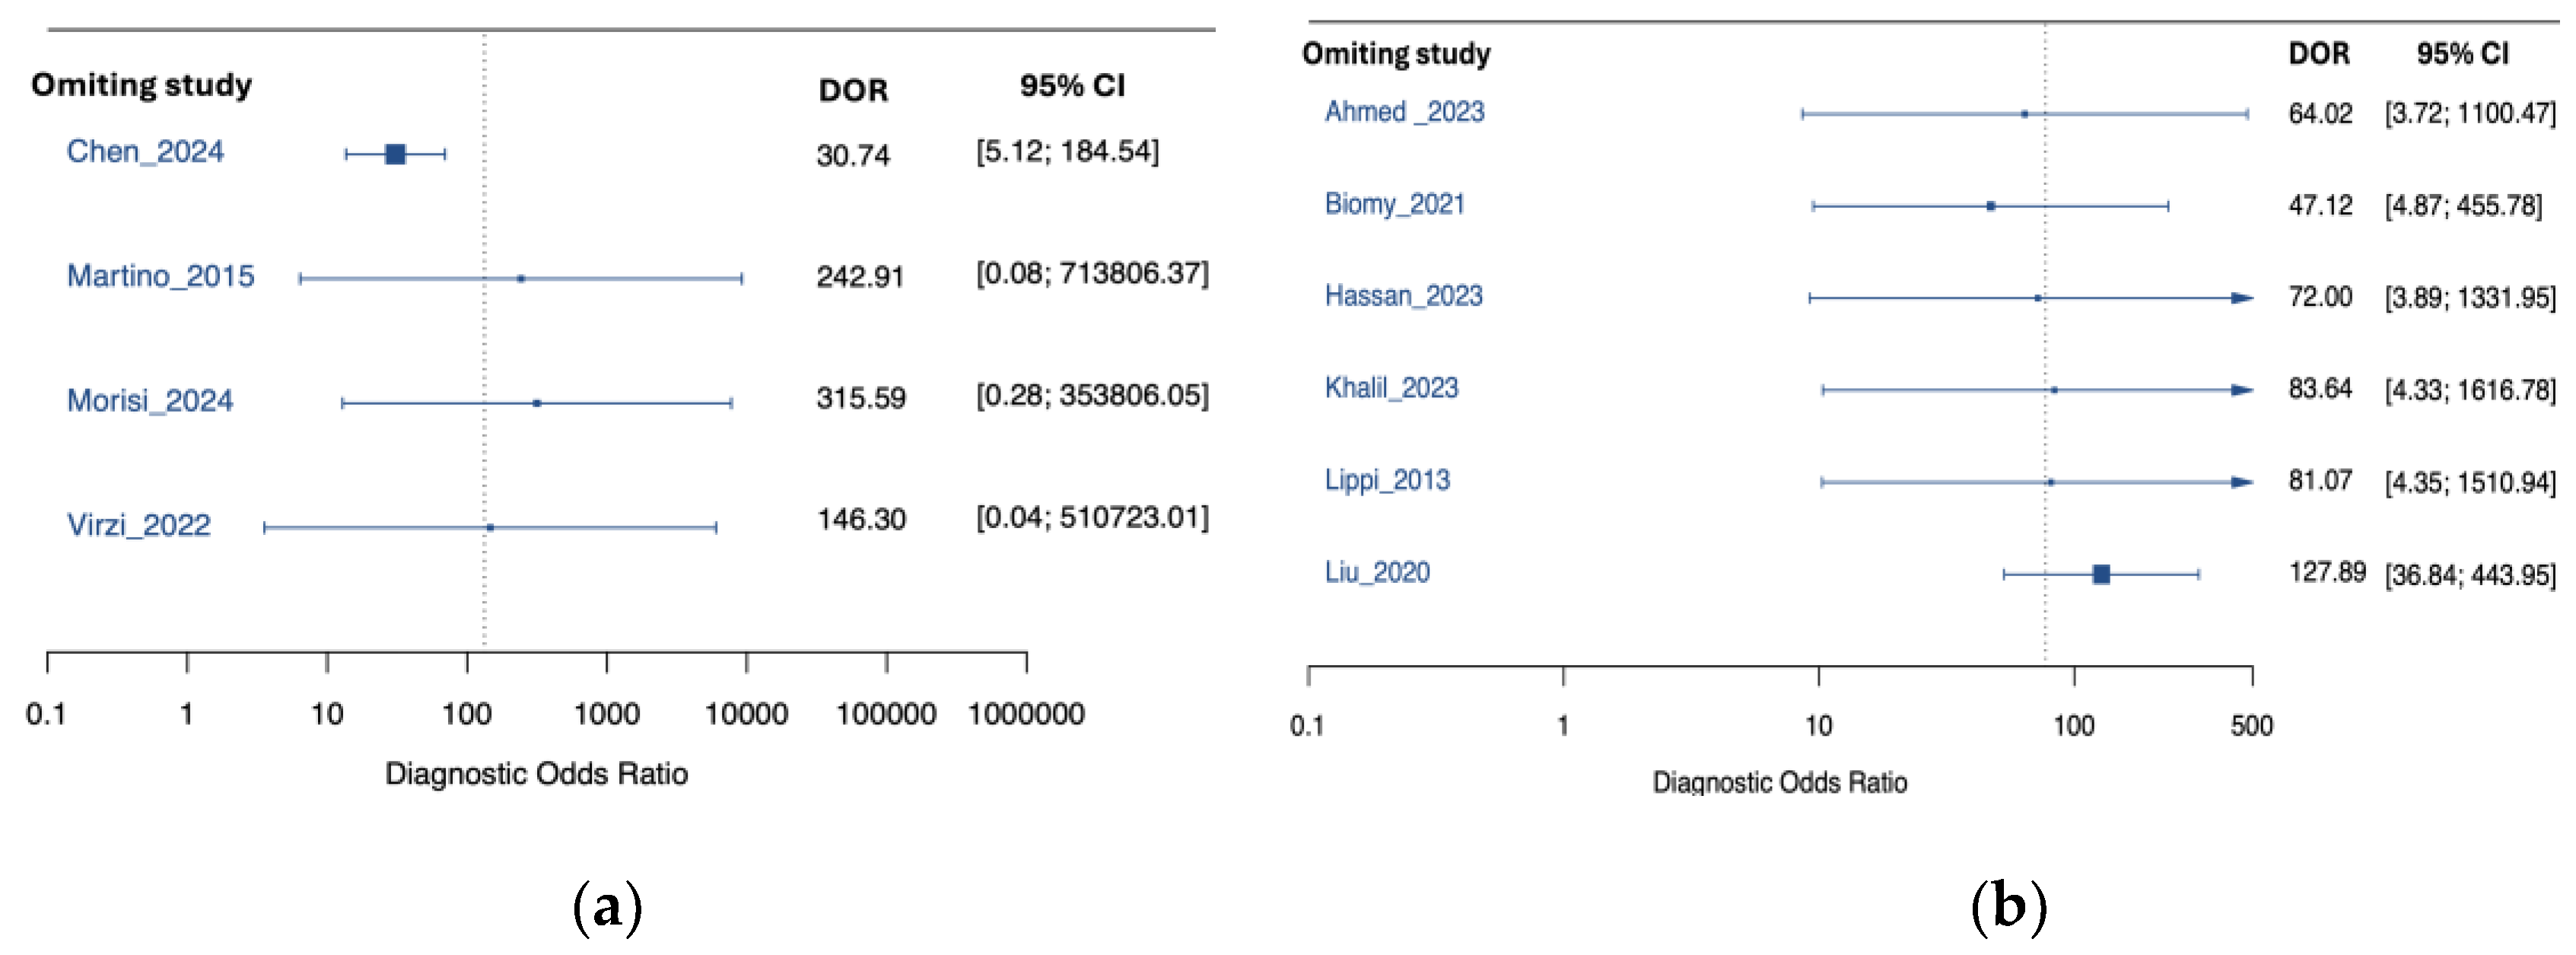
Figure 6.
Subgroup analysis of NGAL diagnostic performance by NGAL test type: (a) Forest plot of sensitivity by NGAL test type; (b) Forest plot of specificity by NGAL test type; (c) Forest plot of diagnostic odds ratio by NGAL test type; (d) Summary receiver operating characteristic (SROC) curves by NGAL test type.
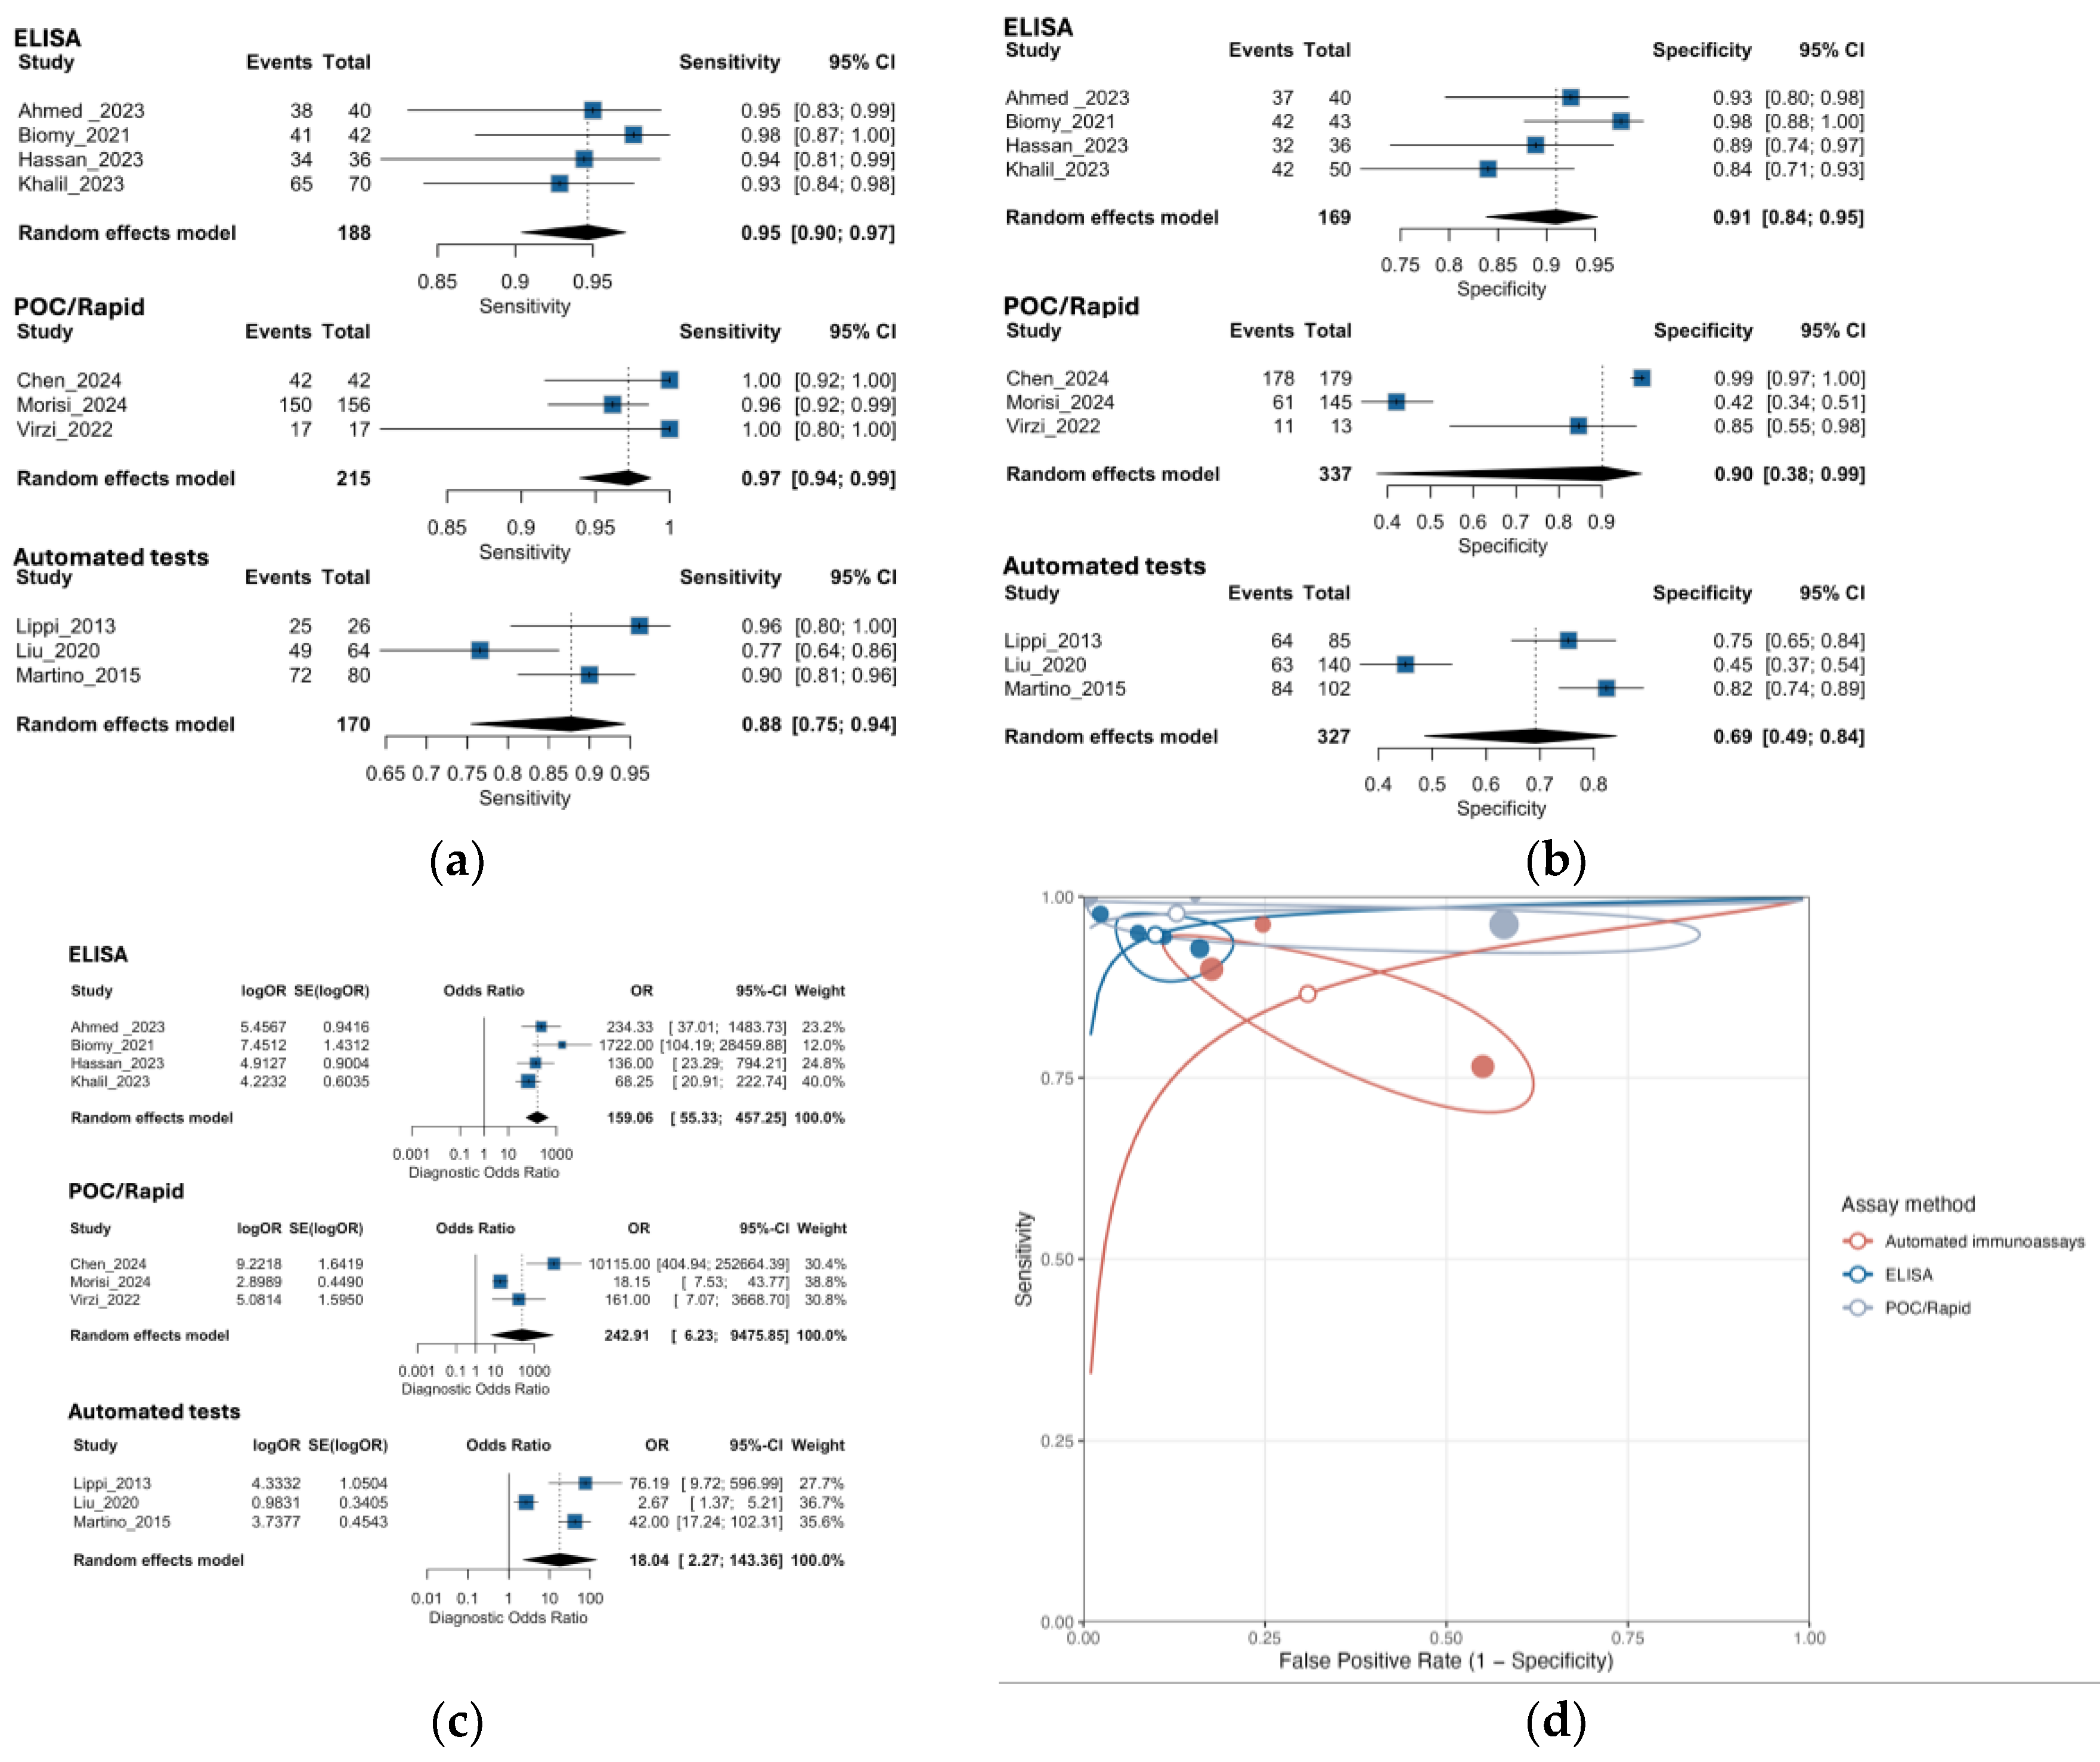
Figure 7.
Subgroup analysis of NGAL diagnostic performance by NGAL study sample size: (a) Forest plot of sensitivity by NGAL study sample size; (b) Forest plot of specificity by NGAL study sample size; (c) Forest plot of diagnostic odds ratio by NGAL study sample size; (d) Summary receiver operating characteristic curves by study sample size.
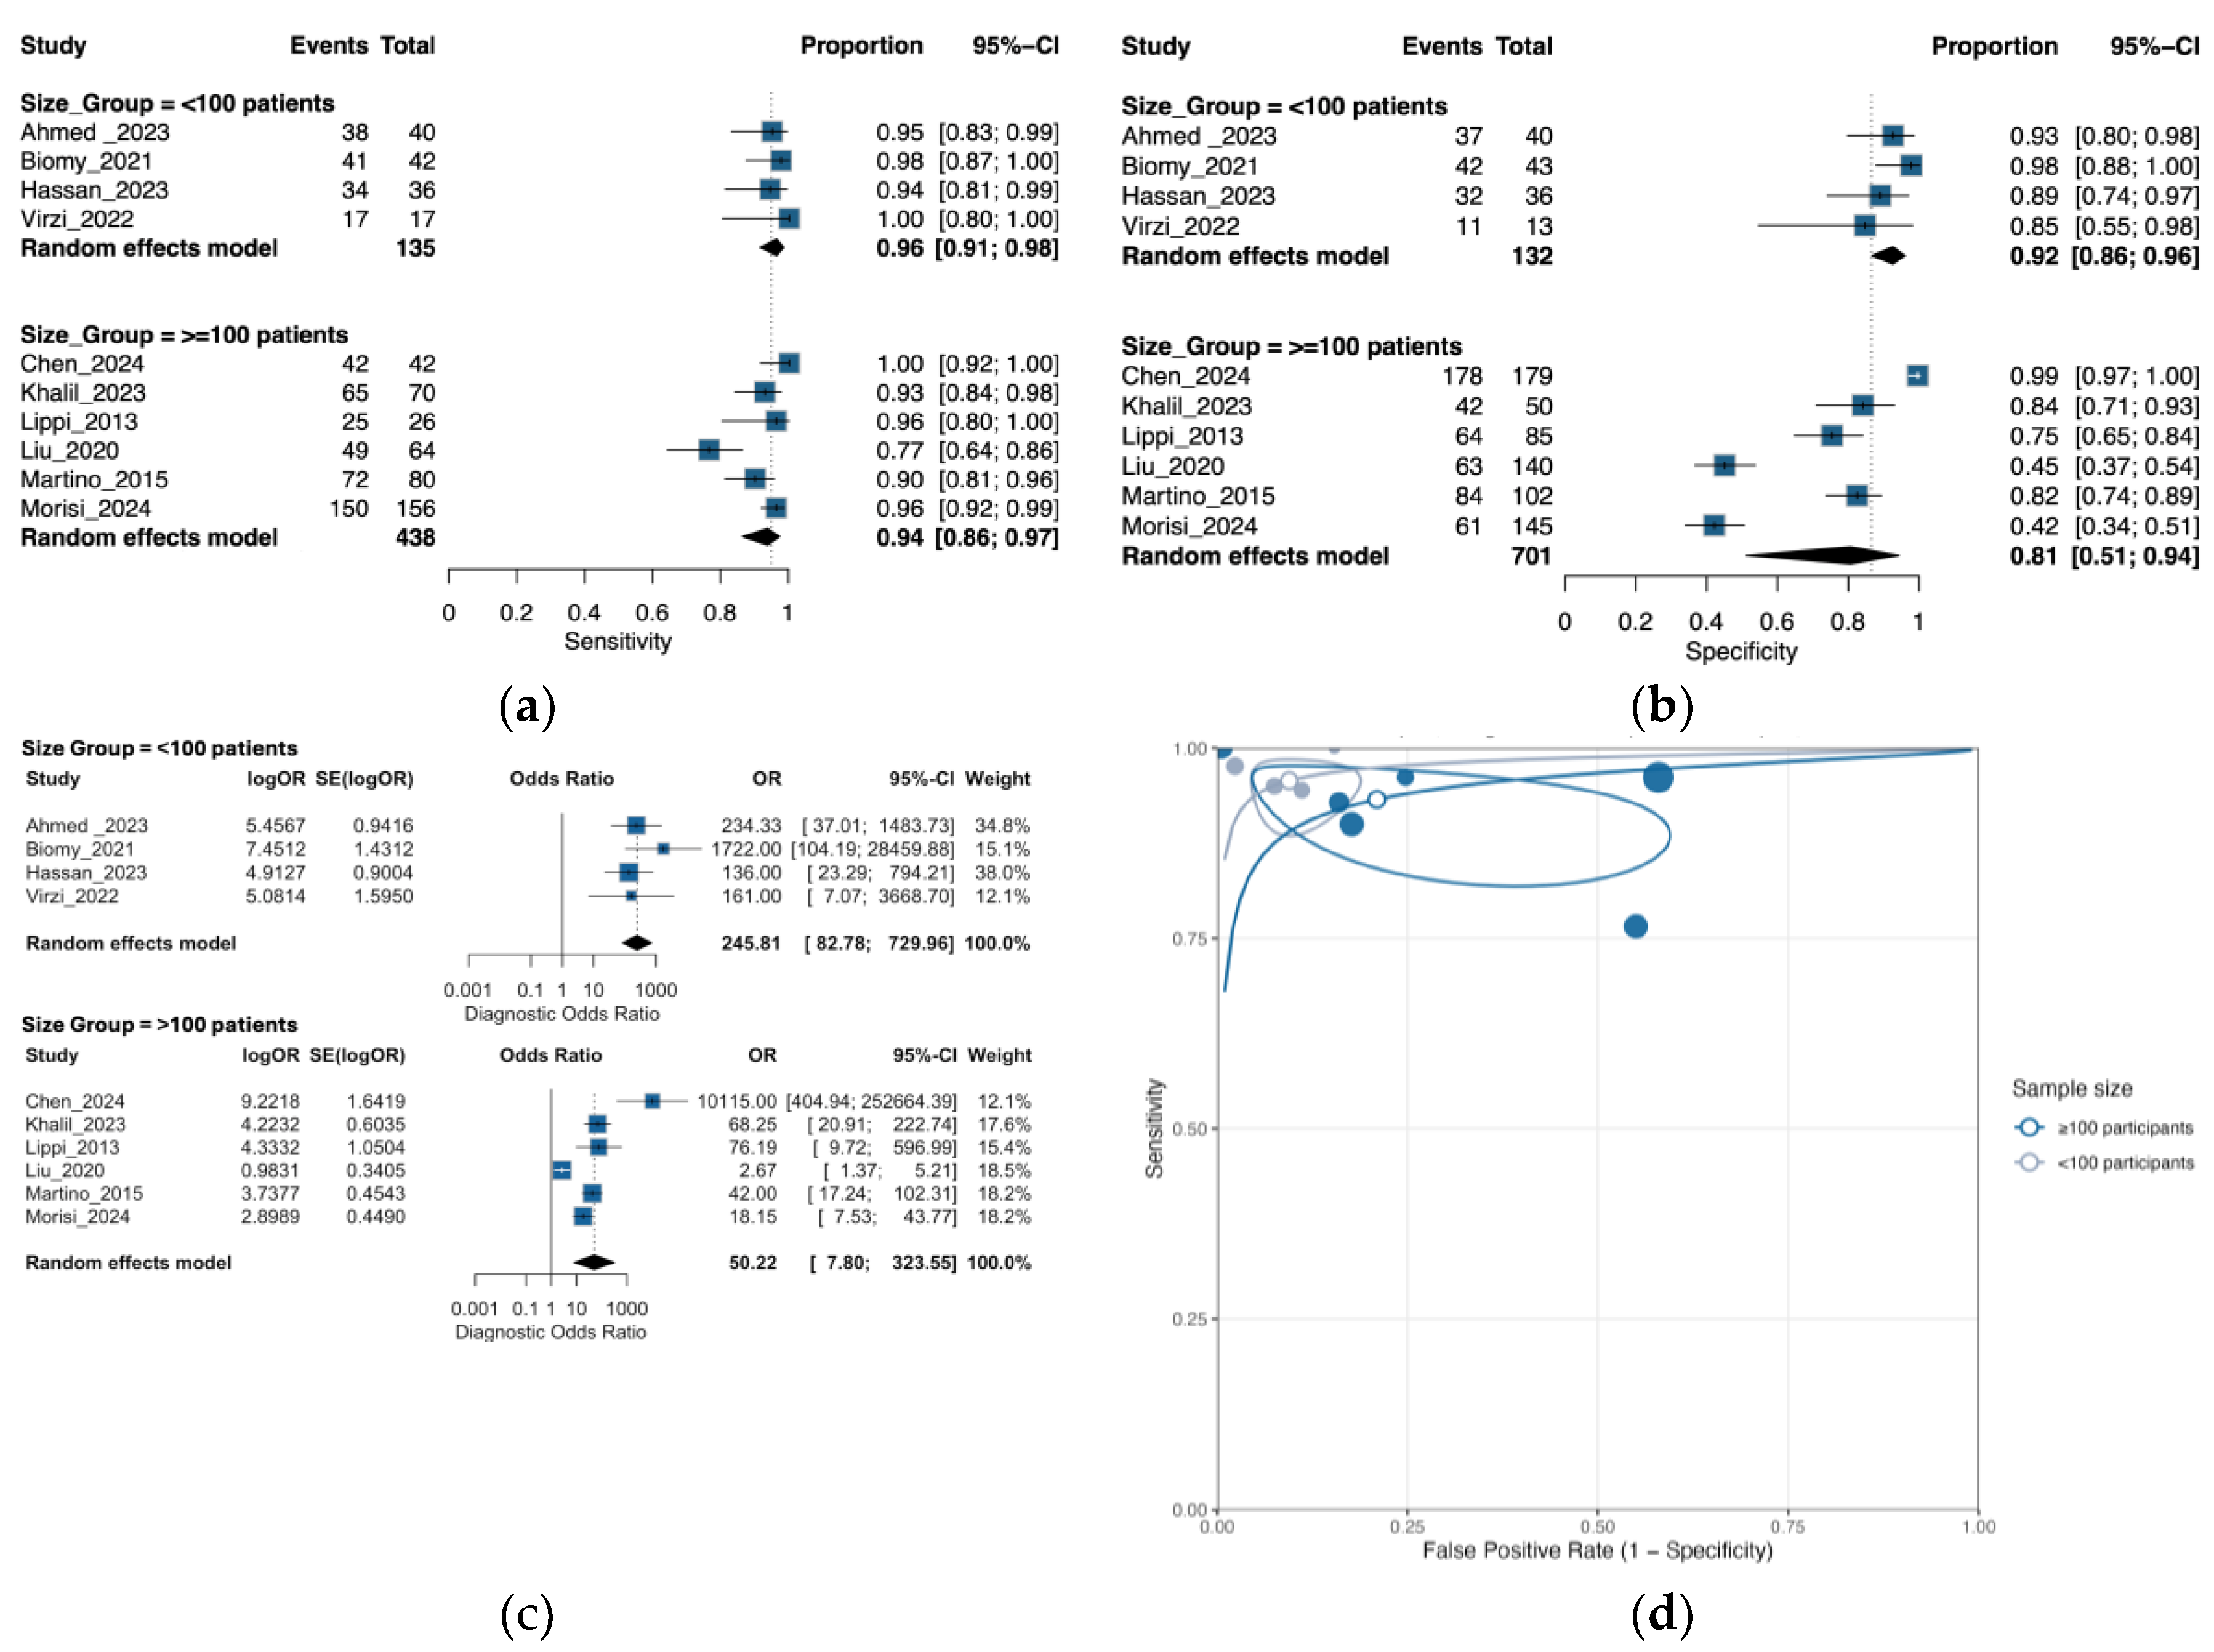
Figure 8.
Deeks’ funnel plots for ascitic/peritoneal NGAL. (a) All studies (slope test p = 0.003). (b) By assay method: automated immunoassays (p = 0.67), ELISA (p = 0.56), point-of-care tests (p = 0.73). (c) By platform: laboratory-based assays (p = 0.062) vs POC (p = 0.73). (d) By study size: <100 (p = 0.585) vs ≥100 participants (p = 0.46). Each panel regresses ln(DOR) on 1/√ESS; p values correspond to Deeks’ asymmetry test (lower p suggests small-study effects).
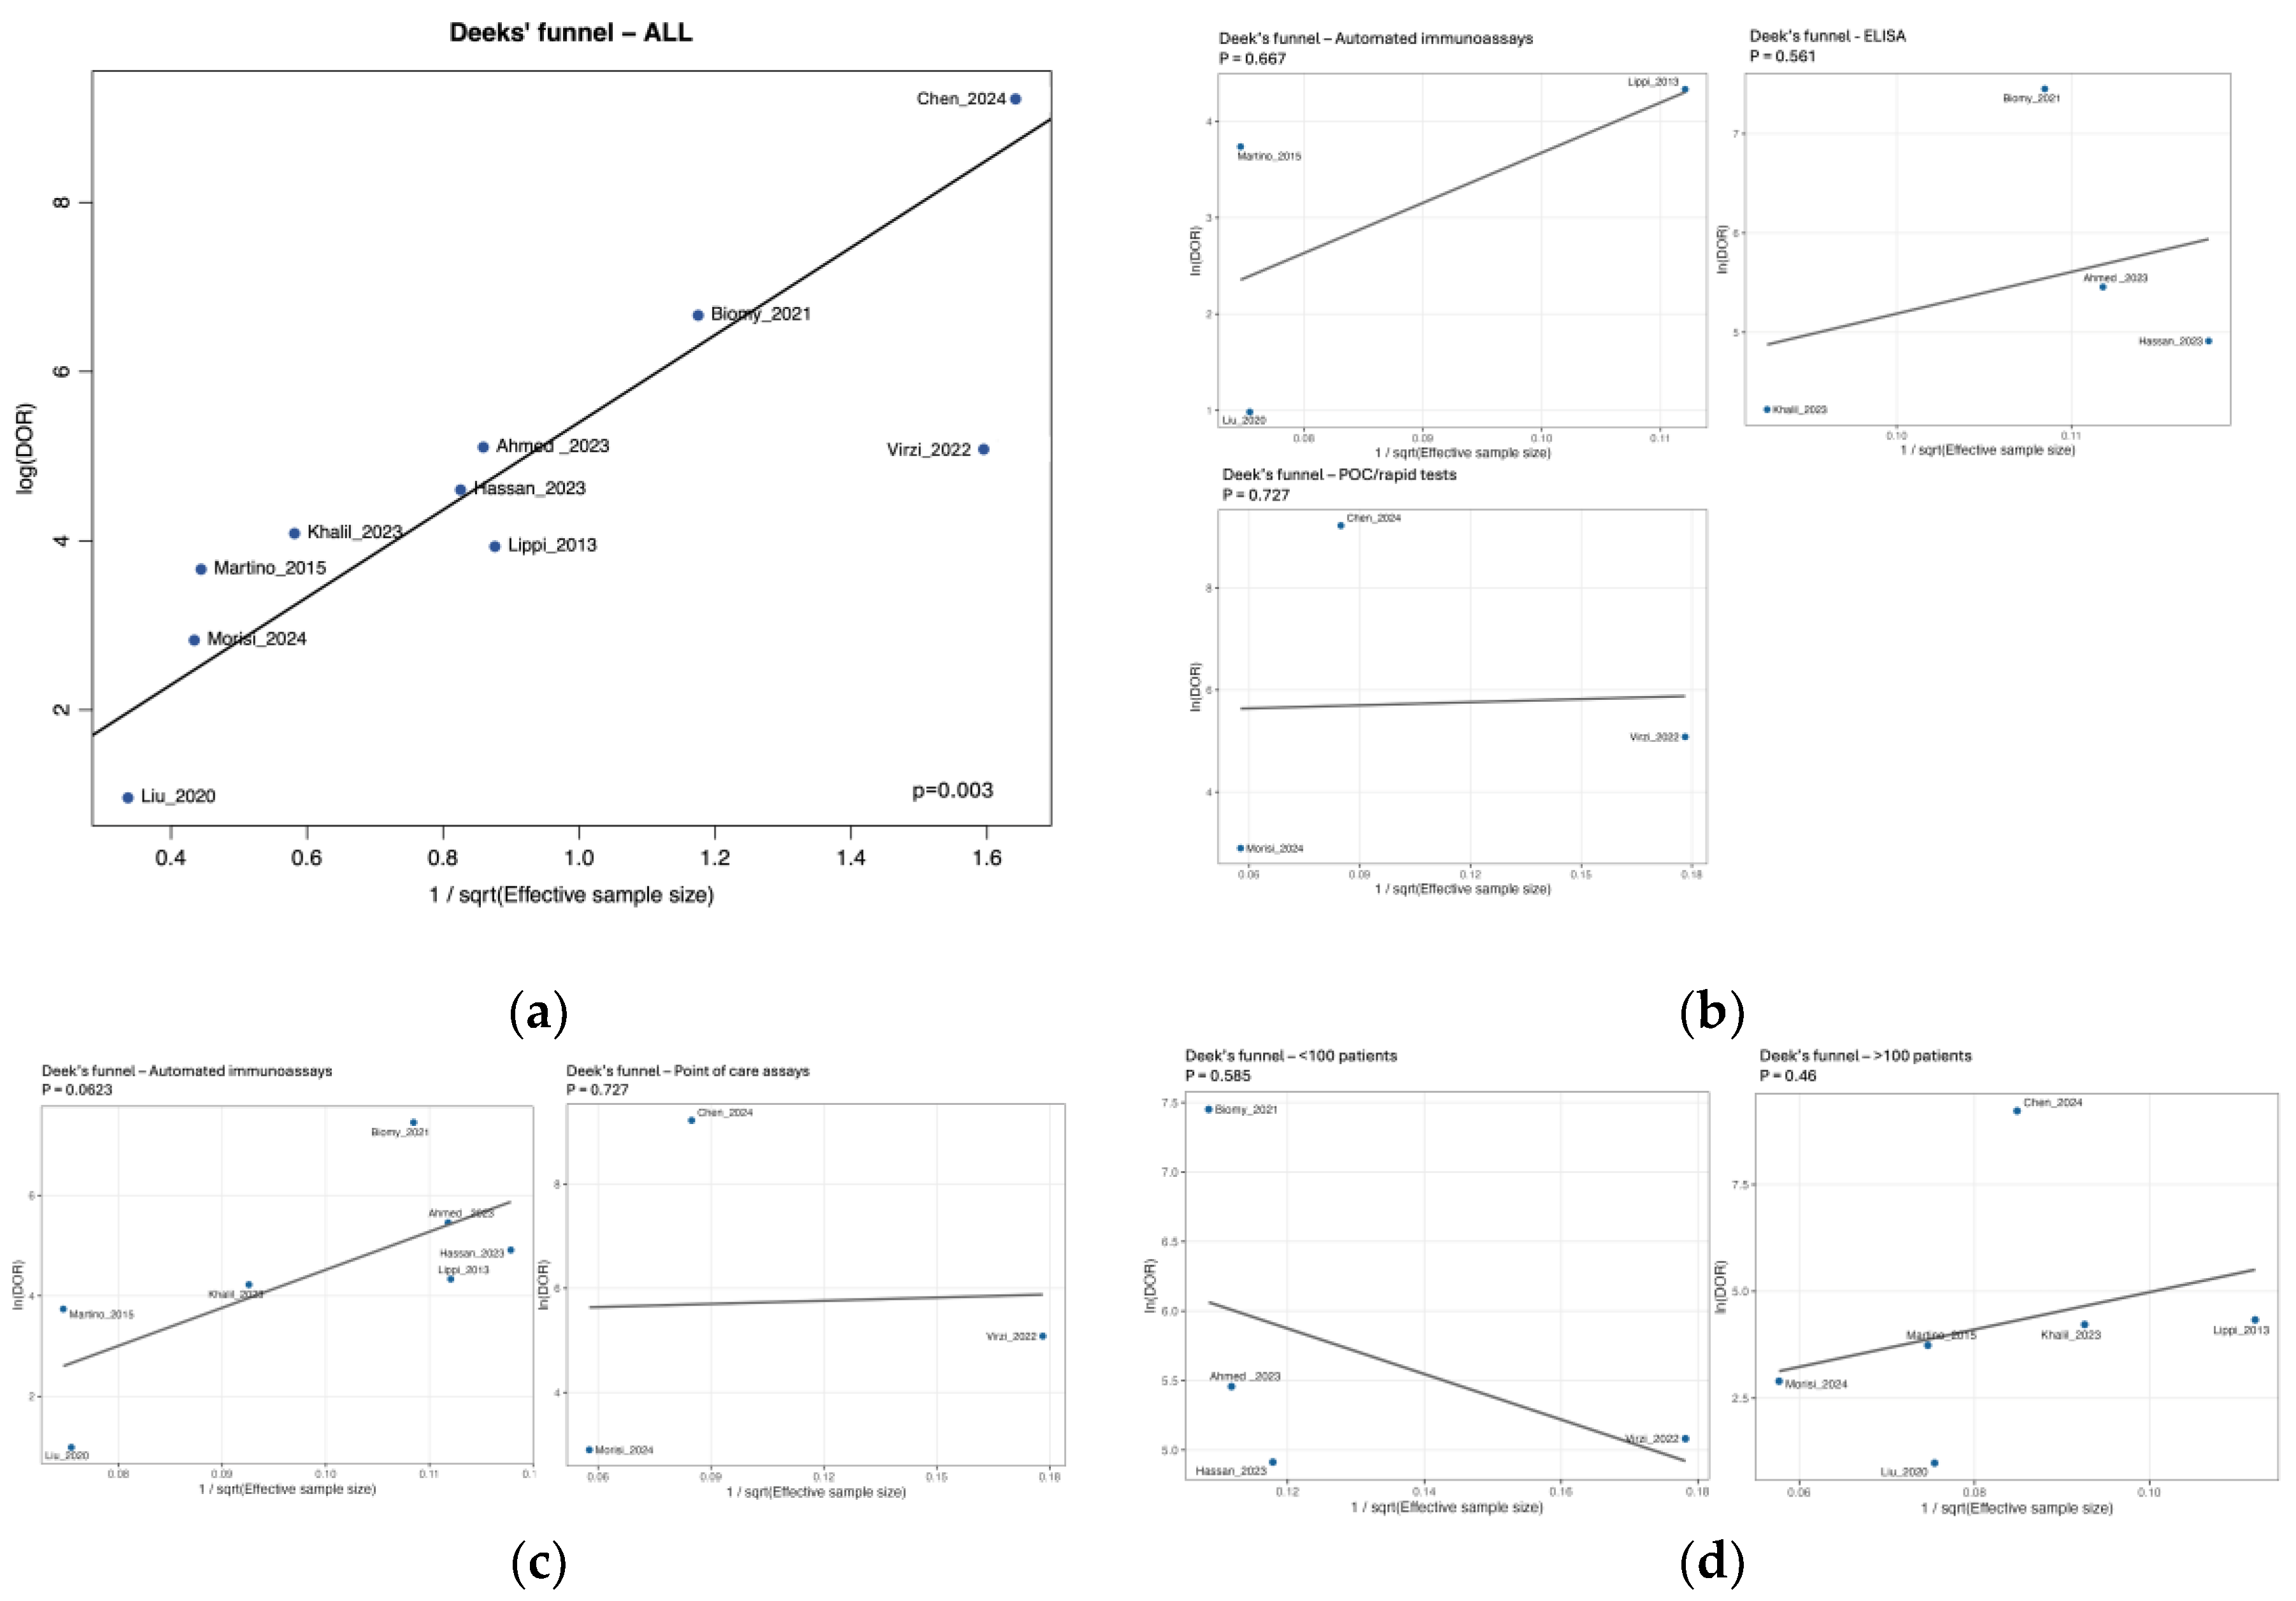

Table 1.
Database-specific search strategies for NGAL and peritonitis diagnostics.
| Database | Search strategy |
|---|---|
| PubMed / MEDLINE | ("neutrophil gelatinase-associated lipocalin"[Title/Abstract] OR "NGAL"[Title/Abstract] OR "lipocalin-2"[Title/Abstract]) AND ("peritoneal dialysis"[Title/Abstract] OR "dialysis effluent"[Title/Abstract] OR "peritoneal fluid"[Title/Abstract] OR "ascites"[Title/Abstract]) AND ("peritonitis"[Title/Abstract] OR "spontaneous bacterial peritonitis"[Title/Abstract] OR "secondary bacterial peritonitis"[Title/Abstract] OR "infection"[Title/Abstract]) |
| Embase | ('neutrophil gelatinase associated lipocalin':ab,ti OR 'NGAL':ab,ti OR 'lipocalin 2':ab,ti) AND ('peritoneal dialysis':ab,ti OR 'dialysis effluent':ab,ti OR 'peritoneal fluid':ab,ti OR 'ascites':ab,ti) AND ('peritonitis':ab,ti OR 'spontaneous bacterial peritonitis':ab,ti OR 'secondary bacterial peritonitis':ab,ti OR 'infection':ab,ti) |
| Cochrane Library | ("neutrophil gelatinase-associated lipocalin" OR NGAL OR "lipocalin-2") AND ("peritoneal dialysis" OR "dialysis effluent" OR "peritoneal fluid" OR "ascites") AND (peritonitis OR "spontaneous bacterial peritonitis" OR "secondary bacterial peritonitis" OR infection) |
| LILACS | ("neutrophil gelatinase-associated lipocalin" OR NGAL OR "lipocalin-2") AND ("diálisis peritoneal" OR "efluente peritoneal" OR "líquido peritoneal" OR ascitis) AND (peritonitis OR "peritonitis bacteriana espontánea" OR "peritonitis bacteriana secundaria" OR infección) |
| Scopus | TITLE-ABS-KEY("neutrophil gelatinase-associated lipocalin" OR NGAL OR "lipocalin-2") AND TITLE-ABS-KEY("peritoneal dialysis" OR "dialysis effluent" OR "peritoneal fluid" OR ascites) AND TITLE-ABS-KEY(peritonitis OR "spontaneous bacterial peritonitis" OR "secondary bacterial peritonitis" OR infection) |
| WoS | TS=("neutrophil gelatinase-associated lipocalin" OR NGAL OR "lipocalin-2") AND TS=("peritoneal dialysis" OR "dialysis effluent" OR "peritoneal fluid" OR ascites) AND TS=(peritonitis OR "spontaneous bacterial peritonitis" OR "secondary bacterial peritonitis" OR infection) |
1 Wos. Web of Science.
Table 2.
Characteristics of the included studies.
| Study (Author, Year, Location) |
Study design | Peritonitis type | Participant characteristics | NGAL measurement method | Diagnostic criteria for peritonitis |
Diagnostic performance metrics |
QUADAS-2 risk of bias |
|---|---|---|---|---|---|---|---|
| Ahmed et al., 2023 [30], Egypt | Case-cohort study with prospective follow-up | Spontaneous bacterial peritonitis | - Total number of participants: 80 Chronic liver disease patients with ascites - Mean/median age: SBP group: 60.6 ± 12.5 years; Non-SBP group: 57.8 ± 10.2 years - Gender distribution: SBP group: 55% male, 45% female; Non-SBP group: 60% male, 40% female - Specific inclusion criteria: Patients with chronic liver disease and ascites admitted to Internal Medicine Department - Specific exclusion criteria: Acute renal impairment, renal replacement therapy, secondary peritonitis, intra-abdominal surgery or malignancy |
- Type of assay: ELISA (SunRed Biotech) - Platform/format: ELISA (laboratory) - Manufacturer/kit: SunRed Biotech - Analyte/target: Total NGAL - Diagnostic cut-off (standardized): 297.8 ng/mL - Original reporting units: ng/mL (standardized to ng/mL) - Cut-off selection rule: reported |
- Neutrophil count threshold: PMN ≥ 250 cells/mm³- Microbiological confirmation method: Positive ascitic fluid culture for single organism- - Clinical criteria: Presence of clinical symptoms and signs - Additional diagnostic parameters: Exclusion of acute renal impairment, renal replacement therapy and secondary peritonitis |
- Sensitivity: 95.6% - Specificity: 92.5% - Positive Predictive Value: 95% - Negative Predictive Value: 95% - AUC: 0.845 - Accuracy: 95% |
Domain 1: Patient Selection: Patients were appropriately selected with defined inclusion/exclusion criteria. Domain 2: Index Test: Serum and ascitic Lipocalin-2 were measured by standardized ELISA, with diagnostic performance evaluated by ROC analysis. Domain 3: Reference Standard: SBP was diagnosed by PMN count and/or positive culture. Domain 4: Flow and Timing: Samples were collected at paracentesis, ensuring consistent timing. Overall risk: Moderate |
| Biomy et al., 2021 [31], Egypt | Cross-sectional study | Spontaneous bacterial peritonitis | - Total number of participants: 85 - Patient population: Cirrhosis patients with ascites - Mean age: SBP group: 61±7.81 years; Non-SBP group: 56.44±6.73 years - Gender distribution: SBP group: Male: 28 (66.67%), Female: 14 (22.2%); Non-SBP group: Male: 28 (65.12%), Female: 15 (34.88%) - Specific inclusion/exclusion criteria: Not reported |
- Type of assay: ELISA (Bioassay Science Laboratory E1719Hu) - Platform/format: ELISA (laboratory) - Manufacturer/kit: Bioassay Science Laboratory E1719Hu - Analyte/target: Total NGAL - Diagnostic cut-off (standardized): 100.8 ng/mL - Original reporting units: ng/dL (standardized to ng/mL) |
- Neutrophil count threshold: PMN >250 cells/mm³ - Microbiological confirmation method: Not specified - Clinical criteria: Abdominal pain, fever, GI bleeding - Additional diagnostic parameters: Ascitic fluid protein, glucose, albumin, SAAG |
- Sensitivity: 97.62% - Specificity: 97.67% - Positive predictive value: 97.62% - Negative predictive value: 97.67% - AUC: 0.974 |
Domain 1: Patient Selection: Cirrhotic ascites patients were included with comprehensive exclusion criteria to reduce bias. Domain 2: Index Test: Ascitic NGAL was determined using standardized ELISA, and ROC analysis was used to assess diagnostic efficiency. Domain 3: Reference Standard: SBP was diagnosed by ascitic fluid PMN count ≥250/mm3. Domain 4: Flow and Timing: Ascitic fluid samples were collected consistently for NGAL measurement in relation to SBP diagnosis. Overall risk: High |
| Chen et al., 2024 [32], China |
Multicenter prospective observational study | Peritoneal dialysis-associated peritonitis | - Total number of participants: 221- PD patients from 4 hospitals - Mean/median age: PDAP group: 57.8±13.9 years; Non-PDAP group: 51.2±12.9 years - Gender distribution: PDAP group: 59.5% male, 40.5% female; Non-PDAP group: 59.8% male, 40.2% female - Specific inclusion criteria: Age >18 years, continuous PD treatment ≥3 months - Specific exclusion criteria: Prior antibiotic use before sampling, unclear sample labeling, contaminated samples, repeat cases, red-colored PD effluent |
- Type of assay: Rapid immunochromatographic test - Specific kit or technology used: H-NGAL rapid test kit (Qingdao Hantang Biotechnology Co.)- NGAL measurement units: Qualitative (positive/negative) - Test formats: Cassette, strip, and pen types - Reading time: 10-15 minutes |
- ISPD criteria (at least 2 of):1) Clinical features: abdominal pain and/or cloudy PD effluent2) PD effluent WBC count >100/μl or >0.1×10⁹/L (dwell time ≥2h) or PMN >50%3) Positive PD effluent culture | - Sensitivity: 100% (95% CI 91.62%-100%) - Specificity: 99.44% (95% CI 96.90%-99.90%) - Accuracy: 99.55% (95% CI 97.48%-99.92%) - Positive Predictive Value: 97.67% (95% CI 87.94%-99.59%) - Negative Predictive Value: 100% (95% CI 97.89%-100%) - Kappa value: 0.985 (95% CI 0.956-1.000) |
Domain 1: Patient Selection: Patients were enrolled from multiple centers with clearly defined inclusion and exclusion criteria, ensuring a relevant sample. Domain 2: Index Test: The H-NGAL rapid test was performed by both professionals (blinded) and patients, using various formats to ensure robust evaluation. Domain 3: Reference Standard: PDAP diagnosis strictly adhered to international guidelines, utilizing a combination of clinical, cellular, and microbiological criteria. Domain 4: Flow and Timing: Samples were collected at the time of enrollment, and the rapid test results (10-15 minutes) allowed for timely diagnostic assessment. Overall risk: Moderate |
| Cullaro et al., 2017 [13], USA | Prospective cohort study | Spontaneous bacterial peritonitis | - Total number of participants: 146 - Hospitalized patients with cirrhosis and ascites - Mean/median age: SBP group: 56.6±9.62 years; Non-SBP group: 59.9±10.9 years - Gender distribution: SBP group: 55% male, 45% female; Non-SBP group: 56% male, 44% female- Specific inclusion criteria: Adult patients hospitalized with cirrhosis and ascites undergoing clinically indicated paracentesis - Specific exclusion criteria: Ascites due to non-cirrhotic causes, recent abdominal surgery, solid organ transplant recipients, documented colitis or enteritis |
- Type of assay: ELISA - Specific kit or technology used: AntibodyShop, Gentofte, Denmark - NGAL measurement units: ng/mL - Limit of detection: 0.5-4.0 ng/mL Diagnostic cut-off (standardized): 230.05 ng/mL - Original reporting units: ng/mL - Intra-assay variation: 2.1% (range 1.3-4.0) |
Neutrophil count threshold: ANC ≥250 cells/mm³ - Microbiological confirmation method: Blood, urine, or ascites cultures - Clinical criteria: Not specified- Additional diagnostic parameters: None |
- For SBP diagnosis: - c-statistic (AUC): 0.68 - For mortality prediction: Sensitivity: 73.3% (cutoff >221.3 ng/mL), Specificity: 71.2% (cutoff >221.3 ng/mL), AUC: 0.79 |
Domain 1: Patient Selection: Low risk - consecutive patients with clear inclusion/exclusion criteria Domain 2: Index Test: Low risk - ELISA performed with standardized protocol, blinded to reference standard Domain 3: Reference Standard: Low risk - ANC ≥250 cells/mm³ is standard criterion Domain 4: Flow and Timing: Low risk - samples collected on day of paracentesis Overall risk: Low |
| Hassan et al., 2023 [20], Egypt | Case-control study | Spontaneous bacterial peritonitis |
-Total number of participants: 72 - Patients with cirrhotic liver and ascites- Mean/median age: Not reported - Gender distribution: Not reported- Specific inclusion criteria: All patients diagnosed as cirrhotic based on clinical and laboratory tests with ascites caused by chronic liver illness - Specific exclusion criteria: Cirrhotic patients with HCC, peritonitis due to any cause other than SBP, portal hypertension and ascites from non-cirrhotic causes, liver or organ transplantation, renal diseases |
- Type of assay: ELISA - Specific kit or technology used: Human Lipocalin linked with Neutrophil Gelatinase Kit, Sun Red bio company, China - NGAL measurement units: ng/mL - Threshold values used for diagnosis: ≥230.05 ng/mL |
- Neutrophil count threshold: PMNL count ≥250/mm³ - Microbiological confirmation method: Positive fluid cultures with single organism culture isolation - Clinical criteria: Clinical presence of ascites, hepatic encephalopathy, jaundice or hematemesis and melena - Additional diagnostic parameters: Laboratory tests (CBC platelet <150000, liver function test albumin<3.5, INR >1.1) |
- Sensitivity: 94.4% - Specificity: 88.9% - Positive Predictive Value: 89.5% - Negative Predictive Value: 94.1% - AUC: 0.989- Accuracy: 91.7% |
Domain 1: Patient Selection: Moderate risk - case-control design with clear inclusion/exclusion criteria Domain 2: Index Test: Low risk - ELISA performed with standardized protocol Domain 3: Reference Standard: Low risk - PMNL count ≥250/mm³ and/or positive culture Domain 4: Flow and Timing: Low risk - samples collected at paracentesis Overall risk: Moderate |
| Khalil et al., 2023 [33], Egypt | Case-control study | Spontaneous bacterial peritonitis and Culture-negative neutrocytic ascites |
-Total number of participants: 150 - Cirrhotic patients divided into infected (n=100) and non-infected (n=50) - SBP subgroup: 55 patients- CNNA subgroup: 15 patients- UTI subgroup: 30 patients- Mean/median age: Not reported- Gender distribution: Not reported - Specific inclusion criteria: Patients aged ≥18 years with liver cirrhosis and ascites - Specific exclusion criteria: Antibiotic treated patients, renal failure, HCC, malignant ascites, septicemia, secondary bacterial peritonitis |
- Type of assay: ELISA (DRG GmbH) - Platform/format: ELISA (laboratory) - Manufacturer/kit: DRG GmbH - Analyte/target: Total NGAL - Diagnostic cut-off (standardized): 110.72 ng/mL - Original reporting units: ng/mL (standardized to ng/mL) - Cut-off selection rule: reported |
- Neutrophil count threshold: AF neutrophils count ≥250×10³ cells/μL - Microbiological confirmation method: Positive ascitic fluid culture for SBP; negative culture for CNNA - Clinical criteria: Clinical symptoms and signs - Additional diagnostic parameters: Mac-1 expression by flow cytometry |
- Sensitivity: 92.7% (CI: [0.82, 0.98]) - Specificity: 84% (CI: [0.75, 0.91]) - Positive Predictive Value: 0.77 (CI: [0.65, 0.86]) - Negative Predictive Value: 0.95 (CI: [0.88, 0.98]) - Area under the ROC curve (AUC): 0.899 (CI: [0.848, 0.951]) |
Domain 1: Patient Selection: Moderate risk - case-control design with clear inclusion/exclusion criteria Domain 2: Index Test: Low risk - ELISA and flow cytometry performed with standardized protocols Domain 3: Reference Standard: Low risk - standard criteria for SBP and CNNA Domain 4: Flow and Timing: Low risk - samples collected within 6h after paracentesis Overall risk: Moderate |
| Lippi et al., 2013 [21], Italy | Cross-sectional study | Bacterial peritonitis (various causes) | - Total number of participants: 111 - Patient population: Patients with new onset nonmalignant ascites - Mean/median age: Not reported - Gender distribution: Not reported - Specific inclusion criteria: Consecutive peritoneal fluids from patients with new onset nonmalignant ascites - Specific exclusion criteria: Visible clots in samples (7 samples excluded) |
- Type of assay: Automated NGAL Test™ (BioPorto Diagnostics A/S) on Beckman Coulter AU5822 - Platform/format: Immunoturbidimetric (laboratory) - Manufacturer/kit: BioPorto Diagnostics A/S - Analyte/target: Total NGAL - Diagnostic cut-off (standardized): 120.0 ng/mL |
- Neutrophil count threshold: PMN ≥250/μL - Microbiological confirmation method: Not used (68% on antibiotics) - Clinical criteria: New onset nonmalignant ascites - Additional diagnostic parameters: LDH, proteins, glucose |
- Sensitivity: 96% (95% CI: 80-100%) - Specificity: 75% (95% CI: 65-84%) - Positive Predictive Value: Not reported - Negative Predictive Value: Not reported - AUC: 0.89 (95% CI: 0.82-0.95) - Accuracy: Not reported |
Domain 1: Patient Selection: Low risk - consecutive patients with defined criteria Domain 2: Index Test: Low risk - predefined threshold, automated assay Domain 3: Reference Standard: Moderate risk - PMN count used instead of culture due to antibiotic use Domain 4: Flow and Timing: Low risk - all samples analyzed similarly Overall risk: Moderate |
| Liu et al., 2020 [22], China | Prospective cohort | Spontaneous bacterial peritonitis |
-Total number of participants: 204 decompensated liver cirrhosis patients with ascites - Mean/median age: Non-SBP group: 57.31 ± 12.91 years; SBP group: 59.64 ± 11.95 years - Gender distribution: Non-SBP group: 65.7% male, 34.3% female; SBP group: 76.6% male, 23.4% female - Specific inclusion criteria: Consecutive hospitalized patients with decompensated liver cirrhosis and ascites - Specific exclusion criteria: Pre-existing renal disease, presence of AKI at hospitalization, renal replacement therapy, secondary peritonitis, malignant diseases |
- Type of assay: Latex-enhanced immunoturbidimetric (BSBE) - Platform/format: Immunoturbidimetric (laboratory) - Manufacturer/kit: BSBE - Analyte/target: Total NGAL - Diagnostic cut-off (standardized): 108.95 ng/mL |
- Neutrophil count threshold: PMN ≥ 250 cells/mm³ and/or positive ascitic fluid culture - Microbiological confirmation method: Ascitic fluid culture (positive in 9 patients: 7 E. coli, 2 K. pneumoniae) - Clinical criteria: Clinical and biological diagnosis of decompensated liver cirrhosis |
- Sensitivity: 76.9% (for mortality prediction) - Specificity: 45.1% (for mortality prediction) - Positive Predictive Value: Not reported - Negative Predictive Value: Not reported - AUC: 0.702 (for mortality prediction in SBP patients) - Accuracy: Not reported |
Domain 1: Patient Selection: Consecutive patients with well-defined inclusion/exclusion criteria. Domain 2: Index Test: Ascitic NGAL measured by standardized latex-enhanced immunoturbidimetric method, with ROC analysis for diagnostic performance. Domain 3: Reference Standard: SBP diagnosed by PMN ≥ 250 cells/mm³ and/or positive ascitic fluid culture. Domain 4: Flow and Timing: Ascitic samples collected at paracentesis with consistent timing for all patients. Overall risk: Low |
| Martino F. et al., 2012 [34], Italy | Case–control study | Peritoneal dialysis-associated peritonitis | - Total number of participants: 60 (30 cases, 30 controls) - Patient population: PD patients on treatment >3 months- Mean/median age: Cases: 66.5 years (IQR 52.2-73); Controls: 70 years (IQR 59.7-73.2) - Gender distribution: Cases: 73.3% male; Controls: 73.3% male - Specific inclusion criteria: PD patients >3 months with signs/symptoms of peritonitis (cases) or routine visit (controls) - Specific exclusion criteria: Not reported |
Type of assay: Chemiluminescent microparticle immunoassay - Specific kit or technology used: Architect platform (Abbott Diagnostics) - NGAL measurement units: ng/mL - Threshold values used for diagnosis: Not specified (ROC analysis performed) |
ISPD guidelines: Cloudy peritoneal effluent with WBC > 100 × 10^6 cells/L (after ≥ 2 h dwell) with > 50% PMNs, abdominal pain and/or positive culture or Gram stain | - Sensitivity: Not reported- Specificity: Not reported- Positive Predictive Value: Not reported- Negative Predictive Value: Not reported -AUC peritoneal NGAL 0.99 (p < 0.001);AUC CRP 0.81 (p = 0.001), PCT 0.70 (p = 0.039), WBC 1.00 (p < 0.001) |
Domain 1: Patient Selection: Low risk - consecutive cases and matched controls Domain 2: Index Test: Unclear risk - no predefined threshold reported Domain 3: Reference Standard: Low risk - standard ISPD criteria used Domain 4: Flow and Timing: Low risk - appropriate sample collection Overall risk: Moderate |
| Martino et al., 2015 [23], Italy | Case-control study | Peritoneal dialysis-associated peritonitis | - Total number of participants: 182 (91 cases, 91 controls) - Patient population: PD patients on treatment ≥90 days - Mean/median age: Peritonitis: 65 years (IQR 53.7-73.7); No peritonitis: 66.5 years (IQR 53.25-78)- Gender distribution: Peritonitis: 77.5% male; No peritonitis: 71.6% male- Specific inclusion criteria: Age >18 years, PD treatment ≥90 days, informed consent - Specific exclusion criteria: Peritonitis episode within 30 days before enrollment |
- Type of assay: Chemiluminescent microparticle immunoassay - Specific kit or technology used: Architect platform (Abbott Diagnostics) - NGAL measurement units: ng/mL - Threshold values used for diagnosis: 85 ng/mL |
- Neutrophil count threshold: WBC > 100 cells/mm^3 (with at least 50% polymorphonuclear cells) - Microbiological confirmation method: Positive culture or Gram stain - Clinical criteria: Clinical signs and symptoms of peritoneal inflammation (pain, discomfort, nausea/vomiting, diarrhea, or constipation) - Additional diagnostic parameters: Cloudy drainage |
- Sensitivity: 90% - Specificity: 82% - Positive predictive value: Not reported - Negative predictive value: Not reported - Area under the ROC curve (AUC): 0.936 - Accuracy: Not reported |
Domain 1: Patient Selection: Low risk - consecutive enrollment with clear criteria Domain 2: Index Test: Low risk - ROC-determined threshold, blinded analysis Domain 3: Reference Standard: Low risk - standard ISPD criteria Domain 4: Flow and Timing: Low risk - appropriate sample collection Overall risk: Low. |
| Morisi et al., 2024 [35], Italy | Retrospective analysis with cross-sectional elements | Peritoneal dialysis-associated peritonitis | - Total number of participants: 301 peritoneal effluent samples - Patient population: PD patients (stable and with suspected/confirmed peritonitis) - Mean/median age: Not reported- Gender distribution: Not reported - Specific inclusion criteria: PD patients undergoing routine analysis or with suspected/confirmed peritonitis - Specific exclusion criteria: Not reported |
- Type of assay: Dipstick (NGALds) vs turbidimetric (NGALlab) - Platform/format: POC rapid (dipstick/lateral flow) - Manufacturer/kit: NGALds - Analyte/target: Total NGAL - Diagnostic cut-off (standardized): 100.0 ng/mL - Original reporting units: µg/L (standardized to ng/mL) |
- Neutrophil count threshold: White cell count and percentage of neutrophils (specific thresholds not reported) - Microbiological confirmation method: Not specified - Clinical criteria: ISPD criteria- Additional diagnostic parameters: NGALlab used as comparator |
- Sensitivity: 96% - Specificity: Not reported - Positive predictive value: 0.64 - Negative predictive value: 0.87 - Area under the ROC curve (AUC): 0.82 |
Domain 1: Patient Selection: Unclear risk - retrospective design, selection criteria not fully described Domain 2: Index Test: Low risk - threshold determined by statistical analysis Domain 3: Reference Standard: Unclear risk - reference standard not fully described Domain 4: Flow and Timing: Low risk - parallel testing performed Overall risk: Moderate |
| Virzì et al., 2022 [36], Vicenza,Italy | Observational, case–control study | Dialysis associated peritonitis | - Total number of participants = 30 PD patients (17 with peritonitis; 13 controls) - Age ≥ 18 years; on PD ≥ 30 days; informed consent - PD modality: 7 CAPD, 23 APD; treatment duration median 32.7 mo (IQR 11–49; range 1–88 mo) - Comorbidities: 9/30 diabetes; 30/30 hypertension; 12/30 CVD; none immunosuppressed; 86.6% on erythropoietin |
Laboratory-based NGAL: particle-enhanced turbidimetric immunoassay (BioPorto Diagnostics; range 50–3000 ng/mL; ≥ 200 ng/mL indicative of peritonitis). Point-of-care NGAL (NGALds): lateral-flow dipstick (BioPorto Diagnostics), semi-quantitative colour categories 25–600 ng/mL; read by two blinded operators |
ISPD guidelines: Cloudy peritoneal effluent with WBC > 100 × 10^6 cells/L (after ≥ 2 h dwell) with > 50% PMNs, abdominal pain and/or positive culture or Gram stain | Spearman’s ρ between NGALds and lab NGAL = 0.88 (p < 0.01), Spearman’s ρ between NGALds and effluent WCC = 0.82 (p < 0.01), Inter-operator reproducibility: ρ = 0.847 (p < 0.001), κ = 0.786 (p < 0.001). All peritonitis cases had NGALds ≥ 300 ng/mL (proposed cutoff) No formal sensitivity/specificity or AUC reported (preliminary study) | Domain 1: Patient selection: clear inclusion/exclusion; consecutive enrolment Domain 2: Index test: blinded operators; pre-specified cutoffs Domain 3: Reference standard: ISPD criteria with culture/WCC -Flow & timing: concurrent sampling for cases/controls Domain 4: Interpretation: objective readouts (dipstick categories; immunoassay thresholds) Overall risk: High |
| Virzì et al., 2024 [37], Italy | Retrospective analysis | Peritoneal dialysis-associated peritonitis | - Total number of participants: 301 peritoneal effluent samples - Patient population: PD patients (healthy during routine analysis and with suspected/confirmed peritonitis) - Mean/median age: Not reported - Gender distribution: Not reported - Specific inclusion criteria: PD patients undergoing routine analysis or with suspected/confirmed peritonitis - Specific exclusion criteria: Not reported |
Type of assay: Two methods compared: NGALlab: BioPorto test (particle-enhanced turbidimetric immunoassay) NGALds: Rapid semi-quantitative colorimetric dipstick test - Specific kit or technology used: Antibody sandwich lateral flow dipstick test- NGAL measurement units: μg/L - Threshold values used for diagnosis: >100 μg/L for peritonitis diagnosis- Dipstick categories: 25, 50, 100, 150, 300, 600 μg/L |
Diagnosed by ISPD criteria for peritonitis | - Spearman’s Rs = 0.876 (p = 10⁻⁹⁶) - Sensitivity: 96 % (150/156) - Specificity, PPV, NPV, AUC: not reported |
- Domain 1: Patient Selection - Low risk (parallel samples from both healthy and peritonitis patients) - Domain 2: Index Test - Low risk (NGALds compared to established NGALlab) - Domain 3: Reference Standard - Low risk (NGALlab as reference) - Domain 4: Flow and Timing - Low risk (retrospective analysis with parallel samples) Overall risk: Moderate |
ANC, Absolute Neutrophil Count; APD, Automated Peritoneal Dialysis; AUC, Area Under the Curve; CAPD, Continuous Ambulatory Peritoneal Dialysis; CBC, Complete Blood Count; CI, Confidence Interval; CNNA, Culture-Negative Neutrocytic Ascites; CRP, C-Reactive Protein; CVD, Cardiovascular Disease; ELISA, Enzyme-Linked Immunosorbent Assay; GI, Gastrointestinal; HCC, Hepatocellular Carcinoma; INR, International Normalized Ratio; IRB, Institutional Review Board; ISPD, International Society for Peritoneal Dialysis; LDH, Lactate Dehydrogenase; NGAL, Neutrophil Gelatinase-Associated Lipocalin; NGALds, NGAL Dipstick Test; NGALlab, Laboratory-based NGAL Test; NPV, Negative Predictive Value; PCT, Procalcitonin; PD, Peritoneal Dialysis; PDAP, Peritoneal Dialysis-Associated Peritonitis; PMN, Polymorphonuclear Neutrophils; PMNL, Polymorphonuclear Leukocytes; PPV, Positive Predictive Value; QUADAS-2, Quality Assessment of Diagnostic Accuracy Studies-2; ROC, Receiver Operating Characteristic; SAAG, Serum-Ascites Albumin Gradient; Ascites Serum; SBP, Spontaneous Bacterial Peritonitis; UTI, Urinary Tract Infection; WBC, White Blood Cell; WCC, White Cell Coun.
Table 3.
Summary of GRADE–DTA Domains and Overall Certainty for Studies on NGAL as a Diagnostic Biomarker in Peritoneal Effluent and Ascitic Fluid.
Table 3.
Summary of GRADE–DTA Domains and Overall Certainty for Studies on NGAL as a Diagnostic Biomarker in Peritoneal Effluent and Ascitic Fluid.
| Study (year) | Risk of bias | Inconsistency | Indirectness | Imprecision | Publication bias | Overall certainty |
|---|---|---|---|---|---|---|
| Ahmed et al., 2023 | Moderate | Not serious | Not serious | Serious | Undetected | Moderate |
| Biomy et al., 2021 | Moderate | Not serious | Not serious | Serious | Undetected | Moderate |
| Chen et al., 2024 | Not serious | Not serious | Not serious | Not serious | Undetected | High |
| Cullaro et al., 2017 | Moderate | Not serious | Not serious | Serious | Undetected | Moderate |
| Hassan et al., 2023 | Moderate | Not serious | Not serious | Serious | Undetected | Moderate |
| Khalil et al., 2023 | Moderate | Not serious | Not serious | Serious | Undetected | Moderate |
| Lippi et al., 2013 | Moderate | Not serious | Not serious | Not serious | Undetected | Moderate |
| Liu et al., 2020 | Moderate | Not serious | Not serious | Serious | Undetected | Moderate |
| Martino et al., 2012 | Moderate | Not serious | Not serious | Serious | Undetected | Moderate |
| Martino et al., 2015 | Moderate | Not serious | Not serious | Serious | Undetected | Moderate |
| Morisi et al., 2024 | Moderate | Not serious | Not serious | Serious | Undetected | Moderate |
| Virzì et al., 2022 | Moderate | Not serious | Not serious | Serious | Undetected | Moderate |
| Virzì et al., 2024 | Moderate | Not serious | Not serious | Serious | Undetected | Moderate |
Disclaimer/Publisher’s Note: The statements, opinions and data contained in all publications are solely those of the individual author(s) and contributor(s) and not of MDPI and/or the editor(s). MDPI and/or the editor(s) disclaim responsibility for any injury to people or property resulting from any ideas, methods, instructions or products referred to in the content. |
© 2025 by the authors. Licensee MDPI, Basel, Switzerland. This article is an open access article distributed under the terms and conditions of the Creative Commons Attribution (CC BY) license (http://creativecommons.org/licenses/by/4.0/).
Copyright: This open access article is published under a Creative Commons CC BY 4.0 license, which permit the free download, distribution, and reuse, provided that the author and preprint are cited in any reuse.


