Preprint
Article

This version is not peer-reviewed.

Procalcitonin as a Diagnostic Biomarker for Bacterial Gastroenteritis: A Retrospective Analysis

A peer-reviewed article of this preprint also exists.

Submitted:

18 February 2025

Posted:

19 February 2025

You are already at the latest version

Abstract

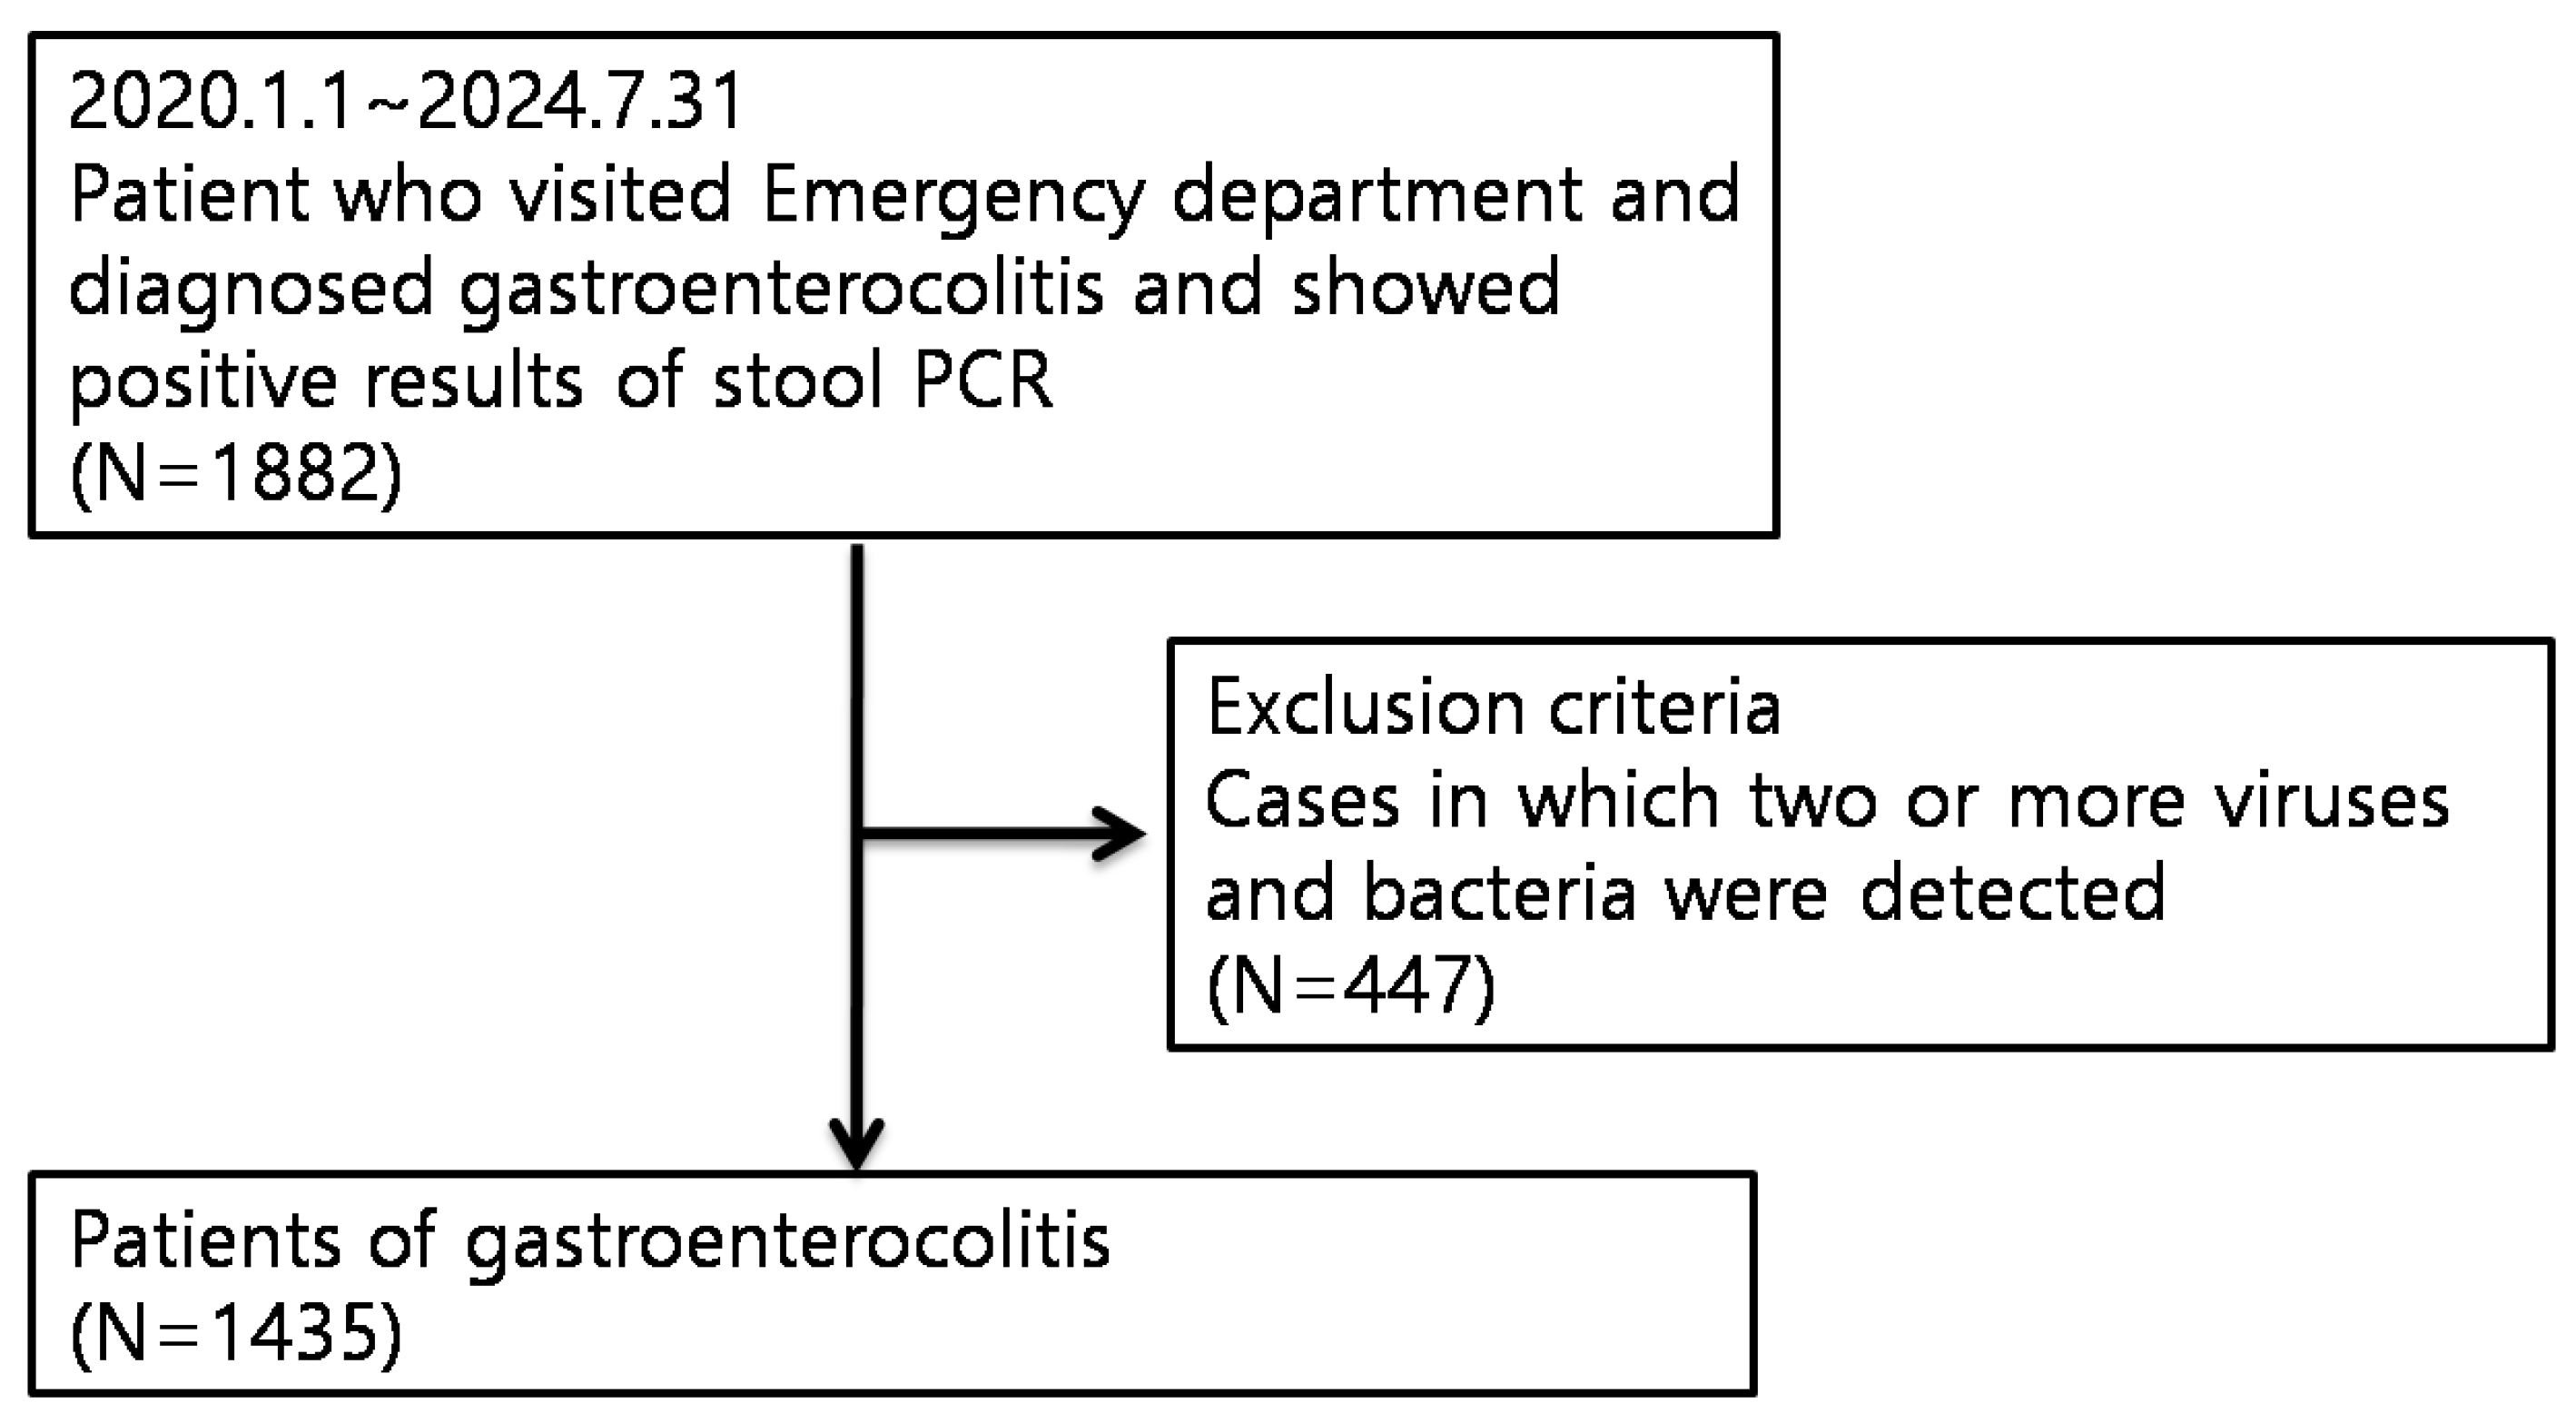
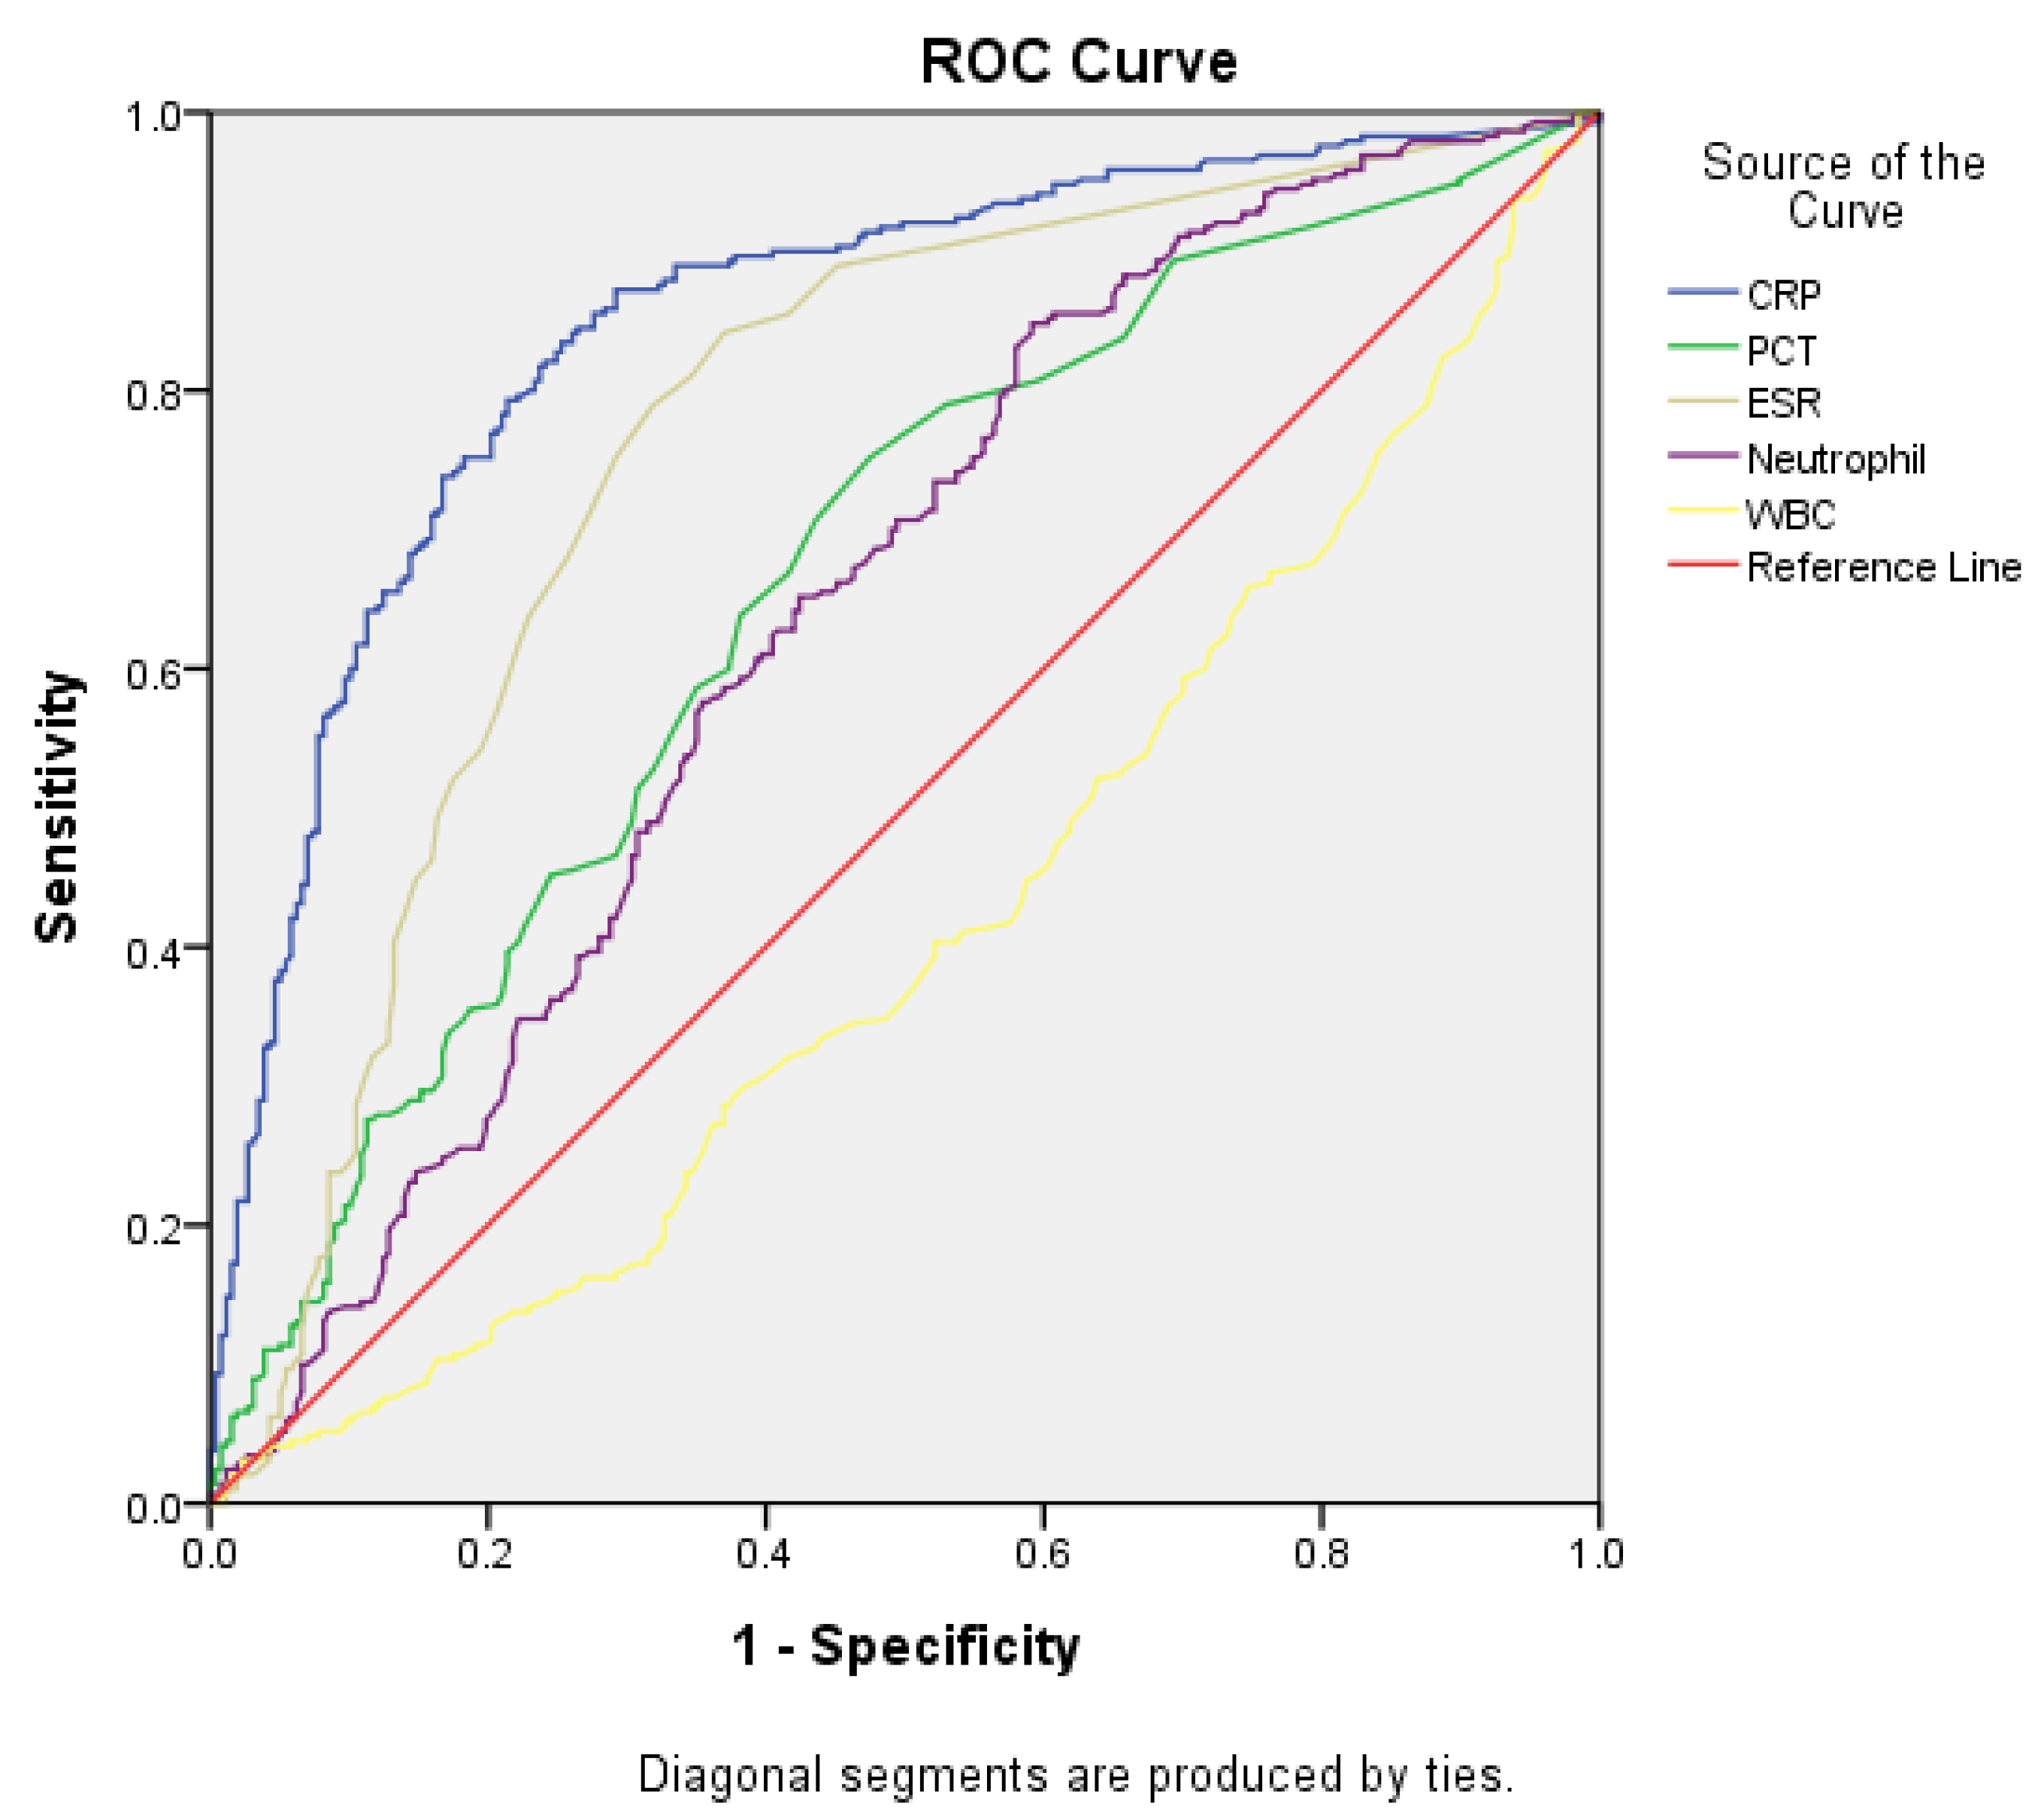
Background/Aim: Bacterial and viral gastroenteritis present with overlapping symptoms, including vomiting, diarrhea, and abdominal pain. Stool tests have been used to differentiate between them; however, stool cultures are time-consuming and stool polymerase chain reaction (PCR) tests are expensive. The role of the clinical value of procalcitonin (PCT) as a diagnostic marker of bacterial gastroenteritis remains to be investigated. This study evaluated the diagnostic value of PCT for the early diagnosis of bacterial gastroenteritis. Methods: The medical records of patients diagnosed with gastroenteritis by the emergency department with positive stool PCR results confirming the diagnosis between January 1, 2020, and July 31, 2024, were retrospectively reviewed. Demographic characteristics and laboratory findings, including the PCT and C-reactive protein (CRP) levels, were analyzed. The area under the curve (AUC) for the diagnosis of bacterial gastroenteritis was assessed to determine the diagnostic potential of PCT. Results: Among the 1,882 cases identified, 1,435 met the inclusion criteria. CRP exhibited superior diagnostic performance for diagnosing bacterial gastroenteritis in general, with an AUC of 0.848 (95% CI, 0.815–0.881; p<0.001). However, in patients aged >17 years with fever (≥38°C), PCT was the only significant inflammatory marker, and the AUC of PCT was 0.767 (95% CI: 0.603–0.932; p=0.019). Conclusions: CRP is effective in predicting bacterial gastroenteritis; however, PCT may serve as a valuable biomarker for the early diagnosis of febrile adult patients. Further large-scale studies must be conducted to validate these results and improve diagnostic strategies.

Keywords: 
;  ;  ;  

1. Introduction

Bacterial and viral gastroenteritis are characterized by overlapping symptoms such as vomiting, diarrhea, and abdominal pain [1]. However, the treatment approaches for bacterial and viral gastroenteritis differ significantly. The management of bacterial gastroenteritis involves the administration of antibiotics, whereas the management of viral gastroenteritis primarily involves providing supportive care [2]. Thus, making a prompt and accurate distinction between these conditions is crucial from the perspectives of patient care and public health concerns.
Elevations in the levels of procalcitonin (PCT), a peptide precursor to calcitonin produced in response to bacterial infections [3], have been observed in patients with bacterial infections. However, normal or mildly elevated PCT levels are observed in patients with viral infections. Thus, PCT has garnered attention as a tool for facilitating early diagnosis and treatment decision-making. Notably, studies on the diagnostic utility of PCT in patients with gastroenteritis are limited. Some studies have explored the role of PCT as a diagnostic marker for bacterial infections, with the findings revealing higher levels in patients with bacterial infections compared with that observed in patients with viral ones [4,5,6,7,8,9]. PCT is a potential marker of bacterial infection; however, its sensitivity and specificity vary [4,5,6,7,8,9]. Few studies have explored the utility of PCT in the differential diagnosis of bacterial gastroenteritis. Two previous studies reported conflicting results, with sensitivity/specificity of 54.8%/52.6% and 87.03/ 68.75% for detecting bacterial colitis and inflammatory diarrhea, respectively [4,5]. The specificity observed in these studies was low, indicating that viral infections may slightly elevate these levels in some cases, leading to false positives. Furthermore, PCT levels may not be sufficiently elevated to distinguish viral gastroenteritis from bacterial gastroenteritis in cases with an overlap between bacterial and viral infections. Thus, PCT exhibits a promising ability to distinguish between bacterial and viral causes; however, this utility is not without limitations. Further studies are necessary to determine the role of PCT in bacterial gastroenteritis.
In this regard, this study aimed to determine whether PCT could serve as a useful biomarker for the early diagnosis of bacterial gastroenteritis in patients visiting the emergency room.

2. Materials and Methods

2.1. Study Design and Patients

The data of patients who were diagnosed with gastroenteritis by the Emergency Department of the Kangwon National University Hospital and tested positive for stool PCR results between January 1, 2020, and July 31, 2024, were used in this retrospective medical chart review. Data regarding demographic characteristics, such as age, sex, and clinical symptoms (body temperature, abdominal pain, nausea, vomiting, diarrhea, and bloody stools) were analyzed. Diarrhea was defined as passing stool ≥3 times per day. Other abdominal symptoms, including pain, nausea, and vomiting occurring within three days of hospitalization were also investigated. Fever was defined as a body temperature of ≥38°C. Only patients with serological and stool PCR test results available within 24 h of hospitalization were included. The patients were categorized into the bacterial and viral gastroenteritis groups based on the results of real-time PCR (BD MAX™ System; Becton, Dickinson and Company, USA). Furthermore, laboratory findings, including the serum PCT levels, C-reactive protein (CRP) levels, white blood cell (WBC) count, and clinical symptoms were compared between the groups. Patients with concurrent diagnoses of bacterial and viral infections and those with infections caused by ≥2 bacterial or viral pathogens were excluded to minimize confounding factors.

2.2. Laboratory Tests

A HITACHI Labospect008AS analyzer (Hitachi High-Tech Co., Japan) was used to measure the serum CRP levels in accordance with the nephelometric method. An Alinity analyzer (Abbott Diagnostics, USA) was used to measure the serum PCT levels in accordance with the chemiluminescence method. The BD MAX™ system (Becton, Dickinson and Company, USA), which can detect eight bacterial pathogens (Campylobacter, Salmonella spp., Shigella spp./enteroinvasive E. coli [EIEC], Plesiomonas shigelloides, Vibrio spp. [V. vulnificus, V. parahaemolyticus, and V. cholerae], heat-labile and heat-stable [LT/ST] enterotoxigenic E. coli [ETEC], and Yersinia enterocolitica) and five viral pathogens (norovirus GI/GII, rotavirus A, adenovirus F40/41, sapovirus [genogroups I, II, IV, V], and human astrovirus) was used to perform multiplex stool PCR testing. Stool specimens were collected during the emergency department visit or after admission to detect bacterial and viral DNA. This approach is more accurate than the standard Micro, Culture and Sensitivity (MC&S) test that would normally be requested by conventional laboratories.

2.3. Definition of Bacterial Gastroenteritis

The presence of symptoms of colitis and bacterial pathogens confirmed through stool PCR testing was defined as bacterial gastroenteritis [10]. The presence of viral pathogens confirmed through multiplex stool PCR testing was defined as viral gastroenteritis. Clinical manifestations of gastroenteritis include fever (body temperature of ≥38.0°C), abdominal pain, nausea, vomiting, and diarrhea.

2.4. Statistical Analysis

All statistical analyses were conducted using IBM SPSS Statistics (version 25.0; IBM Corp., Armonk, NY). Categorical variables are presented as numbers and percentages, whereas continuous variables are presented as the mean ± standard deviation. Categorical variables were analyzed using Chi-square tests, whereas continuous variables were compared using t-tests. Statistical significance was set at p < 0.05. significant. The diagnostic performance of PCT, CRP, WBC, segment neutrophil count, and ESR in differentiating bacterial infection from viral gastroenteritis was assessed using the receiver operating characteristic (ROC) curve analysis. The optimal cut-off values were determined using the Youden index.

2.5. Ethics Statement

This study was approved by the Institutional Committee on Human Research (Institutional Review Board No. KNUH-2025-01-009).

3. Results

3.1. Demographic and Clinical Characteristics

Among the 1,882 patients with gastroenteritis that were initially identified, 1,435 met the inclusion criteria (Figure 1). Among these 1,435 patients, 849 (59.2%) and 586 (40.8%) were diagnosed with bacterial gastroenteritis and viral gastroenteritis, respectively. The mean age of the patients diagnosed with bacterial gastroenteritis was significantly higher (mean age: 35.71 ± 29.10 years) than that of those diagnosed with viral gastroenteritis (mean age: 13.13 ± 23.87 years; p < 0.001). The proportion of male patients in the bacterial gastroenteritis group (55.7%) was higher than that observed in the viral gastroenteritis group (51.5%; p <0.001). Clinical symptoms such as fever (62.4% vs. 31.6%, p <0.001), abdominal pain (90.5% vs. 73.4%, p <0.001), diarrhea (88.1% vs. 61.1%, p <0.001), and bloody stools (7.6% vs. 2.9%, p <0.001) were observed significantly more commonly among the patients with bacterial gastroenteritis. In contrast, nausea (55.7% vs. 80.7%, p <0.001) and vomiting (35.2% vs. 78.9%, p <0.001) were observed more commonly in patients with viral gastroenteritis.
The laboratory parameters of the patients with bacterial gastroenteritis were higher than those of the patients with viral gastroenteritis: neutrophil count (74.52 ± 14.27% vs. 63.32 ± 21.99%, p <0.001), CRP levels (8.28 ± 7.24 mg/dL vs. 1.68 ± 3.57 mg/dL, p <0.001), and PCT levels (1.72 ± 10.61 ng/mL vs. 0.34 ± 0.96 ng/mL, p <0.001) (Table 1).
The prevalence of underlying diseases such as diabetes mellitus (9.3% vs. 3.6%, p <0.001), hypertension (16.7% vs. 5.5%, p <0.001), cerebrovascular disease (2.9% vs. 1.2%, p <0.001), renal disease (2.0% vs. 0.5%, p=0.018), and hyperlipidemia (9.4% vs. 2.4%, p <0.001) was also higher in the bacterial gastroenteritis group.

3.2. Pathogen Detection

Table 2 and Table 3 present the causative pathogens identified through PCR testing. Campylobacter spp. was the most common pathogen (n=490, 57.7%) in the bacterial gastroenteritis group, followed by Salmonella spp. (n=165, 19.4%), Clostridioides difficiletoxin A/B (n=80, 9.4%), STEC (Shiga-like toxin-producing Escherichia coli) stx1/stx2 (n=35, 4.1%), Yersinia enterocolitica (n=23, 2.7%), EPEC (Enteropathogenic E. coli) (n=16, 1.9%), Enterotoxigenic E. coli (ETEC; n=11, 1.3%), Vibrio spp. (n=11, 1.3%), Plesiomonas shigelloides (n=10, 1.2%), Enteroaggregative E. coli (EAEC; n=5, 0.6%), and Shigella spp. (n=3, 0.4%) (Table 2).
Norovirus GI/GII was the most common pathogen (n=325, 55.5%) in the viral gastroenteritis group, followed by rotavirus (n=86, 14.7%), adenovirus 40/41(n=61, 10.4%), sapovirus (n=61, 10.4%), and astrovirus (n=53, 9.0%) (Table 3).

3.2. ROC Analysis

Table 4 and Figure 2 summarize the findings of the ROC curve analysis for CRP, PCT, ESR, neutrophil count, and WBC count in differentiating bacterial infections from viral gastroenteritis. The area under the curve (AUC) for CRP was 0.848 (95% confidence interval [CI], 0.815–0.881), with sensitivity and specificity of 79.0% and 78.6%, respectively, at a cut-off value of 1.8 mg/dL. The AUC for PCT for diagnosing bacterial gastroenteritis was 0.660 (95% CI, 0.614–0.706), with sensitivity and specificity of 60.3% and 62.6%, respectively, at a cut-off value of 0.1 ng/mL. The AUC for ESR was 0.763 (95% CI, 0.721–0.805), with sensitivity and specificity of 71.0% and 72.8%, respectively, at a cut-off value of 10.5 mg/dL. The AUC for the neutrophil count was 0.638 (95% CI, 0.591–0.684), with sensitivity and specificity of 60.7% and 67.0%, respectively, at a cut-off value of 74.4%.
ROC analysis revealed variations in the AUC values depending on symptoms and age groups (Supplementary Table 1 and Supplementary Figure 1). Specifically, the AUC for PCT improved to 0.767 (95% CI, 0.603–0.932) in patients aged >17 years with fever (body temperature ≥38°C; total n=697, febrile n=332). The sensitivity and specificity of PCT were 68.8% and 71.4%, respectively, at a cut-off value of 0.1 ng/mL. Other inflammatory markers, including the CRP level, ESR, neutrophil count, and WBC, were not statistically significant in this subgroup.

4. Discussion

The findings of the present study demonstrate the potential of serum PCT as a biomarker for distinguishing bacterial gastroenteritis from viral gastroenteritis. Furthermore, these findings indicate that compared with CRP levels, ESR, and WBC count, serum PCT may be a more effective biomarker for the early diagnosis of bacterial gastroenteritis in adults with a fever (≥38°C).
The potential of PCT as a biomarker in the clinical diagnosis of infections, particularly bacterial infections, has garnered an increasing amount of attention [11]. PCT is a precursor of calcitonin, which is produced by thyroid C-cells [3]. The PCT levels increase significantly in response to bacterial infections; thus, it is a valuable marker for distinguishing bacterial infections from other inflammatory processes, such as viral infections or noninfectious conditions [12].
Differentiation of bacterial gastroenteritis caused by pathogens such as Salmonella, Shigella, Campylobacter, E. coli, and Clostridioides difficile from viral gastroenteritis and other non-infectious gastrointestinal conditions can be challenging [13]. Unfortunately, diagnostic methods used conventionally such as stool culture, PCR, and serology are time-consuming and expensive, which can delay appropriate treatment. Furthermore, they exhibit limited sensitivity. CRP is an inflammatory marker synthesized in the liver in response to elevated cytokine levels. Its production begins 4–6 h after the onset of inflammation or tissue damage, with values doubling approximately every 8 h. The properties of PCT are similar to those of CRP, i.e., it increases earlier, is more specific, and its levels are correlated with the severity of infection [14].
PCT is predominantly produced within thyroid C-cells and is converted to calcitonin before entering systemic circulation in healthy individuals. Consequently, very low serum PCT levels (<0.02 ng/mL) are observed in healthy individuals [15]. In contrast, PCT is produced through an “alternative pathway” in non-thyroid tissues such as the spleen, kidneys, adipocytes, pancreas, colon, brain, and lungs in patients with systemic bacterial infections. These parenchymal tissues lack the processing pathway required to convert PCT to calcitonin, thereby allowing PCT to enter the systemic circulation and elevate the serum PCT levels. The serum PCT levels are typically <0.1 ng/mL in healthy individuals. Thus, PCT levels of >0.25 ng/mL may indicate the presence of a bacterial infection [15]. PCT levels of>0.5 ng/mL are generally suggestive of a bacterial infection, whereas levels of >2 ng/mL are often associated with more severe bacterial infections [16]. The PCT levels are correlated with the severity of bacterial infections [17]. Elevated PCT levels may indicate more severe or complicated conditions such as sepsis or severe colitis in patients with bacterial gastroenteritis [18]. A meta-analysis targeting acute pancreatitis revealed that the sensitivity and specificity of PCT were lower than those of other biomarkers such as CRP or fecal calprotectin; however, it serves as a helpful adjunct in certain clinical scenarios to make appropriate treatment decisions [19]. Monitoring the PCT levels over time can provide valuable insights into the progression of the infection and response to treatment [20]. Thus, PCT levels can guide antibiotic therapy by distinguishing bacterial infections from gastrointestinal symptoms caused by non-bacterial factors [21]. Elevated PCT levels may support the decision to initiate antibiotic treatment in cases wherein bacterial infection is suspected. However, low PCT levels in patients with suspected bacterial infections can help avoid unnecessary antibiotic use, which will aid in reducing the emergence of antibiotic-resistant bacteria.
The utility of PCT as a potential biomarker for differentiating bacterial gastroenteritis from viral gastroenteritis was evaluated in this context. A minimal increase in the PCT levels is observed in patients with viral infections, such as those caused by norovirus or rotavirus. In contrast, significant elevation is observed in patients with bacterial infections. Although PCT levels are generally higher in patients with bacterial gastroenteritis compared with that in patients with viral gastroenteritis, they can vary depending on the severity of infection and the specific pathogen involved. Thus, the sensitivity and specificity of PCT for detecting bacterial infections, including gastroenteritis, varies, leading to false-positive results in some cases [4,5,6,7,8,9]. Furthermore, the elevated PCT levels observed in patients with non-infectious conditions such as inflammatory bowel disease [18], pancreatitis [22,23], or postsurgical conditions [24,25] may potentially complicate interpretation in certain patient populations. The response of PCT to bacterial infections may be blunted in immunocompromised patients [26,27]; thus, it also increases the likelihood of false negatives. PCT is particularly useful for ruling out bacterial infections at low levels. PCT levels combined with clinical findings can help guide decisions regarding the initiation or avoidance of antibiotics in cases wherein the etiology of gastroenteritis is unclear [28]. Expert and systematic reviews recommend using PCT as part of a comprehensive diagnostic workup for infections, such as severe cases of gastroenteritis, to minimize the unnecessary use of antibiotics for viral infections [29,30]. Shin et al. [5] reported that PCT was a better diagnostic biomarker for inflammatory diarrhea (odds ratio, 1.321; AUC, 0.797) than CRP (odds ratio, 1.145; AUC, 0.697). In contrast, Lee et al. [4] reported that PCT and CRP levels could not be used to distinguish between bacterial and non-bacterial colitis. However, both of these studies were retrospective studies conducted at single institutions; thus, overall evidence remains mixed. Further large-scale prospective studies must be conducted in the future to establish the precise role of PCT in the diagnosis of bacterial gastroenteritis.
The present study retrospectively evaluated the diagnostic value of PCT in differentiating bacterial gastroenteritis from viral gastroenteritis in patients who visited the emergency department. PCT was identified as a significant indicator for predicting bacterial gastroenteritis, especially in patients aged ≥17 years with a fever of ≥38°C, with sensitivity and specificity of 68.8% and 71.4%, respectively. Campylobacter spp. (57.7%) and Salmonella spp. (19.4%) were the primary bacterial pathogens identified, whereas norovirus (55.5%) was the most common viral pathogen. Compared with CRP, PCT is a more useful biomarker for the early diagnosis of bacterial gastroenteritis in febrile adult patients. The utility of PCT as a predictive marker for sepsis underscores its relevance in the diagnosis of gastroenteritis accompanied by fever. In contrast to viral gastroenteritis, which is often associated with mild or no fever, bacterial gastroenteritis frequently presents with high fever [31]. The diagnostic performance of PCT observed in the present study is consistent with that reported by previous studies, highlighting its sensitivity to bacterial infections. However, in contrast to previous studies that focused on sepsis or generalized bacterial infections, the present study specifically evaluated its role in gastroenteritis. Notably, the present study included a relatively large patient population of various age groups, including children, in contrast to previous studies targeting bacterial colitis or inflammatory diarrhea. This positions PCT as a complementary tool to CRP, especially in settings that require rapid decision-making, such as in febrile adults. Incorporating PCT into diagnostic workflows can enhance the early detection of bacterial gastroenteritis, guide appropriate antibiotic therapy, and reduce unnecessary prescriptions in viral cases. These findings support antibiotic stewardship efforts and are consistent with public health goals to minimize antimicrobial resistance.
PCT is primarily a marker for bacterial infections; however, it can also be elevated in patients with certain non-infectious inflammatory conditions, such as trauma, surgery, burns, cancer, autoimmune diseases, chronic kidney disease, heart failure, and myocardial infarction, or following the administration of medications, such as immunosuppressants and chemotherapy agents [32]. Thus, interpreting the PCT levels may be complicated in some cases. Several underlying diseases, such as diabetes, hypertension, cerebrovascular disease, and renal disease, were more prevalent in the bacterial gastroenteritis group than in the viral gastroenteritis group in the present study. The effect of these diseases on the PCT levels cannot be ruled out. All bacterial infections do not result in the same degree of PCT elevation. For instance, infections caused by Clostridioides difficile may not result in a significant increase in PCT compared with that caused by other enteric bacteria, making its diagnostic utility dependent on the specific pathogen [33]. Moreover, PCT is not exclusive to gastrointestinal infections and can be elevated in other bacterial infections, such as respiratory tract infections or sepsis, as well as in severe systemic inflammatory responses [32]. Thus, it cannot be used as a standalone diagnostic tool, rather it can be used in conjunction with clinical findings and other laboratory tests.
This study has some limitations. First, the single-center, retrospective design may have limited the generalizability of the findings. Second, the PCT levels can be elevated in patients with comorbid conditions. However, there were limitations in fully analyzing the underlying conditions or medications as this was a retrospective study. Third, the sensitivity of stool PCR testing is generally high; however, some pathogens may not have been detected. Prospective multicenter studies must be conducted in the future to confirm these findings and establish standardized PCT thresholds tailored to diverse patient populations.

5. Conclusions

In conclusion, PCT is a promising biomarker for the early diagnosis of bacterial gastroenteritis in specific patient groups, particularly febrile adults. It provides valuable insights into the severity and progression of infection; however, it must be used in conjunction with clinical judgment, stool tests, and other diagnostic markers such as CRP. Further studies must be conducted in the future to explore its integration into routine clinical practice to enhance diagnostic accuracy and improve patient outcomes.

Supplementary Materials

The following supporting information can be downloaded at the website of this paper posted on Preprints.org, Figure S1: Receiver operating characteristic curve of CRP, PCT, ESR, neutrophil count, and WBC for differentiating between bacterial and viral gastroenteritis among patients aged >17 years old with fever (BT ≧38°C).; Table S1: Receiver operating characteristic analysis of CRP, PCT, ESR, neutrophil count, and WBC to differentiate between bacterial and viral gastroenteritis according to the symptoms.

Author Contributions

Conceptualization, S.H.L. and H.C.; methodology, S.C.P.; software, H.C. and S.J.N.; validation, S.H.L., S.J.L. and S.C.P.; formal analysis, H.C. and J.H.L.; investigation., J.H.K. and S.H.K.: resources, S.H.L. and S.J.N.; data curation, J.M.P.; writing—original draft preparation, H.C. and J.H.L.; writing—review and editing, S.H.L. and S.C.P.; visualization, H.J.Y; supervision, S.C.P.; project administration, T.S.K.; funding acquisition, S.H.L. and S.J.N. All authors have read and agreed to the published version of the manuscript.

Funding

This study was supported by a grant from the Kangwon Branch of the Korean Society of Gastrointestinal Endoscopy (KSGE_KW_10).

Institutional Review Board Statement

This study was approved (11 February 2025) by Kangwon National University Hospital Institutional Review Board (Institutional Review Board No. KNUH-2025-01-009).

Informed Consent Statement

Not applicable.

Data Availability Statement

Data are available upon request.

Acknowledgments

The authors would like to thank all the participants who collaborated in this study.

Conflicts of Interest

The authors declare no conflicts of interest.

References

  1. Al-Asy, H.M.; Gamal, R.M.; Albaset, A.M.A.; Elsanosy, M.G.; Mabrouk, M.M. New diagnostic biomarker in acute diarrhea due to bacterial infection in children. Int J Pediatr Adolesc Med 2017, 4, 75–80. [Google Scholar] [CrossRef] [PubMed]
  2. Çetin, S.; Telli, E.; Şahin, A.M.; Uğur, M.; Aydın, E.; Şenel, İ.; Yetkin, M.A. Gastrointestinal PCR panel results and antibiotic use in acute gastroenteritis cases: how appropriate are we in our usage? Indian J Med Microbiol 2024, 47, 100536. [Google Scholar] [CrossRef] [PubMed]
  3. Davies, J. Procalcitonin. J Clin Pathol 2015, 68, 675–679. [Google Scholar] [CrossRef] [PubMed]
  4. Lee, J.Y.; Lee, S.Y.; Lee, Y.J.; Lee, J.W.; Kim, J.S.; Lee, J.Y.; Jang, B.K.; Chung, W.J.; Cho, K.B.; Hwang, J.S. Diagnostic value of serum procalcitonin and C-reactive protein in discriminating between bacterial and nonbacterial colitis: a retrospective study. J Yeungnam Med Sci 2023, 40, 388–393. [Google Scholar] [CrossRef]
  5. Shin, H.J.; Kang, S.H.; Moon, H.S.; Sung, J.K.; Jeong, H.Y.; Kim, J.S.; Joo, J.S.; Lee, E.S.; Kim, S.H.; Lee, B.S. Serum procalcitonin levels can be used to differentiate between inflammatory and non-inflammatory diarrhea in acute infectious diarrhea. Med (Baltim) 2018, 97, e11795. [Google Scholar] [CrossRef]
  6. Enguix-Armada, A.; Escobar-Conesa, R.; García-De La Torre, A.; De La Torre-Prados, M.V. Usefulness of several biomarkers in the management of septic patients: C-reactive protein, procalcitonin, presepsin and mid-regional pro-adrenomedullin. Clin Chem Lab Med 2016, 54, 163–168. [Google Scholar] [CrossRef]
  7. Klouche, K.; Cristol, J.P.; Devin, J.; Gilles, V.; Kuster, N.; Larcher, R.; et al. Diagnostic and prognostic value of soluble CD14 subtype (Presepsin) for sepsis and community-acquired pneumonia in ICU patients. Ann Intensive Care 2016, 6, 1. [Google Scholar] [CrossRef]
  8. Leli, C.; Ferranti, M.; Marrano, U.; Al Dhahab, Z.S.; Bozza, S.; Cenci, E.; Mencacci, A. Diagnostic accuracy of presepsin (sCD14-ST) and procalcitonin for prediction of bacteraemia and bacterial DNAaemia in patients with suspected sepsis. J Med Microbiol 2016, 65, 713–719. [Google Scholar] [CrossRef]
  9. Mihajlovic, D.; Brkic, S.; Uvelin, A.; Draskovic, B.; Vrsajkov, V. Use of presepsin and procalcitonin for prediction of SeptiFast results in critically ill patients. J Crit Care 2017, 40, 197–201. [Google Scholar] [CrossRef]
  10. Diseases KSoI. Clinical guideline for the diagnosis and treatment of gastrointestinal infections. Infect Chemother 2010, 42, 323–361. [Google Scholar] [CrossRef]
  11. Riedel, S. Procalcitonin and the role of biomarkers in the diagnosis and management of sepsis. Diagn Microbiol Infect Dis 2012, 73, 221–227. [Google Scholar] [CrossRef] [PubMed]
  12. Liang, P.; Yu, F. Value of CRP, PCT, and NLR in prediction of severity and prognosis of patients with bloodstream infections and sepsis. Front Surg 2022, 9, 857218. [Google Scholar] [CrossRef] [PubMed]
  13. Iturriza-Gómara, M.; Cunliffe, N.A. Viral gastroenteritis. In Hunter’s Tropical Medicine and Emerging Infectious Diseases; Elsevier, 2020; pp. 289–307. [Google Scholar] [CrossRef]
  14. Fernández, A.; Luaces, C.; Pou, J. Procalcitonina en la valoración del niño con fiebre sin foco. An Pediatr Continuada 2004, 2, 97–100. [Google Scholar] [CrossRef]
  15. Soreng, K.; Levy, H.R. Procalcitonin: an emerging biomarker of bacterial sepsis. Clin Microbiol Newsl 2011, 33, 171–178. [Google Scholar] [CrossRef]
  16. Covington, E.W.; Roberts, M.Z.; Dong, J. Procalcitonin monitoring as a guide for antimicrobial therapy: a review of current literature. Pharmacotherapy 2018, 38, 569–581. [Google Scholar] [CrossRef]
  17. Yunus, I.; Fasih, A.; Wang, Y. The use of procalcitonin in the determination of severity of sepsis, patient outcomes and infection characteristics. PLOS One 2018, 13, e0206527. [Google Scholar] [CrossRef]
  18. Thia, K.T.-J.; Chan, E.S.-Y.; Ling, K.-L.; Ng, W.-Y.; Jacob, E.; Ooi, C.-J. Role of procalcitonin in infectious gastroenteritis and inflammatory bowel disease. Dig Dis Sci 2008, 53, 2960–2968. [Google Scholar] [CrossRef]
  19. Chan, Y.-L.; Tseng, C.-P.; Tsay, P.-K.; Chang, S.-S.; Chiu, T.-F.; Chen, J.-C. Procalcitonin as a marker of bacterial infection in the emergency department: an observational study. Crit Care 2003, 8, 1–9. [Google Scholar] [CrossRef]
  20. Rau, B.; Krüger, C.M.; Schilling, M.K. Procalcitonin: improved biochemical severity stratification and postoperative monitoring in severe abdominal inflammation and sepsis. Langenbecks Arch Surg 2004, 389, 134–144. [Google Scholar] [CrossRef]
  21. Sager, R.; Kutz, A.; Mueller, B.; Schuetz, P. Procalcitonin-guided diagnosis and antibiotic stewardship revisited. BMC Med 2017, 15, 15. [Google Scholar] [CrossRef]
  22. Rau, B.M.; Kemppainen, E.A.; Gumbs, A.A.; Büchler, M.W.; Wegscheider, K.; Bassi, C.; Puolakkainen, P.A.; Beger, H.G. Early assessment of pancreatic infections and overall prognosis in severe acute pancreatitis by procalcitonin (PCT): a prospective international multicenter study. Ann Surg 2007, 245, 745–754. [Google Scholar] [CrossRef]
  23. Mofidi, R.; Suttie, S.A.; Patil, P.V.; Ogston, S.; Parks, R.W. The value of procalcitonin at predicting the severity of acute pancreatitis and development of infected pancreatic necrosis: systematic review. Surgery 2009, 146, 72–81. [Google Scholar] [CrossRef] [PubMed]
  24. Meisner, M.; Rauschmayer, C.; Schmidt, J.; Feyrer, R.; Cesnjevar, R.; Bredle, D.; Tschaikowsky, K. Early increase of procalcitonin after cardiovascular surgery in patients with postoperative complications. Intensive Care Med 2002, 28, 1094–1102. [Google Scholar] [CrossRef]
  25. Paruk, F.; Chausse, J.M. Monitoring the post surgery inflammatory host response. J Emerg Crit Care Med 2019, 3, 47–47. [Google Scholar] [CrossRef]
  26. Bele, N.; Darmon, M.; Coquet, I.; Feugeas, J.-P.; Legriel, S.; Adaoui, N.; Schlemmer, B.; Azoulay, E. Diagnostic accuracy of procalcitonin in critically ill immunocompromised patients. BMC Infect Dis 2011, 11, 224. [Google Scholar] [CrossRef] [PubMed]
  27. Yu, X.; Ma, X.; Ai, Y. Diagnostic value of serum procalcitonin for infection in the immunocompromised critically ill patients with suspected infection. Zhonghua Wei Zhong Bing Ji Jiu Yi Xue 2015, 27, 477–483. [Google Scholar] [CrossRef] [PubMed]
  28. Cancella de Abreu, M.; Cassard, C.; Cherubini, I.; Houas, E.; Dechartres, A.; Hausfater, P. Usefulness of serum procalcitonin and point-of-care multiplex PCR gastro-intestinal panel in acute diarrhoea or colitis in the emergency department. Biomarkers 2023, 28, 396–400. [Google Scholar] [CrossRef]
  29. Watkins, R.R.; Lemonovich, T.L. Serum procalcitonin in the diagnosis and management of intra-abdominal infections. Expert Rev Anti-Infect Ther 2012, 10, 197–205. [Google Scholar] [CrossRef]
  30. Schuetz, P.; Chiappa, V.; Briel, M.; Greenwald, J.L. Procalcitonin algorithms for antibiotic therapy decisions: a systematic review of randomized controlled trials and recommendations for clinical algorithms. Arch Intern Med 2011, 171, 1322–1331. [Google Scholar] [CrossRef]
  31. Flynn, T.G.; Olortegui, M.P.; Kosek, M.N. Viral gastroenteritis. Lancet 2024, 403, 862–876. [Google Scholar] [CrossRef]
  32. Becker, K.L.; Snider, R.; Nylen, E.S. Procalcitonin assay in systemic inflammation, infection, and sepsis: clinical utility and limitations. Crit Care Med 2008, 36, 941–952. [Google Scholar] [CrossRef] [PubMed]
  33. Shapiro, D.S.; Friedmann, R.; Husseini, A.; Ivgi, H.; Yinnon, A.M.; Assous, M.V. Can procalcitonin contribute to the diagnosis of Clostridium difficile colitis? Isr Med Assoc J 2017, 19, 313–316. [Google Scholar] [PubMed]
Figure 1. Study flow.
Preprints 149790 g001
Figure 2. Receiver operating characteristic curve of CRP, PCT, ESR, neutrophil count, and WBC for differentiating between bacterial and viral gastroenteritis. CRP, C-reactive protein; PCT, procalcitonin; ESR, erythrocyte sedimentation rate; WBC, white blood cells.
Preprints 149790 g002
Table 1. Patient characteristics in the bacterial and viral gastroenteritis groups.
Characteristics Bacterial gastroenteritis Viral gastroenteritis p-value
  (n=849) (n=586)
Age (year, mean ± SD) 35.71±29.10 13.13±23.87 <0.001
Male sex (n, %) 473 (55.7%) 302 (51.5%) <0.001
Symptom
Fever (BT ≥38°C) 492 (62.4%) 174 (31.6%) <0.001
Abdominal pain (n, %) 582 (90.5%) 179 (73.4%) <0.001
Nausea (n, %) 352 (55.7%) 409 (80.7%) <0.001
Vomiting (n, %) 221 (35.2%) 403 (78.9%) <0.001
Diarrhea (n, %) 712 (88.1%) 319 (61.1%) <0.001
Blood in stool (n, %) 62 (7.6%) 15 (2.9%) <0.001
Laboratory finding
WBC count (×103/μL) 10421.77±4977.77 11900.05±5679.06 <0.001
Neutrophil count (%) 74.52±14.27 63.32±21.99 <0.001
CRP (mg/dL) 8.28±7.24 1.68±3.57 <0.001
ESR (mg/dL) 22.34±16.80 11.43±16.36 <0.001
Procalcitonin (ng/mL) 1.72±10.61 0.34±0.96 <0.001
Underlying disease
DM 79 (9.3%) 21 (3.6%) <0.001
Thyroid disease 11 (1.3%) 4 (0.7%) 0.262
HTN 142 (16.7%) 32 (5.5%) <0.001
CVD 25 (2.9%) 7 (1.2%) 0.027
Respiratory disease 7 (0.8%) 3 (0.5%) 0.484
Liver disease 4 (0.5%) 1 (0.2%) 0.342
Renal disease 17 (2.0%) 3 (0.5%) 0.018
Hyperlipidemia 80 (9.4%) 14 (2.4%) <0.001
Surgical history 24 (2.8%) 9 (1.5%) 0.273
BT, body temperature; WBC, white blood cell; CRP, C-reactive protein; ESR, erythrocyte sedimentation rate;
DM, diabetes mellitus; HTN, hypertension; CVD, cerebrovascular disease.
Table 2. Distribution of bacteria detected through stool polymerase chain reaction testing.
Type Data
Campylobacter spp. 490 (57.7%)
Clostridioides difficile toxin A/B 80 (9.4%)
EAEC (Enteroaggregative E. coli) 5 (0.6%)
EPEC (Enteropathogenic E. coli) 16 (1.9%)
ETEC (Enterotoxigenic E. coli) 11 (1.3%)
Plesiomonas shigelloides 10 (1.2%)
Salmonella spp. 165 (19.4%)
Shigella spp. 3 (0.4%)
STEC (Shiga-like toxin-producing E. coli)
stx1/stx2
35 (4.1%)
Vibrio spp. 11 (1.3%)
Yersinia enterocolitica 23 (2.7%)
Total 849
(100.0%)
Table 3. Distribution of the virus detected through stool polymerase chain reaction testing.
Type Data
Adenovirus 40/41 61 (10.4%)
Astrovirus 53 (9.0%)
Norovirus GI/GII 325 (55.5%)
Rotavirus 86 (14.7%)
Sapovirus 61 (10.4%)
Total 586 (100.0%)
Values are presented as number (%).
Table 4. Receiver operating characteristic analysis of CRP, PCT, ESR, neutrophil count, and WBC to differentiate between bacterial and viral gastroenteritis.
Index AUC (95% CI) Cut-off Sensitivity (%) Specificity (%) p-value
CRP 0.848 (0.815–0.881) 1.8 79.0% 78.6% <.0001
PCT 0.660 (0.614–0.706) 0.1 60.3% 62.6% <.0001
ESR 0.763 (0.721–0.805) 10.5 71.0% 72.8% <.0001
Neutrophil count 0.638 (0.591–0.684) 74.4 60.7% 67.0% <.0001
WBC 0.412 (0.364–0.460) 10750 41.7% 42.4% <.0001
CRP, C-reactive protein; PCT, procalcitonin; ESR, erythrocyte sedimentation rate; WBC, white blood cell; AUC, area under the curve; CI, confidence interval.
Table 5. Receiver operating characteristic analysis of CRP, PCT, ESR, neutrophil count, and WBC to differentiate between bacterial and viral gastroenteritis among patients aged >17 years old with fever (BT ≧38 °C).
Index AUC (95% CI) Cut-off Sensitivity (%) Specificity (%) p-value
CRP 0.715 (0.479–0.951) 8.98 63.4% 71.4% 0.059
PCT 0.767 (0.603–0.932) 0.1 68.8% 71.4% 0.019
ESR 0.683 (0.396–0.970) 13.5 71.0% 71.4% 0.108
Neutrophil count 0.445 (0.178–0.713) 84.4 41.9% 42.9% 0.632
WBC 0.510 (0.269–0.751) 10500 41.9% 42.9% 0.930
CRP, C-reactive protein; PCT, procalcitonin; ESR, erythrocyte sedimentation rate; WBC, white blood cell; BT, body temperature; AUC, area under the curve; CI, confidence interval.
Disclaimer/Publisher’s Note: The statements, opinions and data contained in all publications are solely those of the individual author(s) and contributor(s) and not of MDPI and/or the editor(s). MDPI and/or the editor(s) disclaim responsibility for any injury to people or property resulting from any ideas, methods, instructions or products referred to in the content.
Copyright: This open access article is published under a Creative Commons CC BY 4.0 license, which permit the free download, distribution, and reuse, provided that the author and preprint are cited in any reuse.
Prerpints.org logo

Preprints.org is a free preprint server supported by MDPI in Basel, Switzerland.

Subscribe

Disclaimer

Terms of Use

Privacy Policy

Privacy Settings

© 2025 MDPI (Basel, Switzerland) unless otherwise stated