
Submitted:
29 August 2025
Posted:
01 September 2025
You are already at the latest version
Abstract
This study presents a comprehensive social baseline assessment of Aweil East and Aweil South counties in Northern Bahr el Ghazal, South Sudan regions acutely affected by recurrent flooding, displacement, and service deprivation. Using a mixed-methods approach, the research synthesizes data from 241 household surveys, focus group discussions, and key informant interviews to illuminate the socio-economic vulnerabilities, gender dynamics, and service access gaps across diverse population groups. Findings reveal that 77.2% of households are female-headed, 86.7% include women of reproductive age, and nearly one-third host individuals with disabilities underscoring the need for gender-responsive and disability-inclusive recovery planning. Despite some presence of safe spaces, 95.9% of households lack access to health, psychosocial, or legal services, and 79.7% report no formal platform for community voice. These insights offer an evidence base for aligning local needs with national disaster risk reduction strategies and global frameworks such as the Sendai Framework and Sustainable Development Goals. The study advocates for inclusive governance, targeted service delivery, and community-driven resilience planning in post-disaster contexts.
Keywords:
inclusive recovery
; social baseline assessment
; gender and disability
; flood vulnerability
; service access gap
1. Introduction
Aweil East and Aweil South counties, located in Northern Bahr el Ghazal State, South Sudan, are among the regions most affected by recurrent flooding, displacement, and infrastructure fragility. These counties host vulnerable populations grappling with climate-induced shocks, limited access to essential services, and evolving social dynamics. The recent household survey conducted across 241 households provides a granular view of community-level challenges, revealing critical gaps in protection, livelihoods, and governance(Ajo 2019)
The demographic profile of the surveyed population highlights a predominance of female-headed households (77.2%), widespread caregiving burdens, and a high prevalence of women of reproductive age (86.7%). These indicators point to gendered vulnerabilities exacerbated by displacement and flood-related disruptions. Additionally, nearly one in three households include a person with a disability, underscoring the need for inclusive planning and service delivery that accommodates mobility, health, and access constraints.
Beyond demographic stressors, the data reveals systemic service gaps: 95.9% of households lack access to health, psychosocial, or legal support services, and 79.7% report no platform for raising community concerns. Despite some presence of safe spaces (31.5%), formal support systems remain largely absent. These findings offer a compelling evidence base for aligning local needs with national disaster response strategies and global frameworks such as the Sendai Framework and Sustainable Development Goals particularly those focused on gender equality, health, water security, and inclusive governance(Zaidi and Fordham 2021, Mpiere, Tehami et al. 2025).
2. Methodology
The social baseline assessment employed a mixed-methods approach to capture the socio-economic and cultural dynamics of Aweil East and Aweil South counties. Quantitative data was collected through statistically representative household surveys, which provided insights into demographics, income sources, employment patterns, asset ownership, food security, energy access, and flood resilience. This was complemented by qualitative methods to ensure triangulation and contextual depth, enhancing the reliability and relevance of findings for targeted interventions(Leech, Dellinger et al. 2010)
Focus Group Discussions (FGDs) were conducted with diverse community segments including women, youth, displaced persons, and elders to explore lived experiences, gender roles, and barriers to participation in community life. Key Informant Interviews (KIIs) with local officials, leaders, and service providers enriched the analysis with institutional perspectives on governance and infrastructure gaps. Additionally, service mapping was undertaken to assess the availability and quality of essential services such as healthcare, education, water, and sanitation, with particular attention to the needs of marginalized and displaced populations(Boateng 2012)
3. Findings
3.1. Distribution of Respondents by County
The survey sample shows a strong concentration of responses from Aweil South County, which accounts for 75.1% of the total 241 respondents, compared to 24.9% from Aweil East County. This distribution suggests that the findings may be more reflective of conditions and vulnerabilities in Aweil South, potentially limiting the representativeness of the data across both counties. Interpretation and planning should therefore consider this geographic skew, especially when applying insights to broader regional interventions.
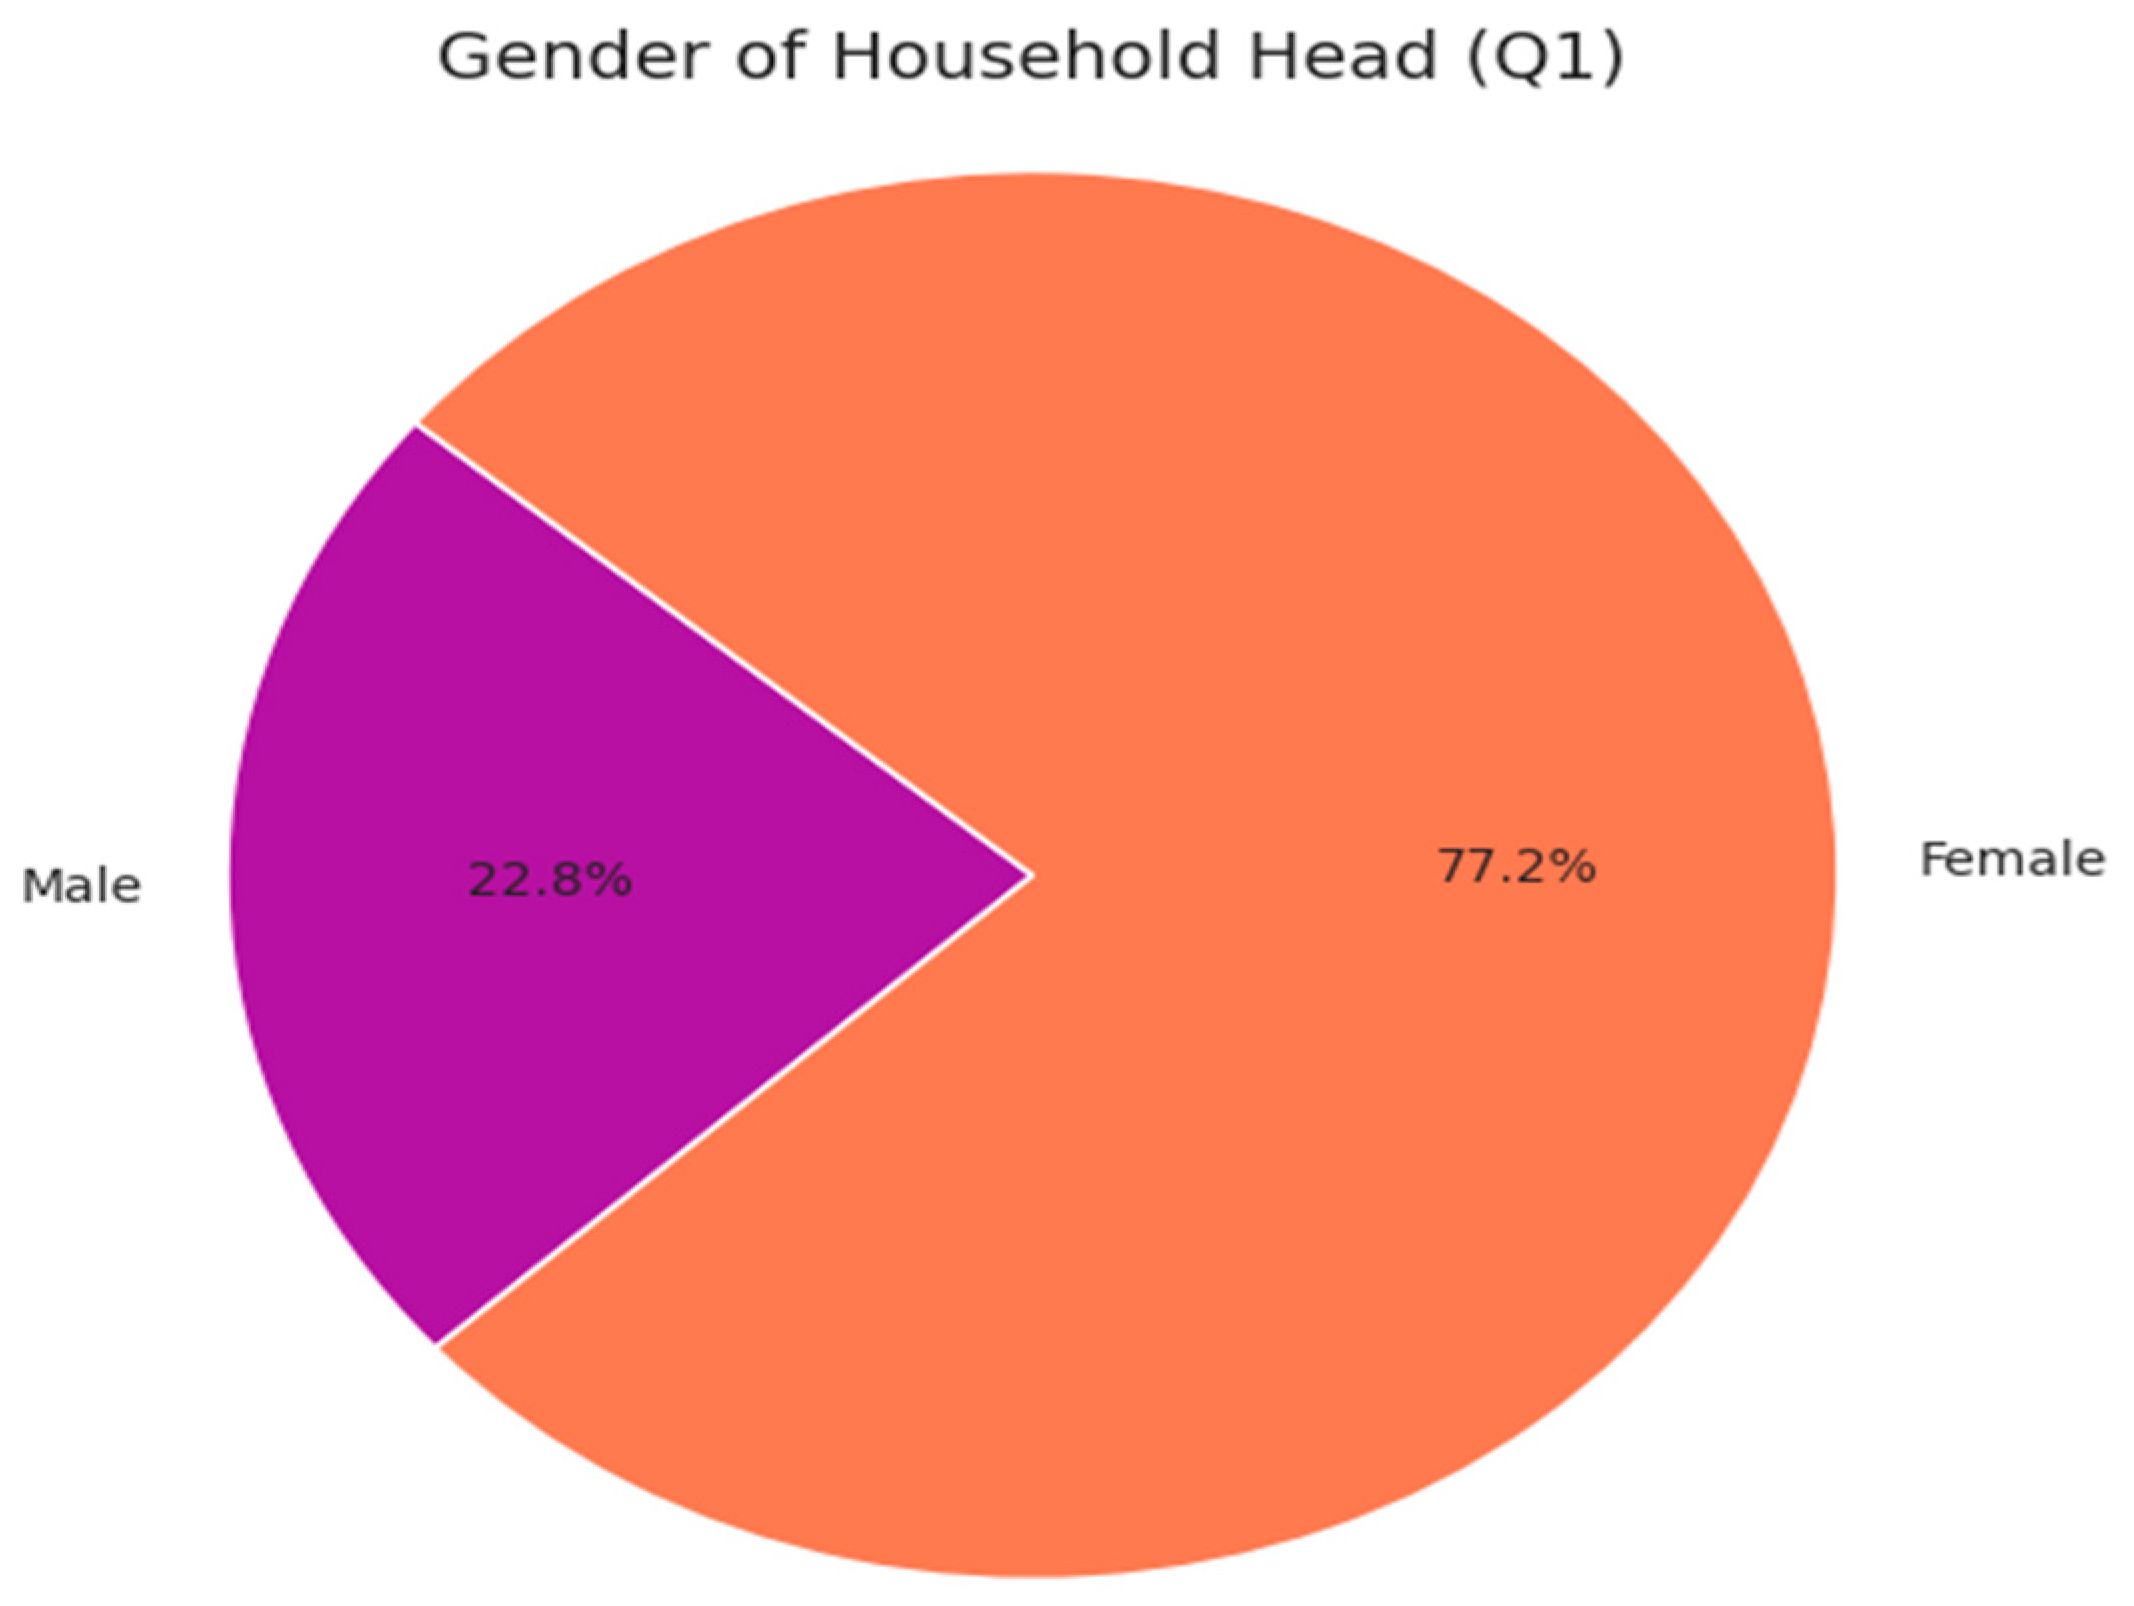
Figure 1.
gender of household head.
The data shows that 77.2% of households are female-headed, indicating that women are the predominant heads of household in the surveyed population, while only 22.8% are male-headed. This gender distribution likely reflects displacement-related dynamics, widowhood, or male outmigration due to conflict or labor demands. Such a profile underscores the need for targeted support to female-headed households, particularly in livelihood recovery, protection, and service access. It also calls for gender-sensitive planning in flood resilience, health systems, and governance interventions to ensure equitable and effective responses.
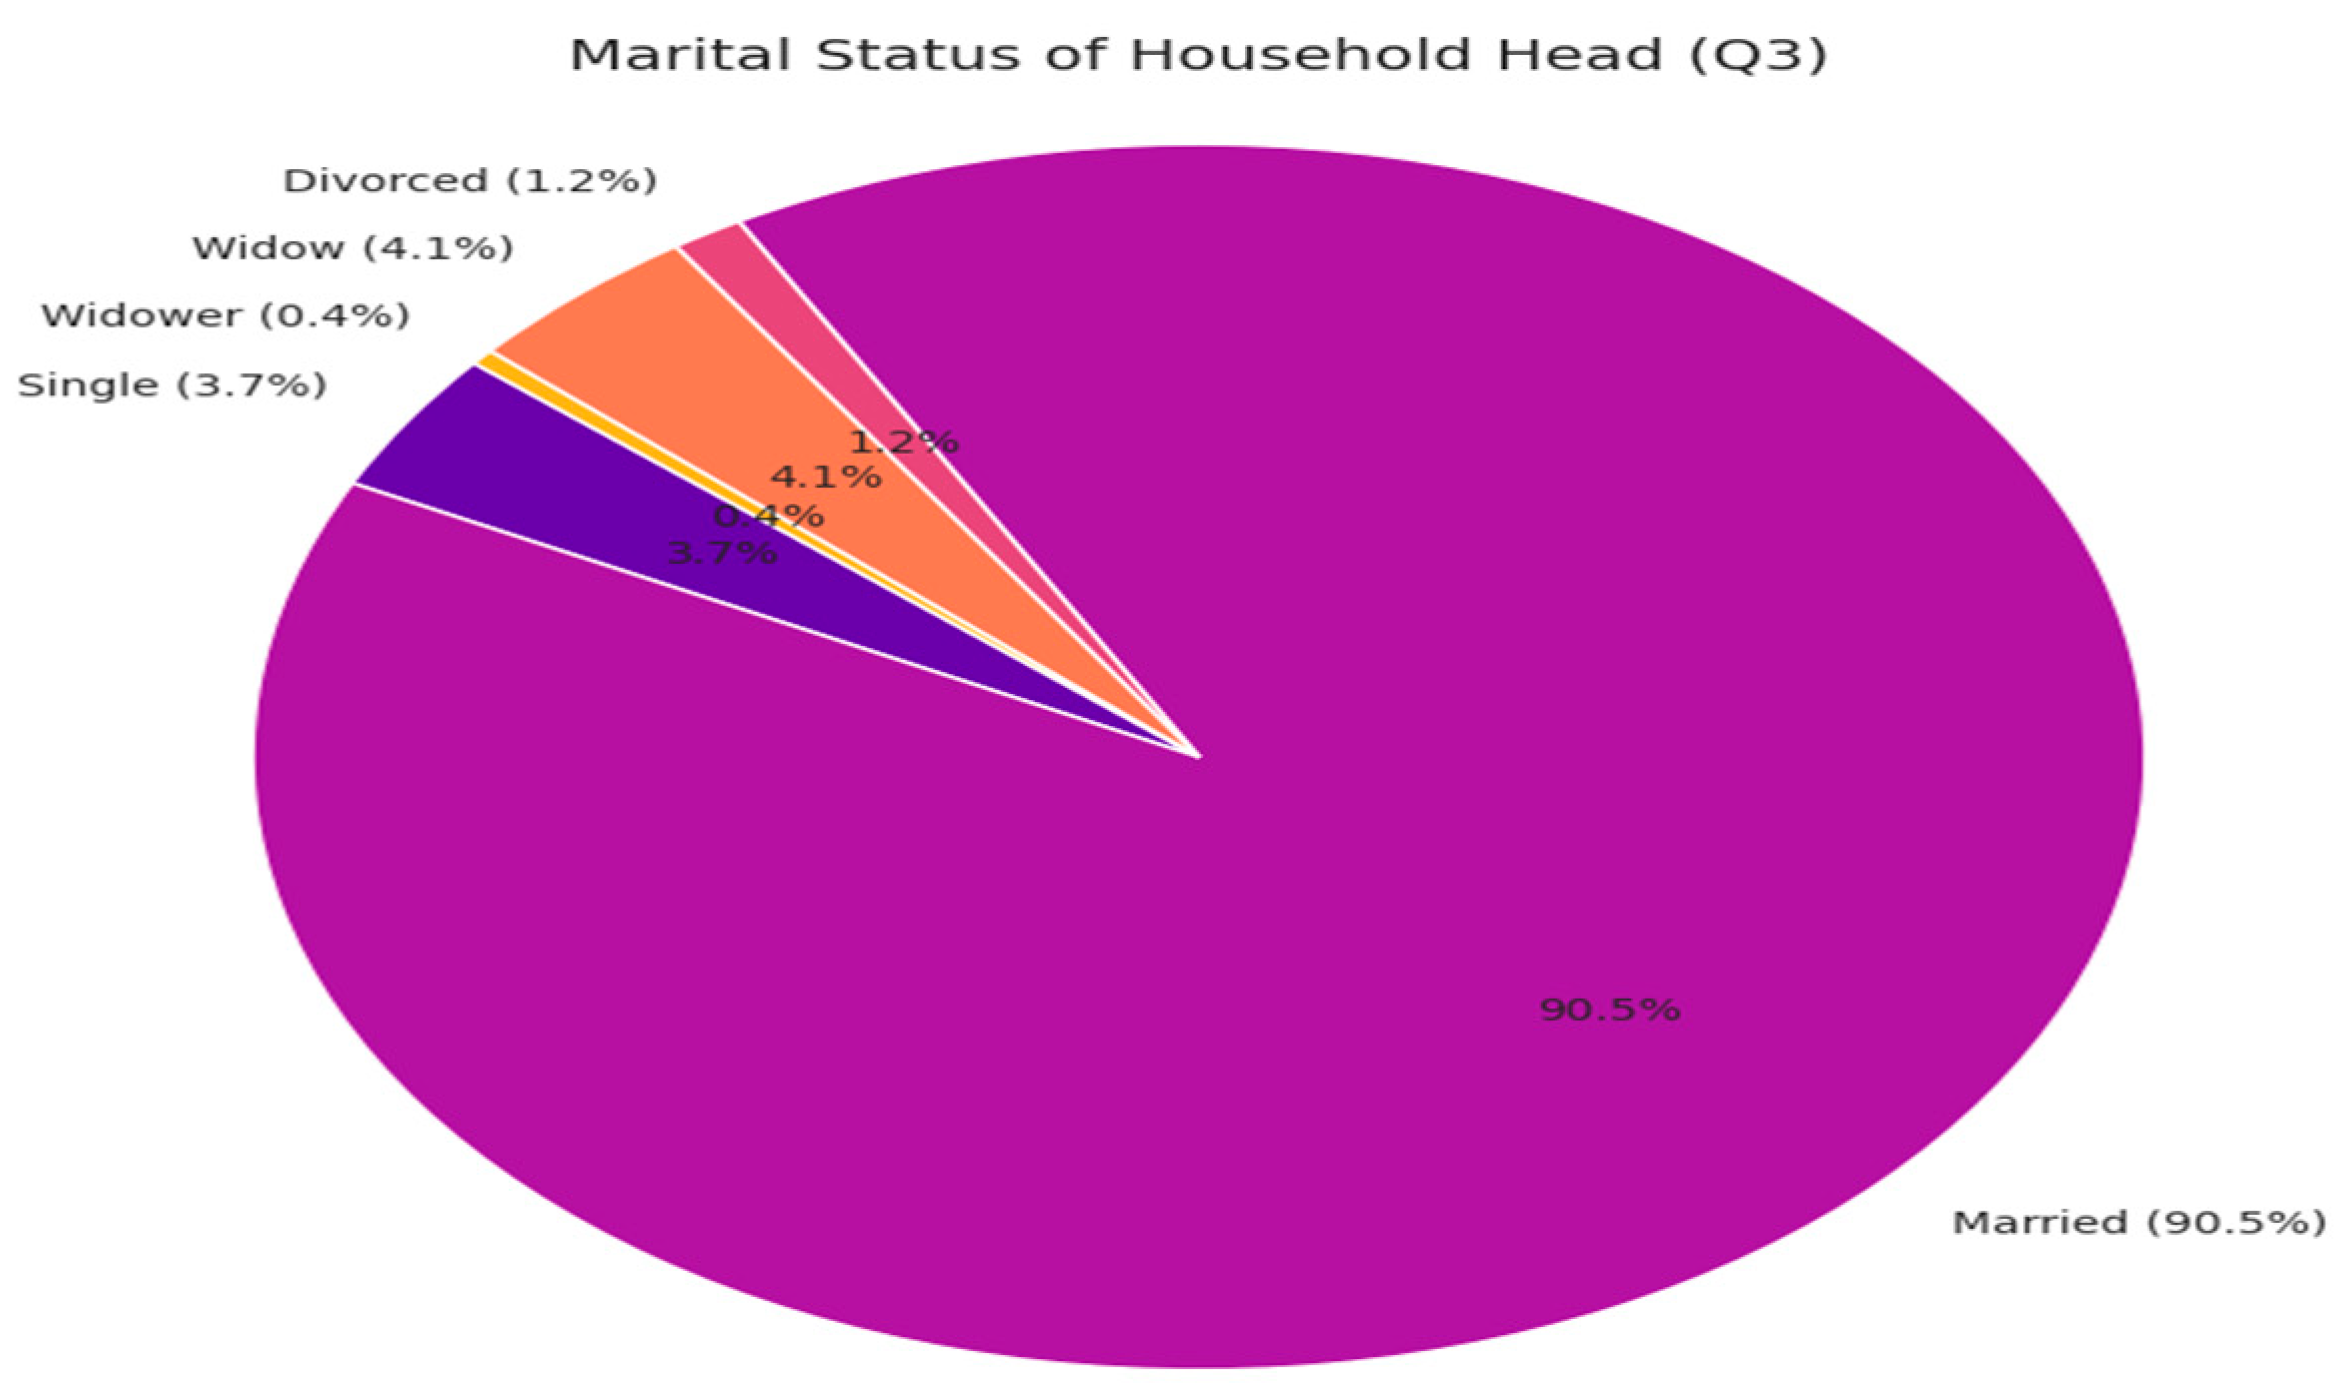
Figure 2.
marital status of the household head.
The data indicates that 90.5% of household heads are married, revealing a strong prevalence of marital partnerships as the dominant household structure. Widows represent the second-largest group at 4.1%, while single (3.7%), divorced (1.2%), and widower-headed households (0.4%) are notably fewer. This distribution suggests that most households operate within family units, which may influence caregiving dynamics, economic resilience, and social support systems.
From a programming perspective, this marital profile supports the effectiveness of family-based interventions, particularly in areas such as livelihoods, psychosocial support, and community resilience. The presence of widows especially in female-headed households warrants targeted assistance, given their likely vulnerability and caregiving burdens. Additionally, the low rates of divorce and single status may reflect cultural norms or underreporting, which should be considered when designing inclusive and context-sensitive support mechanisms.
3.2. Change in Number of Dependents Due to Recent Shocks:
Figure 3.
Change in number of dependents due to recent shocks.
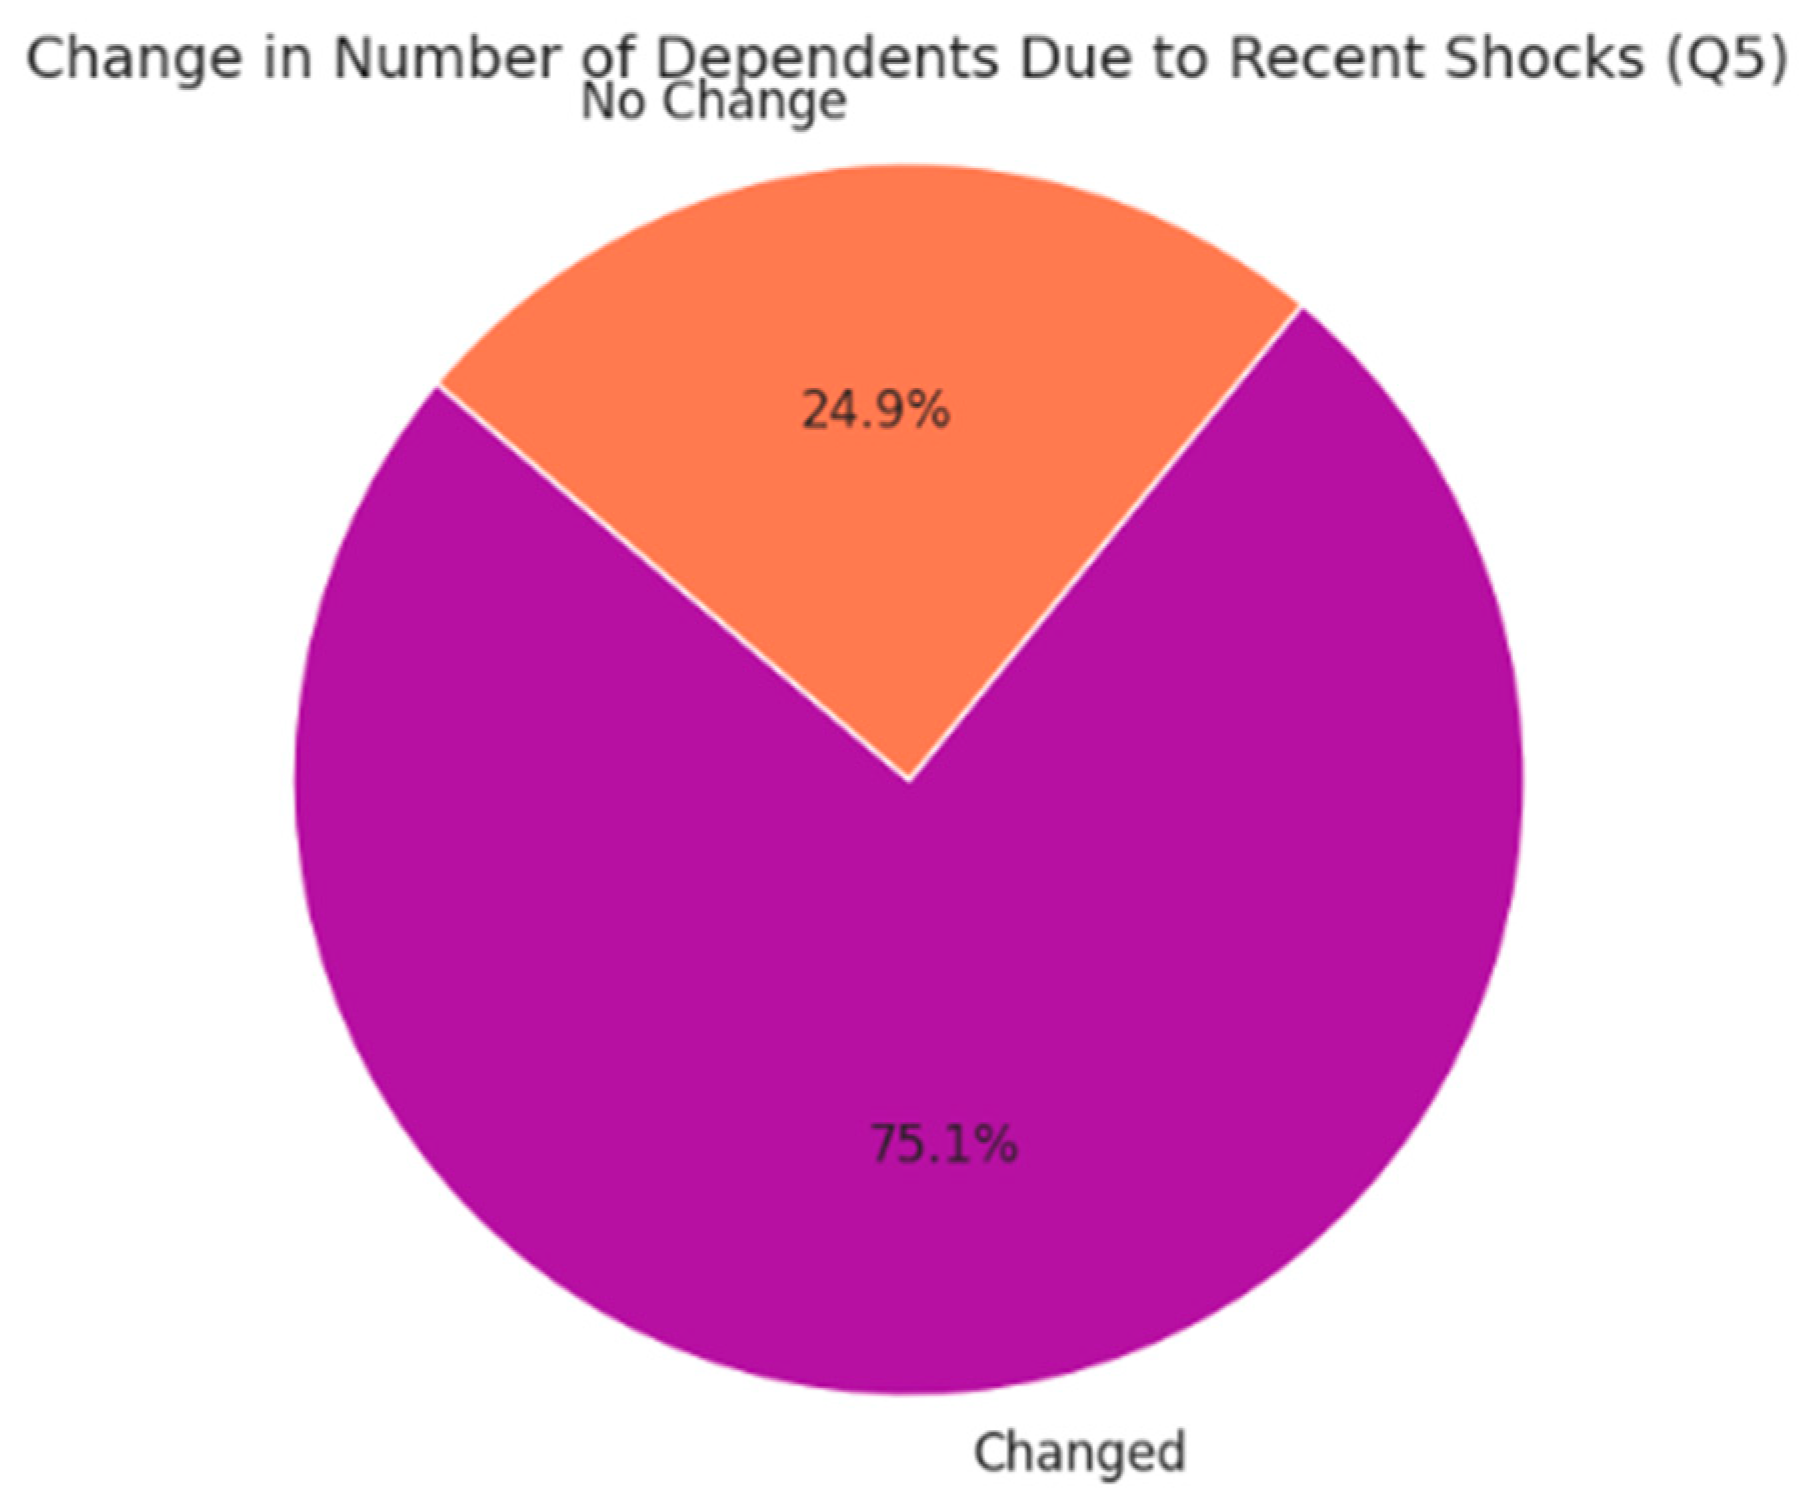
Survey data shows that 75.1% of households experienced a change in the number of dependents following displacement, flooding, or other shocks suggesting widespread household restructuring. These shifts likely stem from fragmentation, merging of families, increased caregiving roles (such as hosting displaced relatives), or the loss of dependents due to migration or mortality. Such dynamics have direct implications for humanitarian response, particularly in the provision of food, shelter, and education. Monitoring dependency ratios will be essential for refining vulnerability assessments and ensuring equitable resource distribution.
Gender-disaggregated data reveals that female-headed households are disproportionately affected, with approximately 75% reporting increased dependents often linked to caregiving burdens, widowhood, or family merging post-displacement. In contrast, male-headed households show lower rates of change, and married households may offer more structural resilience, though they still face considerable strain. These findings underscore the need for targeted social protection measures, especially for women-led and widowed families, to address heightened vulnerability and support recovery in the wake of environmental and social shocks.
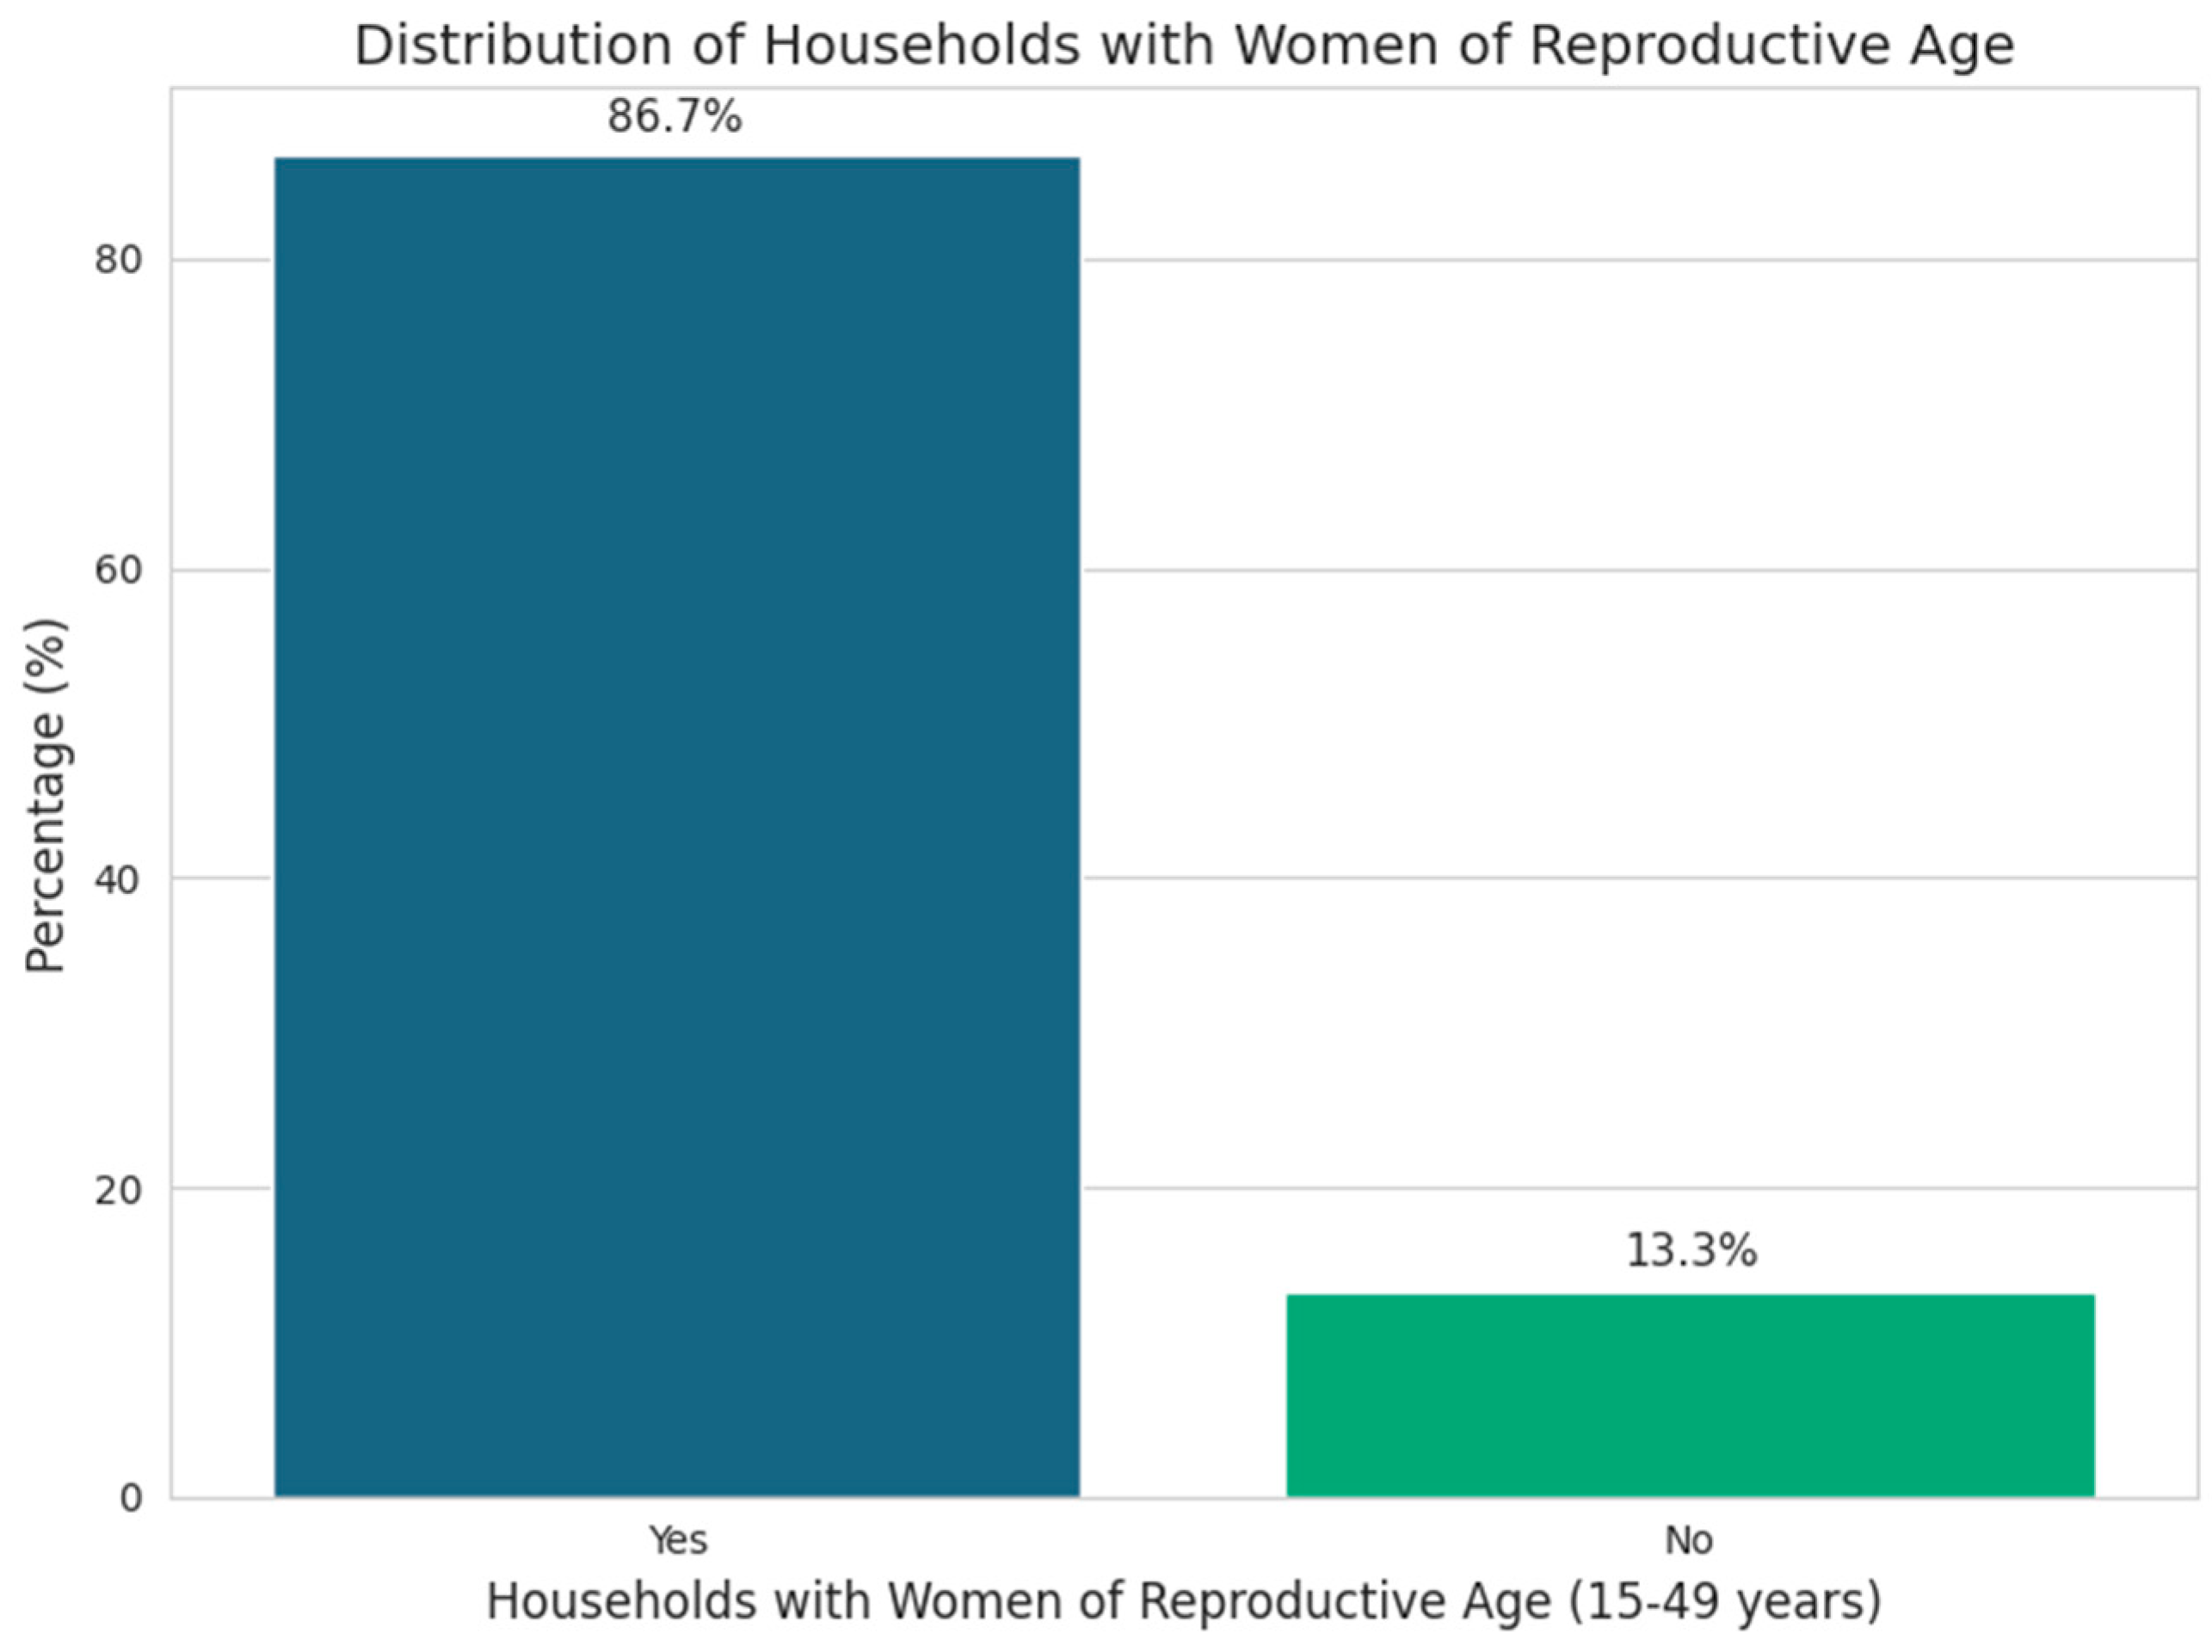
Figure 4.
Distribution of women of reproductive age.
This visualization helps quickly convey the prevalence of reproductive-age women across surveyed households, which could be crucial for planning maternal health services, family planning outreach, or gender-focused interventions.
The bar chart shows that 86.7% of households include women of reproductive age, while only 13.3% do not—highlighting the widespread presence of this demographic across the surveyed population. This prevalence is a critical planning indicator for maternal health services, family planning outreach, and gender-focused interventions, underscoring the need for targeted resource allocation and inclusive programming that addresses the specific health and protection needs of women in reproductive age groups.
3.3. Main Household Income Sources
Figure 5.
distribution of main household income sources.
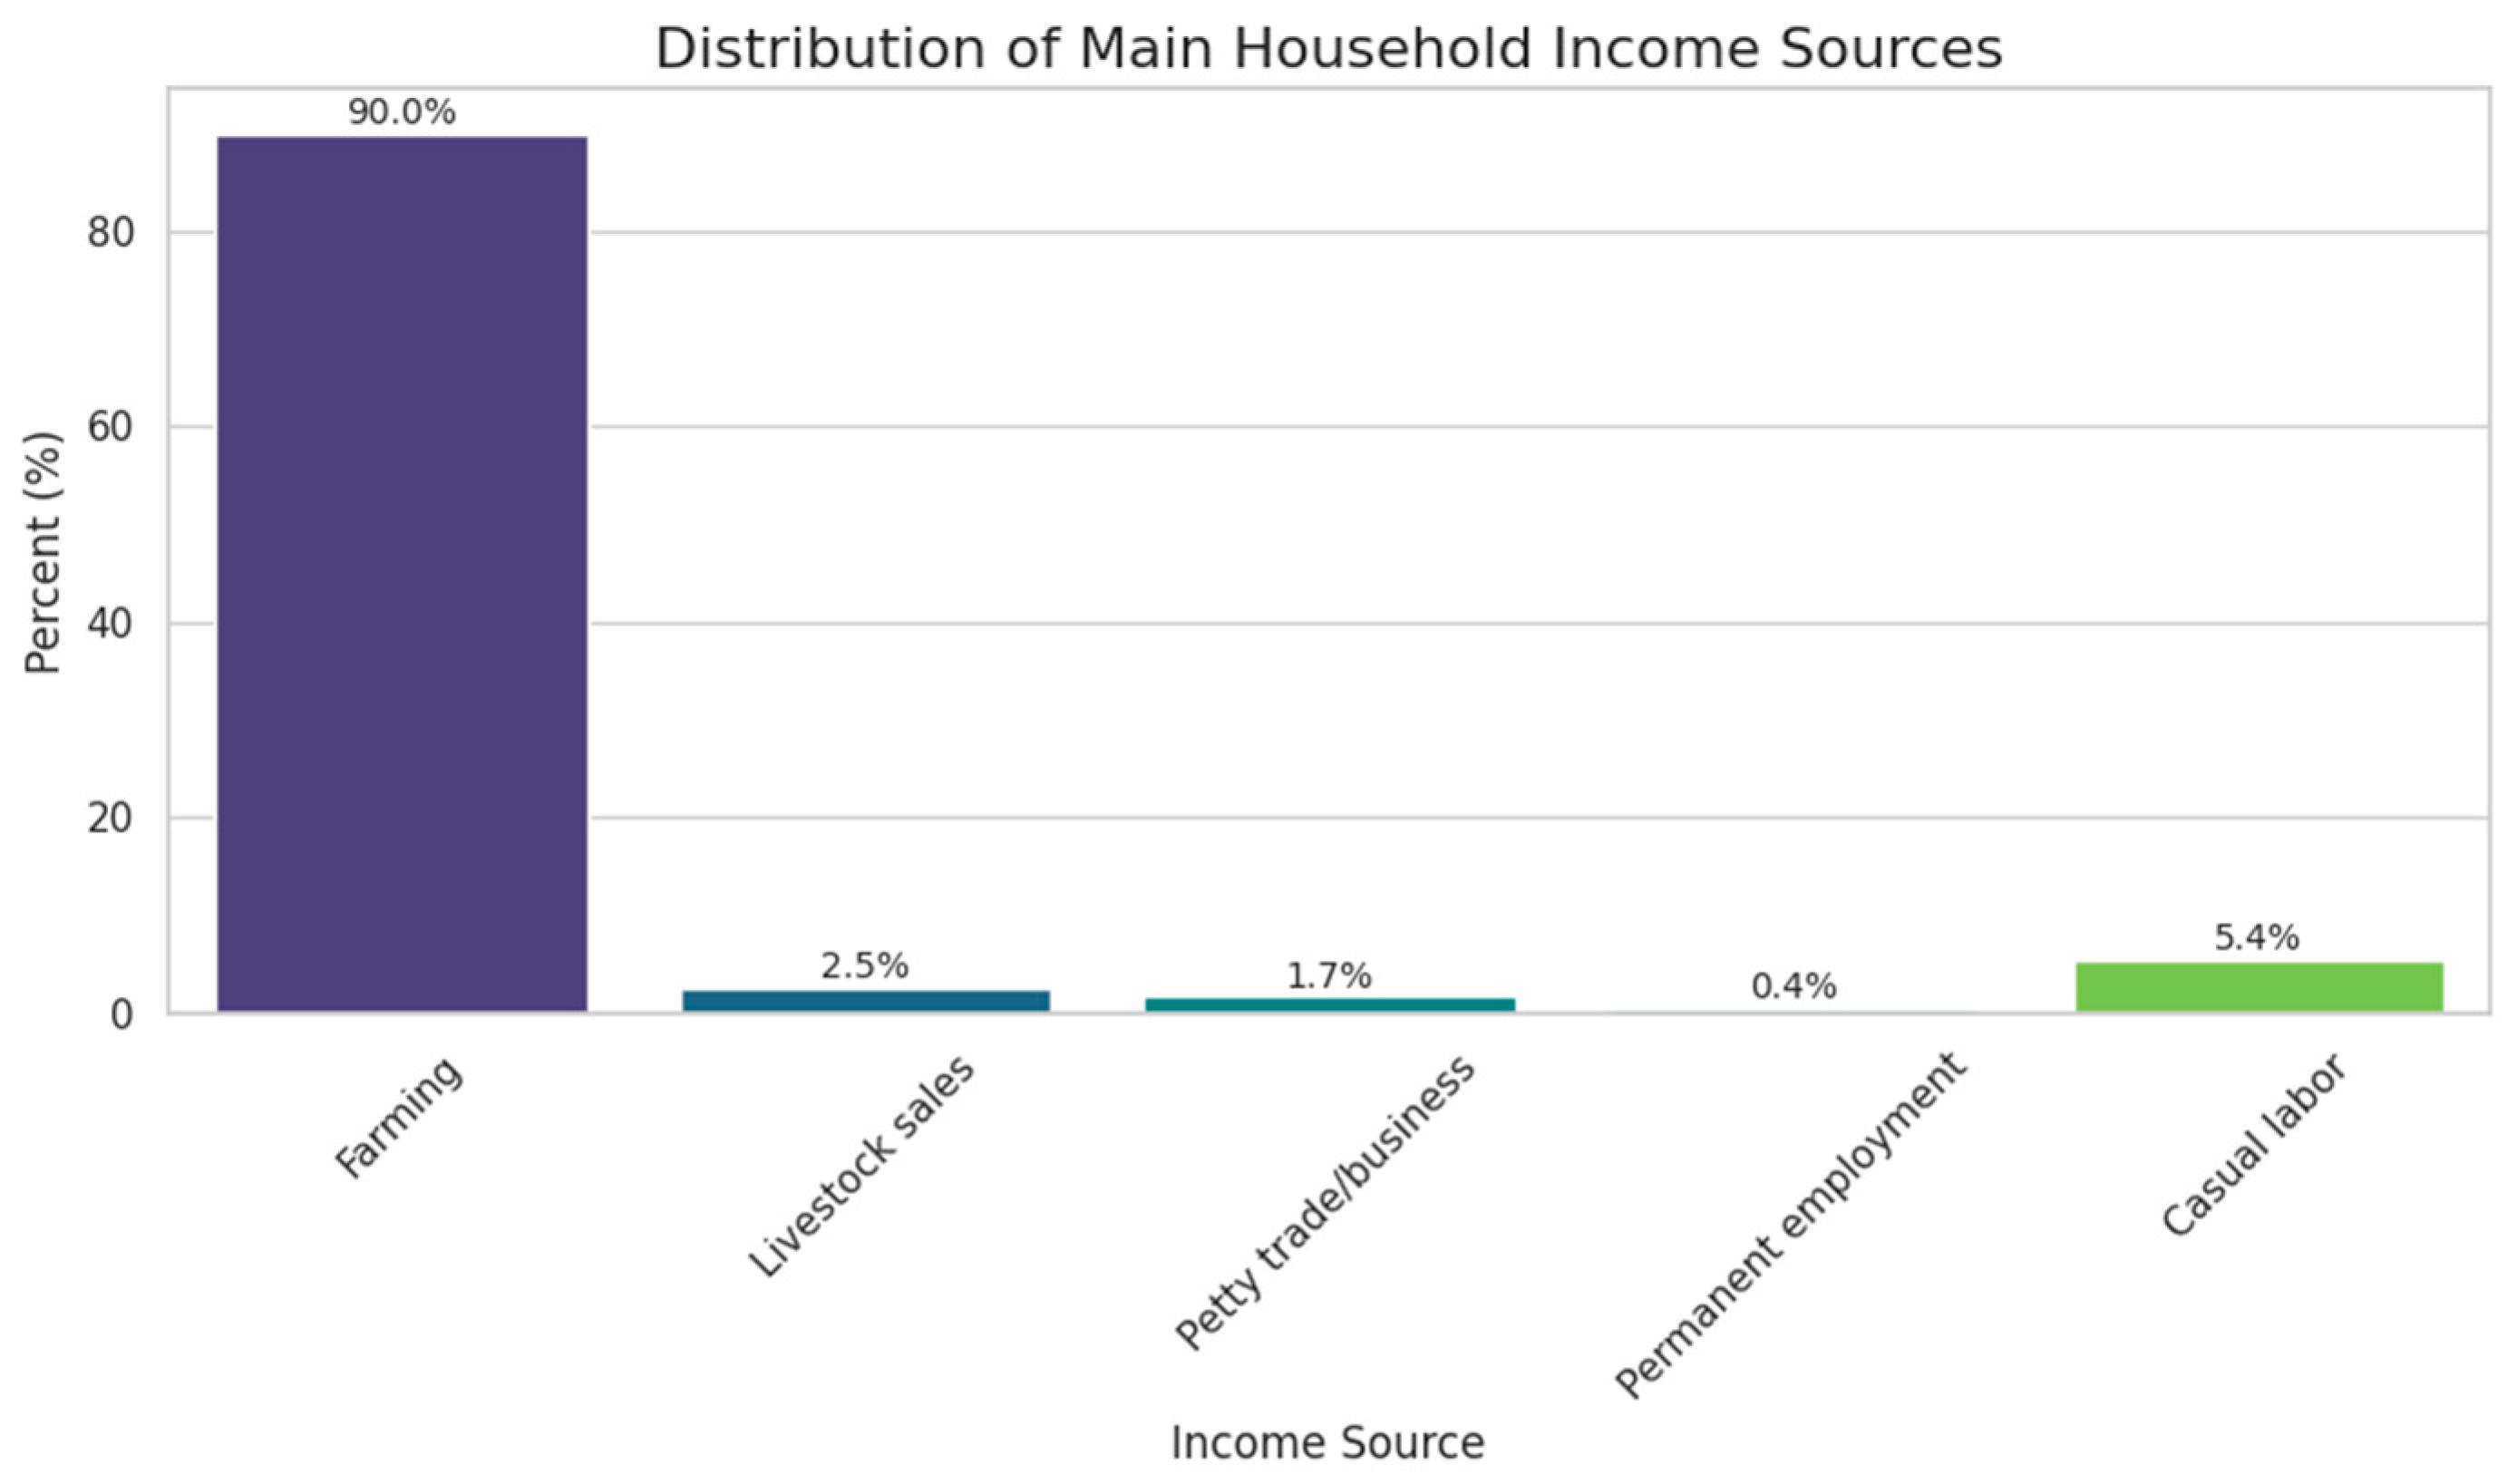
Farming dominates as the primary livelihood source for 90.0% of households, underscoring the community’s deep agrarian dependency, while casual labor (5.4%) offers limited diversification. Marginal contributions from livestock sales (2.5%), petty trade (1.7%), and permanent employment (0.4%) further emphasize the narrow economic base. This distribution signals the need for targeted interventions in agricultural resilience, income diversification, and rural enterprise development to enhance economic stability and reduce vulnerability to climate and market shocks.
3.4. Availability of Support Services for GBV Survivors
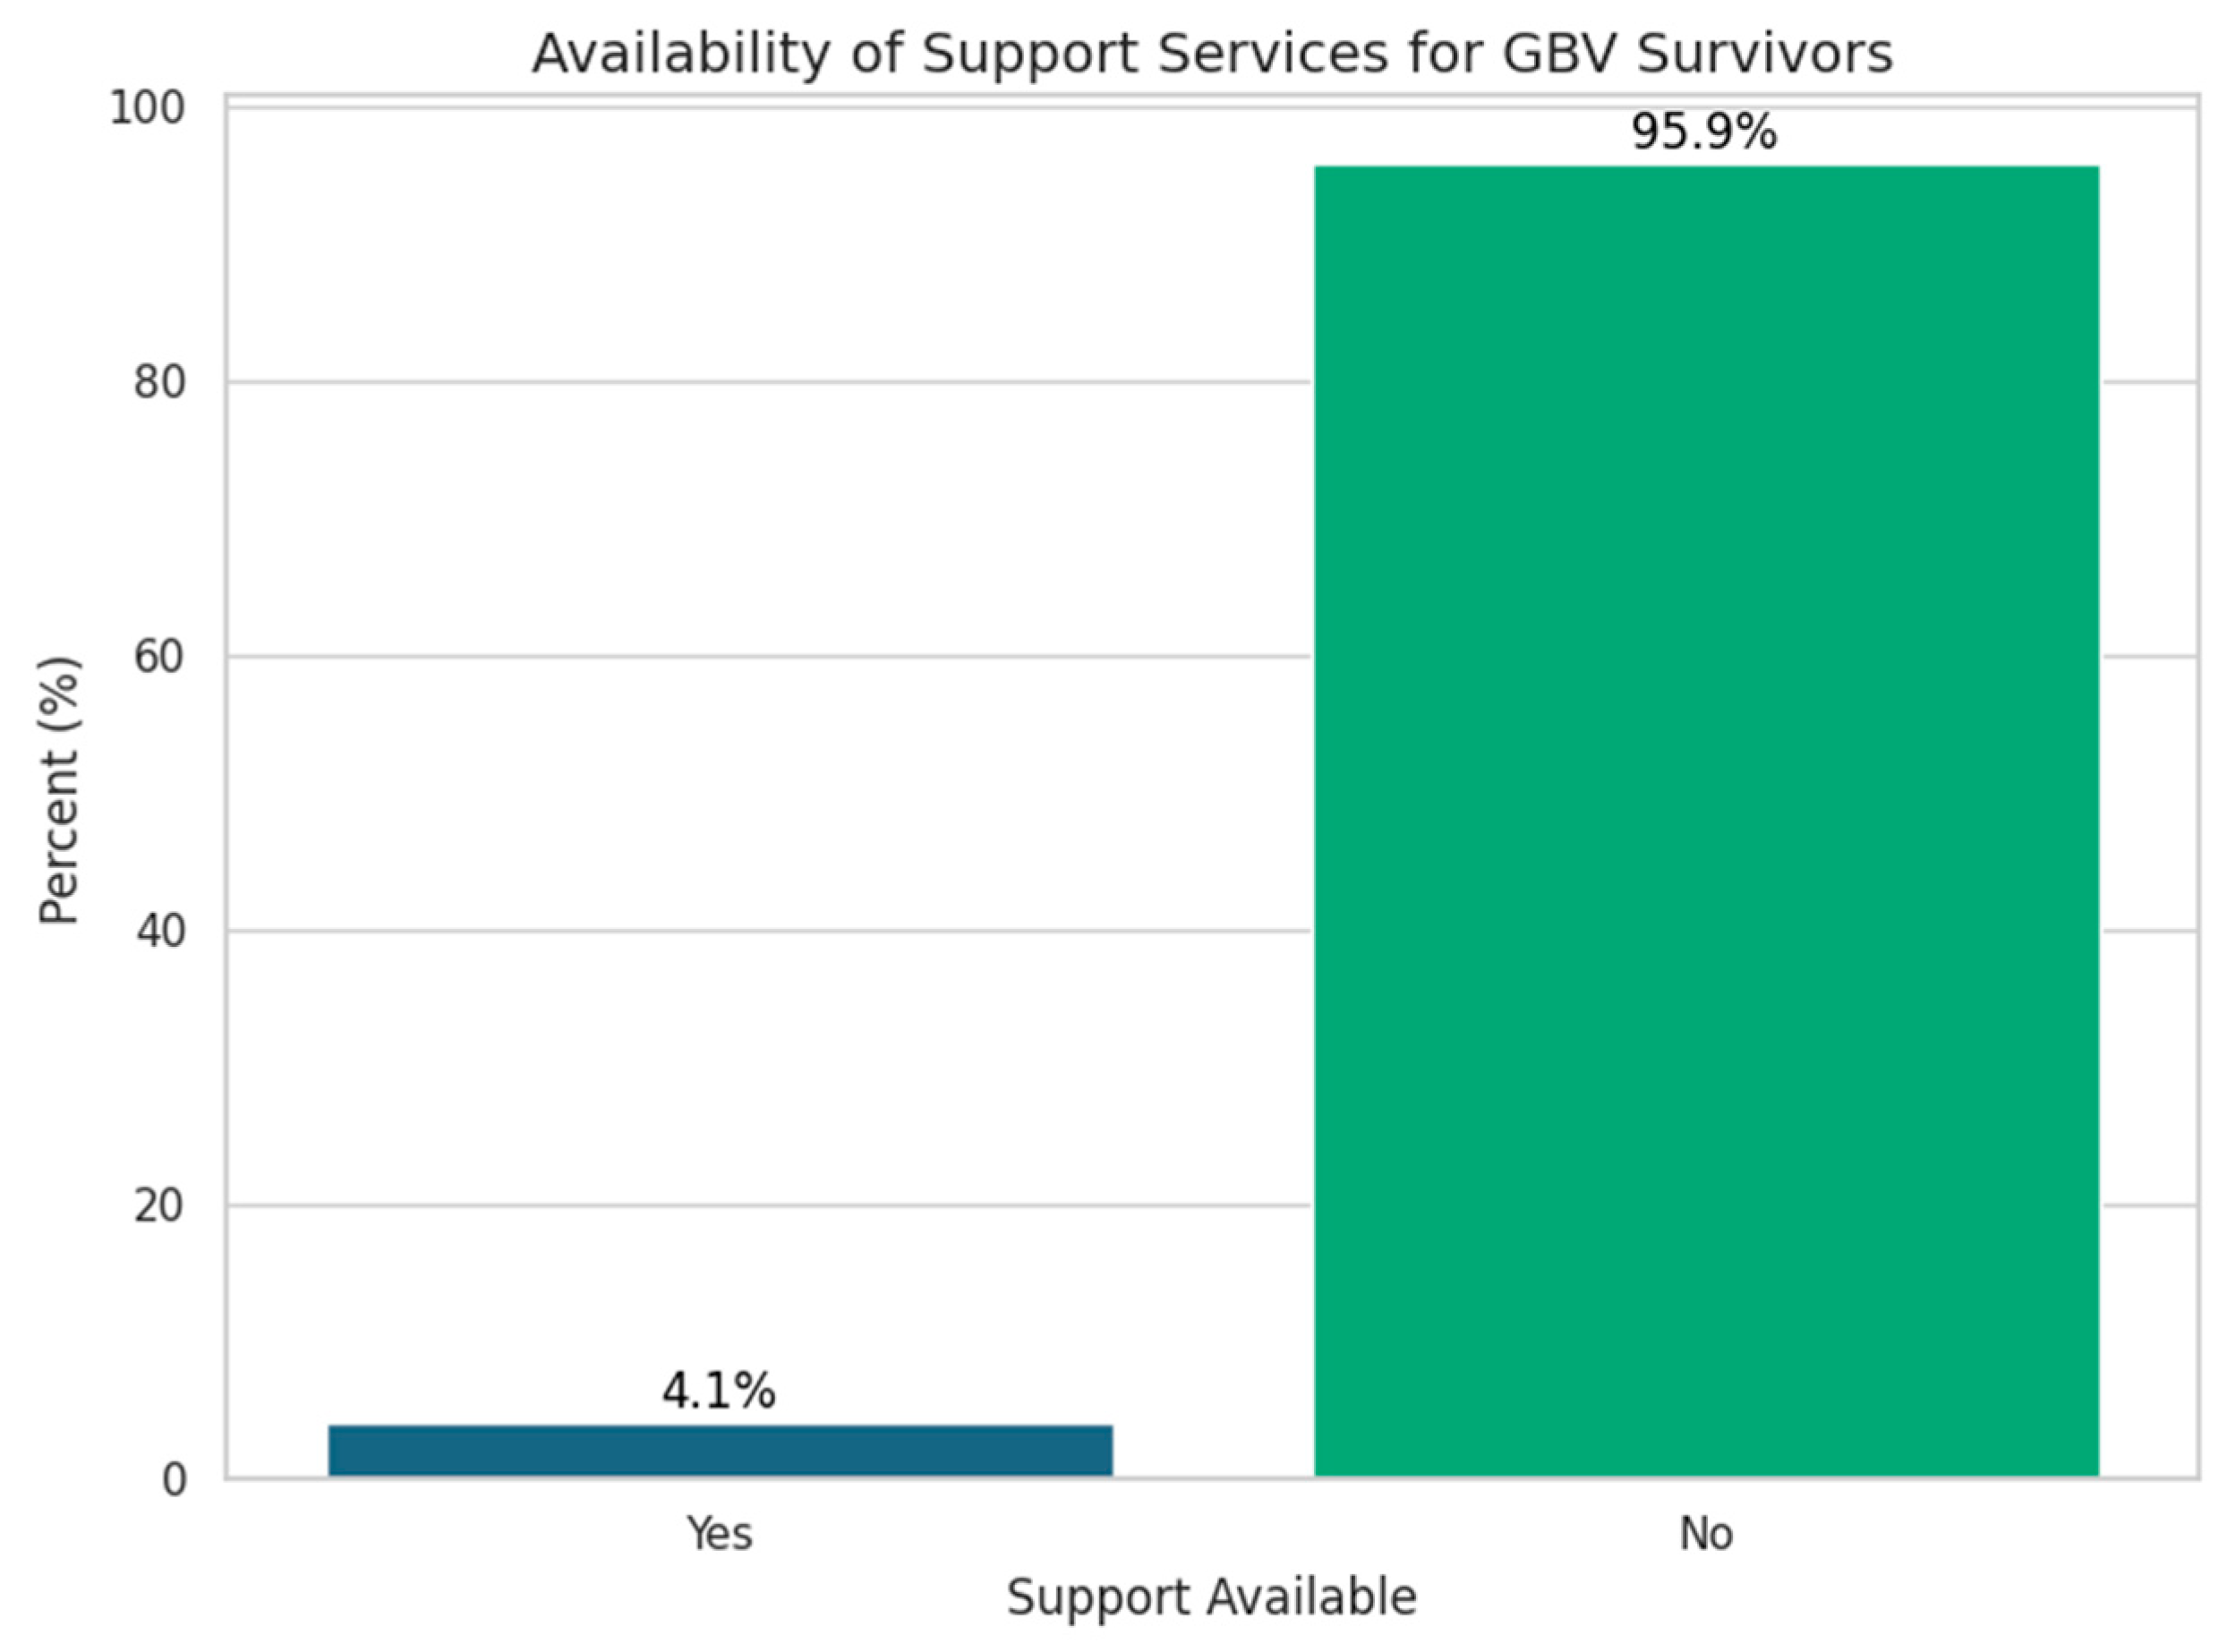
Figure 6.
Availability of support services for GBV survivors.
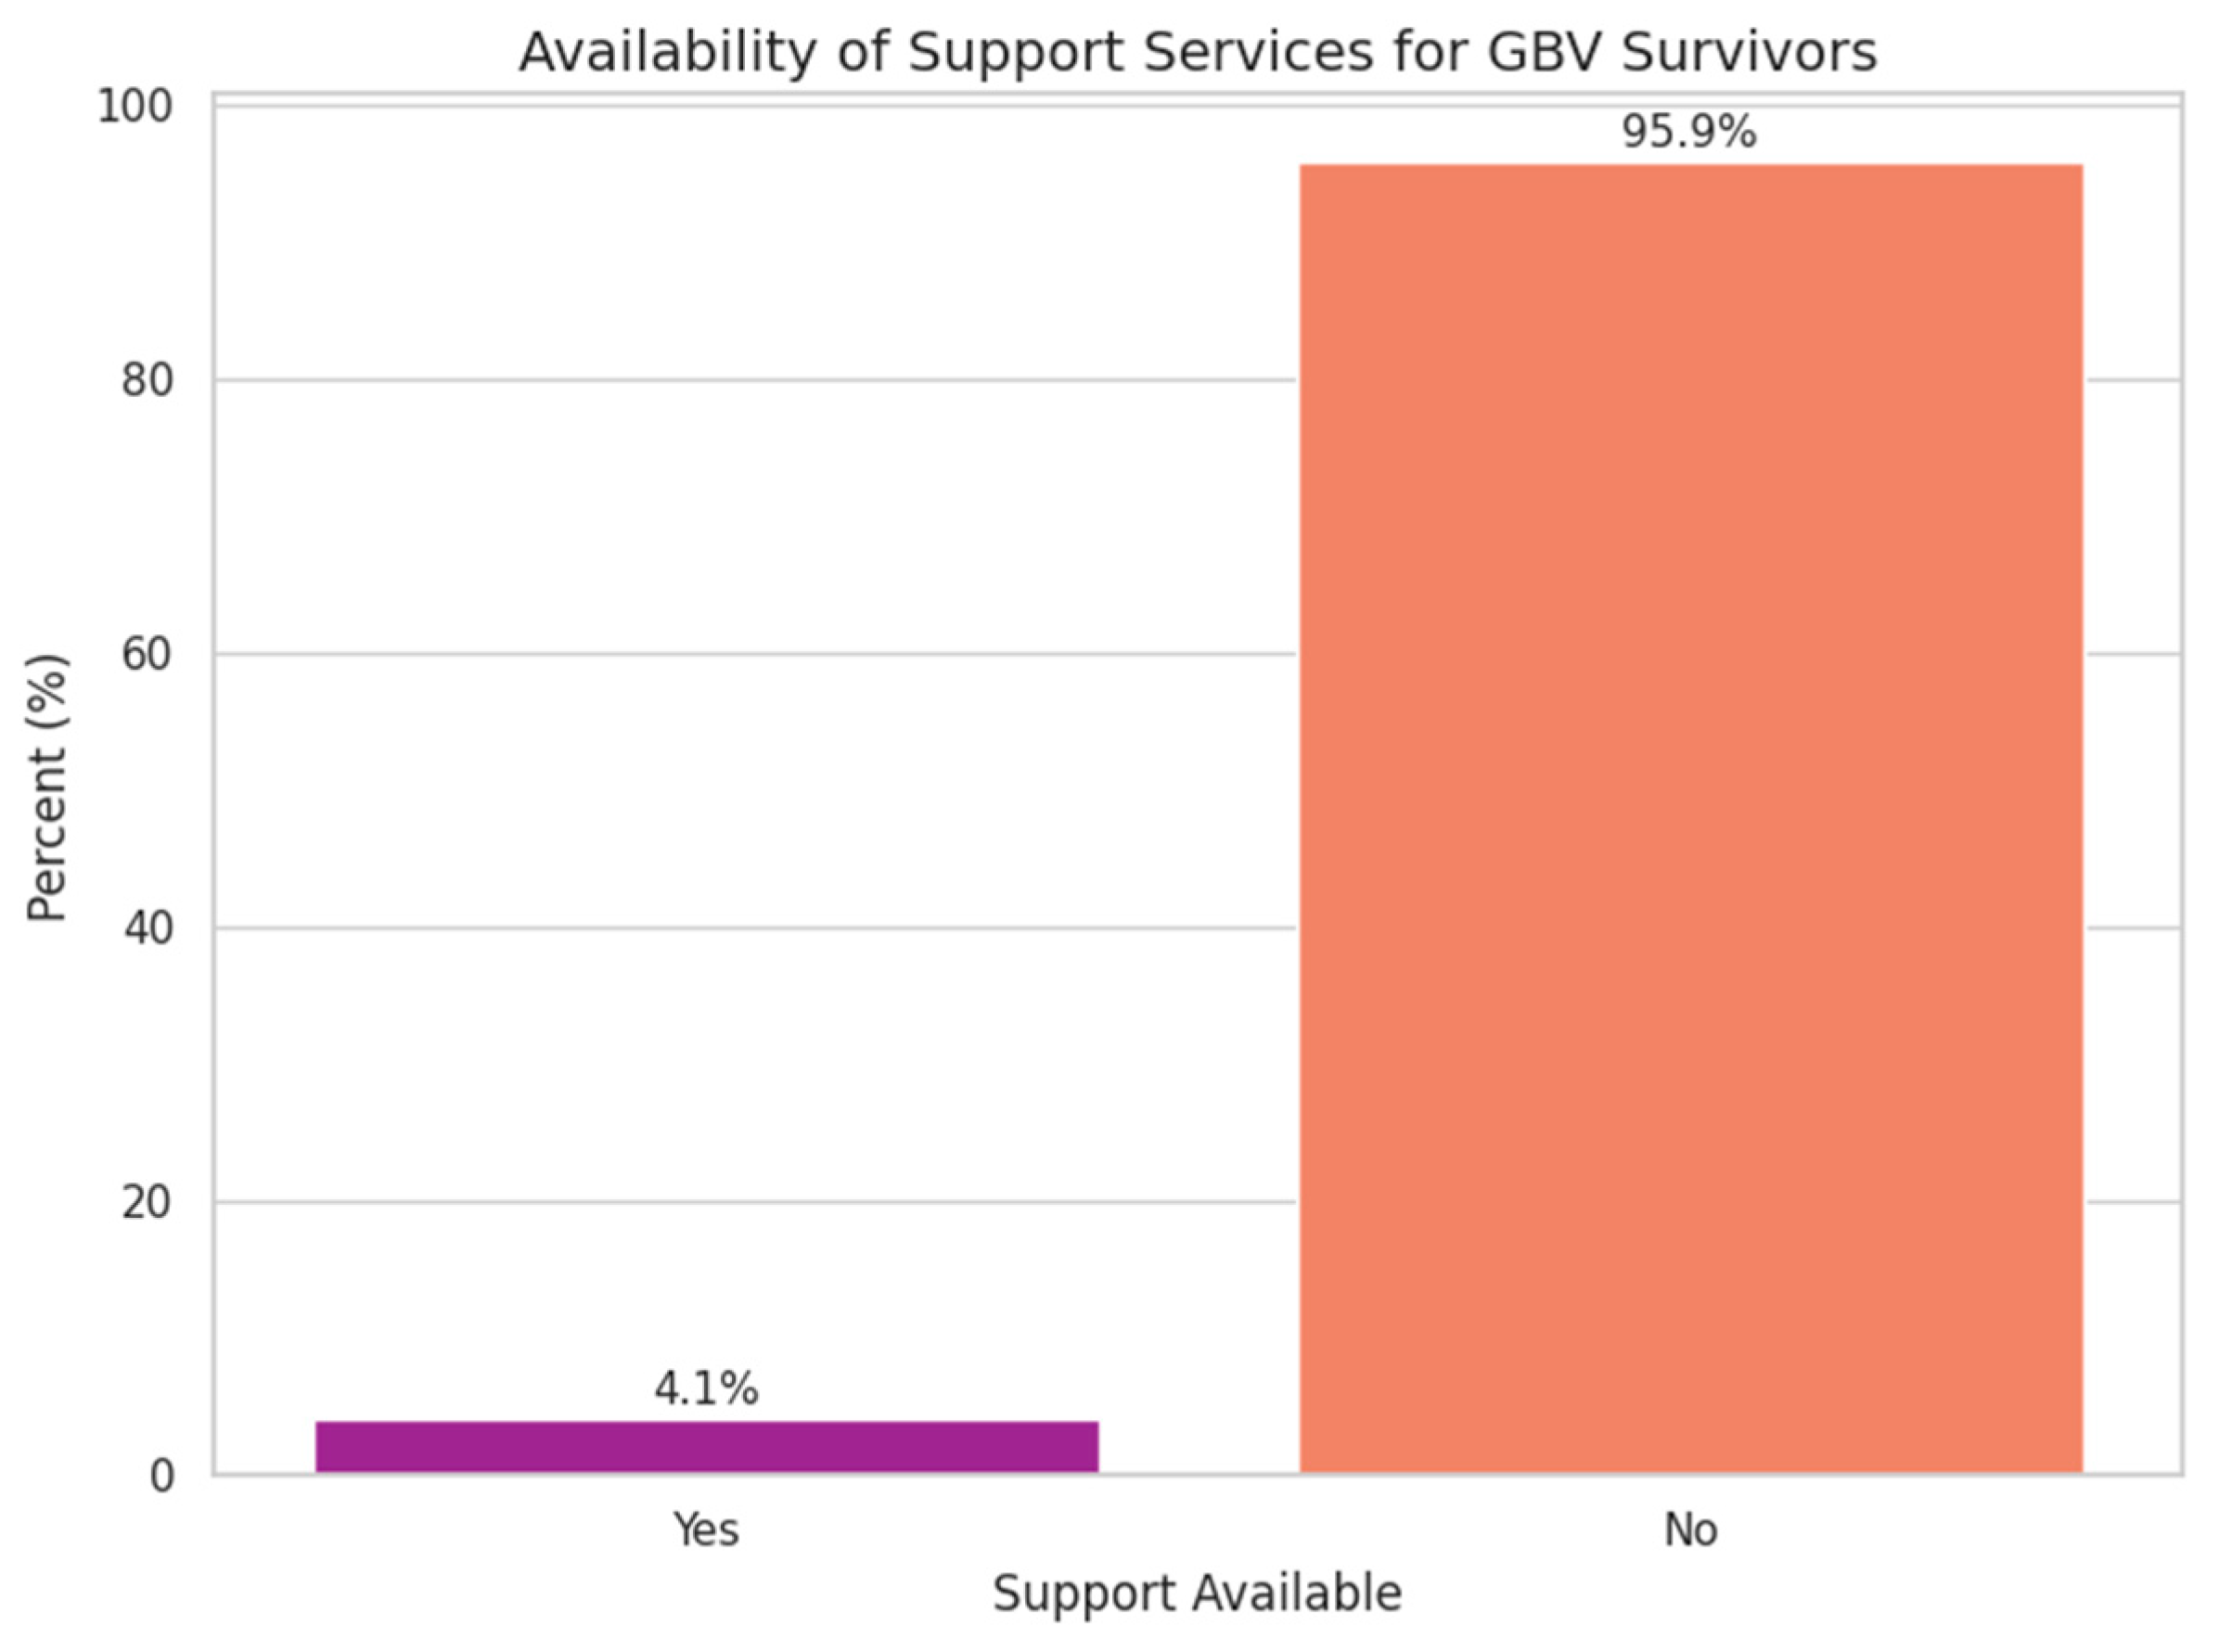
The bar chart reveals a stark disparity in service availability, with only 4.1% of households reporting access to health, psychosocial, or legal support services, while an overwhelming 95.9% remain without these critical resources. This pronounced gap highlights the urgent need for targeted advocacy, policy engagement, and resource mobilization—particularly in high-risk areas where gender-based violence persists and survivors face entrenched barriers to care. Strengthening service coverage and accessibility is essential to ensure protection, dignity, and recovery for affected populations.
3.5. Households with Members Who Have a Disability
Figure 7.
Distribution of households with disabled members.
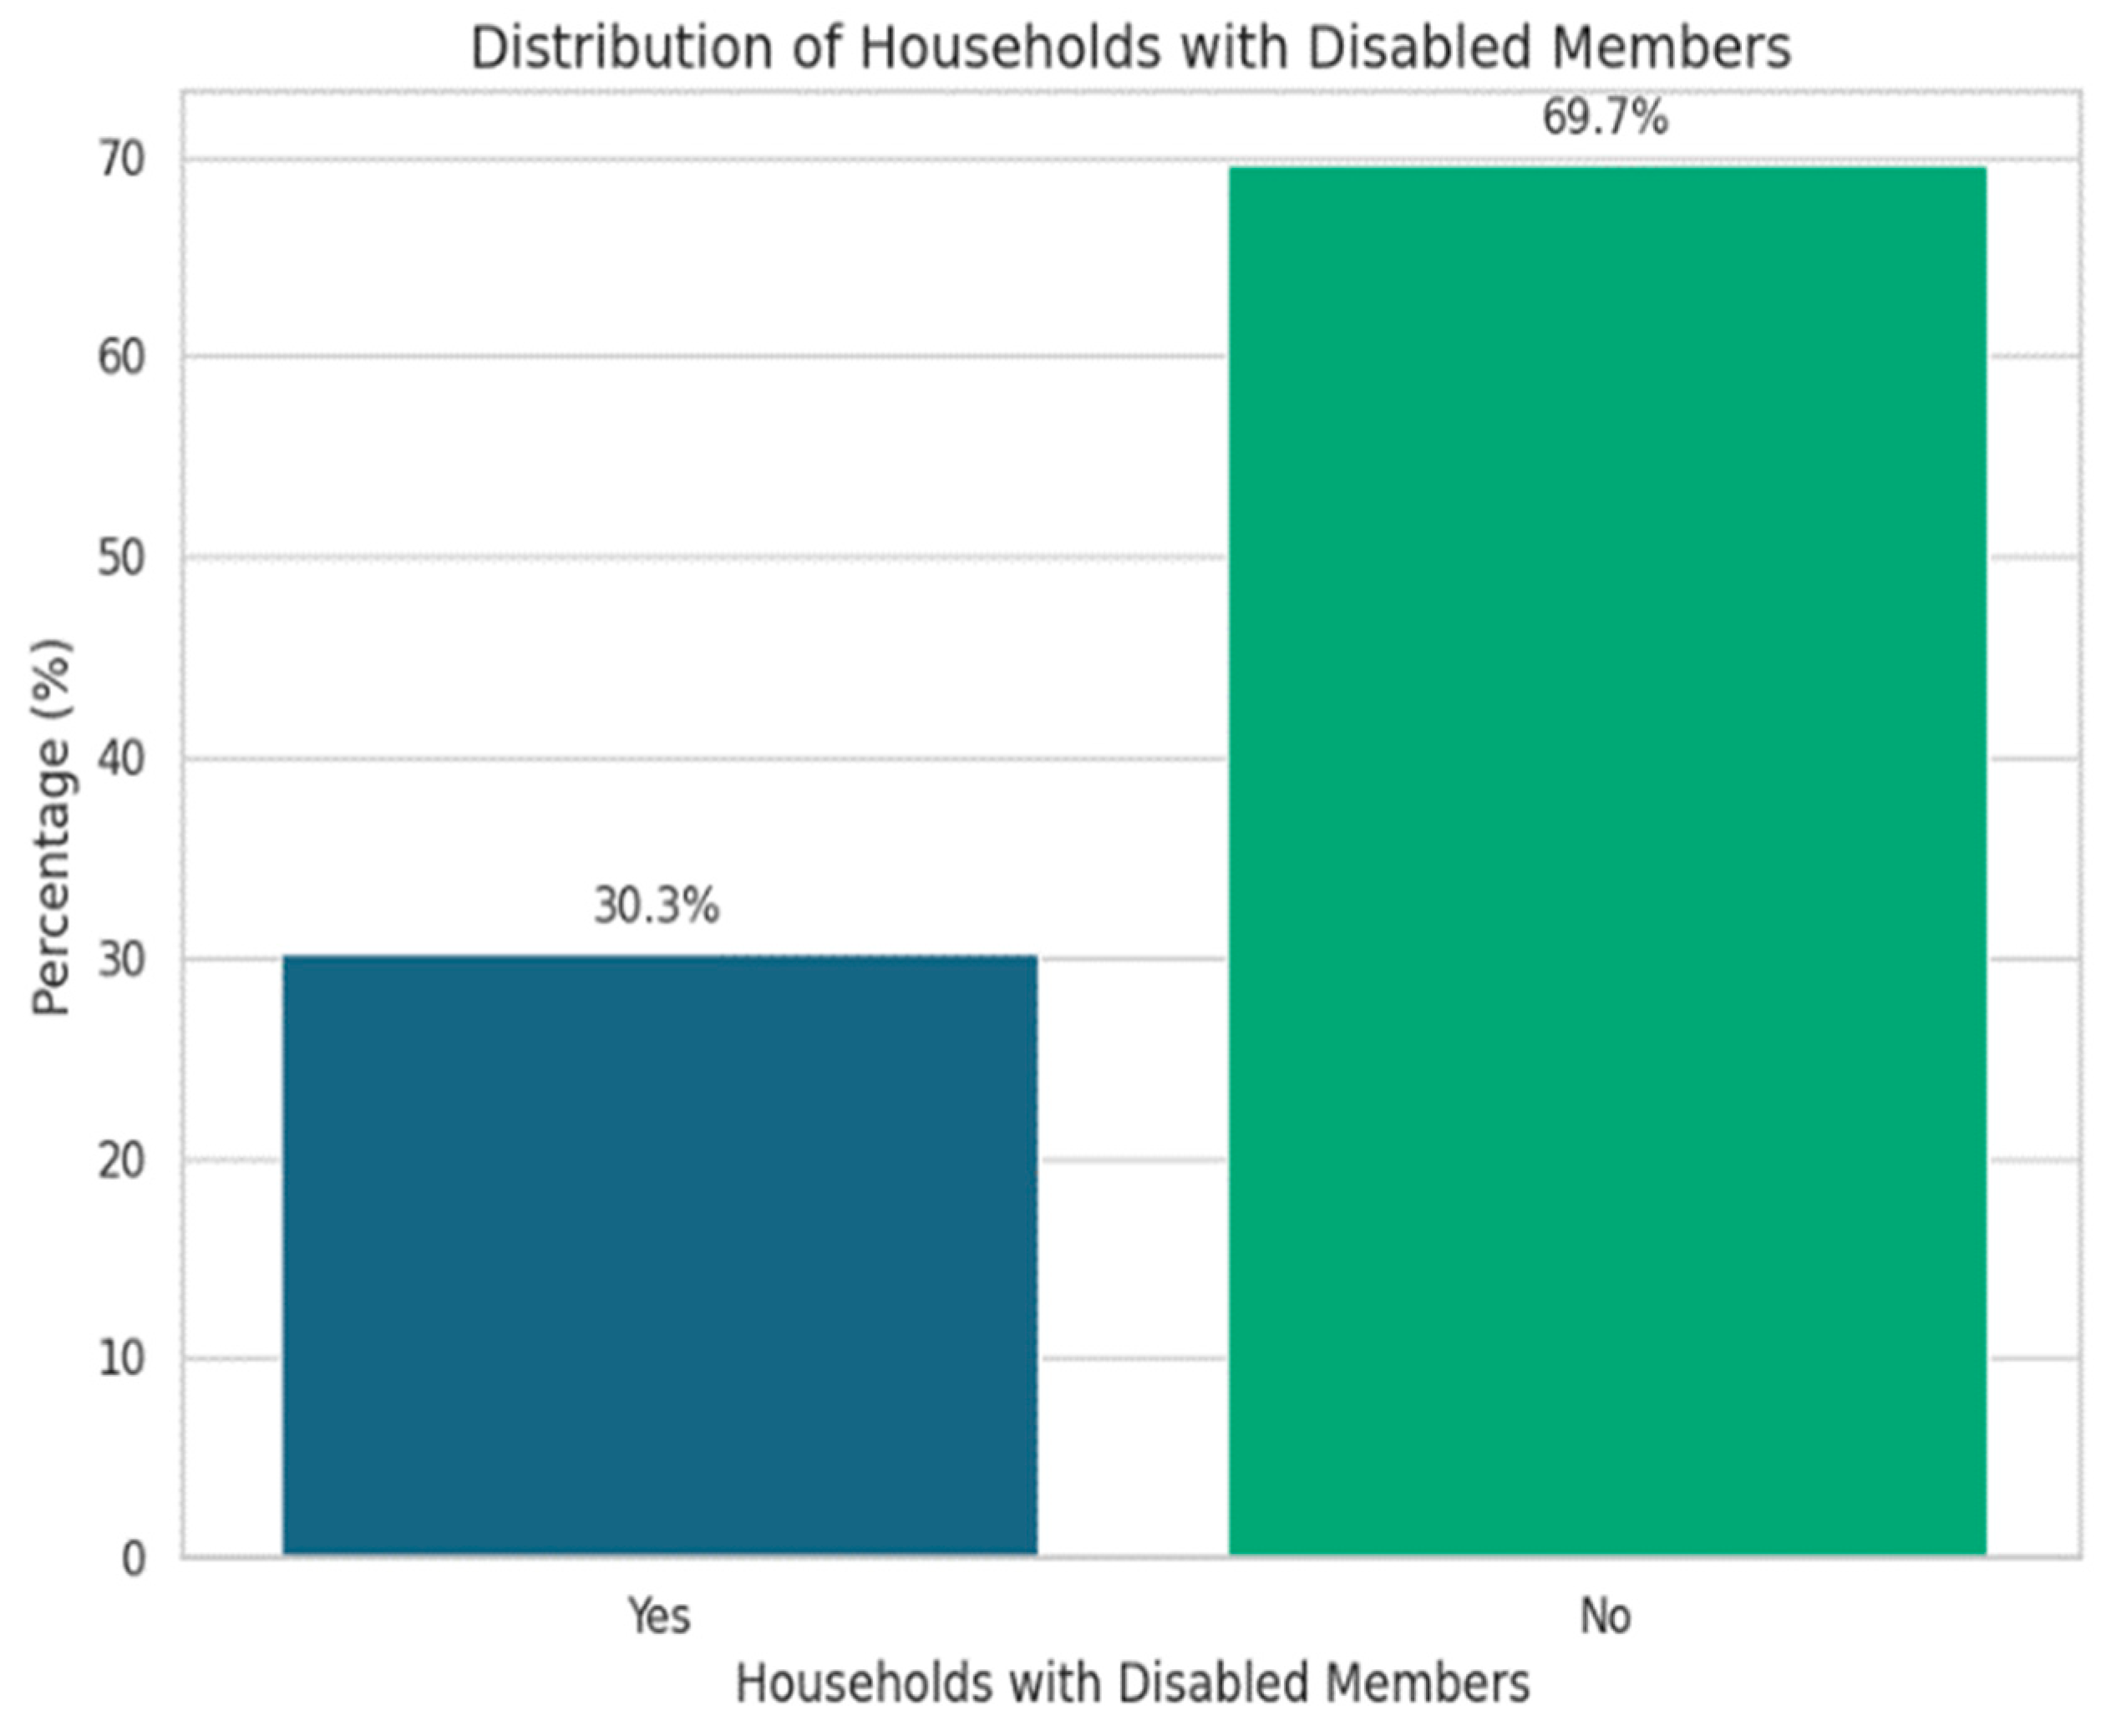
This distribution highlights that nearly 1 in 3 households include a member with a disability an important insight for inclusive planning, accessibility audits, and targeted social support.
The data shows that 30.3% of households include a member with a disability, while 69.7% do not indicating that nearly one in three households face unique accessibility and support needs. This insight is critical for inclusive planning, as it underscores the importance of integrating disability considerations into infrastructure design, service delivery, and social protection programs. Targeted interventions and accessibility audits are essential to ensure equitable access and participation for all community members.
3.6. Availability of Safe Spaces for Women and Children in the Community
Figure 8.
availability of safe spaces for women and children.
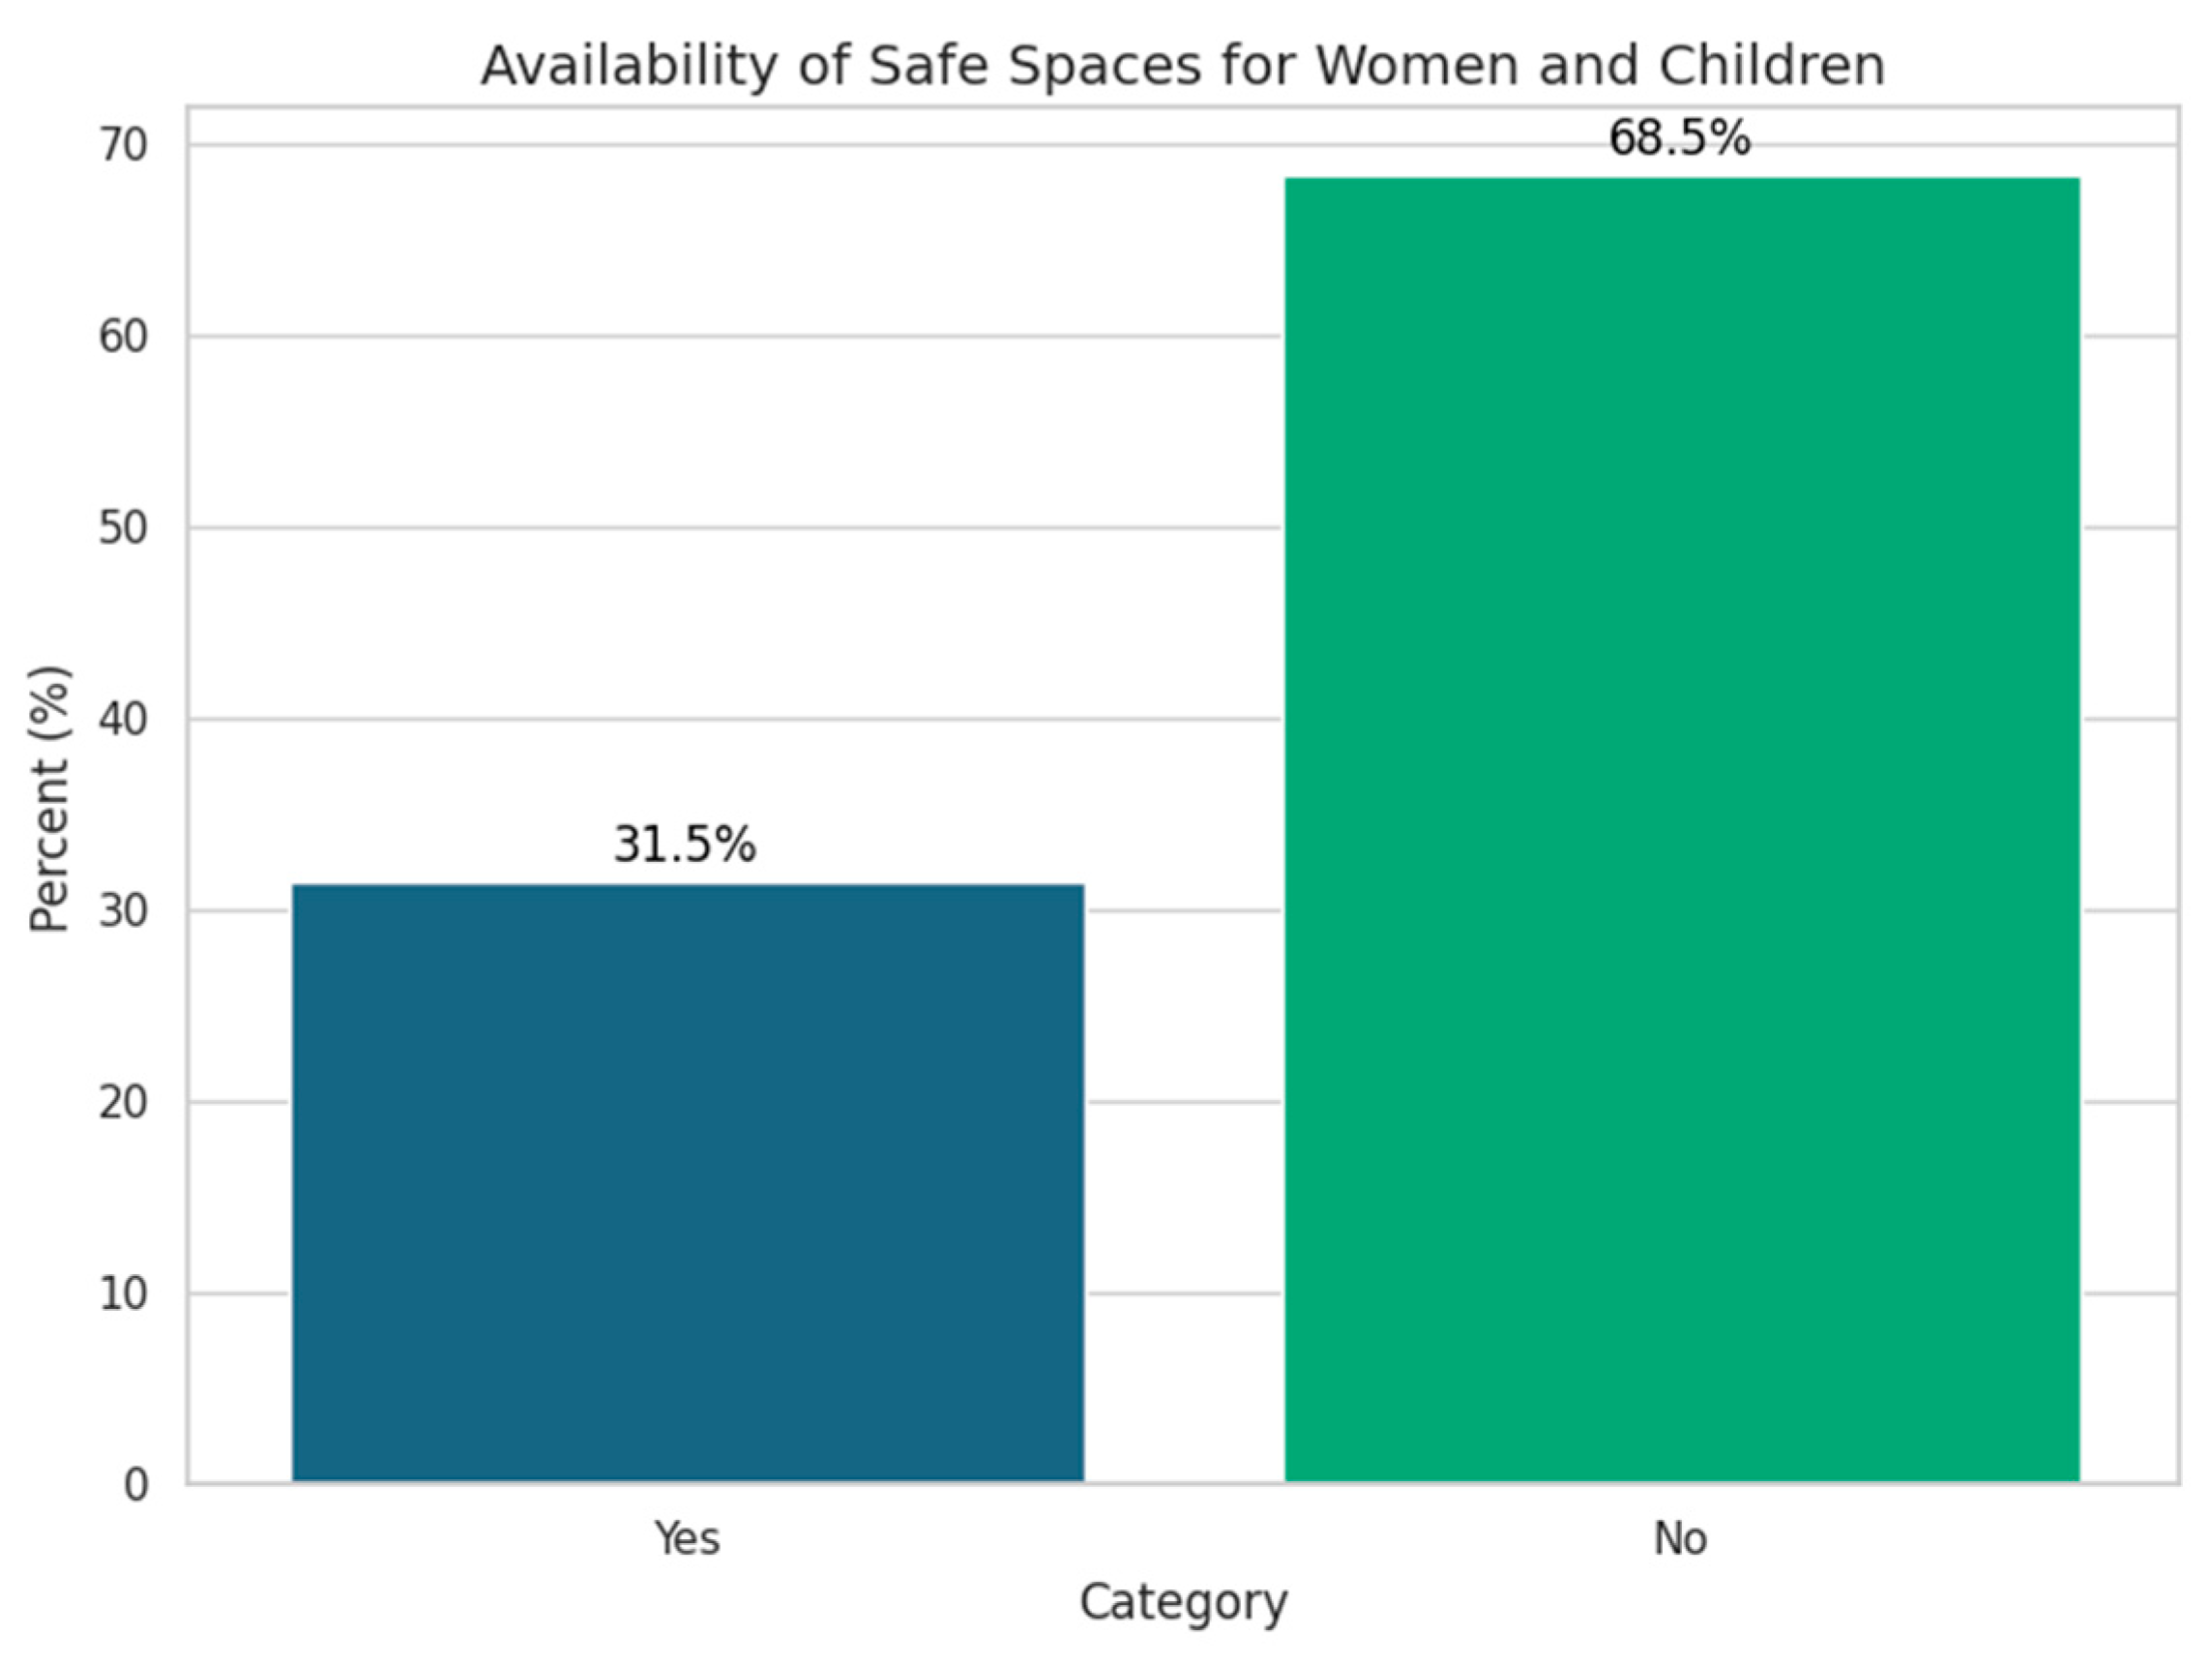
Only 31.5% of households report the presence of safe spaces for women and children, while 68.5% indicate such spaces are unavailable underscoring a substantial gap in protective infrastructure for vulnerable groups. Although a minority benefit from existing safe environments, the majority remain exposed to risk without access to secure, supportive settings. This calls for urgent investment in community-based interventions, targeted policy support, and resource mobilization to expand safe space coverage and ensure inclusive protection across all households.
3.7. Availability of Support Services for GBV Survivors
Figure 9.
Availability of support services for GBV Survivors.
The bar chart reveals a stark service gap: just 4.1% of households report access to health, psychosocial, or legal support services, while an overwhelming 95.9% remain without these essential resources. This disparity underscores a critical shortfall in community care infrastructure. When considered alongside Q31 where 31.5% of households report access to safe spaces it becomes clear that although some protective environments exist, they are seldom reinforced by formal support systems, leaving vulnerable populations without the comprehensive assistance they need.
3.8. Access to Platforms for Raising Community Concerns
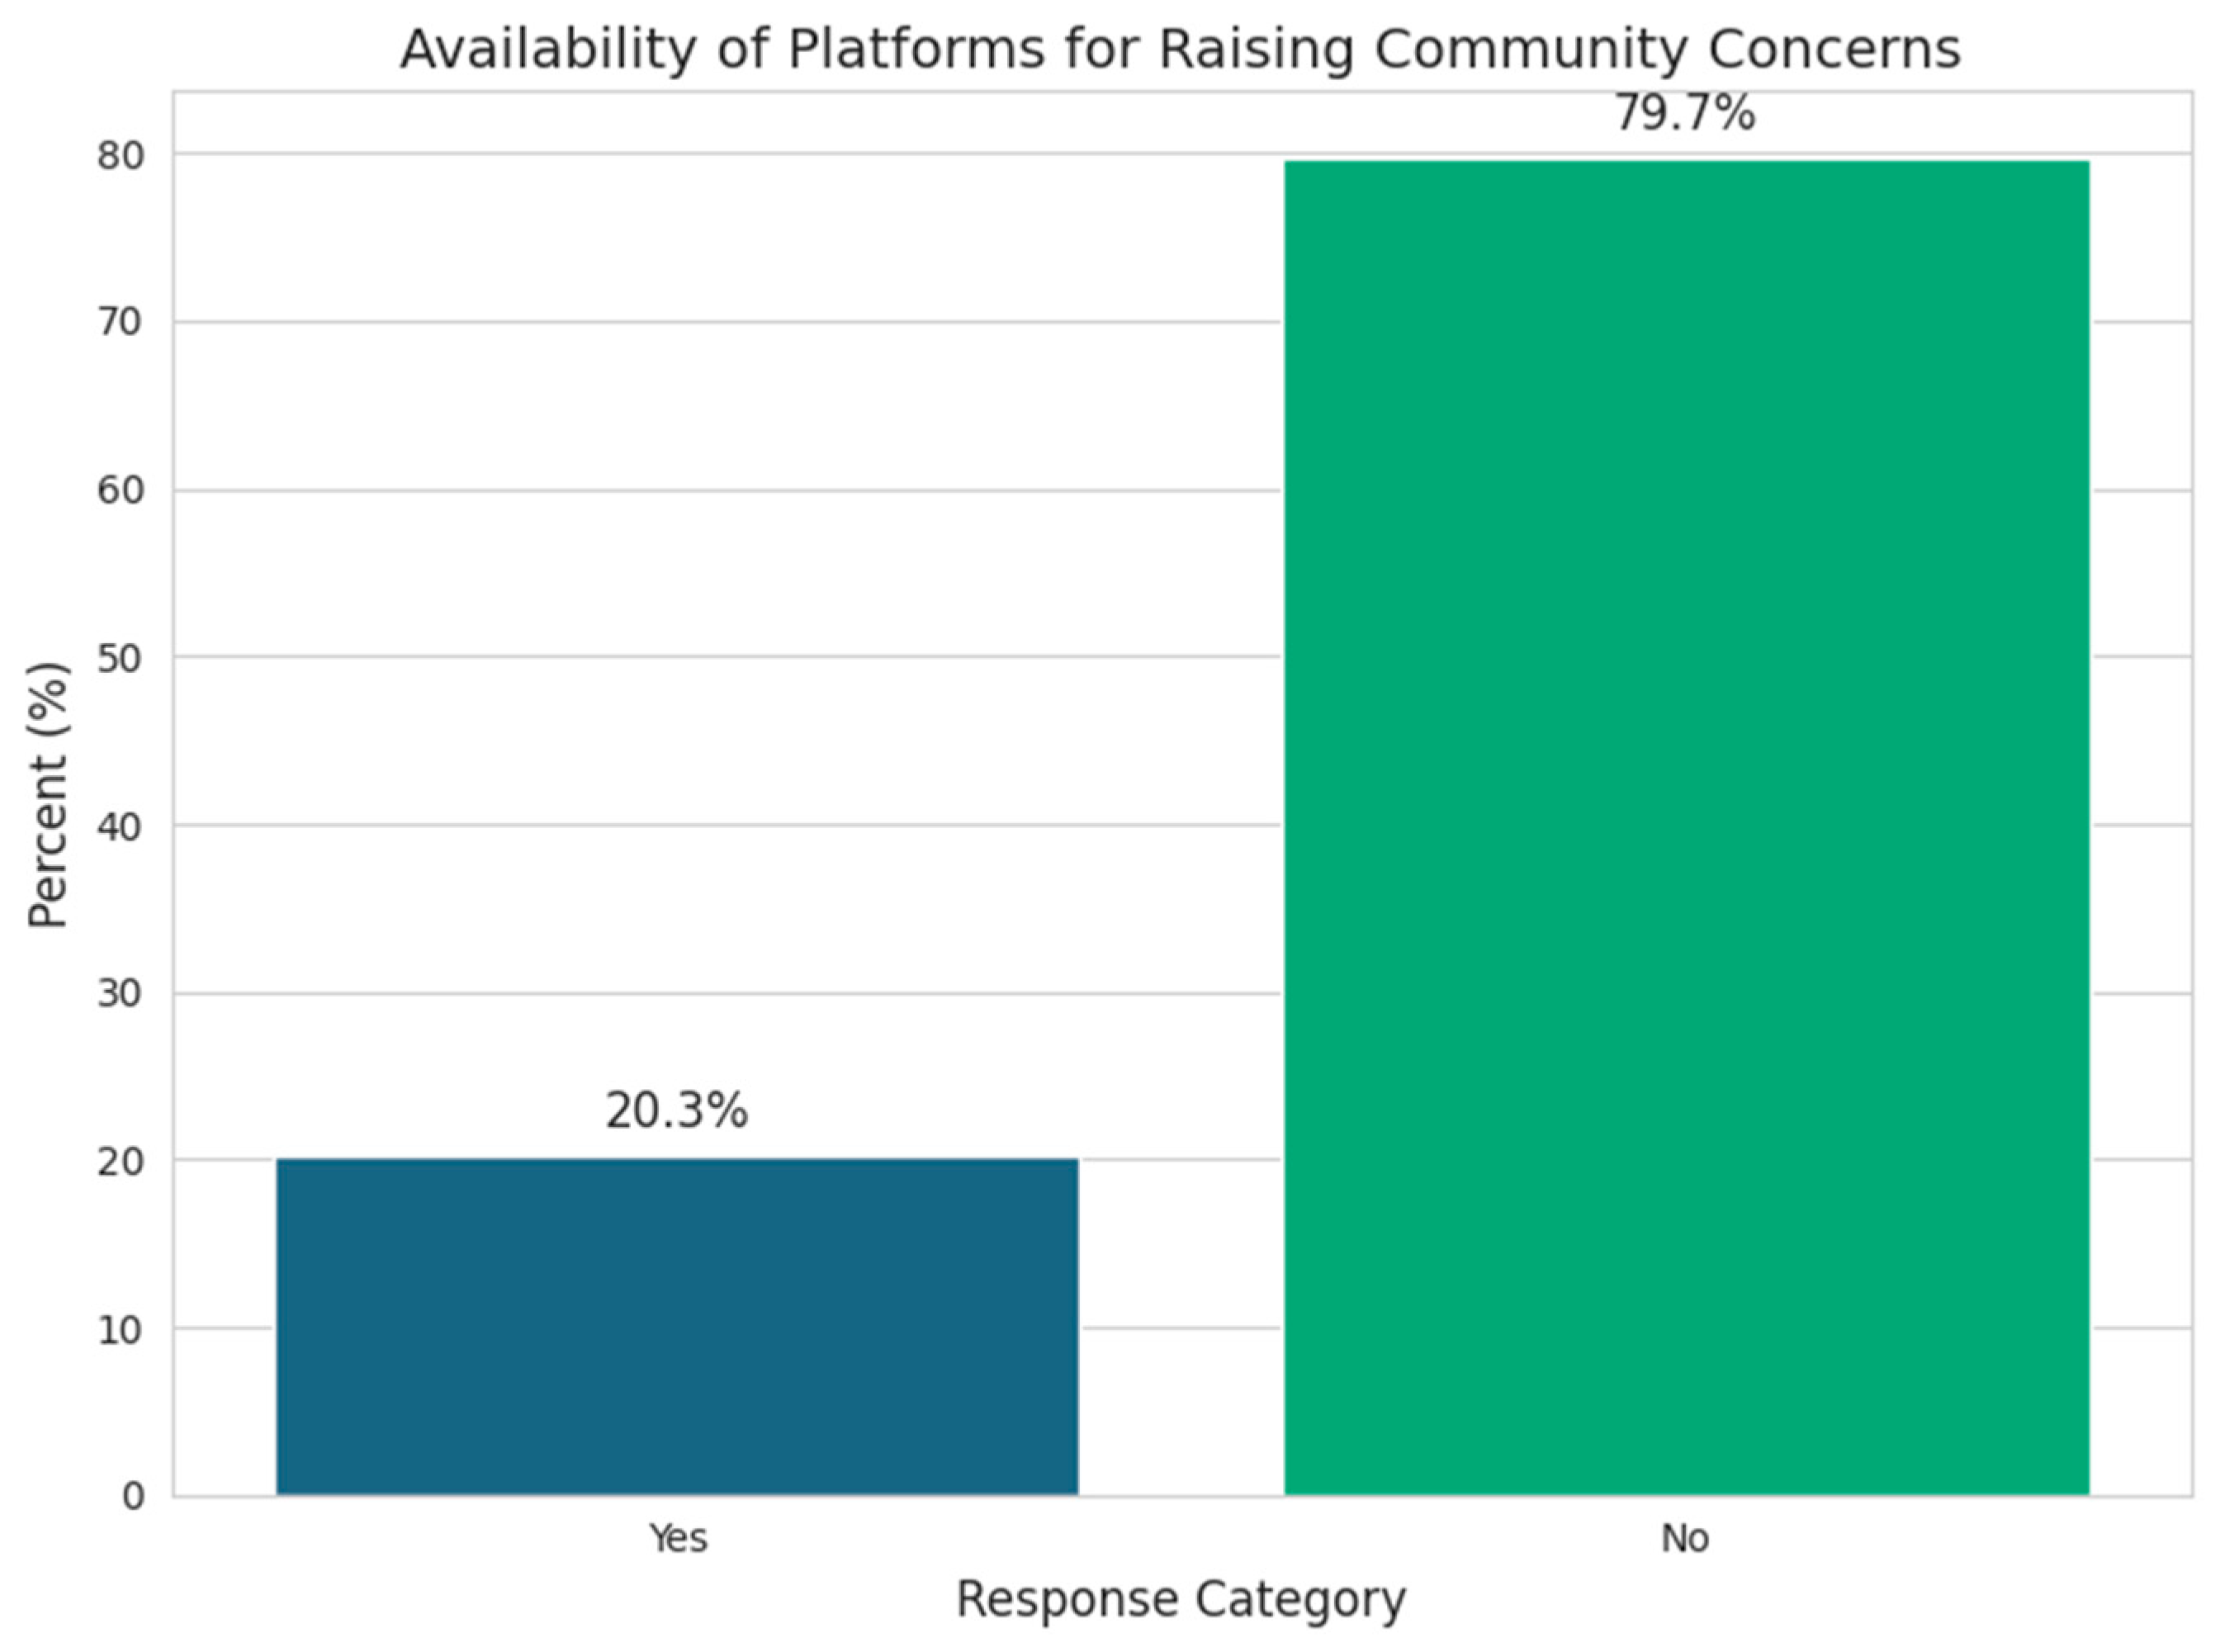
3.9. Access to Platforms for Raising Community Concerns
The bar chart reveals that only 20.3% of households have access to platforms for raising community concerns, while a striking 79.7% lack such avenues highlighting a major gap in participatory governance and accountability. This exclusion from formal and informal feedback mechanisms, such as public forums, ward committees, or digital tools, limits community influence over emergency preparedness, service delivery, and protection responses. To address this, planning efforts should prioritize strengthening ward-level grievance redress systems, integrating community voices into emergency and GBV planning, and deploying mobile or ODK-based reporting tools to ensure inclusive engagement, especially in remote or underserved areas.
3.10. Platforms Used to Raise Community Concerns (Among 49 Households with Access)
Figure 11.
platforms used to raise community concerns.
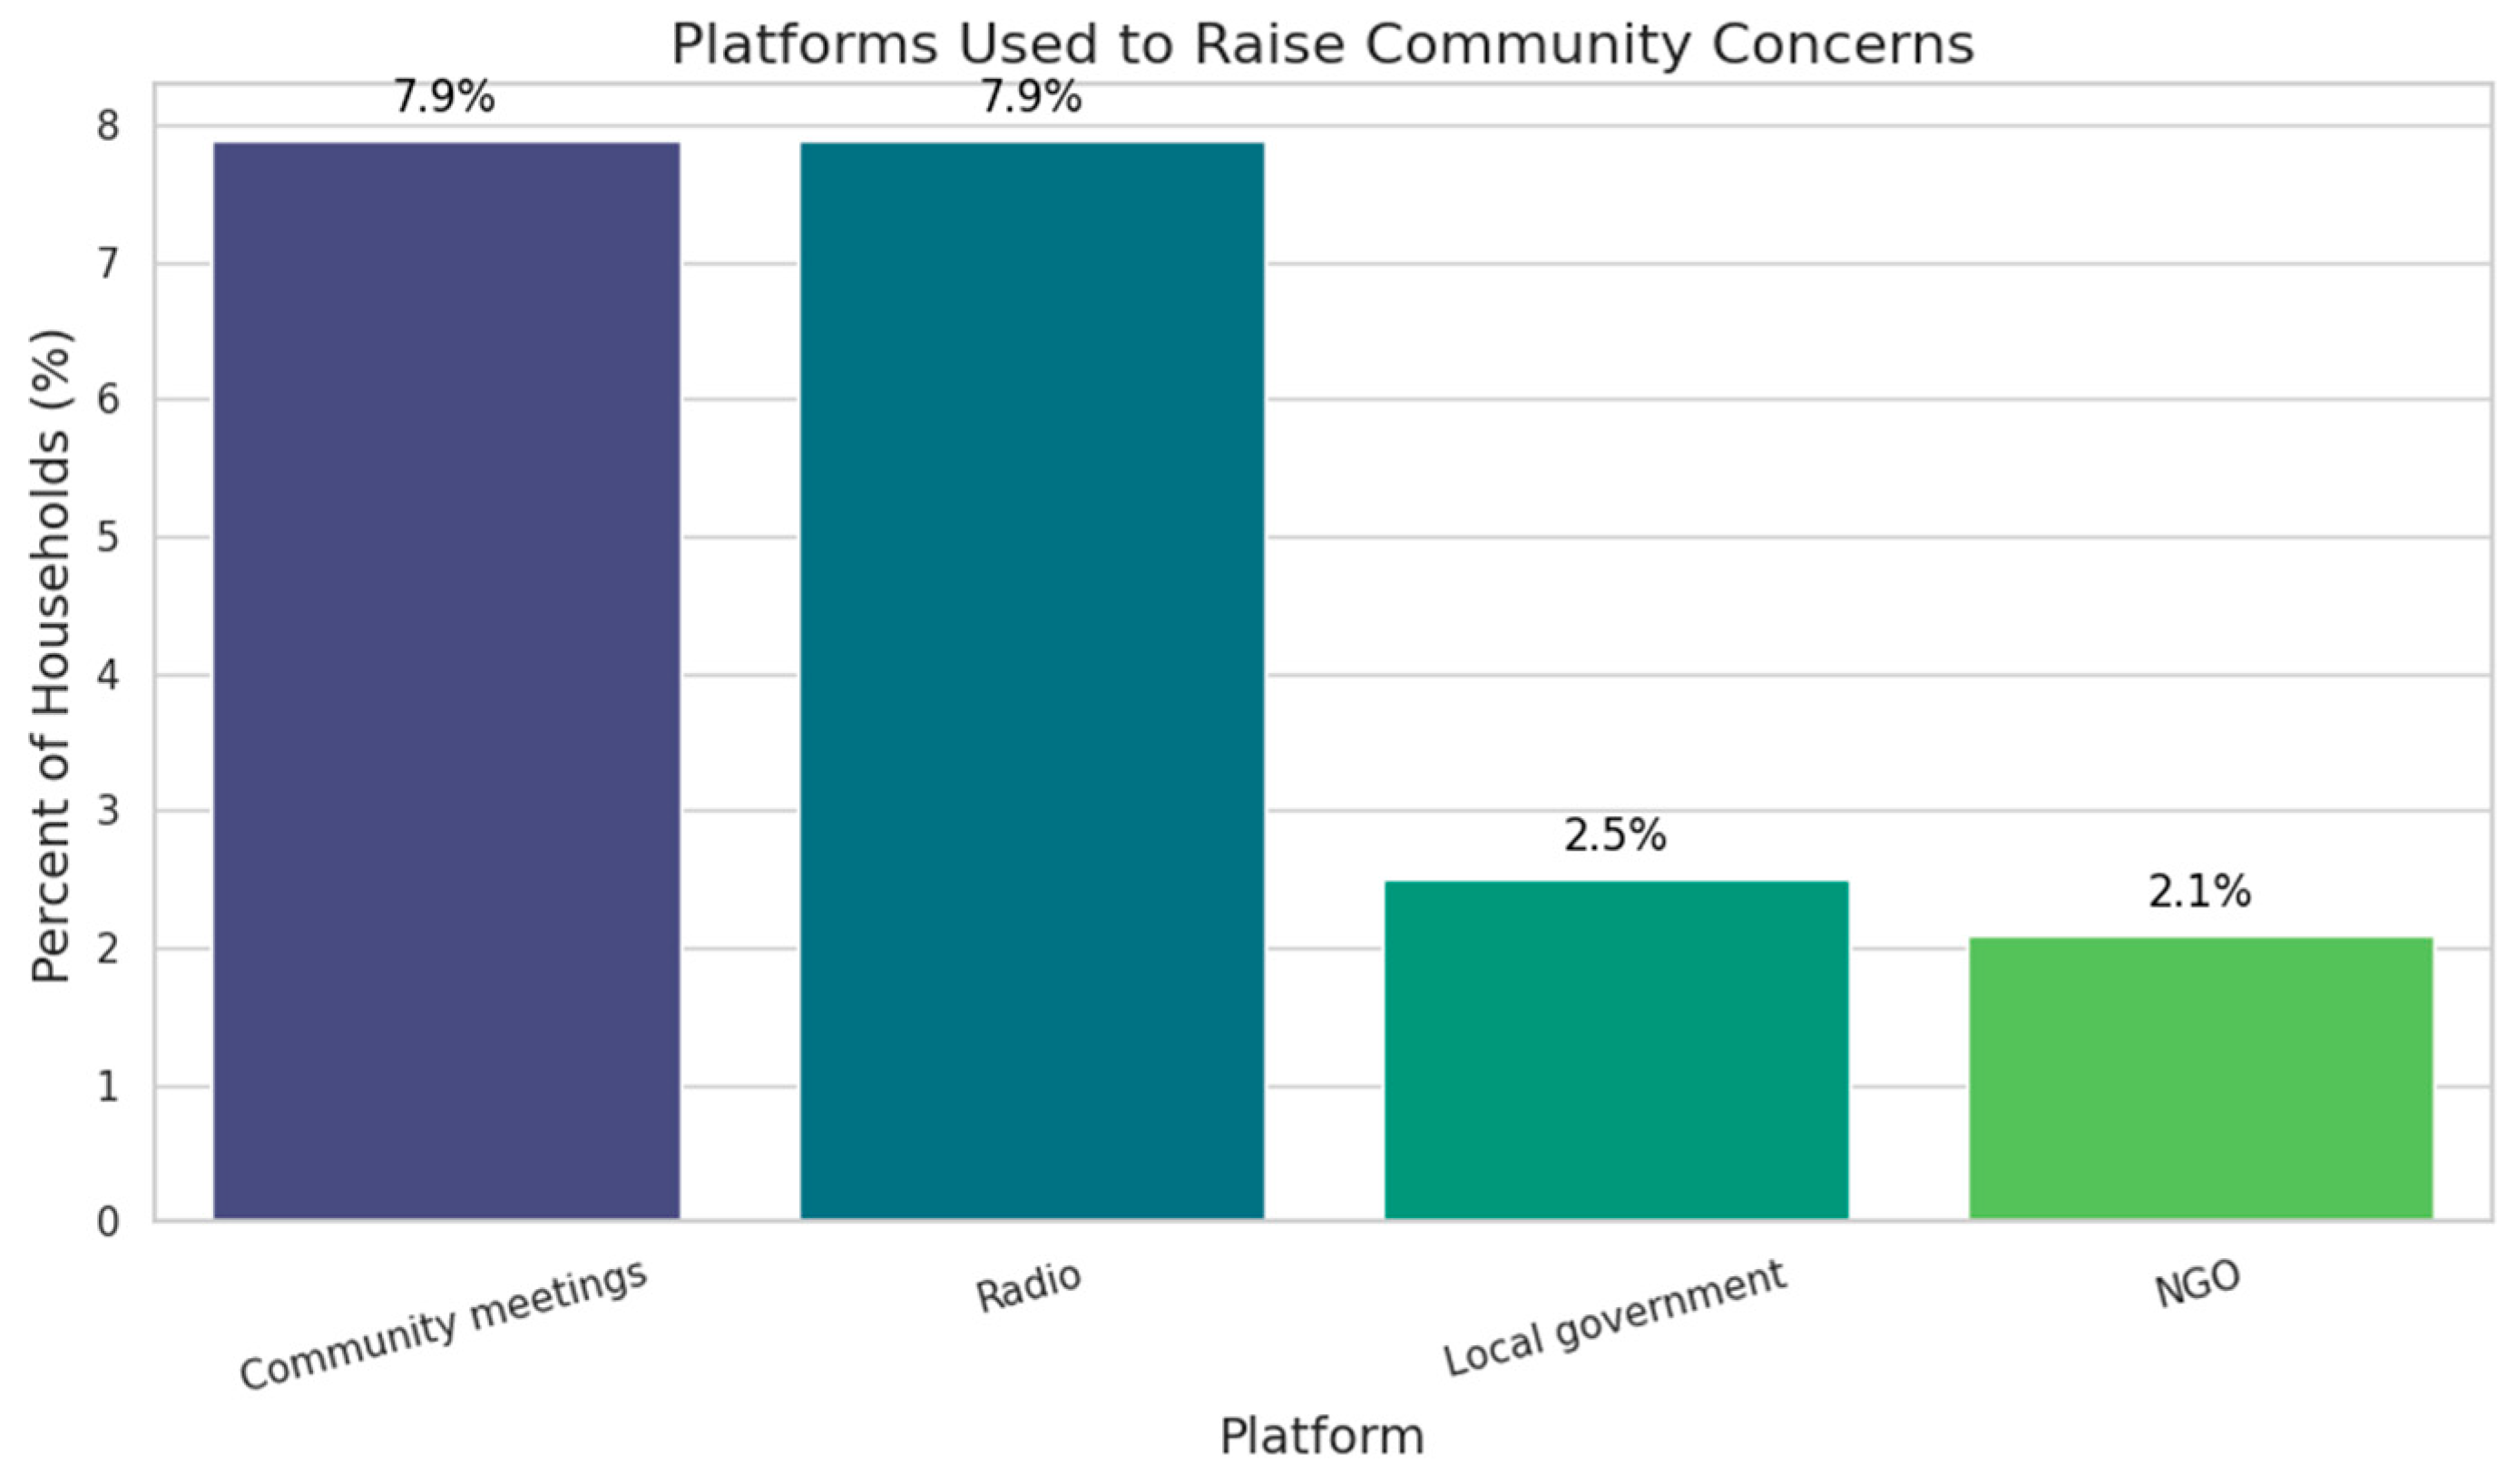
The bar chart on platforms used to raise community concerns shows that community meetings and radio are the most utilized channels, each accounting for 7.9% of household responses. In contrast, formal mechanisms such as local government (2.5%) and NGOs (2.1%) are significantly less accessed. This suggests that informal or semi-formal platforms are more trusted or accessible within the community. To improve civic engagement and accountability, planning efforts should focus on strengthening and formalizing community meetings as grievance redress platforms, leveraging radio for public education and feedback loops, and enhancing the visibility and capacity of local government and NGO channels to build trust and broaden participation.
3.11. community Support for the Vulnerable Groups
Figure 12.
community support for vulnerable groups.
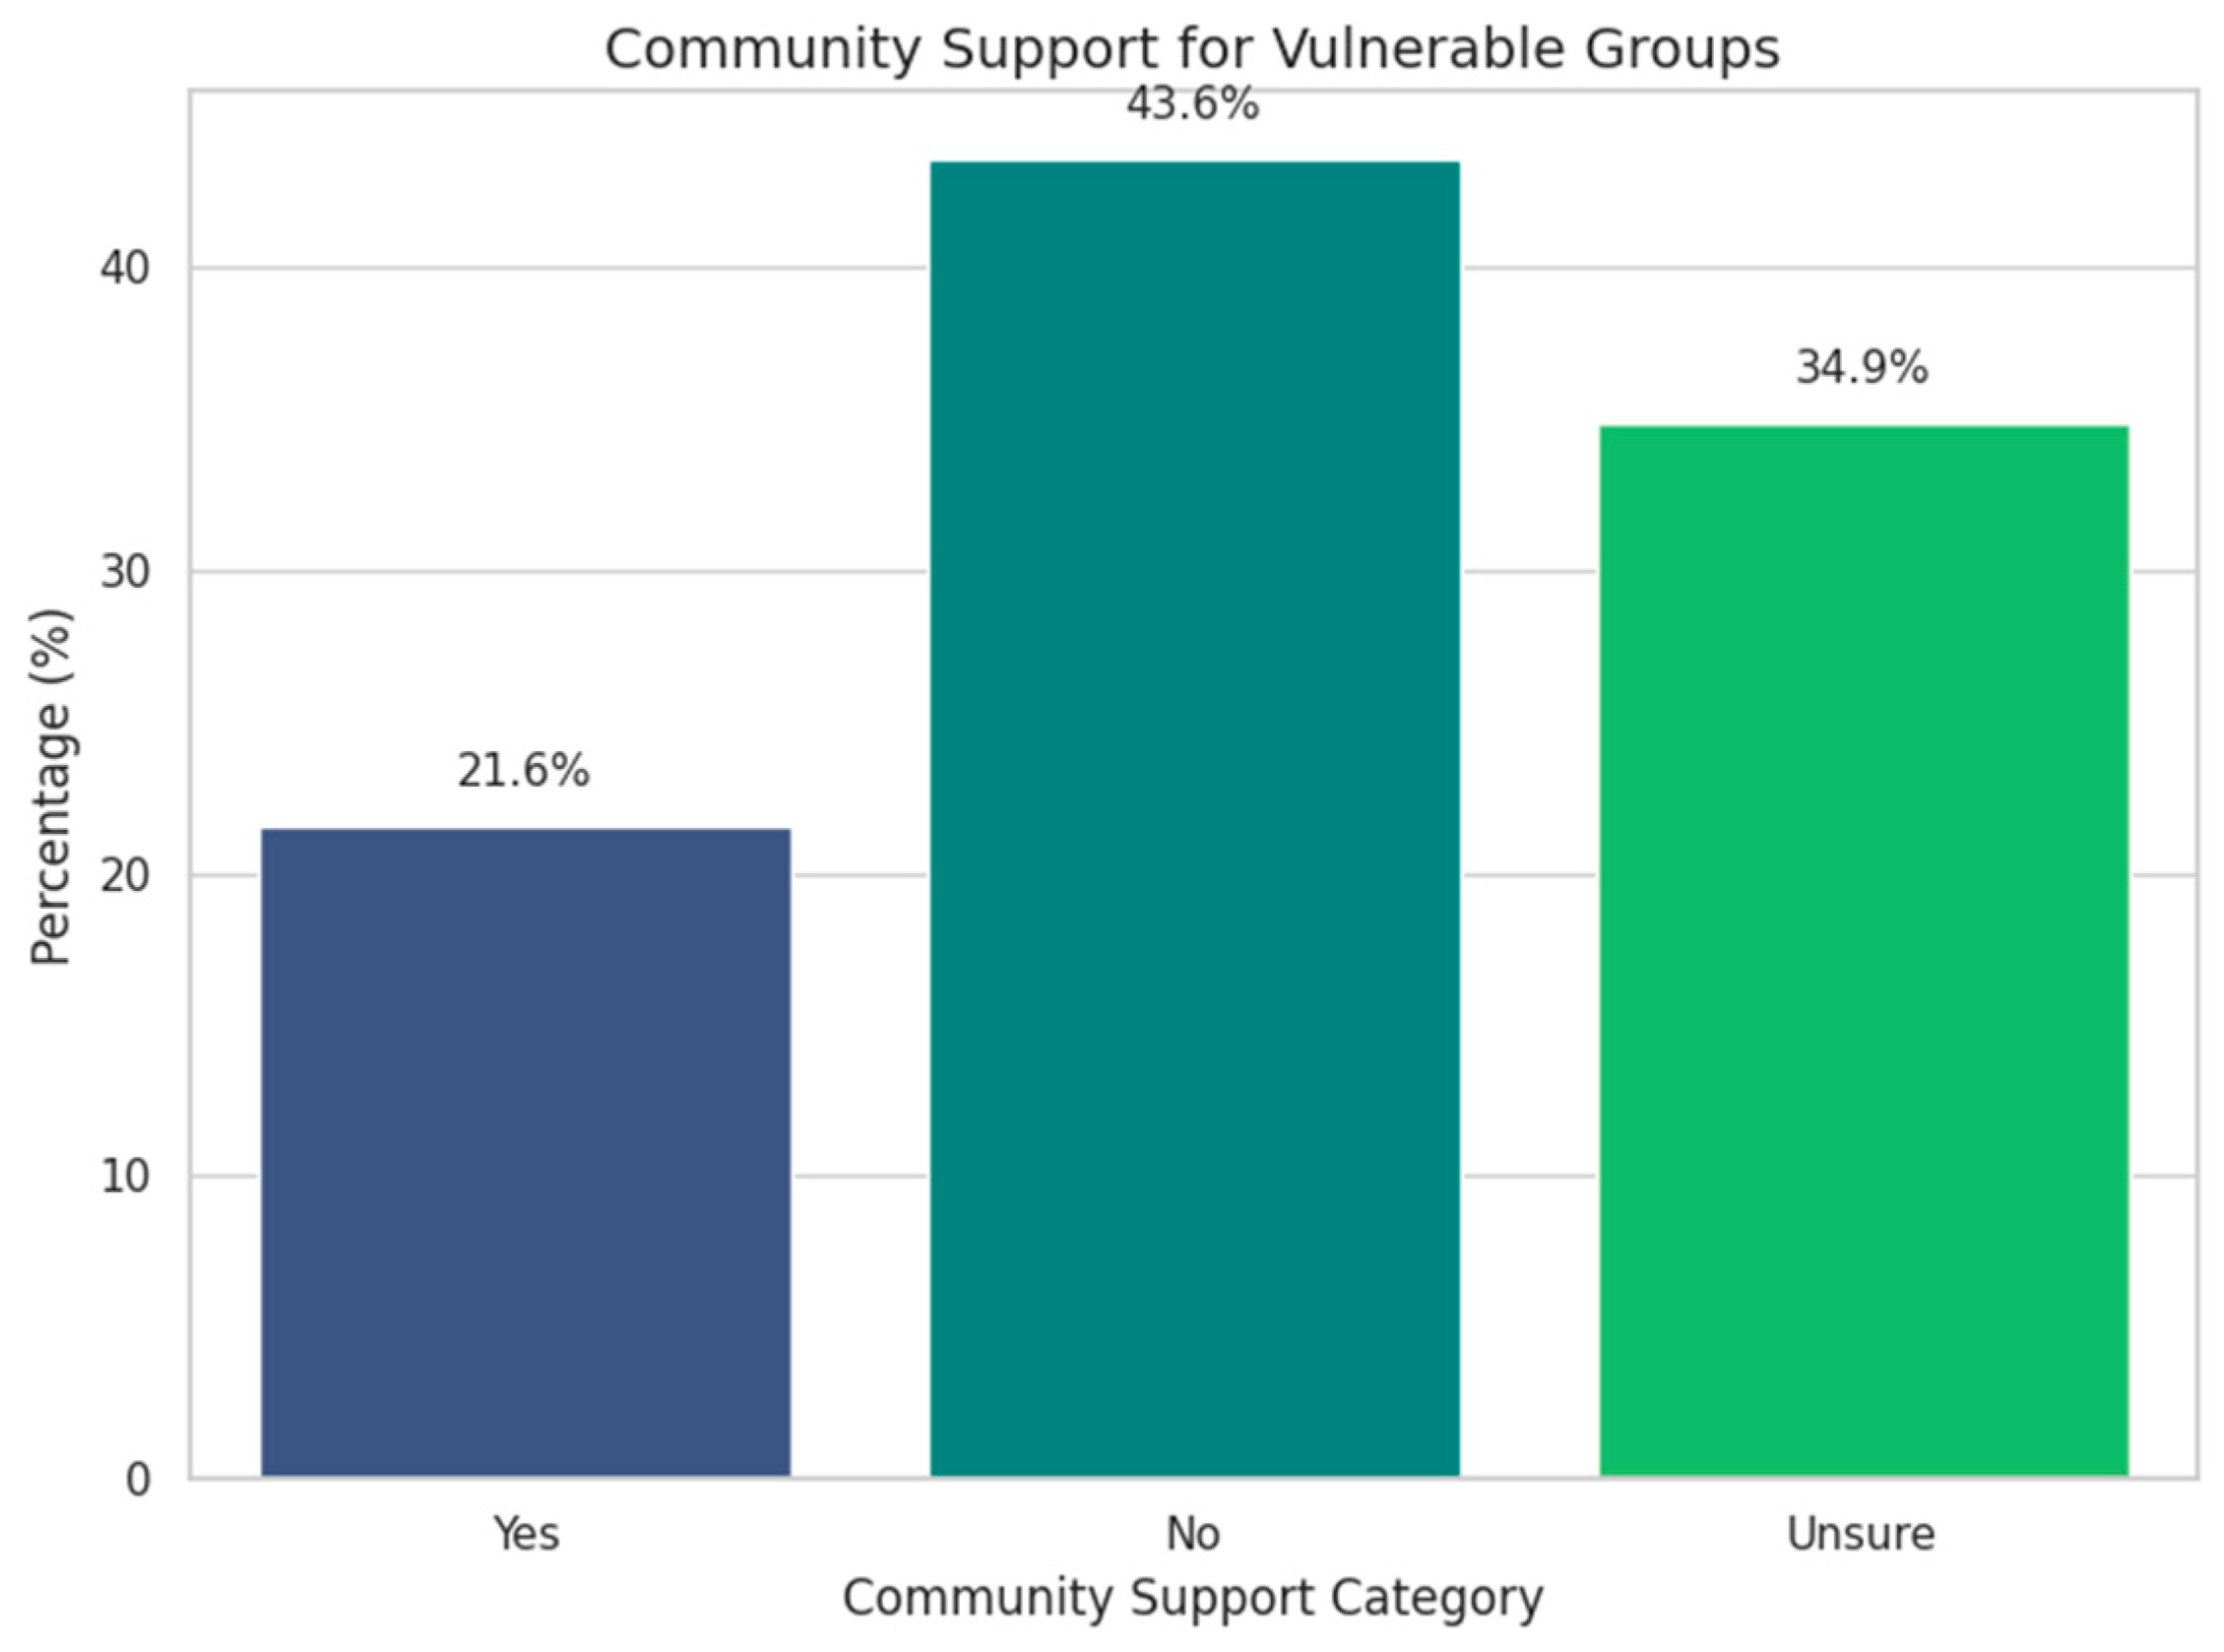
Household perceptions of community support reveal a concerning gap in visibility and delivery of services for vulnerable groups. While 21.6% affirm the presence of support, a larger 43.6% report its absence, and 34.9% remain unsure indicating that even where support may exist, it is either informal, inconsistent, or poorly communicated. This uncertainty points to a need for stronger outreach, clearer messaging, and inclusive service design that engages communities directly. Localized efforts or informal care networks may explain the limited recognition of support, but without formal structures, many households remain disconnected from essential protection mechanisms.
The broader protection and participation indicators reinforce this trend. Although 31.5% of households report safe spaces for women and children, only 4.1% have access to actual GBV support services, exposing a critical disconnect between physical refuge and functional care. Furthermore, just 20.3% of respondents have platforms to raise community concerns, suggesting that voice and accountability systems are severely underdeveloped. These findings highlight the urgent need to strengthen community-based protection frameworks, improve service visibility, and establish feedback mechanisms that empower households to engage meaningfully in local governance and recovery planning.
3.12. Challenges Faced by Elderly During Floods
Figure 13.
Challenges faced by the Elderly during floods.
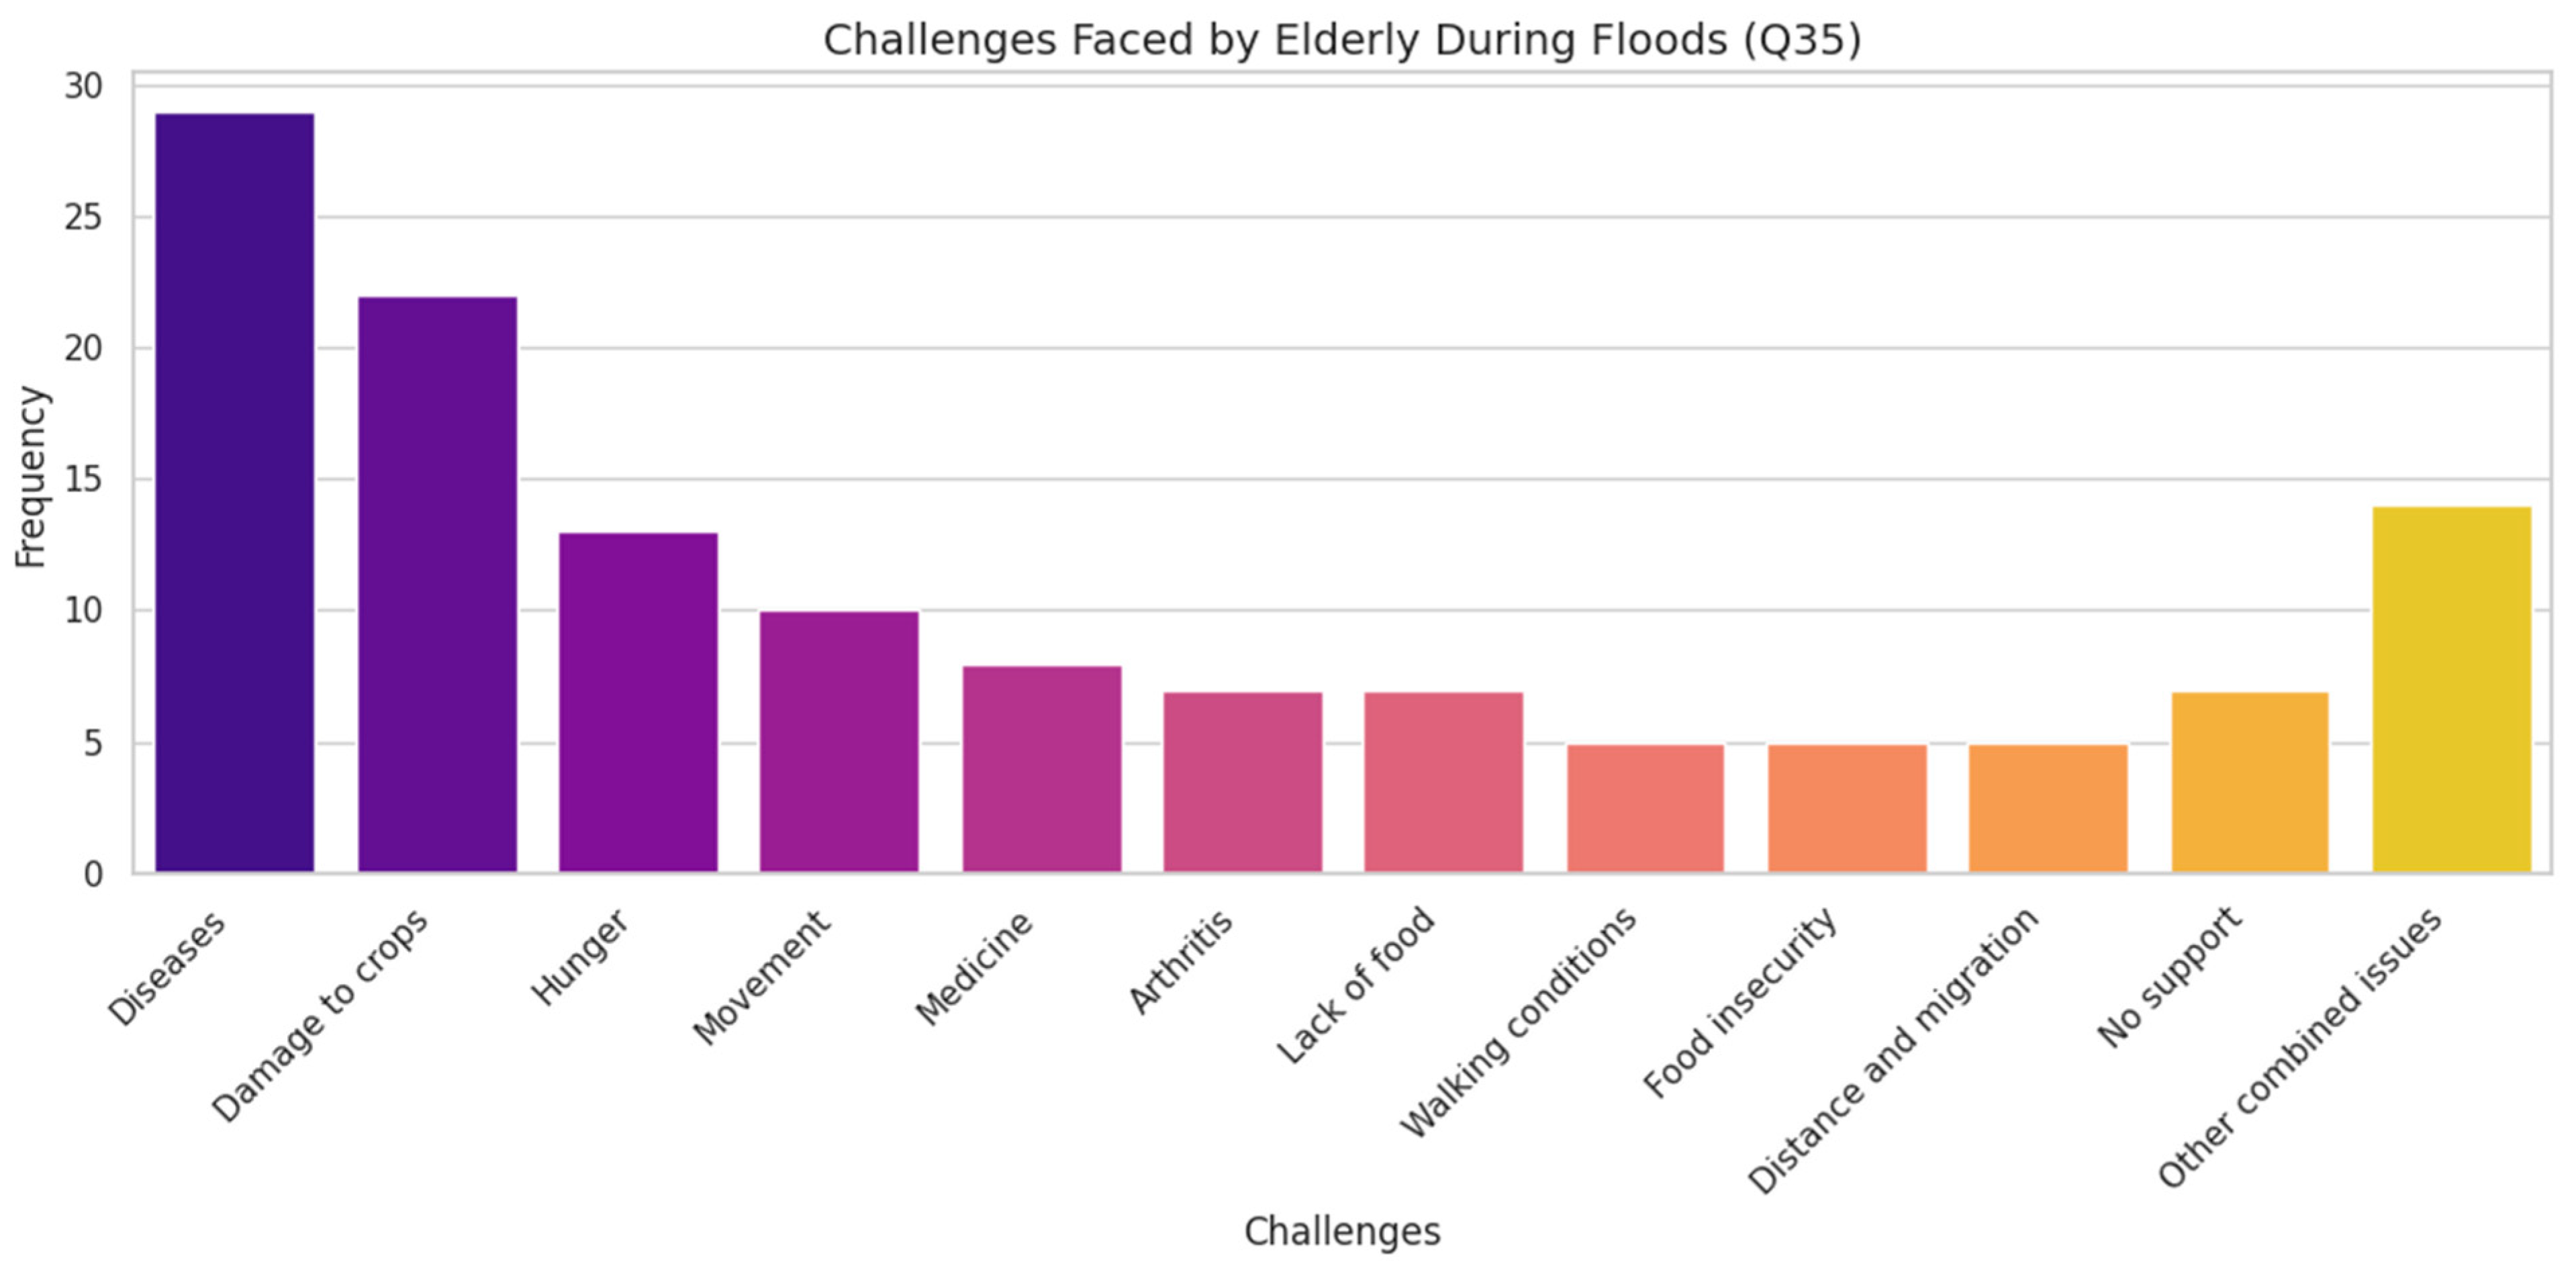
The survey data reveals that health-related vulnerabilities are the most frequently reported challenges during flooding, with 29 mentions of diseases and additional cases involving arthritis and limited access to medicine. These findings underscore the urgent need for mobile health clinics and chronic care services, particularly for elderly and mobility-impaired individuals. The presence of combined challenges such as food, medicine, and shelter further highlight the multidimensional nature of hardship in flood-affected communities, where overlapping needs strain coping capacities.
Food insecurity emerges in various forms, including hunger (13), lack of food (7), and general food insecurity (5), often exacerbated by movement difficulties and poor walking conditions. Damage to crops (22) compounds both economic and nutritional stress, signaling the need for livelihood restoration and agricultural support. Additionally, challenges related to distance, migration, and lack of support point to gaps in humanitarian outreach and coordination. Together, these findings call for integrated response strategies that address health, nutrition, mobility, and social protection in a cohesive and inclusive manner.
3.13. Flood Shelter Accessibility for Persons with Disabilities (PWDs)
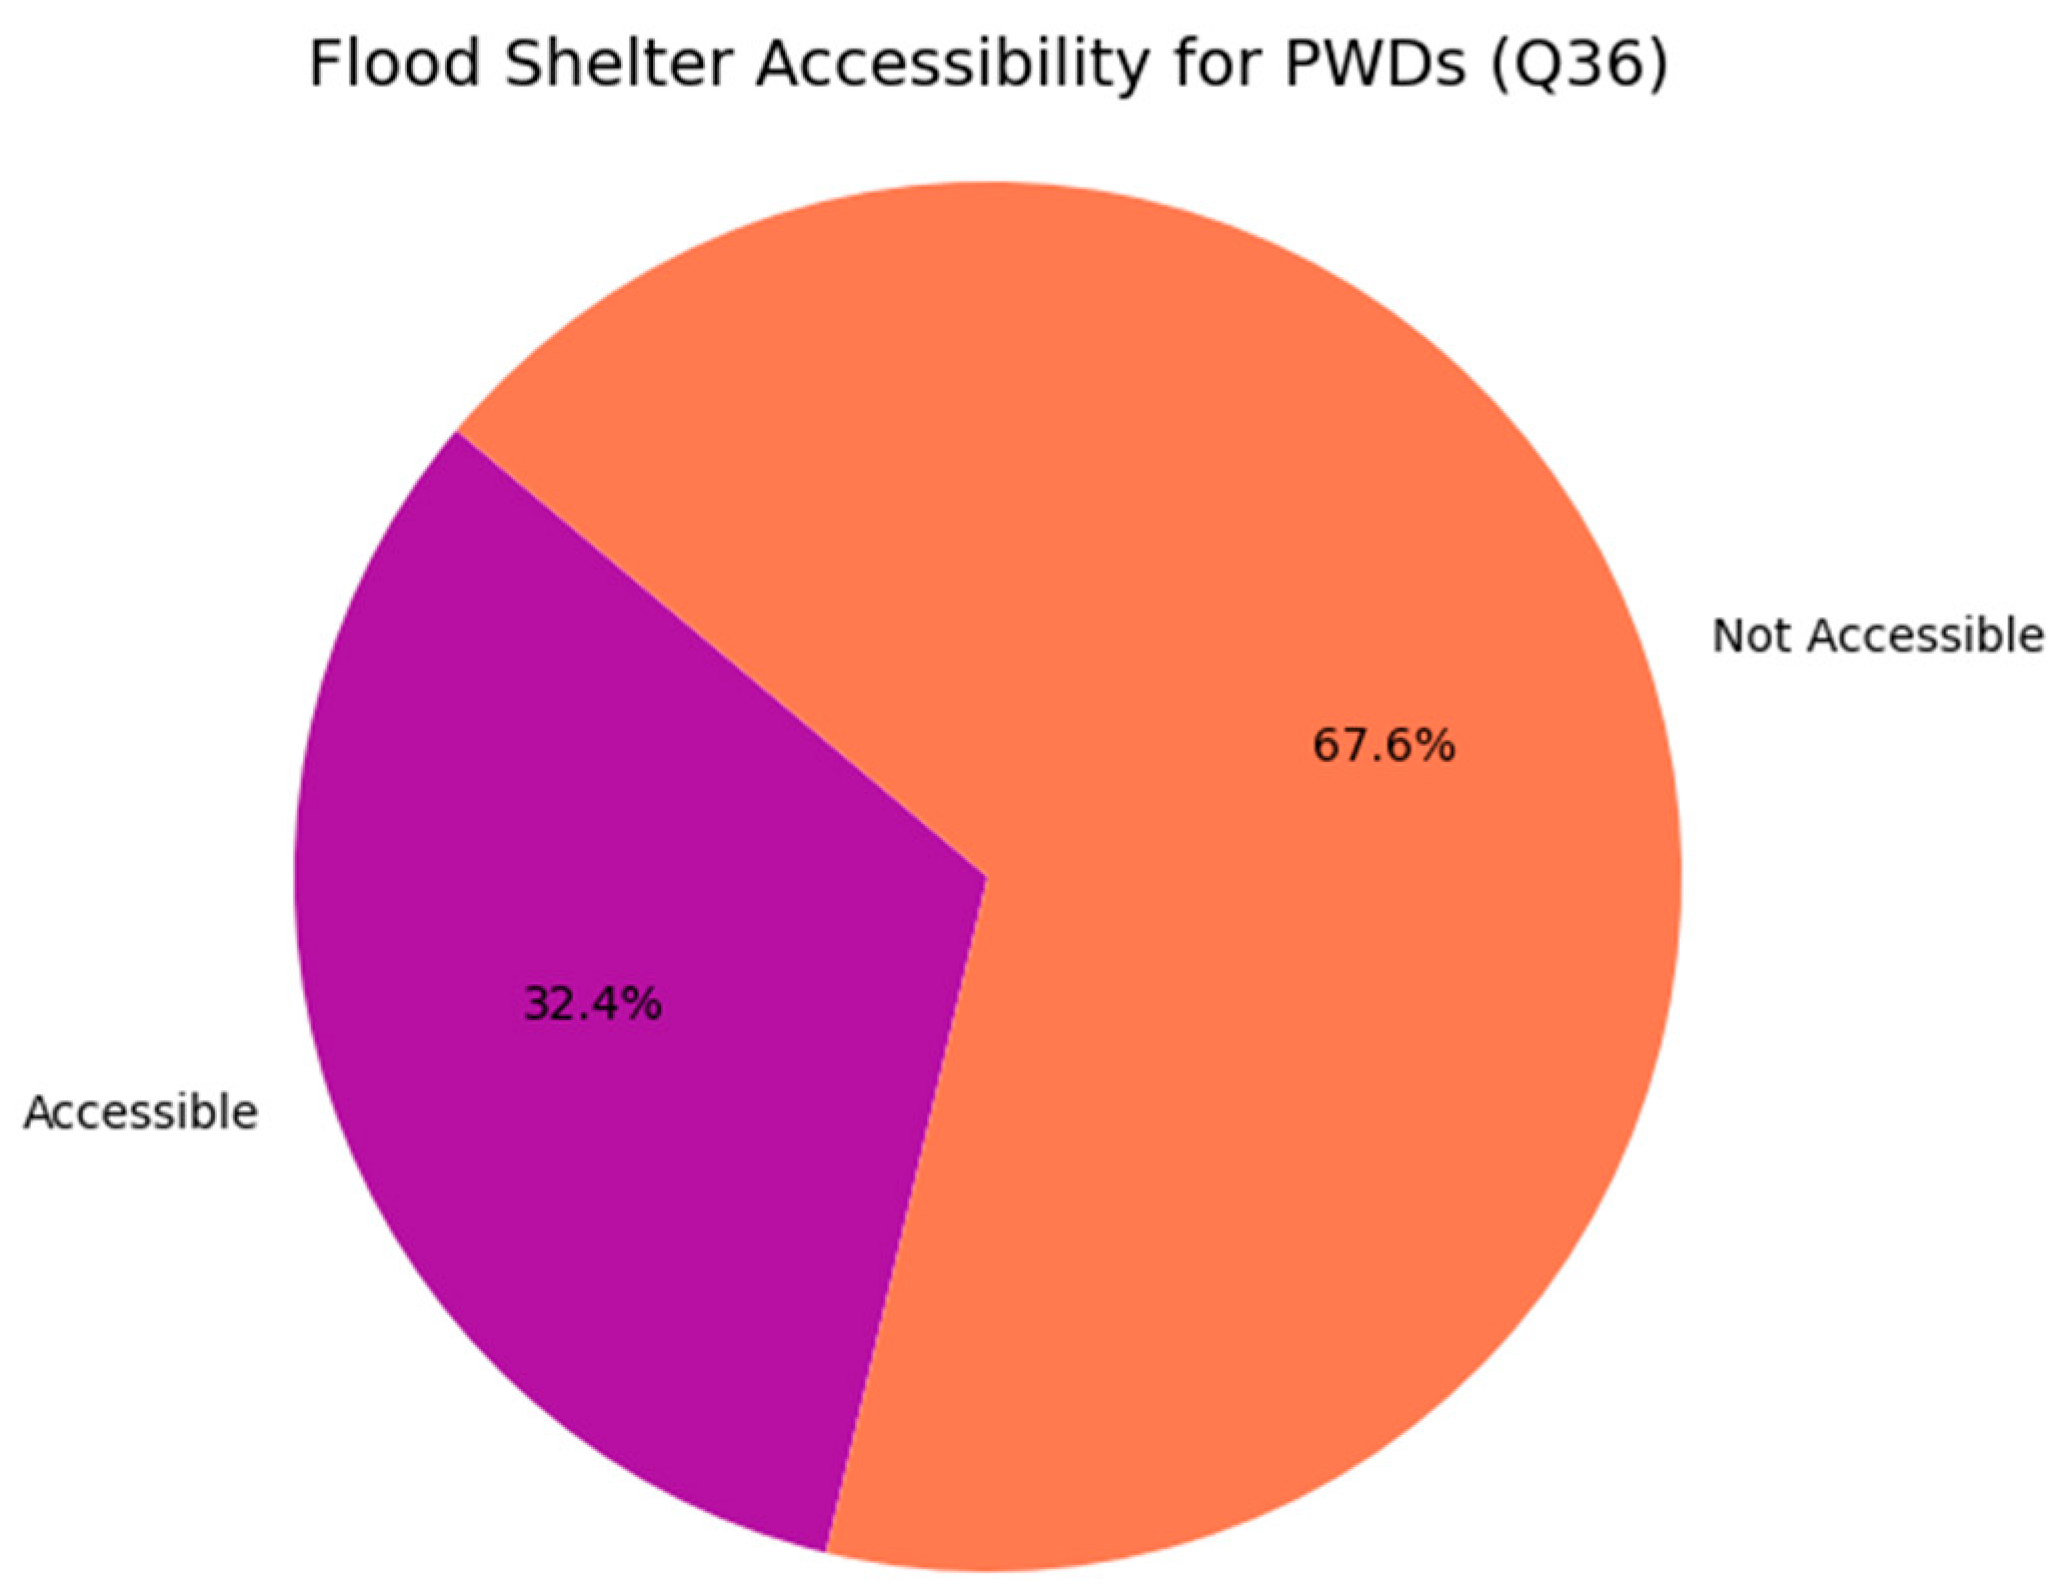
In flood-prone areas, 67.6% of respondents reported that flood shelters are not accessible to persons with disabilities (PWDs), while only 32.4% confirmed accessibility revealing a critical gap in inclusive disaster preparedness. This barrier to safety means nearly seven in ten households indicate that PWDs face heightened risk during emergencies due to inadequate infrastructure and planning. The disparity underscores the urgent need for universal design in shelter construction and inclusive evacuation protocols. These findings offer strong policy leverage for advancing disability-inclusive disaster risk reduction (DiDRR) within county and national frameworks.
3.14. Impact of Flooding on Health Service Access
Figure 15.
Impact of flood on health service access.
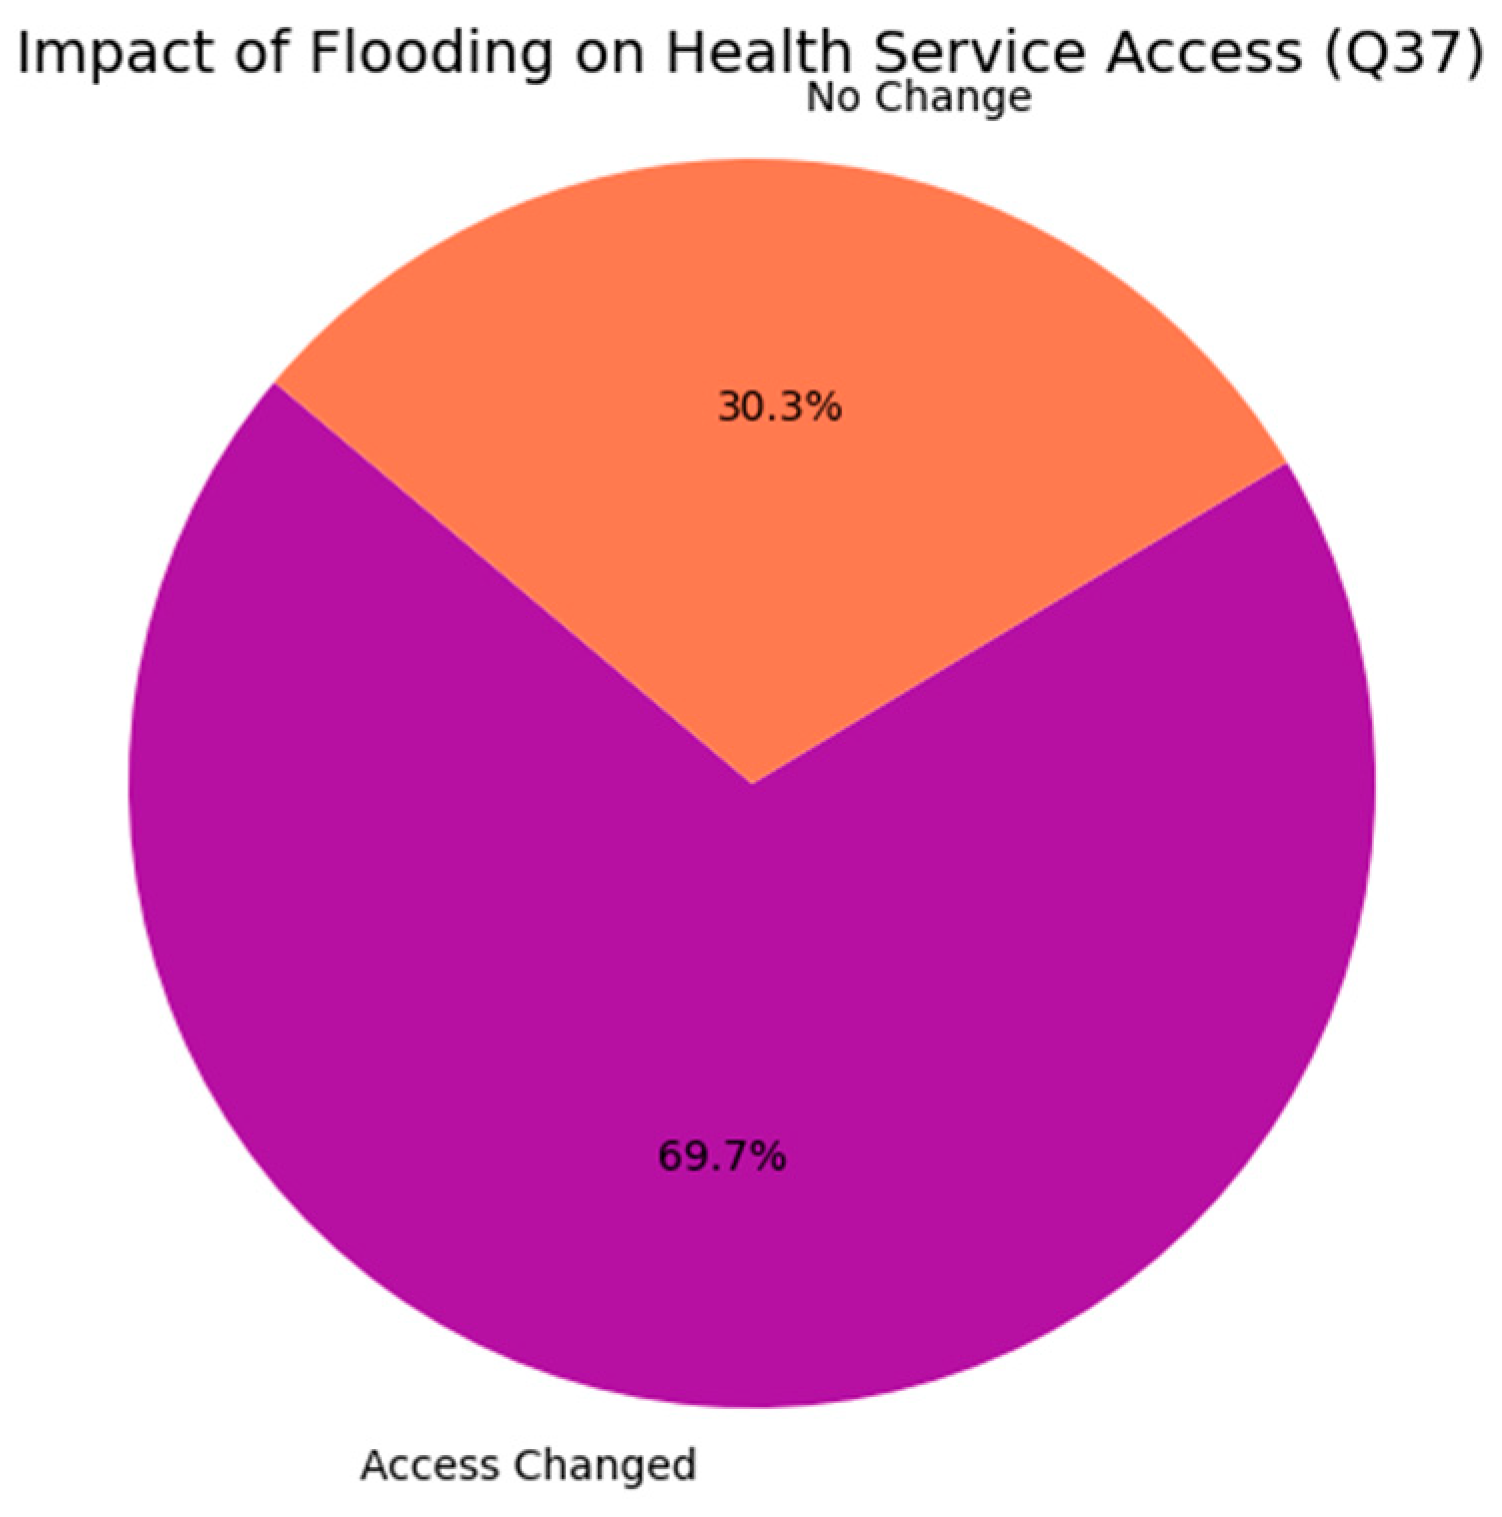
In flood-affected regions, 69.7% of households reported a change in access to health services, signaling significant disruption to essential care systems during emergencies. Meanwhile, 30.3% experienced no change an ambiguous figure that may indicate either resilient infrastructure or a troubling baseline of chronic inaccessibility. This duality underscores the need for deeper contextual analysis and targeted interventions to ensure that health systems are both adaptive and inclusive in the face of climate-induced shocks.
3.15. Emergency Healthcare Access During Floods
Figure 16.
Emergency healthcare access during floods.
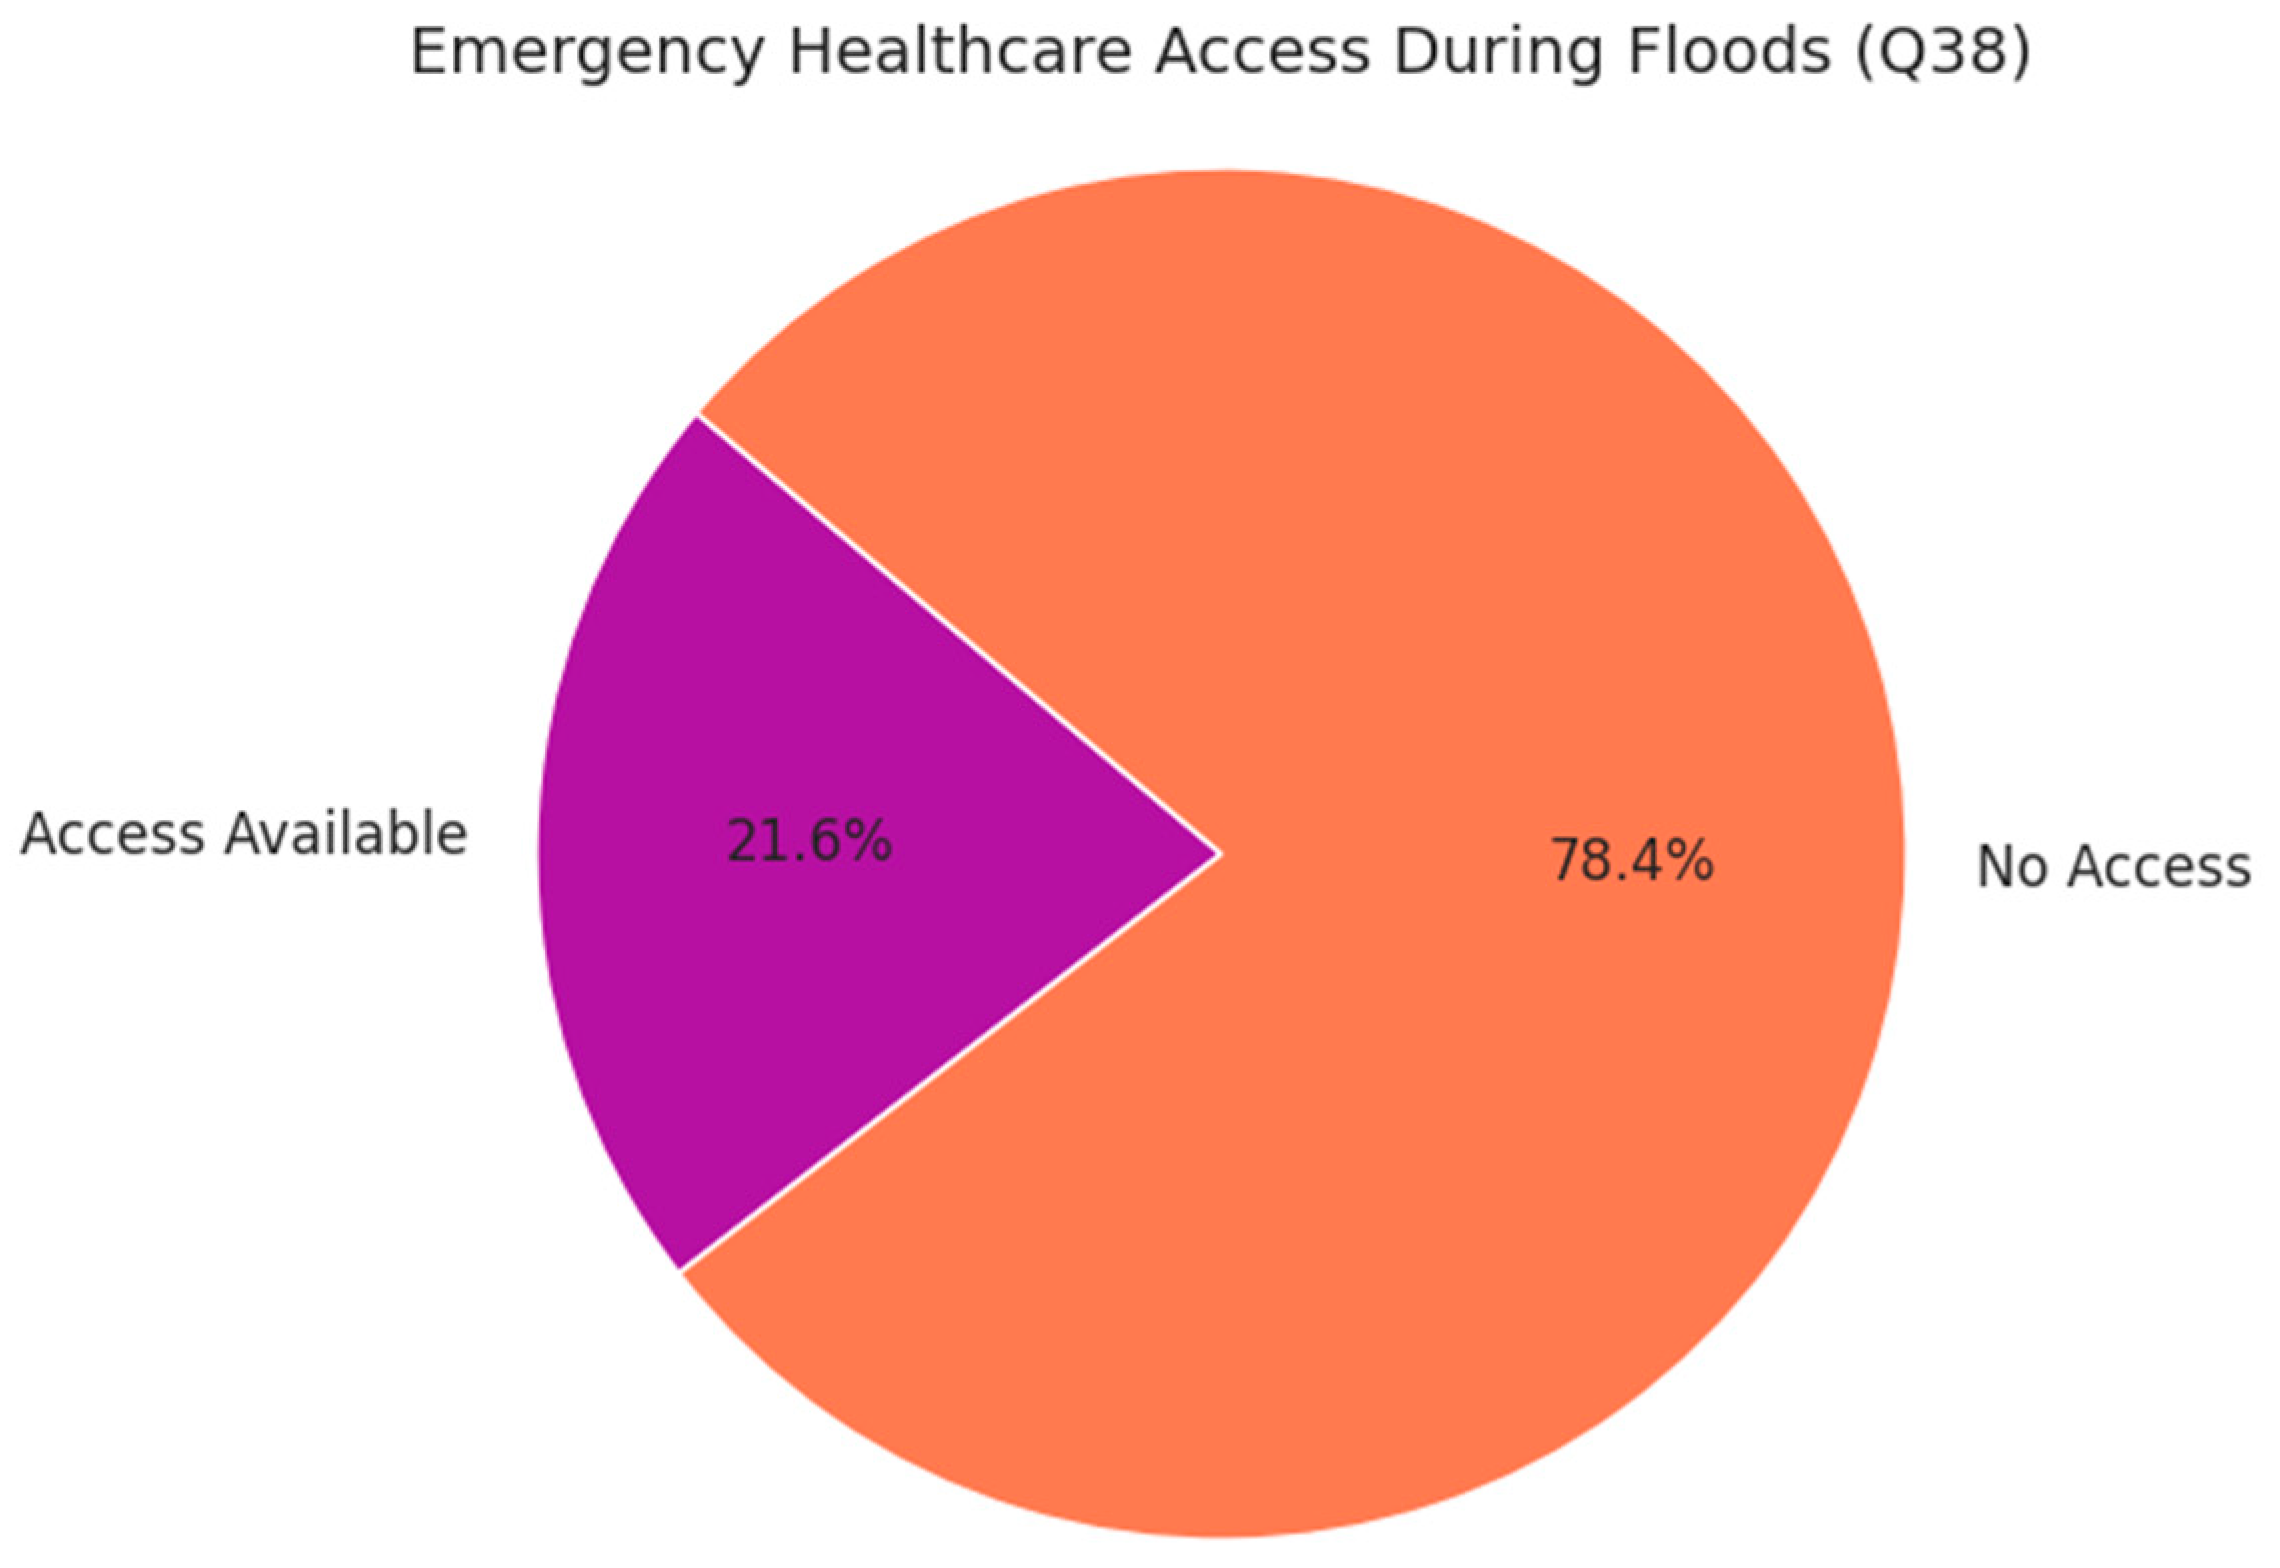
In Aweil South and Aweil East Counties of South Sudan, 78.4% of surveyed households report lacking access to emergency healthcare services during floods, while only 21.6% have access revealing a stark imbalance and a critical gap in disaster health preparedness. This systemic risk leaves nearly four in five households vulnerable to flood-related health emergencies without reliable care, underscoring deep inequities in service distribution driven by barriers such as distance, cost, and damaged infrastructure. The findings strongly support the urgent deployment of mobile clinics, community health volunteers, and inclusive health planning to ensure equitable and resilient healthcare access in flood-prone regions
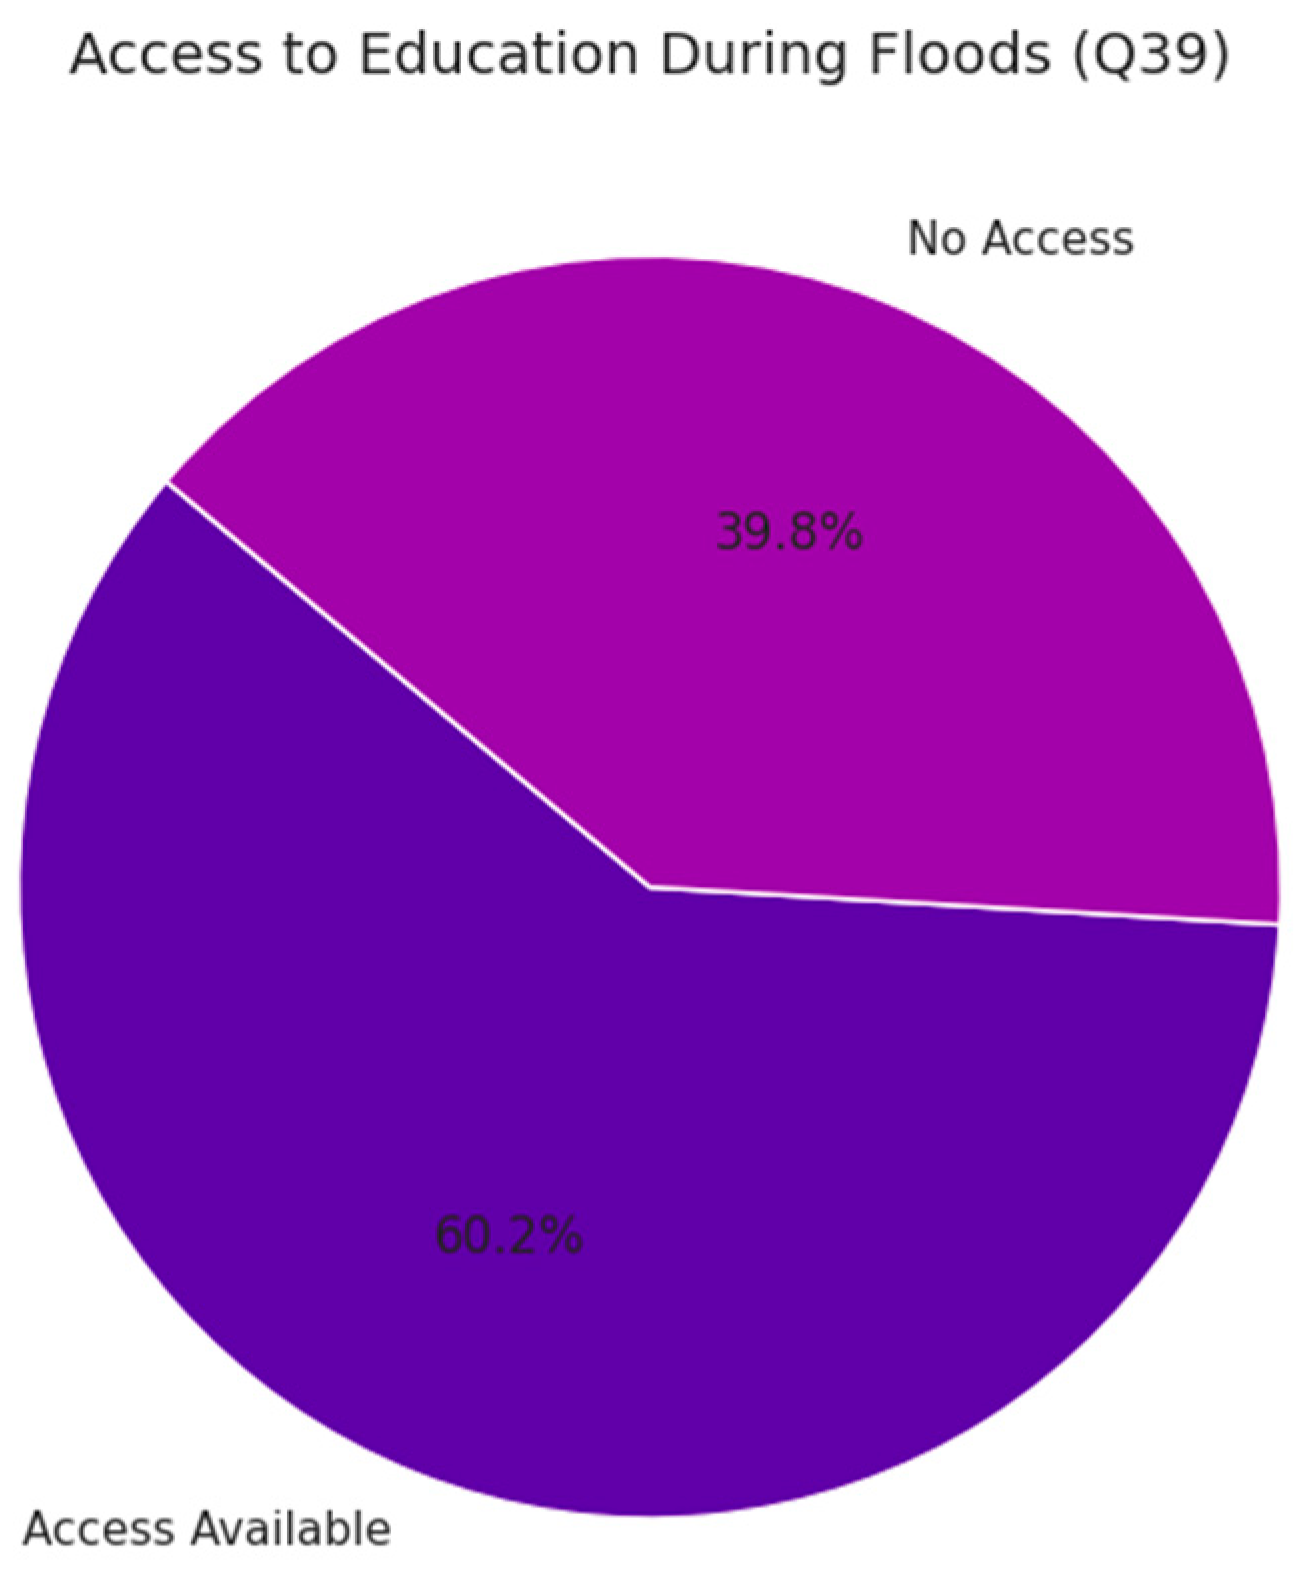
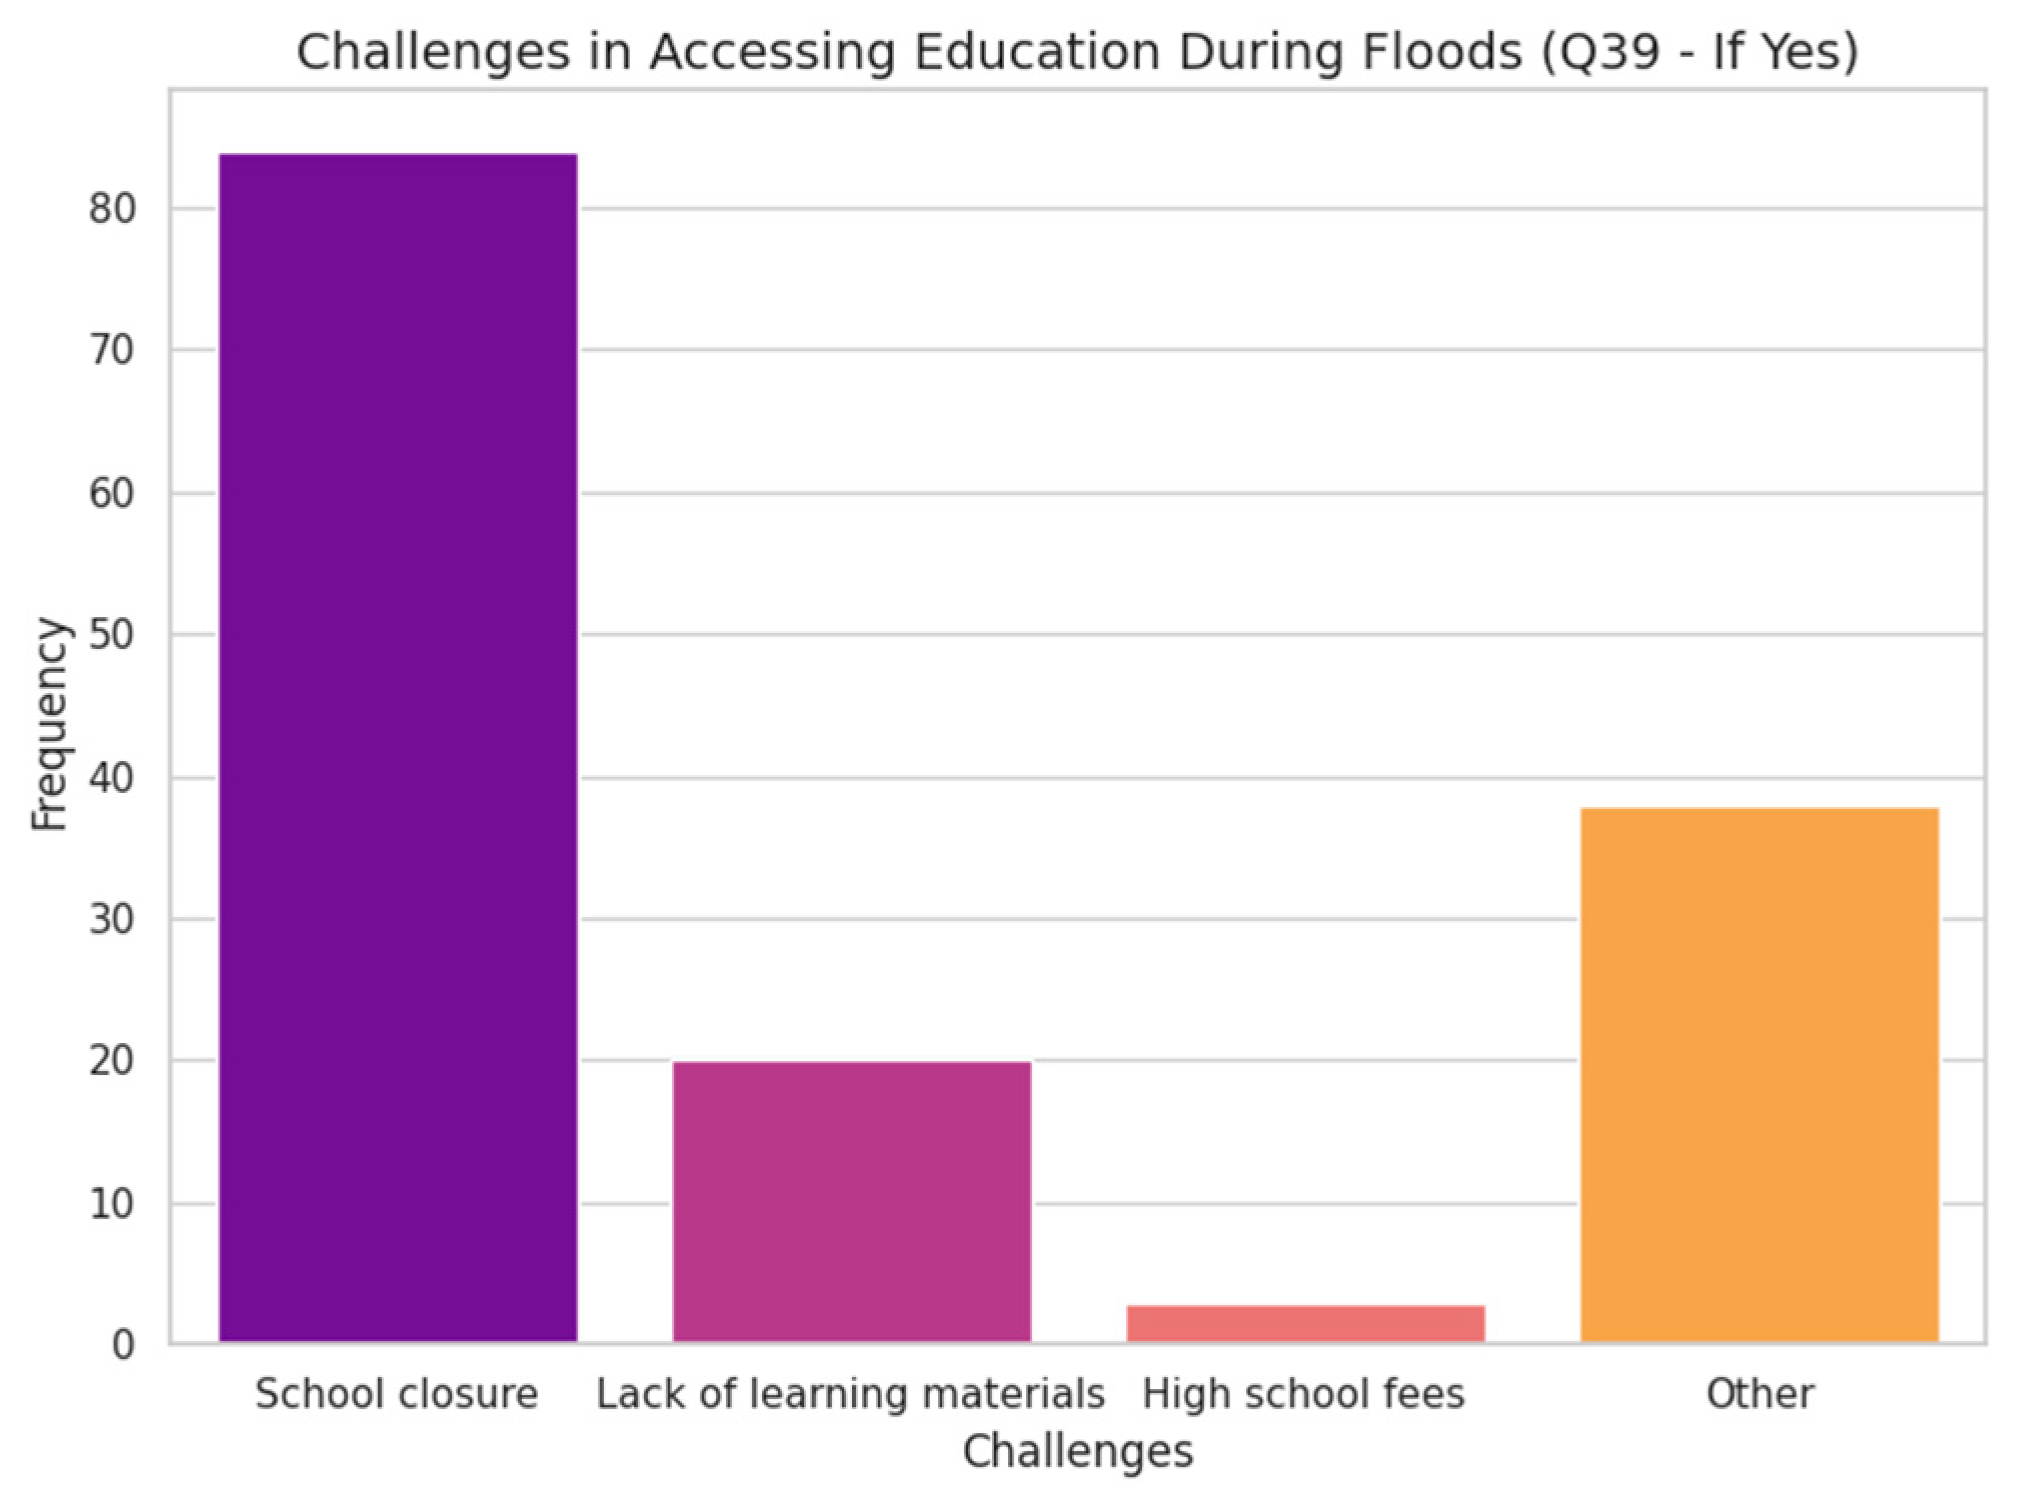
Figure 17.
Access to education during floods.
Figure 18.
Challenges of accessing education.
3.16. Access to Education During Floods
During flood emergencies, 60.2% of households report continued access to education, indicating that a majority manage to sustain learning despite disruptions; however, 39.8% lack access entirely, revealing a substantial gap that leaves many children behind. This disparity highlights the uneven resilience of educational infrastructure and underscores the need for adaptive strategies such as mobile classrooms, radio-based learning, and flood-resilient school designs to ensure inclusive educational continuity in disaster-prone regions.
Among the 145 households that reported access to education during floods, 57.9% still faced school closures, making it the most prevalent challenge and pointing to widespread infrastructure or staffing disruptions even where access exists. Additionally, 13.8% cited lack of learning materials, and 2.1% struggled with high school fees highlighting persistent resource and affordability gaps. Notably, 26.2% reported “other challenges,” which may encompass transport difficulties, safety concerns, or displacement-related barriers, warranting deeper qualitative investigation to inform more resilient and inclusive educational interventions in flood-affected areas.
3.17. Access to Water in the Area
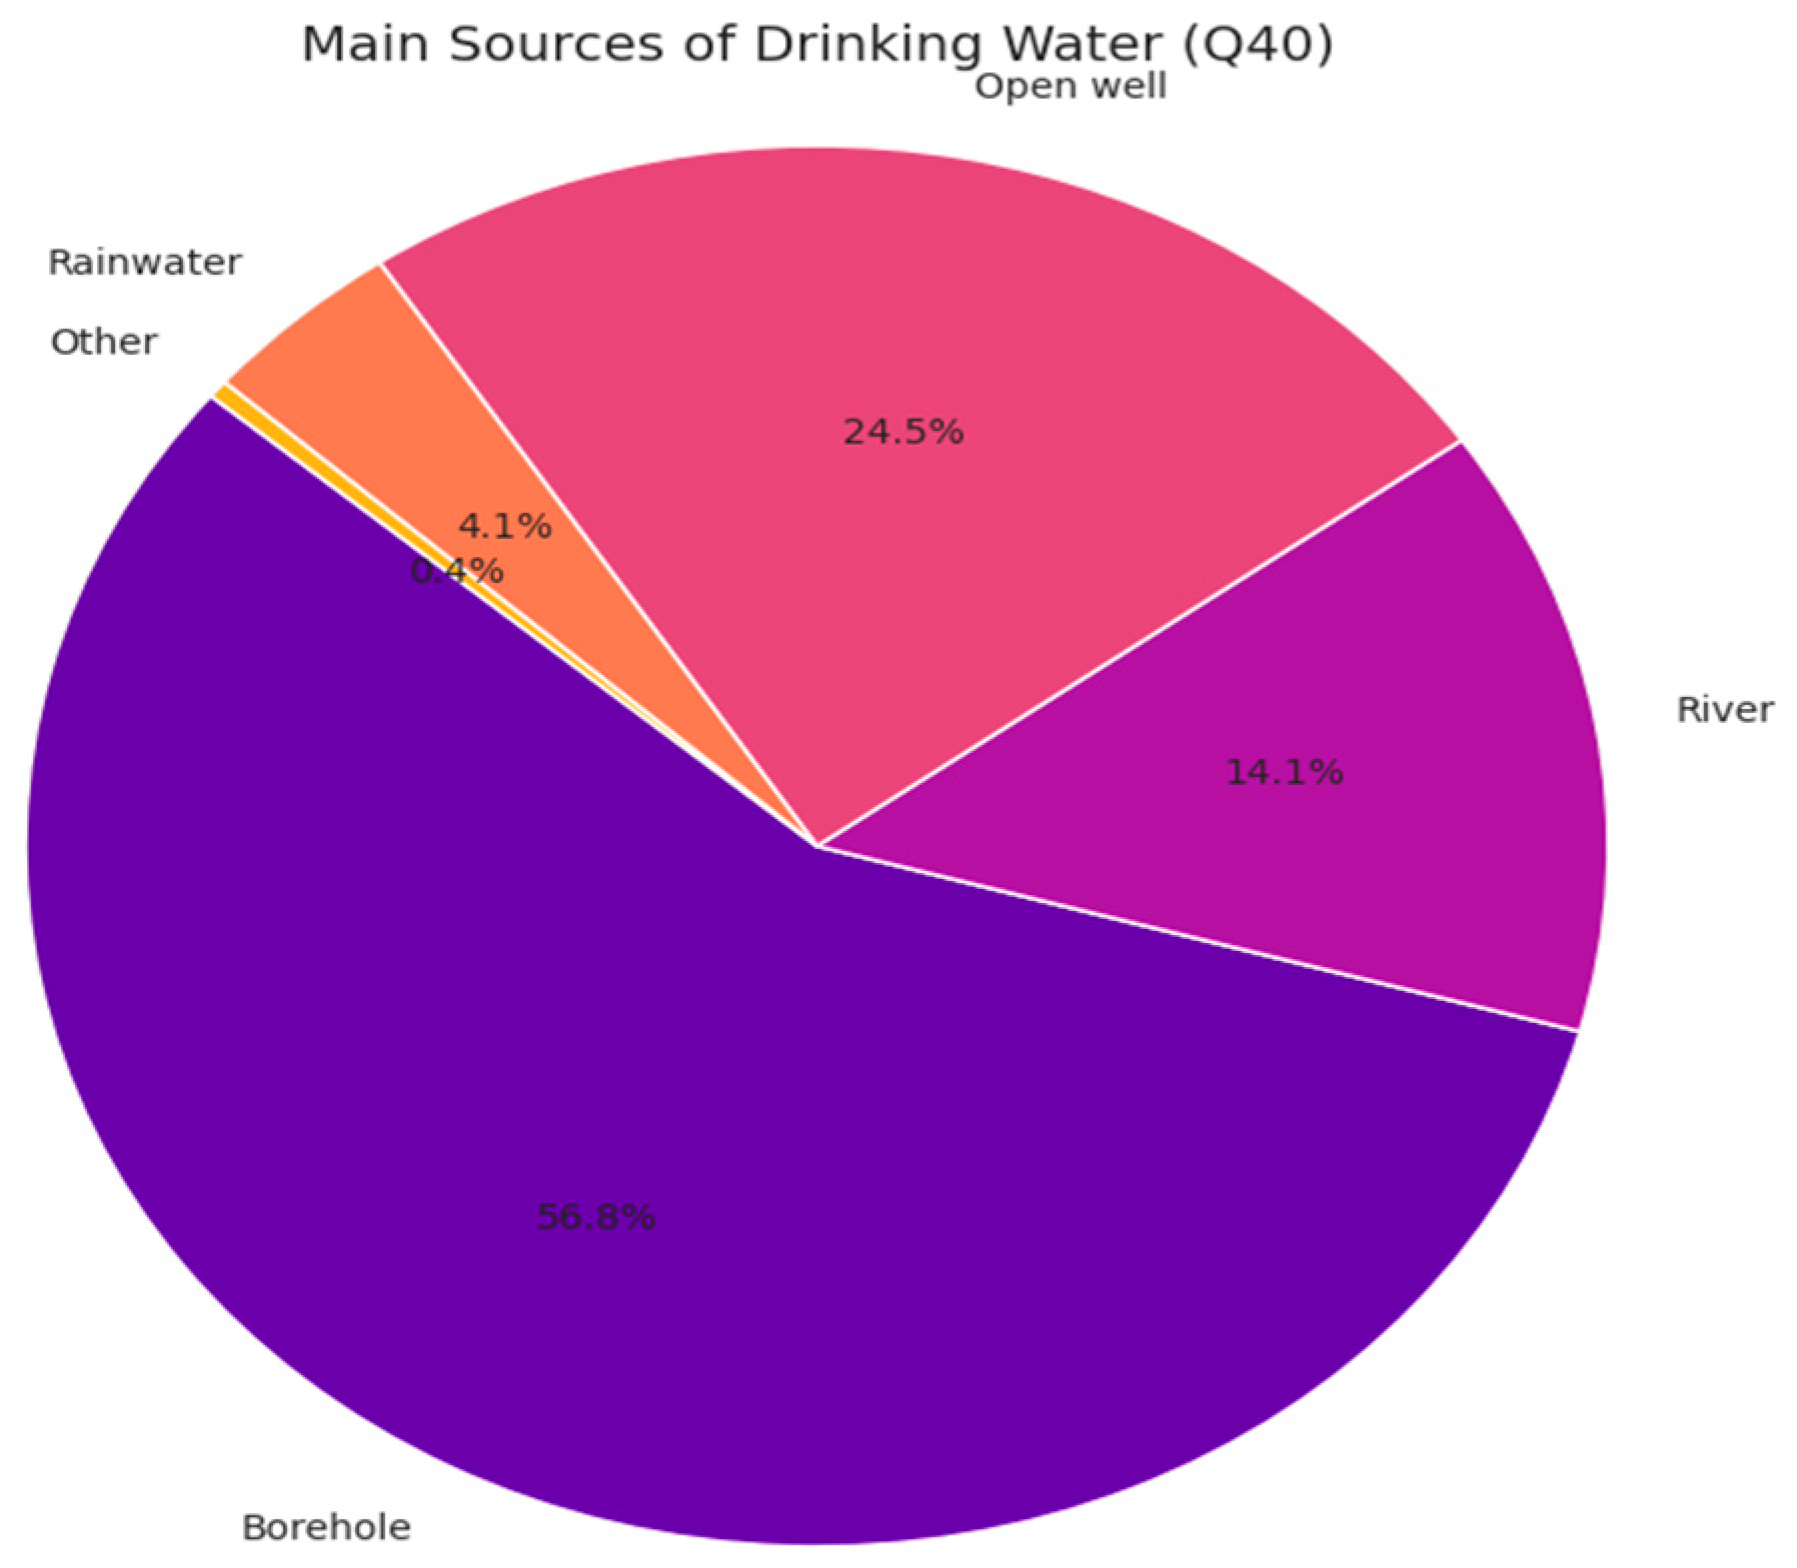
During floods, 56.8% of households rely on boreholes as their primary drinking water source, indicating relatively improved infrastructure but also potential vulnerability to contamination or mechanical failure. Open wells (24.5%) and rivers (14.1%) still serve a significant portion of the population, posing elevated health risks due to runoff and waterborne diseases. Rainwater harvesting, though used by only 4.1%, presents an opportunity for scaling up as a resilience strategy. The marginal 0.4% classified as “Other” may include bottled water, piped systems, or informal sources, which merit further investigation through follow-up surveys to ensure safe and equitable water access during emergencies.
3.18. Flooding Impacts on Water Resources
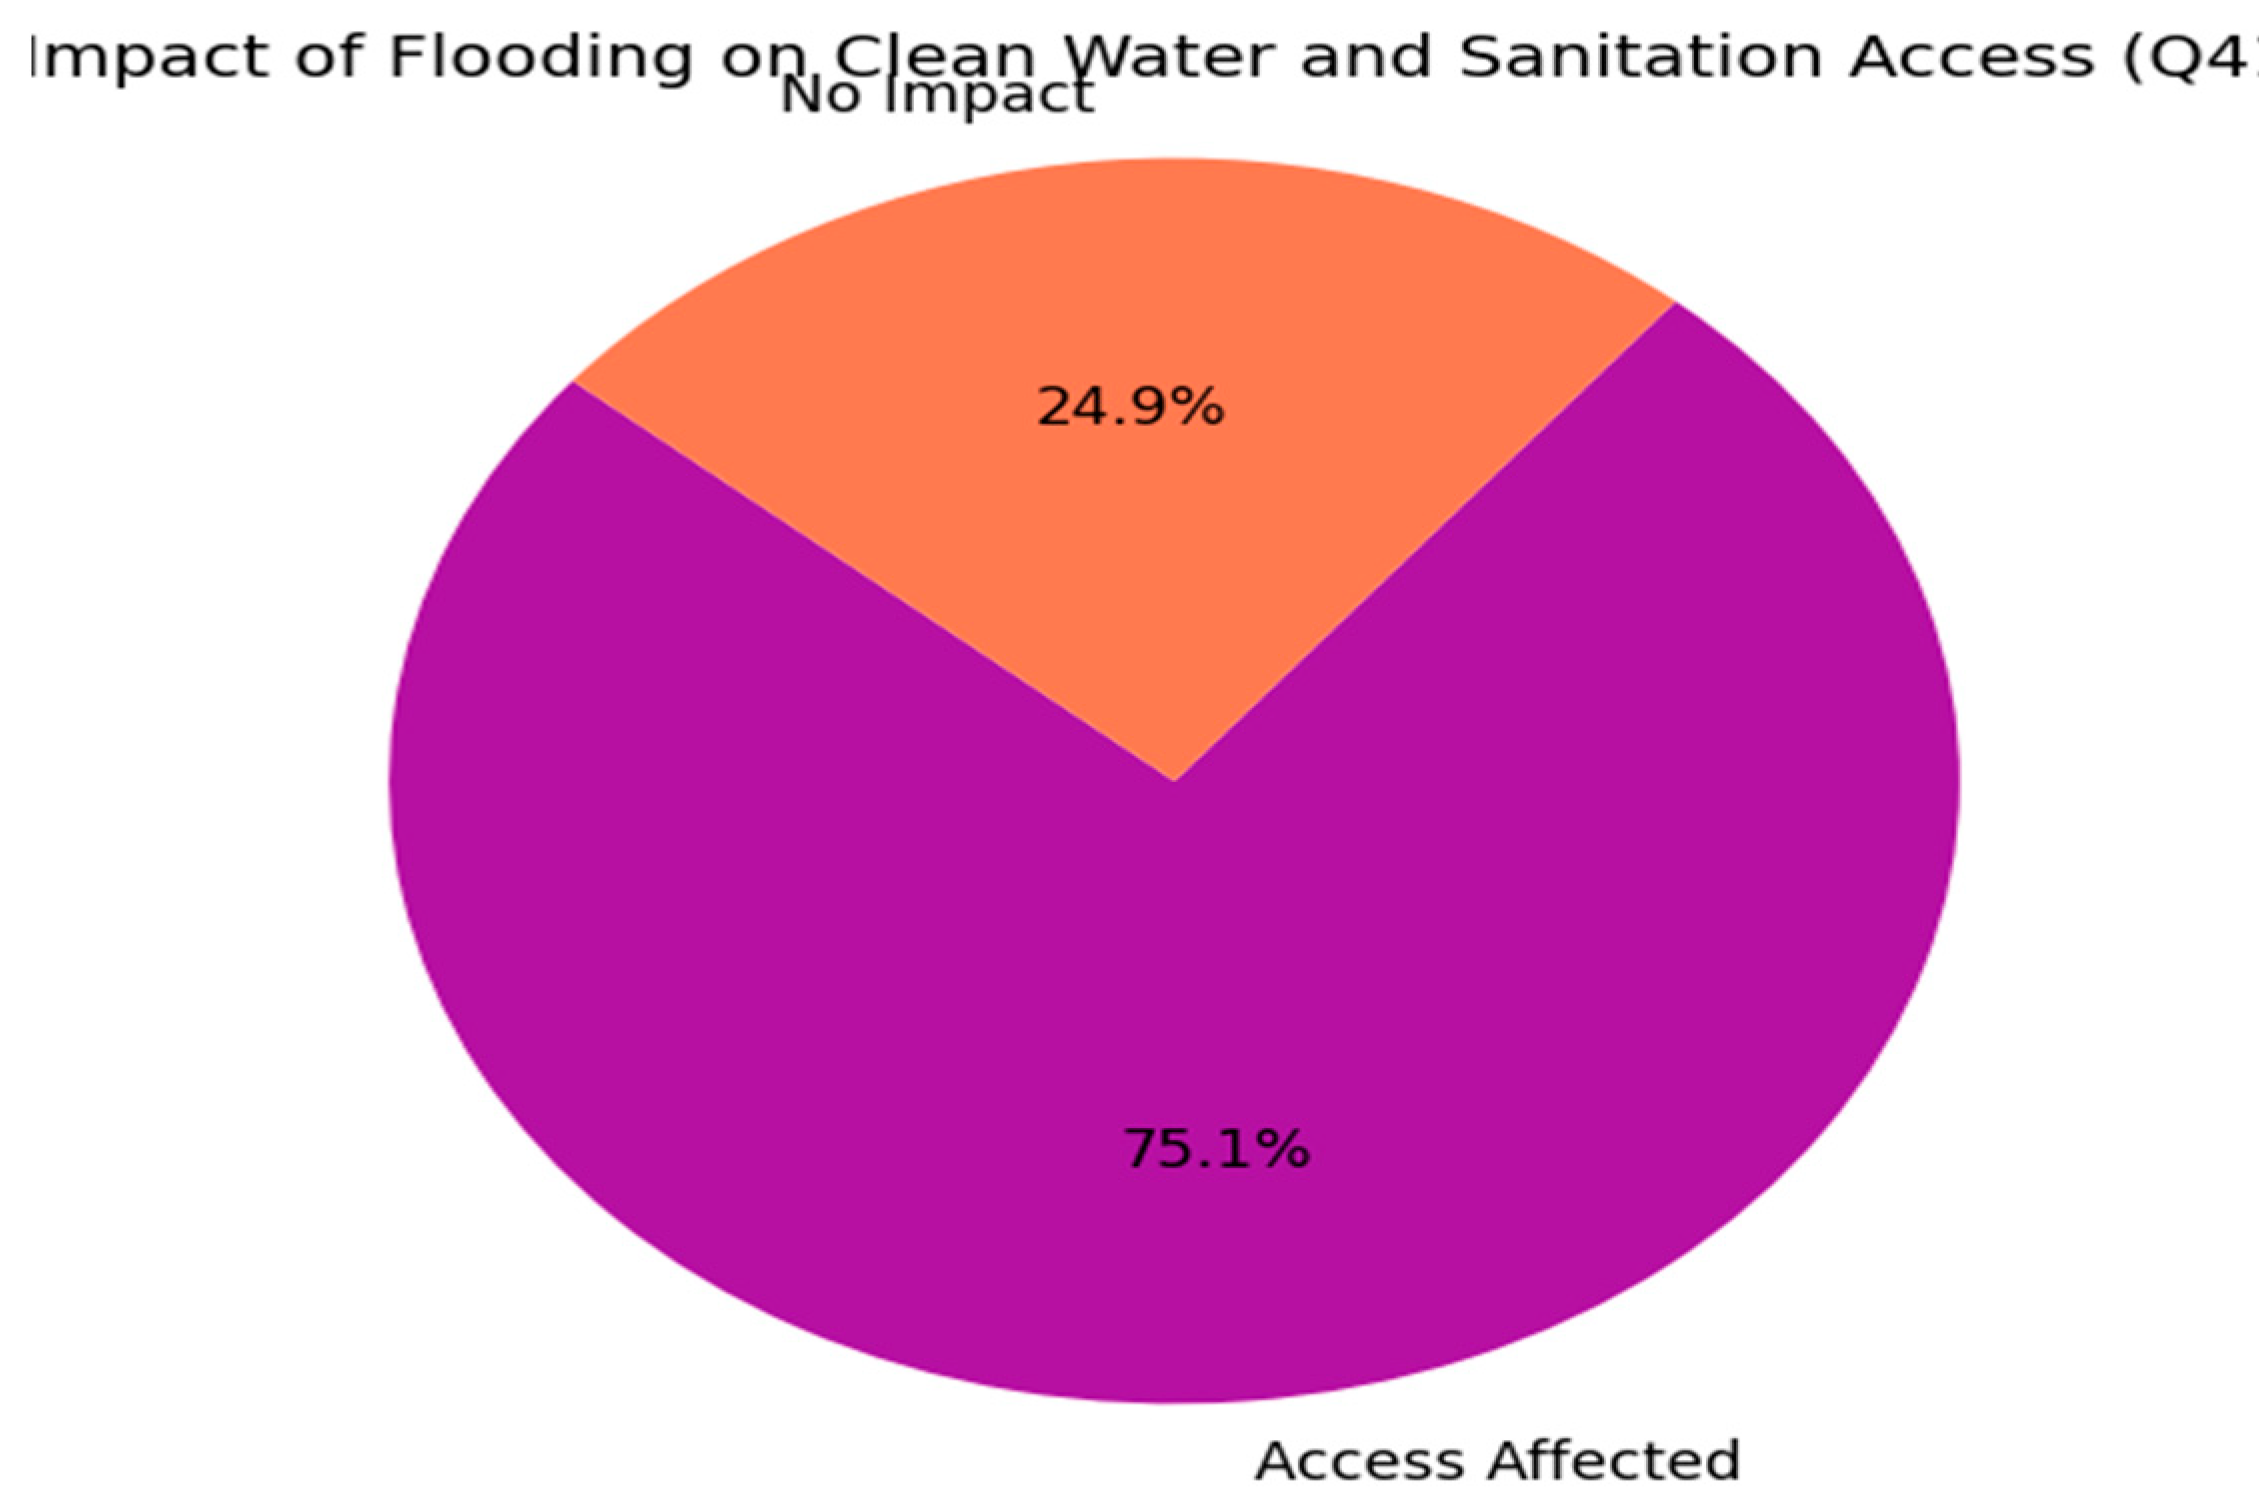
3.19. Access to Clean Water and Sanitation been Affected by Flooding
Flooding has significantly disrupted access to clean water and sanitation for 75.1% of households, revealing widespread vulnerability in WASH (Water, Sanitation, and Hygiene) systems during emergencies. While 24.9% report no impact potentially due to resilient infrastructure like boreholes or elevated latrines this minority is insufficient to counterbalance the broader public health risks. The data underscores the urgent need for targeted investments in flood-resilient WASH solutions, including raised latrine platforms, protected borehole systems, and emergency water treatment kits, to safeguard communities and promote equitable access during climate-induced crises.
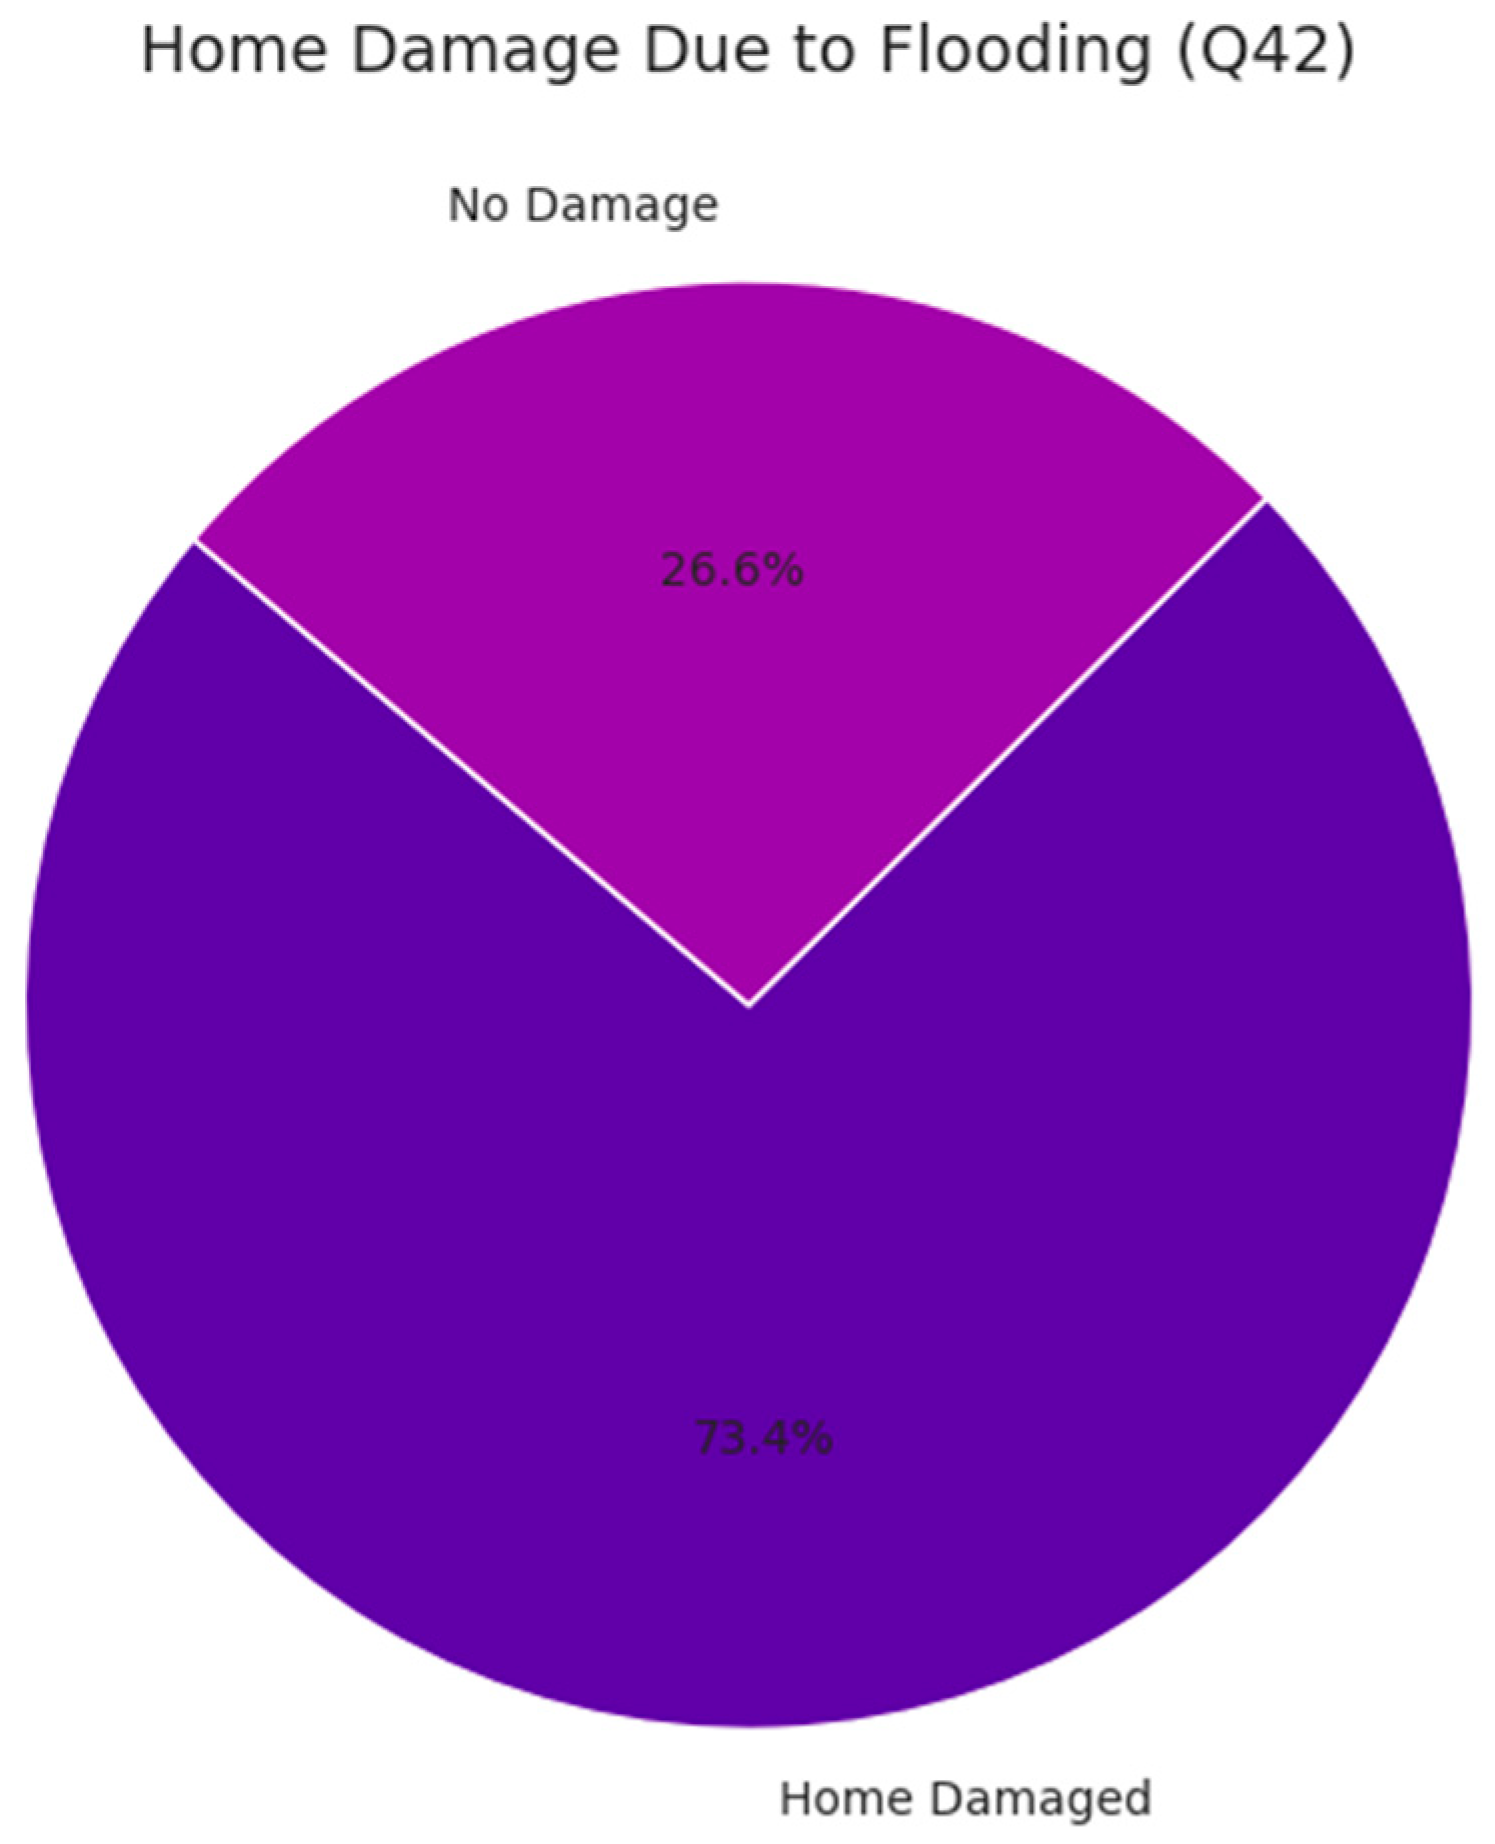
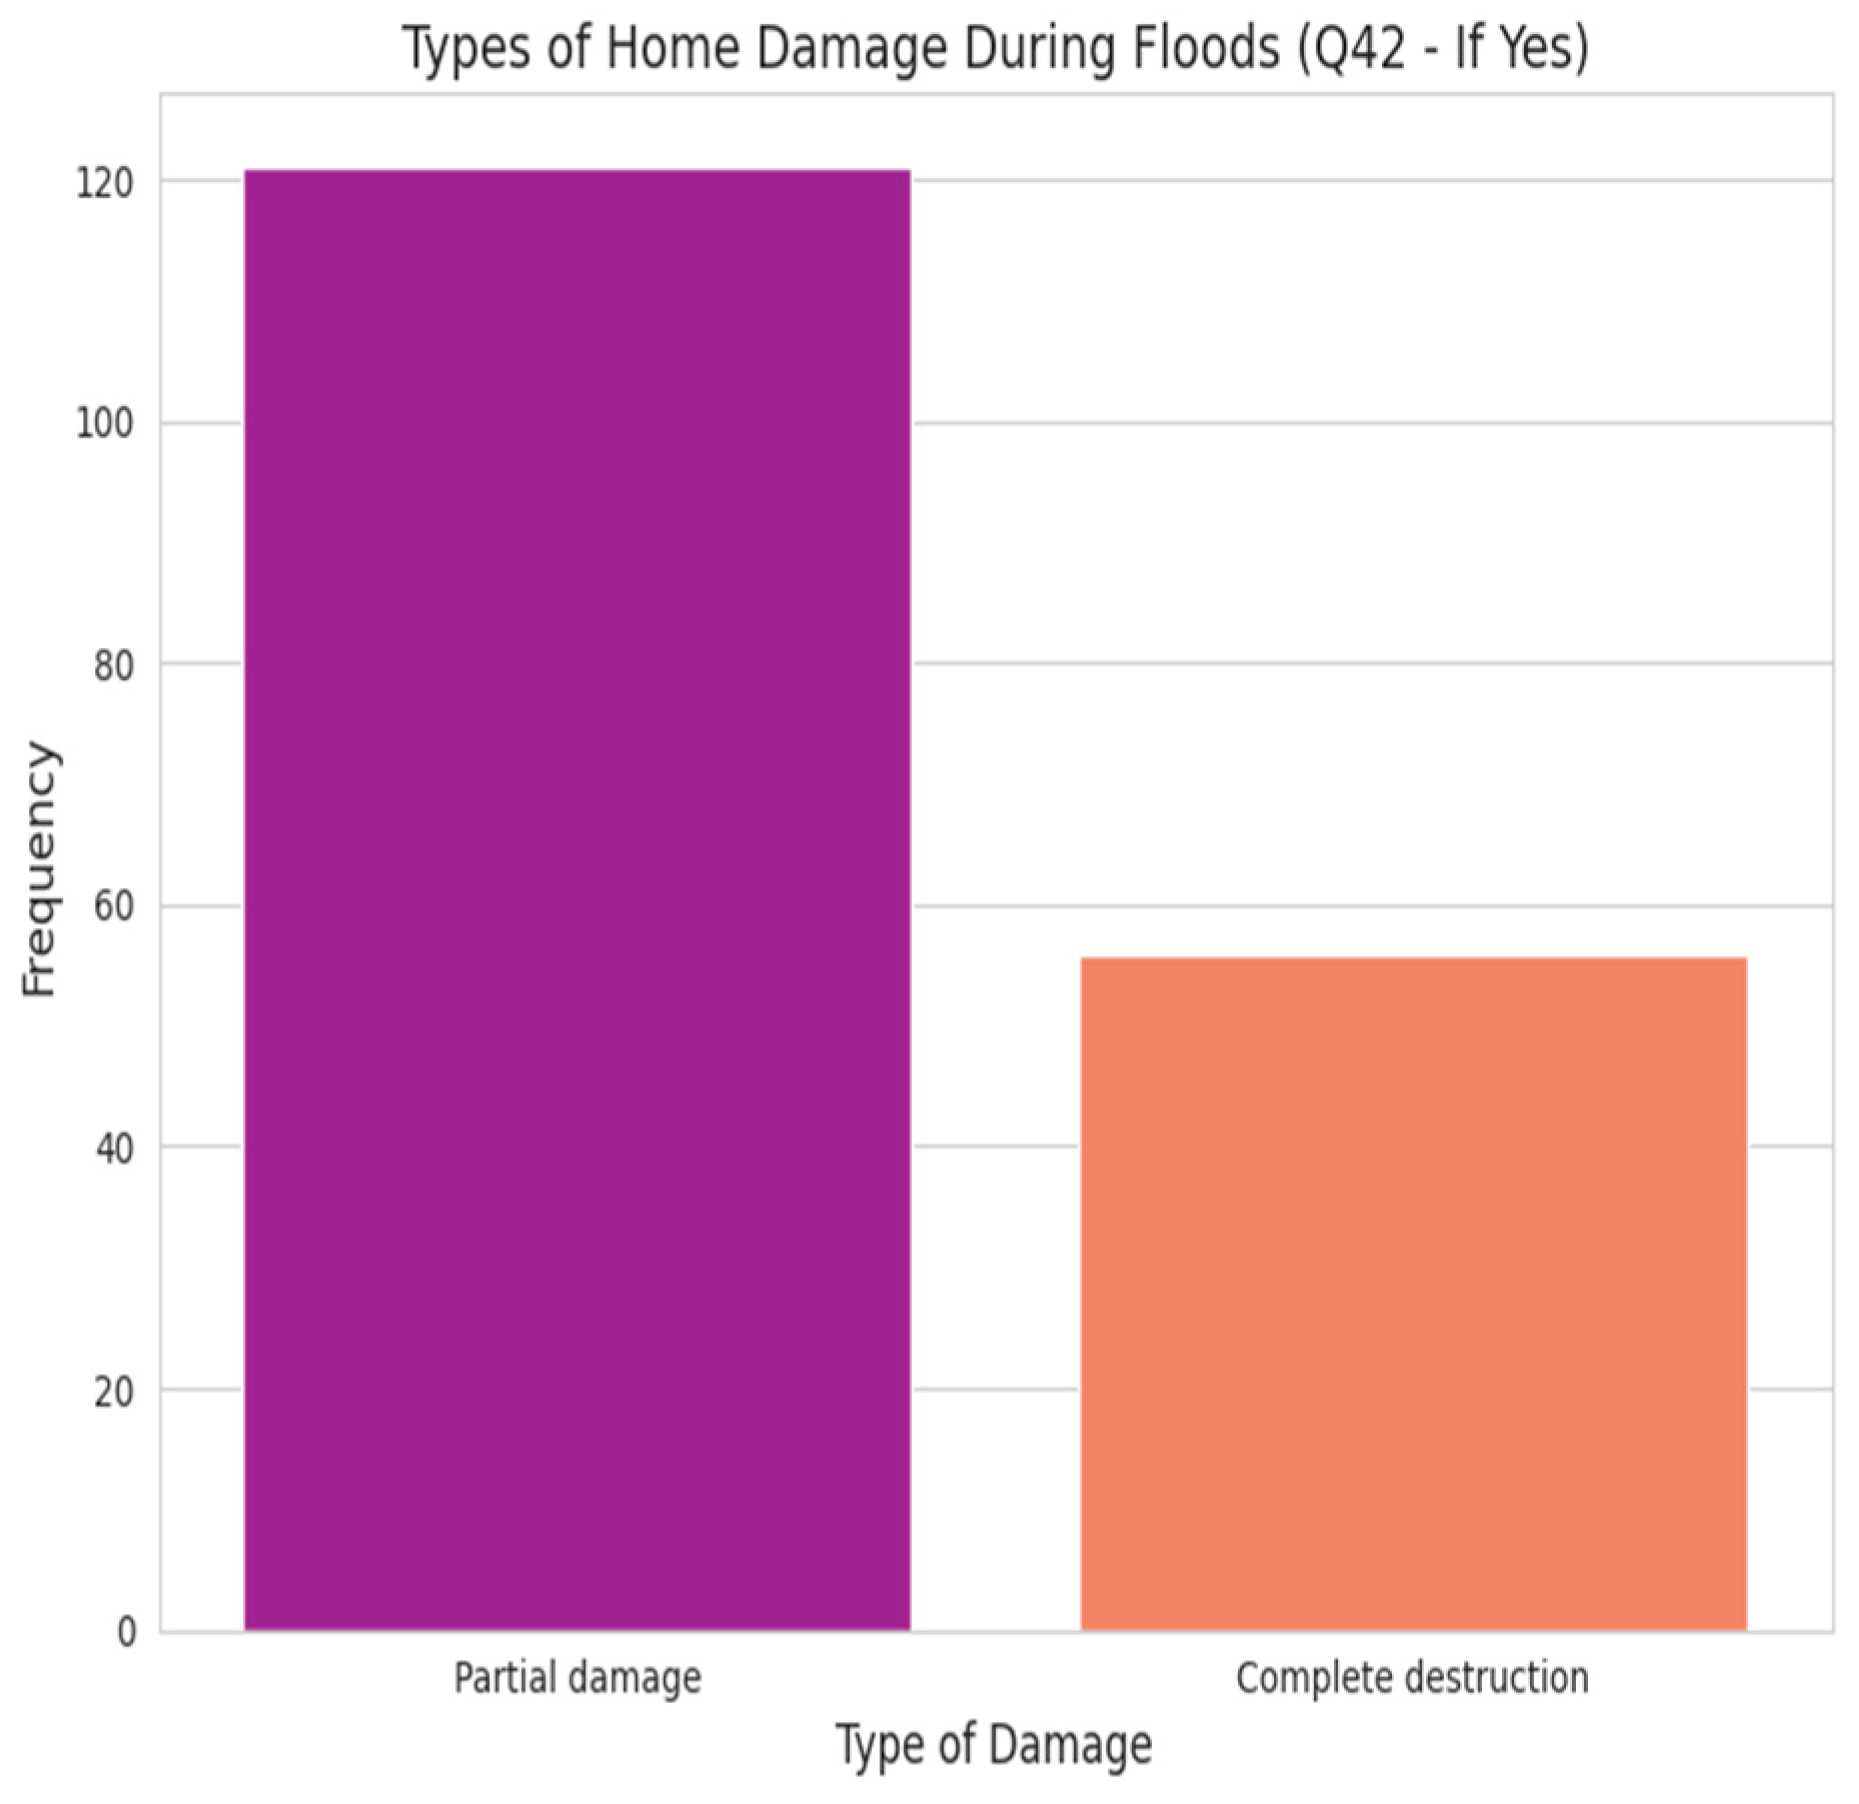
Figure 21.
Home damaged due to flooding.
Figure 22.
Level of home damage by flood.
Flooding has structurally impacted 73.4% of households, with nearly three out of four reporting damage to their homes an alarming rate of exposure. Among the 177 affected households, 68.4% experienced partial damage while 31.6% suffered complete destruction, underscoring the severity of impact and the urgent need for both repair and full reconstruction support. This widespread vulnerability highlights critical gaps in housing resilience and calls for strategic planning, including flood-adapted building designs, community-led reconstruction initiatives, and robust emergency shelter systems to safeguard lives and livelihoods in disaster-prone areas.
Among the 177 households that experienced flood-related damage, 68.4% reported partial damage while 31.6% suffered complete destruction revealing a high level of structural vulnerability and underscoring the severity of impact. This means nearly one in three affected homes are rendered uninhabitable, placing a heavy recovery burden on families and communities. The findings emphasize the urgent need for resilient housing designs, community-driven reconstruction efforts, and robust emergency shelter planning to mitigate future risks and support long-term recovery in flood-prone areas.
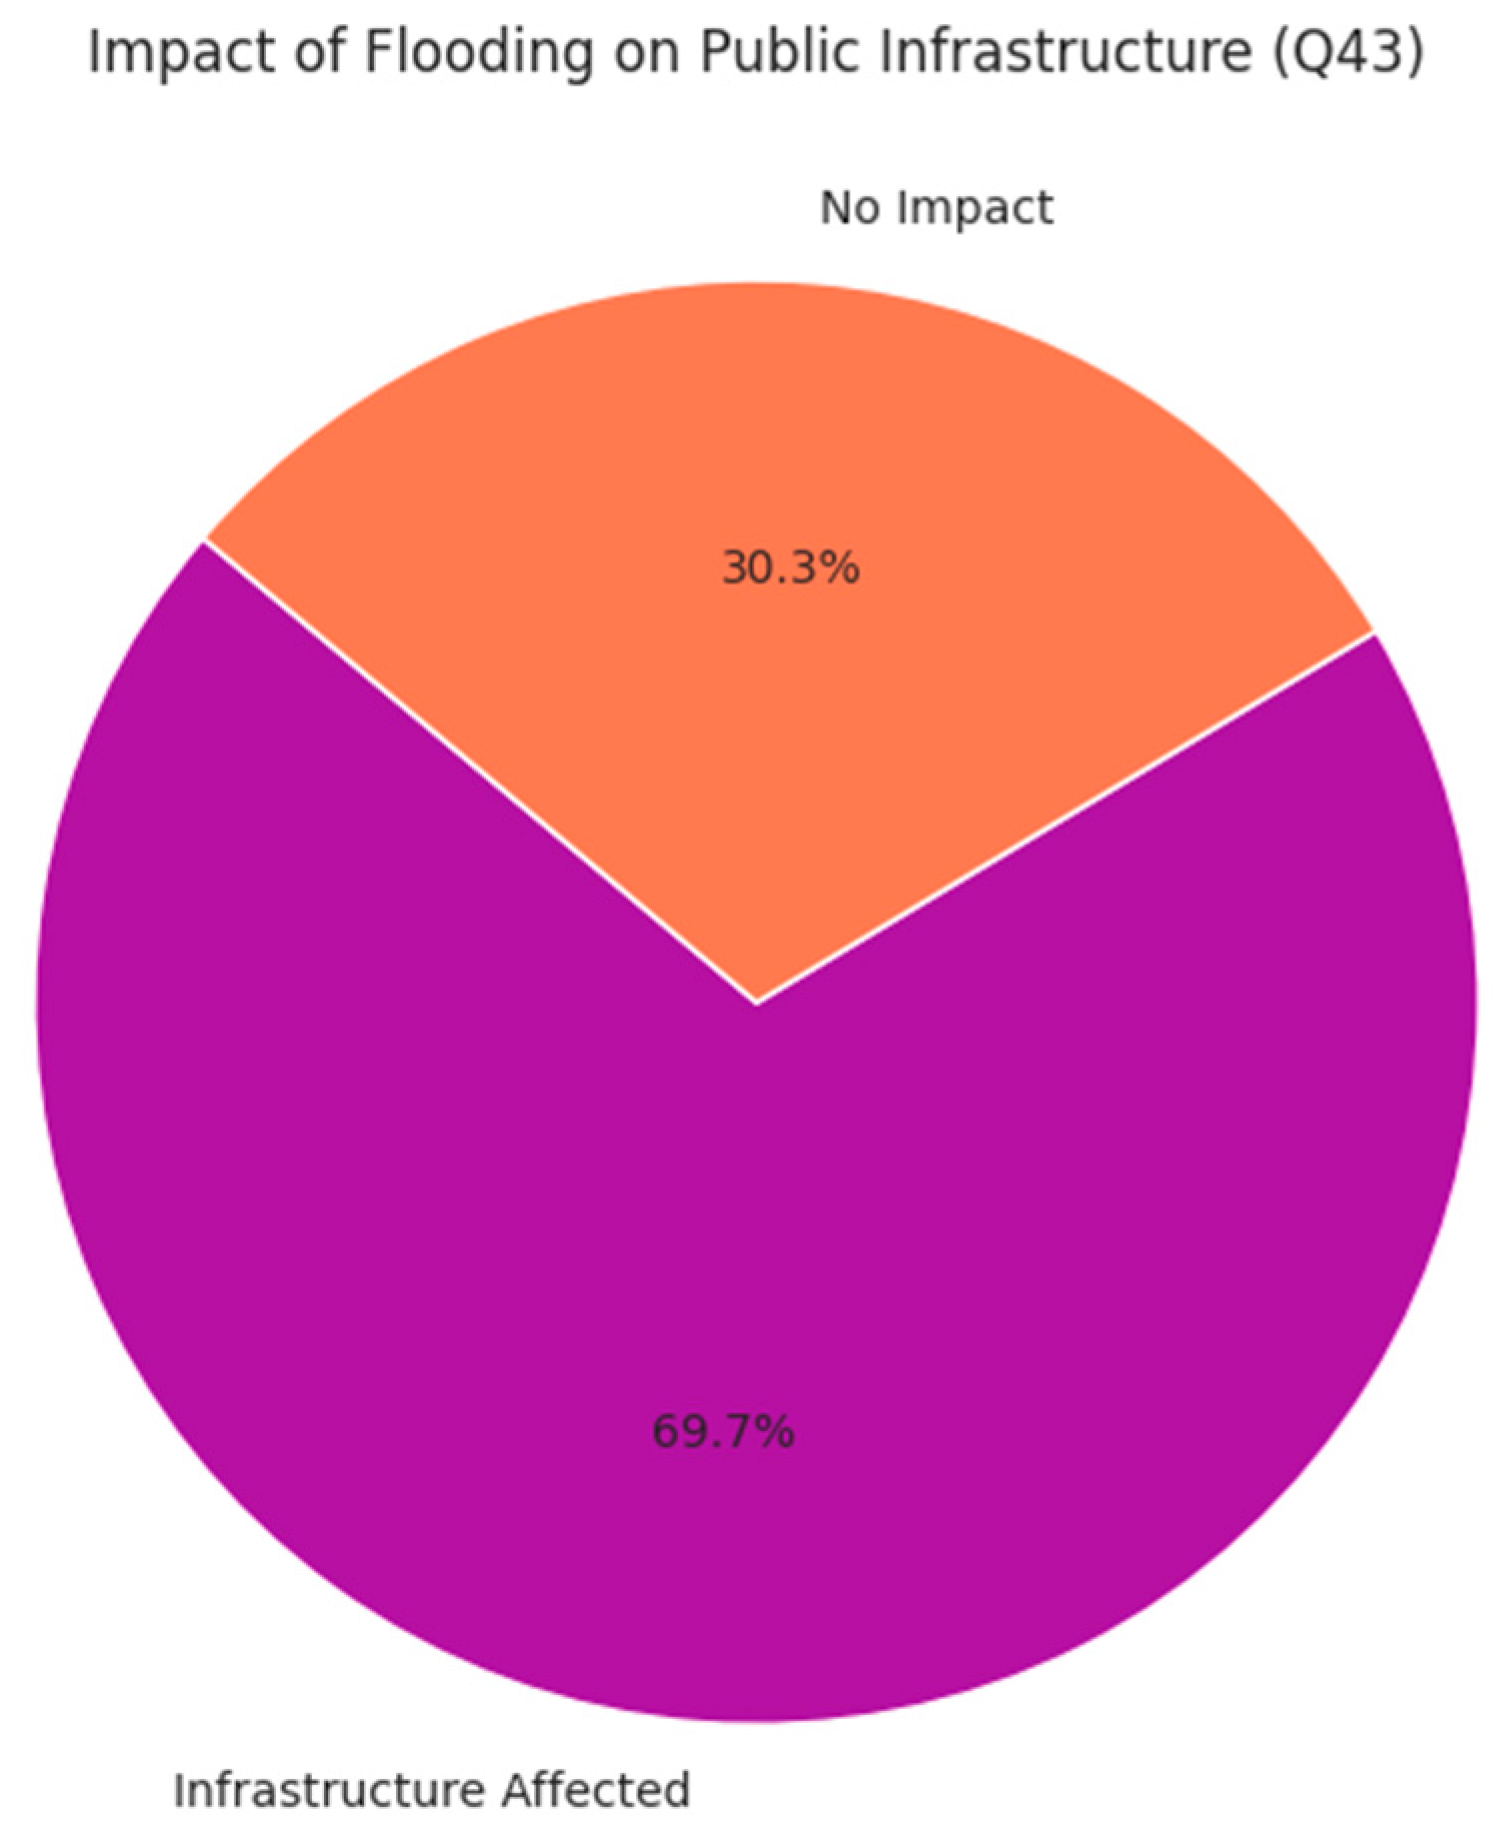
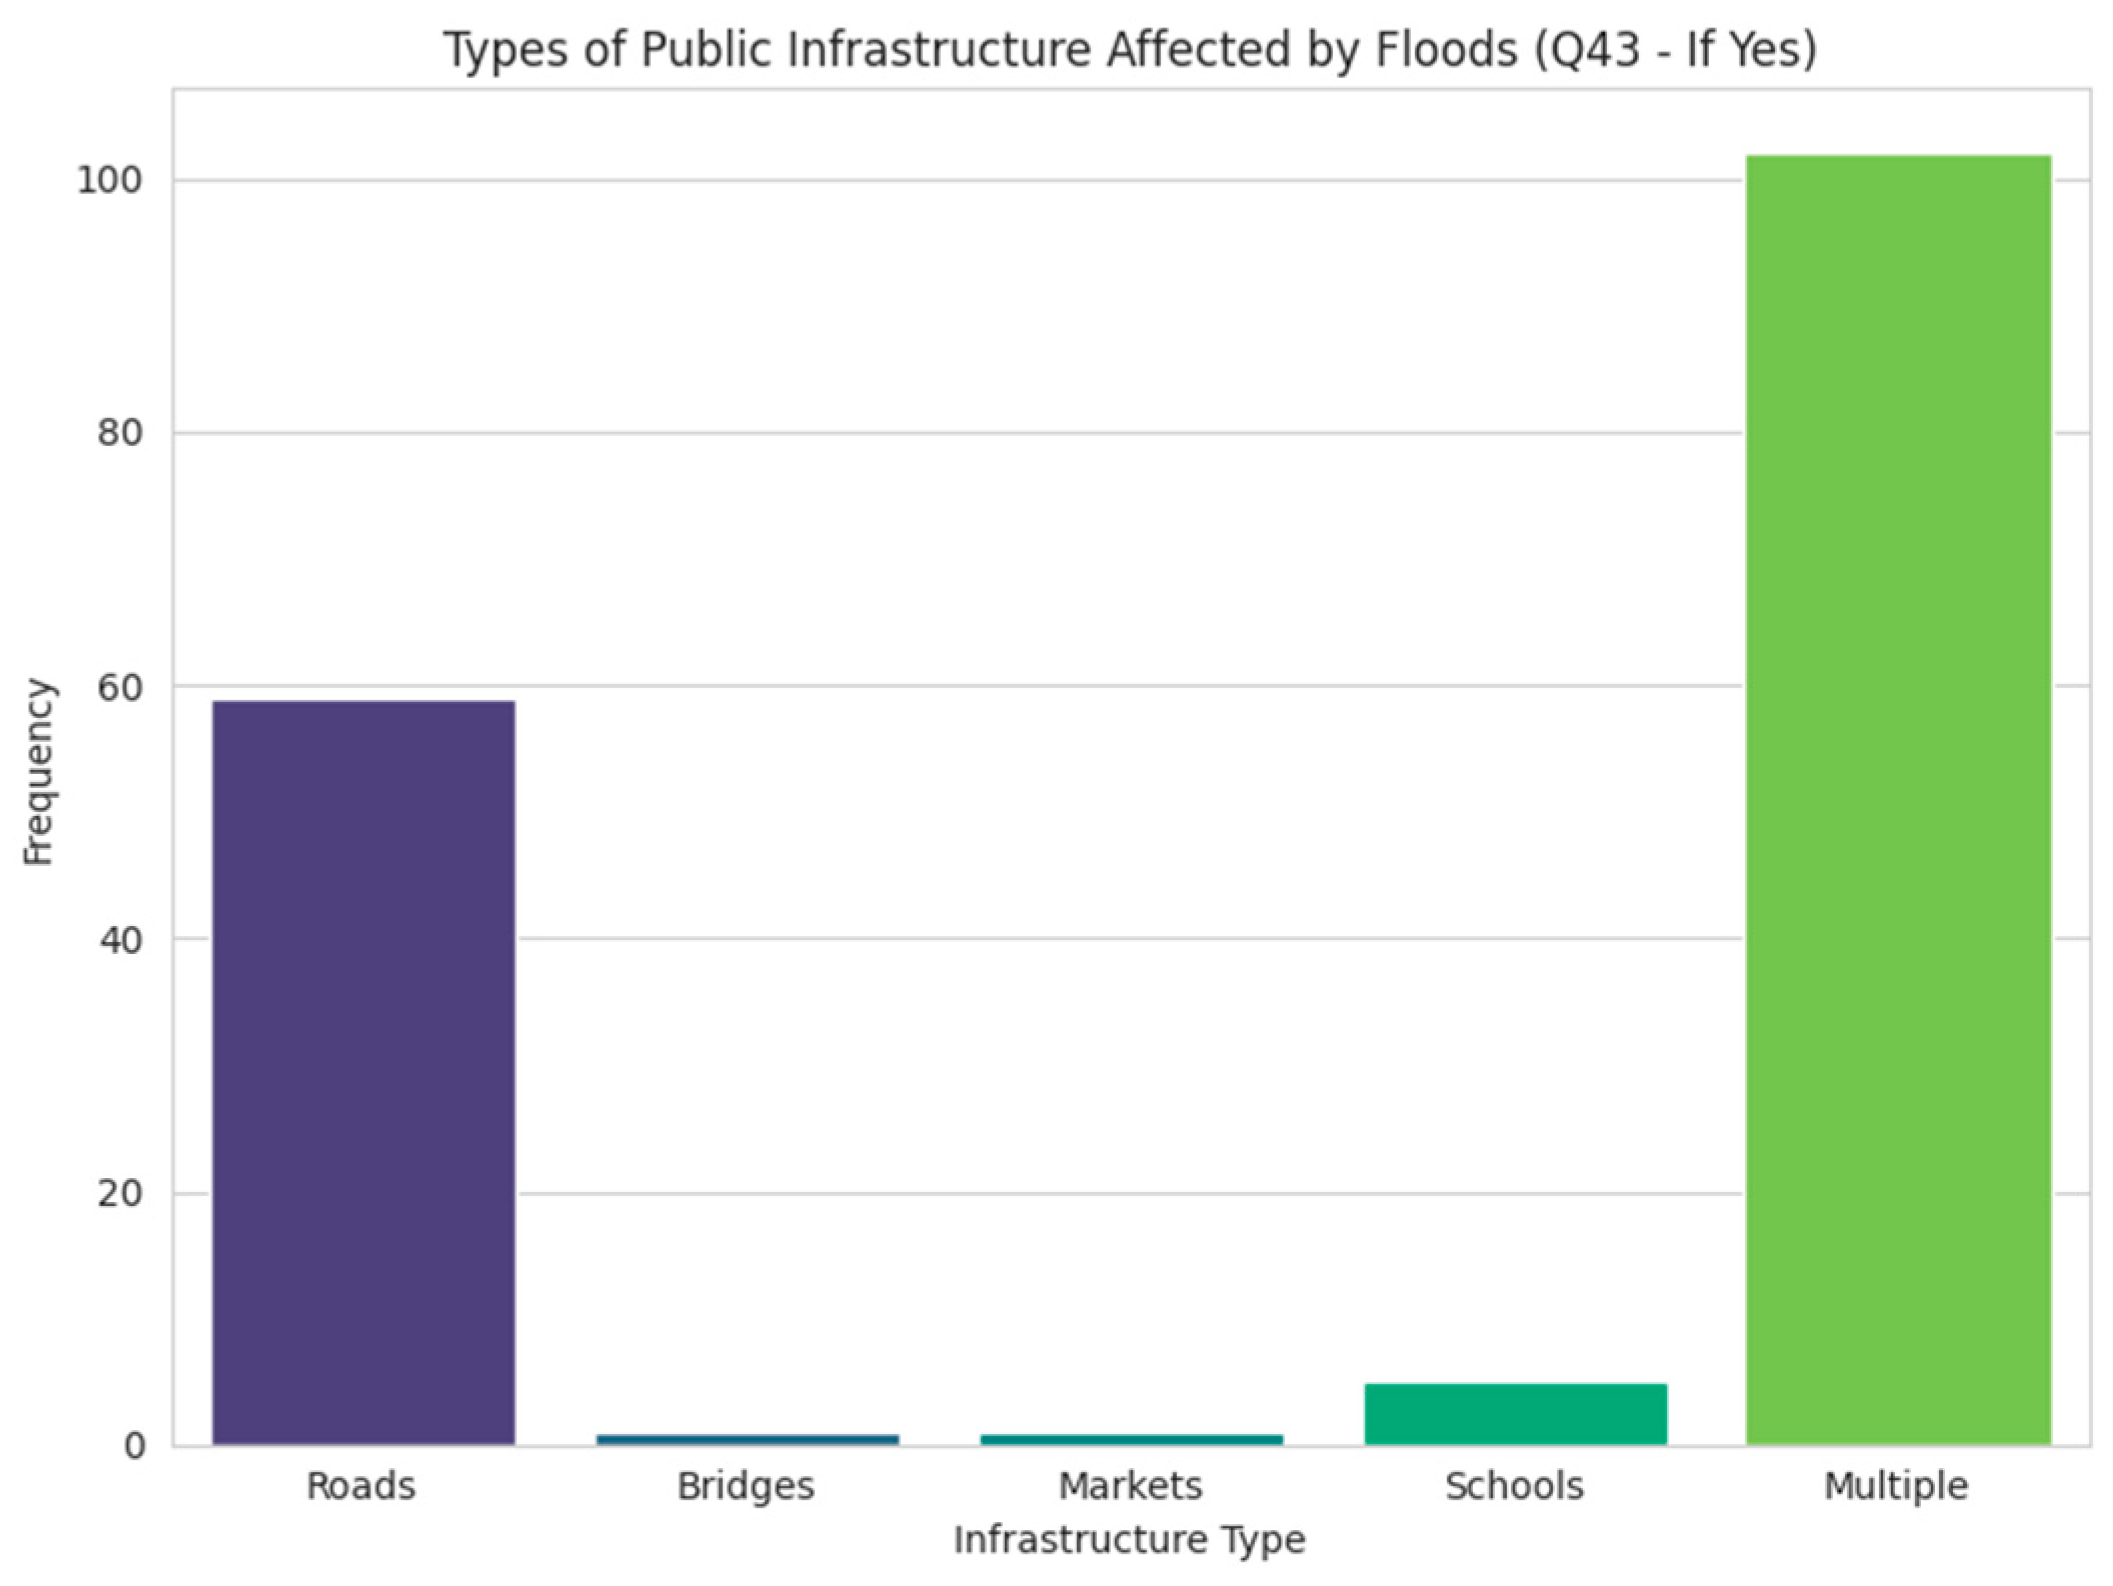
Figure 23.
Impact of flood on public infrastructure.
Figure 24.
Types of infrastructure damaged by flood.
Nearly 70% of surveyed households reported flood-related damage to public infrastructure, underscoring widespread disruption across affected regions. Roads emerged as the most frequently cited single infrastructure affected (35.1%), highlighting their vulnerability and importance for mobility and access. However, the majority of responses (61.3%) indicated multi-sector damage combinations involving roads, bridges, markets, and schools reflecting the interconnected nature of flood impacts. This pattern suggests that floods rarely affect one system in isolation and reinforces the need for integrated recovery planning that prioritizes transport, education, and market access to restore community functionality and resilience.
Figure 25.
Access to mental Health support after floods.
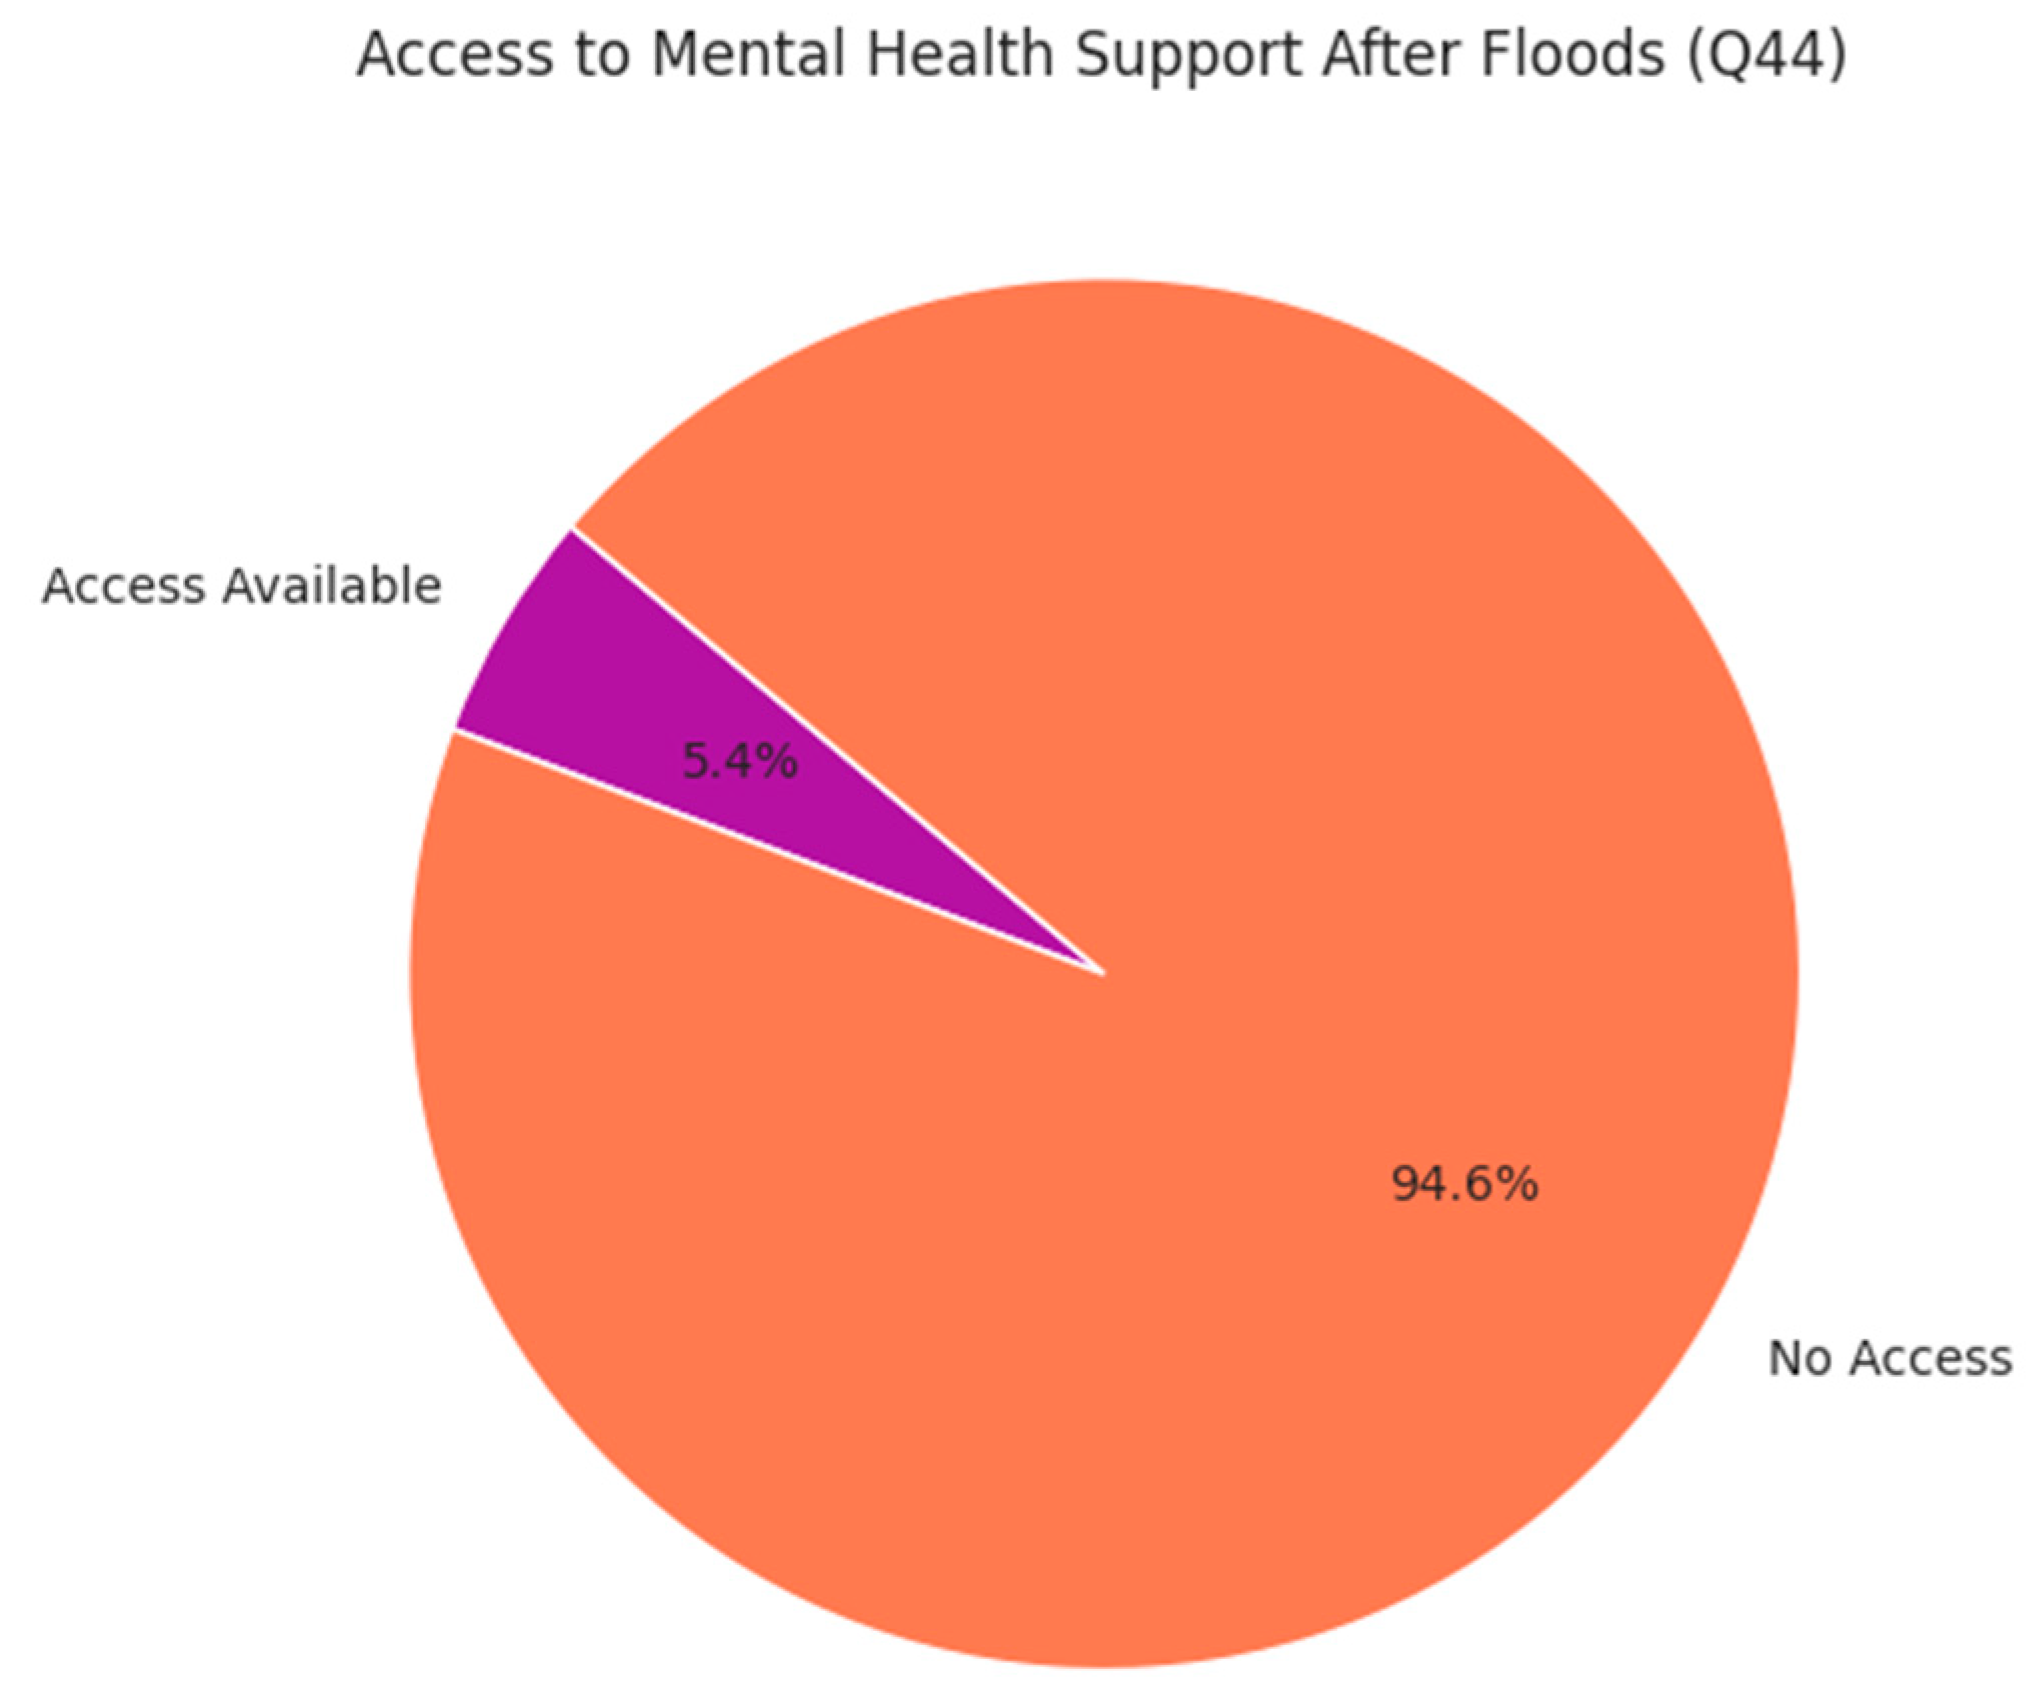
The data reveals a stark gap in post-flood recovery services, with only 5.4% of households reporting access to mental health or psychosocial support, while an overwhelming 94.6% remain without such services. This imbalance underscores a critical shortfall in addressing emotional well-being and trauma in disaster-affected communities, pointing to an urgent need for integrated mental health interventions within humanitarian and resilience-building frameworks.
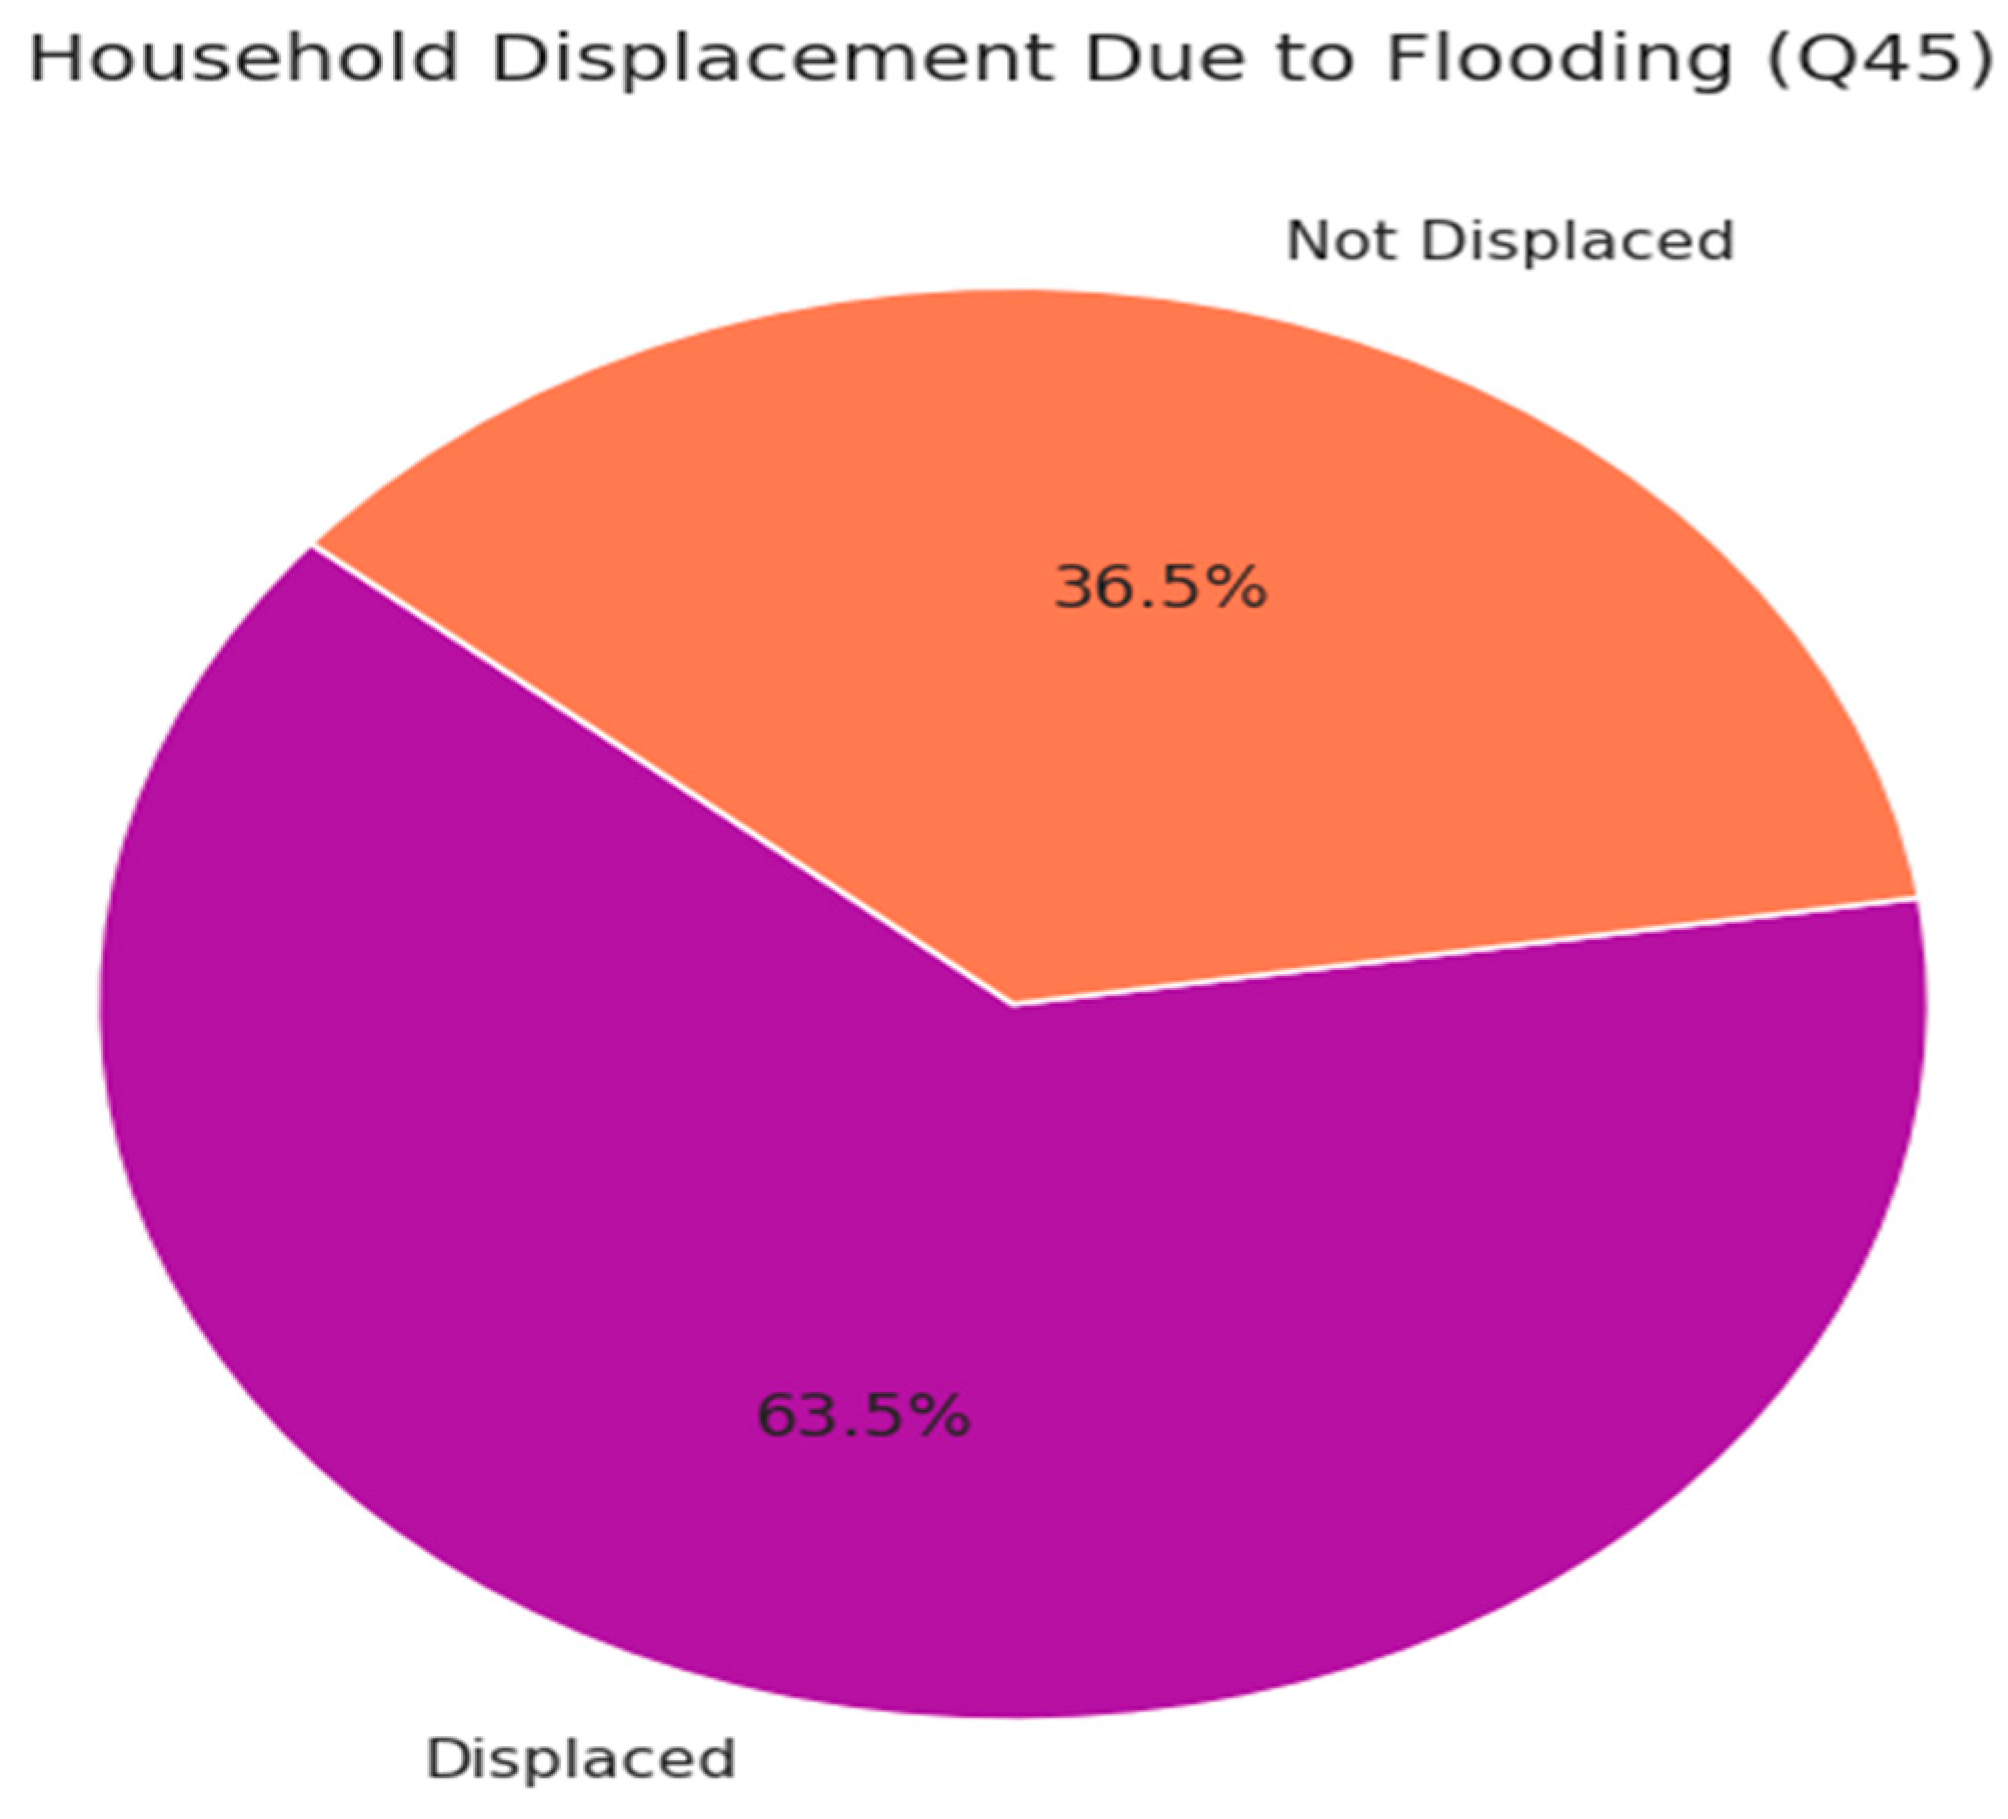
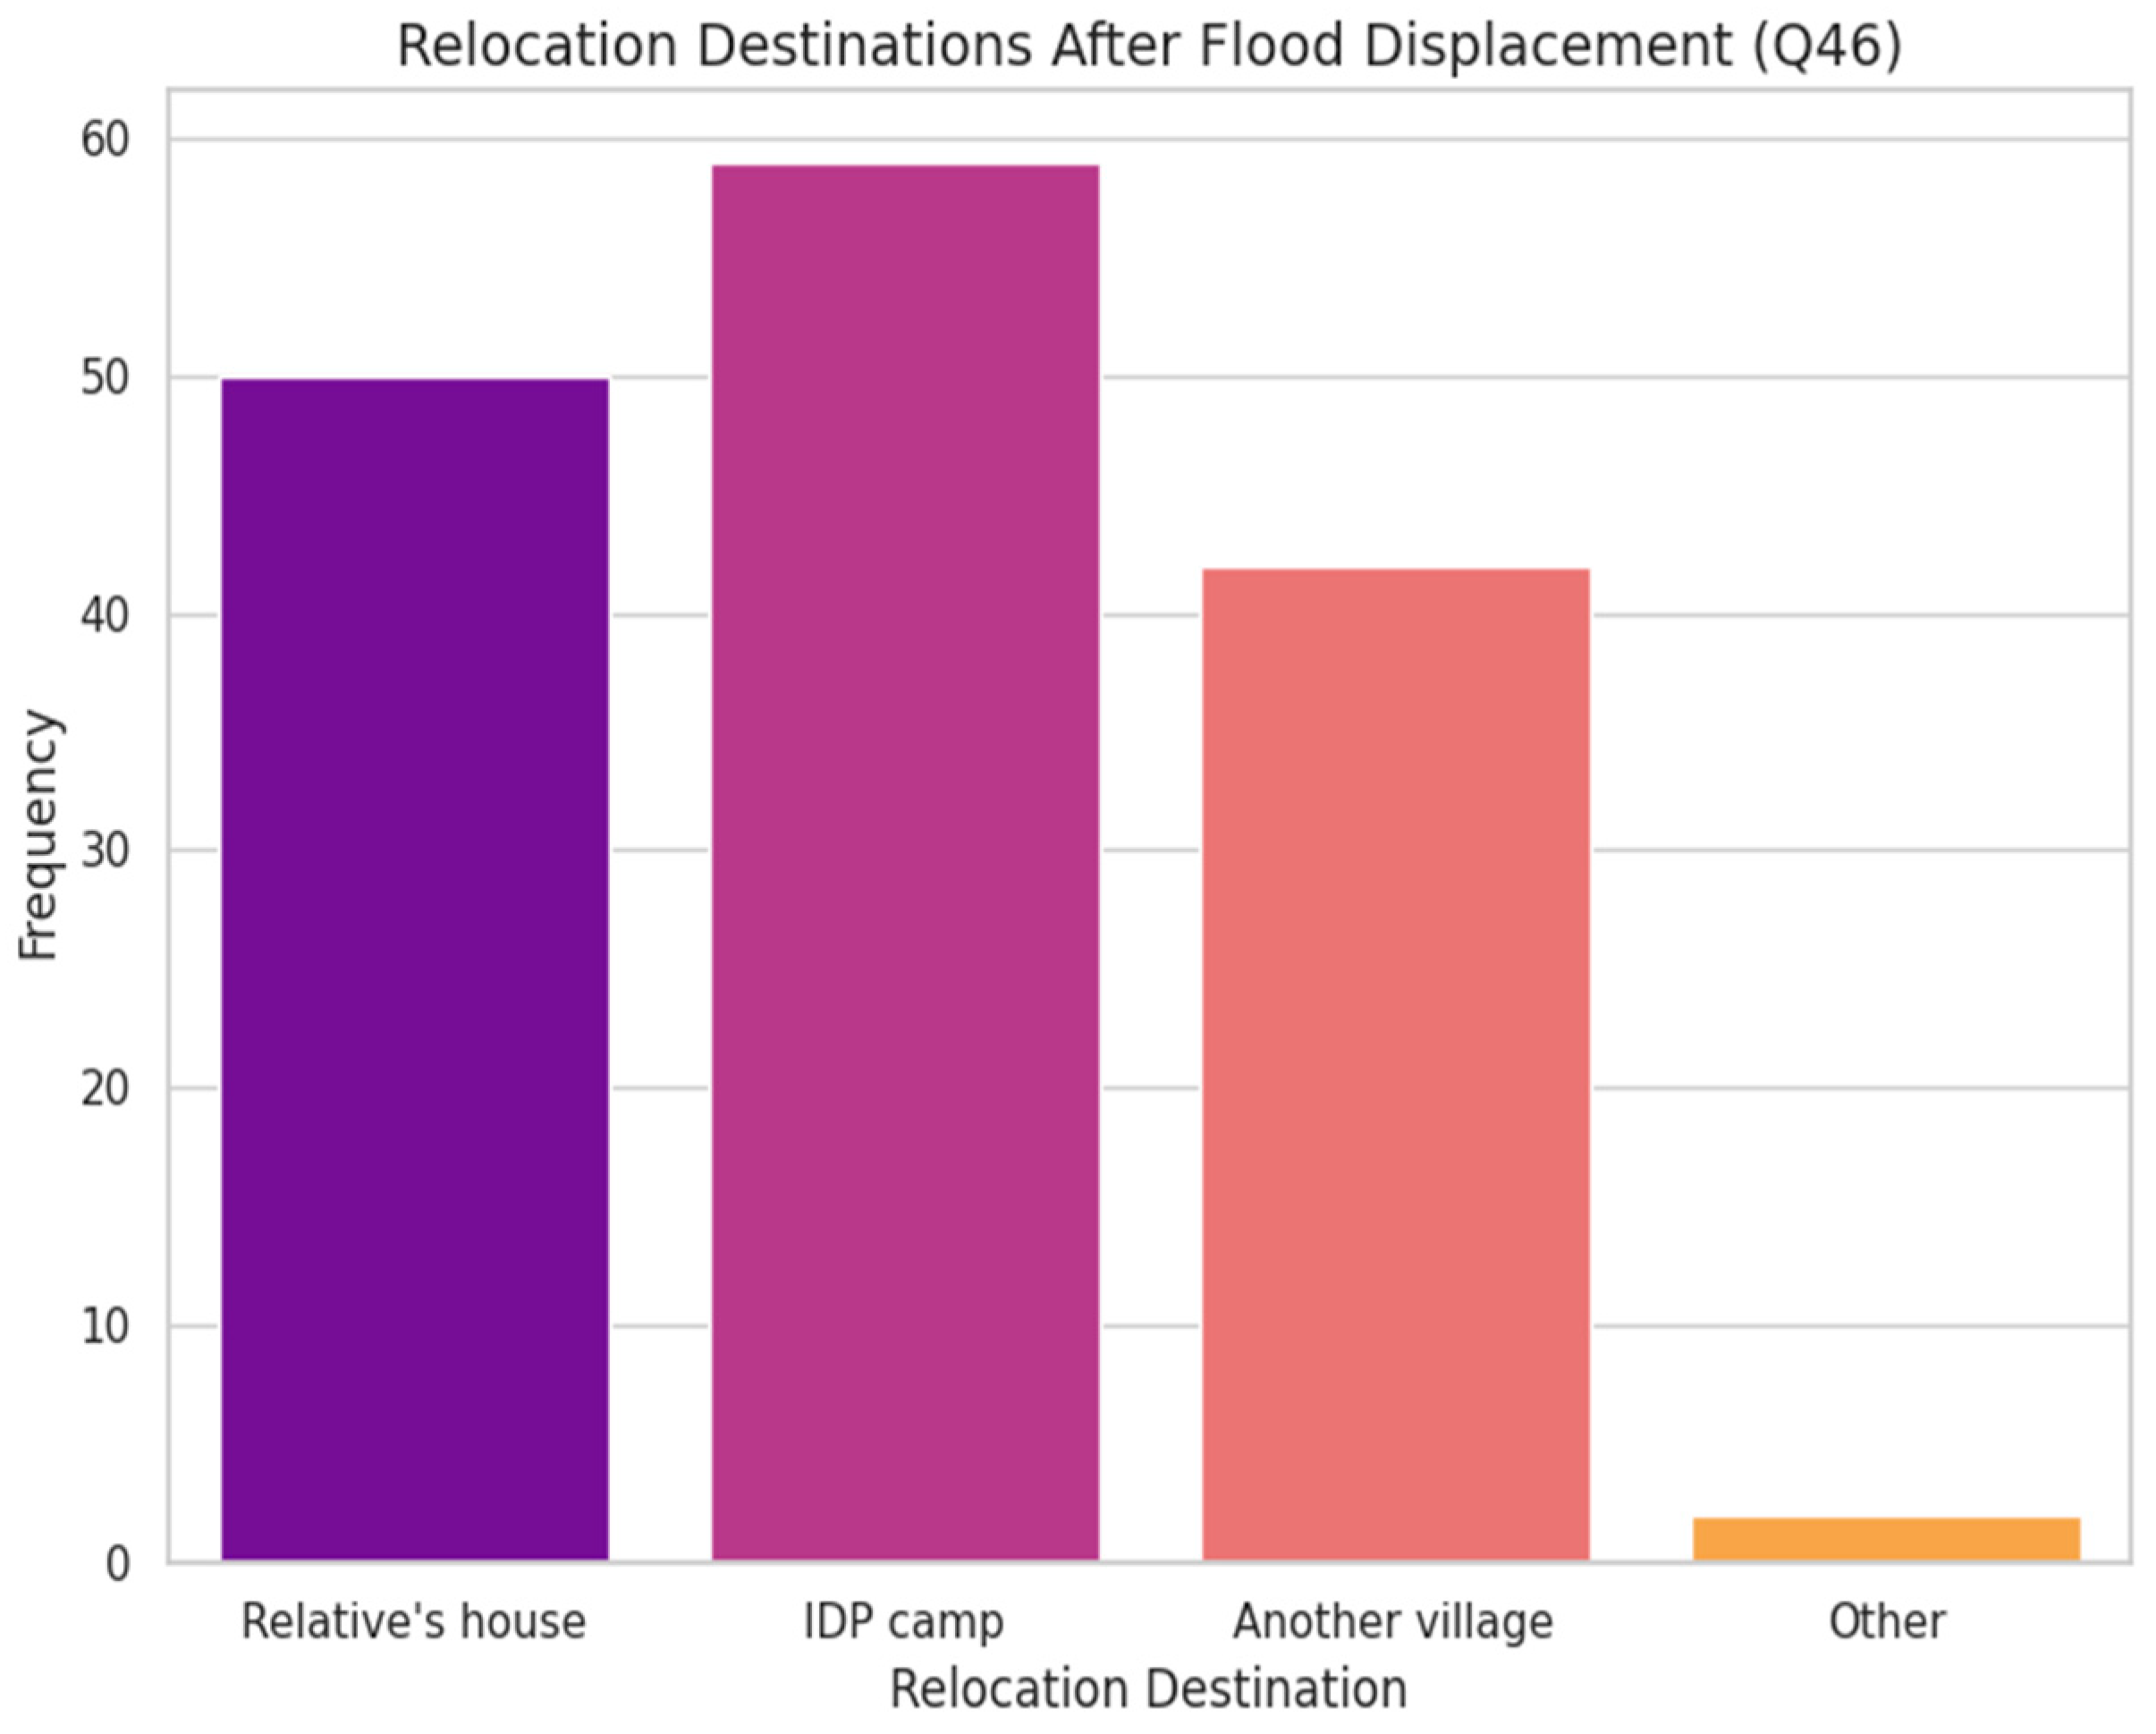
Figure 26.
Household displacement due to flooding .
Figure 27.
Relocation destinations after flooding.
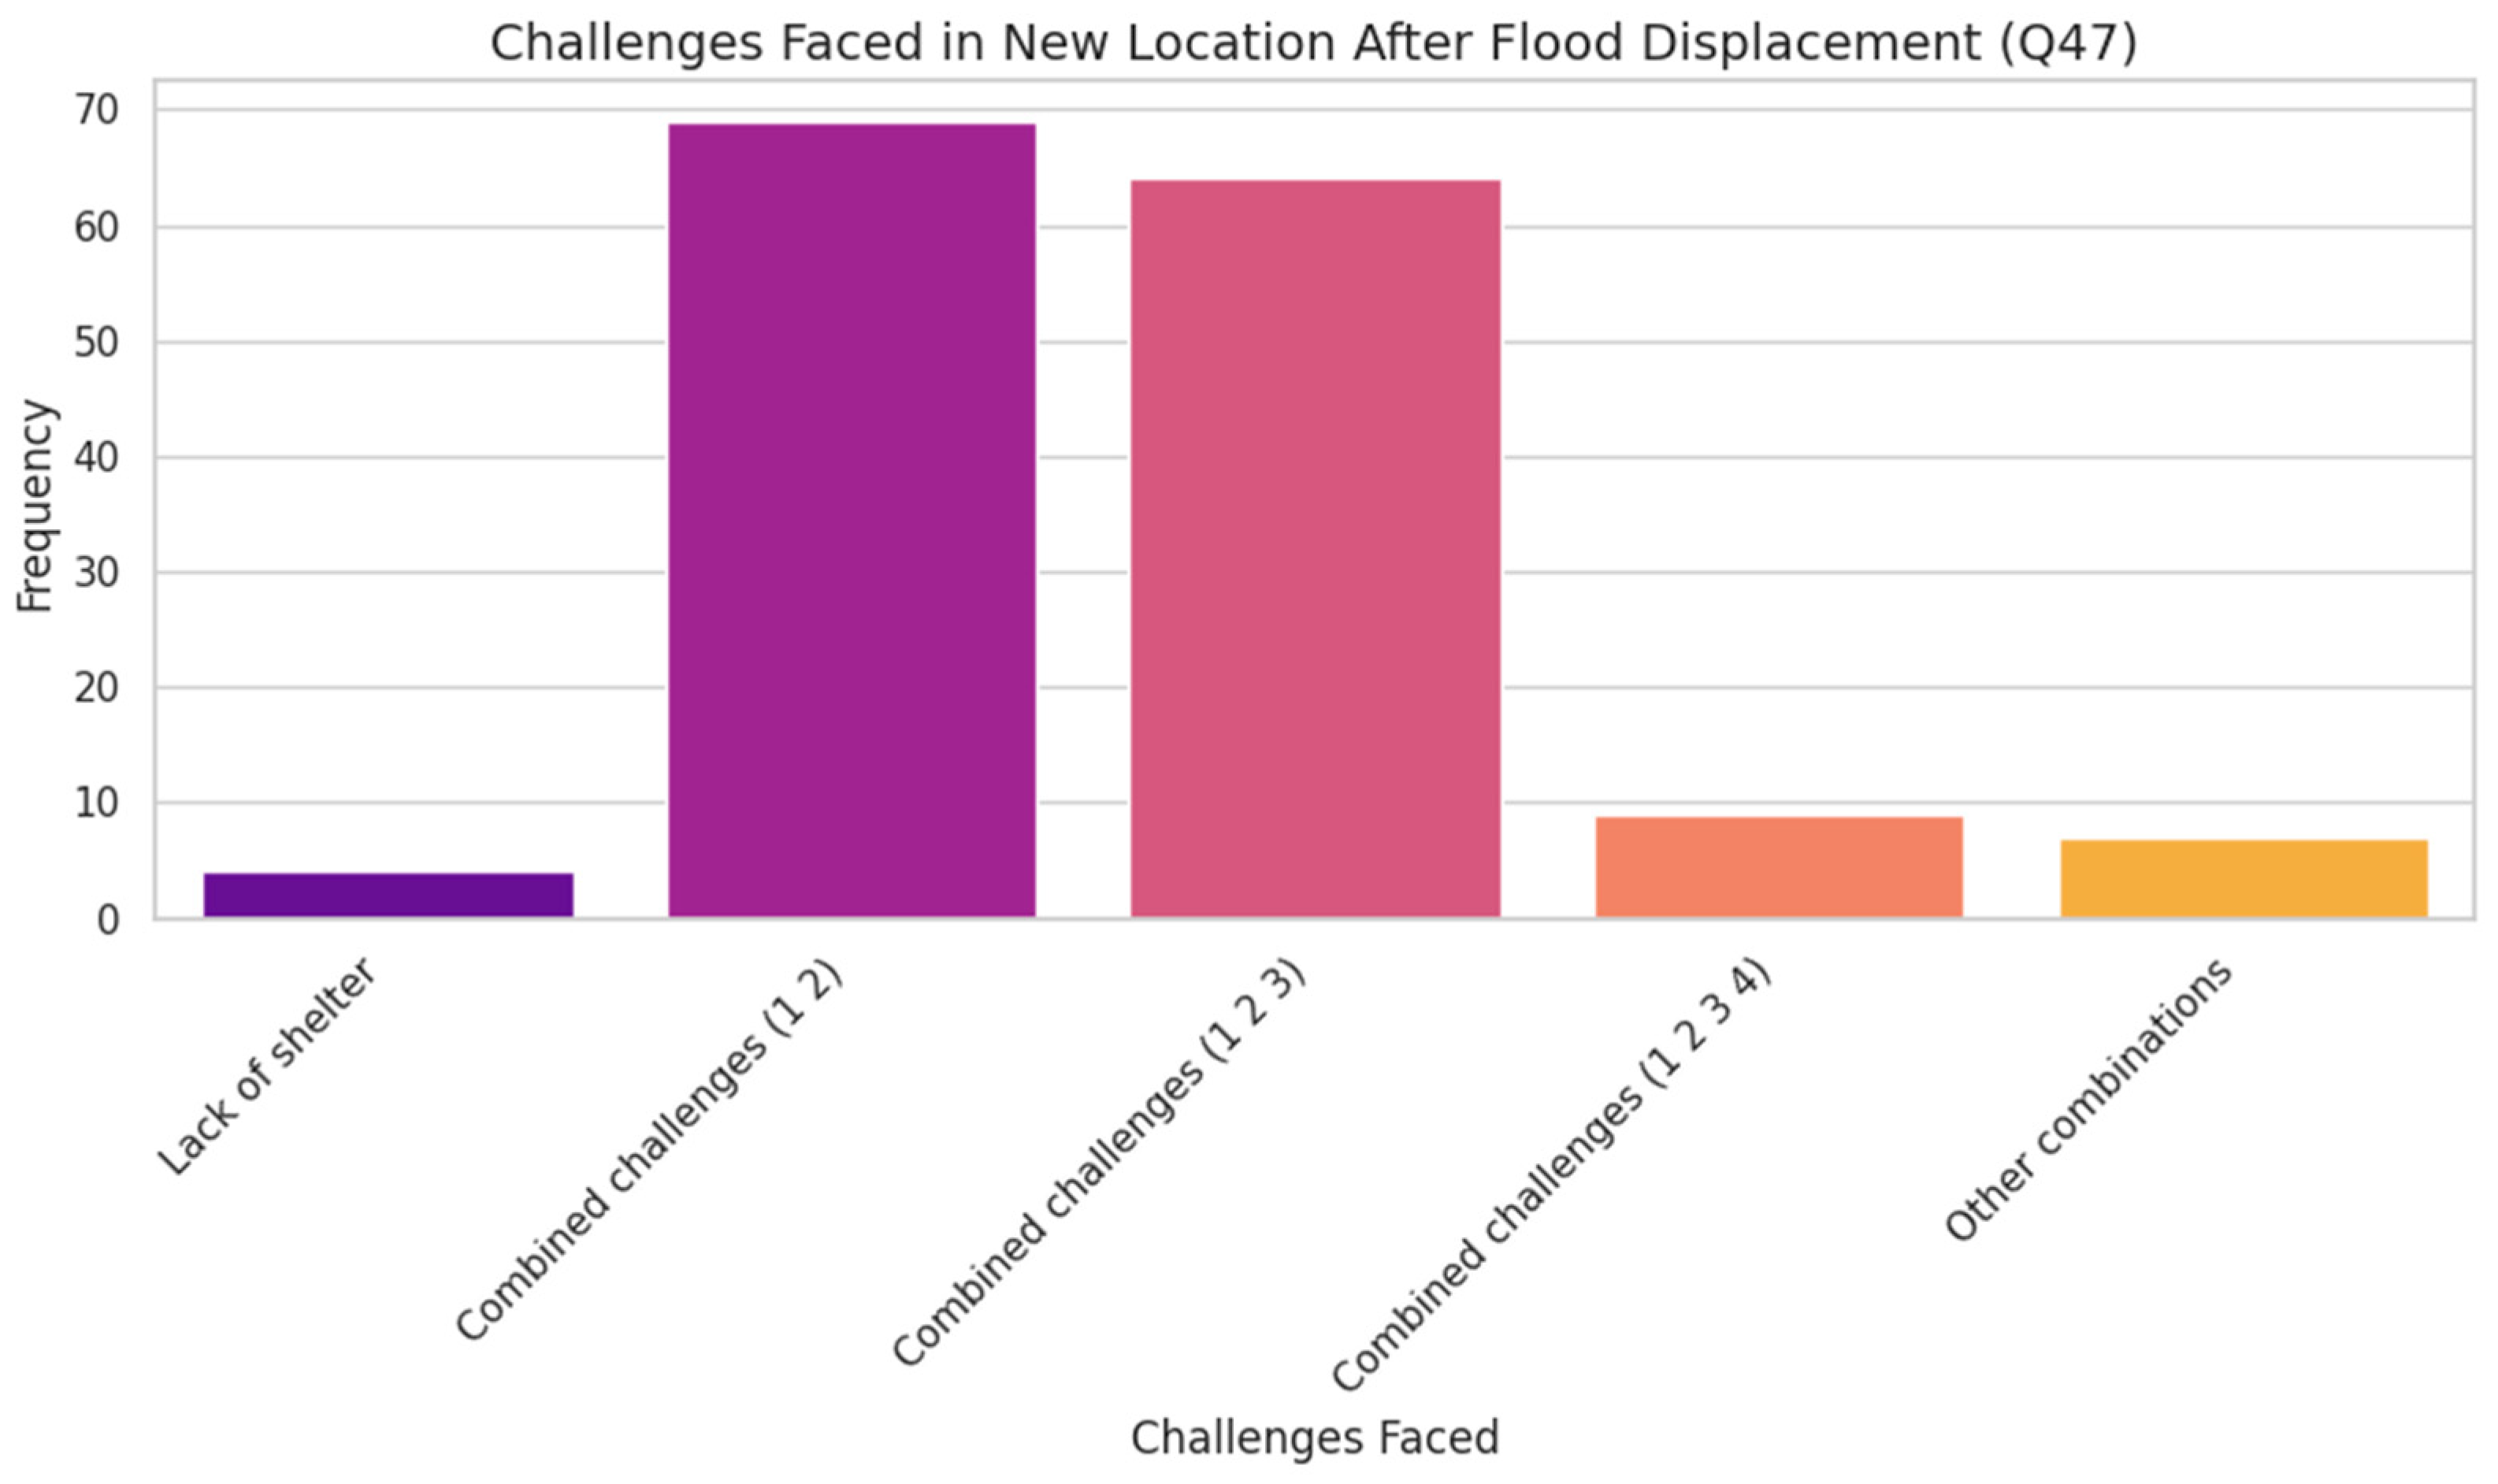
3.20. Challenges in Relocation
Figure 28.
Relocation destinations after flood displacement.
Flooding has led to widespread household displacement, with 63.5% of surveyed households (153) forced to relocate an urgent humanitarian concern. Among those displaced, the majority sought refuge in IDP camps (38.6%), followed by relatives’ homes (32.7%) and other villages (27.5%), reflecting a mix of formal and informal coping strategies. These relocation patterns underscore the reliance on both institutional support and social networks during crisis, though the adequacy of these options remains uncertain.
Once relocated, displaced households face layered challenges. While only a few reported a single issue like lack of shelter, the vast majority experienced multiple deprivations 69 households cited both shelter and food shortages, 64 faced additional water scarcity, and 9 endured all four major hardships including poor sanitation. These findings highlight the multi-dimensional nature of vulnerability in displacement settings and reinforce the need for coordinated humanitarian responses that address basic needs holistically, beyond mere relocation.
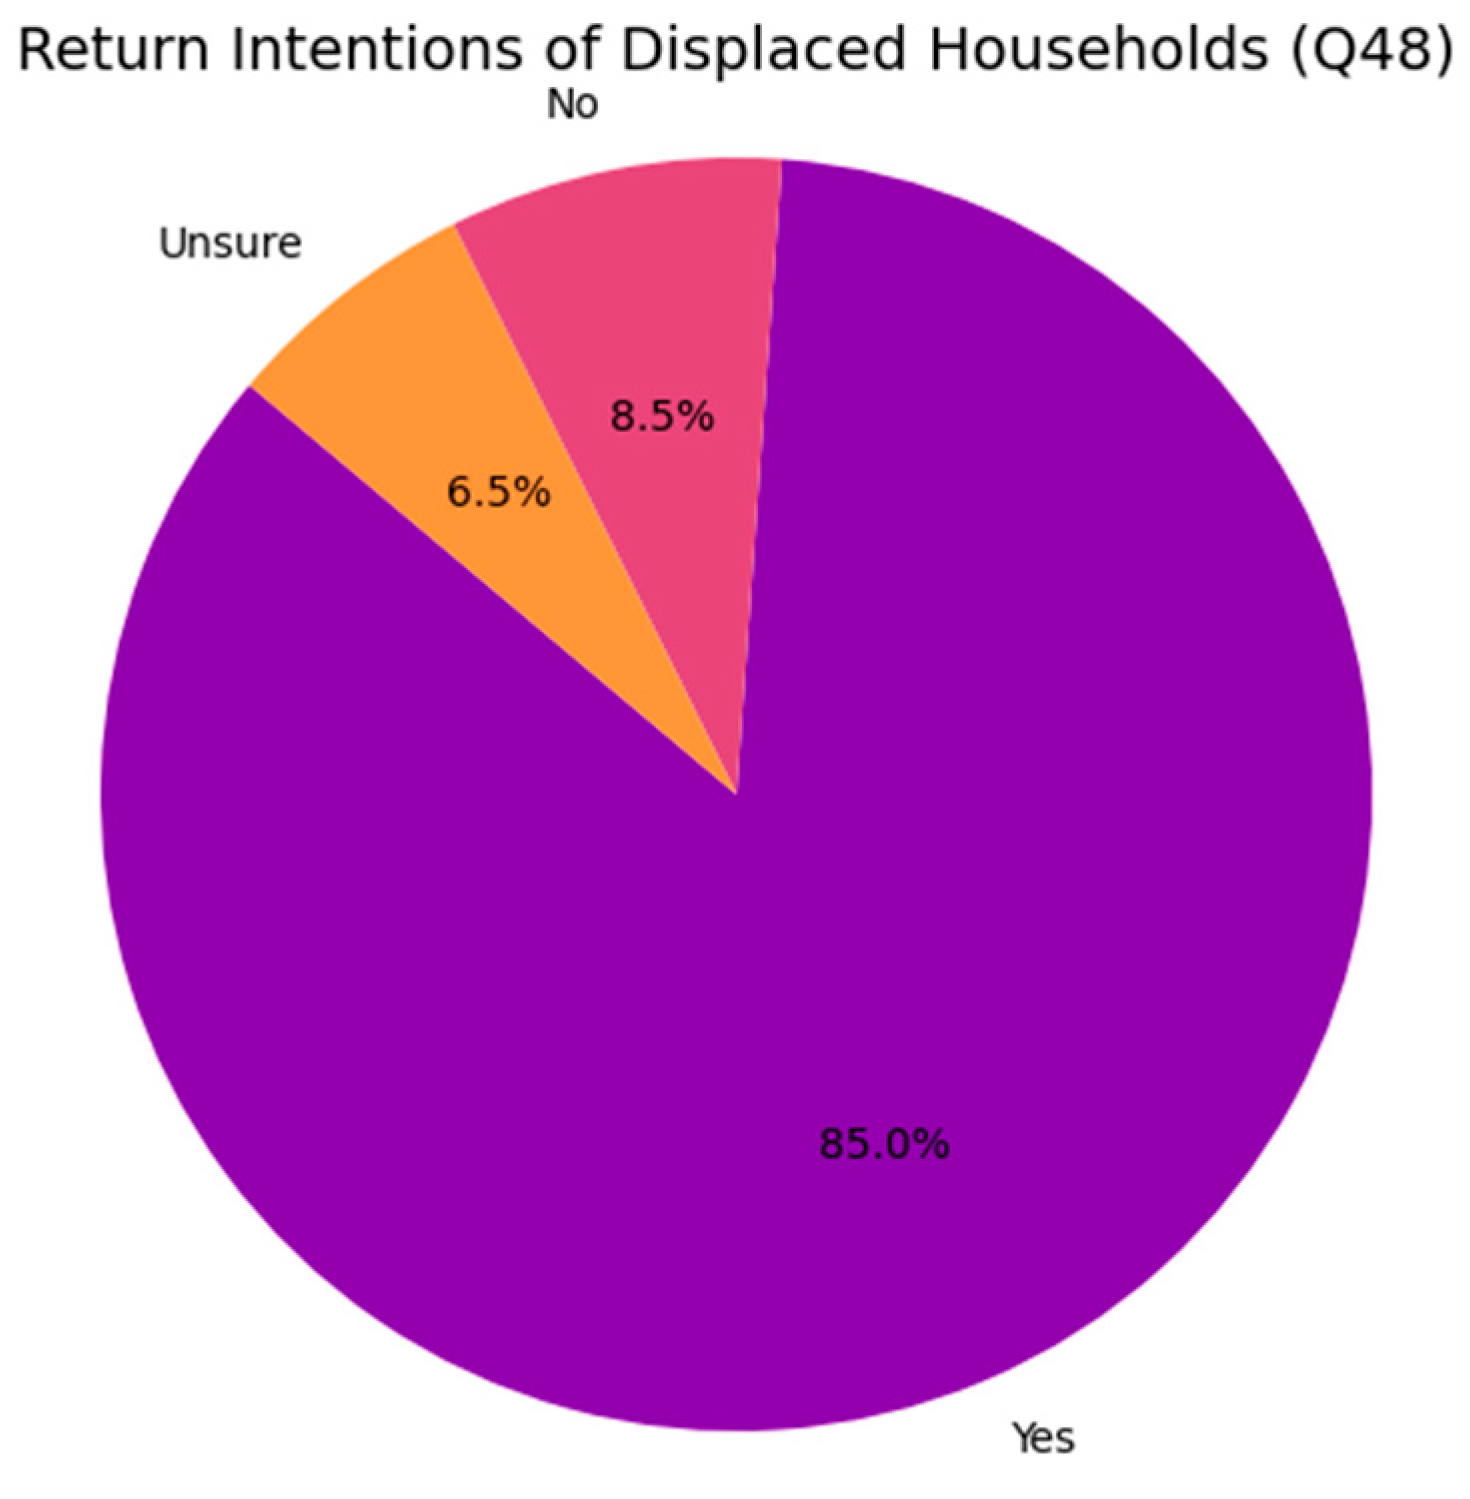
Figure 29.
Returns intentions of displaces households.
The data shows that 85.0% of displaced households intend to return to their original homes, reflecting strong emotional and cultural attachment despite potential risks or damage. Meanwhile, 8.5% do not plan to return possibly due to irreversible loss, land insecurity, or trauma and 6.5% remain undecided, signaling a need for targeted support, counseling, or relocation planning. These findings highlight both the resilience of affected communities and the importance of tailored recovery strategies that address diverse return intentions and barriers.
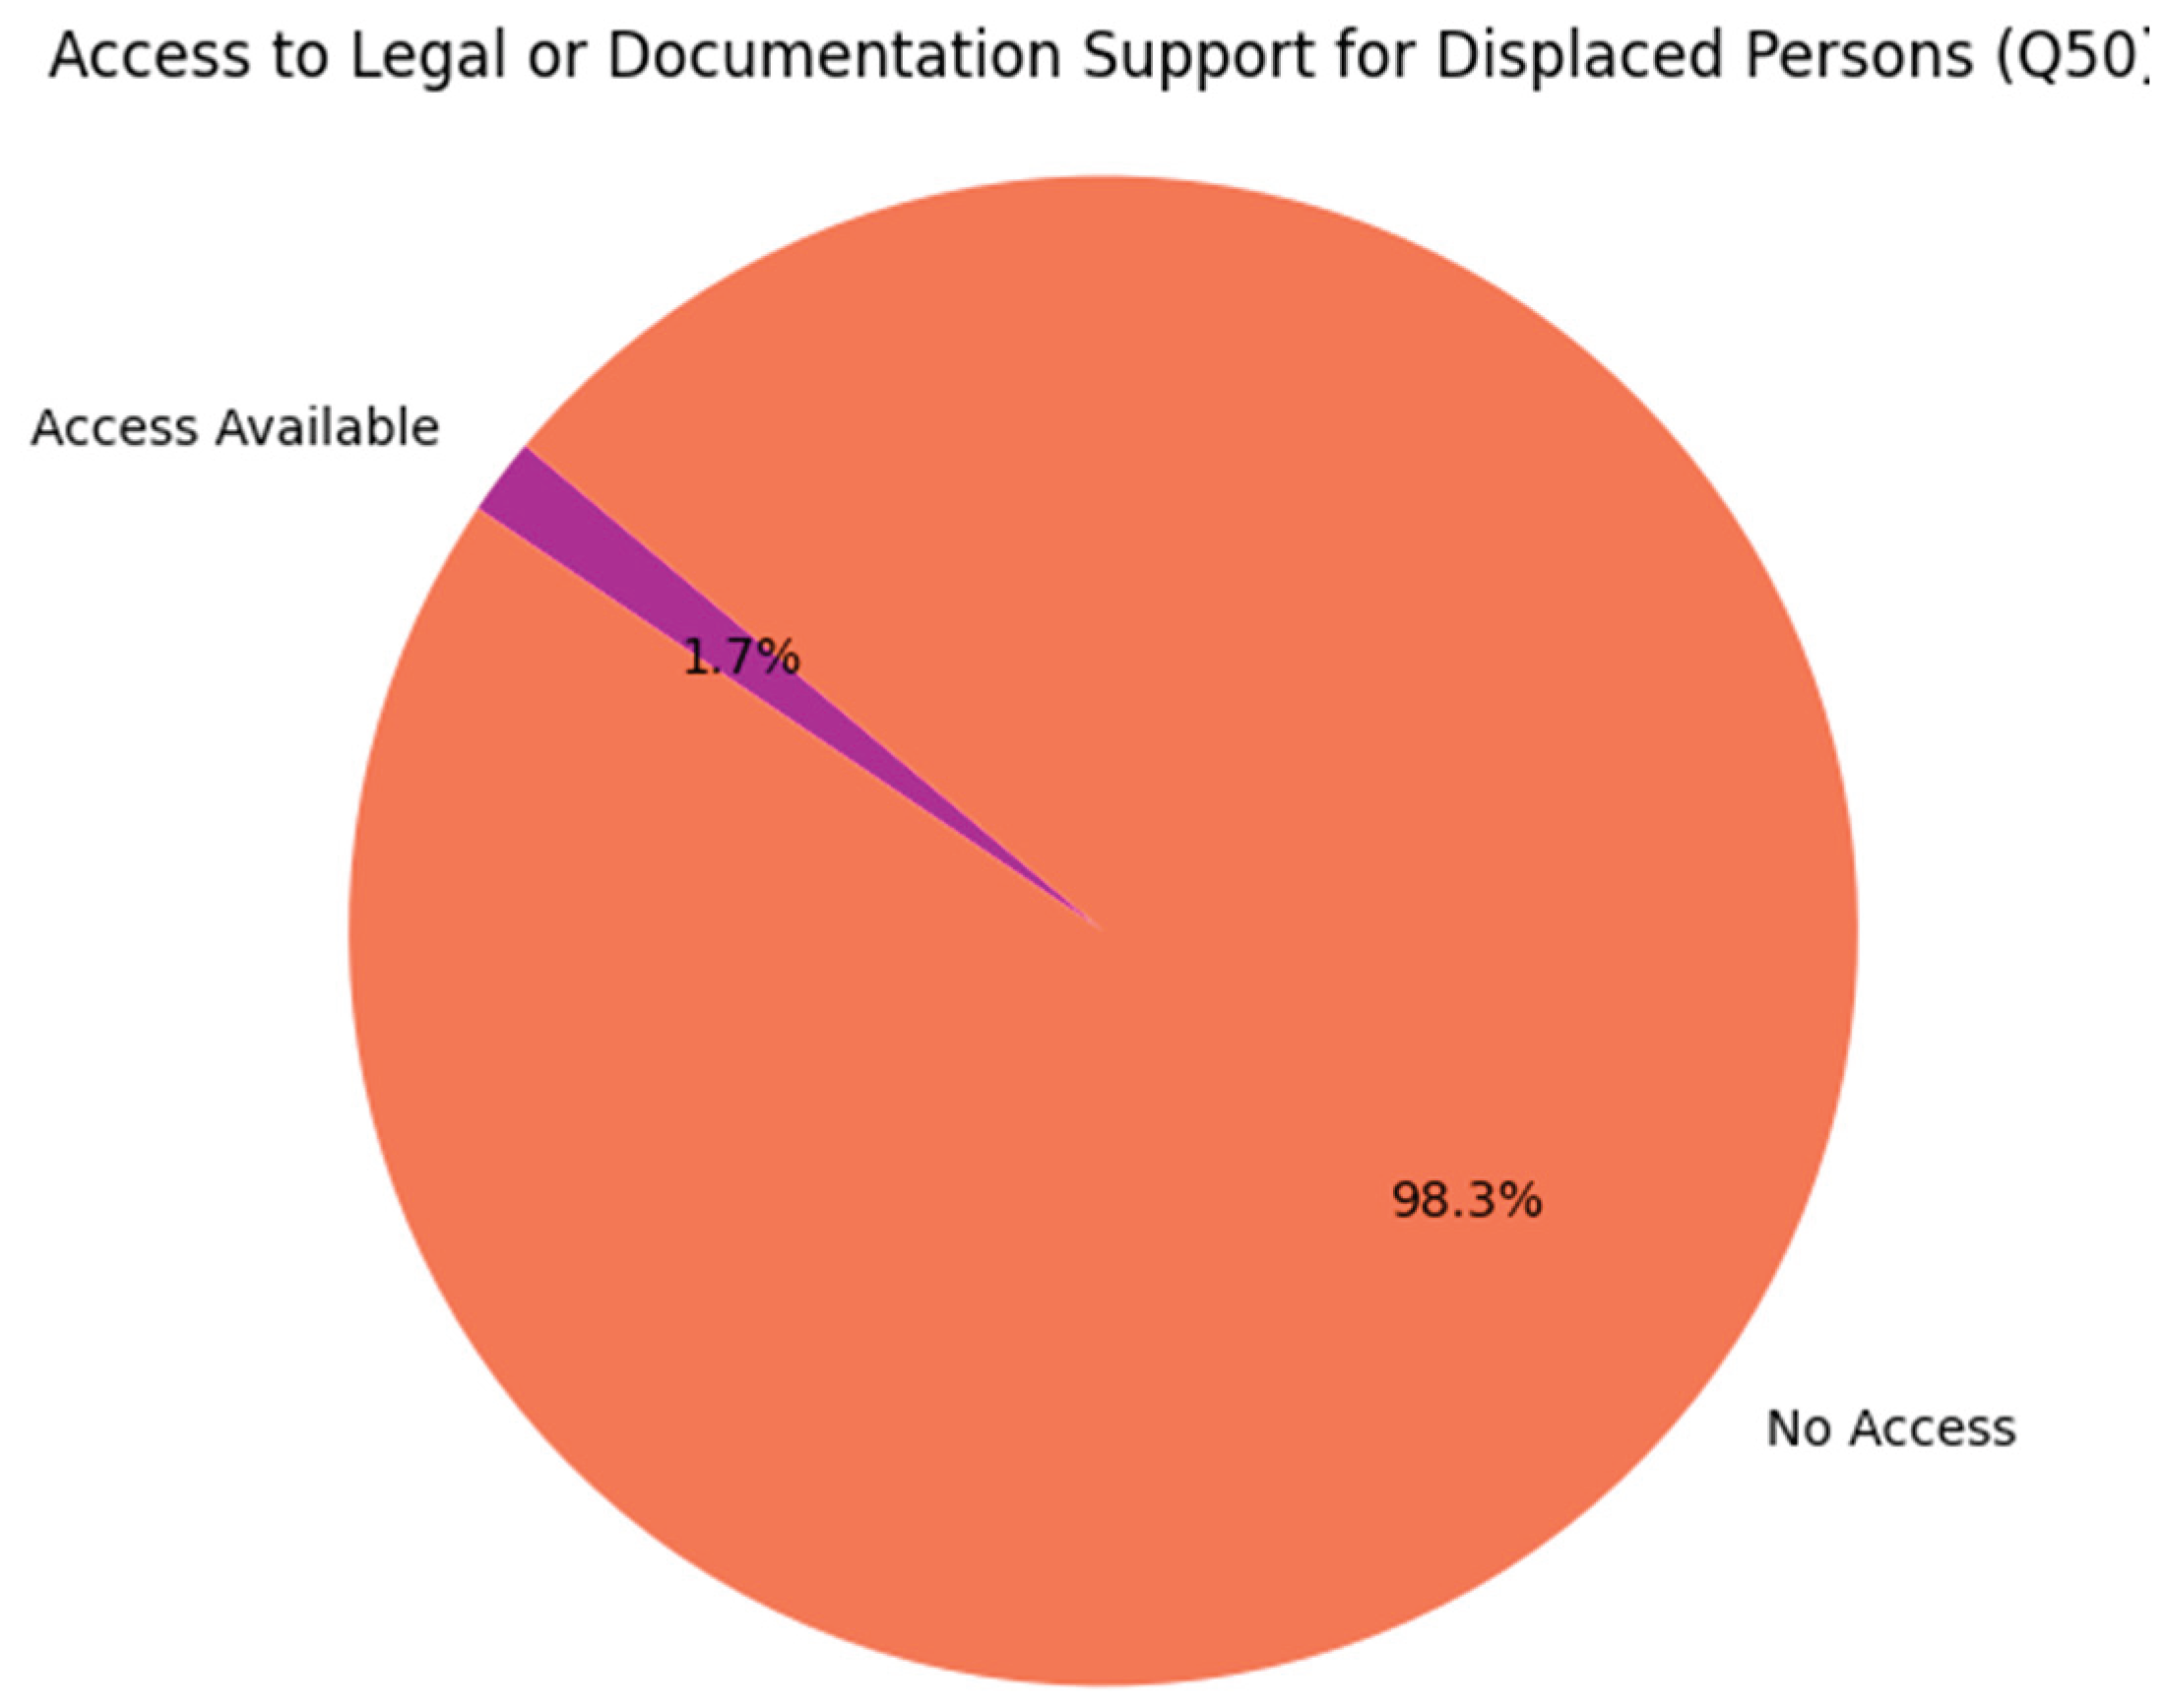
Figure 30.
Access to legal or documentation support for displaced person.
The data reveals a critical gap in post-displacement support, with 98.3% of households lacking access to legal or documentation services essential for land claims, identity verification, and aid eligibility. Only 1.7% reported having such access, underscoring the urgency of integrating legal aid into humanitarian response frameworks. To restore rights and dignity, mobile documentation clinics, paralegal outreach, and coordinated efforts with civil registries and legal NGOs are vital components of inclusive recovery planning.
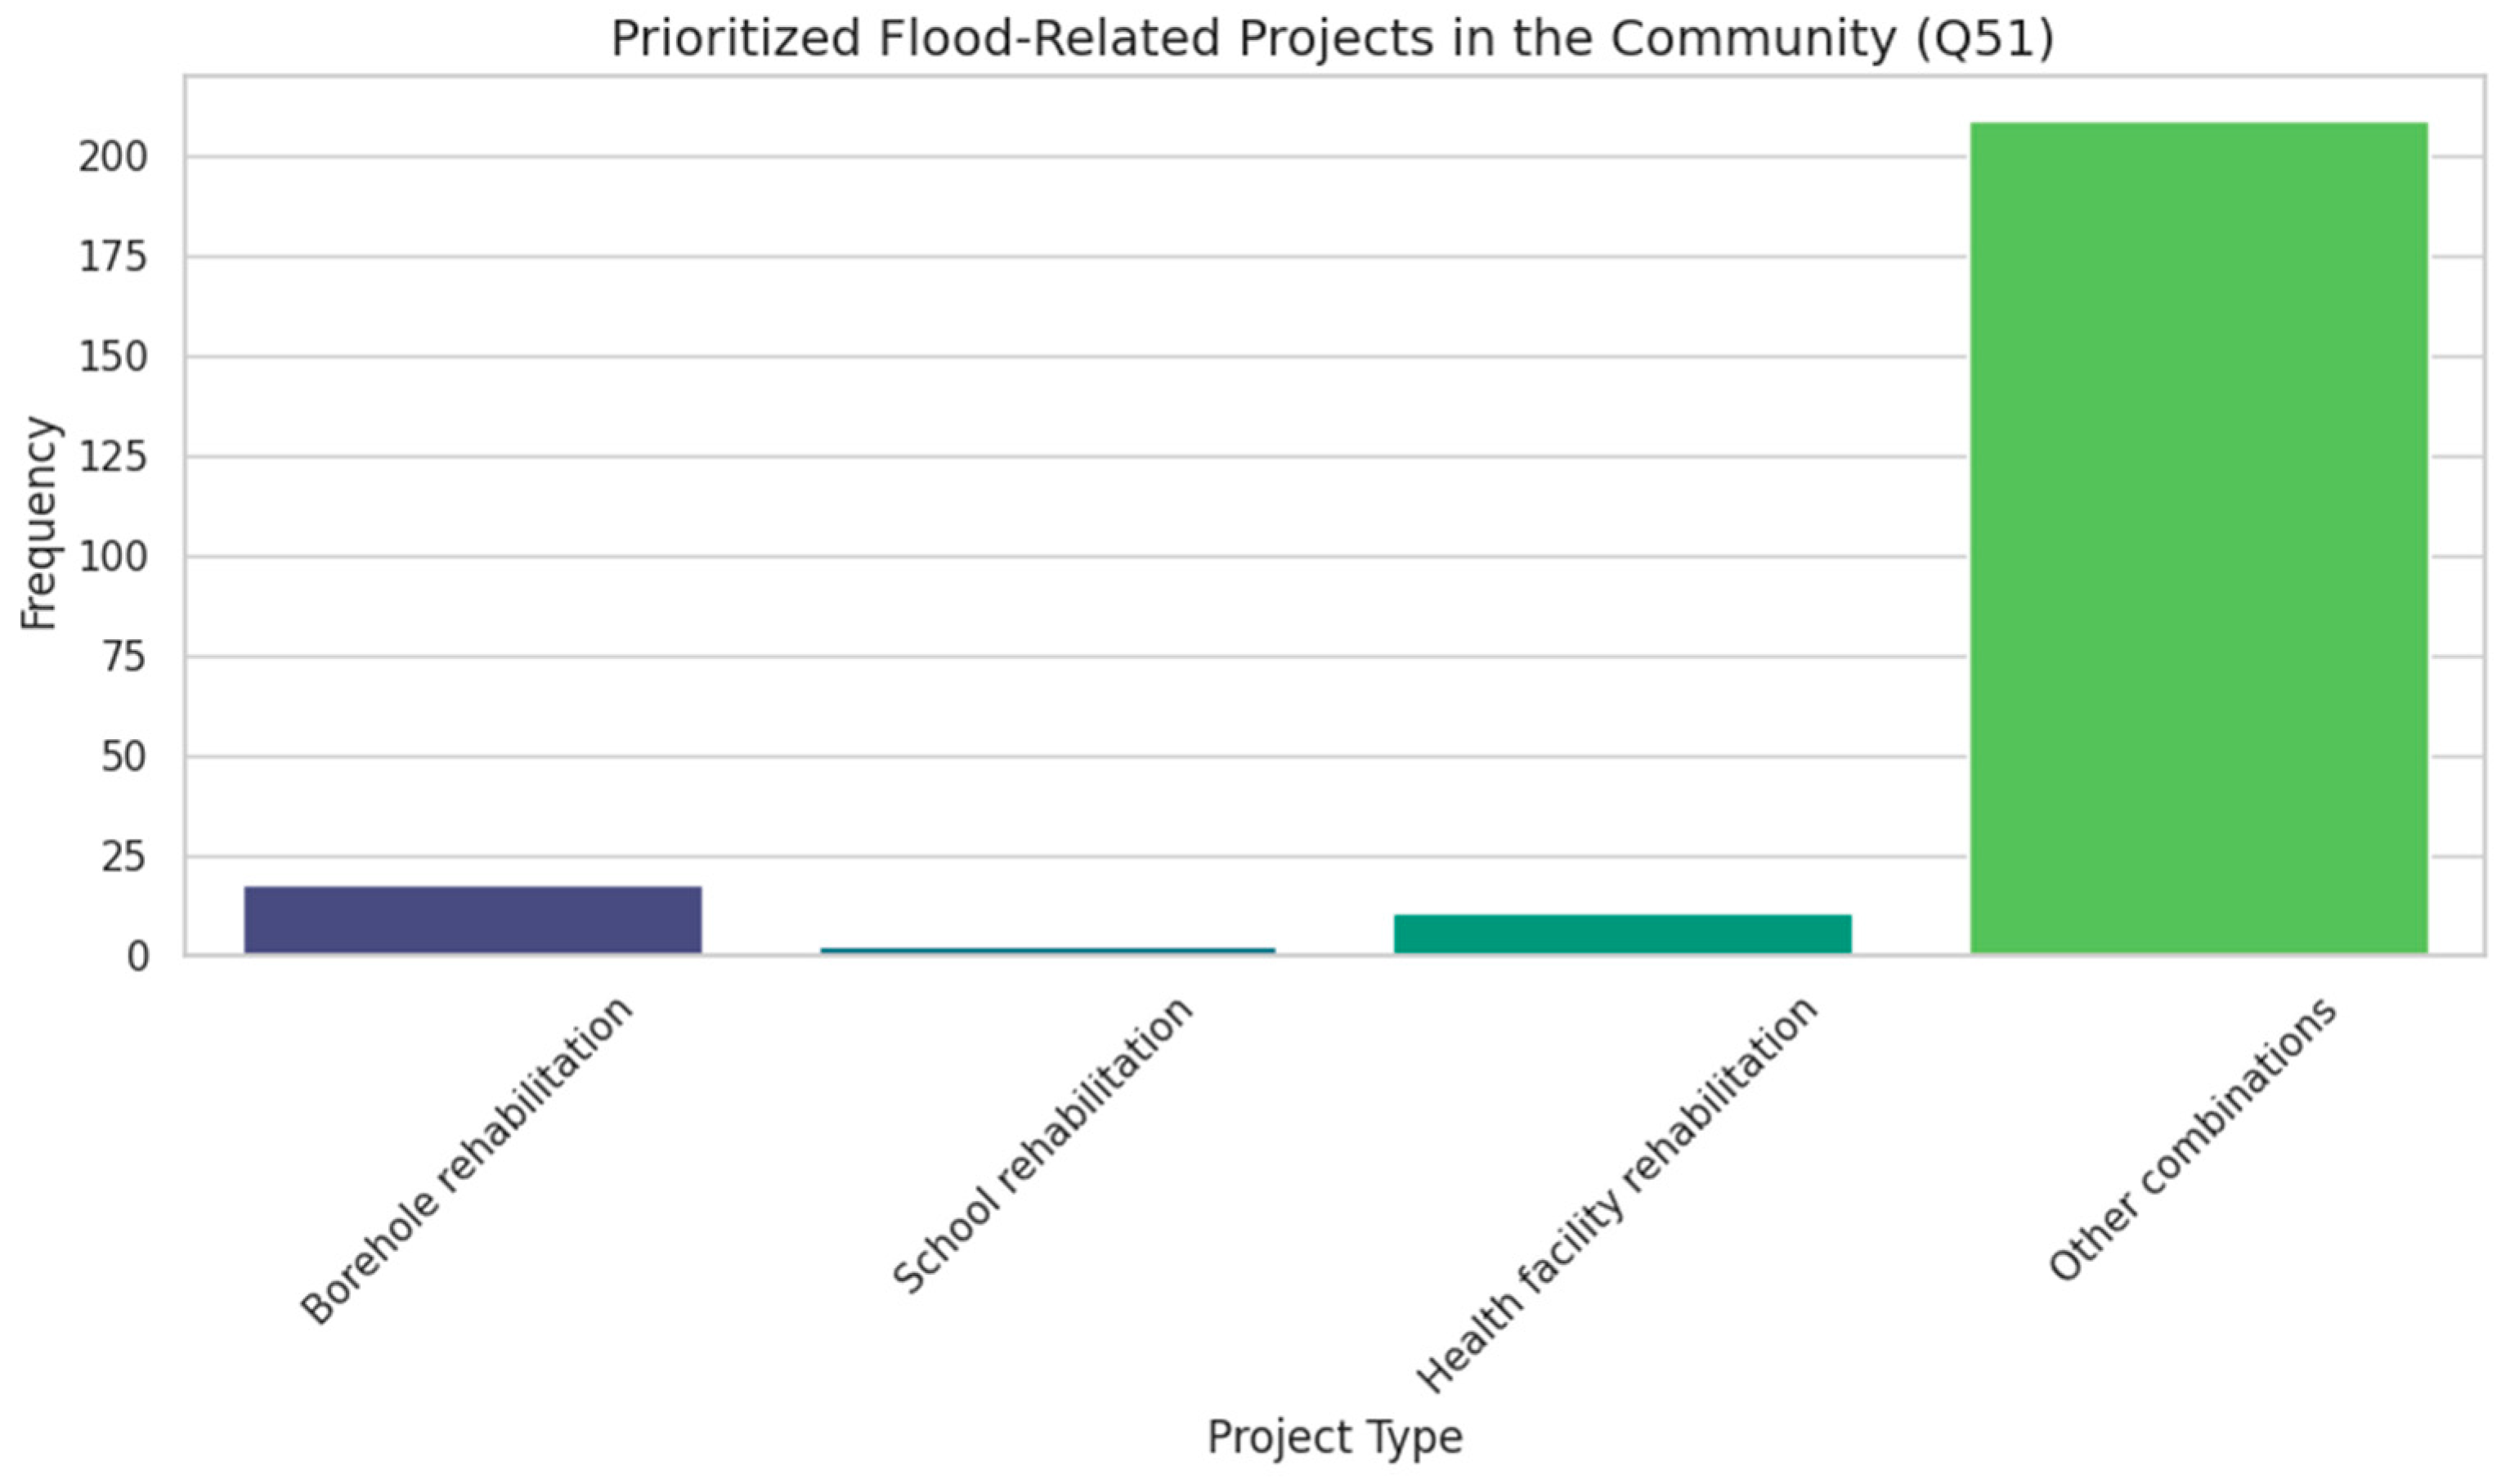
Figure 31.
Prioritized flood related projects in the community.
3.21. Prioritized Flood-Related Projects in the Community:
Chart 51 highlights a strong community preference for integrated flood resilience strategies, with 209 out of 241 respondents prioritizing multi-sectoral interventions. Among these, 36.9% specifically selected the full set of six projects spanning water, health, education, and environmental infrastructure underscoring the need for comprehensive recovery planning. Borehole rehabilitation (7.5%) and health facility restoration (4.6%) were the most frequently cited standalone priorities, reflecting urgent concerns around water access and public health in post-flood contexts.
School rehabilitation and drainage infrastructure were less commonly singled out, yet they often appeared within broader combinations, suggesting their perceived importance as part of a holistic approach. These findings reinforce the value of bundled interventions that address overlapping vulnerabilities and service gaps. For planners and donors, this data supports the design of integrated project packages that respond to community-defined needs especially those that combine WASH, health, and protective infrastructure. A breakdown of the most common coded combinations could further refine targeting and resource allocation.
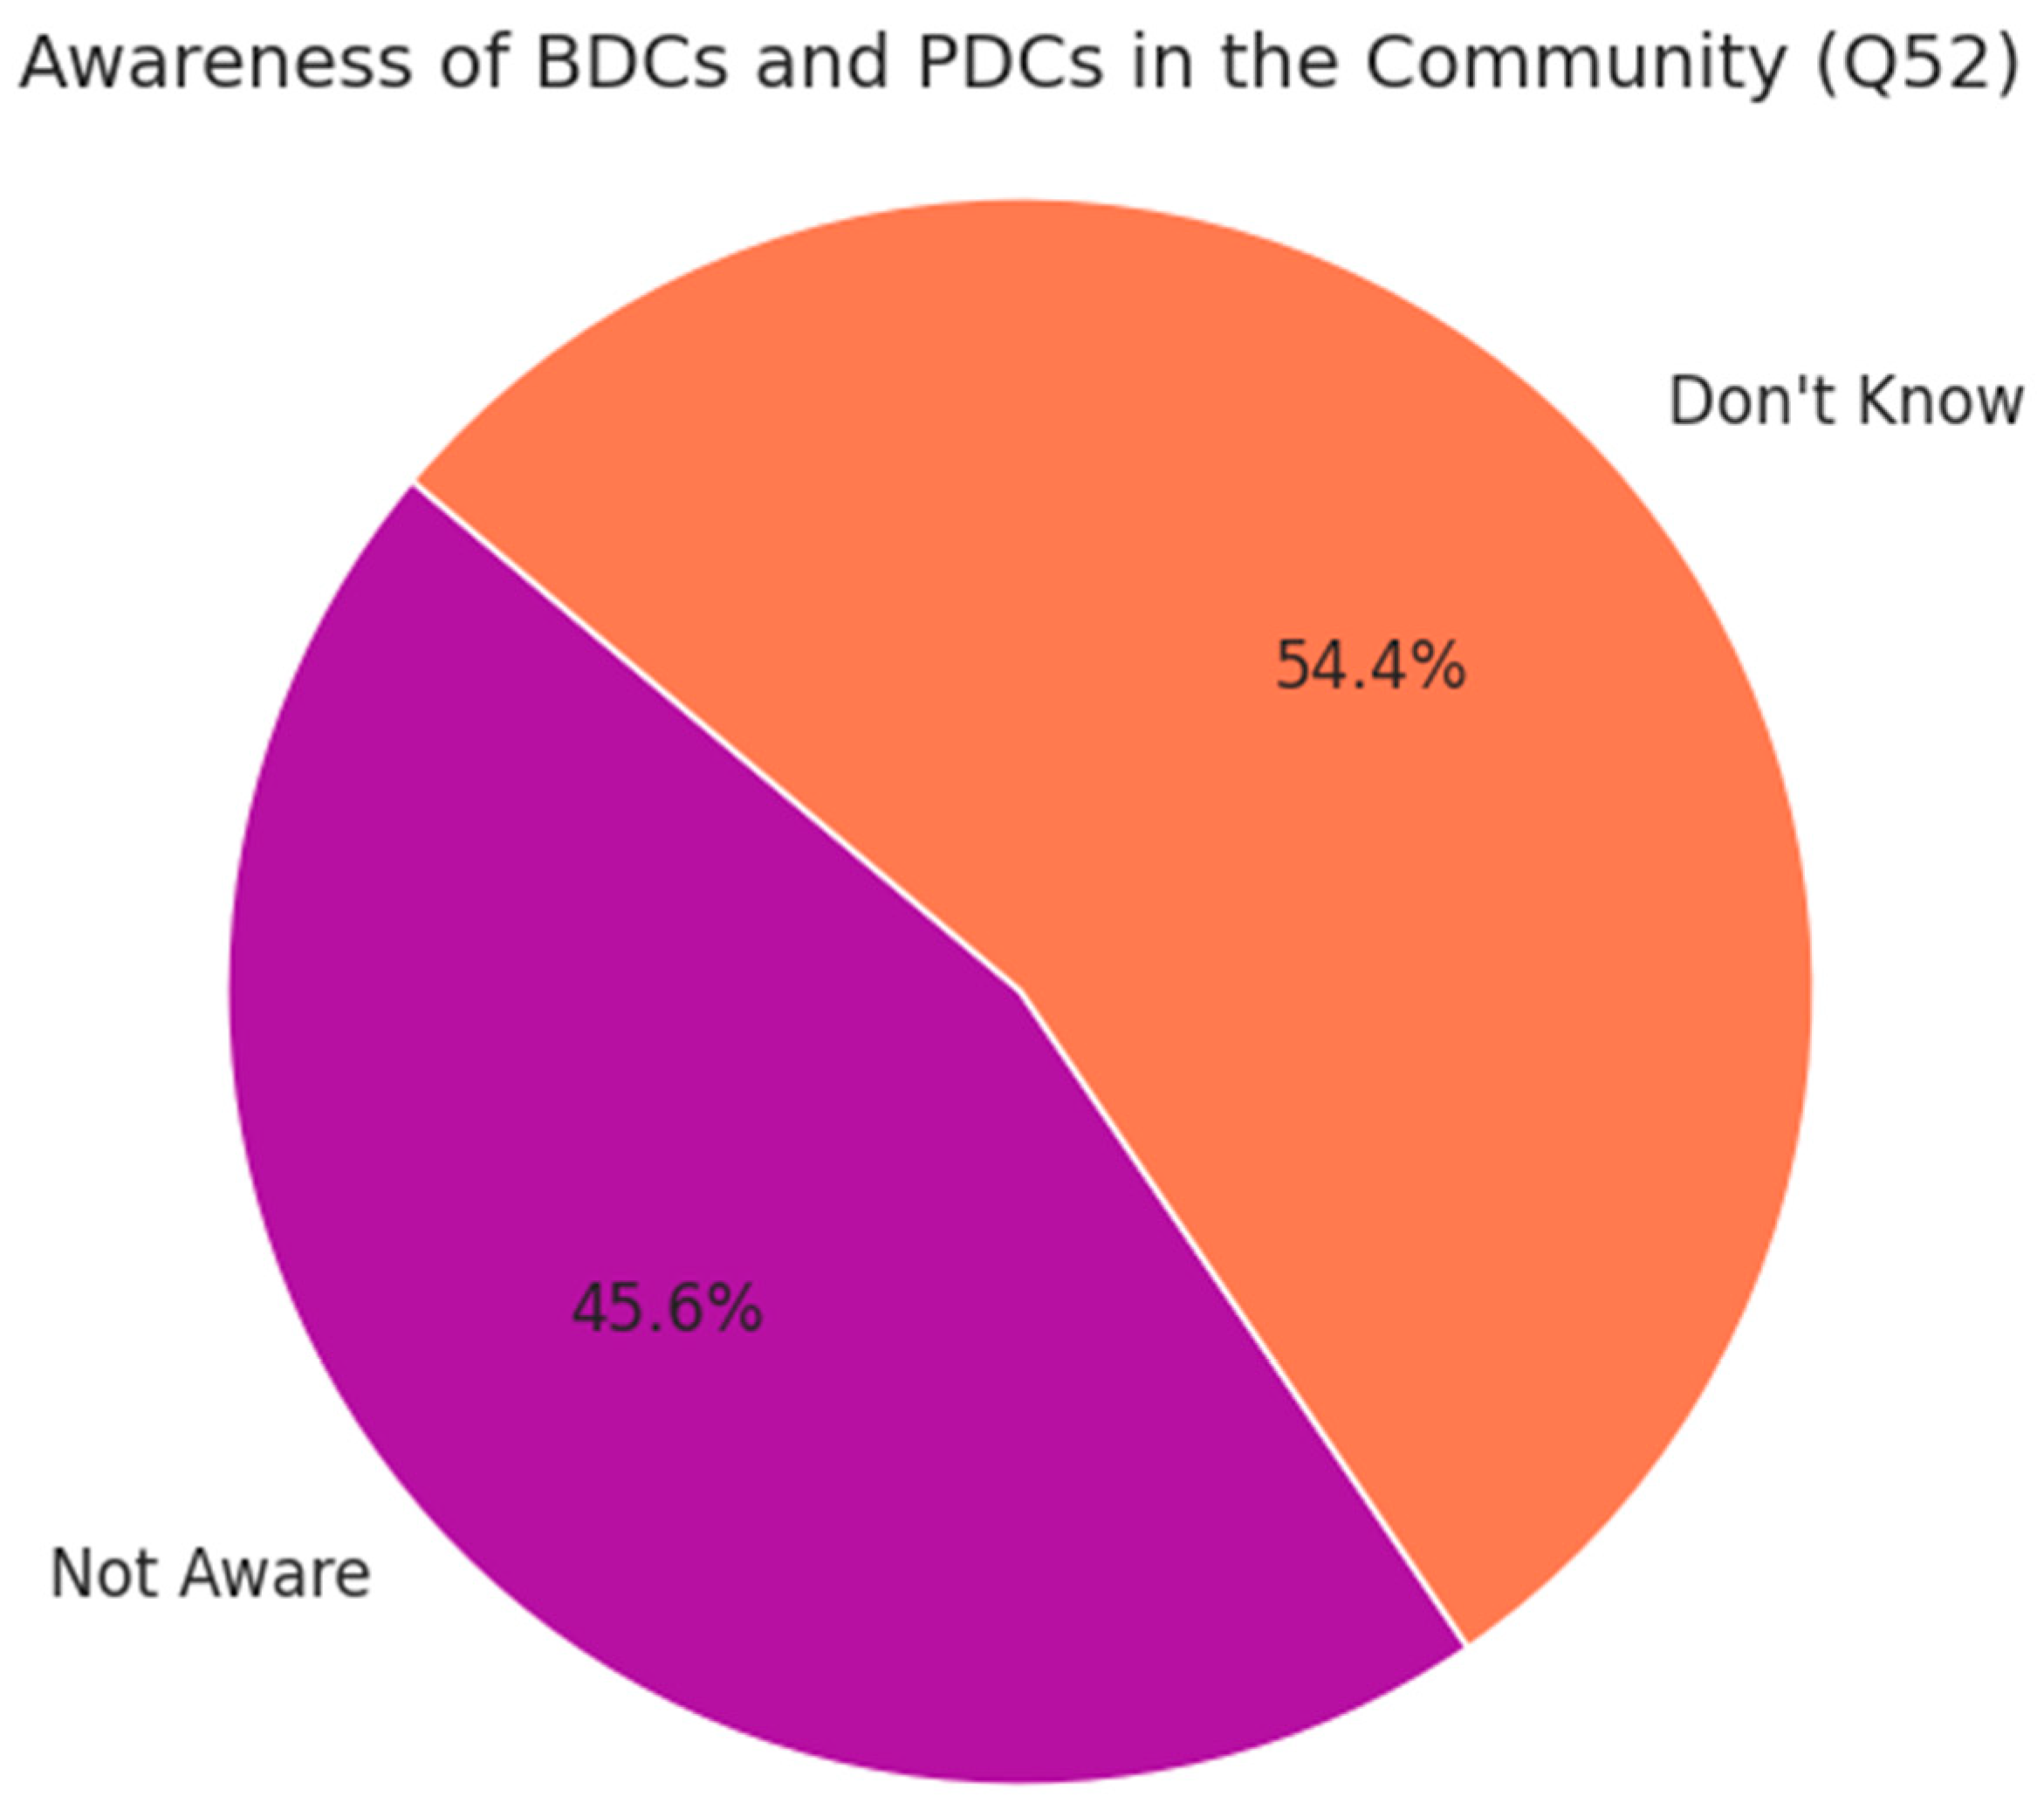
Figure 32.
Awareness of BDCs and PDCs.
The data reveals a complete absence of confirmed awareness regarding Boma Development Committees (BDCs) and Payam Development Committees (PDCs), with 54.4% of respondents stating “Don’t Know” and 45.6% “Not Aware.” This split suggests both a lack of visibility and ambiguity surrounding local governance structures. The absence of any responses to Q53 (“Are they functioning?”) further reinforces the likelihood that these committees are either inactive, unknown, or disconnected from meaningful community engagement highlighting a critical gap in participatory development and local accountability mechanisms.
4. Discussion
The household-level data from Aweil East and Aweil South counties highlighting high rates of female-headed households, limited access to safe spaces and essential services, and widespread livelihood fragility offers critical insights for aligning local response strategies with global resilience and development frameworks.
Sendai Framework for Disaster Risk Reduction (2015–2030) The Sendai Framework emphasizes inclusive risk governance and the empowerment of vulnerable groups, particularly women and persons with disabilities. The findings from Aweil, where over 75% of households are female-headed and nearly 96% lack access to health, psychosocial, or legal support, underscore the urgency of strengthening community-based protection systems and integrating gender-responsive planning into disaster preparedness and recovery. The observed changes in household dependency due to displacement and flooding also align with Sendai’s call to “strengthen disaster risk governance to manage disaster risk.”
Sustainable Development Goals (SDGs)
Several SDGs are directly implicated:
- SDG 3 (Good Health and Well-being): The near-total absence of support services highlights gaps in health system coverage and psychosocial care.(Sdg 2019)
- SDG 5 (Gender Equality): The disproportionate burden on female and widow-headed households calls for targeted social protection and empowerment programs.(Sdg 2019)
- SDG 6 (Clean Water and Sanitation) and SDG 11 (Sustainable Cities and Communities): These are relevant for flood resilience, WASH infrastructure, and inclusive urban planning.(Sdg 2019)
- SDG 10 (Reduced Inequalities) and SDG 16 (Peace, Justice, and Strong Institutions): The lack of grievance redress mechanisms and participatory platforms reflects systemic exclusion and governance challenges.(Sdg 2019)
National Frameworks and Humanitarian Strategy At the national level, South Sudan’s National Development Strategy (NDS) and Humanitarian Response Plan emphasize resilience, gender inclusion, and community engagement. The data from Aweil counties can inform localized implementation of these strategies particularly in designing inclusive service delivery models, strengthening ward-level feedback loops, and deploying mobile-based reporting tools (e.g., ODK) (Hartung, Lerer et al. 2010)to reach underserved populations(Agarwal, Kant et al. 2019, Goldhagen, Elkrail et al. 2024, Ngugi 2024)
5. Conclusion and Recommendation
The flood impact survey conducted in Aweil South and Aweil East Counties reveals widespread displacement, infrastructure damage, and governance gaps, with 63.5% of households displaced and 69.7% reporting public infrastructure damage. Female-headed households (77.2%) dominate the respondent pool, highlighting gendered vulnerabilities, especially as 75.1% report increased dependents due to flooding. Legal and documentation support is nearly absent (only 1.7% access), and awareness of local governance structures like BDCs and PDCs is virtually nonexistent. Communities prioritize multi-sectoral flood recovery, with borehole rehabilitation, health facility restoration, and school reconstruction emerging as top needs. These findings align with multiple SDGs particularly those addressing poverty, gender equality, health, education, and climate resilience and reinforce the urgency of integrated, community-led recovery planning(Sdg 2019, Khisa, Kipkemoi et al. 2025)
Strategically, the data supports national frameworks such as South Sudan’s Flood Preparedness Plan, UNDP’s Climate Resilience Programme(Haile and Juba 2016) and the UNHCR-Japan Flood Resilience Project. It also aligns with the World Bank’s Regional Climate Resilience Program (P180171)(Chabwera 2024) offering actionable insights for stakeholder engagement, hazard mapping, infrastructure rehabilitation, and governance reform. Key recommendations include embedding local data into national systems like WIMS(Mosello, Mason et al. 2016), funding climate-resilient infrastructure, expanding legal aid and civic education, and establishing feedback loops between communities and institutions. This evidence base positions the survey as a vital tool for shaping inclusive, data-driven interventions in South Sudan’s flood-prone regions(Koji 2023, Chabwera 2024, Ngugi 2024)
References
- Agarwal, S., R. Kant and R. Shankar (2019). "Humanitarian supply chain management frameworks: A critical literature review and framework for future development." Benchmarking: An International Journal 26(6): 1749-1780.
- Ajo, D. J. L. (2019). "The Role of Community Based Organizations in the Development of Rural Communities.".
- Boateng, W. (2012). "Evaluating the efficacy of focus group discussion (FGD) in qualitative social research." International Journal of Business and Social Science 3(7).
- Chabwera, T. (2024). "Regional Climate Resilience Program Procurement Plan for Eastern and Southern Africa.".
- Goldhagen, J., S. E. Elkrail and A. Affan (2024). "Responding to the humanitarian crisis in Sudan." BMJ Paediatrics Open 8(1): e002893. [CrossRef]
- Haile, G. and S. S. Juba (2016). "United Nations Development Programme (UNDP) South Sudan.".
- Hartung, C., A. Lerer, Y. Anokwa, C. Tseng, W. Brunette and G. Borriello (2010). Open data kit: tools to build information services for developing regions. Proceedings of the 4th ACM/IEEE international conference on information and communication technologies and development.
- Khisa, G. V., I. Kipkemoi and P. K. Gakai (2025). Social implications of domestication of animals in Africa. Reference Module in Food Science, Elsevier.
- Koji, S. (2023). "Africa and Japan: The World Seen through Assignment in and Evacuation from Sudan." Asia-Pacific Review 30(3): 30-47. [CrossRef]
- Leech, N. L., A. B. Dellinger, K. B. Brannagan and H. Tanaka (2010). "Evaluating mixed research studies: A mixed methods approach." Journal of mixed methods research 4(1): 17-31. [CrossRef]
- Mosello, B., N. Mason and R. Aludra (2016). "The case of South Sudan.".
- Mpiere, D., K. Tehami, I. Coulibaly and C. Mbaiogaou (2025). "Assessing the Integration of the Sendai Framework, Sustainable Development Goals, and the Paris Agreement in Advancing Disaster Risk Reduction and Sustainable Development: Insights from an African Perspective." Journal of Geoscience and Environment Protection 13(7): 350-368. [CrossRef]
- Ngugi, S. (2024). "South Sudan (2021–2022)." Yearbook of International Disaster Law Online 5(1): 482-492.
- Sdg, U. (2019). "Sustainable development goals." The energy progress report. Tracking SDG 7(3): 2-6.
- Zaidi, R. Z. and M. Fordham (2021). "The missing half of the Sendai framework: Gender and women in the implementation of global disaster risk reduction policy." Progress in Disaster Science 10: 100170. [CrossRef]
Disclaimer/Publisher’s Note: The statements, opinions and data contained in all publications are solely those of the individual author(s) and contributor(s) and not of MDPI and/or the editor(s). MDPI and/or the editor(s) disclaim responsibility for any injury to people or property resulting from any ideas, methods, instructions or products referred to in the content. |
© 2025 by the authors. Licensee MDPI, Basel, Switzerland. This article is an open access article distributed under the terms and conditions of the Creative Commons Attribution (CC BY) license (http://creativecommons.org/licenses/by/4.0/).
Copyright: This open access article is published under a Creative Commons CC BY 4.0 license, which permit the free download, distribution, and reuse, provided that the author and preprint are cited in any reuse.


