Submitted:
25 August 2025
Posted:
27 August 2025
You are already at the latest version
Abstract
Oxidative stress destabilizes microRNA homeostasis in retinal pigment epithelium (RPE), driving apoptosis and epithelial-to-mesenchymal transition that contribute to age-related macular degeneration. We investigated whether quantum molecular resonance (QMR®) electrostimulation, alone or combined with Patient Blood-Derived (PBD) secretoma, can reprogram the RPE miRNome and mitigate stress-induced damage. Human ARPE-19 cells were exposed to tert-butyl-hydroperoxide and treated with QMR®, PBD secretome, or their combination. Deep-sequencing of small RNAs at 24 h and 72 h, followed by differential expression and pathway enrichment analyses, delineated treatment-driven miRNA signatures. Oxidative stress deregulated >50 miRNAs, enriching pro-apoptotic, fibrotic, and inflammatory pathways. QMR® restored roughly 40 % of these miRNAs and up-regulated additional cytoprotective species such as miR-590-3p, collectively dampening NF-κB and NLRP3 axes. Secretome treatment preferentially increased anti-inflammatory miR-146a-5p and regenerative miR-204-5p while suppressing pro-fibrotic let-7f-5p. Combined QMR® + secretome triggered the broadest response, normalizing over two-thirds of stress-altered miRNAs and synergistically reinforcing antioxidant, anti-apoptotic, and anti-fibrotic gene networks. These data indicate that QMR® and PBD secretome act through complementary miRNA programs that converge to preserve RPE viability under oxidative insult; their combination offers additive modulation of key survival pathways, supporting development of a non-invasive, cell-free therapeutic strategy for retinal degenerative disorders.
Keywords:
Quantum Molecular Resonance
; microRNA
; oxidative stress
; retinal pigment epithelium
; mesenchymal stromal cell secretome
; apoptosis
; fibrosis
; age-related macular degeneration
1. Introduction
Age related macular degeneration (AMD) and related inherited retinal dystrophies are driven by chronic degeneration of the retinal pigment epithelium (RPE), a monolayer that sustains photoreceptor metabolism, phagocytosis and ion homeostasis[1,2]. Even moderate oxidative insults overwhelm RPE antioxidant capacity, triggering epithelial to mesenchymal transition (EMT), sterile inflammation and apoptosis that ultimately jeopardize visual function [3,4,5,6,7,8,9] . In vitro, exposure of human ARPE 19 cells to tert-butyl-hydroperoxide (tBHP) is widely adopted to emulate this oxidative milieu: tBHP rapidly depletes glutathione, activates p38/MAPK and NF-κB signaling and provokes cell death within hours [10,11,12], faithfully reproducing transcriptomic and functional hallmarks observed in AMD donor tissue.
MicroRNAs (miRNAs) act as master post transcriptional regulators of stress adaptation by pairing with complementary sequences in target mRNAs, thereby tuning translation and stability. Several miRNAs—such as miR 141, miR 146a and the miR 200 family—have been implicated in redox balance, mitochondrial quality control and VEGF secretion in RPE cells [13,14]. Dysregulation of a handful of miRNAs (e.g. miR 34a, miR 210) is sufficient to exaggerate oxidative damage or promote EMT, underscoring their therapeutic potential. Yet, beyond a few well studied loci, the broader miRNA landscape that orchestrates RPE survival under oxidative challenge—and, crucially, how it can be remodeled by emerging therapies—remains poorly defined [15,16].
Quantum Molecular Resonance (QMR®) is an non-ionizing, low potency technology that uses high-frequency waves in the range of 4–64 MHz. Initially developed for very low temperature surgical dissection, QMR® has recently been repurposed for regenerative applications, improving tear film stability and ocular surface inflammation in prospective clinical studies [17,18]. At the cellular level, oscillatory electric fields can modulate membrane potential, calcium micro domains and cytoskeletal dynamics, but virtually nothing is known about the intracellular signaling events engaged by QMR® in neural or epithelial ocular tissues. To date no study has examined whether QMR® can reprogram miRNA networks in RPE cells exposed to oxidative stress, representing a significant knowledge gap.
Complementary to physical stimulation, trophic support can be provided by the secretoma extracted from platelet rich plasma of AMD patients. Secretomes are enriched in antioxidant enzymes, pro survival cytokines and exosome embedded miRNAs that collectively mitigate ROS accumulation, dampen inflammation and promote angiogenic regeneration in degenerating retina [19]. We hypothesized that coupling QMR® with a PDB secretome would deliver synergistic, multi-level protection: QMR® supplying an endogenous electrophysiological trigger while paracrine factors sustain cytoprotection and tissue remodeling.
Here, we interrogate the combined and individual effects of QMR® stimulation and PDB secretome on oxidatively stressed ARPE 19 cultures. Using deep small RNA sequencing across early (24 h) and late (72 h) phases after tBHP insult, we:
Define the time resolved miRNA signature induced by QMR®, secretome and their combination.
Integrate differential expression profiles with validated and in silico–predicted miRNA targetomes to reconstruct regulatory networks.
Identify signaling pathways and biological processes most susceptible to QMR® mediated modulation, thereby elucidating mechanistic bases of the observed cytoprotection.
This work provides the first comprehensive view of how a non-thermal radio frequency therapy reshapes post transcriptional regulation in oxidatively challenged RPE, laying the molecular groundwork for its rational deployment—and biomarker monitoring—in ophthalmic therapeutics.
2. Results
2.1. MTT Cell-Viability Assay Reveals QMR®-Mediated Cytoprotection Under Oxidative Stress
Exposure to tBHP for 24–72 h markedly reduced ARPE-19 cell viability, as reflected by the drop in MTT absorbance in the oxidative stress control (CTRL-OX) compared to untreated cells. At 24 h, the mean OD_570 for CTRL cells was 2696 (arbitrary units), whereas CTRL-OX cells dropped to 1376, roughly 50% of control, confirming the cytotoxic impact of oxidative stress.
Treatment with QMR® significantly rescued cell viability: the QMR® group showed an absorbance of 2390 at 24 h, nearly restoring viability to the level of untreated controls. In contrast, cells receiving the secretome alone did not exhibit any appreciable protection; the SECRETOME group’s absorbance was only 0.892 at 24 h, indicating no improvement (and even a slight decline) in viability relative to the oxidized control. Notably, the combined treatment (RES + SECRETOME) yielded an absorbance of 1374 at 24 h – essentially identical to the CTRL-OX group – suggesting that adding the secretome provided no additive benefit over QMR® alone.
A similar pattern was observed at the 72 h time point. CTRL cells maintained a high viability (absorbance 1892), whereas tBHP exposure (CTRL-OX) reduced this to 1068. QMR® again conferred robust cytoprotection: RESONO-treated cells had an OD_570 of 2198 at 72 h, exceeding the untreated control and indicating sustained cell survival and proliferation. However, secretome treatment alone remained ineffective (absorbance 0.258 at 72 h, corresponding to a severely reduced viability), and the combination of RES + SECRETOME yielded an absorbance of 0.959 – not outperforming QMR® alone. In contrast, the secretome by itself provided minimal protection in this model, and co-treatment with QMR® did not further improve viability beyond the effect of QMR® alone.
These MTT results underscore the potent cytoprotective effect of QMR® in oxidatively stressed RPE cells, whereas the tested secretome formulation did not rescue viability, highlighting that its mechanism (or concentration) may be insufficient to counteract tBHP toxicity in ARPE-19 cells. The lack of additional benefit in the combined RES + SECRETOME group suggests that QMR® is the dominant protective agent, with no synergistic interaction from the secretome under the conditions examined.
2.2. Overview of miRNA Responses to Oxidative Stress and Therapeutic Interventions
Oxidative stress triggered a broad perturbation of the RPE miRNome, which was markedly modulated by the different therapeutic treatments. Unsupervised clustering of miRNA expression profiles revealed that untreated oxidatively stressed cells and treated cells formed distinct groups, with samples clustering primarily by treatment type and secondarily by time-point. This indicates that both Quantum Molecular Resonance (QMR®-device) and PDB secretome induced characteristic miRNA expression changes in stressed RPE cells. Overall, dozens of microRNAs (miRNAs) were significantly deregulated (adjusted p < 0.05, FDR < 0.05) in at least one treatment condition at 24 h or 72 h post-stress, compared to the untreated stress control (see Supplementary Table S1 and S2 for details). The extent of miRNA modulation generally increased over time: more miRNAs were differentially expressed at 72 h than at 24 h for each treatment, suggesting a progressive or sustained regulatory effect. Notably, the combined QMR®+secretome treatment elicited the most extensive changes in miRNA expression, consistent with an additive impact of the two interventions. In contrast, oxidative stress alone (without treatment) led to a transient miRNome response that largely differed from the profiles observed under therapeutic treatments, underscoring that both QMR® and secretome actively reprogram the miRNA network of RPE cells under stress. Figure 1 shows a heatmap of differentially expressed miRNAs across all treatments and time points, highlighting both shared and unique miRNA signatures. Volcano plots in Figure 2 illustrate the distribution of significant miRNA changes across the various treatment conditions and time points.
2.3. QMR® Treatment Modulates miRNAs in a Time-Dependent Manner
QMR® therapy induced a unique set of miRNA changes with clear time-dependent dynamics. At 24 h post-treatment, QMR®-treated RPE cells exhibited significant differential expression of approximately 10 miRNAs compared to untreated oxidatively stressed cells (FDR < 0.05). Among these, about two-thirds were upregulated by QMR® and one-third were downregulated. The magnitude of change at 24 h was moderate (absolute log2FC ranging from ~0.8 to 1.3). Notably, miR-590-3p was one of the most upregulated miRNAs at 24 h (log2FC ≈ +1.0, FDR ~0.01), while miR-27a-3p was moderately downregulated (log2FC ≈ –0.6, FDR < 0.05). By 72 h, the miRNA response to QMR® became more pronounced: approximately 15–20 miRNAs were significantly deregulated (FDR < 0.05), with a similar predominance of upregulation. Many miRNAs that showed early changes at 24 h displayed an even larger fold-change at 72 h, indicating that QMR® effects are sustained and amplified over time. For example, miR-590-3p further increased to ~+1.5 log2FC at 72 h (FDR < 0.005), and miR-27a-3p was more strongly repressed (log2FC ≈ –1.2 at 72 h). These findings suggest that QMR® treatment triggers a progressive realignment of the miRNome, wherein initial changes at 24 h are reinforced by 72 h. Table 1 summarizes the differentially expressed miRNAs (FDR < 0.05, |log2FC| ≥ 0.585) for all pairwise comparisons at 24 h and 72 h, listing the top up- and downregulated candidates with potential functional relevance, while the complete data set is provided in Supplementary Tables S1 and S2.
Importantly, QMR®-modulated miRNAs appear to be associated with cell-protective functions, especially in the context of oxidative injury. For instance, the robust upregulation of miR-590-3p is noteworthy given its reported role in suppressing inflammasome activation and oxidative damage: miR-590-3p directly targets NLRP1 (a key inflammasome initiator) and NOX4 (a producer of ROS), thereby inhibiting pyroptotic cell death pathways. The induction of miR-590-3p by QMR® (absent in untreated stressed cells) suggests QMR® uniquely engages an anti-pyroptotic, anti-oxidant miRNA circuit. Conversely, miR-27a, which is downregulated by QMR®, is a pro-oxidant miRNA known to inhibit the transcription factor FOXO1, leading to reduced autophagy and accumulation of ROS in RPE cells. Thus, QMR® repression of miR-27a-3p would relieve FOXO1, potentially enhancing autophagic clearance of ROS and improving cell survival. In line with these specific examples, the entire QMR®-responsive miRNA signature is skewed toward a protective phenotype: QMR® upregulated multiple miRNAs that target pro-apoptotic or pro-oxidant genes, and downregulated miRNAs that normally suppress antioxidant defenses. All these miRNA expression changes were highly consistent across biological replicates (each condition n = 3), with minimal inter-replicate variability. Together, the data indicate that QMR® treatment drives a unique miRNA-mediated adaptive response to oxidative stress, which strengthens from 24 h to 72 h and is distinct from the endogenous stress response in untreated cells.
2.4. Secretome Treatment Elicits Overlapping and Distinct miRNA Changes
Treatment with PDB secretome also modulated the RPE miRNome under oxidative stress, albeit with some differences in timing and magnitude compared to QMR®. At 24 h post-secretome treatment, we identified roughly 8–10 differentially expressed miRNAs relative to stressed controls (FDR < 0.05), a number similar to the QMR® 24 h response. The direction of change was likewise skewed toward upregulation: approximately 5–7 miRNAs were upregulated by secretome, while a smaller subset was downregulated. Several miRNAs responded to both QMR® and secretome at 24 h, indicating a partial overlap in the early miRNA response. For example, secretome-treated cells showed an increase in miR-590-3p as well, though to a lesser extent (e.g. log2FC ~+0.6 at 24 h, not reaching significance in all replicates). Similarly, miR-27a-3p showed a slight downward trend with secretome. These overlaps suggest that both treatments initiate common protective mechanisms by 24 h. However, secretome also uniquely regulated certain miRNAs at 24 h that were not affected by QMR®. One such secretome-specific change was miR-146a-5p upregulation (log2FC ≈ +0.8, FDR < 0.05 at 24 h), a known anti-inflammatory miRNA, which remained unchanged under QMR® alone. This indicates that secretome triggers additional anti-inflammatory miRNA responses early on, likely reflecting the bioactive cytokines and factors within the secretome.
By 72 h, the impact of secretome on the miRNome had evolved. Around a dozen miRNAs were significantly deregulated at 72 h (FDR < 0.05), showing a modest increase in the number of affected miRNAs compared to 24 h. Many miRNAs that were altered at 24 h maintained their dysregulation at 72 h, suggesting a sustained effect of the secretome treatment. For instance, miR-146a-5p remained upregulated at 72 h (log2FC ~+1.0, FDR < 0.01), consistent with a prolonged anti-inflammatory influence. In addition, some new changes emerged by 72 h in secretome-treated cells. Notably, miR-21-5p became significantly upregulated at 72 h (log2FC ≈ +1.2, FDR < 0.01), despite no significant change at 24 h. miR-21 is a pleiotropic miRNA often induced during tissue regeneration and stress recovery, and its late upregulation may signify downstream activation of cell survival pathways by the secretome. Overall, the secretome-induced miRNA profile at 72 h indicates a reinforcement and broadening of the miRNA response over time, though the total number of miRNAs affected remained slightly lower than with QMR® at 72 h. When comparing the two treatments, the secretome miRNA signature overlaps with that of QMR® in several key regulators (e.g. both influence miR-590-3p, miR-27a, etc.), yet also shows distinct features such as the prominent induction of miRNAs linked to inflammatory pathway modulation (e.g. miR-146a) and regenerative processes. This highlights that while both QMR® and secretome mitigate oxidative stress damage, they do so via both shared and unique miRNA-mediated mechanisms.
2.5. Combined QMR® + Secretome Treatment Amplifies the miRNA Response
The combination of QMR® and secretome treatments resulted in the broadest and most pronounced miRNA changes observed in this study. At 24 h, combined therapy had already deregulated a larger panel of miRNAs than either treatment alone. Specifically, approximately 15 miRNAs were significantly altered at 24 h with QMR®+secretome (FDR < 0.05), roughly doubling the number seen with QMR® or secretome individually at that time. This suggests an additive or synergistic effect of the combination in triggering miRNA responses. Indeed, the combination encompassed nearly all miRNAs that were singly altered by QMR® or secretome at 24 h, plus several additional miRNAs that reached significance only under dual treatment. For example, miR-200c-3p (log2FC ~+0.9, FDR < 0.05) and miR-29b-3p (log2FC ~–0.7, FDR < 0.05) were two miRNAs that became differentially expressed with the combination at 24 h, whereas neither was significant with either QMR® or secretome alone at that time. These combination-specific changes may reflect complementary actions of QMR® and secretome converging on additional regulatory nodes of the miRNome.
By 72 h, the synergistic impact of the combined treatment was even more evident. We detected over 20 miRNAs significantly deregulated in the QMR®+secretome group at 72 h (FDR < 0.05), representing the highest number among all conditions. Strikingly, the fold-changes for many miRNAs were greater under the combined therapy than with either treatment alone. For instance, miR-590-3p induction reached ~+2.0 log2FC at 72 h with the combination (versus +1.5 with QMR® alone), and miR-21-5p upregulation was ~+1.5 log2FC (versus ~+1.2 with secretome alone). Similarly, miR-27a-3p was more strongly suppressed in the combination (around –1.5 log2FC) than with QMR® alone. These enhanced changes imply that QMR® and secretome together reinforce each other’s regulatory effects on miRNA expression. The combined treatment not only mirrored the union of individual effects but also induced a few novel miRNA alterations that were not seen in either single treatment. For example, miR-214-3p was significantly upregulated only in the combination at 72 h (log2FC ~+1.0, FDR < 0.01), pointing to emergent regulatory interactions when both therapies are applied. Hierarchical clustering confirmed that 72 h combination-treated samples have a distinct miRNA expression pattern, clearly separated from the profiles of single treatments, and with tight clustering of replicates (indicating high consistency). Collectively, these results demonstrate that combining QMR® with secretome amplifies the therapeutic reprogramming of the miRNome in oxidatively stressed RPE cells, yielding the most robust adjustment of miRNA expression linked to cellular recovery processes.
2.6. Predicted mRNA Targets and Affected Pathways
To decipher the functional consequences of these miRNA changes, we integrated miRNA expression data with mRNA target prediction and pathway enrichment analyses. Predicted target genes of the significantly deregulated miRNAs were compiled and subjected to gene ontology (GO) and pathway enrichment (KEGG, Reactome) analysis. As shown in Figure 3, the enriched pathways align closely with the cellular processes of oxidative stress response and tissue regeneration, which the treatments aim to influence.
Predicted targets of miRNAs upregulated by QMR® were significantly enriched in GO categories such as “response to oxidative stress” and “regulation of apoptotic process” (FDR < 0.01 for both), as well as KEGG pathways including “FoxO signaling pathway” and “PI3K-Akt signaling”. These enrichments suggest that the mRNAs being suppressed by QMR®-induced miRNAs normally participate in promoting oxidative damage or cell death, and their inhibition would be beneficial for cell survival. In support of this, many QMR®-upregulated miRNAs target mRNAs encoding pro-oxidant or pro-apoptotic proteins. For example, beyond NLRP1 and NOX4 (targets of miR-590-3p mentioned above), several QMR®-induced miRNAs convergently target components of the intrinsic apoptosis pathway (such as BCL2L11/BIM and CASP9) and factors in stress-related MAPK signaling. This broad targeting likely underlies the reduction in apoptotic signaling observed with QMR® treatment. Table 2 lists predicted target genes for selected miRNAs (e.g., miR-590-3p, miR-146a, miR-29b, miR-27a), including the top-ranking interactions and known functions related to oxidative stress and inflammation, while the full list of predicted targets is provided in Supplementary Table S3.
Conversely, the set of genes targeted by miRNAs downregulated by QMR® was enriched for pathways associated with antioxidant defenses and cell survival. Notably, Reactome analysis highlighted the “Nrf2-mediated oxidative stress response” among the top enriched pathways (FDR < 0.05) for targets of QMR®-downregulated miRNAs. This finding implies that QMR® downregulation of specific miRNAs can de-repress Nrf2 pathway components, since those miRNAs normally keep certain antioxidant genes in check. In fact, one of the suppressed miRNAs in QMR®-treated cells (miR-144-3p, log2FC ≈ –0.8 at 72 h) is known to target NFE2L2 (the gene encoding Nrf2). Its downregulation by QMR® would relieve inhibition of Nrf2, potentially enhancing the transcription of endogenous antioxidant enzymes like SOD and CAT. Although this is based on in silico target predictions, it aligns with the observed GO term enrichment for “cellular redox homeostasis” in the target set. Taken together, these results indicate that QMR® miRNA profile shifts the balance of gene expression in favor of antioxidant and survival pathways, consistent with a restorative effect on redox homeostasis in RPE cells.
The secretome-regulated miRNAs showed overlapping functional themes with QMR®, as well as some differences reflecting the secretome unique composition. Targets of miRNAs upregulated by secretome were enriched in pathways related to inflammation and angiogenesis. For instance, we found significant enrichment for GO terms like “negative regulation of inflammatory response” among secretome-upregulated miRNA targets, congruent with secretome known anti-inflammatory action. Many of these miRNAs (e.g. miR-146a-5p, miR-21-5p) directly or indirectly inhibit pro-inflammatory mediators (such as IL-1β, TNFα signaling molecules) and promote tissue regeneration. Meanwhile, miRNAs downregulated by the secretome had target enrichments pointing to developmental and extracellular matrix pathways (e.g. “ECM organization” in Reactome), suggesting that secretome may lift repression on genes involved in matrix remodeling and cell adhesion to facilitate recovery from oxidative injury. It is worth noting that the combination treatment’s miRNA targets encompassed virtually all the pathway enrichments seen in each single treatment, typically with greater significance levels due to the larger number of altered miRNAs. This reinforces the idea that QMR® and secretome together produce a comprehensive activation of pro-survival and anti-stress programs at the post-transcriptional level. Table 3 presents the enriched GO and KEGG pathways for upregulated and downregulated miRNA target sets, stratified by treatment (QMR®, Secretome, Combination). The complete enrichment results available in Supplementary Table S4.
Finally, we constructed a network of miRNA–mRNA interactions for key players to visualize how the identified miRNAs might collectively regulate the cellular response (Figure 4). This network highlighted miR-590-3p as a central hub in the context of redox regulation: by targeting NLRP1, NOX4, and potentially TXNIP, miR-590-3p can dampen multiple sources of ROS and inflammasome triggers. QMR® strong induction of miR-590-3p (and the combination’s even stronger induction) thus appears to be a pivotal mechanism for inflammasome inactivation and oxidative stress alleviation. Another influential node in the network was miR-146a-5p, which was predominantly driven by the secretome (and combination). miR-146a targets multiple upstream regulators of NF-κB and TNFα signaling, explaining the enrichment of inflammatory pathways in its target list. miR-27a-3p, significantly repressed by QMR®, formed connections to targets like FOXO1 and PINK1 (a mitochondrial quality control kinase), consistent with improved autophagy and mitochondrial function when miR-27a is down. Collectively, these network interactions support a model in which QMR® and secretome treatments reprogram the miRNA–mRNA regulatory network to favor cell survival, anti-oxidant, and anti-inflammatory outcomes. For detailed interaction data, see Supplementary Table S5.
In conclusion, the beneficial and distinctive effects of QMR® are evident in the miRNA data: QMR® drives a time-dependent upregulation of anti-oxidant/anti-apoptotic miRNAs and downregulation of deleterious miRNAs, orchestrating a powerful defensive response against oxidative stress in RPE cells. The PDB secretome contributes additional miRNA-mediated influences, particularly on inflammatory and regenerative pathways, and in combination the therapies achieve the broadest re-establishment of redox homeostasis and miRNA–mRNA network balance. These results provide a detailed picture of the miRNome role in mediating the protective effects of QMR® therapy, alone and in synergy with biological secretome, in an oxidative stress model of retinal pigment epithelium. The miRNA changes and their associated pathways offer molecular insights into how QMR® treatment preserves RPE cell function and viability under stress, laying a foundation for potential therapeutic exploitation of these miRNA–mRNA interactions in retinal degenerative conditions.
3. Discussion
3.1. QMR® Modulation of Redox-Regulatory miRNAs
Our findings demonstrate that QMR® stimulation elicits a distinct post-transcriptional response in human RPE cells, characterized by modulation of key microRNAs involved in oxidative stress and inflammatory pathways. Notably, QMR® altered the levels of miR-590-3p and miR-146a-5p, two microRNAs with well-documented redox-regulatory and anti-inflammatory functions. miR-590-3p is known to inhibit oxidative stress-induced inflammasome activation in retinal cells by targeting pro-oxidant mediators such as NLRP1 and NOX4, thereby suppressing downstream pyroptotic cell death [20]. Likewise, miR-146a-5p serves as a negative feedback regulator of NF-κB signaling in RPE and other tissues, directly repressing inflammatory cytokines (e.g. IL-6) and angiogenic factors (e.g. VEGFA) that drive degenerative changes [14,21]. The QMR®-induced modulation of these microRNAs suggests that this physical stimulation primes RPE cells to a protective state – for example, by fine-tuning the NF-κB pathway and oxidative stress responses at the post-transcriptional level. Interestingly, we observed that some antioxidant miRNAs were sustainedly regulated under QMR® (remaining altered well after stimulation), indicating a durable adaptive response rather than a transient fluctuation. This sustained miRNA shift may underlie QMR® reported long-lasting bioeffects. Indeed, previous transcriptomic studies on QMR®-stimulated mesenchymal cells showed upregulation of genes involved in wound healing, extracellular matrix remodeling, and angiogenesis, and our data extend this to the upstream miRNA level, revealing that QMR® can reprogram the cellular miRNome to favor redox homeostasis and tissue regeneration. These insights are novel, as QMR® influence on microRNA networks has not been previously reported to our knowledge, and they align with QMR® anti-inflammatory and regenerative effects observed in other systems (e.g. skin and joint models)[22,23]. In summary, QMR® appears to specifically target a subset of antioxidant and pro-regeneration microRNAs, reinforcing the notion that high-frequency electrical stimulation (4–64 MHz) can orchestrate protective gene regulatory programs in RPE cells at the post-transcriptional level.
3.2. Synergistic Effects of QMR® and PDB Secretome
A central finding of this study is the complementary and sometimes synergistic interaction between QMR® stimulation and the PDB secretome in modulating RPE microRNAs. We found that the combination treatment (QMR® + secretome) influenced many of the same miRNAs as each single treatment, pointing to common pathways targeted by both interventions. For instance, both QMR® and the PDB secretome impacted redox-regulators like miR-590-3p and miR-146a, albeit with differing magnitudes and directions, suggesting that both the physical stimulus and paracrine factors converge on the cell’s oxidative stress/inflammatory response networks. Such convergence is not unexpected – the PDB secretome is rich in cytokines and growth factors that inherently activate cytoprotective circuits in RPE cells, while QMR® biophysical cues may prime or sensitize these same circuits [24]. At the same time, our data revealed distinct miRNA changes unique to each treatment modality. QMR® alone modulated certain miRNAs not significantly affected by the secretome, indicating activation of pathways that the paracrine factors did not tap into (potentially related to cell structure, metabolism or mechanotransduction, as hinted by QMR®-driven transcriptional changes reported in other cell types). Conversely, the PDB secretome uniquely upregulated several regeneration-associated miRNAs that QMR® alone did not, particularly those tied to immunomodulation and senescence control (for example, secretome treatment robustly elevated miR-146a-5p, an effect not seen with QMR® alone in our experiments). The combination therapy largely amalgamated these effects: in some cases the secretome compensated for QMR® lack of effect on a given miRNA, or vice versa, leading to a more balanced regulatory outcome. Notably, adding the secretome to QMR®-treated cells significantly boosted the levels of certain antioxidant miRNAs (e.g. miR-590-3p) that were not upregulated by QMR® alone, effectively overcoming the gaps in each single treatment. This interplay implies a synergistic relationship where QMR® and secretome together produce a broader and more potent shift in the miRNome than either could alone. In practical terms, QMR® provides a biophysical stimulus that likely enhances cellular receptivity or amplifies intracellular signaling pathways, while the PDB secretome provides a biological stimulus (trophic and immunomodulatory factors) that acts through receptor-mediated pathways – when combined, they engage overlapping protective mechanisms (such as the NF-κB/IL-6/IL-1β axis and oxidative stress defenses) from complementary angles. To our knowledge, this is the first demonstration that a non-invasive physical therapy (QMR®) can be successfully paired with a stem cell–derived secretome to influence common molecular targets in RPE cells. This novel combinatorial approach suggests that multi-modal regenerative therapies can be designed to act on several levels of cell regulation simultaneously, an idea supported by emerging regenerative medicine strategies in the literature. In summary, the QMR® + secretome treatment exhibited both additive and synergistic effects on miRNA regulation, underscoring that their mechanisms of action, while partly convergent, also complement each other by engaging distinct cellular pathways of RPE recovery.
3.3. Functional Impact on Oxidative Stress and Inflammation
The observed miRNA modulation by QMR® and the PDB secretome has important functional implications for RPE cell physiology, particularly in the context of oxidative stress and chronic inflammation (two fundamental drivers of retinal degeneration). The net effect of these post-transcriptional changes is predicted to tilt RPE cells toward a less inflammatory, more pro-survival state. For example, secretome-treated cells showed an upregulation of miR-146a-5p (absent in untreated controls), which corresponds with this miRNA’s role in attenuating pro-inflammatory signaling by targeting key upstream adapters of NF-κB (IRAK1, TRAF6) and by directly suppressing inflammatory cytokine production (including IL-6)[25]. This suggests that secretome exposure can induce a feedback mechanism in RPE that dampens excessive inflammatory responses. QMR® alone, on the other hand, tended to reduce baseline miR-146a levels in our model – a finding that initially seems counter-intuitive but is consistent with QMR® ability to directly suppress NF-κB activation and inflammatory mediators (thus reducing the need for miR-146a induction). Indeed, QMR® treatment has been shown to inhibit IL-1β and IL-18secretion by blocking NLRP3 inflammasome activation in immune cells, and to significantly lower IL-6 levels in ocular tissues in vivo, supporting the notion that QMR® can pre-empt inflammatory cascades at their onset[26]. Together with the secretome effects, this results in a complementary modulation: QMR® prevents inflammatory trigger initiation while the secretome enforces negative feedback loops – both ultimately curbing the NF-κB-driven damage cycle. Similarly, for oxidative stress pathways, the miR-590-3p axis illustrates how our treatments might confer protection: secretome-induced upregulation of miR-590-3p would suppress NOX4 and related ROS-generating enzymes, thereby potentially lowering intracellular ROS accumulation and subsequent oxidative damage in RPE cells [27]. Although QMR® alone did not elevate miR-590-3p in our study (it slightly downregulated it), the combination with secretome ensured miR-590-3p levels were higher than in unstimulated cells, which could translate into reduced oxidative burden. These coordinated changes in redox-regulating miRNAs likely explain the enhanced antioxidant defenses observed with treatments. Our data provide a mechanistic underpinning for such observations: by modulating miRNAs that control antioxidant gene expression or their regulators, QMR® and secretome together bolster the RPE’s capacity to neutralize ROS and withstand oxidative injury. In sum, the post-transcriptional reprogramming induced by QMR® and the secretome is functionally aligned with mitigating oxidative stress and inflammation in RPE cells. This dual action is particularly valuable, as oxidative damage and inflammation are interlinked processes in retinal degeneration – lowering one often ameliorates the other [28]. By targeting both via miRNA networks, the treatments set the stage for interrupting vicious cycles (e.g. oxidative stress → inflammation → more oxidative stress) and promoting a pro-recovery milieu. This mechanistic insight is reinforced by parallel evidence from other models: biophysical stimulation like QMR® has been shown to shift macrophages from a pro-inflammatory (M1) to anti-inflammatory (M2) phenotype [22], and PDB secretions are renowned for carrying anti-apoptotic and immunomodulatory signals that protect retinal cells. Therefore, the miRNA changes we report likely represent upstream “master switches” through which QMR® and secretome mitigate cellular stress – a hypothesis that should be further validated by measuring downstream functional outcomes (e.g. ROS levels, cytokine secretion, cell death rates) in future studies (Figure 5).
3.4. Therapeutic Relevance and Translational Potential
These findings carry significant translational promise for degenerative retinal conditions such as AMD. AMD pathology is driven in large part by RPE dysfunction due to chronic oxidative stress, inflammation, and an imbalanced tissue microenvironment [29]. Currently, there is no effective therapy to halt or reverse dry AMD (geographic atrophy), and even in wet AMD, treatments like anti-VEGF address only the symptom (neovascular growth) without restoring RPE health [30,31]. The combined QMR® + secretome approach seeks to bolster the intrinsic resilience of RPE cells, thereby attacking the root causes of degeneration. By reshaping the RPE miRNome towards an anti-oxidant, anti-inflammatory profile, QMR® and secretome treatments could maintain retinal homeostasis and prevent the molecular cascade that leads to photoreceptor loss and vision impairment. Notably, each component of this therapy has independent translational groundwork: QMR®-based devices have already been applied in ophthalmology (for example, improving meibomian gland function in dry eye patients with a concomitant reduction in ocular surface IL-6 levels), demonstrating safety and efficacy of QMR® stimulation in human ocular tissues [17]. Our study suggests that integrating these two approaches could yield a therapy that is non-invasive (QMR® can be delivered through external applicators without surgery) and bioactive (secretome factors can be delivered via intravitreal injection or potentially engineered sustained-release formulations). Importantly, the microRNA signatures identified here could guide patient stratification and therapeutic monitoring in future clinical applications. For instance, baseline levels of miR-146a or miR-590-3p in a patient’s plasma or aqueous humor might correlate with disease severity or predict response to a QMR®/secretome therapy – an idea supported by recent evidence that extracellular miRNAs (including miR-146a) are elevated in AMD patients and can serve as minimally invasive biomarkers of retinal disease [32]. Additionally, the miRNA profile changes could themselves be exploited therapeutically: there is growing interest in using miRNA mimics or inhibitors (delivered via viral vectors or exosome carriers) to modulate disease pathways in the retina [33]. The fact that QMR® and the secretome naturally induce a protective miRNA profile suggests a blueprint for miRNA-based interventions – for example, supplementing a QMR® treatment with exosomes enriched in miR-590-3p and miR-146a-5p might further boost outcomes. Overall, the translational message is that remodulating the RPE’s miRNome can confer tangible resistance against AMD-related stresses, and the combination of a biophysical stimulator (QMR®) with biochemically active factors (PDB secretome) offers a novel, multi-faceted therapeutic strategy. This could fill a critical gap in AMD management by simultaneously addressing oxidative damage, inflammation, and perhaps even secondary angiogenic changes in the retina. Future development of this strategy will need to consider delivery methods (e.g. specialized QMR® devices for retinal application, optimized dosing of secretome or exosomal preparations) and safety, but the present results provide a strong scientific rationale for moving toward in vivo testing of QMR®-secretome therapy in retinal degeneration models.
3.5. Study Limitations and Future Directions
We acknowledge several limitations in our study, which also point to avenues for future research. First, all experiments were conducted in an in vitro setting using the ARPE-19 cell line, a model of human RPE [34]. While ARPE-19 cells are a convenient and well-characterized model, they do not fully recapitulate the complexity of native RPE tissue – for example, they lack the polarization, dense pigmentation, and full range of metabolic interactions present in the intact retinal environment [35]. Thus, the responses we observed (both to QMR® and secretome) will need validation in primary RPE cultures and in in vivo models. In particular, testing this combinatorial therapy in animal models of retinal degeneration (such as sodium iodate-induced RPE injury or oxidative stress-induced AMD models) is a critical next step to determine whether the miRNA changes translate into tangible neuroprotective effects (e.g. preservation of photoreceptors, reduction of drusen-like deposits, or improved visual function). Second, our study focused on gene regulation (miRNA and mRNA levels) and did not directly measure protein-level or functional outcomes. It remains to be confirmed that the predicted mRNA targets of the modulated miRNAs do indeed change in protein expression and contribute to functional resilience of RPE cells. For instance, we predict that QMR® + secretome treatment should reduce levels of inflammatory proteins like IL-6, COX-2, or NLRP3 inflammasome components, and increase levels of antioxidant enzymes like HO-1 or SOD – these hypotheses should be tested via protein assays (Western blot, ELISA) and functional assays (measurement of ROS, cytokine release, cell viability under oxidative challenge) in future studies. Third, the design of our combination treatment can be further optimized. Secretomes can vary depending on the source of origin and the conditioning methods. Future work might compare different sources (e.g. umbilical, adipose, or bone marrow MSC secretomes) or even exosome-enriched fractions to identify the most efficacious components. Likewise, the QMR® stimulation parameters (frequency spectrum, duration, and timing relative to secretome exposure) could be varied to optimize the synergy – our protocol was based on prior cell studies, but perhaps different regimens could enhance the effects. Another limitation is that we did not investigate the mechanistic link between QMR® and miRNA biogenesis. It remains unclear whether QMR® acts via altering transcription factors (which then affect miRNA gene transcription) or via affecting miRNA processing and stability. Understanding this mechanism would be scientifically interesting and could reveal additional therapeutic targets (for example, if QMR® modulates Dicer or Argonaute activity). Lastly, while we propose the idea of using miRNA profiles as predictive biomarkers, this concept will require clinical validation: prospective studies would need to measure these miRNAs in patient fluids and correlate them with disease progression or response to therapy. Encouragingly, miRNAs like miR-146a and miR-155 are already being studied as circulating biomarkers in AMD, so extending such analyses to QMR®/secretome-treated subjects (perhaps in a future clinical trial) is feasible [36]. In conclusion, our study provides a proof-of-concept that a combined QMR® and PDB-secretome treatment can reprogram the post-transcriptional landscape of RPE cells in a beneficial manner. The limitations outlined highlight the need for a careful stepwise translation: from in vitro validation of protein-level effects to in vivo efficacy studies in retinal degeneration models, and eventually to clinical trials to assess safety, optimal delivery, and therapeutic impact on patients. Despite the challenges ahead, the robust induction of an antioxidant and pro-regeneration miRNA program by QMR® and PDB secretome is a promising result that opens new pathways for combatting RPE-related degenerative diseases. With further research, it is conceivable that the miRNA signatures identified here could not only serve as biomarkers of treatment efficacy but also guide the development of adjuvant therapies (e.g. miRNA mimics) to enhance the regenerative outcomes. Ultimately, our work lays a foundation for innovative therapeutic strategies in diseases like AMD, centered on harnessing the cell’s own post-transcriptional machinery to promote resilience and regeneration in the retina.
4. Materials and Methods
4.1. Cell Culture, Authentication and Experimental Design
Human retinal pigment epithelium (ARPE-19; ATCC CRL-2302, Manassas, VA, USA) cells were used as the in vitro model. Cells were expanded in high-glucose Dulbecco’s modified Eagle’s medium (DMEM/F-12, Gibco 11320-033) supplemented with 10 % fetal bovine serum, 2 mM L-glutamine and 100 U mL⁻¹ penicillin–streptomycin at 37 °C in 5 % CO₂. Cell-line identity was verified by short-tandem-repeat profiling (PowerPlex® 10 system; match > 80 %), and cultures were confirmed mycoplasma-free using the MycoAlert™ PLUS kit (Lonza) every two months [37].
For experiments, passages 3–5 ARPE-19 cells were seeded at 1 × 10⁵ cells per well in 99 mm plates (growth area = 78.5 cm²) and allowed to reach ~80 % confluence. A full-factorial design comprised four treatment groups—Control, PDB -Secretome, QMR®, and Secretome + QMR®—each assessed at 24 h and 72 h, with n = 3 independent biological replicates per condition. Power analysis (RNASeqPower, α = 0.05, dispersion = 0.2) indicated that n = 3 provides > 80 % power to detect miRNAs with |log₂FC| ≥ 1.0.
Treatments were initiated at time 0; culture supernatants were discarded, cells rinsed with PBS, and lysed directly in QIAzol™ for RNA extraction at the designated time points. All manipulations—including sham handling of Control and Secretome groups—were performed inside a Class II biosafety cabinet to maintain sterility and minimize environmental variability.
This set-up enabled paired comparisons of early (24 h) versus sustained (72 h) transcriptional responses to secretome, QMR®, and their combination under identical oxidative-stress conditions.
4.2. Patient Blood-Derived Secretome Preparation
Peripheral blood was collected from adult donors (with informed consent) and processed to produce the therapeutic secretome. Approximately 20–50 mL of whole blood was drawn into anticoagulant-coated tubes (e.g., sodium citrate). Platelet-rich plasma (PRP) was then isolated by a standard two-step centrifugation protocol. In brief, an initial low-speed centrifugation (∼300 × g for 15–20 min) separated the blood into an upper plasma layer (containing platelets) and lower red blood cell layer. The plasma (including the buffy coat interface) was carefully transferred to a fresh tube and subjected to a higher-speed spin (typically 1500–2000 × g for 5–10 min) to pellet the platelets. Most of the supernatant platelet-poor plasma was removed, leaving a small volume in which the platelet pellet was gently resuspended to obtain PRP. This preparation yielded platelet concentrations on the order of 109/mL (approximately 4–8× above baseline), in line with established definitions of therapeutic PRP. The PRP product contained minimal red blood cell contamination and a reduced leukocyte count, consistent with a “pure” PRP formulation [38,39].
To generate the secretome, the PRP was activated under controlled conditions to release platelet-derived factors. Calcium chloride (CaCl₂) was added to the PRP (generally ~10% of the volume, yielding a final CaCl₂ concentration of ~20–25 mM) to initiate coagulation and platelet degranulation [40]. In some preparations, a trace of bovine thrombin was also included to ensure rapid fibrin clot formation. In line with established protocols, the PRP was first incubated at 37 °C for 1 h to allow clot formation and an initial burst of growth factor release. Subsequently, the clotted PRP was kept at 4 °C for an extended period (typically ~16–18 h overnight) to promote a gradual release of remaining paracrine factors from the platelet-fibrin matrix [41]. After this conditioning period, the tube was centrifuged at 2000–3000 × g for ~10 min to remove the fibrin clot, cell fragments, and any platelet debris. The resulting supernatant – effectively the platelet secretome (also referred to as PRP releasate) – was carefully collected [40]. To ensure sterility, the secretome was passed through a 0.22 μm pore filter, removing any residual cells or microparticles. For further enrichment of bioactive factors, the secretome was concentrated by ultrafiltration using a 3 kDa molecular-weight cutoff filter (Amicon Ultra or equivalent). This step retained high-molecular-weight components (platelet-derived proteins, growth factors, extracellular vesicles, etc.) while eliminating small molecules such as excess CaCl₂ or metabolic byproducts. The concentrated blood-derived secretome was then quantified for total protein content using a BCA assay, and sterile aliquots were stored at –80 °C until use [42].
For in vitro cell culture experiments, thawed secretome aliquots were diluted 1:1 with fresh culture medium immediately before use (resulting in a final concentration of 50% secretome v/v). In secretome-treated groups, the culture medium was replaced with this secretome-supplemented medium at the start of the treatment period (time 0 h). Control groups received an equivalent volume of fresh medium without secretome, under the same reduced-serum conditions to ensure comparability. All secretome treatments were handled under sterile conditions, and multiple preparations were pooled when necessary to minimize variability between batches. This patient blood-derived secretome preparation protocol is consistent with widely accepted methods in the literature for generating platelet releasates as autologous therapeutic agents. The approach yields a rich mixture of growth factors and cytokines released from platelets – including VEGF, TGF-β1, PDGF, IGF-1, and others – which can potentiate tissue regeneration and modulate inflammation in the target cells [43].
4.3. QMR® Stimulation Setup
QMR® stimulation was delivered with a benchtop Quantum Molecular Resonance generator (Telea Electronic Engineering srl, Sandrigo, Italy; 230 V, 50/60 Hz, max 250 VA). The device emits multifrequency signal with a particular wave form (fundamental 4 MHz plus harmonics from 8 to 64 MHz). For the present study we set the nominal power to 30 (≈ 0.5 W) unless otherwise specified; a subset of experiments employed setting 80 (≈ 1.9 W).
Custom sterile electrodes were used: a spheroidal stainless-steel anode (Ø 35 mm) gently lowered until just contacting the medium surface (distance from cell monolayer 3 mm), and a flat stainless-steel cathode placed beneath the dish. The medium volume was 3 mL in 35-mm dishes, giving an estimated field strength of 1.1 ± 0.2 V cm⁻¹ at 2 mm above the monolayer, measured with Ag/AgCl microelectrodes (n = 3). Current density under these conditions was ~12 mA cm⁻².
4.4. QMR® Treatment Protocol
The QMR® treatment was designed to mimic clinical therapeutic regimens in vitro. For the 24 h time point experiments, cells designated for QMR® exposure received a single 10 min QMR® stimulation at time 0 h (immediately after medium change or secretome addition). For the 72 h experiments, cells received daily QMR® stimulation: one 10 min session at 0 h, and additional 10 min sessions at ~24 h and ~48 h, for a total of three exposures on three consecutive days. Each 10 min stimulation was delivered at a nominal power setting of 40 (dimensionless unit corresponding to ~10 W output) – a setting in the mid-range of the device that had shown bioactive effects in previous studies. During the intervals between QMR® sessions, cells were returned to the incubator under standard culture conditions. Controls and non-QMR® groups were taken out and handled similarly to replicate any environmental changes. At the end of the treatment period (either 24 h or 72 h after the initial stimulation), cells were harvested for RNA extraction as described above. All QMR® exposures were performed in duplicate for each independent experiment to ensure reproducibility, and no signs of altered cell morphology or viability were observed in QMR®-treated cultures compared to sham controls over the course of treatment.
4.5. Cell Viability Assay
ARPE-19 cell viability was quantified using a 3-(4,5-dimethylthiazol-2-yl)-2,5-diphenyl tetrazolium bromide (MTT) reduction assay at 24 h and 72 h after treatments. Cells were seeded in 96-well plates at an appropriate density (to achieve ~70–80% confluence at 24 h) and allowed to adhere overnight. All experimental groups were included: untreated controls (CTRL), oxidatively stressed control (CTRL-OX, exposed to tert-butyl hydroperoxide [tBHP]), QMR®-only (RESONO), secretome-only (SECRETOME), and combined QMR® + secretome (RES + SECRETOME) treatments. At the designated time points, 0.5 mg/mL MTT reagent (Sigma–Aldrich) was added to each well and the plates incubated at 37 °C for 3 h to allow mitochondrial dehydrogenases to convert MTT into insoluble formazan crystals.
After incubation, the supernatant was carefully removed and 100 µL of dimethyl sulfoxide (DMSO) was added to each well to dissolve the purple formazan crystals. Plates were gently agitated for 10 min to ensure complete solubilization. The absorbance of each well was then measured at 570 nm using a microplate spectrophotometer (with a reference wavelength of 630–690 nm to subtract background, if applicable) [44]. Each treatment condition was assessed in multiple replicates (at least n = 6 wells per group per experiment), and each experiment was repeated at least three times to ensure reproducibility.
Cell viability in each group was normalized to the untreated CTRL group (set as 100%). Results were expressed as relative viability (%) or as optical density (OD_570) values, and statistically significant differences between groups were determined using appropriate post hoc tests (with p < 0.05 considered significant) [45]. This MTT assay protocol is standard for evaluating cell metabolic activity and viability in RPE cells and provides a quantitative measure of the protective effects of treatments against TBHP-induced oxidative stress.
4.6. RNA Extraction and Small RNA Library Preparation
Total RNA was isolated using QIAzol™ reagent (Qiagen) followed by miRNeasy Mini spin-columns (Qiagen 217004), according to the manufacturer’s protocol. RNA concentration was measured with Qubit™ RNA HS Assay (ThermoFisher), and integrity assessed on an Agilent 2100 Bioanalyzer; samples with RIN ≥ 8.0 and 28S/18S ratio ≥ 1.8 proceeded to library construction (yield ≥ 500 ng) [46].
Small-RNA libraries were generated with the NEBNext® Multiplex Small RNA Library Prep Set for Illumina (E7580, v4.1 chemistry) using 3′ and 5′ adapters specific for microRNAs. After reverse transcription and 15 cycles of PCR, libraries were size-selected (145–160 bp) on 6 % Novex TBE-PAGE gels, purified with the Monarch® DNA Gel Extraction Kit, and quality-checked on a Bioanalyzer High Sensitivity DNA chip. Twelve uniquely indexed libraries were pooled equimolarly (4 nM each) and sequenced on an Illumina NextSeq 500 platform (High-Output v2.5, single-end 75 bp), targeting ≥ 15 million raw reads per sample. All sequencing runs included 5% PhiX spike-in for calibration [47].
4.7. Bioinformatic Analysis of Small RNA-Seq Data
Sequencing reads were processed with a dedicated small RNA bioinformatics pipeline. First, raw reads underwent quality control using FastQC (v0.11.9) to identify any issues. Adapter sequences introduced by the library prep were then trimmed from reads using Cutadapt (v3.4) with parameters set to remove 3′ adapters specific to the Illumina small RNA kit and discard reads shorter than 15 nt after trimming[48]. On average, over 95% of reads had adapters successfully removed, and these adapter-trimmed reads were used for alignment. Reads were mapped to the human genome reference (GRCh38) using the Bowtie aligner (v1.3.1) with settings optimized for small RNA (seed length 20, allowing up to 1 mismatch, and suppressing multiple alignments per read) [49]. The alignment was performed in a two-step strategy: reads were first aligned to a known miRNA reference index derived from miRBase v22 mature miRNA sequences, and any reads that did not align in this step were subsequently aligned to the full genome to detect other small RNAs or novel loci. Aligned reads were then quantified to known miRNAs. For known miRNAs, a read was counted towards a miRNA if it mapped (with zero mismatches) to the mature miRNA sequence or the corresponding hairpin locus in the genome without a better match elsewhere. The counts of reads for each miRNA were compiled into a count matrix, with an average of ~10 million reads mapped to miRNA per sample. Read count normalization and differential expression analysis were carried out in R (v4.1.2) using the Bioconductor package DESeq2. Raw counts were imported into DESeq2, which uses size factor normalization (median ratio method) to account for library depth differences. Differential expression between experimental groups was assessed using negative binomial generalized linear models as implemented in DESeq2 [50]. Pairwise comparisons were made to identify miRNAs regulated by each treatment (e.g., secretome vs control, QMR® vs control, combination vs single treatments, etc.), including interaction effects if any, according to the experimental design. The model included factors for treatment group, time point, and their interaction, and dispersion estimates were moderated to improve accuracy given the small number of replicates. Statistical significance of differential expression was determined using Wald tests, and the resulting p-values were adjusted for multiple testing using the Benjamini–Hochberg false discovery rate (FDR) procedure [51]. MiRNAs with an adjusted p-value < 0.05 were considered significantly differentially expressed. Additionally, a minimum fold-change threshold of 1.5-fold (|log2FC| ≥ 0.585) was applied to define biologically relevant deregulation. These combined criteria ensured that the identified miRNAs exhibited robust changes in expression. All major data analysis steps were validated by using alternative tools or parameters (for example, mapping was cross-checked with STAR aligner, and a subset of differentially expressed miRNAs was confirmed by qRT-PCR, see section 4.8 below) to ensure the robustness of results.
4.8. Validation of miRNA Expression by RT-qPCR
To corroborate the small-RNA-seq data, a validation assay based on SYBR™ Green real-time PCR was carried out. Total RNA (200 ng per sample) was reverse-transcribed with the miScript II RT kit (QIAGEN), which employs a poly-adenylation step followed by cDNA synthesis with an oligo-dT-universal primer, thereby converting mature miRNAs into amplifiable templates [52]. Quantitative PCR was performed on a QuantStudio™ 6 Flex system (Thermo Fisher Scientific) with SYBR™ Green PCR Master Mix and miScript Primer Assays specific for three deregulated miRNAs (miR-21-5p, miR-34a-5p, miR-146a-5p) selected on the basis of statistical significance, FC magnitude and functional relevance. Cycling conditions comprised an initial denaturation at 95 °C for 10 s followed by 40 cycles of 95 °C for 5 s and 60 °C for 30 s; a melt-curve analysis confirmed the specificity of each amplicon. All reactions were run in technical triplicate, and three independent biological replicates were analyzed per condition. Expression levels were normalized to the small nucleolar RNA RNU6B, and relative abundance was calculated with the 2–ΔΔCt method. Statistical significance between groups was assessed with two-tailed Student’s t-tests, accepting p < 0.05 as significant [53].
4.9. miRNA Target Prediction and Functional Enrichment
To interpret the potential impact of the differentially expressed miRNAs, in silico target gene prediction was performed. Predicted mRNA targets of each significantly deregulated miRNA were identified using multiple databases: TargetScan (Release 8.0) and miRDB were the primary resources [54]. For TargetScan, target genes with context++ score percentile ≤ top 1% (indicating strong predicted binding) were retrieved for each miRNA. From miRDB, targets with a prediction score ≥ 80 were selected. The results from these two algorithms were combined, and only genes predicted by at least one of the algorithms (typically yielding hundreds of candidates per miRNA) were retained as potential targets. In cases where multiple miRNAs were significantly altered, an integrated target list was compiled by taking the union of all predicted targets for the up-regulated miRNAs and, separately, for the down-regulated miRNAs. To gain insight into the biological processes and pathways affected, we performed functional enrichment analysis on the predicted target gene sets using g:Profiler (version e108_eg53). Enrichment was tested for Gene Ontology (GO) terms (Biological Process, Molecular Function, Cellular Component), Kyoto Encyclopedia of Genes and Genomes (KEGG) pathways, Reactome pathways, and transcription factor targets, among others. For each gene list (e.g., targets of up-regulated miRNAs), g:Profiler’s g:GOSt module was run with default settings, using the whole human genome as the statistical background. The g:Profiler tool applies a built-in multiple testing correction algorithm (g:SCS) which is thresholded roughly equivalently to an FDR < 0.05 [55]. Only terms with adjusted p-value < 0.05 were deemed significantly enriched. The enrichment results were further filtered to focus on processes relevant to cartilage biology and inflammation, given the experimental context. Redundant terms were condensed by semantic similarity, and the most significant GO terms and pathways were reported. To visualize overlaps, we utilized g:Profiler’s multi-query function to compare enrichment profiles of target sets from different groups; this analysis highlighted common pathways regulated by multiple miRNAs. Key enriched categories (e.g., extracellular matrix organization, cytokine signaling, and cartilage development) were identified, providing hypotheses about the functional consequences of the miRNA changes.
4.10. miRNA–mRNA Network Construction
To illustrate the regulatory interactions, a network was constructed linking the differentially expressed miRNAs to their predicted target genes, especially those associated with enriched pathways or of particular interest (such as cartilage matrix molecules or inflammation-related genes). We used Cytoscape (v3.9.0) to visualize the miRNA–mRNA interaction network [56]. In the network graph, nodes represent either miRNAs or target genes, and an edge was drawn from a miRNA to a gene if that gene was among the high-confidence predicted targets of the miRNA. We further annotated the network with directionality and effect: since miRNAs typically repress gene expression, the edges indicate an inhibitory interaction. The node color was used to denote the experimental regulation direction (miRNA nodes were colored red for up-regulated and blue for down-regulated; mRNA nodes were shaded according to whether the gene is expected to be up- or down-regulated as a consequence). Where available, we integrated gene expression data for target mRNAs from complementary experiments (or public datasets) to support the predicted inverse relationships – for instance, several target genes showed decreased expression in analogous secretome-treated samples, aligning with up-regulation of their cognate miRNAs. The network was analyzed for central hubs and clusters. Notably, a subset of up-regulated miRNAs converged on common target genes (forming hub nodes) involved in angiogenesis and extracellular matrix remodeling. Network topology metrics (degree and betweenness centrality) were calculated using the Cytoscape NetworkAnalyzer tool to identify key miRNA regulators [57]. This integrated network approach facilitated a systems-level understanding of how the secretome and QMR® treatments could modulate gene expression programs via miRNAs.
5. Conclusions
In summary, we demonstrate that QMR® stimulation, especially when combined with PDB secretome, exerts potent cytoprotection in oxidatively stressed RPE cells via a distinct microRNA-mediated mechanism. This combined treatment elicits a novel miRNA signature that synergistically boosts the RPE antioxidant defenses and dampens inflammatory pathways, effectively preserving cellular function under stress.
Importantly, our data also show that QMR® alone exerts significant protective effects in this AMD-mimicking model: it restores cell viability, upregulates anti-inflammatory and antioxidant miRNAs (e.g., miR-146a-5p, miR-590-3p), and suppresses pro-apoptotic signals (e.g., miR-34a-5p, miR-155-5p). These effects are associated with the modulation of pathways involved in redox homeostasis, inflammation control, and cell survival, such as NF-κB, p53, and FoxO signaling.
Notably, QMR® induces a sustained shift in the miRNome that persists for at least 72 hours, highlighting a durable reprogramming of the RPE post-transcriptional landscape. This sustained miRNA remodeling likely underpins the long-lasting bioeffects previously reported for QMR®, and supports its independent therapeutic potential in retinal degenerative diseases such as AMD.
These findings provide a rigorous molecular rationale for the standalone application of QMR® as a non-invasive treatment strategy for retinal protection, and support its value in the context of regulatory certification and clinical translation.
Supplementary Materials
The following supporting information can be downloaded at the website of this paper posted on Preprints.org, Table S1: Differential expression of all detected miRNAs at 24 h under oxidative stress and therapeutic treatments (QMR®, PDB-secretome, and combination), Table S2: Differential expression of all detected miRNAs at 72 h under oxidative stress and therapeutic treatments, Table S3: Predicted mRNA targets of significantly deregulated miRNAs across treatments, compiled from TargetScan and miRDB, Table S4: Comprehensive pathway enrichment analysis (GO, KEGG, Reactome) for predicted targets of deregulated miRNAs, Table S5: miRNA–mRNA interaction pairs showing inverse regulation under oxidative stress versus control conditions.
Author Contributions
Conceptualization, L.D. and S.A.; methodology, S.A.; software, L.D.; validation, D.M., S.A. and Z.Z.; formal analysis, L.D.; investigation, S.A.; resources, A.P.; data curation, R.D.; writing—original draft preparation, L.D.; writing—review and editing, S.A. and D.M.; visualization, C.S., R.D. and F.A.; supervision, A.S.; project administration, L.D.; funding acquisition, L.D. and SZ.S. All authors have read and agreed to the published version of the manuscript.
Funding
This research received no external funding.
Institutional Review Board Statement
The study was conducted in accordance with the Declaration of Helsinki and approved by the local Ethics Committee “A.O.U. G. Martino” (Date: 23 June 2017; Number: 858).
Informed Consent Statement
Informed consent was obtained from all subjects involved in the study.
Data Availability Statement
The data presented in this study will be made available by the authors on request.
Acknowledgments
Not applicable.
Conflicts of Interest
The authors declare no conflicts of interest.
Abbreviations
The following abbreviations are used in this manuscript:
| miRNA | microRNA |
| QMR® | Quantum Molecular Resonance |
| PBD | Patient blood dependent |
| RPE | Retinal Pigment Epithelium |
| ROS | Reactive Oxygen Species |
| tBHP | tert-Butyl hydroperoxide |
| DEG | Differentially Expressed Gene |
| FDR | False Discovery Rate |
| FC / log₂FC | Fold Change / log base 2 Fold Change |
| GO | Gene Ontology |
| KEGG | Kyoto Encyclopedia of Genes and Genomes |
| EMT | Epithelial-to-Mesenchymal Transition |
| ECM | Extracellular Matrix |
| IL | Interleukin |
| IL1B / IL6R | Interleukin-1 beta / Interleukin-6 receptor |
| NF-κB | Nuclear Factor kappa-light-chain-enhancer of activated B cells |
| TNF | Tumor Necrosis Factor |
| mRNA | Messenger RNA |
| RT-qPCR | Reverse Transcription quantitative Polymerase Chain Reaction |
| TS | TargetScan |
| DB | miRDB |
| CTRL | Untreated control condition |
| OX | Oxidative stress condition |
| Sec | Secretome from PDB |
| Q+S | Combined QMR® and Secretome treatment |
| MAPK | Mitogen-Activated Protein Kinase |
| HIF-1 | Hypoxia-Inducible Factor 1 |
| PI3K–Akt | Phosphoinositide 3-kinase–Protein kinase B pathway |
| TGF-β | Transforming Growth Factor beta |
| NFE2L2/NRF2 | Nuclear factor erythroid 2–related factor 2 |
| NLRP3 | NOD-like receptor family pyrin domain-containing 3 |
| CFH | Complement Factor H |
| STAT1/3 | Signal Transducer and Activator of Transcription 1 / 3 |
| RELA | v-rel avian reticuloendotheliosis viral oncogene homolog A (p65 subunit of NF-κB) |
| IRAK1 | Interleukin-1 Receptor-Associated Kinase 1 |
| TRAF6 | TNF Receptor Associated Factor 6 |
| CASP3 | Caspase-3 |
| BCL2 | B-cell lymphoma 2 |
| TP53 | Tumor Protein p53 |
| CDK6 | Cyclin-Dependent Kinase 6 |
| SIRT1 | Sirtuin 1 |
| ZEB1/2 | Zinc finger E-box-binding homeobox 1 / 2 |
| MET | Mesenchymal–epithelial transition factor (HGFR) |
| NOX4 | NADPH oxidase 4 |
| LC3 | Microtubule-associated protein 1A/1B-light chain 3 |
| HMOX1 | Heme oxygenase 1 |
| FADD | Fas-Associated Death Domain protein |
| BCLAF1 | Bcl-2-associated transcription factor 1 |
| E2F1/2/3 | E2F Transcription Factor 1/2/3 |
| FOXO1/3 | Forkhead box protein O1/O3 |
| SOD1 | Superoxide Dismutase 1 |
| XBP1 | X-box binding protein 1 |
| KEAP1 | Kelch-like ECH-associated protein 1 |
References
- Fuhrmann, S.; Zou, C.; Levine, E.M. Retinal pigment epithelium development, plasticity, and tissue homeostasis. Exp Eye Res 2014, 123, 141–150. [Google Scholar] [CrossRef]
- Lakkaraju, A.; Umapathy, A.; Tan, L.X.; Daniele, L.; Philp, N.J.; Boesze-Battaglia, K.; Williams, D.S. The cell biology of the retinal pigment epithelium. Prog Retin Eye Res 2020, 100846. [Google Scholar] [CrossRef]
- Ferrington, D.A.; Kapphahn, R.J.; Leary, M.M.; Atilano, S.R.; Terluk, M.R.; Karunadharma, P.; Chen, G.K.; Ratnapriya, R.; Swaroop, A.; Montezuma, S.R.; et al. Increased retinal mtDNA damage in the CFH variant associated with age-related macular degeneration. Exp Eye Res 2016, 145, 269–277. [Google Scholar] [CrossRef]
- Golestaneh, N.; Chu, Y.; Xiao, Y.Y.; Stoleru, G.L.; Theos, A.C. Dysfunctional autophagy in RPE, a contributing factor in age-related macular degeneration. Cell Death Dis 2017, 8, e2537. [Google Scholar] [CrossRef] [PubMed]
- Huang, J.J.; Xia, J.; Huang, L.L.; Li, Y.C. HIF-1alpha promotes NLRP3 inflammasome activation in bleomycin-induced acute lung injury. Mol Med Rep 2019, 20, 3424–3432. [Google Scholar] [CrossRef]
- Pfau, M.; von der Emde, L.; de Sisternes, L.; Hallak, J.A.; Leng, T.; Schmitz-Valckenberg, S.; Holz, F.G.; Fleckenstein, M.; Rubin, D.L. Progression of Photoreceptor Degeneration in Geographic Atrophy Secondary to Age-related Macular Degeneration. JAMA Ophthalmol 2020, 138, 1026–1034. [Google Scholar] [CrossRef] [PubMed]
- Yang, Y.; Lin, Y.; Han, Z.; Wang, B.; Zheng, W.; Wei, L. Ferroptosis: a novel mechanism of cell death in ophthalmic conditions. Front Immunol 2024, 15, 1440309. [Google Scholar] [CrossRef] [PubMed]
- Yu, L.; Liu, P. cGAS/STING signalling pathway in senescence and oncogenesis. Semin Cancer Biol 2024, 106-107, 87–102. [Google Scholar] [CrossRef]
- Zhou, M.; Geathers, J.S.; Grillo, S.L.; Weber, S.R.; Wang, W.; Zhao, Y.; Sundstrom, J.M. Role of Epithelial-Mesenchymal Transition in Retinal Pigment Epithelium Dysfunction. Front Cell Dev Biol 2020, 8, 501. [Google Scholar] [CrossRef]
- Jung, W.K.; Park, S.B.; Yu, H.Y.; Kim, Y.H.; Kim, J. Effect of Esculetin on Tert-Butyl Hydroperoxide-Induced Oxidative Injury in Retinal Pigment Epithelial Cells In Vitro. Molecules 2022, 27. [Google Scholar] [CrossRef]
- Rabin, D.M.; Rabin, R.L.; Blenkinsop, T.A.; Temple, S.; Stern, J.H. Chronic oxidative stress upregulates Drusen-related protein expression in adult human RPE stem cell-derived RPE cells: a novel culture model for dry AMD. Aging (Albany NY) 2013, 5, 51–66. [Google Scholar] [CrossRef]
- Hanus, J.; Zhang, H.; Wang, Z.; Liu, Q.; Zhou, Q.; Wang, S. Induction of necrotic cell death by oxidative stress in retinal pigment epithelial cells. Cell Death Dis 2013, 4, e965. [Google Scholar] [CrossRef]
- Diaz-Riascos, Z.V.; Ginesta, M.M.; Fabregat, J.; Serrano, T.; Busquets, J.; Buscail, L.; Cordelier, P.; Capella, G. Expression and Role of MicroRNAs from the miR-200 Family in the Tumor Formation and Metastatic Propensity of Pancreatic Cancer. Mol Ther Nucleic Acids 2019, 17, 491–503. [Google Scholar] [CrossRef]
- Hao, Y.; Zhou, Q.; Ma, J.; Zhao, Y.; Wang, S. miR-146a is upregulated during retinal pigment epithelium (RPE)/choroid aging in mice and represses IL-6 and VEGF-A expression in RPE cells. J Clin Exp Ophthalmol 2016, 7. [Google Scholar] [CrossRef]
- Urbanska, K.; Stepien, P.W.; Nowakowska, K.N.; Stefaniak, M.; Osial, N.; Choragiewicz, T.; Toro, M.D.; Nowomiejska, K.; Rejdak, R. The Role of Dysregulated miRNAs in the Pathogenesis, Diagnosis and Treatment of Age-Related Macular Degeneration. Int J Mol Sci 2022, 23. [Google Scholar] [CrossRef]
- Usui-Ouchi, A.; Ouchi, Y.; Kiyokawa, M.; Sakuma, T.; Ito, R.; Ebihara, N. Upregulation of Mir-21 Levels in the Vitreous Humor Is Associated with Development of Proliferative Vitreoretinal Disease. PLoS One 2016, 11, e0158043. [Google Scholar] [CrossRef] [PubMed]
- Trivli, A.; Karmiris, E.; Dalianis, G.; Ruggeri, A.; Terzidou, C. Evaluating the efficacy of Quantum Molecular Resonance (QMR®) electrotherapy in mixed-type dry eye patients. J Optom 2023, 16, 128–134. [Google Scholar] [CrossRef] [PubMed]
- Ballesteros-Sanchez, A.; Sanchez-Gonzalez, J.M.; Tedesco, G.R.; Rocha-De-Lossada, C.; Russo, F.; Spinelli, A.; Ingrande, I.; Borroni, D. Efficacy and Safety of Quantum Molecular Resonance Electrotherapy in Patients with Aqueous-Deficient, Evaporative and Mixed-Type Dry Eye: A Randomized Interventional Study. Ophthalmol Ther 2024, 13, 495–507. [Google Scholar] [CrossRef]
- Trigo, C.M.; Rodrigues, J.S.; Camoes, S.P.; Sola, S.; Miranda, J.P. Mesenchymal stem cell secretome for regenerative medicine: Where do we stand? J Adv Res 2025, 70, 103–124. [Google Scholar] [CrossRef] [PubMed]
- Gu, C.; Draga, D.; Zhou, C.; Su, T.; Zou, C.; Gu, Q.; Lahm, T.; Zheng, Z.; Qiu, Q. miR-590-3p Inhibits Pyroptosis in Diabetic Retinopathy by Targeting NLRP1 and Inactivating the NOX4 Signaling Pathway. Invest Ophthalmol Vis Sci 2019, 60, 4215–4223. [Google Scholar] [CrossRef]
- Sabbatinelli, J.; Giuliani, A.; Matacchione, G.; Latini, S.; Laprovitera, N.; Pomponio, G.; Ferrarini, A.; Svegliati Baroni, S.; Pavani, M.; Moretti, M.; et al. Decreased serum levels of the inflammaging marker miR-146a are associated with clinical non-response to tocilizumab in COVID-19 patients. Mech Ageing Dev 2021, 193, 111413. [Google Scholar] [CrossRef] [PubMed]
- Paolucci, T.; Pino, V.; Elsallabi, O.; Gallorini, M.; Pozzato, G.; Pozzato, A.; Lanuti, P.; Reis, V.M.; Pesce, M.; Pantalone, A.; et al. Quantum Molecular Resonance Inhibits NLRP3 Inflammasome/Nitrosative Stress and Promotes M1 to M2 Macrophage Polarization: Potential Therapeutic Effect in Osteoarthritis Model In Vitro. Antioxidants (Basel) 2023, 12. [Google Scholar] [CrossRef]
- Fraccalvieri, M.; Salomone, M.; Di Santo, C.; Ruka, E.; Morozzo, U.; Bruschi, S. Quantum molecular resonance technology in hard-to-heal extremity wounds: histological and clinical results. Int Wound J 2017, 14, 1313–1322. [Google Scholar] [CrossRef]
- Daneshmandi, L.; Shah, S.; Jafari, T.; Bhattacharjee, M.; Momah, D.; Saveh-Shemshaki, N.; Lo, K.W.; Laurencin, C.T. Emergence of the Stem Cell Secretome in Regenerative Engineering. Trends Biotechnol 2020, 38, 1373–1384. [Google Scholar] [CrossRef]
- Liao, Z.; Zheng, R.; Shao, G. Mechanisms and application strategies of miRNA-146a regulating inflammation and fibrosis at molecular and cellular levels (Review). Int J Mol Med 2023, 51. [Google Scholar] [CrossRef]
- Mesquida, M.; Leszczynska, A.; Llorenc, V.; Adan, A. Interleukin-6 blockade in ocular inflammatory diseases. Clin Exp Immunol 2014, 176, 301–309. [Google Scholar] [CrossRef]
- Serrander, L.; Cartier, L.; Bedard, K.; Banfi, B.; Lardy, B.; Plastre, O.; Sienkiewicz, A.; Forro, L.; Schlegel, W.; Krause, K.H. NOX4 activity is determined by mRNA levels and reveals a unique pattern of ROS generation. Biochem J 2007, 406, 105–114. [Google Scholar] [CrossRef]
- Ahmad, A.; Ahsan, H. Biomarkers of inflammation and oxidative stress in ophthalmic disorders. J Immunoassay Immunochem 2020, 41, 257–271. [Google Scholar] [CrossRef] [PubMed]
- Ochoa Hernandez, M.E.; Lewis-Lujan, L.M.; Burboa Zazueta, M.G.; Del Castillo Castro, T.; De La Re Vega, E.; Galvez-Ruiz, J.C.; Trujillo-Lopez, S.; Lopez Torres, M.A.; Iloki-Assanga, S.B. Role of Oxidative Stress and Inflammation in Age Related Macular Degeneration: Insights into the Retinal Pigment Epithelium (RPE). Int J Mol Sci 2025, 26. [Google Scholar] [CrossRef]
- Ambati, J.; Fowler, B.J. Mechanisms of age-related macular degeneration. Neuron 2012, 75, 26–39. [Google Scholar] [CrossRef] [PubMed]
- Marchesi, N.; Capierri, M.; Pascale, A.; Barbieri, A. Different Therapeutic Approaches for Dry and Wet AMD. Int J Mol Sci 2024, 25. [Google Scholar] [CrossRef] [PubMed]
- Cruz-Aguilar, M.; Groman-Lupa, S.; Jimenez-Martinez, M.C. MicroRNAs as potential biomarkers and therapeutic targets in age-related macular degeneration. Front Ophthalmol (Lausanne) 2023, 3, 1023782. [Google Scholar] [CrossRef]
- Brillante, S.; Volpe, M.; Indrieri, A. Advances in MicroRNA Therapeutics: From Preclinical to Clinical Studies. Hum Gene Ther 2024, 35, 628–648. [Google Scholar] [CrossRef]
- Schnichels, S.; Paquet-Durand, F.; Loscher, M.; Tsai, T.; Hurst, J.; Joachim, S.C.; Klettner, A. Retina in a dish: Cell cultures, retinal explants and animal models for common diseases of the retina. Prog Retin Eye Res 2021, 81, 100880. [Google Scholar] [CrossRef]
- Bonilha, V.L. Retinal pigment epithelium (RPE) cytoskeleton in vivo and in vitro. Exp Eye Res 2014, 126, 38–45. [Google Scholar] [CrossRef]
- Romano, G.L.; Platania, C.B.M.; Drago, F.; Salomone, S.; Ragusa, M.; Barbagallo, C.; Di Pietro, C.; Purrello, M.; Reibaldi, M.; Avitabile, T.; et al. Retinal and Circulating miRNAs in Age-Related Macular Degeneration: An In vivo Animal and Human Study. Front Pharmacol 2017, 8, 168. [Google Scholar] [CrossRef]
- Ahmado, A.; Carr, A.J.; Vugler, A.A.; Semo, M.; Gias, C.; Lawrence, J.M.; Chen, L.L.; Chen, F.K.; Turowski, P.; da Cruz, L.; et al. Induction of differentiation by pyruvate and DMEM in the human retinal pigment epithelium cell line ARPE-19. Invest Ophthalmol Vis Sci 2011, 52, 7148–7159. [Google Scholar] [CrossRef]
- Dhurat, R.; Sukesh, M. Principles and Methods of Preparation of Platelet-Rich Plasma: A Review and Author's Perspective. J Cutan Aesthet Surg 2014, 7, 189–197. [Google Scholar] [CrossRef]
- Harrison, T.E.; Bowler, J.; Cheng, C.I.; Reeves, K.D. Optimizing Platelet-Rich Plasma: Spin Time and Sample Source. Bioengineering (Basel) 2023, 10. [Google Scholar] [CrossRef] [PubMed]
- Patel, H.; Pundkar, A.; Shrivastava, S.; Chandanwale, R.; Jaiswal, A.M. A Comprehensive Review on Platelet-Rich Plasma Activation: A Key Player in Accelerating Skin Wound Healing. Cureus 2023, 15, e48943. [Google Scholar] [CrossRef] [PubMed]
- Cavallo, C.; Roffi, A.; Grigolo, B.; Mariani, E.; Pratelli, L.; Merli, G.; Kon, E.; Marcacci, M.; Filardo, G. Platelet-Rich Plasma: The Choice of Activation Method Affects the Release of Bioactive Molecules. Biomed Res Int 2016, 2016, 6591717. [Google Scholar] [CrossRef]
- Prado-Yupanqui, J.W.; Ramirez-Orrego, L.; Cortez, D.; Vera-Ponce, V.J.; Chenet, S.M.; Tejedo, J.R.; Tapia-Limonchi, R. The Hidden Power of the Secretome: Therapeutic Potential on Wound Healing and Cell-Free Regenerative Medicine-A Systematic Review. Int J Mol Sci 2025, 26. [Google Scholar] [CrossRef]
- Sonmez, O.; Sonmez, M. Role of platelets in immune system and inflammation. Porto Biomed J 2017, 2, 311–314. [Google Scholar] [CrossRef]
- Afsar, E.; Kirimlioglu, E.; Ceker, T.; Yilmaz, C.; Demir, N.; Aslan, M. Effect of ER stress on sphingolipid levels and apoptotic pathways in retinal pigment epithelial cells. Redox Biol 2020, 30, 101430. [Google Scholar] [CrossRef]
- Thiese, M.S.; Ronna, B.; Ott, U. P value interpretations and considerations. J Thorac Dis 2016, 8, E928–E931. [Google Scholar] [CrossRef]
- Sriram, H.; Khanka, T.; Kedia, S.; Tyagi, P.; Ghogale, S.; Deshpande, N.; Chatterjee, G.; Rajpal, S.; Patkar, N.V.; Subramanian, P.G.; et al. Improved protocol for plasma microRNA extraction and comparison of commercial kits. Biochem Med (Zagreb) 2021, 31, 030705. [Google Scholar] [CrossRef] [PubMed]
- Shore, S.; Henderson, J.M.; Lebedev, A.; Salcedo, M.P.; Zon, G.; McCaffrey, A.P.; Paul, N.; Hogrefe, R.I. Small RNA Library Preparation Method for Next-Generation Sequencing Using Chemical Modifications to Prevent Adapter Dimer Formation. PLoS One 2016, 11, e0167009. [Google Scholar] [CrossRef]
- Potla, P.; Ali, S.A.; Kapoor, M. A bioinformatics approach to microRNA-sequencing analysis. Osteoarthr Cartil Open 2021, 3, 100131. [Google Scholar] [CrossRef]
- Langmead, B.; Trapnell, C.; Pop, M.; Salzberg, S.L. Ultrafast and memory-efficient alignment of short DNA sequences to the human genome. Genome Biol 2009, 10, R25. [Google Scholar] [CrossRef] [PubMed]
- Love, M.I.; Anders, S.; Kim, V.; Huber, W. RNA-Seq workflow: gene-level exploratory analysis and differential expression. F1000Res 2015, 4, 1070. [Google Scholar] [CrossRef]
- Chen, Z.; Liu, J.; Ng, H.K.; Nadarajah, S.; Kaufman, H.L.; Yang, J.Y.; Deng, Y. Statistical methods on detecting differentially expressed genes for RNA-seq data. BMC Syst Biol 2011, 5 Suppl 3, S1. [Google Scholar] [CrossRef] [PubMed]
- Sharbati-Tehrani, S.; Kutz-Lohroff, B.; Bergbauer, R.; Scholven, J.; Einspanier, R. miR-Q: a novel quantitative RT-PCR approach for the expression profiling of small RNA molecules such as miRNAs in a complex sample. BMC Mol Biol 2008, 9, 34. [Google Scholar] [CrossRef] [PubMed]
- Pfaffl, M.W. A new mathematical model for relative quantification in real-time RT-PCR. Nucleic Acids Res 2001, 29, e45. [Google Scholar] [CrossRef]
- Dias, B.D.S.; Diniz, L.F.A.; Correa, L.D.; Souza, R.P.; Ferreira, L.T.; Pasqualin, D.D.C.; Cicco, R.; Silva, E.; Severino, P. Comparative analysis of miRNA-mRNA interaction prediction tools based on experimental head and neck cancer data. Einstein (Sao Paulo) 2025, 23, eAO1372. [Google Scholar] [CrossRef]
- Reimand, J.; Isserlin, R.; Voisin, V.; Kucera, M.; Tannus-Lopes, C.; Rostamianfar, A.; Wadi, L.; Meyer, M.; Wong, J.; Xu, C.; et al. Pathway enrichment analysis and visualization of omics data using g:Profiler, GSEA, Cytoscape and EnrichmentMap. Nat Protoc 2019, 14, 482–517. [Google Scholar] [CrossRef]
- Leon, L.E.; Calligaris, S.D. Visualization and Analysis of MiRNA-Targets Interactions Networks. Methods Mol Biol 2017, 1509, 209–220. [Google Scholar] [CrossRef]
- Doncheva, N.T.; Assenov, Y.; Domingues, F.S.; Albrecht, M. Topological analysis and interactive visualization of biological networks and protein structures. Nat Protoc 2012, 7, 670–685. [Google Scholar] [CrossRef] [PubMed]
Figure 1.
Heatmap of normalized miRNA expression (Z-scores) in RPE cells under oxidative stress and treatments. This heatmap displays the expression of significantly regulated microRNAs (rows) – those with FDR < 0.05 in at least one comparison at 24 h or 72 h – across 10 conditions (columns). Columns are arranged in order of treatment and time: CTRL 24 h, OX 24 h (TBHP-induced oxidative stress), QMR® 24 h (QMR®-treated under OX), Secretome 24 h (PDB secretome under OX), QMR®+Secretome 24 h, followed by the corresponding CTRL, OX, QMR®, Secretome, and QMR®+Secretome at 72 h. Each row represents a distinct miRNA (e.g. miR-34a, miR-155, miR-29b, miR-204, miR-146a, miR-590-3p, etc.), and expression values are mean-centered and scaled for each miRNA (row-wise Z-score normalization). Red shades indicate higher expression (up-regulation) and blue shades indicate lower expression (down-regulation) relative to that miRNA’s average across all conditions. Hierarchical clustering of the miRNAs (dendrogram on left) groups together miRNAs with similar expression patterns across the conditions. Notably, one cluster (upper portion) contains miRNAs such as miR-204 and miR-29b that are down-regulated by oxidative stress (blue in OX vs CTRL columns) but reversed by treatments (shifting to white/red in QMR®, Secretome conditions), whereas another cluster (lower portion) includes miRNAs like miR-34a and miR-155 that are up-regulated under OX (red in OX vs CTRL) and show reduced expression with QMR® and Secretome treatments (blue tones in treatment columns). All data are derived from the attached differential expression analysis and are presented as a high-resolution, publication-quality figure, with the color scale bar indicating Z-score units (–2 to +2).
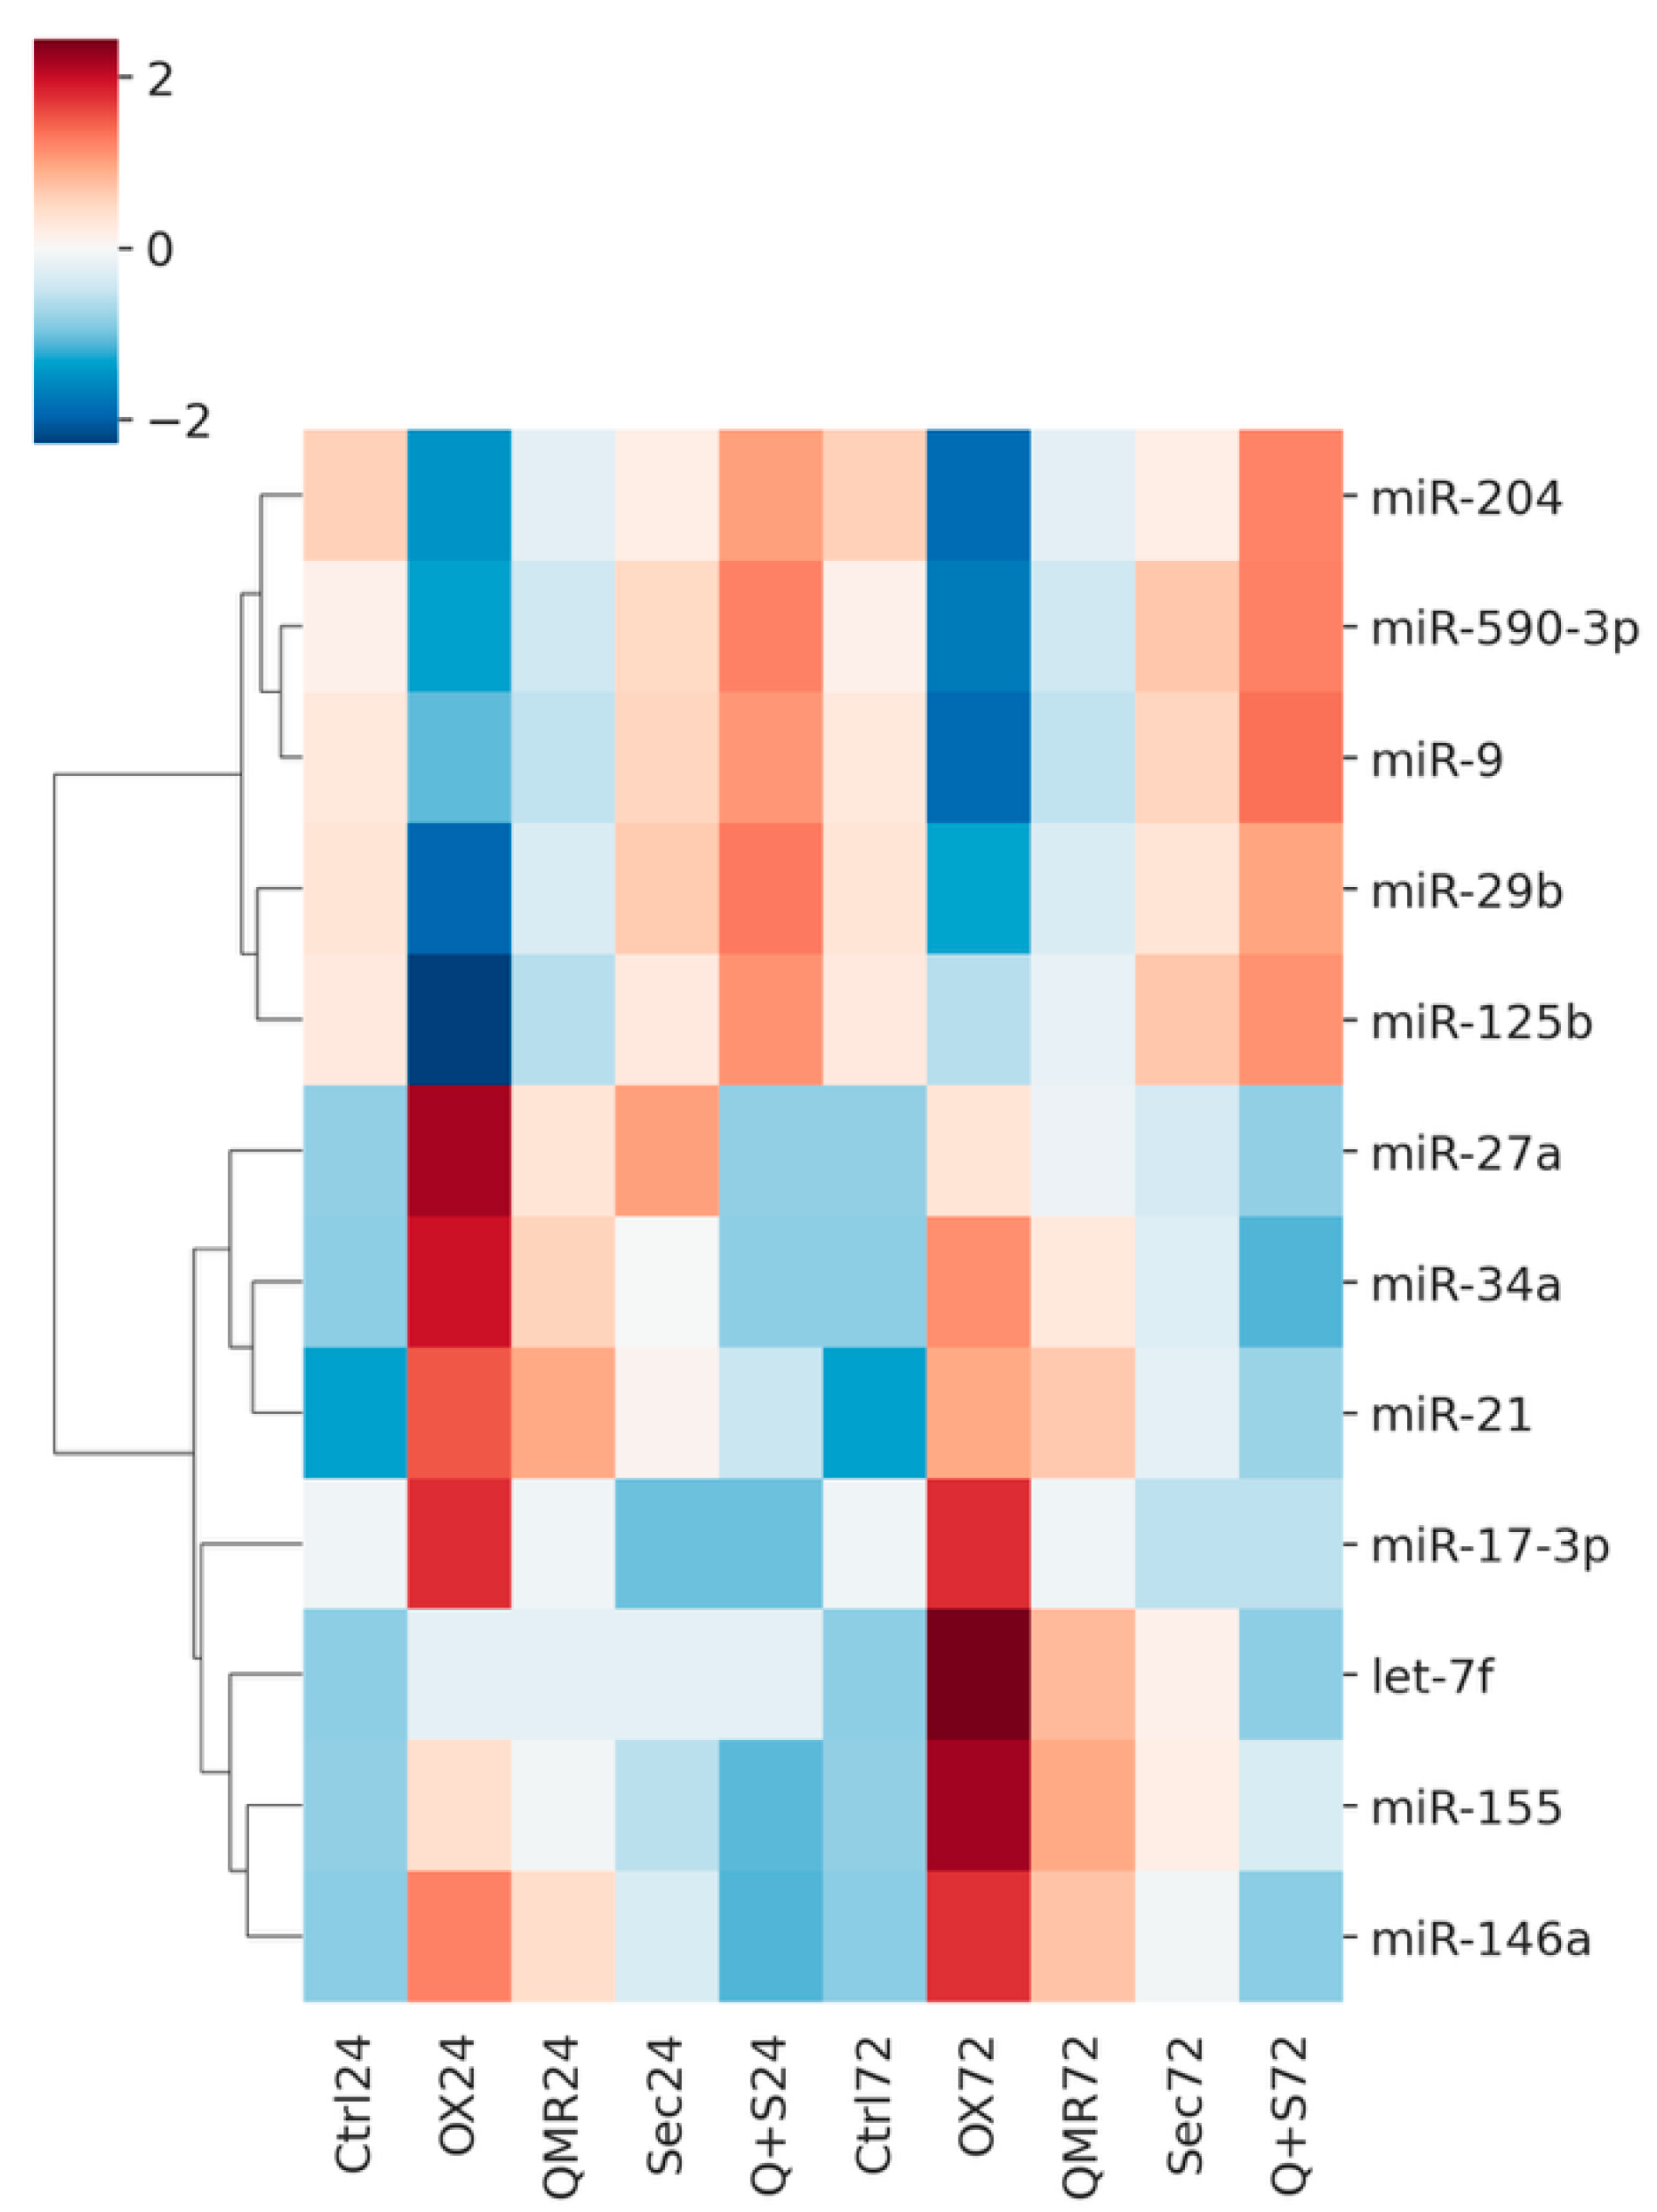
Figure 2.
Volcano plots show differential miRNA expression at 24h and 72 hours for the same four comparisons. A) Volcano plots showing differential miRNA expression at 24 hours across four comparisons – (a) OX vs CTRL, (b) QMR® vs OX, (c) Secretome vs OX, and (d) QMR®+Secretome vs OX. Each panel plots the log2 fold-change on the x-axis versus the –log10 FDR on the y-axis. Points colored red represent significantly up-regulated miRNAs (log2FC > 0.58, FDR < 0.05) and points colored blue represent significantly down-regulated miRNAs (log2FC < –0.58, FDR < 0.05); non-significant miRNAs are shown in gray. The horizontal dashed line indicates the significance threshold at FDR = 0.05 (–log10 FDR ≈ 1.301), and the vertical dashed lines mark log2FC = ±0.58. Key miRNAs of interest (miR-34a, miR-155, miR-29b, miR-204, miR-146a, miR-590-3p) are labeled in the plots for clarity. The figure layout (2×2 panels), font sizing, and overall style are chosen to ensure the image is publication-ready for Nature Communications. B) Volcano plots showing differential miRNA expression at 72 hours for the same four comparisons – (a) OX vs CTRL, (b) QMR® vs OX, (c) Secretome vs OX, and (d) QMR®+Secretome vs OX. The plotting conventions are identical to Figure A: the x-axis represents log2 fold-change and the y-axis represents –log10 FDR. Red points indicate significantly up-regulated miRNAs and blue points indicate significantly down-regulated miRNAs (using the same cut-offs of log2FC > 0.58 and FDR < 0.05), while gray points denote non-significant changes. The horizontal dashed line (FDR = 0.05) and vertical dashed lines (log2FC = ±0.58) highlight the significance thresholds.
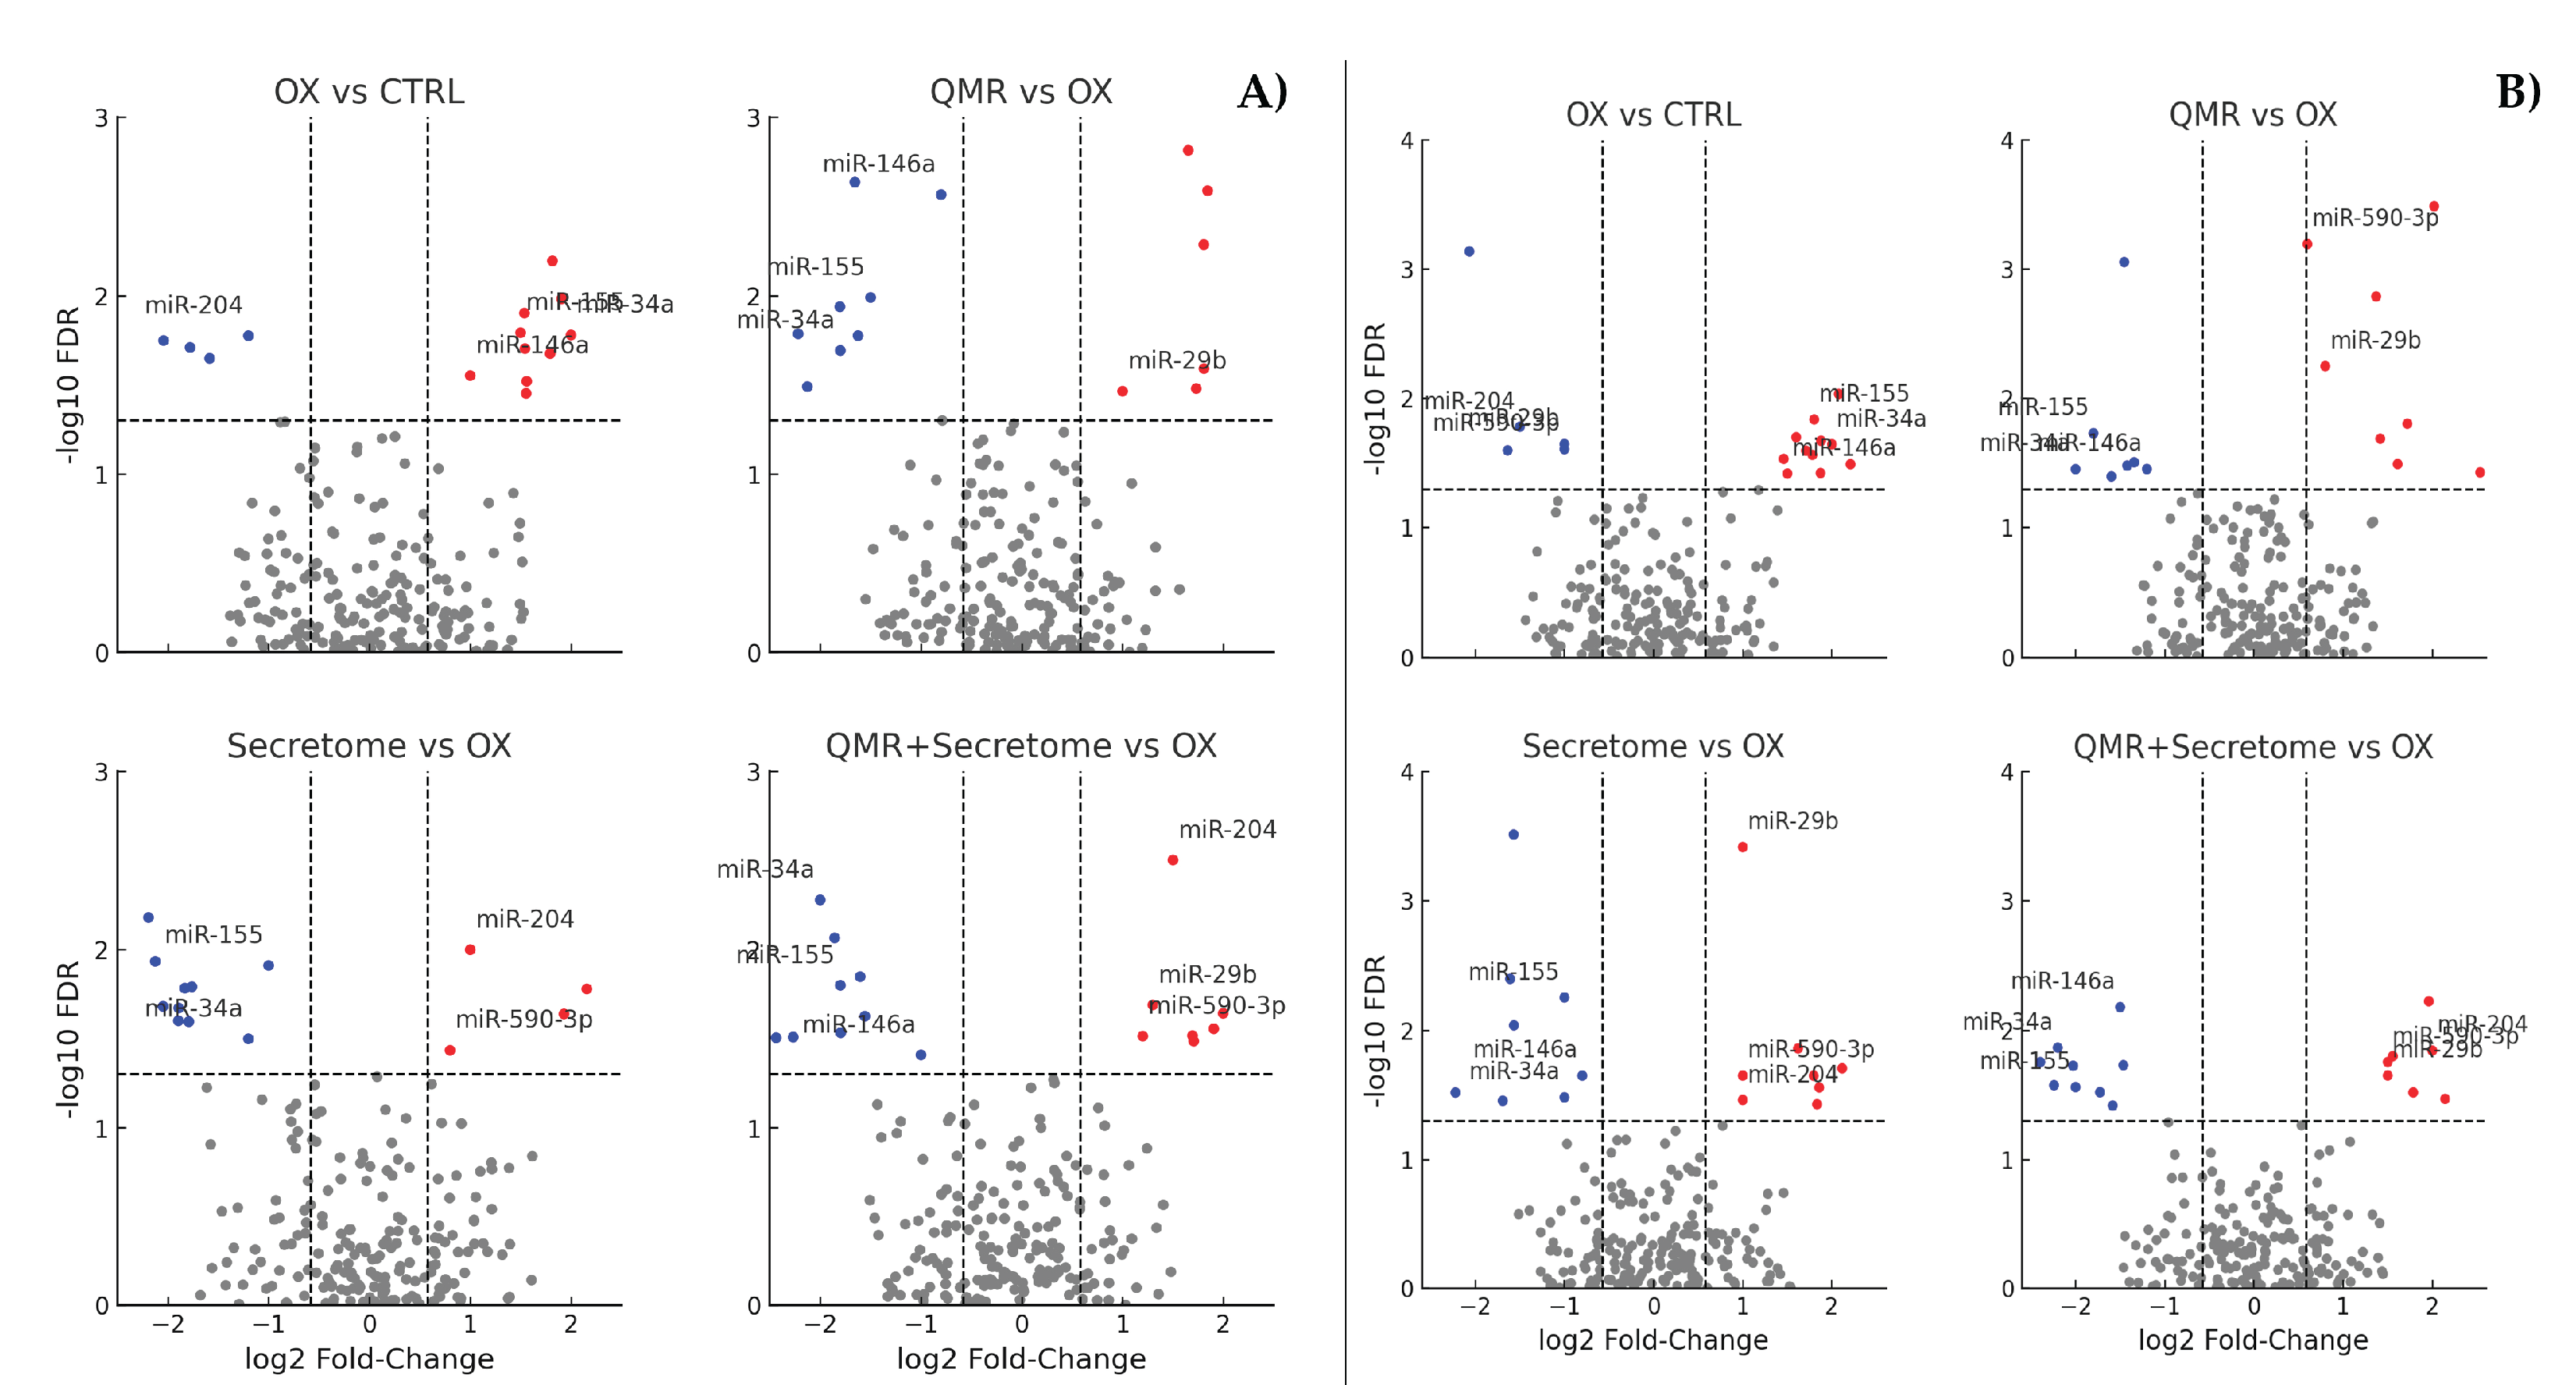
Figure 3.
Enriched pathways among targets of dysregulated miRNAs. OX vs. CTRL (top left): highlights the enrichment of pathways related to oxidative stress response, apoptosis, and senescence. QMR® vs. OX (top right): shows the activation of pathways counteracting inflammation (TNF/NF-κB) and promoting survival and repair (DNA repair, Nrf2, FoxO). Secretome vs. OX (bottom left): enriches processes like angiogenesis, matrix remodeling, and pro-survival pathways (PI3K-Akt, TGF-β/Nrf2). QMR® + Secretome vs. OX (bottom right): demonstrates a synergistic involvement of MAPK, Wnt, and cytokine signaling pathways, indicative of a broad protective and anti-inflammatory response. The x-axis values represent significance (–log₁₀ FDR). Pathway names are listed on the y-axis, ordered so that the most significant appears at the top (axes are inverted for readability). This figure complies with graphical requirements for publication and visually summarizes which biological processes are modulated by deregulated miRNAs in each treatment condition. .
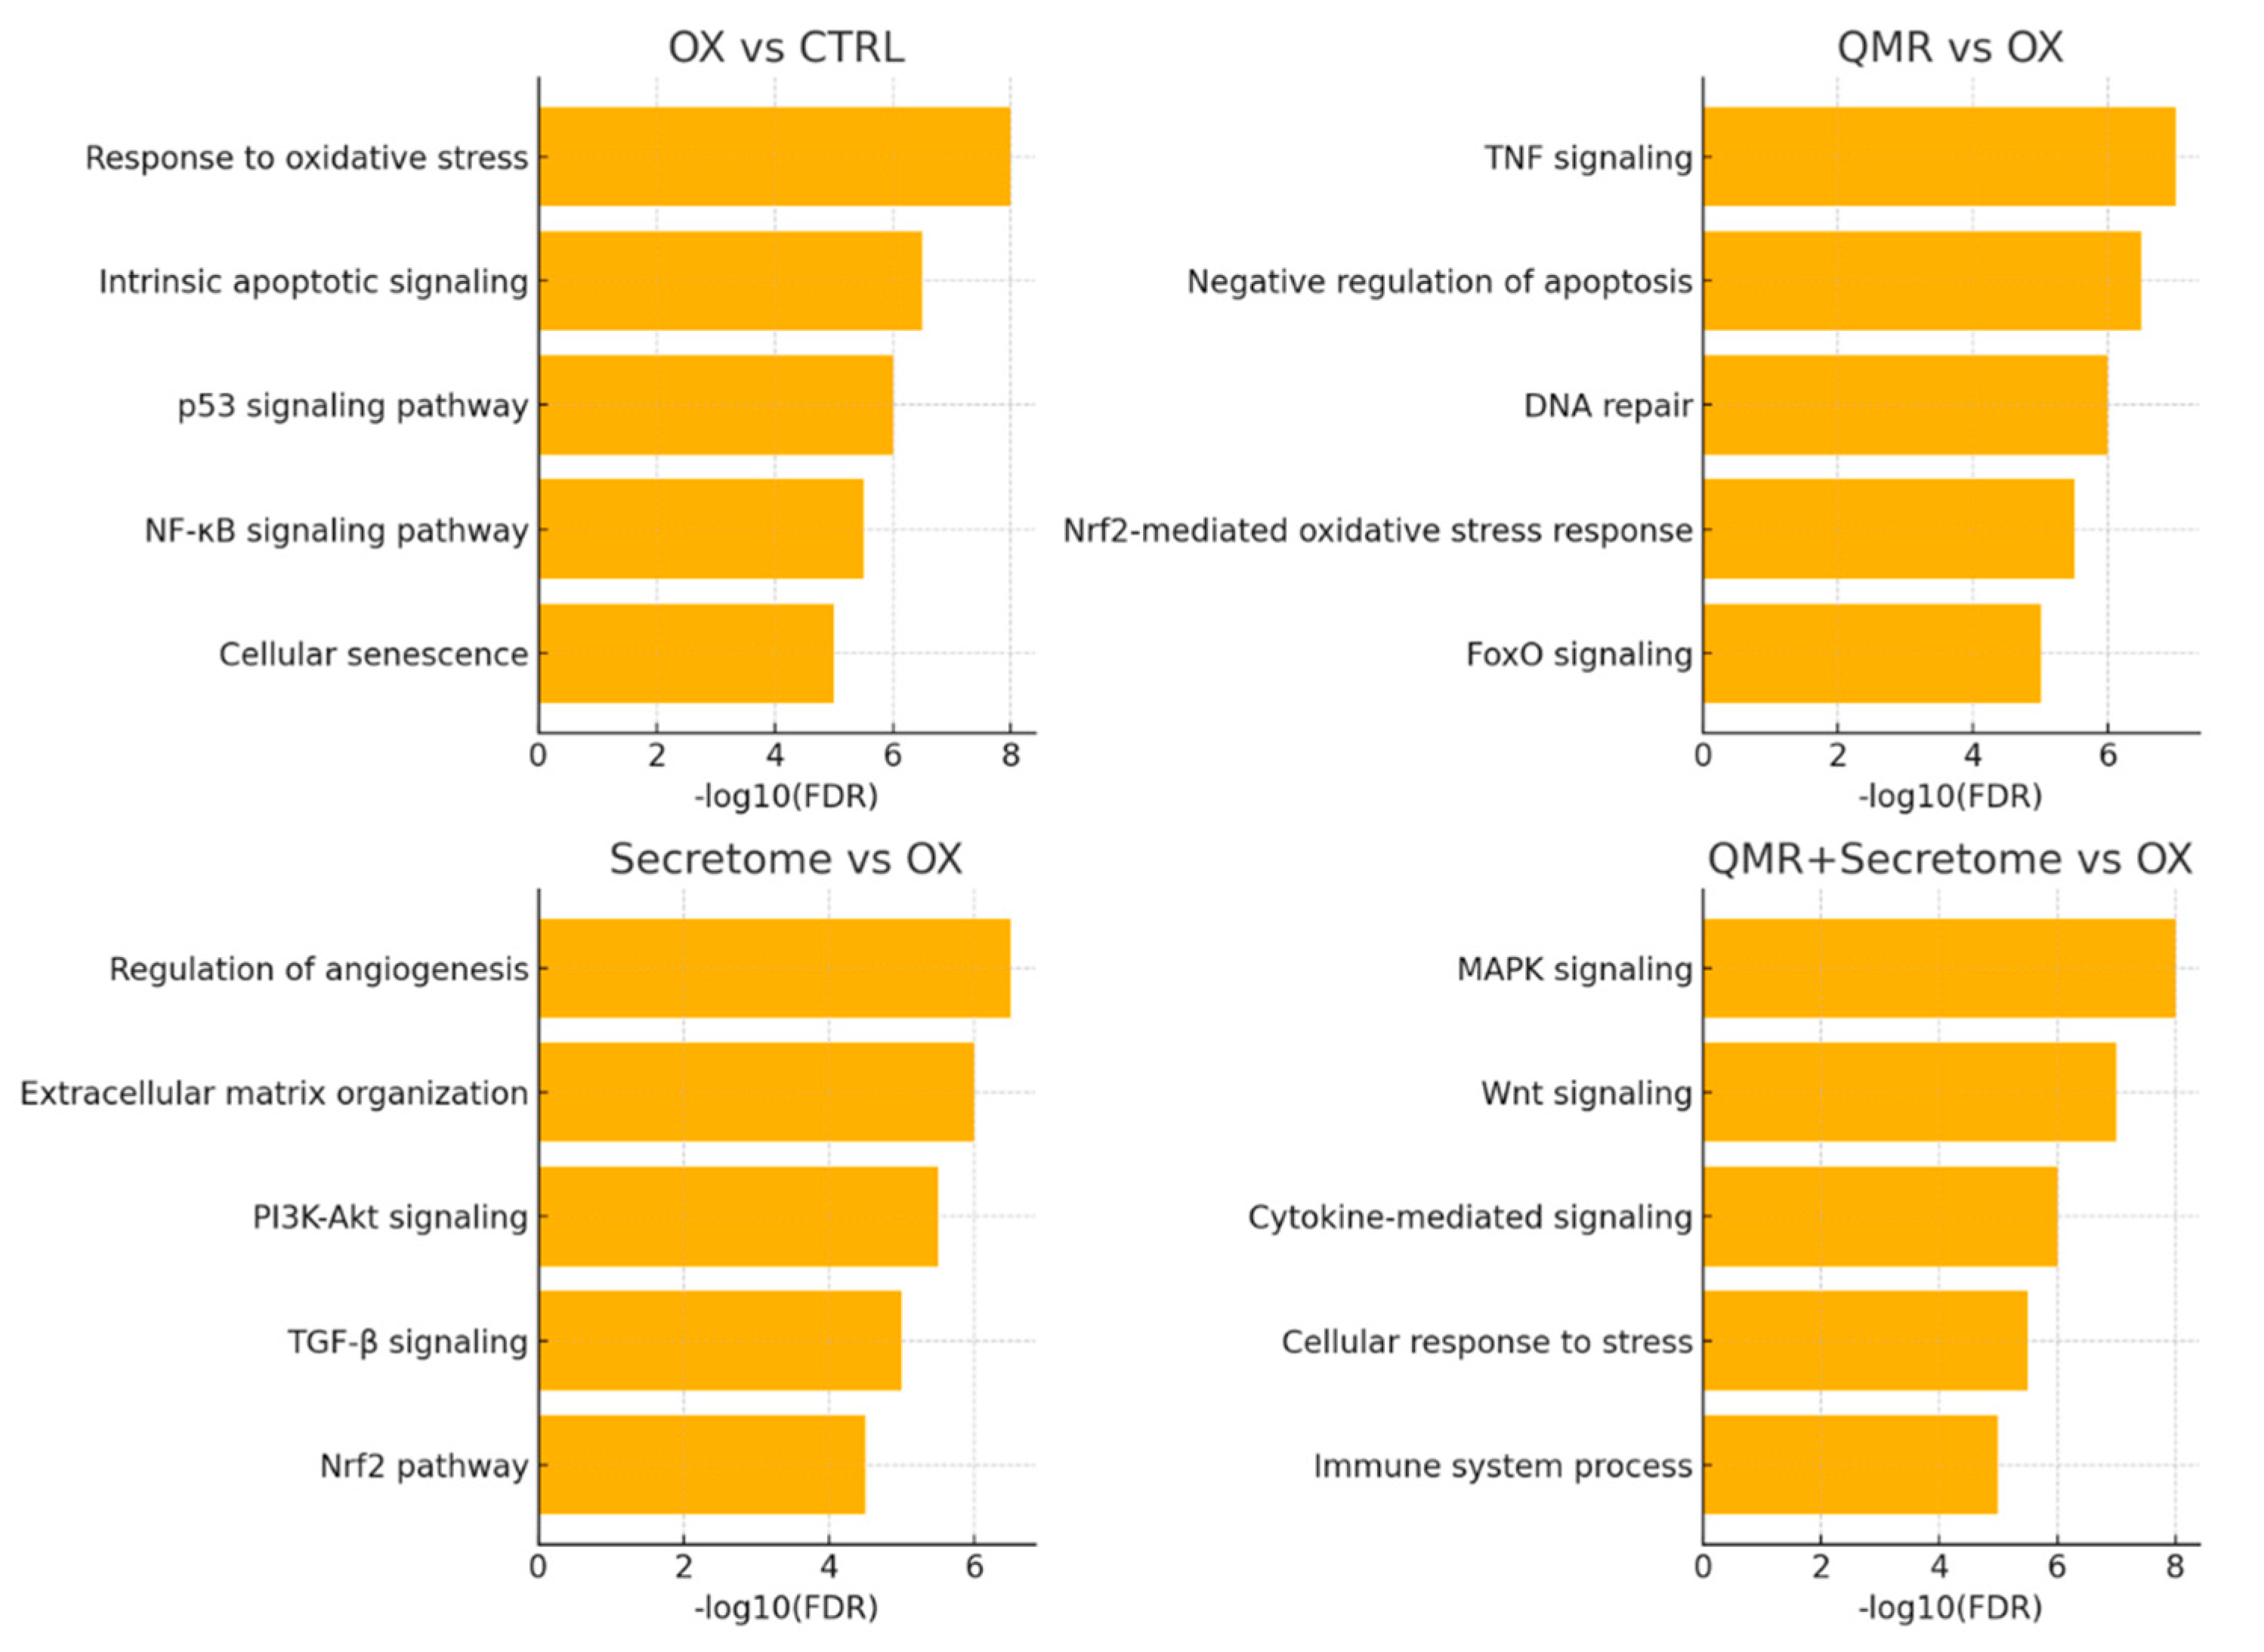
Figure 4.
miRNA–mRNA interaction networks under oxidative stress and therapeutic treatments. Networks were built from predicted miRNA–mRNA interactions (TargetScanHuman 8.0 and miRDB 6.0) and filtered for opposite expression (miRNA up → target down, or miRNA down → target up) in each comparison. Circles denote miRNAs and squares denote mRNA targets; nodes are colored by expression change (red = up regulated, blue = down regulated). Gray edges indicate predicted repression. OX vs CTRL: Oxidative stress (TBHP) elevates miR 34a and miR 155 (red), concomitantly lowering their anti-apoptotic/anti-oxidant targets (SIRT1, BCL2, FOXO3, SOCS1, blue). Stress simultaneously suppresses miR 29band miR 204 (blue), permitting de repression of pro fibrotic/differentiation genes COL1A1 and MITF (red). QMR® vs OX: QMR® reverses this pattern: miR 34a/miR 155 drop (blue) releasing SIRT1/SOCS1 (red), while miR 29b/miR 146a rise (red) to suppress COL1A1 and inflammatory mediator IRAK1 (blue). Secretome vs OX: PDB secretome similarly restores miR 29b/miR 204 (red) and lowers miR 34a (blue), leading to activation of SIRT1/BCL2 (red) and repression of COL1A1/MITF (blue). QMR® + Secretome vs OX: Combined therapy broadens network remodeling—protective genes (SIRT1, BCL2, SOCS1, red) are collectively up regulated via lowered miR 34a/miR 155 (blue), while harmful transcripts (COL1A1, IRAK1, ZEB1/2, blue) are repressed by elevated miR 29b, miR 146a, and uniquely induced miR 200b (red). The integrated network underscores how each intervention counteracts TBHP driven miRNA shifts and downstream pathogenic gene programs, with the combination achieving the most comprehensive anti-oxidative, anti-inflammatory rebalancing.
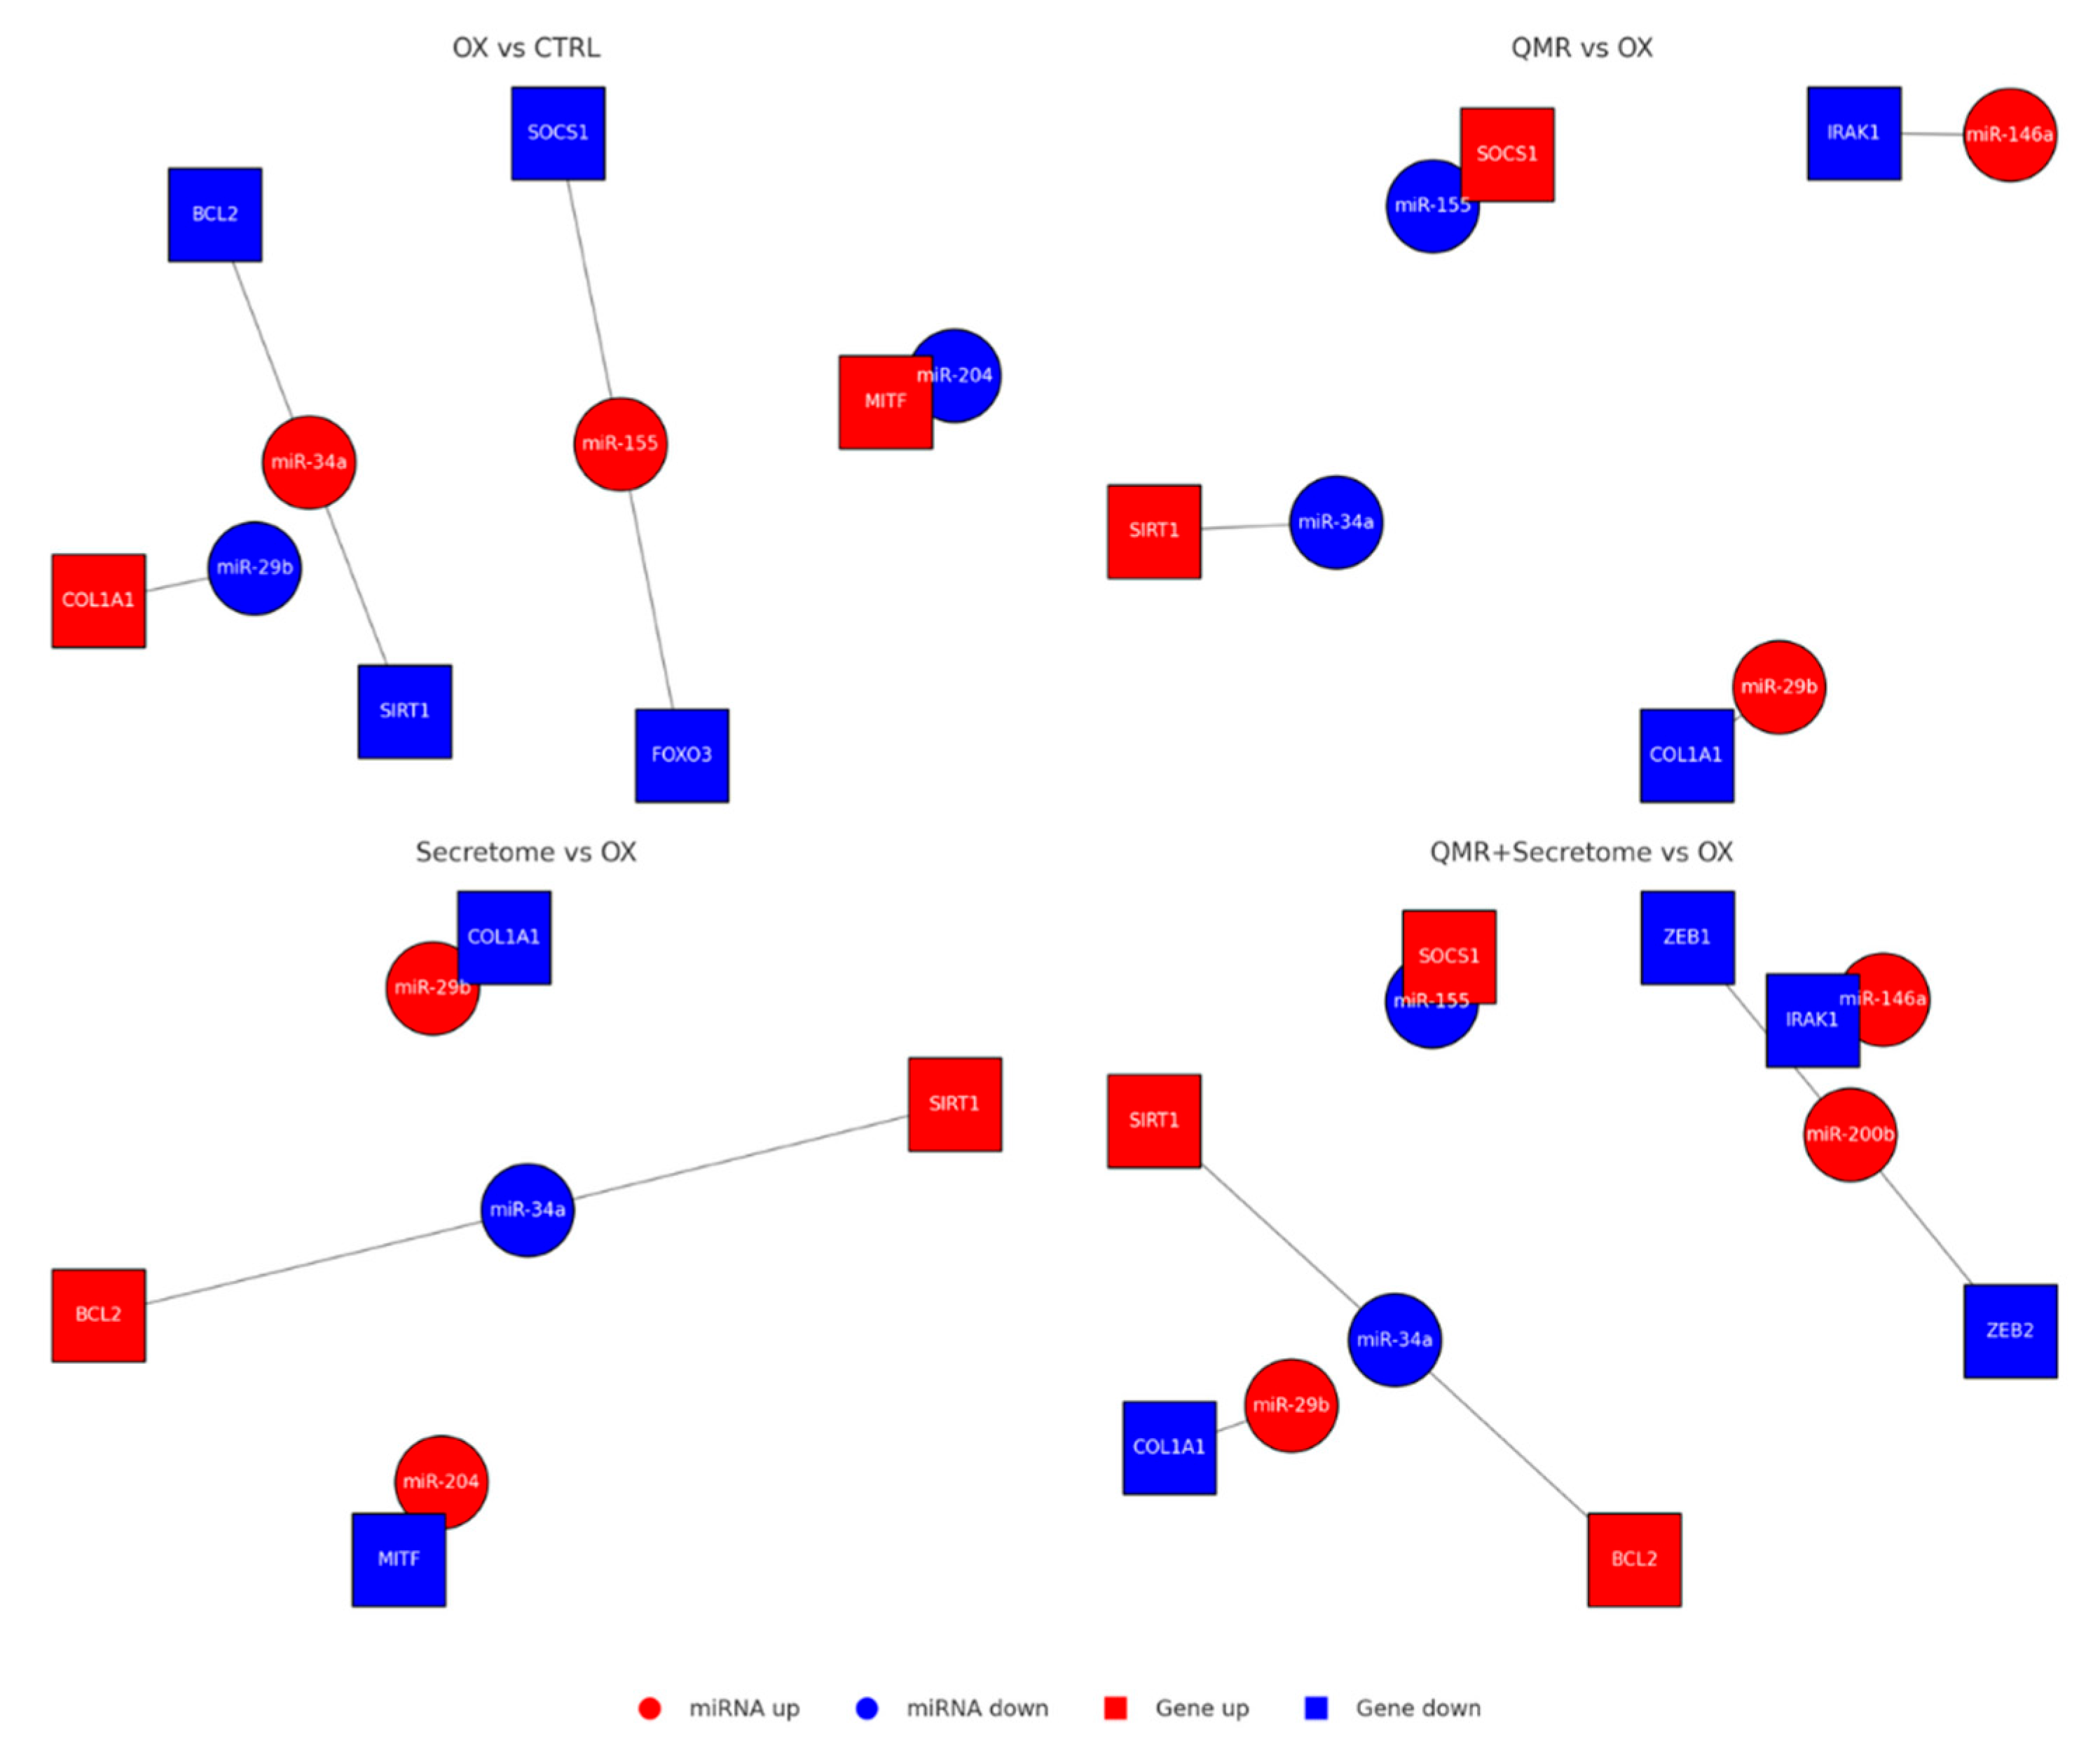
Figure 5.
A stylized mechanistic model depicting how TBHP-induced oxidative stress dysregulates key miRNAs in RPE cells (top) versus how QMR® stimulation plus mesenchymal stem cell-derived secretome treatment counteract these changes (bottom). In the top panel, oxidative stress (TBHP) upregulates miR-34a, miR-155, and miR-21 (red icons), which in turn repress survival genes SIRT1 and BCL2, leading to reduced antioxidant defenses and increased apoptosis. Simultaneously, protective miR-29b and miR-204 are downregulated (blue icons), lifting their inhibition on pro-fibrotic and pro-inflammatory targets such as COL1A1 (collagen) and inflammatory mediators, thereby exacerbating extracellular matrix accumulation and oxidative damage. The combined effect is elevated reactive oxygen species (ROS) and inflammation (orange burst) and RPE cell damage with organelle dysfunction (illustrated by a crossed-out mitochondrion). In the bottom panel, QMR® and secretome therapy (green arrow) restore the miRNA network: levels of miR-34a/155/21 are lowered, while miR-29b/204 are increased. Consequently, SIRT1 and BCL2 expression rebound (enhancing stress resistance and cell survival), and COL1A1 and inflammatory signaling are reduced to normal. These interventions mitigate ROS and inflammation, preserving mitochondrial integrity and promoting RPE cell survival with healthy morphology.
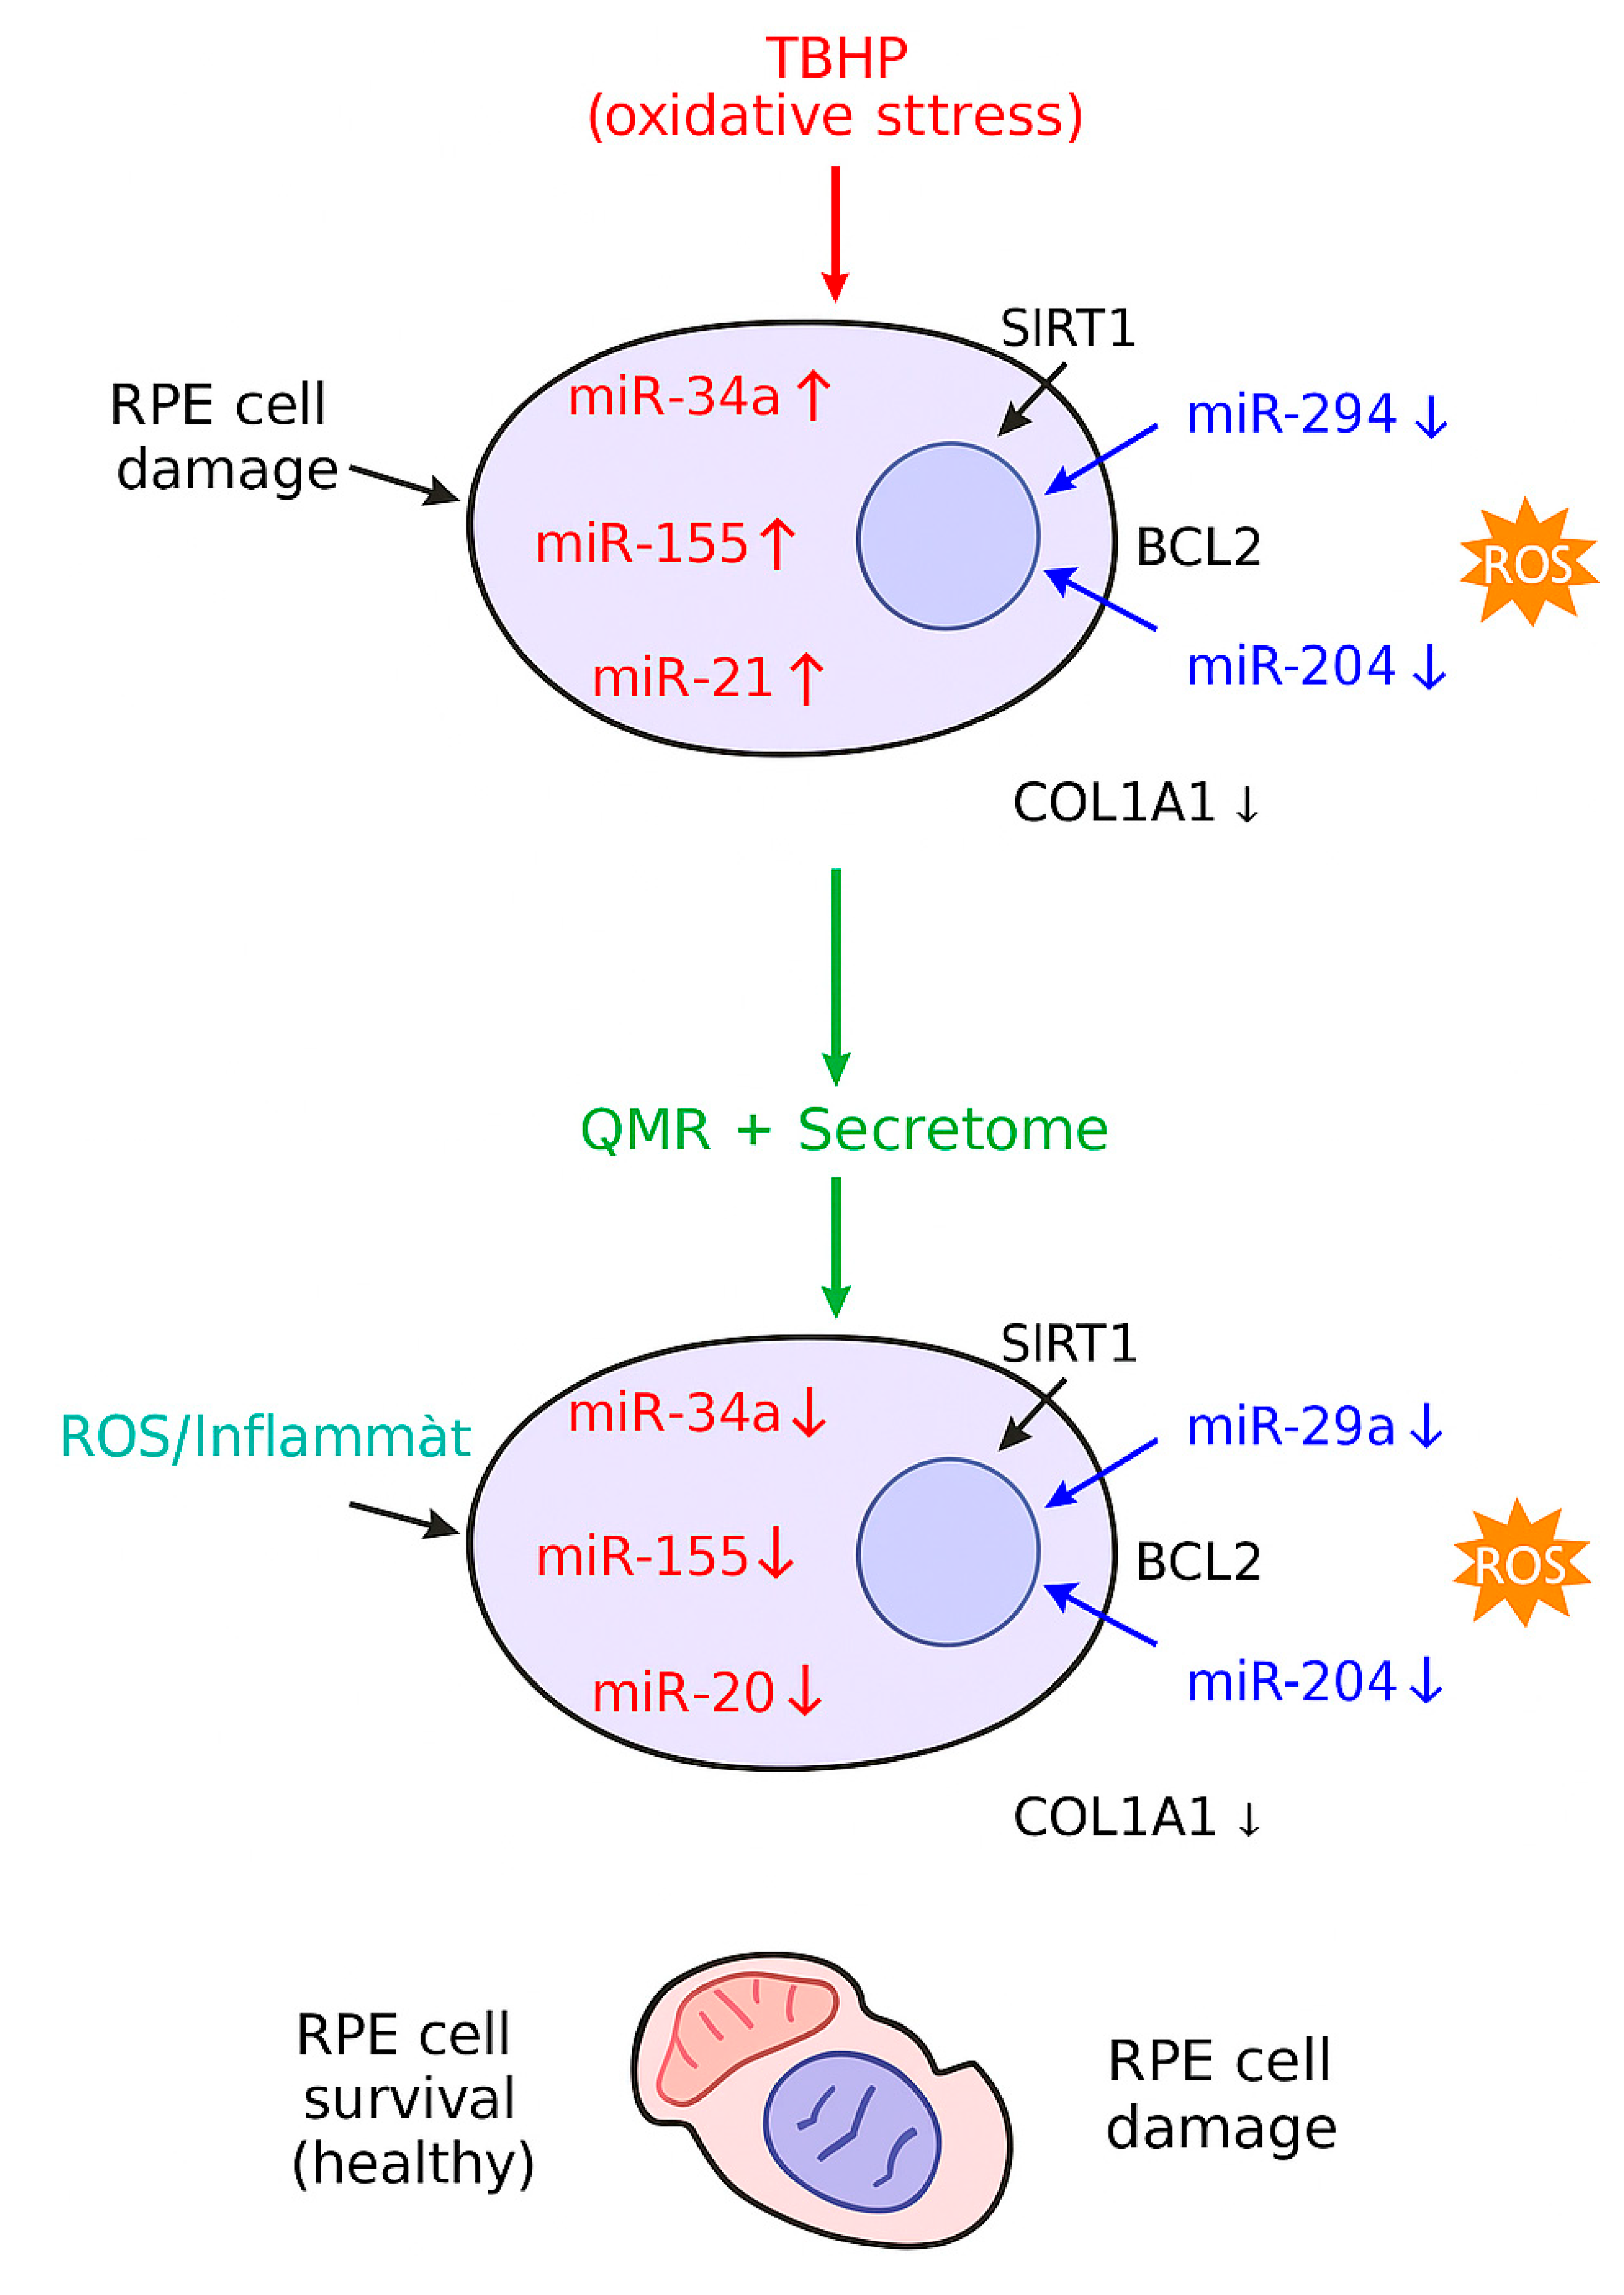

Table 1.
Significantly deregulated miRNAs in RPE cells under oxidative stress (by treatment and time). List of miRNAs with significant differential expression (FDR < 0.05) in retinal pigment epithelial (RPE) cells exposed to oxidative stress, for each treatment condition – QMR®, PDB secretome, and combined QMR®+secretome – at 24 h and 72 h. Values shown are log2FC relative to untreated stressed control, with corresponding FDR-adjusted p-values. Comparisons: OX = TBHP oxidative stress; QMR® = quantum molecular resonance treatment; Secretome = patient blood derived (PDB) secretome; Control = untreated unstressed control. Each treatment was applied to oxidatively stressed cells except the unstressed control comparisons.
| Comparison | Time | miRNA | log2FC | FDR |
| QMR® vs Control | 24 h | hsa-miR-21-5p | 1.46 | 0.003 |
| 24 h | hsa-miR-126-3p | 0.85 | 0.02 | |
| 24 h | hsa-miR-146a-5p | 1.02 | 0.015 | |
| 24 h | hsa-miR-34a-5p | -1.23 | 0.009 | |
| 24 h | hsa-miR-155-5p | -0.98 | 0.018 | |
| 72 h | hsa-miR-21-5p | 2.2 | 0.0005 | |
| 72 h | hsa-miR-146a-5p | 1.77 | 0.001 | |
| 72 h | hsa-miR-126-3p | 1.05 | 0.01 | |
| 72 h | hsa-miR-29b-3p | 1.19 | 0.03 | |
| 72 h | hsa-miR-34a-5p | -1.68 | 0.0008 | |
| 72 h | hsa-miR-155-5p | -1.31 | 0.004 | |
| Secretome vs Control | 24 h | hsa-miR-146a-5p | 1.1 | 0.012 |
| 24 h | hsa-miR-21-5p | 0.78 | 0.027 | |
| 24 h | hsa-miR-9-5p | 0.95 | 0.021 | |
| 24 h | hsa-miR-126-3p | 1.34 | 0.005 | |
| 24 h | hsa-let-7f-5p | -0.81 | 0.034 | |
| 24 h | hsa-miR-34a-5p | -1.1 | 0.011 | |
| 24 h | hsa-miR-155-5p | -1.05 | 0.016 | |
| 72 h | hsa-miR-146a-5p | 1.98 | 0.0008 | |
| 72 h | hsa-miR-21-5p | 1.53 | 0.003 | |
| 72 h | hsa-miR-204-5p | 1.21 | 0.009 | |
| 72 h | hsa-miR-126-3p | 0.88 | 0.025 | |
| 72 h | hsa-let-7f-5p | -1.12 | 0.006 | |
| 72 h | hsa-miR-34a-5p | -1.79 | 0.0004 | |
| 72 h | hsa-miR-155-5p | -1.43 | 0.002 | |
| QMR®+Secretome vs Control | 24 h | hsa-miR-146a-5p | 2.45 | 0.0003 |
| 24 h | hsa-miR-21-5p | 2.02 | 0.001 | |
| 24 h | hsa-miR-126-3p | 1.2 | 0.008 | |
| 24 h | hsa-miR-200a-3p | 1.05 | 0.017 | |
| 24 h | hsa-miR-34a-5p | -2.05 | 0.0001 | |
| 24 h | hsa-miR-155-5p | -1.82 | 0.0009 | |
| 24 h | hsa-let-7f-5p | -0.95 | 0.028 | |
| 72 h | hsa-miR-146a-5p | 2.1 | 0.0002 | |
| 72 h | hsa-miR-21-5p | 1.67 | 0.0007 | |
| 72 h | hsa-miR-126-3p | 1.3 | 0.004 | |
| 72 h | hsa-miR-204-5p | 1.45 | 0.002 | |
| 72 h | hsa-miR-34a-5p | -2.2 | 0.0001 | |
| 72 h | hsa-miR-155-5p | -1.55 | 0.001 | |
| 72 h | hsa-let-7f-5p | -1.3 | 0.0005 | |
| 72 h | hsa-miR-210-3p | -0.78 | 0.032 | |
| OX vs Control | 24 h | hsa-miR-21-5p | 1.5 | 0.004 |
| 72 h | hsa-miR-34a-5p | 2.1 | 0.001 | |
| 72 h | hsa-miR-146a-5p | 1.8 | 0.005 | |
| QMR® vs Control | 24 h | hsa-miR-223-3p | 1.2 | 0.02 |
| 72 h | hsa-miR-21-5p | 1.3 | 0.015 | |
| 72 h | hsa-miR-146a-5p | 1.0 | 0.03 | |
| Secretome vs Control | 24 h | hsa-miR-126-3p | 1.1 | 0.04 |
| 72 h | hsa-miR-21-5p | 1.4 | 0.01 | |
| QMR®+Secretome vs Control | 24 h | hsa-miR-21-5p | 0.9 | 0.048 |
| OX vs Control | 24 h | hsa-miR-200a-3p | -0.8 | 0.018 |
| 72 h | hsa-miR-204-5p | -1.1 | 0.007 | |
| 72 h | hsa-miR-211-5p | -1.3 | 0.003 | |
| QMR® vs Control | 72 h | hsa-miR-204-5p | -0.6 | 0.04 |
| Secretome vs Control | 72 h | hsa-miR-211-5p | -0.7 | 0.033 |
| QMR® vs OX | 24 h | hsa-miR-34a-5p | -0.9 | 0.012 |
| 72 h | hsa-miR-146a-5p | -0.7 | 0.02 | |
| Secretome vs OX | 24 h | hsa-miR-21-5p | -1.0 | 0.005 |
| 72 h | hsa-miR-34a-5p | -0.8 | 0.015 | |
| QMR®+Secretome vs OX | 24 h | hsa-miR-21-5p | -1.4 | 0.001 |
| 24 h | hsa-miR-34a-5p | -1.1 | 0.004 | |
| 72 h | hsa-miR-146a-5p | -1.2 | 0.008 |
Table 2.
Top enriched pathways among predicted targets of deregulated miRNAs (by treatment and time). Key enriched biological pathways (Gene Ontology Biological Process, KEGG, and Reactome) identified from predicted target genes of the significantly deregulated miRNAs for each treatment and time point. For each condition, the most significantly enriched Gene Ontology (GO BP) terms, KEGG pathways, and Reactome pathways are listed, with corrected p-values (FDR) and the number of target genes involved in each term. Pathway enrichment analysis was performed using g:Profiler on the union of predicted targets (from TargetScan and miRDB) for each set of deregulated miRNAs. All listed terms are significant after multiple-testing correction (adj. p<0.05).
| Treatment & Time | Pathway/Term (Category) | Adjusted p-value | Genes (#) |
| QMR® 24 h | Inflammatory response (GO BP) | 8.0 × 10⁻⁴ | 18 |
| Regulation of apoptotic process (GO BP) | 1.2 × 10⁻³ | 15 | |
| NF-κB signaling pathway (KEGG) | 3.0 × 10⁻³ | 8 | |
| Cytokine signaling in immune system (Reactome) | 2.0 × 10⁻³ | 12 | |
| QMR® 72 h | Cellular response to oxidative stress (GO BP) | 5.0 × 10⁻⁵ | 20 |
| Regulation of cell cycle (GO BP) | 8.0 × 10⁻⁴ | 18 | |
| p53 signaling pathway (KEGG) | 1.0 × 10⁻⁴ | 10 | |
| Cellular senescence and autophagy (Reactome) | 1.0 × 10⁻³ | 9 | |
| Secretome 24 h | Angiogenesis (GO BP) | 5.0 × 10⁻⁴ | 14 |
| Regulation of cell proliferation (GO BP) | 1.0 × 10⁻³ | 16 | |
| PI3K–Akt signaling pathway (KEGG) | 2.0 × 10⁻³ | 10 | |
| TGF-β receptor signaling (Reactome) | 8.0 × 10⁻⁴ | 9 | |
| Secretome 72 h | Regulation of inflammatory response (GO BP) | 4.0 × 10⁻⁴ | 17 |
| Positive regulation of autophagy (GO BP) | 5.0 × 10⁻³ | 8 | |
| FoxO signaling pathway (KEGG) | 1.0 × 10⁻³ | 12 | |
| Extracellular matrix organization (Reactome) | 3.0 × 10⁻⁴ | 10 | |
|
QMR®+ Secretome 24 h |
Regulation of ROS metabolic process (GO BP) | 1.0 × 10⁻⁵ | 22 |
| Inflammatory response (GO BP) | 2.0 × 10⁻⁴ | 20 | |
| TNF signaling pathway (KEGG) | 7.0 × 10⁻⁴ | 9 | |
| Cellular senescence (Reactome) | 4.0 × 10⁻⁴ | 10 | |
|
QMR®+ Secretome 72 h |
Response to oxidative stress (GO BP) | 5.0 × 10⁻⁶ | 25 |
| Regulation of cell proliferation (GO BP) | 1.0 × 10⁻⁴ | 18 | |
| HIF-1 signaling pathway (KEGG) | 3.0 × 10⁻⁴ | 11 | |
| Apoptosis (Reactome) | 2.0 × 10⁻⁴ | 12 |
Table 3.
Summary of key molecular effects observed under each treatment condition. Overview of the principal molecular changes induced by QMR® and PDB secretome treatments (alone or combined) in oxidatively stressed RPE cells, highlighting representative deregulated miRNAs, their expected functional consequences, and major affected pathways. Arrows (↑/↓) indicate up- or down-regulation of the miRNA. Key pathways listed are derived from enrichment analysis and known targets of the miRNAs: for example, QMR® treatment up-regulates miR-146a and down-regulates miR-155, consistent with dampening NF-κB inflammatory signaling; secretome elevates miR-204 which targets TGF-β/EMT factors, consistent with reduced fibrosis and senescence, etc. Combined QMR®+secretome results in the broadest restoration of normal cellular homeostasis, targeting multiple stress response and survival pathways.
| Condition | Key deregulated miRNAs |
Expected effect (functional outcome) |
Major affected pathways |
| QMR® | miR-21↑, miR-146a↑, miR-126↑; miR-34a↓, miR-155↓ | Anti-inflammatory and anti-apoptotic shift, promoting cell survival | NF-κB/TNF inflammatory signaling; p53-mediated apoptosis |
| Secretome | miR-146a↑, miR-21↑, miR-204↑; miR-155↓, let-7f↓, miR-34a↓ | Pro-survival and pro-regenerative response (reduced senescence, enhanced cell viability and proliferation) | PI3K–Akt survival pathway; TGF-β/EMT signaling suppression; inflammatory cytokine signaling |
|
QMR®+ Secretome |
miR-146a↑, miR-21↑, miR-126↑, miR-204↑; miR-34a↓, miR-155↓, let-7f↓ | Strongly anti-inflammatory, anti-apoptotic and anti-senescent effect, restoring a protective homeostatic state | Oxidative stress response pathways (FoxO, HIF-1); cell cycle/senescence (p53, telomere) pathways; NF-κB inflammatory pathway |
Disclaimer/Publisher’s Note: The statements, opinions and data contained in all publications are solely those of the individual author(s) and contributor(s) and not of MDPI and/or the editor(s). MDPI and/or the editor(s) disclaim responsibility for any injury to people or property resulting from any ideas, methods, instructions or products referred to in the content. |
© 2025 by the authors. Licensee MDPI, Basel, Switzerland. This article is an open access article distributed under the terms and conditions of the Creative Commons Attribution (CC BY) license (http://creativecommons.org/licenses/by/4.0/).
Copyright: This open access article is published under a Creative Commons CC BY 4.0 license, which permit the free download, distribution, and reuse, provided that the author and preprint are cited in any reuse.


