
Submitted:
22 August 2025
Posted:
27 August 2025
You are already at the latest version
Abstract
(1) Background: We explore the pharmacology of the P-glycoprotein (P-gp) efflux pump and its role in multidrug resistance; (2) Methods: We use Protein Data Bank (PDB) database mining and an artificial intelligence (AI) model Boltz-2.1.1 developed for simultaneous structure and affinity prediction to explore the multimeric nature of recent P-gp inhibitors. We construct a MARTINI coarse-grain (CG) force field description of P-gp embedded in a model of the endothelial blood-brain barrier; (3) Results: We found that recent P-gp inhibitors have been captured in either monomeric, dimeric or trimeric states. Our CG model demonstrates the ability of P-gp substrates to permeate and transition across the BBB bilayer; (4) Conclusions: We report a multimodal binding model of P-gp inhibition, in which later generations of inhibitors are found in dimeric and trimeric states. We report analysis of P-gp substrates which point to an extended binding surface that explains how P-gp can bind over 300 substrates non-selectively. Our coarse-grain model of substrate permeation into P-gp shows benchmarking similarities to prior atomistic models and provide new insights at far longer timescales.
Keywords:
blood-brain barrier
; efflux pumps
; P-glycoprotein
; molecular dynamics
; cryo-EM
; substrates
; inhibitors
1. Introduction
The blood–brain barrier (BBB), formed primarily by brain microvascular endothelial cells (BMECs) and surrounded by mural cells and astrocytic end-feet, regulates the transport of nutrients, molecules, and cells into and out of the brain. BMECs form tight junctions to restrict paracellular transport, while various transporters and efflux pumps facilitate and regulate transcellular transport [1]. Despite its protective function, the BBB poses a significant obstacle to the treatment of many central nervous system (CNS) disorders by limiting drug delivery to the brain.
A major contributor to this limited permeability is P-glycoprotein (P-gp; Figure 1.a), an ATP binding cassette (ABC) transporter associated with multidrug resistance (MDR) [2]. Polarized to the luminal surface of BMECs, P-gp functions as an ATP-dependent efflux pump that transports substrates back into circulation that have passively diffused into the cells [3]. Efflux pumps like P-gp act as a secondary line of protection for the brain and have numerous molecular substrates, contributing to multidrug resistance (MDR). Enhancing CNS drug delivery thus requires strategies that either inhibit P-gp-mediated efflux or MDR. Although over 300 compounds have been identified as potential P-gp substrates [4], no strategy has yet proven successful in clinically inhibiting P-gp [5], underscoring the need for deeper mechanistic understanding.
P-gp is a ~170 kDa protein composed of two pseudo-symmetric halves, that span two transmembrane domains (TMDs) and two nucleotide-binding domain (NBDs) (Figure 1.a). Each TMD is made up of 6 transmembrane helices. During the efflux cycle, P-gp adopts two distinct conformations: an inward-facing state, which opens intracellularly, and an outward-facing state, which opens extracellularly. In the inward-facing state, the protein forms an inverted V-shape, where the two structural halves delineate an inner cavity through which substrates gain access to the transporter core. For efflux back into circulation (Figure 1.b), substrates must access this inner volume [6]. The aperture angle of the protein (θ) is defined by the spacing (d) between the NBDs at the ends of each arm and both the aperture angle and NBD spacing change during efflux as conformational rearrangements occur. Structural studies have reported that the NBD spacing in the inward-facing state ranges from 40 to 60 Å [7,8,9,10], though a recent study of human P-gp reported a narrower spacing of approximately 30 Å [10]. Reviews of P-gp structures have highlighted significant heterogeneity, including discrepancies between aperture angles observed in cryo electron microscopy (cryo-EM) structures and those derived from X-ray crystallography [6]. Recently, there have been a variety of new X-ray and cryo-EM structures of P-gp substrates. A lot of work has gone into understanding the conformational transitions of P-gp [11,12,13,14,15,16,17,18], which we will not cover in this work.
In vitro and in vivo studies of P-gp function offer an avenue to understanding P-gp efflux kinetics and the influence of P-gp on Caco-2 cell permeability [1,19,20,21,22]. However, these methods are often limited in their ability to offer up mechanistic insight into the steps associated with efflux. To address this limitation, molecular dynamics (MD) simulations are increasingly employed to probe conformational transitions and substrate interactions beyond the reach of current experimental techniques.
In this study, we use PDB database mining, AI tools and a coarse-grain model to glean novel insights into the the binding of both inhibitors and substrates of P-gp. We propose a multimodal binding model for P-gp inhibition that holds the promise of better understanding the complex problem of P-gp inhibition for preventing multidrug resistance.
2. Results
2.1. P-Gp Inhibitor Pharmacology: Multimodality of Inhibition
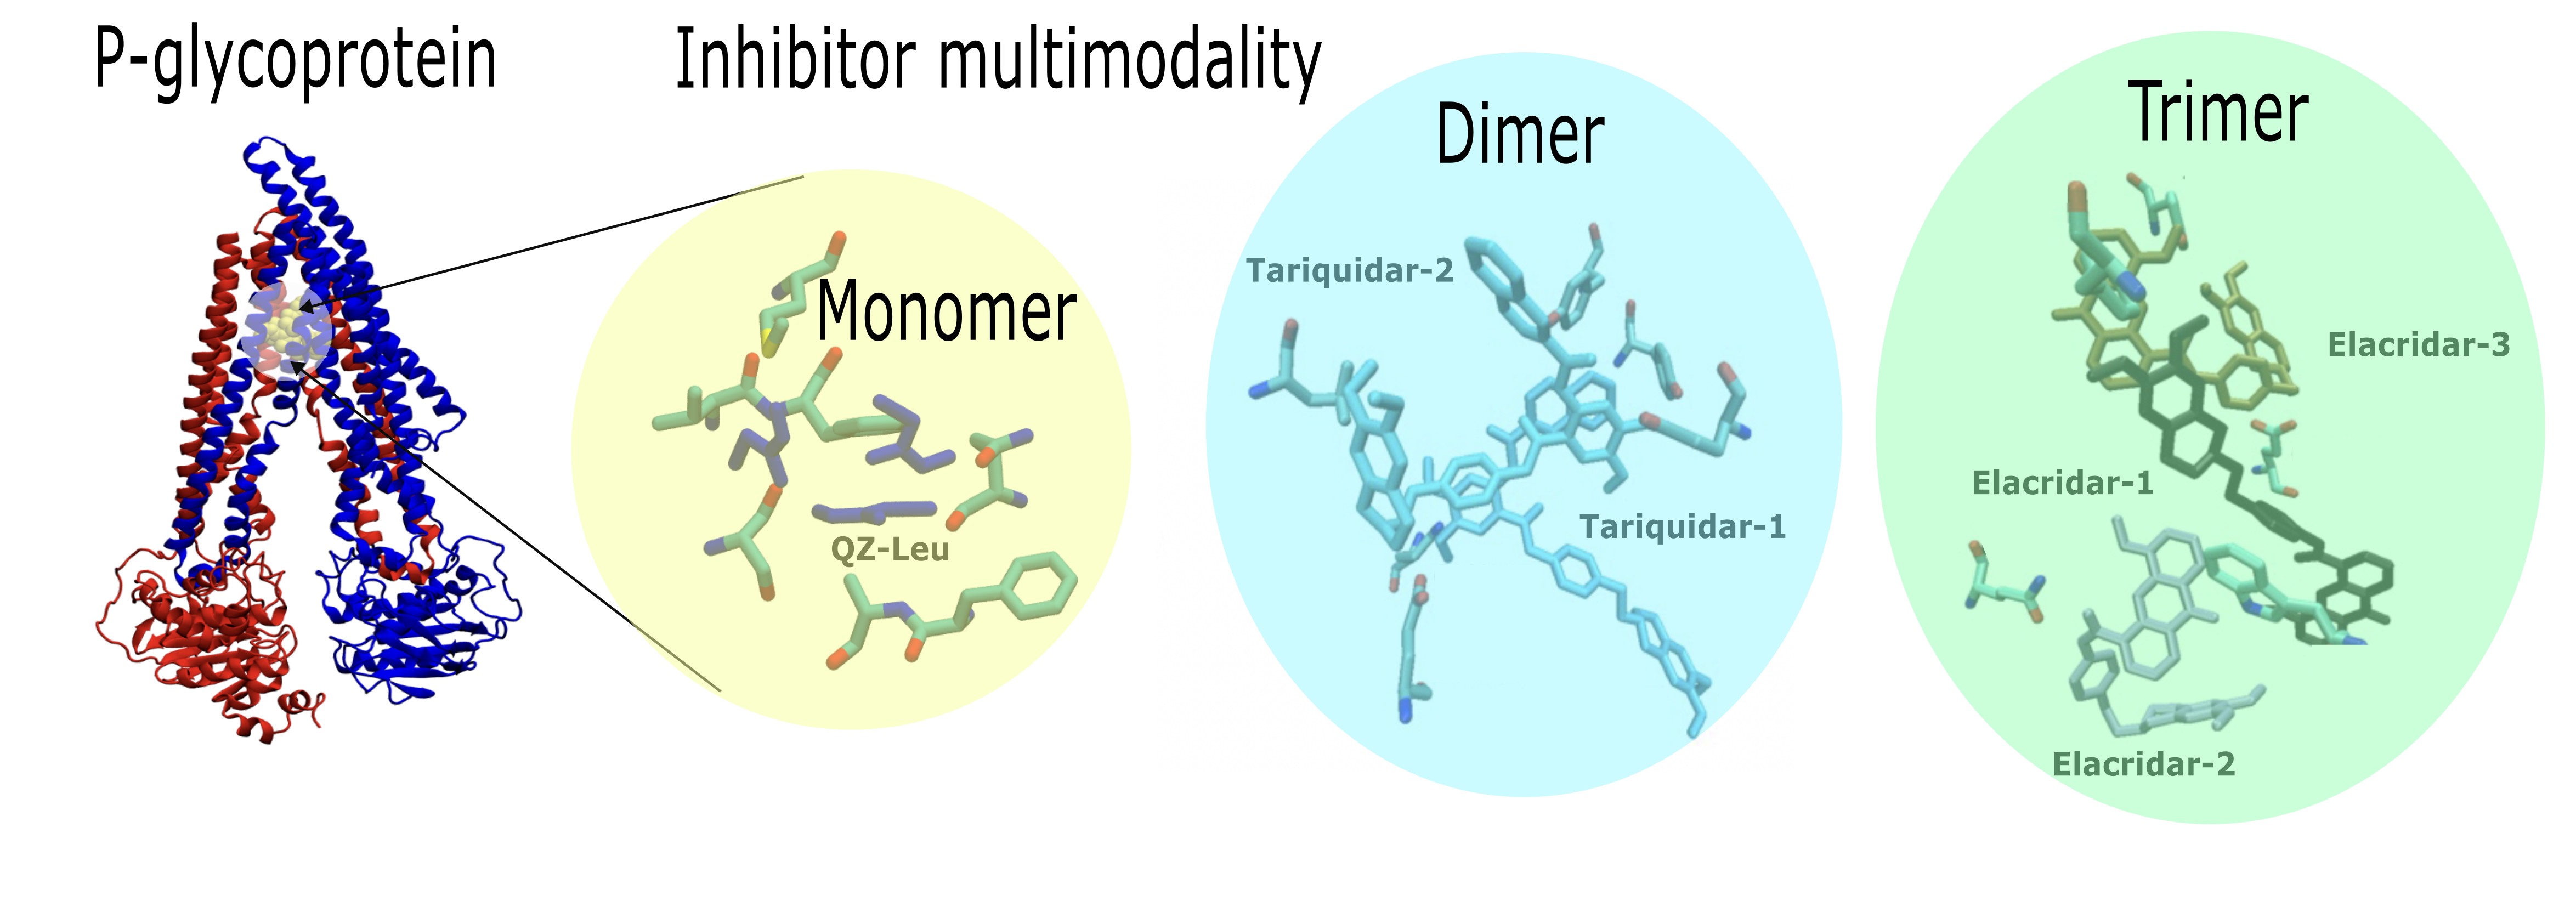
By PDB database mining, we present evidence of P-gp modulation that includes examples with monomeric (n = 1), dimeric (n = 2) or trimeric (n = 3) inhibitor bound. Firstly, P-gp was captured with a monomer of QZ-Leu (PDB id 4Q9K; X-ray, 3.80 Å) in Figure 2.a. The binding pose shown in Figure 2.a employs a van der Waals representation of the inhibitor, and also depicts the chemical structure of QZ-Leu. Secondly, the inhibition of P-gp by a dimer of tariquidar was identified (PDB id 7A6E; cryo-EM, 3.60 Å; Figure 2.b). Third, the inhibition of P-gp by a trimeric bundle of elacridar (PDB id 8Y6I; cryo-EM, 2.54 Å; Figure 2.c) is depicted in Figure 2.c. In Figure 2.d we calculate the centre-of-mass (COM) distance to the apical top, defined in Figure 1 as F335 and F336, which increased as the inhibitor modality changed from monomer to trimer. This is due to the COM shifting downwards towards the NBD lobes as the trimeric assembly occupies more space in the central cavity (Figure 2). In Figure 2.e-g, we depict the molecular interactions of between P-gp and each inhibitor molecule. Figure 2.e depicts the inhibition of P-gp by a QZ-Leu monomer (PDB id 4Q9K; X-ray, 3.80 Å), while Figure 2.f illustrates the P-gp binding of a tariquidar dimer (PDB id 7A6E; cryo-EM, 3.60 Å). Finally, Figure 2.g. shows P-gp inhibition by a trimer of elacridar (PDB id 8Y6I; cryo-EM, 2.54 Å).
2.2. P-Glycoprotein Substrate Pharmacology: The Handling of Chemotherapeutics and Environmental Pollutants from PDB Database Analysis
By using PDB database mining, we sought to characterize the broad range of novel P-gp substrate transport structures. The structures we considered are shown in Figure 3. Firstly, we consider P-gp bound with the substrate and chemotherapeutic taxol (PDB id 6QEX; cryo-EM, 3.60 Å; Figure 3.a) [10], secondly, P-gp bound with the substrate and environmental polluter bromophenyl BDE100 (PDB id 6UJN; X-ray, 3.98 Å; Figure 3.b) [25], and, third, P-gp bound with the substrate and the Cystic Fibrosis Transmembrane Conductance Regulator (CFTR) potentiator ivacaftor (PDB id 7OTG; cryo-EM, 5.40 Å; Figure 3.c) [26]. The average distance of each substrate to the apex (F335, F336) is shown in Figure 3.d. In Figure 3.e-f we depict the binding site of taxol, BDE100 and ivacaftor in P-gp. We find the taxol and BDE100 are positioned at the same distance to the apical point defined by F335 and F336. On the other hand, ivacaftor is located further down the inner binding site. For purposes of the distance comparison, we built a homology model based on the 6UJN template of murine P-gp with BDE100 (see the Methods section).
2.3. Assessing IC50 of P-Gp Inhibitors and Substrates with AI
Using the AI-based tool Boltz-2 [27] we calculated the affinity probability and the predicted IC50 for each of the three inhibitors (QZ-Leu, tariquidar, elacridar), and the three substrates (taxol, BDE100, ivacaftor). The results are presented in Table 1. The predicted Template Modeling (pTM) score considers the overall fold accuracy of a single protein chain [27]. The Predicted inter-chain TM (ipTM) score assesses the inter-chain interactions in multimeric models [27]. The Confidence Score showcases the overall model quality. The Average predicted Local Distance Difference Test (pLDDT) is the per-residue confidence metric [27], and reflects the local structural reliability. The Affinity Probability estimates the likelihood that a predicted protein-ligand complex corresponds to a true, energetically favorable binding interaction [27]. The IC50 denotes the half-maximal inhibitory concentration, and is defined as the modulator concentration required to inhibit 50% of target activity, with a lower value denoting a higher modulator potency. The predicted negative log₁₀ of IC50 (pIC50) correlates with the potency of inhibition, with a higher value predicting a greater inhibitory effect.
Figure 4 demonstrates the output from the Boltz-2 prediction for P-gp substrate and inhibitor binding sites, specifically for inhibitors QZ-Leu (Figure 4.a), tariquidar (Figure 4.b), and elacridar (Figure 4.c), and for substrates taxol (Figure 4.d), BDE100 (Figure 4.e), and ivacaftor (Figure 4.f). It is apparent that the performance of Boltz-2 is best for monomeric binding, while Boltz-2 is as of yet able to predict dimeric and trimeric poses (as predicted by cryo-EM or X-ray), because the algorithm tends to approximate these molecules as monomeric entities, hence failing to capture their full structural complexity.
Figure 5 shows a comparison of the binding poses predicted by Boltz-2 (orange) to those from X-ray crystallography or cryo-EM (red) for the P-gp inhibitor QZ-Leu, the P-gp substrate BDE100 and the P-gp substrate ivacaftor. This comparison suggests that Boltz-2 is a valid tool for predicting P-gp substrate and inhibitor binding locations. The results demonstrate that Boltz-2 effectively identifies binding sites for both substrates and inhibitors with high accuracy, as the predicted poses were consistent with those obtained from cryo-EM or X-ray, either as native or as homology models, thereby supporting the reliability of this new engine.
2.4. Developing a P-Glycoprotein Coarse-Grain Model to Explore Substrate Interactions.
Here we report a coarse-grain (CG) model of P-gp embedded in the BMEC membrane. We compared the model of partitioning of the P-gp substrate rhodamine-123 to previously published atomistic models of the BBB [28,29] and P-gp embedded in a model of the endothelial BBB [6]. The composition used for the endothelial BBB membrane was reported elsewhere [28], and comprises ~30% cholesterol, ~19% sphingomyelin, and the remainder (~51%) of phospholipids. The protein system was prepared by the Martinize tool of MARTINI [30], using an atomistic equilibrated coordinate of human inward-facing (IF) P-glycoprotein (PDB ID 6QEX [10]). A protein-bilayer system was prepared with the INSANE application of MARTINI [30], using a coarse-grained (CG) topology description under the MARTINI 3.0.b.3.2 coarse-grain forcefield [31], specifically with a four-to-one mapping that typically represent 4 atomistic particles as one bead. An elastic network model was added to the protein description [32] to preserve the secondary structure. A protein-bilayer system was prepared using a 322 lipid bilayer distributed according to Table 1, comprising 30% cholesterol, 6% POPE, 19% POSM, 8% SLPC, 8% PAPS, 15% PAPE, 4% POPC, 8% PAPC, and 2% SAPI. The simulation box was solvated with MARTINI water beads. Na+ and Cl− ions were added to the system to reach the physiological conditions of 150 mM NaCl. We chose a typical substrate, rhodamine-123, which we have studied previously [6], as a representative example of a general P-gp substrate. The results are depicted in Figure 6. In Figure 6.a-c we depict our analysis of coarse-grain model of apo P-gp trajectory (50 μs) using MARTINI with an elastic network model [32]. In particular, the root-mean-square deviations (RMSD ± σ) of P-gp relative to the initial conformation yields an average value of 6.1 ± 0.4 Å for replica 1, and 6.1 ± 0.3 Å for replica 2, similar to that calculated for ubiquitin using MARTINI and MARTINI with an elastic network [33]. In Figure 6.b-d, we depict the partitioning of 20 CG rhodamine-123 substrate using a MARTINI representation (red), showing that partition of substrate into the BMEC bilayer reaches over 90% within the first μs. In Figure 6.e, we depict the % partitioning of CG rhodamine-123 to atomistic (AA) rhodamine-123 (blue) from our previous work [6], showing that the models agree quantitatively on the % of substrate partition, which provides validity to the model.
3. Discussion
3.1. P-Gp Inhibition Exhibits Multimodal Character
The inhibitors analysed in this study support a multimodal binding model. Based on PDB data mining, the inhibitors are observed to interact with multiple pockets and occupy increasingly larger volumes within the central binding cavity of P-gp as the binding mode changes from monomeric to multimeric. This spatial expansion allows inhibitors to interact with a broader array of residues across the transmembrane domains, resulting in a wider contact surface compared to monomeric mode of inhibition. This could contribute to an increased inhibitory effect by physically obstructing substrate access and preventing conformational transitions. However, this also correlates with a reduced specificity for the canonical substrate-binding pocket, particularly near the apex of the central binding cavity, also supported by increasing distances from F335 and F336 residues in Figure 2.d. We found the distance of the inhibitor from the P-gp apex increases as progression from monomeric forms (QZ-Leu) to multimeric forms (tariquidar and elacridar) occurs, and this change is accompanied by a larger standard deviation (σ) in ligand positioning across models. This suggestion that the apical peak (W335/W336) plays a role in the anchoring the extracellular end of the TM helix has been reported in other membrane-spanning proteins [35,36]. In summary, the monomeric inhibitors such as QZ-Leu are located more distal in the inner binding cavity.
Furthermore, our data reveal that the inhibitors occupy different binding sites and interact with distinct sets of amino acid residues, as shown in Figure 2.e-g. QZ-Leu binds near the canonical substrate-binding pocket, making direct contact with M986, a residue also observed contacting substrate taxol in Figure 3.e. This overlap supports a competitive and targeted binding pattern. In contrast, the dimeric tariquidar and trimeric elacridar complexes span multiple sites within the central cavity, extending away from the apex and interacting with more peripheral residues, including Y130. This broader engagement may reduce their ability to tightly occupy or compete for the precise substrate binding site, while still achieves inhibition by blocking substrate access and conformational stabilisation of the inward-facing state.
3.2. P-Gp Substrate Pharmacology: The Handling of Chemotherapeutics and Environmental Pollutants from PDB Database Analysis Shows Diversity in Character
Over 300 P-gp substrates have been identified [4], many of which are chemotherapeutics and other essential precision medicine tools, and this has motivated an intense search for a P-gp inhibitor, which to this day has not resulted in late-stage clinical trial success [6]. One way to improve this search is to better understand the nuances among substrates, in particular the interactions of P-gp across diverse substrate classes such as environmental pollutants (e.g., BDE100) and chemotherapeutic agents (e.g., taxol).
In Figure 2.e-h we depict the substantial variability in substrate orientation and proximity to the apical residues F335 and F336 (apex definition; Figure 1.a). Compared to the inhibitors shown in Figure 2.a-d, substrates generally maintain a greater average distance from these residues (Figure 2.h). One could infer that this points to differences in the mechanism substrate between transport and inhibition, but such discussions have been made elsewhere vigorously [37]. We note that taxol (PDB ID: 6QEX) and BDE100 (PDB ID: 6UJN) show similar spatial distances from the apex (F335-F336), implying overlapping binding positions despite their differing chemical classes. In contrast, the CFTR potentiator ivacaftor (PDB ID: 7OTG) binds at a lower point in the inner cavity, displaying a larger centre-of-mass distance from these residues. This deviation could point to subtle differentiated mode of interaction, which has been explored elsewhere [38]. It is our general opinion, however, that the P-gp inner binding region should be be considered a single, extended binding surface, as we have argued elsewhere [6]. This argument succinctly explains how P-gp can bind over 300 different substrates non-selectively.
Figure 3 reveals the presence of conserved interaction patterns between substrates and inhibitors within the P-gp binding pocket, in particular shared molecular contacts between both the inhibitor elacridar (Figure 3.c) and the substrate ivacaftor (Figure 3.f) with residue E875. These shared contacts point to common recognition motifs potentially crucial to P-gp function. Residue Q347 emerged as another key binding site, interacting with the substrate ivacaftor (Figure 3.f), inhibitor tariquidar (Figure 3.b), and substrate taxol (Figure 3.d). This convergence suggests Q347 may play a versatile role in the promiscuous binding behaviour characteristic of P-gp. Similarly, residue M986 interacts with both taxol (Figure 3.d) and QZ-Leu (Figure 3.a), further supporting the concept of shared binding determinants between substrates and inhibitors.
These conserved contact points represent promising targets for rational drug design, offering new strategies to modulate P-gp activity by exploiting common recognition motifs shared by structurally diverse compounds.
3.3. Boltz-2 AI Suggests That Later Generation Inhibitors Bind More Efficiently.
To rigorously assess the reliability of structural and binding predictions, Boltz-2 employs a suite of confidence metrics tailored to both single-chain and multi-chain protein models. The predicted TM-score (pTM) quantifies confidence in single-chain structural prediction, representing the algorithm’s estimate of the traditional TM-score that would result from superimposing the predicted structure onto the unknown native conformation. For multi-chain assemblies, the interface predicted TM-score (ipTM) serves as a complementary metric, evaluating the accuracy of inter-chain packing and interactions by considering only inter-chain residue pairs.
Binding affinity is assessed through two complementary metrics. The binary binding affinity score estimates the probability of ligand-target interaction, while the predicted pIC50—expressed as −log₁₀(IC50 in molar units)—provides a quantitative measure of binding potential, with higher values indicating stronger predicted affinity. Additionally, the predicted IC₅₀ value reflects the half-maximal inhibitory concentration, where lower values denote greater binding strength.
As shown in Table 1, all inhibitors exhibit high confidence scores. Elacridar stands out with the highest pTM score (0.781), indicating the greatest confidence in single-chain structural prediction, and the highest ipTM score (0.933), reflecting superior inter-chain packing accuracy. In contrast, tariquidar demonstrates the highest predicted pIC50 value (7.243) and the lowest predicted IC50 value (57.1 nM), suggesting both the strongest binding potential and greatest inhibitory strength. Based on the combined metrics, tariquidar emerges as the most confident and potent inhibitor according to Boltz-2 predictions.
Similarly, all substrates listed in Table 1 show robust confidence scores. BDE100 exhibits the highest pTM score (0.792), while ivacaftor achieves the highest ipTM score (0.915) and binding affinity probability (0.663). Taxol displays the highest predicted pIC₅₀ (6.928) and IC₅₀ (118.0 nM) values among substrates, indicating strong binding potential and inhibitory capacity. Based on the combined metrics, taxol emerges as the most confident and potent substrate according to Boltz-2 predictions.
A trend emerges whereby the earlier first-generation inhibitors such as QZ-Leu [7] are associated with less potent P-gp inhibition, and larger IC50 values. For QZ-Leu, and the associated QZ family of inhibitors, Szewczyk et al. estimate IC50 values in vitro to increase with the size of the side-chain, namely QZ-Val (IC50 = 1.7 µM), QZ-Leu (IC50 = 5.4 µM) and QZ-Phe (IC50 = 24 µM) [7]. We proceed to compare these experimental values to those estimated by Boltz-2, namely QZ-Leu (IC50 = 0.27 µM) and QZ-Phe (IC50 = 0.26 µM) (Table S5).
3.4. P-Gp Coarse-Grained Model
Our coarse-grain model of substrate permeation into P-gp shows benchmarking similarities to prior atomistic models [6], but this model provides new insights at far longer timescales. Our CG model is able to observe the diffusion of P-gp in the membrane over a 50 μs timescale. The protein RMSD (μ ± σ) over 50 μs for replica-1 was found to be 6.1 ± 0.4 Å, and for replica-2 it was 6.1 ± 0.3 Å, which was similar to that calculated for ubiquitin using MARTINI and MARTINI with an elastic network [33]. In Figure 6.b-d we depict the partitioning of 20 CG rhodamine-123 substrate using a MARTINI representation (red), showing that partition of substrate into the BMEC bilayer reaches over 90% within the first μs. In Figure 6.e we depict the % partitioning of CG rhodamine-123 to atomistic (AA) rhodamine-123 (blue) from our previous work [6], showing that the models agree quantitatively on the % of substrate partition, which yields validity to the model.
3.5. Conclusion
In conclusion, in this work we report a multimodal binding model of P-gp inhibition, in which P-gp can be inhibited by compounds bound as either monomer, dimers and trimers. This is a trend that has emerged in the Protein Data Bank in recent years, and both raises many questions but also bears important consequences for the next generation of P-gp inhibitors to combat multidrug resistance to chemotherapeutics. From machine learning calculations with Boltz-2 we report analysis of P-gp inhibitors and substrates and show that machine learning can predict the binding pose to a high degree of correspondence with high-resolution X-ray or cryo-EM models. We report analysis of P-gp substrates using machine learning, together with our newly developed P-gp-BBB coarse-grain model, which point to an extended binding region that explains how P-gp can bind over 300 substrates non-selectively.
4. Materials and Methods
4.1. P-Gp Human Homology Models.
P-gp homology models have been described elsewhere in detail [40]. The following human P-gp homology model were constructed in this work:
(1) A human homology model from the murine inward-facing P-gp template (ABCB1; PDB ID: 4Q9K; resolution: 3.8 Å; sequence identity: 87%; Uniprot: P08183). Target–template alignment was performed using ProMod3 via the SWISS-MODEL webserver (https://swissmodel.expasy.org) [41]. The resulting alignment and verification data are shown in Table S1 and Table S2, respectively. Model quality was assessed using the global and per-residue QMEAN scoring function [42].
(2) To compare substrate-bound P-gp structures based on a human template, BDE100 (ABCB1; murine P-gp; PDB ID: 6UJN; resolution: 3.98 Å) and ivacaftor (ABCB1; murine P-gp; PDB ID: 7OTG; resolution: 5.40 Å) were remodelled using SWISS-MODEL (https://swissmodel.expasy.org). This approach ensured consistency with the human Taxol-bound structure (PDB ID: 6QEX). The modelling process involved four key steps: (i) template identification: Uniprot sequence P08183 (human P-gp) was selected. (ii) Target–template alignment: alignment was conducted between Uniprot sequence P08183 (human P-gp) and P21447 (mouse P-gp). (iii) Model building: homology models of the ligand-bound structures were generated. (iv) Model quality evaluation: see Tables S3 and S4 for relevant assessment metrics. The SWISS-MODEL workflow did not retain the original ligand-binding sites in the remodelled structures. Therefore, the ligands were manually reinserted into the homology model’s post-construction to preserve their docking orientation.
4.2. Protein-Ligand Co-Folding Using Boltz-2
Structural predictions of protein-ligand complexes, as well as estimated binding affinity and IC50 values, were performed using Boltz-2.1.1, a machine learning-based model developed for simultaneous structure and affinity prediction [27] on the Rowan Scientific web-server (https://rowansci.com/) using the Protein-ligand co-folding tool, which utilizes the Boltz-2 model. Protein sequences were retrieved from UniProt (ID: P21447) [43], and ligand structures were provided in SMILES format, which were sourced from Pubchem [44] with CIDs 441276, 154083 and 16220172, respectively. A default Multiple Sequence Alignment (MSA) server was used for generating evolutionary profiles automatically. This step was handled internally by the backend of Boltz-2.
4.3. Coarse-Grain Protein-Membrane Model Setup
The protein system was prepared by the Martinize tool of MARTINI [30], using an atomistic equilibrated coordinate of human inward-face (IF) P-glycoprotein (PDB ID 6QEX [10]). A protein-bilayer system was prepared with the INSANE application of MARTINI [30], using a coarse-grained (CG) topology description under the MARTINI 3.0.b.3.2 coarse-grain forcefield [31], specifically with a four-to-one mapping that typically represent 4 atomistic particles as one bead. An elastic network model was added to the protein description [32] to preserve the secondary structure. The final bilayer size was 322 lipids (Table 2). The box was solvated with MARTINI water beads (each bead represents 4 water molecules). Na+ and Cl− ions were added to the system to reach the physiological conditions of 150 mM NaCl.
4.4. Coarse-Grained Molecular Dynamics
All simulations (including all-atom) were run with GROMACS 2021 simulation package [45]. Following system setup, an equilibration procedure consisting of 50 ns using the Berendsen barostat [46] and v-rescale thermostat [47] for pressure and temperature coupling, respectively. Simulations were run at 300 K and 1 bar pressure. An atmospheric pressure of 1 bar was maintained using the Berendsen pressure coupling with compressibility κ = 4.5 · 10-5 bar-1 and a time constant τP = 4 ps. The LINCS algorithm [48] was used to constrain bond lengths with a timestep of 20 fs. The long-range electrostatic interactions were calculated with the particle mesh Ewald (PME) method. During the equilibration process the protein backbone beads were constrained. The 50 ns of equilibration was continued with a 50 μs of production run for apo P-gp. A second simulation with 20 CG rhodamine-123 substrate molecules were added to the equilibrated box and run for 12 μs.
Author Contributions
Conceptualization, C.J.; methodology, C.J.; software, C.J.; validation, C.J., E.O., H.P, M.B., J.O., S.T., C.G., B.W.F., E.L.M., and A.A.; formal analysis, C.J., E.O., H.P, M.B., J.O., S.T., C.G., B.W.F. and E.L.M.; investigation, C.J., E.O., H.P., M.B., J.O., S.T., C.G., B.W.F., E.L.M., and A.A.; resources, C.J. and R.D.; data curation, C.J., E.O., H.P., M.B., J.O., S.T., C.G., B.W.F. and E.L.M.; writing—original draft preparation, C.J. and E.O.; writing—review and editing, C.J., E.O., H.P., M.B., J.O., S.T., C.G., B.W.F., E.L.M. and R.D.; visualization, C.J., E.O., H.P., M.B., J.O., S.T., C.G., B.W.F. and E.L.M.; supervision, C.J.; project administration, C.J.; funding acquisition, C.J. All authors have read and agreed to the published version of the manuscript.
Funding
We acknowledge support by the European Union’s Horizon 2020 research and innovation programme under the Marie Skłodowska-Curie grant agreement No 101023783.
Institutional Review Board Statement
Not applicable.
Informed Consent Statement
Not applicable.
Data Availability Statement
The original data presented in the study are openly available for download in GitHub at https://github.com/chrisjorg/P-gp.
Acknowledgments
We acknowledge support of the SCIAMA Supercomputer at the University of Portsmouth. We want to thank the following people for their insightful comments on the manuscript: Dr. Kasper Busk Pedersen from Aarhus University, the Biomodelling Group and Prof. Birgit Schiøtt, Dr. Martin Voegele, and Dr. Miro Astore. We thank members of the Biomodelling Group who assisted in the early buildings of the coarse-grain model.
Conflicts of Interest
The authors declare no conflicts of interest.
Abbreviations
The following abbreviations are used in this manuscript:
| P-gp | P-glycoprotein |
| ABC | ATP-Binding Cassette |
| BMEC | Brain microvascular endothelial cell |
| BBB | Blood-brain barrier |
| TMD | Transmembrane domain |
| NBD | Nucleotide binding domain |
| MD | Molecular Dynamics |
| CG | Coarse-grain |
| POPC | 1-Palmitoyl-2-oleoyl-sn-glycero-3-phosphocholine |
| POPE | 1-Palmitoyl-2-oleoyl-sn-glycero-3-phosphoethanolamine |
| POSM | Palmitoyl Sphingomyelin |
| SLPC | 1-Stearoyl-2-linoleoyl-sn-glycero-3-phosphocholine |
| PAPS | 1-Palmitoyl-2-arachidonoyl-sn-glycero-3-phosphoserine |
| PAPE | 1-Palmitoyl-2-arachidonoyl-sn-glycero-3-phosphoethanolamine |
| PAPC | 1-Palmitoyl-2-arachidonoyl-sn-glycero-3-phosphocholine |
| SAPI | Stearoyl Arachidonoyl Phosphatidylinositol |
| SMILES | Simplified Molecular Input Line Entry System |
| PDB | Protein Data Bank |
| COM | Center of Mass |
| CFTR | Cystic Fibrosis Transmembrane Conductance Regulator |
| pTM | Predicted TM-score |
| ipTM | Interface Predicted TM-score |
| pLDDT | Predicted Local Distance Difference Test |
| IC50 | Half Maximal Inhibitory Concentration |
| pIC50 | Negative Log of IC50 |
| QMEAN | Qualitative Model Energy Analysis |
| MSA | Multiple Sequence Alignment |
| PME | Particle Mesh Ewald |
| LINCS | Linear Constraint Solver |
| GROMACS | GROningen MAchine for Chemical Simulations |
References
- Wong, A.D.; Ye, M.; Levy, A.F.; Rothstein, J.D.; Bergles, D.E.; Searson, P.C. The Blood-Brain Barrier: An Engineering Perspective. Front Neuroeng 2013, 6, 7. [CrossRef]
- Gottesman, M.M.; Ling, V. The Molecular Basis of Multidrug Resistance in Cancer: The Early Years of P-Glycoprotein Research. FEBS Lett 2006, 580, 998–1009. [CrossRef]
- van Veen, H.W.; Konings, W.N. Structure and Function of Multidrug Transporters. Resolving the Antibiotic Paradox: Progress in Understanding Drug Resistance and Development of New Antibiotics 1998, 145–158.
- Kim, Y.; Chen, J. Molecular Structure of Human P-Glycoprotein in the ATP-Bound, Outward-Facing Conformation. Science (1979) 2018, 359, 915–919. [CrossRef]
- Condic-Jurkic, K.; Subramanian, N.; Mark, A.E.; O’Mara, M.L. The Reliability of Molecular Dynamics Simulations of the Multidrug Transporter P-Glycoprotein in a Membrane Environment. PLoS One 2018, 13, e0191882. [CrossRef]
- Jorgensen, C.; Ulmschneider, M.B.; Searson, P.C. Modeling Substrate Entry into the P-Glycoprotein Efflux Pump at the Blood–Brain Barrier. J Med Chem 2023, 66, 16615–16627. [CrossRef]
- Szewczyk, P.; Tao, H.; McGrath, A.P.; Villaluz, M.; Rees, S.D.; Lee, S.C.; Doshi, R.; Urbatsch, I.L.; Zhang, Q.; Chang, G. Snapshots of Ligand Entry, Malleable Binding and Induced Helical Movement in P-Glycoprotein. Biological Crystallography 2015, 71, 732–741. [CrossRef]
- Jin, M.S.; Oldham, M.L.; Zhang, Q.; Chen, J. Crystal Structure of the Multidrug Transporter P-Glycoprotein from Caenorhabditis Elegans. Nature 2012, 490, 566–569. [CrossRef]
- Aller, S.G.; Yu, J.; Ward, A.; Weng, Y.; Chittaboina, S.; Zhuo, R.; Harrell, P.M.; Trinh, Y.T.; Zhang, Q.; Urbatsch, I.L. Structure of P-Glycoprotein Reveals a Molecular Basis for Poly-Specific Drug Binding. Science (1979) 2009, 323, 1718–1722. [CrossRef]
- Alam, A.; Kowal, J.; Broude, E.; Roninson, I.; Locher, K.P. Structural Insight into Substrate and Inhibitor Discrimination by Human P-Glycoprotein. Science (1979) 2019, 363, 753–756. [CrossRef]
- Xing, J.; Huang, S.; Heng, Y.; Mei, H.; Pan, X. Computational Insights into Allosteric Conformational Modulation of P-Glycoprotein by Substrate and Inhibitor Binding. Molecules 2020, 25, 6006. [CrossRef]
- Loo, T.W.; Bartlett, M.C.; Clarke, D.M. Drug Binding in Human P-Glycoprotein Causes Conformational Changes in Both Nucleotide-Binding Domains. Journal of Biological Chemistry 2003, 278, 1575–1578. [CrossRef]
- McCormick, J.W.; Vogel, P.D.; Wise, J.G. Multiple Drug Transport Pathways through Human P-Glycoprotein. Biochemistry 2015, 54, 4374–4390. [CrossRef]
- Ward, A.B.; Szewczyk, P.; Grimard, V.; Lee, C.-W.; Martinez, L.; Doshi, R.; Caya, A.; Villaluz, M.; Pardon, E.; Cregger, C. Structures of P-Glycoprotein Reveal Its Conformational Flexibility and an Epitope on the Nucleotide-Binding Domain. Proceedings of the National Academy of Sciences 2013, 110, 13386–13391. [CrossRef]
- Callaghan, R.; Ford, R.C.; Kerr, I.D. The Translocation Mechanism of P-Glycoprotein. FEBS Lett 2006, 580, 1056–1063. [CrossRef]
- Prajapati, R.; Sangamwar, A.T. Translocation Mechanism of P-Glycoprotein and Conformational Changes Occurring at Drug-Binding Site: Insights from Multi-Targeted Molecular Dynamics. Biochimica et Biophysica Acta (BBA)-Biomembranes 2014, 1838, 2882–2898. [CrossRef]
- Li, H.; Gong, W. Study of Allosteric Transitions of Human P-Glycoprotein by Using the Two-State Anisotropic Network Model. Front Med (Lausanne) 2022, 9, 815355. [CrossRef]
- De Vecchis, D.; Schäfer, L. V Coupling the Role of Lipids to the Conformational Dynamics of the ABC Transporter P-Glycoprotein. Biophys J 2024, 123, 2522–2536.
- Venable, R.M.; Kramer, A.; Pastor, R.W. Molecular Dynamics Simulations of Membrane Permeability. Chem Rev 2019, 119, 5954–5997. [CrossRef]
- Van Breemen, R.B.; Li, Y. Caco-2 Cell Permeability Assays to Measure Drug Absorption. Expert Opin Drug Metab Toxicol 2005, 1, 175–185.
- Bednarek, R. In Vitro Methods for Measuring the Permeability of Cell Monolayers. Methods Protoc 2022, 5, 17. [CrossRef]
- Jorgensen, C.; Linville, R.M.; Galea, I.; Lambden, E.; Vögele, M.; Chen, C.; Troendle, E.P.; Ruggiu, F.; Ulmschneider, M.B.; Schiøtt, B. Permeability Benchmarking: Guidelines for Comparing in Silico, in Vitro, and in Vivo Measurements. J Chem Inf Model 2025. [CrossRef]
- Nosol, K.; Romane, K.; Irobalieva, R.N.; Alam, A.; Kowal, J.; Fujita, N.; Locher, K.P. Cryo-EM Structures Reveal Distinct Mechanisms of Inhibition of the Human Multidrug Transporter ABCB1. Proceedings of the National Academy of Sciences 2020, 117, 26245–26253. [CrossRef]
- Hamaguchi-Suzuki, N.; Adachi, N.; Moriya, T.; Yasuda, S.; Kawasaki, M.; Suzuki, K.; Ogasawara, S.; Anzai, N.; Senda, T.; Murata, T. Cryo-EM Structure of P-Glycoprotein Bound to Triple Elacridar Inhibitor Molecules. Biochem Biophys Res Commun 2024, 709, 149855. [CrossRef]
- Le, C.A.; Harvey, D.S.; Aller, S.G. Structural Definition of Polyspecific Compensatory Ligand Recognition by P-Glycoprotein. IUCrJ 2020, 7, 663–672. [CrossRef]
- Barbieri, A.; Thonghin, N.; Shafi, T.; Prince, S.M.; Collins, R.F.; Ford, R.C. Structure of ABCB1/P-Glycoprotein in the Presence of the CFTR Potentiator Ivacaftor. Membranes (Basel) 2021, 11, 923. [CrossRef]
- Passaro, S.; Corso, G.; Wohlwend, J.; Reveiz, M.; Thaler, S.; Ram Somnath, V.; Getz, N.; Portnoi, T.; Roy, J.; Stark, H. Boltz-2: Towards Accurate and Efficient Binding Affinity Prediction. BioRxiv 2025, 2025–2026.
- Jorgensen, C.; Ulmschneider, M.B.; Searson, P.C. Atomistic Model of Solute Transport across the Blood–Brain Barrier. ACS Omega 2021, 7, 1100–1112. [CrossRef]
- Jorgensen, C.; Troendle, E.P.; Ulmschneider, J.P.; Searson, P.C.; Ulmschneider, M.B. A Least-Squares-Fitting Procedure for an Efficient Preclinical Ranking of Passive Transport across the Blood–Brain Barrier Endothelium. J Comput Aided Mol Des 2023, 37, 537–549. [CrossRef]
- Wassenaar, T.A.; Ingólfsson, H.I.; Bockmann, R.A.; Tieleman, D.P.; Marrink, S.J. Computational Lipidomics with Insane: A Versatile Tool for Generating Custom Membranes for Molecular Simulations. J Chem Theory Comput 2015, 11, 2144–2155. [CrossRef]
- Souza, P.C.T.; Alessandri, R.; Barnoud, J.; Thallmair, S.; Faustino, I.; Grünewald, F.; Patmanidis, I.; Abdizadeh, H.; Bruininks, B.M.H.; Wassenaar, T.A. Martini 3: A General Purpose Force Field for Coarse-Grained Molecular Dynamics. Nat Methods 2021, 18, 382–388. [CrossRef]
- Periole, X.; Cavalli, M.; Marrink, S.-J.; Ceruso, M.A. Combining an Elastic Network with a Coarse-Grained Molecular Force Field: Structure, Dynamics, and Intermolecular Recognition. J Chem Theory Comput 2009, 5, 2531–2543. [CrossRef]
- Monticelli, L.; Kandasamy, S.K.; Periole, X.; Larson, R.G.; Tieleman, D.P.; Marrink, S.-J. The MARTINI Coarse-Grained Force Field: Extension to Proteins. J Chem Theory Comput 2008, 4, 819–834. [CrossRef]
- Vanommeslaeghe, K.; Hatcher, E.; Acharya, C.; Kundu, S.; Zhong, S.; Shim, J.; Darian, E.; Guvench, O.; Lopes, P.; Vorobyov, I. CHARMM General Force Field: A Force Field for Drug-like Molecules Compatible with the CHARMM All-atom Additive Biological Force Fields. J Comput Chem 2010, 31, 671–690. [CrossRef]
- Nørholm, M.H.H.; von Heijne, G.; Draheim, R.R. Forcing the Issue: Aromatic Tuning Facilitates Stimulus-Independent Modulation of a Two-Component Signaling Circuit. ACS Synth Biol 2015, 4, 474–481. [CrossRef]
- Yusuf, R.; Yau, J.J.Y.; Baker-Valla, G.W.; Lawrence, R.J.; Draheim, R.R. EnvZ Signal Output Correlates with Capacity for Transmembrane Water Encapsulation. bioRxiv 2025, 2023–2025.
- Ma, J.; Biggin, P.C. Substrate versus Inhibitor Dynamics of P-glycoprotein. Proteins: Structure, Function, and Bioinformatics 2013, 81, 1653–1668. [CrossRef]
- Klepsch, F.; Vasanthanathan, P.; Ecker, G.F. Ligand and Structure-Based Classification Models for Prediction of P-Glycoprotein Inhibitors. J Chem Inf Model 2014, 54, 218–229. [CrossRef]
- Weidner, L.D.; Fung, K.L.; Kannan, P.; Moen, J.K.; Kumar, J.S.; Mulder, J.; Innis, R.B.; Gottesman, M.M.; Hall, M.D. Tariquidar Is an Inhibitor and Not a Substrate of Human and Mouse P-Glycoprotein. Drug Metabolism and Disposition 2016, 44, 275–282. [CrossRef]
- Domicevica, L.; Biggin, P.C. Homology Modelling of Human P-Glycoprotein. Biochem Soc Trans 2015, 43, 952–958. [CrossRef]
- Waterhouse, A.; Bertoni, M.; Bienert, S.; Studer, G.; Tauriello, G.; Gumienny, R.; Heer, F.T.; de Beer, T.A.P.; Rempfer, C.; Bordoli, L. SWISS-MODEL: Homology Modelling of Protein Structures and Complexes. Nucleic Acids Res 2018, 46, W296–W303. [CrossRef]
- Kiefer, F.; Arnold, K.; Künzli, M.; Bordoli, L.; Schwede, T. The SWISS-MODEL Repository and Associated Resources. Nucleic Acids Res 2009, 37, D387–D392. [CrossRef]
- UniProt: The Universal Protein Knowledgebase in 2021. Nucleic Acids Res 2021, 49, D480–D489.
- Kim, S.; Thiessen, P.A.; Bolton, E.E.; Chen, J.; Fu, G.; Gindulyte, A.; Han, L.; He, J.; He, S.; Shoemaker, B.A. PubChem Substance and Compound Databases. Nucleic Acids Res 2016, 44, D1202–D1213. [CrossRef]
- Van Der Spoel, D.; Lindahl, E.; Hess, B.; Groenhof, G.; Mark, A.E.; Berendsen, H.J.C. GROMACS: Fast, Flexible, and Free. J Comput Chem 2005, 26, 1701–1718. [CrossRef]
- Berendsen, H.J.C.; Postma, J.P.M. van; Van Gunsteren, W.F.; DiNola, A.; Haak, J.R. Molecular Dynamics with Coupling to an External Bath. J Chem Phys 1984, 81, 3684–3690. [CrossRef]
- Bussi, G.; Donadio, D.; Parrinello, M. Canonical Sampling through Velocity Rescaling. J Chem Phys 2007, 126. [CrossRef]
- Hess, B.; Bekker, H.; Berendsen, H.J.C.; Fraaije, J.G.E.M. LINCS: A Linear Constraint Solver for Molecular Simulations. J Comput Chem 1997, 18, 1463–1472.
- Consortium, U. UniProt: A Hub for Protein Information. Nucleic Acids Res 2015, 43, D204–D212.
Figure 1.
P-gp and its role in efflux of chemotherapeutics and other important therapeutics across the cell membrane. (a) P-glycoprotein consists of two pseudo-symmetric halves encoded into a single polypeptide. Each half consists of six transmembrane helices, and one cytosolic nucleotide binding domain (NBD) along with interconnecting loops and short helices. The two structural halves enclose a central cavity. An invariant apex point is made up of residues F335 and F336. (b) Schematic illustration showing transport processes across the endothelial barrier of the BBB. The first pathway is transcellular diffusion, in which molecules passively diffuse across the membrane, but can be transported back into circulation by efflux pumps, if they are a substrate of such pumps. The second pathway is the paracellular pathway, in which molecules exploit the cell-cell space for transport. Due to the presence of tight junction proteins such as occludins and claudins, this pathway is mostly inaccessible, and as such, for most small lipophilic molecules, passive diffusion is the only pathway into the brain.
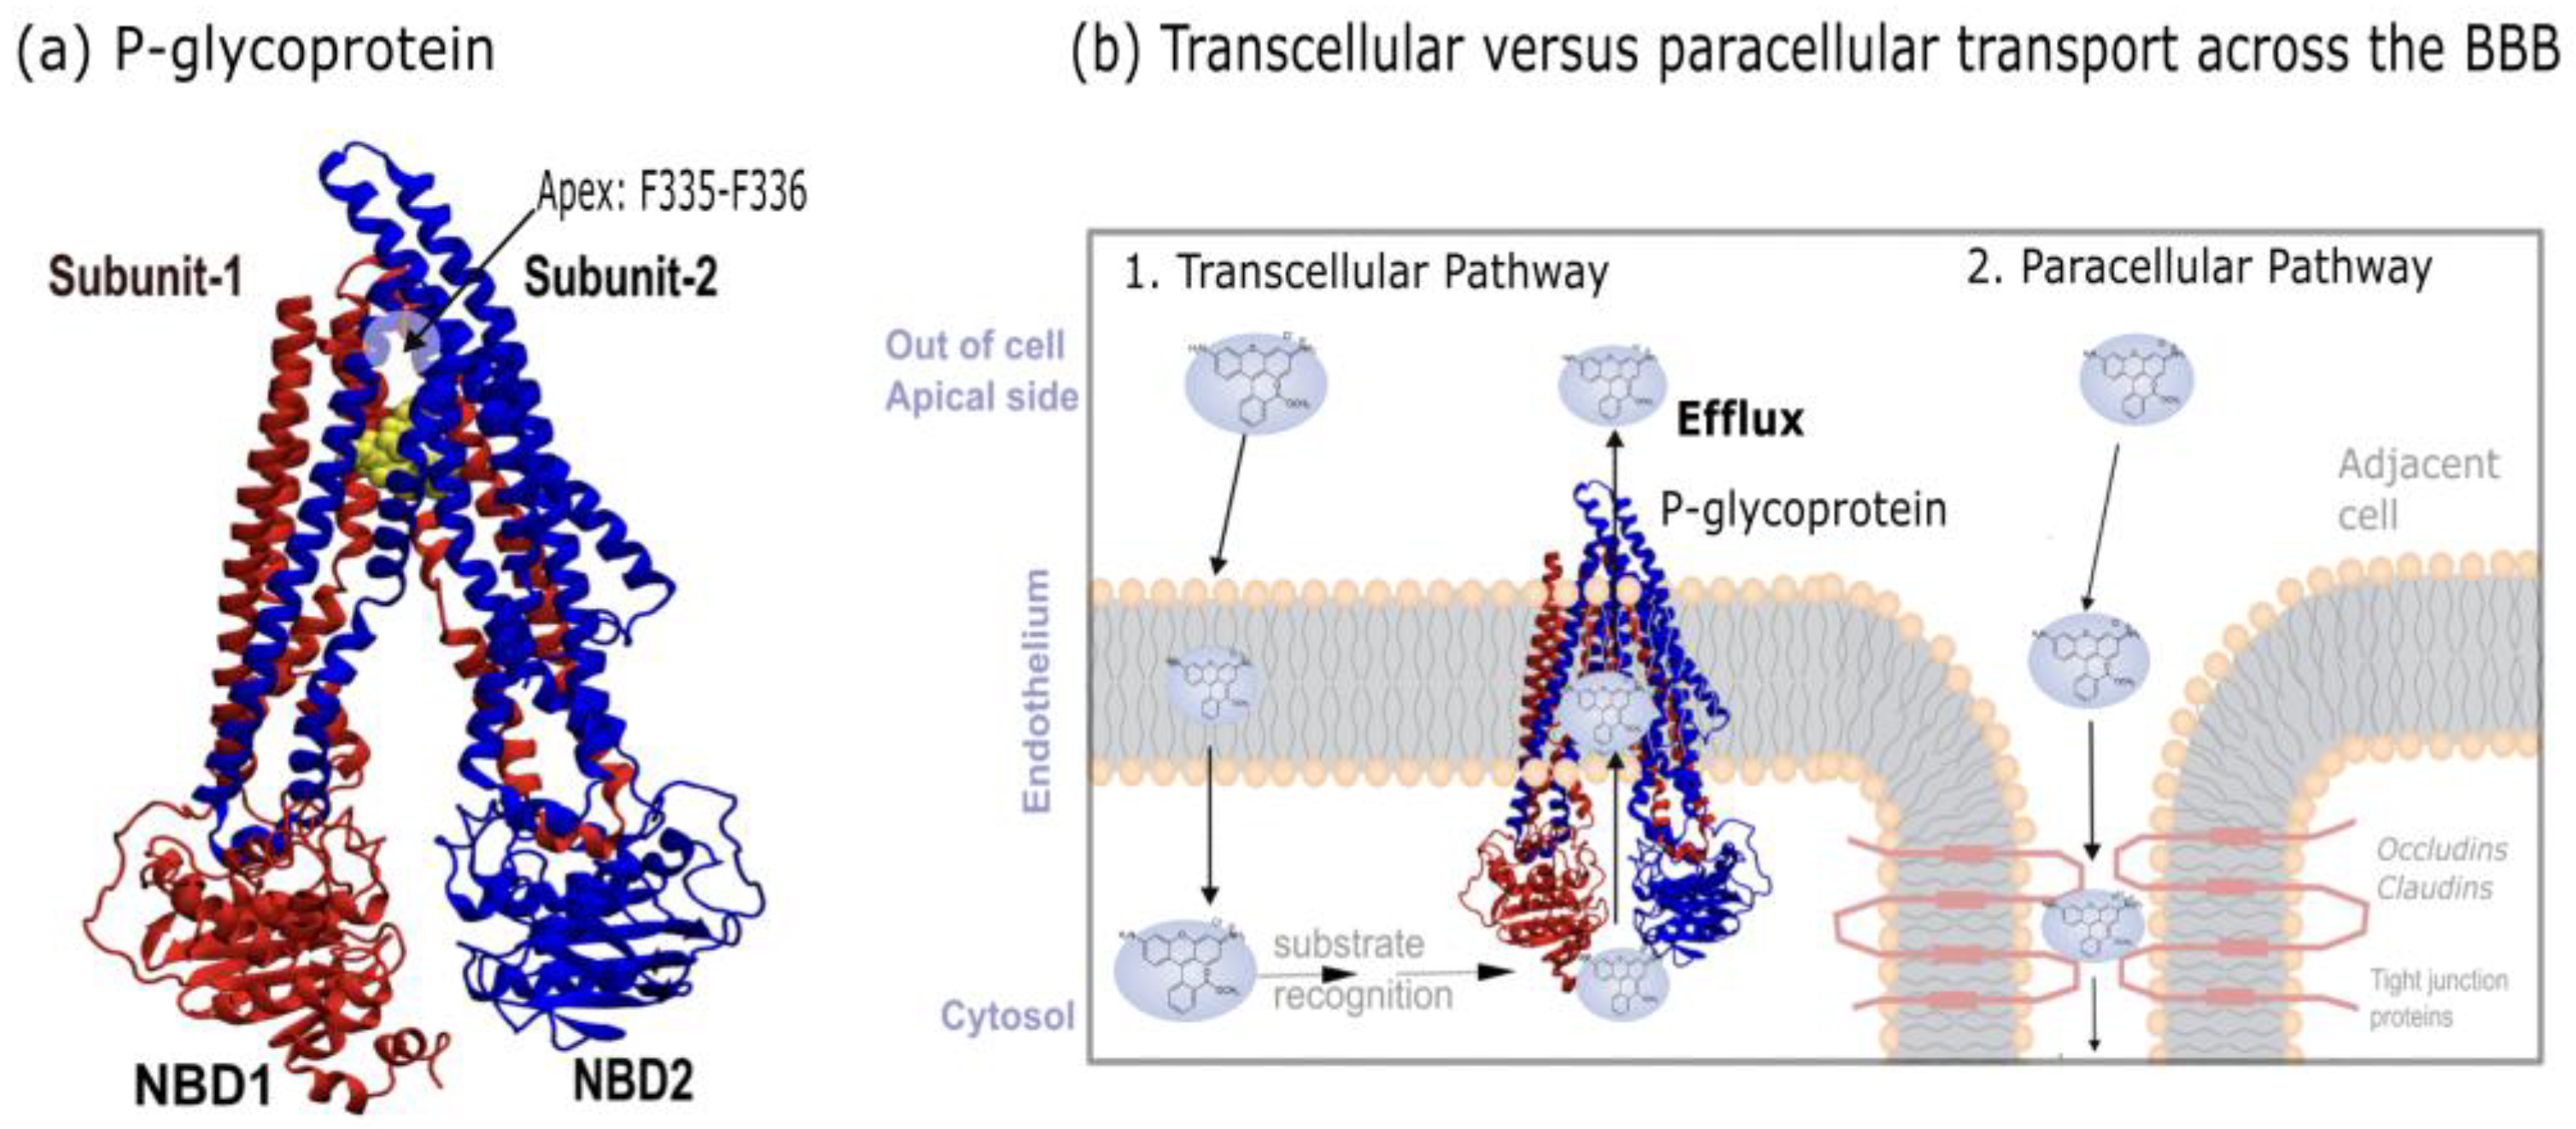
Figure 2.
Multimodality of P-gp inhibition arranged by state of oligomerization. (a) Inhibition of P-gp by a monomer of QZ-Leu (PDB id 4Q9K; X-ray, 3.80 Å) [7], with the binding pose shown in van der Waals representation and associated chemical structure depicted. (b) Inhibition of P-gp by a dimer of tariquidar (PDB id 7A6E; cryo-EM, 3.60 Å) [23]. (c) Inhibition of P-gp by a trimer of elacridar (PDB id 8Y6I; cryo-EM, 2.54 Å) [24]. This structure possesses an unresolved NBD-NBD lobe region. (d) Average distance between the centre-of-mass (COM) of each inhibitor moiety and the COM residue F335 and residue F336. Due to the presence of uneven number of inhibitors between (a)-(c), the distance of each inhibitor is calculated to F335 and the procedure is repeated for F336. The error bar is the standard deviation (σ) of each individual distance obtained per structure. (e-f) Binding site analysis of recent P-gp inhibitors in the PDB. (e) Inhibition of P-gp by a monomer of QZ-Leu (PDB id 4Q9K; X-ray, 3.80 Å) [7], with the binding pose shown in licorice representation. (f) Inhibition of P-gp by a dimer of tariquidar (PDB id 7A6E; cryo-EM, 3.60 Å) [23]. (g) Inhibition of P-gp by a trimer of elacridar (PDB id 8Y6I; cryo-EM, 2.54 Å) [24].
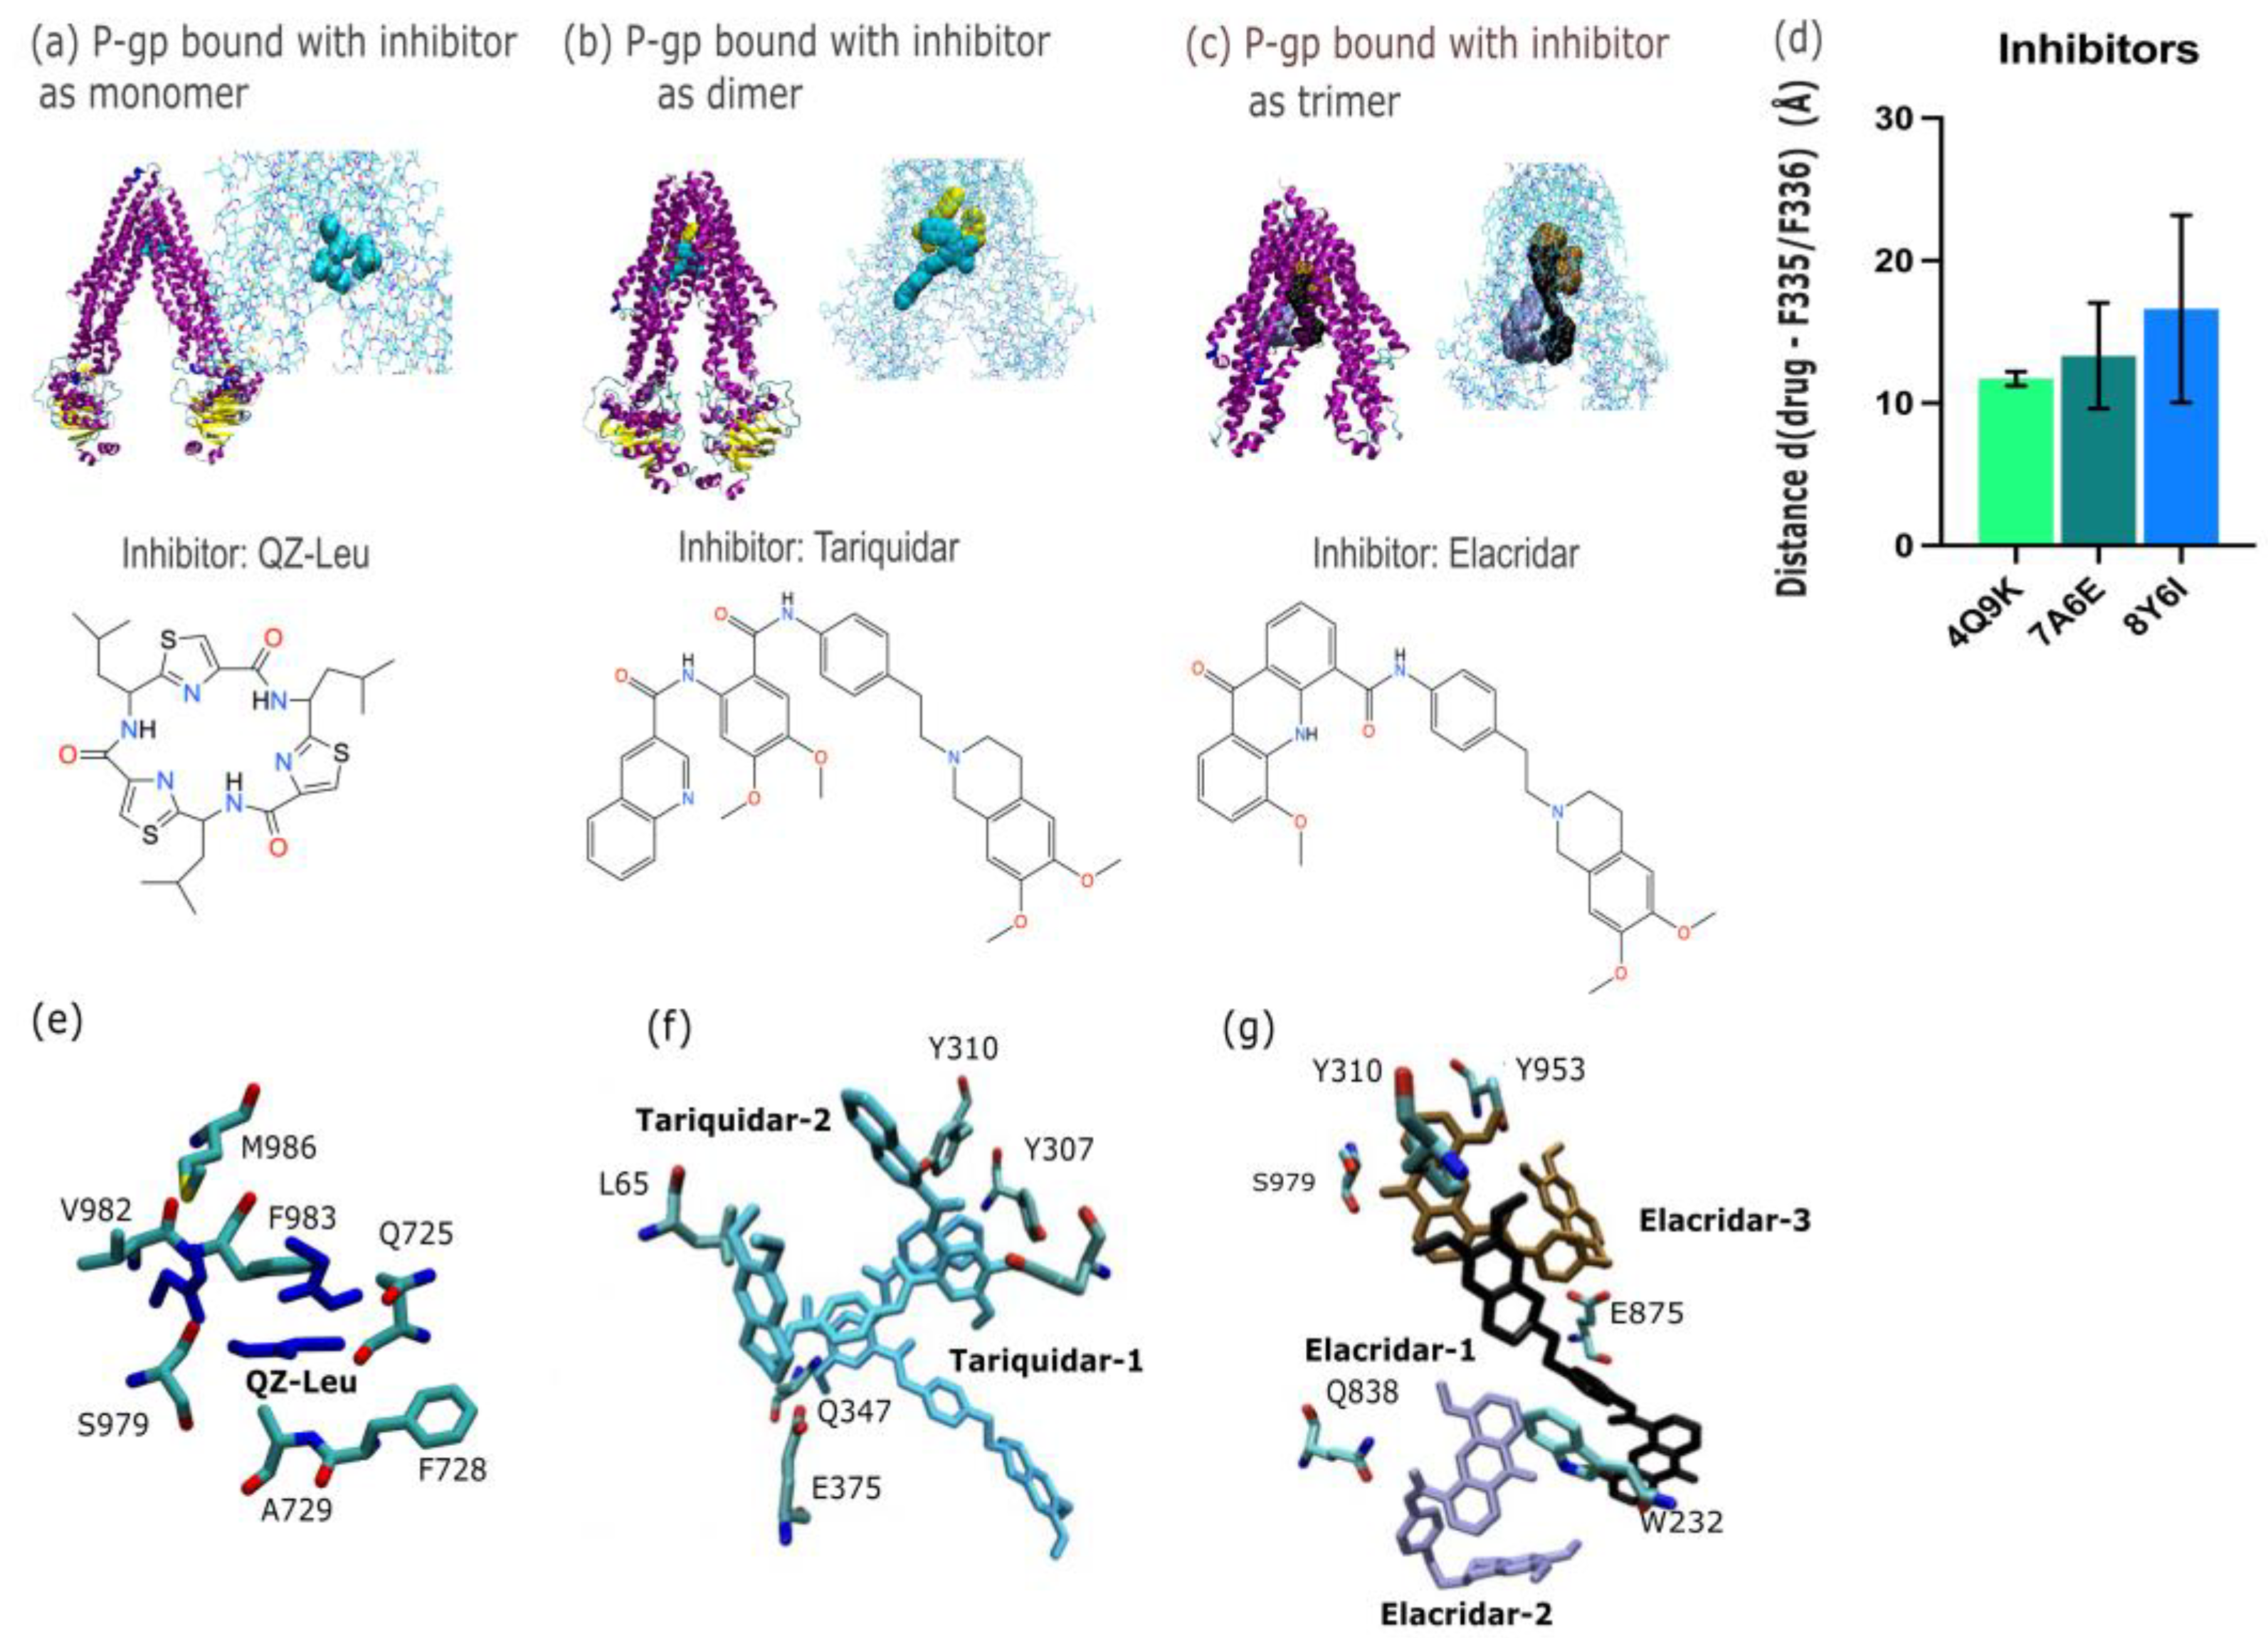
Figure 3.
Overview of the binding site of novel P-gp substrate conformations available in the PDB. (a) P-gp bound with the substrate and chemotherapeutic taxol (PDB id 6QEX; cryo-EM, 3.60 Å) [10]. (b) P-gp bound with the substrate and environmental polluter bromophenyl BDE100 (PDB id 6UJN; X-ray, 3.98 Å) [25]. (c) P-gp bound with the substrate and CFTR potentiator ivacaftor (PDB id 7OTG; cryo-EM, 5.40 Å) [26]. (d) Average distance between the centre-of-mass (COM) of each substrate moiety and the COM residue F335 and residue F336. To follow the same standard as for the inhibitors in Figure 2, the distance of each substrate is calculated to F335 and the procedure is repeated for F336. The error bar is the standard deviation (σ) of each individual distance obtained per structure. (e-g) Overview of the binding site of recent P-gp substrates of chemotherapeutic or environmental concern available in the PDB. (e) P-gp bound with the substrate and chemotherapeutic taxol (PDB id 6QEX; cryo-EM, 3.60 Å) [10], with the binding pose shown in licorice. (f) P-gp bound with the substrate and environmental polluter bromophenyl BDE100 (PDB id 6UJN; X-ray, 3.98 Å) [25]. (g) P-gp bound with the substrate and CFTR potentiator ivacaftor (PDB id 7OTG; cryo-EM, 5.40 Å) [26].
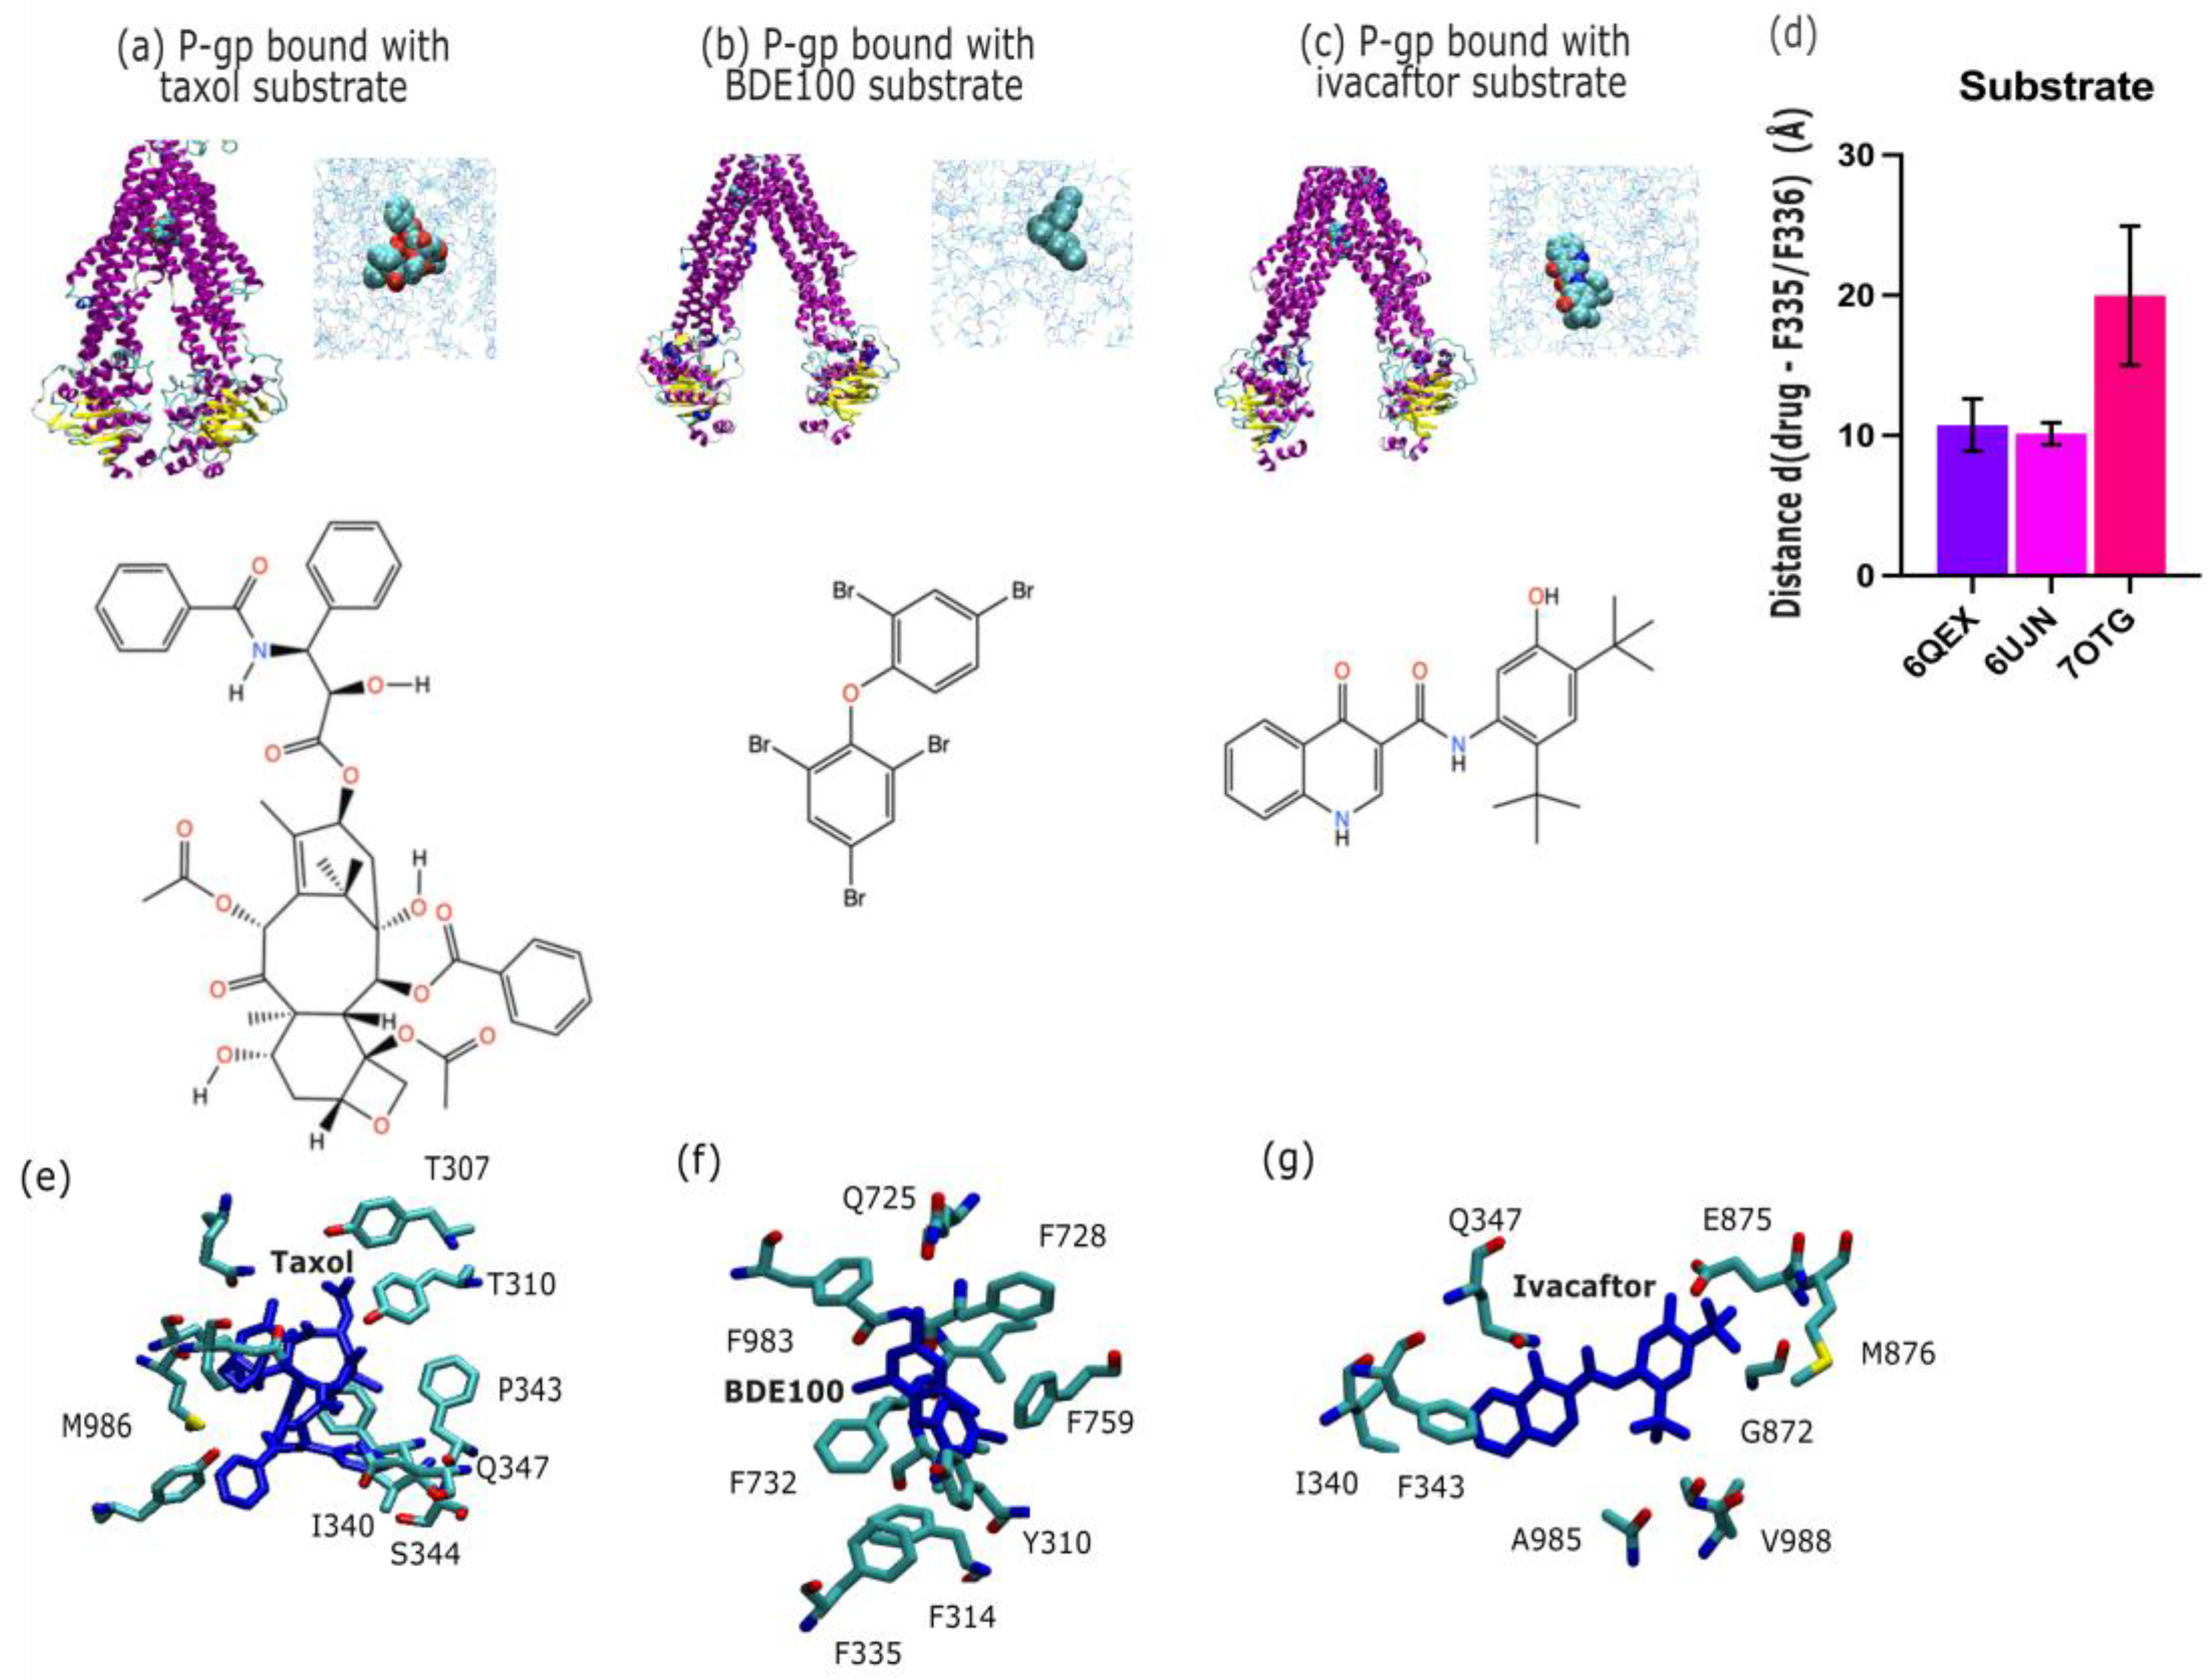
Figure 4.
Binding poses predicted by the AI tool Boltz-2 for (a-c) P-gp inhibitors and (d-f) P-gp substrates. (a) P-gp inhibition by QZ-Leu, (b) P-gp inhibition by tariquidar, (c) P-gp inhibition by elacridar. (d-f) Overview of the binding site of recent P-gp substrates of chemotherapeutic or environmental concern available in the PDB. (d) P-gp bound with the substrate and chemotherapeutic taxol (PDB id 6QEX; cryo-EM, 3.60 Å) [10], with the binding pose shown in licorice. (e) P-gp bound with the substrate and environmental polluter bromophenyl BDE100 (PDB id 6UJN; X-ray, 3.98 Å) [25]. (f) P-gp bound with the substrate and CFTR potentiator ivacaftor (PDB id 7OTG; cryo-EM, 5.40 Å) [26].
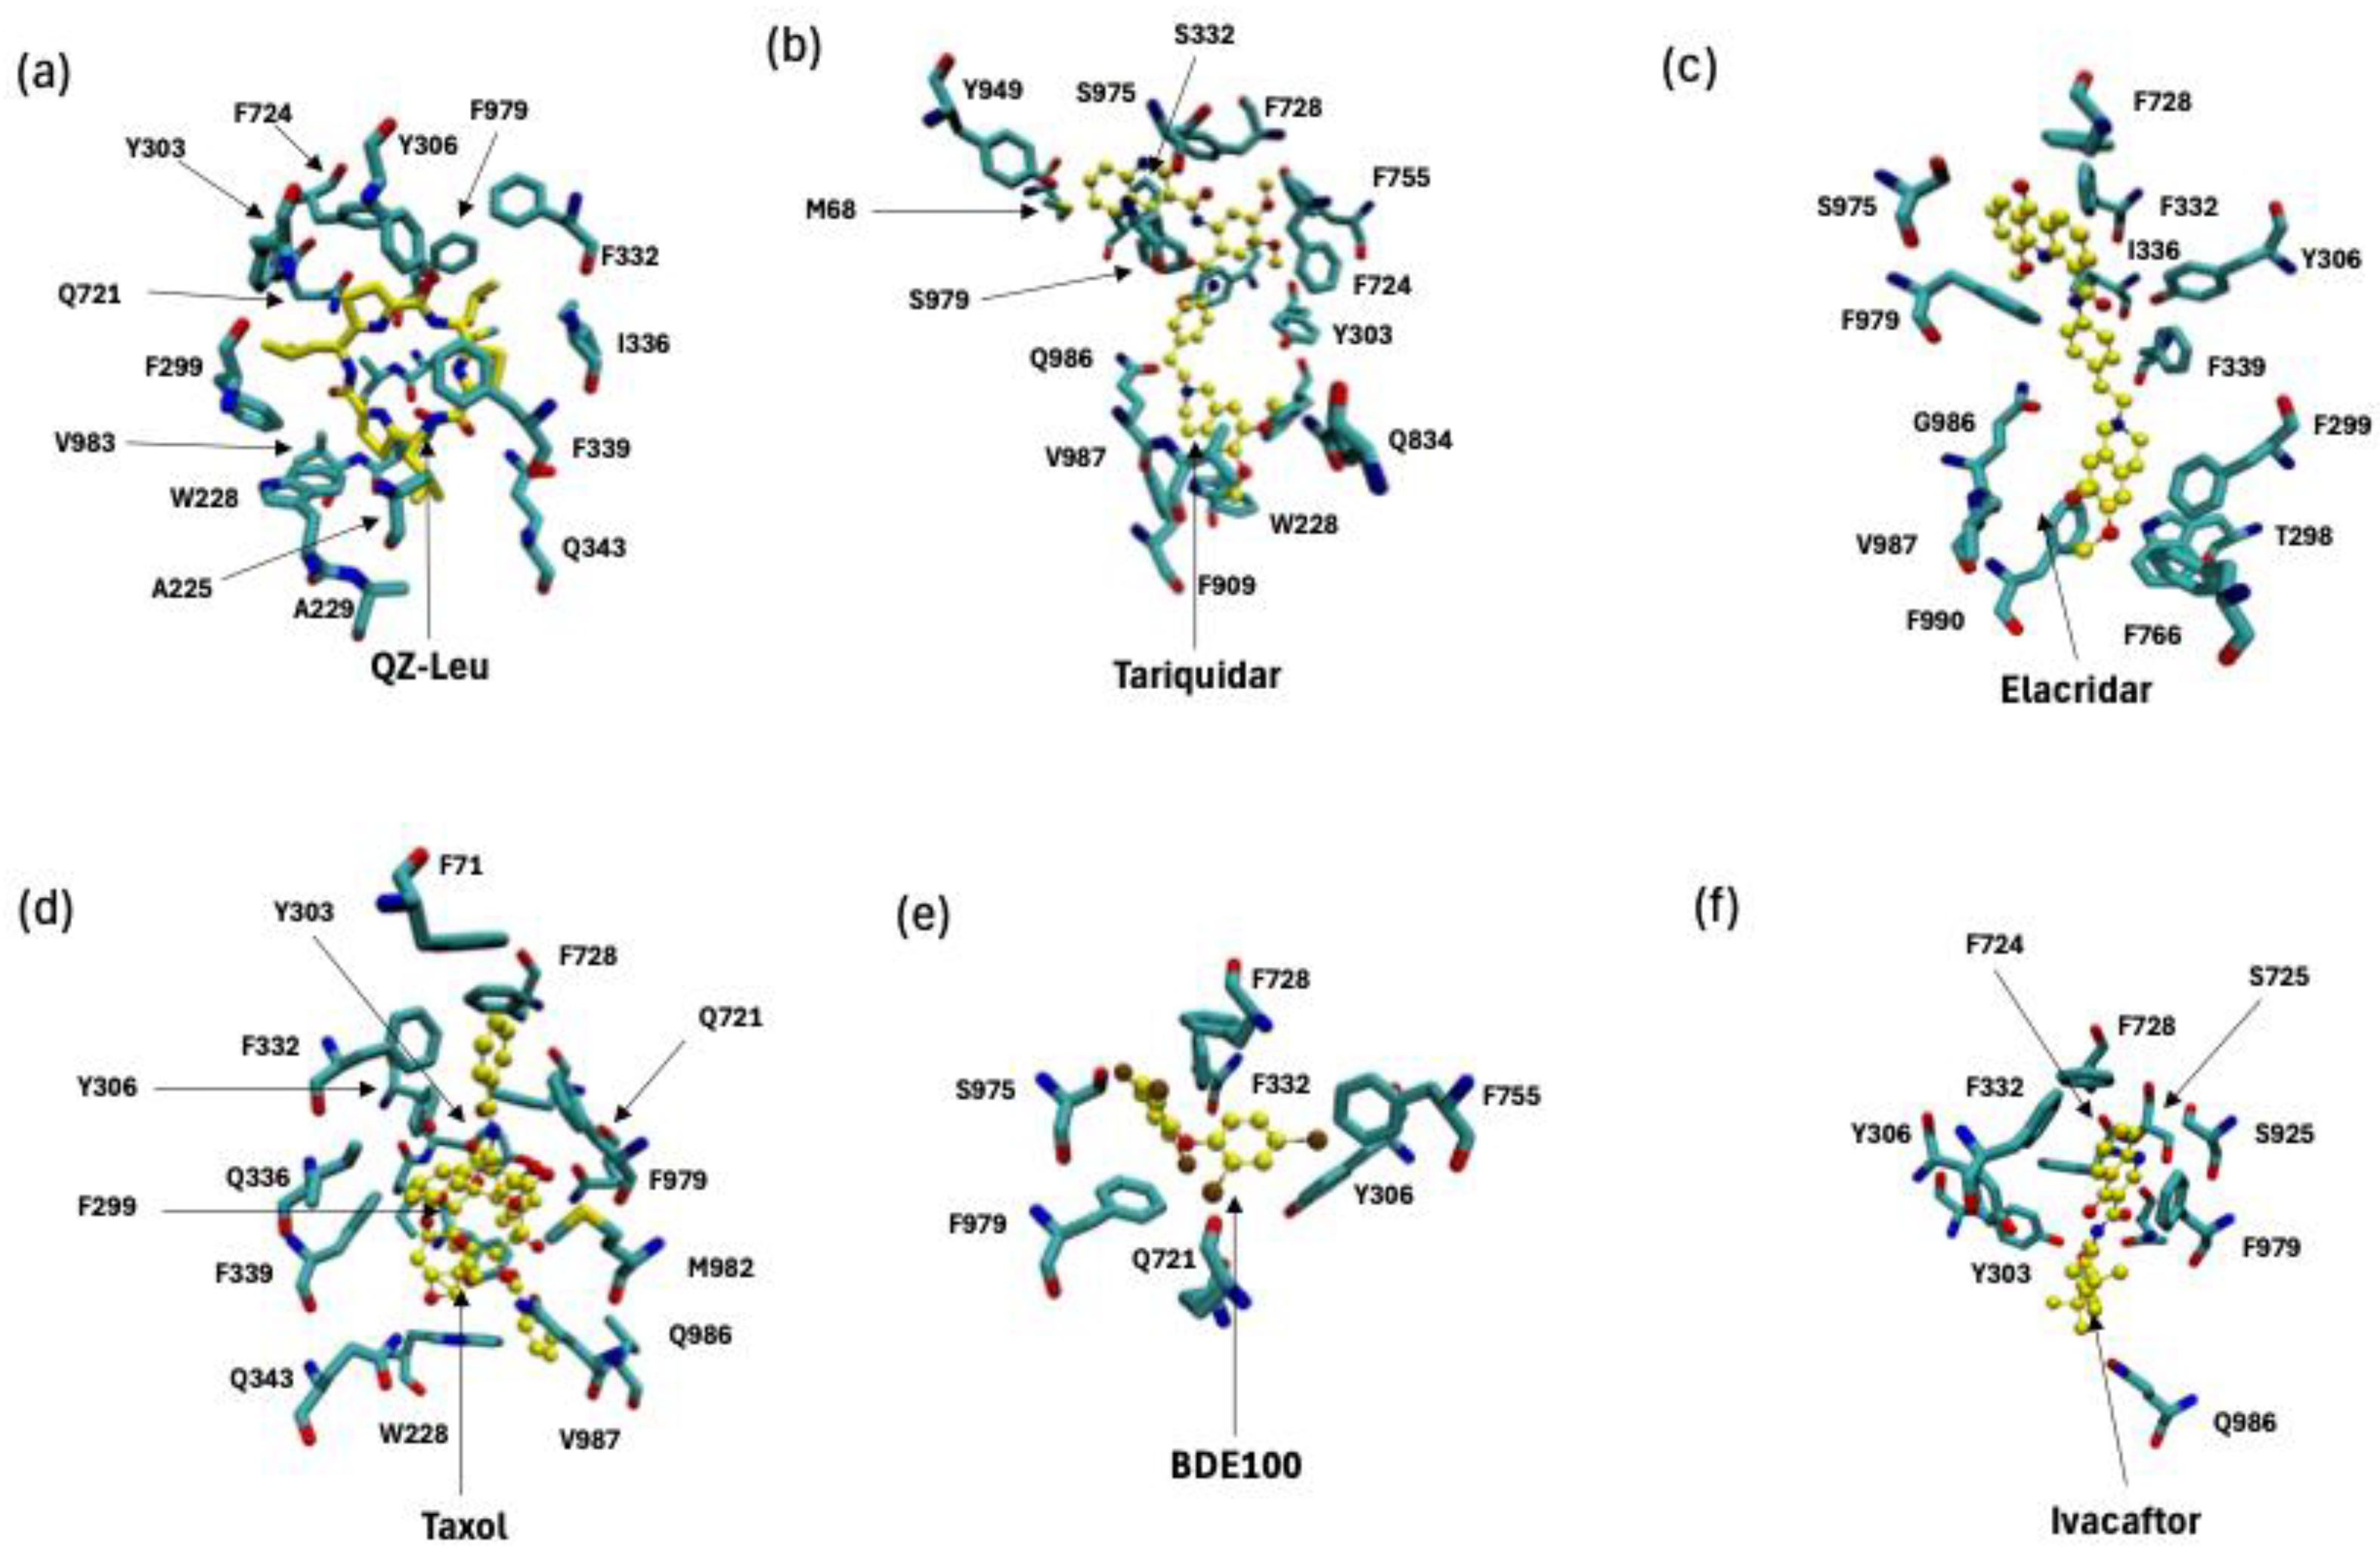
Figure 5.
Comparing the binding poses predicted by the AI tool Boltz-2 (orange) to those from X-ray crystallography or cryo-EM (red) for the P-gp inhibitor QZ-Leu, the P-gp substrate BDE100 and the P-gp substrate ivacaftor. (a-b) P-gp inhibition by QZ-Leu (PDB id 4Q9K; X-ray, 3.80 Å) [7]. (c-d) P-gp bound with the substrate and environmental polluter bromophenyl BDE100 (PDB id 6UJN; X-ray, 3.98 Å) [25]. (e-f) P-gp bound with the substrate and CFTR potentiator ivacaftor (PDB id 7OTG; cryo-EM, 5.40 Å) [26]. This comparison suggests that Boltz-2 is a valid tool for predicting P-gp substrate and inhibitor binding locations.
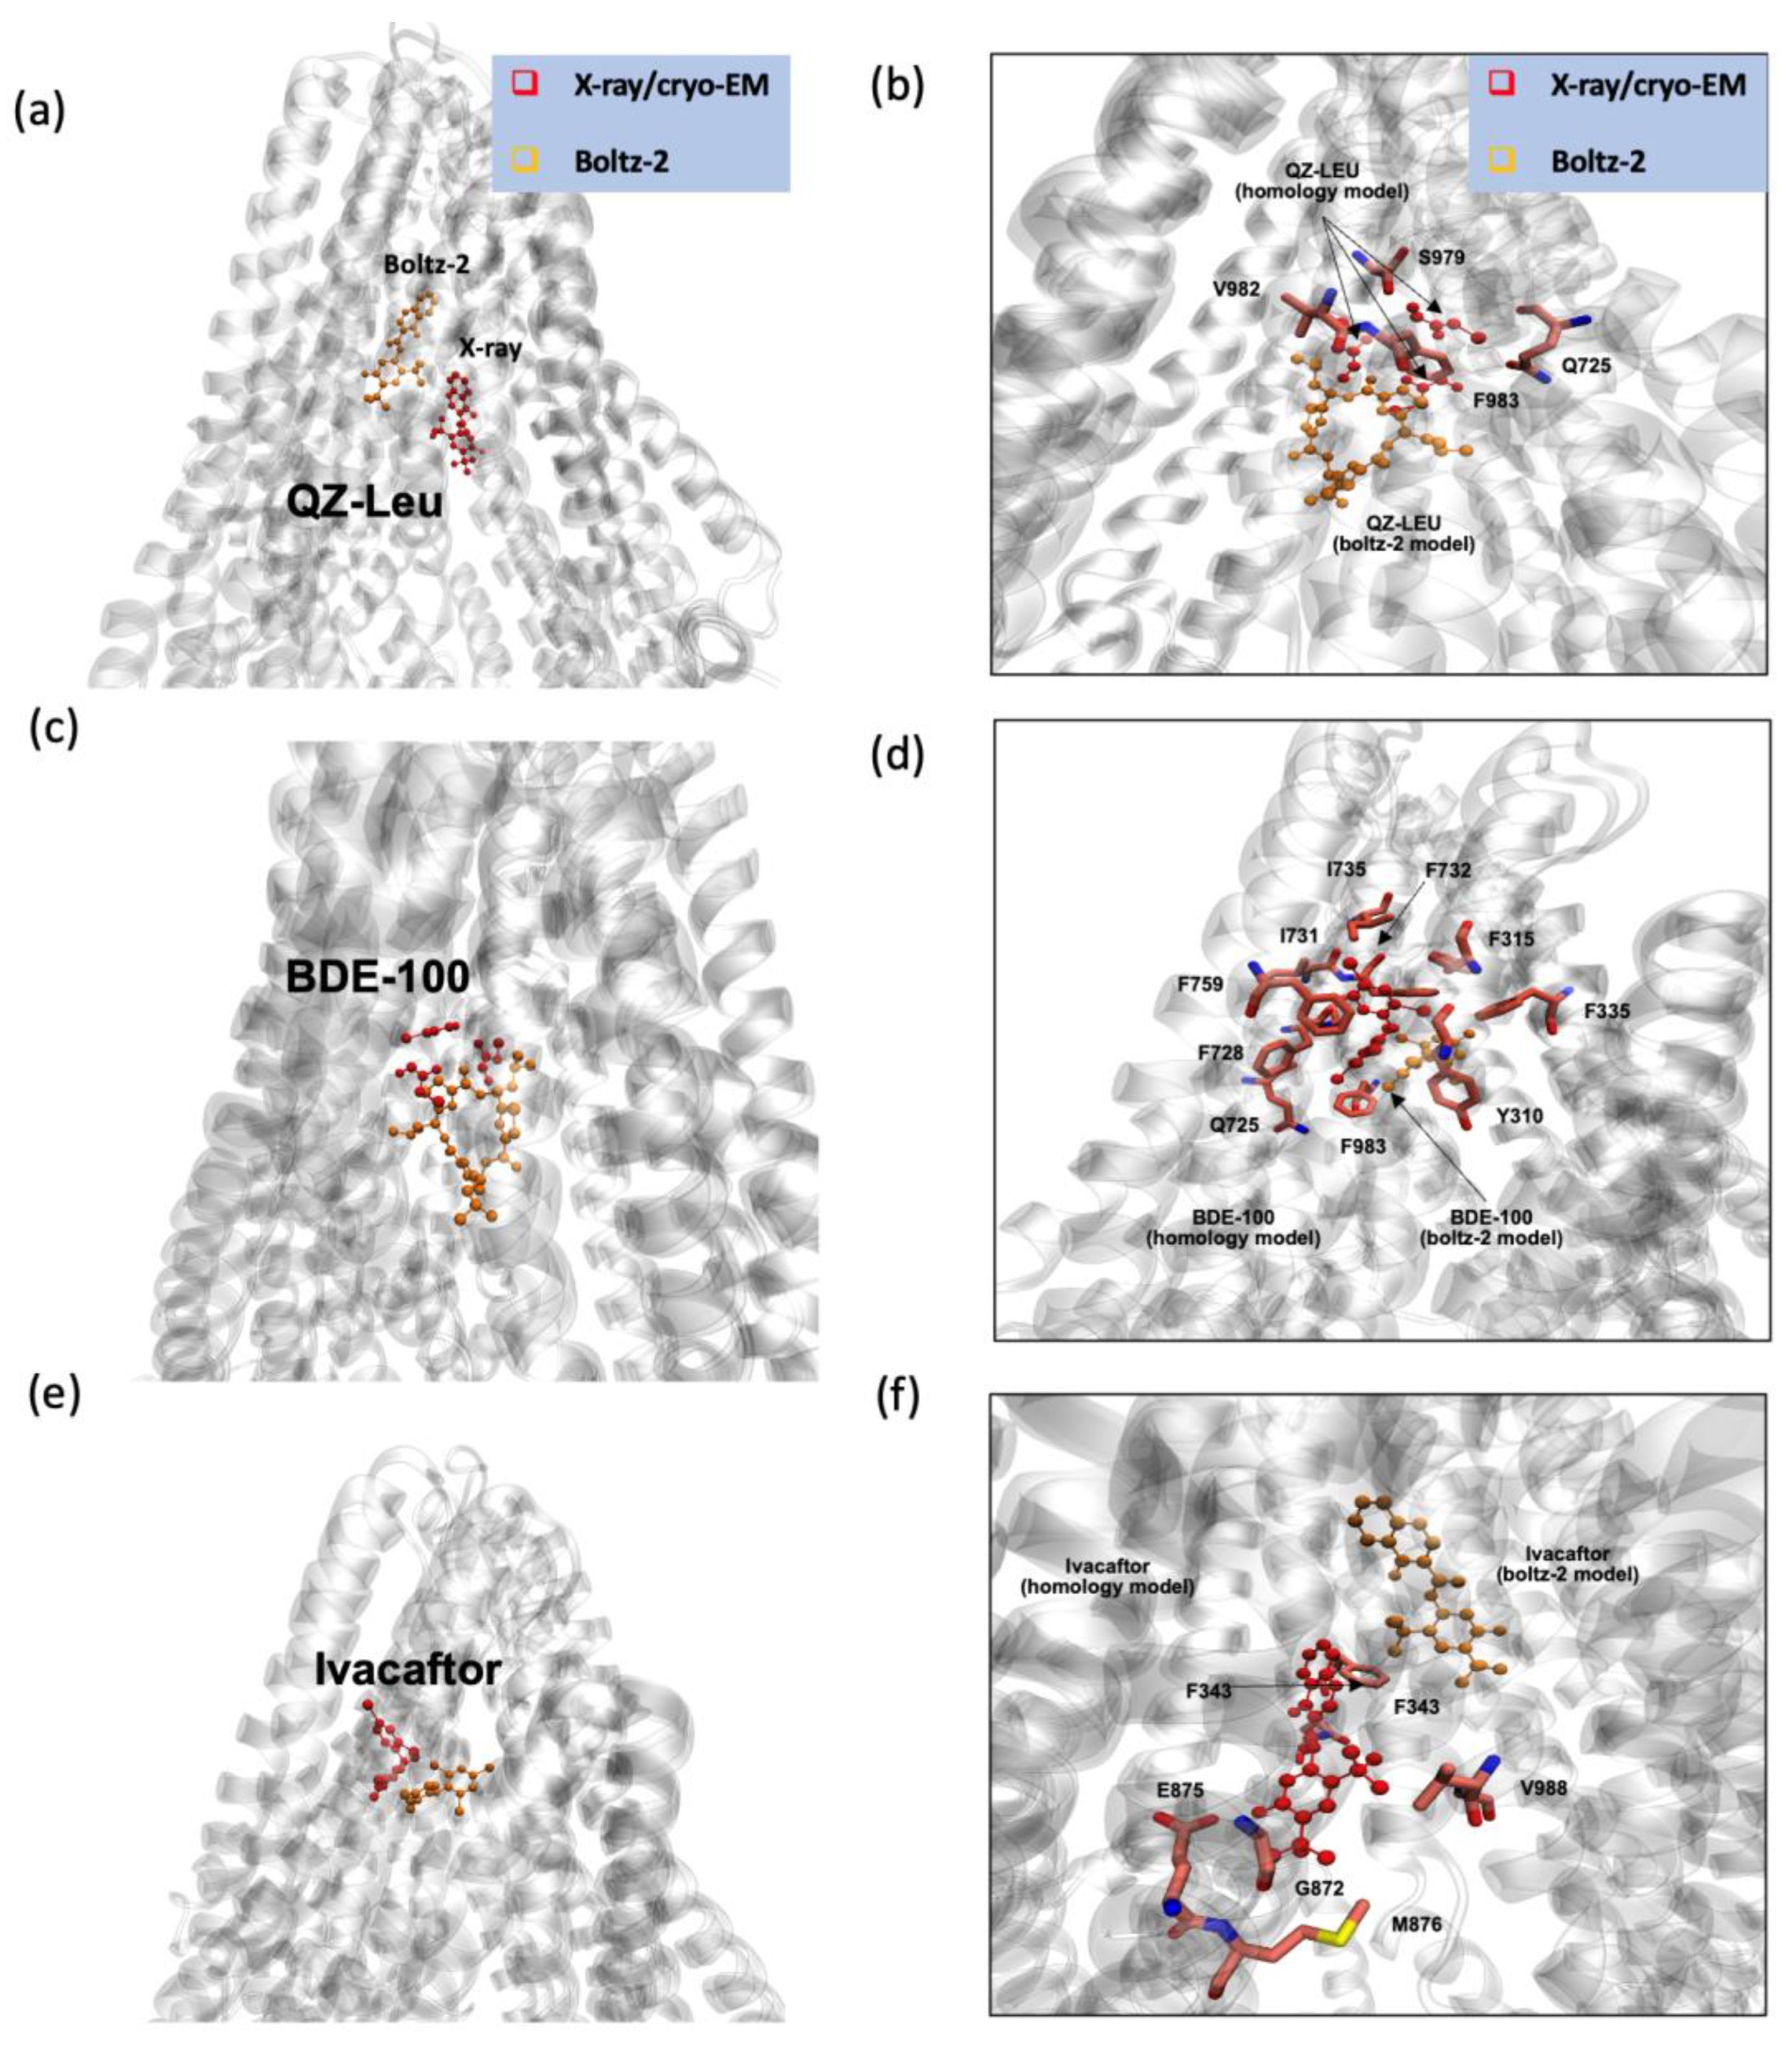
Figure 6.
P-glycoprotein and P-gp-substrate coarse-grain models (n = 2 replicates). (a, c) Analysis of coarse-grain model of apo P-gp trajectory (50 μs) using MARTINI with an elastic network model [32]. The protein RMSD (μ ± σ) over 50 μs for replica-1 was found to be 6.1 ± 0.4 Å, and for replica-2 it was 6.1 ± 0.3 Å. (b, d) Partitioning of CG rhodamine-123 into the bilayer, as defined % of rhodamine-123 within 5 Å of the bilayer, using a MARTINI representation, for replicate 1 (red) and 2 (blue). (c, d) System representations depicting P-gp (yellow) in a Quicksurf representation, with a BMEC membrane composed of 9 types of lipids. The ions are rendered in van der Waals shape. The W water bead is not rendered for visual clarity, but is given a legend representation as a red sphere. A legend of each component is given below, ion beads, water beads, membrane beads and the P-gp rendering. (e) Partitioning of CG rhodamine-123 into the bilayer, as defined % of rhodamine-123 within 5 Å of the bilayer, using a MARTINI representation (red) compared to the partitioning of atomistic rhodamine-123 from CHARMM General Force Field [34] (CGenFF) (blue) across 2 μs for purposes of equal comparison. Atomistic data is from [6] © 2023 American Chemical Society.
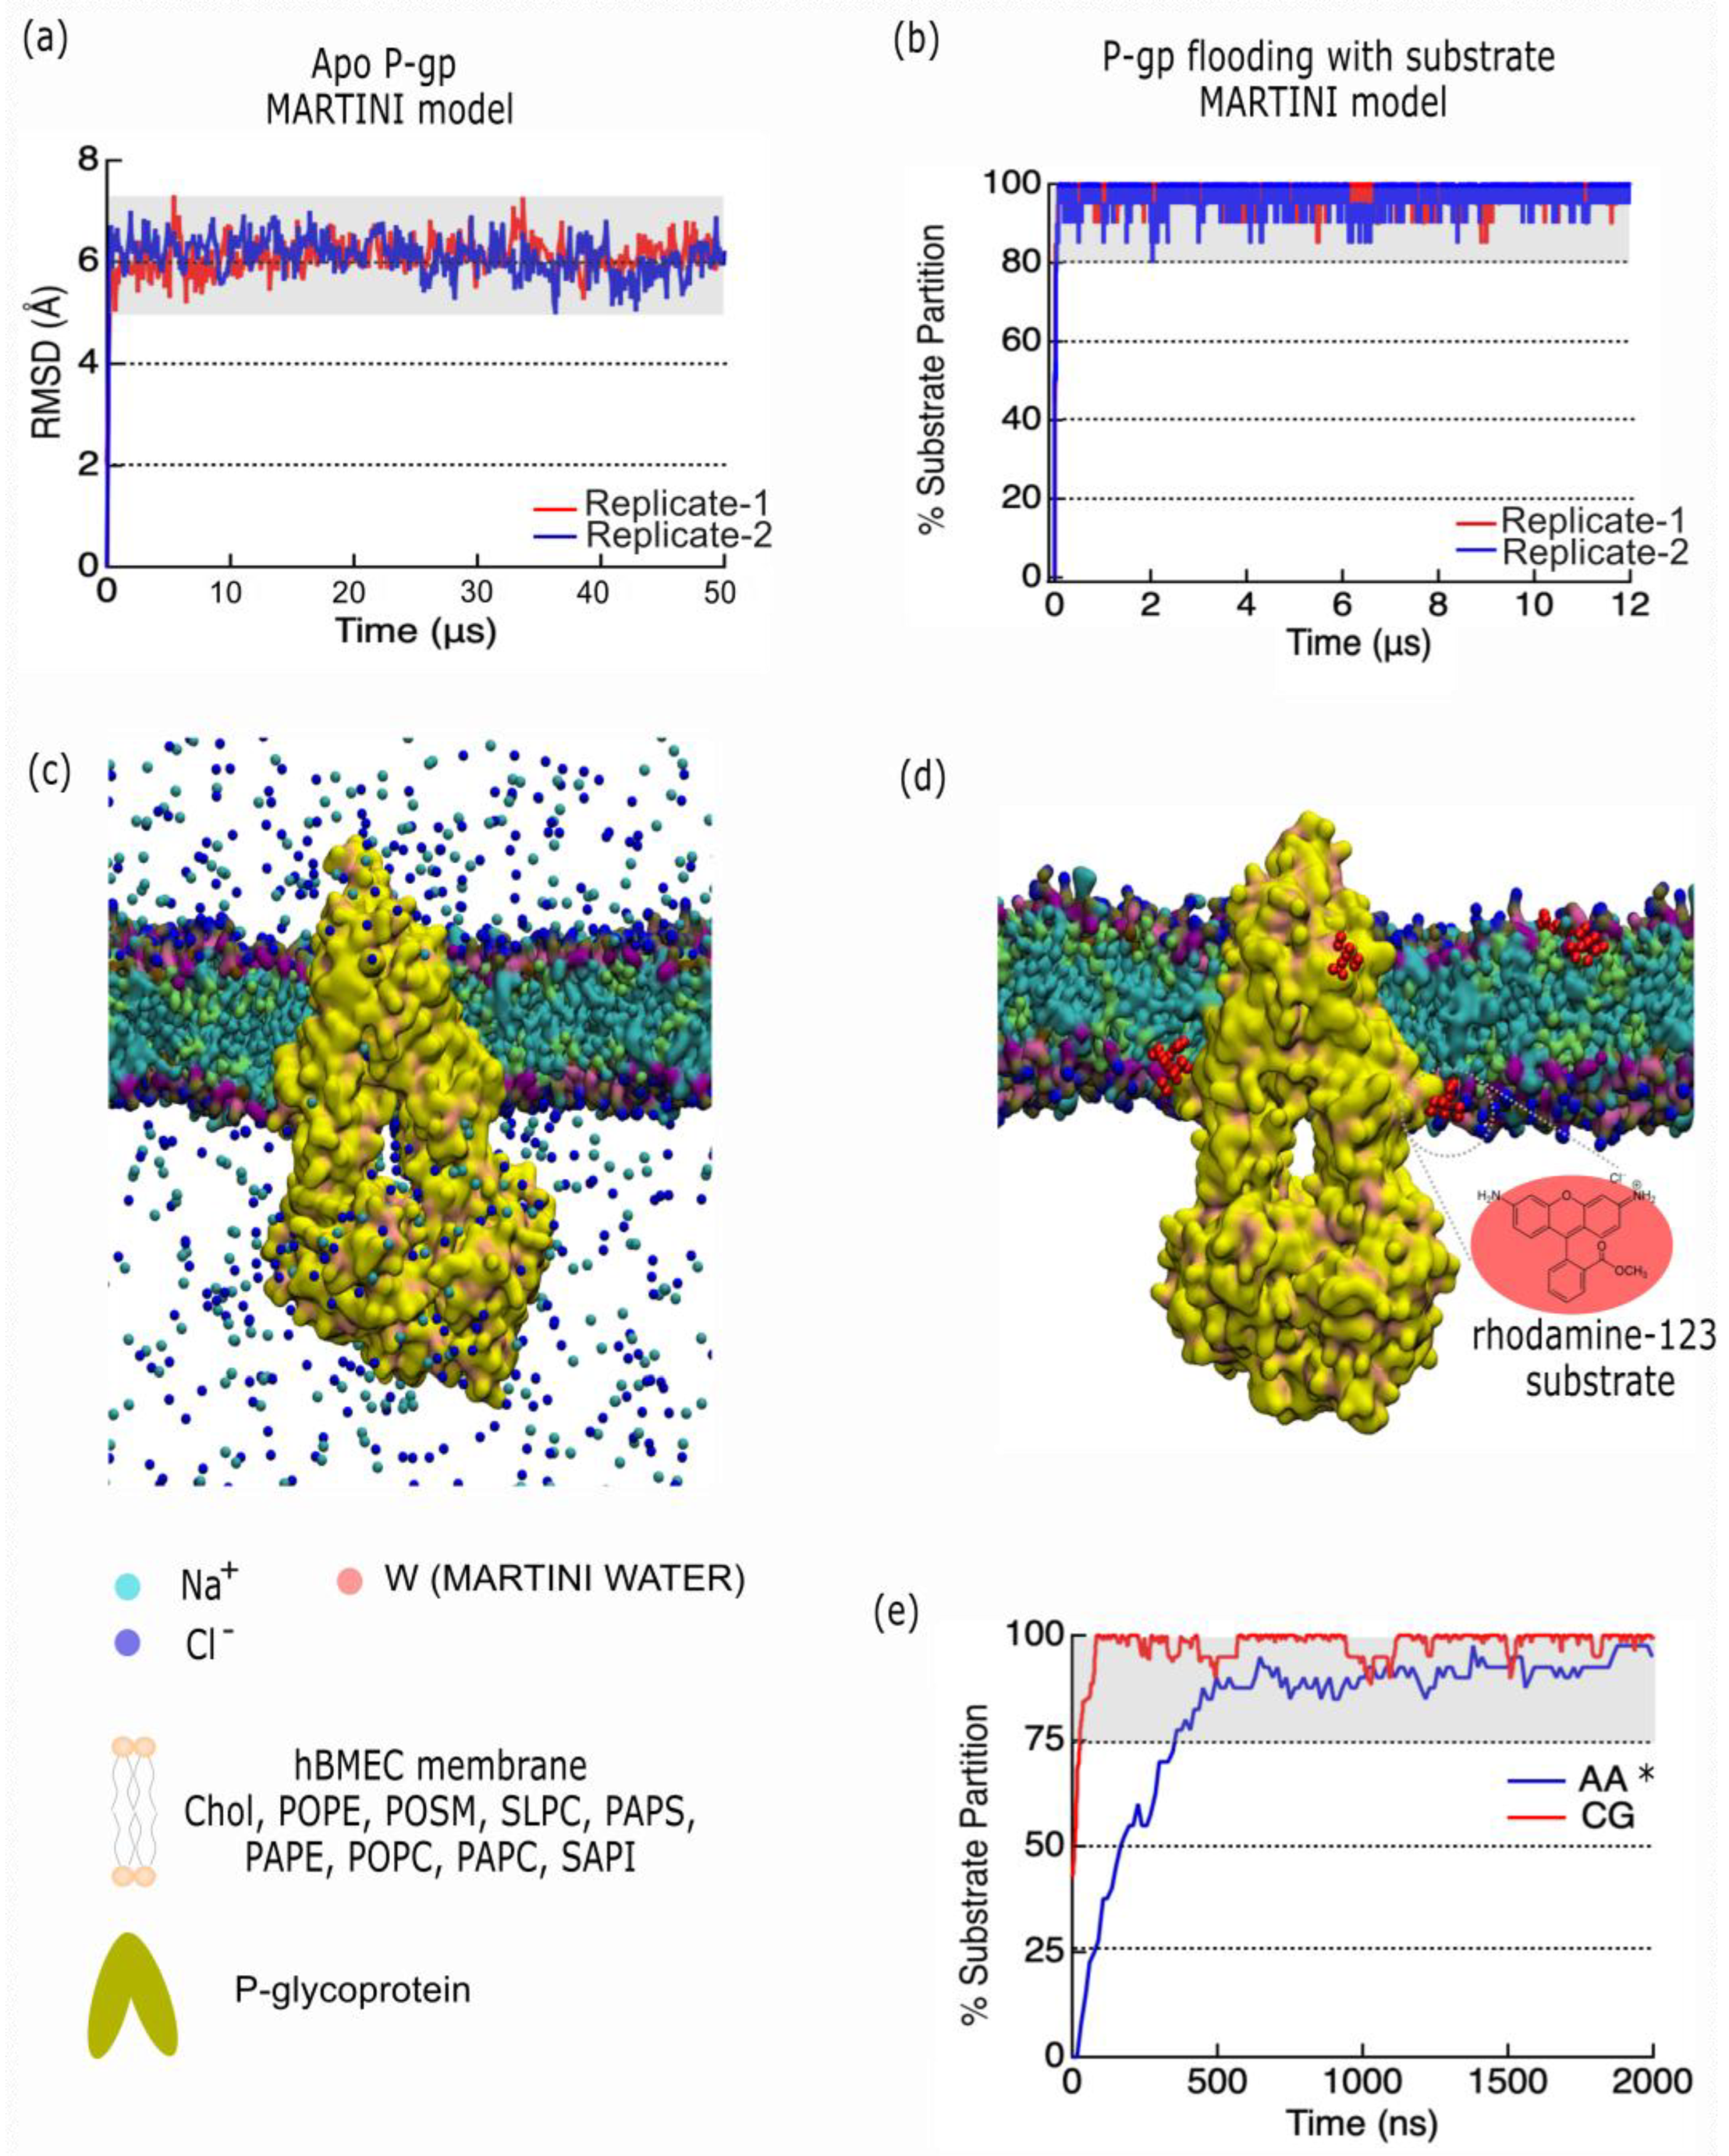

Table 1.
Predicted IC50 and affinity probability obtained from Boltz-2 [27]. Summary of the confidence metrics for structural prediction. The predicted Template Modeling (pTM; 0.7-1: good; 0.5-0.7: average; 0-0.5: low) score considers the overall fold accuracy of a single protein chain [27]. The Predicted inter-chain TM (ipTM; 0.8-1: good; 0.6-0.8: average; 0-0.6: low) score assesses the inter-chain interactions in multimeric models [27]. The Confidence Score (0.75-1: good; 0.5-0.75: average; 0-0.5 low) showcases the overall model quality. The Average predicted Local Distance Difference Test (pLDDT; 0.7-1: good; 0.5-0.7: average; 0-0.5: low) is the per-residue confidence metric [27], and reflects the local structural reliability. The Affinity Probability (0.75-1: good; 0.5-.075 average; 0-0.5: low) estimates the likelihood that a predicted protein-ligand complex corresponds to a true, energetically favorable binding interaction [27]. The IC50 denotes the half-maximal inhibitory concentration, and is defined as the modulator concentration required to inhibit 50% of target activity, with a lower value denoting a higher modulator potency. The predicted negative log₁₀ of IC50 (pIC50) correlates with the potency of inhibition, with a higher value predicting a greater inhibitory effect.
| Inhibitors | Substrates | |||||
|---|---|---|---|---|---|---|
| QZ-Leu | Tariquidar | Elacridar | Taxol | BDE100 | Ivacaftor | |
| Predicted TM-Score (pTM) | 0.763 | 0.772 | 0.781 | 0.780 | 0.792 | 0.774 |
| Interface Predicted TM-Score (ipTM) | 0.890 | 0.911 | 0.933 | 0.892 | 0.779 | 0.915 |
| Confidence Score | 0.743 | 0.785 | 0.784 | 0.755 | 0.781 | 0.777 |
| Average predicted local distance difference test (pLDDT) | 0.706 | 0.753 | 0.746 | 0.721 | 0.782 | 0.743 |
| Affinity Probability | 0.402 | 0.667 | 0.672 | 0.545 | 0.503 | 0.663 |
| Predicted pIC50 | 6.565 | 7.243 | 6.447 | 6.928 | 5.589 | 6.237 |
| Predicted IC50 (nM) | 272.3 | 57.1 | 357.3 | 118.0 | 2580 | 579.4 |
Table 2.
Lipid distribution in BBB MARTINI 3.0.b.3.2 model. Values are provided in percentage and (absolute) values.
Table 2.
Lipid distribution in BBB MARTINI 3.0.b.3.2 model. Values are provided in percentage and (absolute) values.
| Lipid | Total bilayer (%) |
|---|---|
| CHOL | 30 (96) |
| POPE | 6 (20) |
| POSM | 19 (61) |
| SLPC | 8 (27) |
| PAPS | 8 (25) |
| PAPE | 15 (47) |
| POPC | 4 (13) |
| PAPC | 8 (27) |
| SAPI | 2 (6) |
Disclaimer/Publisher’s Note: The statements, opinions and data contained in all publications are solely those of the individual author(s) and contributor(s) and not of MDPI and/or the editor(s). MDPI and/or the editor(s) disclaim responsibility for any injury to people or property resulting from any ideas, methods, instructions or products referred to in the content. |
© 2025 by the authors. Licensee MDPI, Basel, Switzerland. This article is an open access article distributed under the terms and conditions of the Creative Commons Attribution (CC BY) license (http://creativecommons.org/licenses/by/4.0/).
Copyright: This open access article is published under a Creative Commons CC BY 4.0 license, which permit the free download, distribution, and reuse, provided that the author and preprint are cited in any reuse.


