

Submitted:
25 August 2025
Posted:
26 August 2025
You are already at the latest version
Abstract
Bibliometric indicators play a key role in assessing research performance at individual, departmental, and institutional levels, influencing both funding allocation, and university rankings. However, despite their widespread use, bibliometrics are often applied indiscriminately and without discrimination, overlooking contextual factors that affect research productivity. This research investigates how gender, academic discipline, institutional location, and academic rank influence bibliometric outcomes within the Greek Higher Education system. A dataset of 2015 faculty profiles members from 18 universities and 92 departments was collected and analyzed using data from Google Scholar and Scopus. The findings reveal significant disparities in publication and citation metrics: female researchers, faculty in peripheral institutions, and those in specific disciplines (such as humanities) tend to score lower values across several indicators. These inequalities underscore the risks of applying one-size-fits-all evaluation models in performance-based research funding systems. The paper moves beyond one-size-fits-all perspective and proposes that bibliometric evaluations should be context-sensitive and grounded in discipline and rank-specific benchmarks. By establishing more refined and realistic expectations for researcher productivity, institutions and policymakers can use bibliometrics as a constructive tool for strategic research planning and fair resource allocation, rather than as a mechanism that reinforces the existing biases. The study also contributes to ongoing international discussions on the responsible use of research metrics in higher education policy.
Keywords:
bibliometrics
; research assessment
; higher education
; performance-based funding
; regional disparities
; gender inequalities
; disciplinary differences
; strategic planning
1. Introduction
Bibliometrics are closely linked to both funding and the ranking of academic entities, such as Higher Education Institutes (HEI), departments, or even individual researchers. At the national level, higher education, research policy bodies, and funding authorities often set evaluation criteria that incorporate bibliometric indicators as a key component. Likewise, international organizations responsible for publishing annual university rankings, utilize bibliometric data to measure the research impact of universities worldwide. For instance, the Quacquarelli Symonds (QS) publishes the annual QS World University Rankings [1], in which citations per faculty constitute a significant factor. Similarly, the Best Global Universities ranking, produced by Clarivate, U.S. News and World Report, assigns more than 65% of its overall weighting to bibliometric indicators [2].
Despite being recognized as the most established quantitative method to evaluate the performance and the impact of research-oriented activities within a HEI, bibliometric indicators have also faced substantial criticism. Especially when allocating national funds to universities, policymakers and funding agencies must carefully consider how they use and interpret bibliometric data to avoid injustices. In this context, the presented study investigates how bibliometric indicators are affected by specific aspects within a national performance-based research funding system, as well as within the framework of self-assessment and strategic planning of a university, a faculty, or even a department.
The research productivity of universities depends on several factors, which have already been discussed sporadically in prior research efforts. Key dimensions that have been identified in the literature include: i) scientific disciplines differences [3], ii) the geographical location of the universities [4], and iii) the researchers’ academic rank [5,6]. In this work, we examine how these factors contribute to disparities in research output, using a large dataset comprising bibliometric data from 2015 researchers affiliated with Greek universities. Our findings reveal significant inequalities in publication, associated with scientific discipline, universities’ location, researcher gender, and, lastly, academic ranking. “One-size-fits-all” or “horizontal” approaches fail to address the complexity of the academic landscape and may reinforce and enlarge existing disparities. Therefore, policymakers and governmental agencies are urged to consider these differentiated factors within their strategic planning.
The factors that influence the measurement of research performance through the use of bibliometric indicators are more or less well known; however, this study confirms their significance using a large sample of researchers. The main conclusion is that horizontal solutions, or those that fail to consider specific contextual differences, such as geographic location or scientific discipline, are likely to lead to imbalances and injustices, especially in the context of research funding. Furthermore, the goals set by institutions and evaluation bodies regarding individual researchers’ performance should be based on realistic data that takes into account both the particularities of the scientific field, and the stage of each researcher’s career trajectory.
This paper aims to demonstrate that, with the appropriate adjustments, bibliometric indicators can become a valuable tool for researcher evaluation and benchmarking, rather than a source of stress, discouragement, or contention. In this direction, the presented study explores how bibliometric indicators are affected by specific parameters within a national research assessment and resource allocation frameworks, as well as in the context of institutional self-assessment and strategic planning.
This study aims to address the following research questions:
RQ1 - Does the scientific discipline of researchers substantially affect the bibliometric indicators (from the basic to the more complex) and in what ways?
RQ2 - To what extent do the location of the academic unit (e.g., central or peripheral regions) and the gender impact the values of bibliometric indicators?
RQ3 - Is a unified national-level evaluation framework appropriate for assessing research performance across all institutions and disciplines, or are contextualized adjustments necessary?
RQ4 - Could discipline-specific, national-level bibliometric indicators serve as standards for assessing individual research performance?
A one-size-fits all evaluation model is unlikely to serve all cases fairly. To be effective and equitable, research assessment and strategic planning should be grounded in bibliometric indicators that are tailored to disciplinary and institutional contexts.
2. Related Background
2.1. Universities and the Importance of Bibliometrics
Over time, bibliometrics became a common practice within universities for measuring research impact at both national and international levels [7,8]. This is further reinforced when examining research productivity within the domain of bibliometrics itself. Indeed, conducting an advanced search query into the Scopus database, results indicate an increase in papers over the last seven years (2018-2025). More specifically, in the search query TITLE (“university” OR “academic institutions “) AND TITLE (“scientometrics” OR “bibliometrics”), the engine returned 54 documents ranging from 1987 up to 2025. Figure 1 presents the research activity on this topic over the past fifteen years (2008-2025). As illustrated, except for 2019, when only one document was published, there has been a gradual increase in the number of related publications over the last seven years.
A closer examination of the recent research retrieved from Scopus reveals several compelling reasons why universities and national policy makers in higher education should incorporate bibliometric analyses into their strategic planning and decision-making processes. Hammarfelt and colleagues conducted an in-depth investigation on the use of bibliometrics as a means to develop a more informed and performance-based research funding system (PRFS) [7]. The authors conducted a detailed examination of how national PRFS utilize bibliometrics to improve the allocation of resources in academic institutions of Sweden and Norway, relying on Hicks’ basic criteria [9]. That is, research must be numerically evaluated, each kind of PRFS should be applied at a national level, and governmental distribution of research funding should depend on the results of the evaluation itself.
Another contribution of bibliometrics in the academic context is enabling the comparison of different institutions based on their research performance. Consequently, several studies first elaborate on the methodological approach of gathering bibliometrics data from multiple universities, and then, applying consistent statistical tests to derive comparative insights [4,10,11]. However, the practical added value of such comparisons is not always apparent to policymakers, especially when their institution’s performance ranks lower compared to others. A fact that may lead to frustration regarding the effectiveness of their current research strategies. These comparisons primarily extract descriptive data that are useful for summarizing the research activity of a university. Without bibliometrics summary data over a defined period, a clear understanding of university research performance is lacking. Moreover, in the absence of such quantifiable metrics, it becomes challenging to develop predictive models that estimate an institution’s potential for improvement. Thus, bibliometrics comparisons serve as a crucial tool for numerically assessing a university’s research presence in relation to other academic institutions at both national and international levels.
Beyond the comparison and summarization of performance indicators across universities, the comparative process also plays a key role in benchmarking. Specifically, research policy makers can utilize bibliometrics data from other institutions to identify core journals and conferences within specific research domains. This information can then be used to provide targeted guidance to researchers, encouraging publication in scientific venues that meet established quality or impact criteria. In addition, at the faculty level, experienced researchers can leverage bibliometrics data from other universities to mentor early-career researchers, such as PhD students [4]. This mentorship can take various forms, including identifying potential collaborators to initiate research dialogues and propose new co-authorships, as well as recognizing effective strategies that have been successfully implemented elsewhere to enhance research productivity and visibility.
In any case, the current study argues that the use of bibliometrics data for comparative purposes among universities is not intended for isomorphic conformity of lower-performing universities to higher-performing ones; nor merely as another numerical evaluation of scientific performance within an institution. Instead, it should be viewed as a learning process that:
- helps a university to strategically design its research policy based on state-of-the-art practices already implemented by higher-performing universities,
- assists researchers in understanding best research practices to enhance co-authorship networks and increase the visibility of their scientific efforts,
- provides data to governmental bodies to develop well-informed performance-based funding and resource allocation systems.
These assumptions also align with the perspectives of Karlsson and colleagues [12], who argue that bibliometrics should not be treated as “just another evaluation”. Instead, they emphasize its role as a management tool for university administrators and national higher education authorities to revise research policies, guide academic staff, and develop new strategic directions.
2.2. Universities’ Funding & Bibliometrics
It is self-evident that researchers with funding tend to publish more than those with little or no funding [13]. The findings of Gulbrandsen and Smeby [13] are further supported by Goldfarb’s research [14], which also identified a positive relationship between governmental research funding and research outcomes. Typically, the allocation of funding follows performance-based research funding systems (PRFS). As explained by Hicks [9], the rationale behind these systems is that universities demonstrating superior performance according to predefined research quality criteria should receive proportionally greater funding. Several studies have positioned research quality criteria as tools designed to guide universities and researchers in enhancing their performance by actively fostering competition [3,15]. These research quality criteria are closely linked to the emergence of a bibliometrics-driven culture within academia [16]. The rise of this metric-oriented environment has, in turn, prompted calls for prudent and well-defined guidelines regarding the use of such indicators within PRFS [17]. This development is primarily due to the growing role of PRFSs in institutional evaluation processes, whose outcomes significantly influence national resource allocation mechanisms and, consequently, university funding. Nonetheless, there are considerable variations across countries in how these funding systems operate and to what extent PRFS have been developed and adopted.
In Sweden, Hammarfelt et. al. [7] provided a comprehensive analysis of the national performance-based research funding system and its implications for 26 academic institutions. 20% of the total public funding allocated to the universities is tied to research performance - specifically, 10% from external financing and 10% from the number of publications and citations. In the same study, the authors also draw attention to several discipline disparities that emerged within the Swedish system. For instance, in the humanities and the “soft” social sciences, the primary objective has been the increase of publications, rather than focusing on citations like in other disciplines (medical or natural sciences). In a neighboring country, Denmark, Ingwersen and Larsen examined the effects of introducing performance indicators on research productivity [18]. Their findings showed a 52% rise in published research articles after these indicators were introduced, reflecting a broader trend in public research funding, similar to the Norwegian PRFS model [19].
As cited by the work of Hammarfelt [7], the Norwegian model was developed at the national level across universities, rather than being implemented within individual institutions [19,20]. Specifically, the system was designed to capture the total research output of all Norwegian universities. It introduced a three-tier classification scheme to evaluate publication quality: non-scientific, scientific, and prestigious. Only scientific and prestigious publications qualify for funding. Despite its widespread adoption, the model has been criticized for its simplistic approach to assessing publication quality [7]. Moreover, it fails to address the inequalities across different scientific disciplines, geographic location of the university, gender, and academic rank (e.g., assistant, associate, professor).
For several years, the Greek/Hellenic Authority for Higher Education (HAHE - https://www.ethaae.gr/en/) has been implementing a hybrid evaluation system for Higher Education Institutions (HEIs). This system, designed to guide the allocation of public funding, assigns a weight of 70% to objective, general factors, such as the number and type of academic programs, the student population, laboratory equipment needs, geographical dispersion, and similar variables.
The remaining 30% of the annual state budget allocated to higher education is distributed based on a set of qualitative criteria. These criteria, with a particular emphasis on the institution’s research activity, play a significant role in the funding allocation process. Among other elements, the system considers the number of scientific publications and citations per faculty member (based on Scopus or Google Scholar data), the volume of publications in high-impact journals, the institution’s ranking in international evaluation frameworks, and participation in research projects (in terms of both quantity and budget size).
However, it is evident that in determining the values for the research-related criteria used to calculate the funding level for each HEI, insufficient attention is paid to factors such as the disciplinary focus of the institution, its geographical location, or issues of inequality related to gender or academic rank. As the analysis that follows will demonstrate, these factors are crucial determinants of institutional performance. They should be considered not only in funding allocation decisions but also more broadly in evaluation procedures and the strategic planning of national or international regulatory bodies.
In this context, the remainder of this article seeks to highlight the sources and underlying causes of distortions and discrepancies in performance indicators, as outlined in the research questions presented in the Introduction section. These questions are not just academic exercises, but crucial tools for understanding and improving the current evaluation system. The analysis that follows primarily aims to build an argument that evaluation (and funding allocation) models that fail to account for institutional specificities tend to exacerbate disparities and widen the gap between the “strong” and the less “privileged” institutions in the field of higher education research.
3. Research Methodology
This section outlines the methodology employed for data collection and analysis, describes the initial and final sample characteristics, and details the bibliometric indicators obtained from the citation indexes or produced after further data processing and analysis.
3.1. Data Collection and Analysis
The proposed methodology consists of three stages (see Figure 2). The first stage involves the collection of specific bibliometric indicators for a large sample of faculty staff from universities across Greece. The bibliometric data were gathered from Google Scholar (GS) and Scopus (SC) citation indexes, based on the researchers’ unique identifiers. It is noted that due to the absence of a national centralized system for unique IDs and the limited use of ORCID accounts, this identification process was conducted manually, demonstrating the dedication and effort put into the research. To ensure a representative sample of faculty staff, several academic departments from diverse scientific disciplines and various regions of the country were selected. Once the researcher’s list was finalized, the Publish or Perish tool [21] was utilized to extract the bibliometric indicators (see Table 1) from the citation indexes (Google Scholar and Scopus).
The second stage of the methodology was dedicated to data cleaning and processing. Profiles with missing or erroneous data were either excluded from the sample or included after appropriate corrections, such as the removal of duplicate profiles and the reconciliation of inconsistent entries. Following the data cleaning process, the final dataset was processed to derive additional indicators, including average values, totals, and ratios. This enabled the construction of a comprehensive multidimensional dataset, which allowed for a deep and thorough comparative analysis across academic disciplines (scientific fields), academic rank, gender, and HEI location.
Finally, in the third stage, we propose a statistically based, data-driven Performance Evaluation Framework that examines bibliometric variables, such as publications and citations per researcher, across disciplines, academic ranks, and years of activity. The proposed framework establishes discipline and rank-specific baseline values, providing a fair and evidence-based approach to evaluating research performance over time.
3.2. Sample Characteristics & Indicators
Profile information for each faculty member was collected primarily from their publicly available personal webpages. This included gender, academic rank, departmental affiliation, and university. Additionally, unique Google Scholar and Scopus IDs were manually identified for each individual. The initial dataset comprised bibliometric data from 2.825 faculty members. Given that the total number of faculty members in Greek Higher Education Institutions (HEIs) is approximately 10.000, the sample represents a substantial portion of the academic population. The dataset includes profiles from 92 academic departments across 18 HEIs, out of a total of 25 in Greece. Based on their department and following previous works from basic up to complex discipline schemas, the sample was organized into five major scientific disciplines: (1) Computer Science, (2) Economics/Business/Social Sciences and Humanities (SSH), (3) Engineering, (4) Medical Sciences, and (5) Natural Sciences. On average, each department contributed approximately 30 faculty members, while each university contributed around 156 faculty members. Geographically, 11 of the HEIs are located in peripheral (non-metropolitan) regions, while the remaining seven (7) are situated in central urban areas (such as capital cities, major urban centers).
Next, it should be noted that researchers’ profiles missing one or both unique identifiers (IDs of Google Scholar or Scopus) were excluded from the final sample. This was done to ensure the accuracy and reliability of the bibliometric data, as the unique identifiers are crucial for retrieving comprehensive and up-to-date publication and citation information. Specifically, 556 profiles lacked a Google Scholar ID (or it was not public), and 209 lacked a Scopus ID. As a result, only 2140 profiles included valid identifiers for both platforms, forming the final dataset used for bibliometric data extraction.
For each of these profiles, the bibliometric indicators listed in Table 1 were retrieved from Google Scholar and Scopus via the Publish or Perish application or (in some cases) through manual search, which involved visiting the individual’s profile on the respective platform and retrieving the necessary data. Additionally, a set of derived indicators was developed by combining values from both citation indexes, enabling a more robust and comprehensive analysis of research performance.
The profile sample used for analysis was further refined through the removal of outliers based on the bibliometric data retrieved from Google Scholar and Scopus. Specifically, faculty profiles with (i) fewer than five or more than 800 documents or (ii) fewer than 10 citations in Google Scholar were excluded, resulting in the removal of 125 profiles. It is noteworthy that among the excluded profiles were six (6) faculty staff involved in CERN research projects, whose publication volume significantly exceeded the defined upper threshold (over 800 documents in Google Scholar). These six profiles alone accounted for 925.790 citations, while the remaining 2134 profiles accumulated a total of 6.943.066 citations, based on Google Scholar data. After excluding these outliers, the final sample comprised 2015 faculty profiles, representing approximately 20% of the total academic staff population in Greece. Table 2 summarizes demographic and institutional characteristics for both the initial (2825 profiles) and final sample (2015 profiles), including distribution by gender, geographic location of institution (central/peripheral HEIs), and scientific discipline across academic ranks (Assistant, Associate, and Full Professor).
The most significant reduction between the initial and final sample (-43%) was observed among the academic staff in the field of Economics / Business Sciences / Social Sciences and Humanities. This was primarily due to the lack of publicly available Google Scholar or Scopus profiles, reflecting the limited coverage of these disciplines in citation databases [22].
4. Results
The results and their analysis are presented in the following subsections, each examining a critical dimension of the study: disciplinary differences, regional disparities, and gender-based inequalities. Additionally, this study presents an initial attempt to develop a statistically based Performance Evaluation Framework that establishes target benchmarks for publications and citations by discipline and academic rank. This framework offers a valuable tool for academic institutions, serving two purposes: first, as an objective mechanism for faculty evaluation and assessment, and second, perhaps more importantly, as a strategic instrument for institutional planning, goal-setting, and resource allocation decisions.
4.1. Discipline Inequalities – The Impact of Collaboration Publishing Networks
As expected, research methodology and culture vary significantly across disciplines, fundamentally affecting publication and citation patterns. Theoretical fields like mathematics and physics typically produce fewer but more substantial papers with concentrated citation patterns, while experimental sciences generate more frequent, incremental outputs with broader citation networks [23]. Collaboration structures also differ markedly, with large interdisciplinary teams predominating in life sciences versus predominantly individual scholarship in the humanities [24,25,26]. Publication venues vary systematically by field, ranging from peer-reviewed journal articles in STEM disciplines to monographs in the humanities and conference proceedings in computer science.
Additionally, the coverage and representation of publications and citations across different bibliometric databases vary substantially between scientific fields or even the language of publication, a phenomenon extensively documented in the literature [27,28]. This variation stems from differences in publication cultures, indexing practices, and the historical development of discipline-specific databases. In this context, the following analysis presents statistical evidence that corroborates findings from other research groups while providing novel insights specific to academic performance evaluation.
Specifically, Table 3 presents comprehensive performance metrics including the mean number of publications and citations per academic faculty member across scientific fields, based on Google Scholar. The table additionally reports annual citation rates per researcher and the average citation-to-publication ratio for each discipline.
Examining the above data, it is evident that medical sciences exhibit the highest number of citations and the second-highest number of publications, with minimal difference from the computer science field, which ranks first. As expected, academic staff in Economics, Business, and Social Sciences and Humanities show the lowest representation in terms of publication numbers (and citations). These data originate from Google Scholar and may differ from reality (especially for Economics, Business, and SSH fields).
Similar results are observed in the “cites per year” and “cites per paper” indicators, which again demonstrate the distinction of health sciences from other fields, as well as the smaller magnitudes in Economics, Business, SSH, and Engineering sciences. Given the differentiations between various scientific fields, these differences must be taken into account both during personnel evaluation and resource allocation.
The above results are entirely compatible with the findings of numerous studies that have reached the same conclusions, namely, that medical, natural, and technology-oriented sciences consistently receive far more citations than the social sciences, humanities, economics, and business fields due to several key structural and cultural differences. Citation rates in medicine are dramatically higher, with quantitative data showing they outpace humanities citations [29]. Moreover, health sciences and technological sciences tend to publish more frequently, in shorter cycles, and with more co-authors, which expands their citation networks. Additionally, as already mentioned, citation databases and indexing services have historically favored journals from these scientific areas, while a vast majority of humanities articles remain uncited. Once again, these differences underscore the limitations of using universal citation metrics across disciplines and support the adoption of field-adjusted or alternative evaluation models to account for varying knowledge production and publication cultures.
Both the number of publications and citations are directly related to the size of collaboration networks among researchers within each scientific field [23,24,25]. Predominantly, academic networks typically lead to higher paper output through several mechanisms. A well-established network of collaborators leads to better scientific outcomes (interdisciplinarity, multidisciplinarity), resource and infrastructure sharing, workload distribution in article writing, etc. Furthermore, the participation of more authors in an article offers visibility amplification, better paper quality, larger audiences across subfields, and increased citations through subsequent articles by each co-author. Similar results occur when collaboration networks are international and extend beyond narrow national frameworks [26,30].
The following table (Table 4) presents a series of statistical data that confirm the impact of network size, or more simply, the size of authorship teams per scientific field, on the number of articles and citations received. The PpA(GS5) and CpA(GS6) metrics, and particularly the ratios DE1=Papers(GS1)/PpA(GS5) and DE2=Citations(GS2)/CpA(GS6), are significantly elevated in medical, natural, and technological sciences compared to Economics, Business, and SSH fields. The same applies to the Authors per Paper (ApP – GS7) metrics, with values for medical and natural sciences being the highest.
Overall, it is observed that differences across scientific fields remain consistent when analyzing author-normalized metrics, such as Papers and Citations per Author, and the direct relation with the mean citation rate and the number of co-authors is demonstrated. More specifically, the ratios reveal important insights about how collaboration affects research impact - fields with higher collaboration tend to show greater citation amplification, suggesting that collaborative work receives more recognition and citations than individual contributions.
Completing this series of results, the following table (Table 5) presents a comparison of the number of publications and citations between the two bibliographic databases utilized in the present work (Google Scholar and Scopus).
From the above results, practical conclusions emerge regarding the utilization of relevant citation databases within the framework of evaluation and resource allocation. The coverage differences per scientific discipline are evident both in the number of publications and citations. Therefore, the selection of the citation database from which evaluation/resource allocation data will be derived must be made carefully, taking into account the particular characteristics of each scientific discipline. More details and data will be provided in the discussion and conclusions sections.
4.2. Regional Inequalities
This section explores regional disparities in research performance between centrally located and peripheral HEIs, as reflected in the bibliometric indicators retrieved from the citation indexes. Inequalities of output were identified. As shown in the figures below, substantial differences were observed across various indicators, including the total number of publications and citations for a faculty member across scientific disciplines (see total count of papers per faculty member in Figure 3-a / indicator Papers-GS1 and total count of citations in Figure 3-b / indicator Citations-GS2). The most notable differences were identified in Computer Science, with faculty from centrally located HEIs producing 42% more papers and receiving 49% more citations, in Engineering with 25% more papers and 21% more citations, and in Medical Science with 23% more papers and 20% more citations.
Based on the above-presented results, it becomes evident that the geographical location of a HEI significantly influences its research performance, as reflected through key bibliometric indicators. An attempt to interpret and contextualize these regional disparities is provided in the discussion section. In any case, the underlying factors contributing to this phenomenon must be taken into account both in the evaluation of academic personnel at the national or international level, and even more so in the allocation of funding, to avoid the continual widening of the gap between ‘central universities’ and those located in regional areas.
4.3. Gender Inequalities
As anticipated, gender inequalities are present in the Greek HEIs, mirroring global trends [31,32], and are reflected both in the proportion of female academic staff and in bibliometric indicators. This issue is not limited to the underrepresentation of women in senior positions (e.g., full professor) [33]. Still, it extends to lower ranks (e.g., assistant and associate professors) and exhibits horizontal segregation across scientific disciplines. According to the results illustrated in Figure 4 (derived from Table 2), gender parity is observed only within medical departments and solely at the assistant professor level, where women account for 46% of the total study’s sample. The most pronounced gender disparities are found in engineering departments, where only 1 out of 10 academic staff members, across all ranks, is female. Although there appears to be a slight increase in female representation from higher to lower academic ranks (17% among full professors compared to 29% among assistant professors), the overall picture remains concerning. Moreover, it is worth noting that, unlike other countries, Greece has not adopted any state-level policy initiatives specifically aimed at addressing gender bias within its higher education system [34,35].
Apart from gender representation disparities, these inequalities are also reflected in the bibliometric indicators (see Table 6).
Overall, females achieve 82.1% of male paper output and 87.9% of male citations in Google Scholar. However, these aggregate figures mask substantial field-specific variations. Economy Business emerges as the most gender-balanced field, with female researchers achieving 92-103% of male productivity and exceeding males in Google Scholar citations at 103.2%. In contrast, Medical Sciences shows the most pronounced gender gaps, with females consistently achieving only 67-74% of male productivity across all metrics. At the same time, Computer Sciences demonstrates severe disparities in Scopus representation, where females reach just 61.4% of male paper output. The analysis also uncovers a systematic database effect, with gender gaps consistently appearing larger in Scopus than Google Scholar across most disciplines, indicating that the choice of bibliometric database can significantly influence perceptions of gender equity. These differences are also partly attributable to the underrepresentation of women in higher academic ranks, a factor that requires further investigation in future research.
4.4. A Discipline-Based and Academic Rank Performance Evaluation Framework
This section provides a comprehensive analysis examining annual publication and citation output across academic ranks (e.g., full professor, associate professor, assistant professor) and scientific fields. The proposed framework utilizes statistical analysis to develop fair and discipline-specific performance evaluation metrics for faculty members [36,37,38]. Statistical-based performance models can help predict research output based on historical data. This approach allows performance evaluation within specific fields, recognizing the differentiations (such as fewer publications are typically expected in the Social Sciences and Humanities compared to the Medical Sciences). Additionally, it allows for establishing rank-specific expectations, such as comparing average research output between associate and full professors annually.
The statistical analysis employed percentile distributions from 2015 academic researchers. The following performance levels by percentile range were established: (a) 25th to 50th percentile - meeting minimum standards, (b) 50th to 75th percentile - above average performance, (c) 75th to 90th percentile - exceptional performance, and (d) above 90th percentile - top-tier productivity. Percentiles were utilized because they offer a robust and simple distribution-based approach for interpreting research performance [39]. This method facilitates comparisons across diverse disciplines and academic ranks without the assumption of normality in the data. By focusing on relative standing within a field rather than relying on arbitrary or absolute thresholds, this approach enhances both fairness and comparability of performance benchmarks.
Table 7 below presents annual target values for publication and citation numbers by percentile, scientific field, and academic rank. The ranking of scientific fields is based on expected values per indicator, with the highest values found in high-productivity and high-impact fields such as Medical Sciences and Computer Sciences. Engineering and Natural Sciences follow these with moderate productivity and impact, and finally, Economics, Business, and Social Sciences and Humanities fields with lower productivity and effect.
Based on the data in Table 7, an institution, academic department, or individual faculty member can determine their performance level relative to their rank and scientific field, enabling evidence-based evaluation and goal-setting for academic career development.
The proposed approach offers a valuable tool for creating more equitable promotion requirements across different academic disciplines. For instance, if promotion from Assistant to Associate Professor requires reaching the 75th percentile, this translates to considerably different benchmarks (e.g., in Medical Sciences, faculty members would need approximately 6.1 publications and 106 citations annually to be promotion-ready, while in Economics, Business and SSH, the threshold would be 2.5 publications and 39 citations per year).
This evidence-based methodology demonstrates how field-specific, statistically-grounded standards can replace arbitrary “one-size-fits-all” publication and citation requirements with peer-benchmarked expectations that reflect the realities of each discipline.
The framework’s value extends beyond individual tenure and promotion decisions. It serves as a tool for implementing institutional strategic development plans and can be scaled to national or international levels. In any case, the quality of the results depends on the availability of data.
While the proposed framework offers clear advantages, its effective use depends on maintaining up-to-date and comprehensive datasets. Equally important, bibliometric benchmarks should be applied as a complement to qualitative evaluations and peer review, ensuring that both the quantity and quality of research are considered. In this way, the framework strengthens existing qualitative evaluation practices rather than replacing them, offering a balanced, evidence-based approach to assessing academic performance.
Concluding with the current percentiles results, faculty evaluation must become more transparent, data-driven, and adopt equitable processes that respect the unique norms and expectations of each academic discipline while maintaining rigorous standards for advancement.
5. Discussion – Conclusions
5.1. Major Findings and Practical Implications
In the present section, an attempt will be made to provide answers to the research questions (RQ1 - RQ4), posed within the framework of this research. Specifically, the first research question (RQ1) concerned whether the scientific discipline substantially affects the bibliometric indicators and in what ways.
The data reveal significant differences in metrics across different disciplines that have important implications for fair evaluation. The study shows that Medical Sciences leads with 138 papers and 3,208 citations per researcher, followed by Computer Sciences at 143 papers and 2,847 citations per researcher. At the same time, Economics, Business, and Social Sciences and Humanities lag with 62 papers and 1,062 citations per researcher.
One of the key factors driving these differences is collaboration networks, with Medical and Natural Sciences averaging 5.0 authors per paper compared to only 2.7 in Economics and related fields [23,24,25,26].
The choice of a bibliometric database further compounds these inequities. For example, Scopus citation index captures only 43% of Economics, Business, and Social Sciences and Humanities papers found in Google Scholar and just 36% of their citations [40]. Another parameter that must be considered regarding bibliometric databases is the language, especially for non-English-speaking countries (e.g., Greece). Content coverage in these cases is problematic [27].
The same conclusions regarding the impact of the scientific discipline on bibliometric indicators emerged in relation to the proposed Performance Evaluation Framework. Specifically, the research showed that promotion benchmarks are dramatically different by field - an Assistant Professor in Medical Sciences needs 6.1 publications and 106 citations annually to reach the 75th percentile. In comparison, their counterpart in Economics, Business, and Social Sciences and Humanities needs 2.5 publications and 39 citations for the same ranking.
These findings provide substantial information regarding the first research question and lead to a critical conclusion that universal evaluation models create systematic bias and injustice. In this context, field-specific benchmarks are essential for fair assessment, as the differences in collaboration networks and citation index coverage create advantages and disadvantages that cannot be ignored. Evaluation systems that overlook disciplinary variations will produce unfair outcomes, particularly in terms of funding and career advancement.
The following research question (RQ2) concerned the impact of the location of the academic unit (e.g., central or peripheral regions) and the gender of academic staff when utilizing bibliometric indicators. Specifically, this research proves that location creates significant and systematic disadvantages for academic institutions and faculty members situated in peripheral regions compared to those in central urban areas. The study demonstrates that faculty at centrally-located universities consistently outperform their peripheral counterparts across all scientific disciplines, with the most dramatic gaps appearing in Computer Sciences, where central institutions produce 42% more papers and receive 49% more citations than peripheral ones.
In an attempt to explain this phenomenon, we should have in mind that in Greece, as in other countries, the expansion of Higher Education considered factors beyond academic criteria. That is, this expansion aimed at the financial and social development of Greek provinces [41]. In this context, beyond scientific criteria, the creation of regional universities is connected with development policies, particularly for remote or less favored regions of a country [42,43]. This specific situation has been defined as the “third role” for Higher Education Institutions after teaching and research, or the “Triple Helix model” [44], which includes the collaboration of university-industry-government networks for knowledge transfer and innovation development [45].
Nevertheless, HEIs located in peripheral regions often lack adequate physical, technological, and knowledge infrastructures required to compete in the new knowledge economy. The factors that affect performance are structural variables, including size, age, city size, location in a capital city, disciplinary orientation, and country location [46].
Through this research, the above findings were confirmed, and it becomes clear that current evaluation systems that ignore these geographic disadvantages perpetuate and potentially worsen existing inequalities between institutions. Performance-based funding mechanisms that fail to account for location-specific characteristics disadvantage peripheral universities, creating a loop where resource allocation widens the gap between central and regional institutions.
Similar conclusions apply regarding the gender of academic staff. This research confirms severe structural underrepresentation for the Greek higher education system, with women comprising only 21.7% of total academic staff, with the worst situation in the field of Engineering. Disparities also exist in bibliometric indicators, which reflect global trends [47]. As shown by the results, gender-based inequalities are pervasive across disciplines, compounded by database selection, interconnected with structural underrepresentation at senior levels, and currently unaddressed by local decision-makers, making gender a critical factor that must be considered alongside discipline, location, and rank in designing equitable evaluation and funding systems.
The main findings that emerged regarding the two final questions (RQ3 and RQ4) - whether a unified national-level evaluation framework is appropriate for assessing research performance across all institutions and disciplines, or whether a discipline-specific evaluation system fed by national-level bibliometric indicators is ultimately needed - are the following:
- “One-size-fits-all” approaches do not address the complexity of the academic landscape and reinforce existing disparities, leading to injustices, particularly in funding.
- Horizontal solutions tend to exacerbate disparities and widen the gap between strong and less privileged institutions.
- A discipline-specific approach that includes national-level bibliometric data can and should serve as an alternative research performance assessment framework that enables universities, departments, or faculty members to determine their performance relative to their rank and scientific field, supporting evidence-based evaluation and career development goal-setting.
In conclusion, bibliometric indicators should complement rather than replace qualitative assessments and peer review. Universities and national authorities for higher education must operate discipline-specific evaluation frameworks that incorporate national-level bibliometric data, while guarding against over-reliance on quantitative metrics that might overlook research quality or contextual factors.
5.2. Limitations and Future Steps
This study offers a thorough analysis of bibliometric indicators within the Greek Higher Education system; however, certain limitations must be acknowledged. The cross-sectional design provides only a snapshot in time, and a longitudinal study would be advantageous for tracking how these disparities develop. Additionally, while Google Scholar and Scopus offer extensive data, they do not always index all forms of scholarly output, such as monographs and non-English publications, which particularly impacts the humanities and social sciences. Moreover, the analysis predominantly emphasizes quantitative metrics; incorporating qualitative measures, such as the societal impact of research or the quality of teaching, could provide a more comprehensive view of academic performance.
Future research should aim to address these gaps. A longitudinal analysis could uncover crucial trends in research productivity and the long-term effects of funding policies. Broadening the research to incorporate alternative metrics (altmetrics) and a wider variety of publication types would facilitate a more inclusive evaluation framework. Furthermore, future studies could investigate the underlying causes of the observed disparities through qualitative methods, such as surveys and interviews with faculty, to gain deeper insights into the systemic barriers encountered by researchers in peripheral institutions or by female academics.
Lastly, we encourage other researchers to adopt this context-sensitive evaluation model to other national systems, testing its applicability and contributing to the international dialogue on responsible research assessment.
Author Contributions
Conceptualization, Evangelia Triperina, Ioannis Drivas, Foteini Efthymiou, Alexandros Koulouris and Ruben Comas-Forgas; Data curation, Dimitrios Kouis, Evangelia Triperina, Ioannis Drivas, Foteini Efthymiou, Alexandros Koulouris and Ruben Comas-Forgas; Methodology, Dimitrios Kouis, Evangelia Triperina, Ioannis Drivas, Foteini Efthymiou, Alexandros Koulouris and Ruben Comas-Forgas; Software, Dimitrios Kouis, Evangelia Triperina, Ioannis Drivas, Foteini Efthymiou, Alexandros Koulouris and Ruben Comas-Forgas; Validation, Dimitrios Kouis, Evangelia Triperina, Ioannis Drivas, Foteini Efthymiou, Alexandros Koulouris and Ruben Comas-Forgas; Writing – original draft, Dimitrios Kouis, Evangelia Triperina, Ioannis Drivas, Foteini Efthymiou, Alexandros Koulouris and Ruben Comas-Forgas; Writing – review & editing, Dimitrios Kouis, Evangelia Triperina, Ioannis Drivas, Foteini Efthymiou, Alexandros Koulouris and Ruben Comas-Forgas.
Funding
This research received no external funding.
Institutional Review Board Statement
Not applicable.
Informed Consent Statement
Not applicable.
Acknowledgments
During the preparation of this manuscript/study, the author(s) used Excel, PowerPoint, and Publish or Perish Software for data analysis, data collection, and figure creation. The authors also used Claude.ai and Grammarly to improve the readability of the text. The authors have reviewed and edited the output and take full responsibility for the content of this publication.
Conflicts of Interest
The authors declare no conflicts of interest.
References
- Quacquarelli Symonds QS World University Rankings 2025: Top Global Universities Available online: https://www.topuniversities.com/world-university-rankings/2025.
- Robert Morse; Sam Wellington How U.S. News Calculated the 2025-2026 Best Global Universities Rankings Available online: https://www.usnews.com/education/best-global-universities/articles/methodology.
- Mingers, J.; Willmott, H. Taylorizing Business School Research: On the ‘One Best Way’ Performative Effects of Journal Ranking Lists. Hum. Relat. 2013, 66, 1051–1073. [CrossRef]
- Sonkar, S.K.; Kumar, S.; Mahala, A.; Tripathi, M. Science Research in Indian Universities: A Bibliometric Analysis. J. Scientometr. Res. 2021, 10, 184–194. [CrossRef]
- Abramo, G.; Aksnes, D.W.; D’Angelo, C.A. Comparison of Research Performance of Italian and Norwegian Professors and Universities. J. Informetr. 2020, 14, 101023. [CrossRef]
- Kwiek, M.; Roszka, W. Top Research Performance in Poland over Three Decades: A Multidimensional Micro-Data Approach. J. Informetr. 2024, 18, 101595. [CrossRef]
- Hammarfelt, B.; Nelhans, G.; Eklund, P.; Åström, F. The Heterogeneous Landscape of Bibliometric Indicators: Evaluating Models for Allocating Resources at Swedish Universities. Res. Eval. 2016, 25, 292–305. [CrossRef]
- Rijcke, S. de; Wouters, P.F.; Rushforth, A.D.; Franssen, T.P.; Hammarfelt, B. Evaluation Practices and Effects of Indicator Use—a Literature Review. Res. Eval. 2016, 25, 161–169. [CrossRef]
- Hicks, D. Performance-Based University Research Funding Systems. Res. Policy 2012, 41, 251–261. [CrossRef]
- Ming, H.W.; Hui, Z.F.; Yuh, S.H. COMPARISON OF UNIVERSITIES’ SCIENTIFIC PERFORMANCE USING BIBLIOMETRIC INDICATORS. Malays. J. Libr. Inf. Sci. 2011, 16, 1–19.
- Raan, A.F.J.V. Bibliometric Statistical Properties of the 100 Largest European Research Universities: Prevalent Scaling Rules in the Science System. J. Am. Soc. Inf. Sci. Technol. 2008, 59, 461–475. [CrossRef]
- Karlsson, S.; Fogelberg, K.; Kettis, Å.; Lindgren, S.; Sandoff, M.; Geschwind, L. Not Just Another Evaluation: A Comparative Study of Four Educational Quality Projects at Swedish Universities. Tert. Educ. Manag. 2014, 20, 239–251. [CrossRef]
- Gulbrandsen, M.; Smeby, J.-C. Industry Funding and University Professors’ Research Performance. Res. Policy 2005, 34, 932–950. [CrossRef]
- Goldfarb, B. The Effect of Government Contracting on Academic Research: Does the Source of Funding Affect Scientific Output? Res. Policy 2008, 37, 41–58. [CrossRef]
- Leisyte, L.; Dee, J.R. Understanding Academic Work in a Changing Institutional Environment: Faculty Autonomy, Productivity, and Identity in Europe and the United States. In Higher Education: Handbook of Theory and Research; Smart, J.C., Paulsen, M.B., Eds.; Higher Education: Handbook of Theory and Research; Springer Netherlands: Dordrecht, 2012; Vol. 27, pp. 123–206 ISBN 978-94-007-2949-0.
- Burrows, R. Living with the H-Index? Metric Assemblages in the Contemporary Academy. Sociol. Rev. 2012, 60, 355–372. [CrossRef]
- Hammarfelt, B.; De Rijcke, S. Accountability in Context: Effects of Research Evaluation Systems on Publication Practices, Disciplinary Norms, and Individual Working Routines in the Faculty of Arts at Uppsala University. Res. Eval. 2015, 24, 63–77. [CrossRef]
- Ingwersen, P.; Larsen, B. Influence of a Performance Indicator on Danish Research Production and Citation Impact 2000–12. Scientometrics 2014, 101, 1325–1344. [CrossRef]
- Schneider, J.W. An Outline of the Bibliometric Indicator Used for Performance-Based Funding of Research Institutions in Norway. Eur. Polit. Sci. 2009, 8, 364–378. [CrossRef]
- Gunnar Sivertsen A Performance Indicator Based on Complete Data for the Scientific Publication Output at Research Institutions. Int. Soc. Scientometr. Informetr. 2010, 6, 22–28.
- Anne-Wil Harzing Publish or Perish 2007.
- Martín-Martín, A.; Thelwall, M.; Orduna-Malea, E.; Delgado López-Cózar, E. Google Scholar, Microsoft Academic, Scopus, Dimensions, Web of Science, and OpenCitations’ COCI: A Multidisciplinary Comparison of Coverage via Citations. Scientometrics 2021, 126, 871–906. [CrossRef]
- Vieira, E.S.; Gomes, J.A.N.F. Citations to Scientific Articles: Its Distribution and Dependence on the Article Features. J. Informetr. 2010, 4, 1–13. [CrossRef]
- Larivière, V.; Gingras, Y.; Sugimoto, C.R.; Tsou, A. Team Size Matters: Collaboration and Scientific Impact since 1900. J. Assoc. Inf. Sci. Technol. 2015, 66, 1323–1332. [CrossRef]
- Yoo, H.S.; Jung, Y.L.; Lee, J.Y.; Lee, C. The Interaction of Inter-Organizational Diversity and Team Size, and the Scientific Impact of Papers. Inf. Process. Manag. 2024, 61, 103851. [CrossRef]
- Kyvik, S.; Reymert, I. Research Collaboration in Groups and Networks: Differences across Academic Fields. Scientometrics 2017, 113, 951–967. [CrossRef]
- Vera-Baceta, M.-A.; Thelwall, M.; Kousha, K. Web of Science and Scopus Language Coverage. Scientometrics 2019, 121, 1803–1813. [CrossRef]
- Aksnes, D.W.; Sivertsen, G. A Criteria-Based Assessment of the Coverage of Scopus and Web of Science. J. Data Inf. Sci. 2019, 4, 1–21. [CrossRef]
- Patience, G.S.; Patience, C.A.; Blais, B.; Bertrand, F. Citation Analysis of Scientific Categories. Heliyon 2017, 3, e00300. [CrossRef]
- Wang, J.; Frietsch, R.; Neuhäusler, P.; Hooi, R. International Collaboration Leading to High Citations: Global Impact or Home Country Effect? J. Informetr. 2024, 18, 101565. [CrossRef]
- O’Connor, P.; O’Hagan, C. Excellence in University Academic Staff Evaluation: A Problematic Reality? Stud. High. Educ. 2016, 41, 1943–1957. [CrossRef]
- Picardi, I. The Glass Door of Academia: Unveiling New Gendered Bias in Academic Recruitment. Soc. Sci. 2019, 8, 160. [CrossRef]
- O’Connor, P. Gender Imbalance in Senior Positions in Higher Education: What Is the Problem? What Can Be Done? Policy Rev. High. Educ. 2019, 3, 28–50. [CrossRef]
- Barriere, S.G.; Söderqvist, L.; Fröberg, J. How Gender-Equal Is Higher Education? Women’s and Men’s Preconditions for Conducting Research; Swedish Research Council, 2021; p. 110;.
- Park, S. Seeking Changes in Ivory Towers: The Impact of Gender Quotas on Female Academics in Higher Education. Womens Stud. Int. Forum 2020, 79, 102346. [CrossRef]
- Szluka, P.; Csajbók, E.; Győrffy, B. Relationship between Bibliometric Indicators and University Ranking Positions. Sci. Rep. 2023, 13, 14193. [CrossRef]
- Carpenter, C.R.; Cone, D.C.; Sarli, C.C. Using Publication Metrics to Highlight Academic Productivity and Research Impact. Acad. Emerg. Med. Off. J. Soc. Acad. Emerg. Med. 2014, 21, 1160–1172. [CrossRef]
- Sanchez, T.W. Faculty Performance Evaluation Using Citation Analysis: An Update. J. Plan. Educ. Res. 2017, 37, 83–94. [CrossRef]
- Brito, R.; Rodríguez-Navarro, A. Research Assessment by Percentile-Based Double Rank Analysis. J. Informetr. 2018, 12, 315–329. [CrossRef]
- Harzing, A.-W.; Alakangas, S. Google Scholar, Scopus and the Web of Science: A Longitudinal and Cross-Disciplinary Comparison. Scientometrics 2016, 106, 787–804. [CrossRef]
- Zmas, A. Financial Crisis and Higher Education Policies in Greece: Between Intra- and Supranational Pressures. High. Educ. 2015, 69, 495–508. [CrossRef]
- Pinto, H. Universities and Institutionalization of Regional Innovation Policy in Peripheral Regions: Insights from the Smart Specialization in Portugal. Reg. Sci. Policy Pract. 2024, 16, 12659. [CrossRef]
- Choyubekova, G.; Zholdubaeva, A.; Zaid, S. Leading Role of Higher Education Institutions on the Development of Peripheral Regions.; Atlantis Press, October 2019; pp. 189–194.
- Compagnucci, L.; Spigarelli, F. The Third Mission of the University: A Systematic Literature Review on Potentials and Constraints. Technol. Forecast. Soc. Change 2020, 161, 120284. [CrossRef]
- Chanthes, S. University Outreach in the Triple Helix Model of Collaboration for Entrepreneurial Development. J. Educ. Issues 2022, 8, 178–192. [CrossRef]
- Frenken, K.; Heimeriks, G.J.; Hoekman, J. What Drives University Research Performance? An Analysis Using the CWTS Leiden Ranking Data. J. Informetr. 2017, 11, 859–872. [CrossRef]
- Andersson, E.R.; Hagberg, C.E.; Hägg, S. Gender Bias Impacts Top-Merited Candidates. Front. Res. Metr. Anal. 2021, 6. [CrossRef]
Figure 1.
Number of publications per year in the Scopus database based on the search query [TITLE (“universities” OR “academic institutions”) AND TITLE (“scientometrics” OR “bibliometrics”)].
Figure 1.
Number of publications per year in the Scopus database based on the search query [TITLE (“universities” OR “academic institutions”) AND TITLE (“scientometrics” OR “bibliometrics”)].
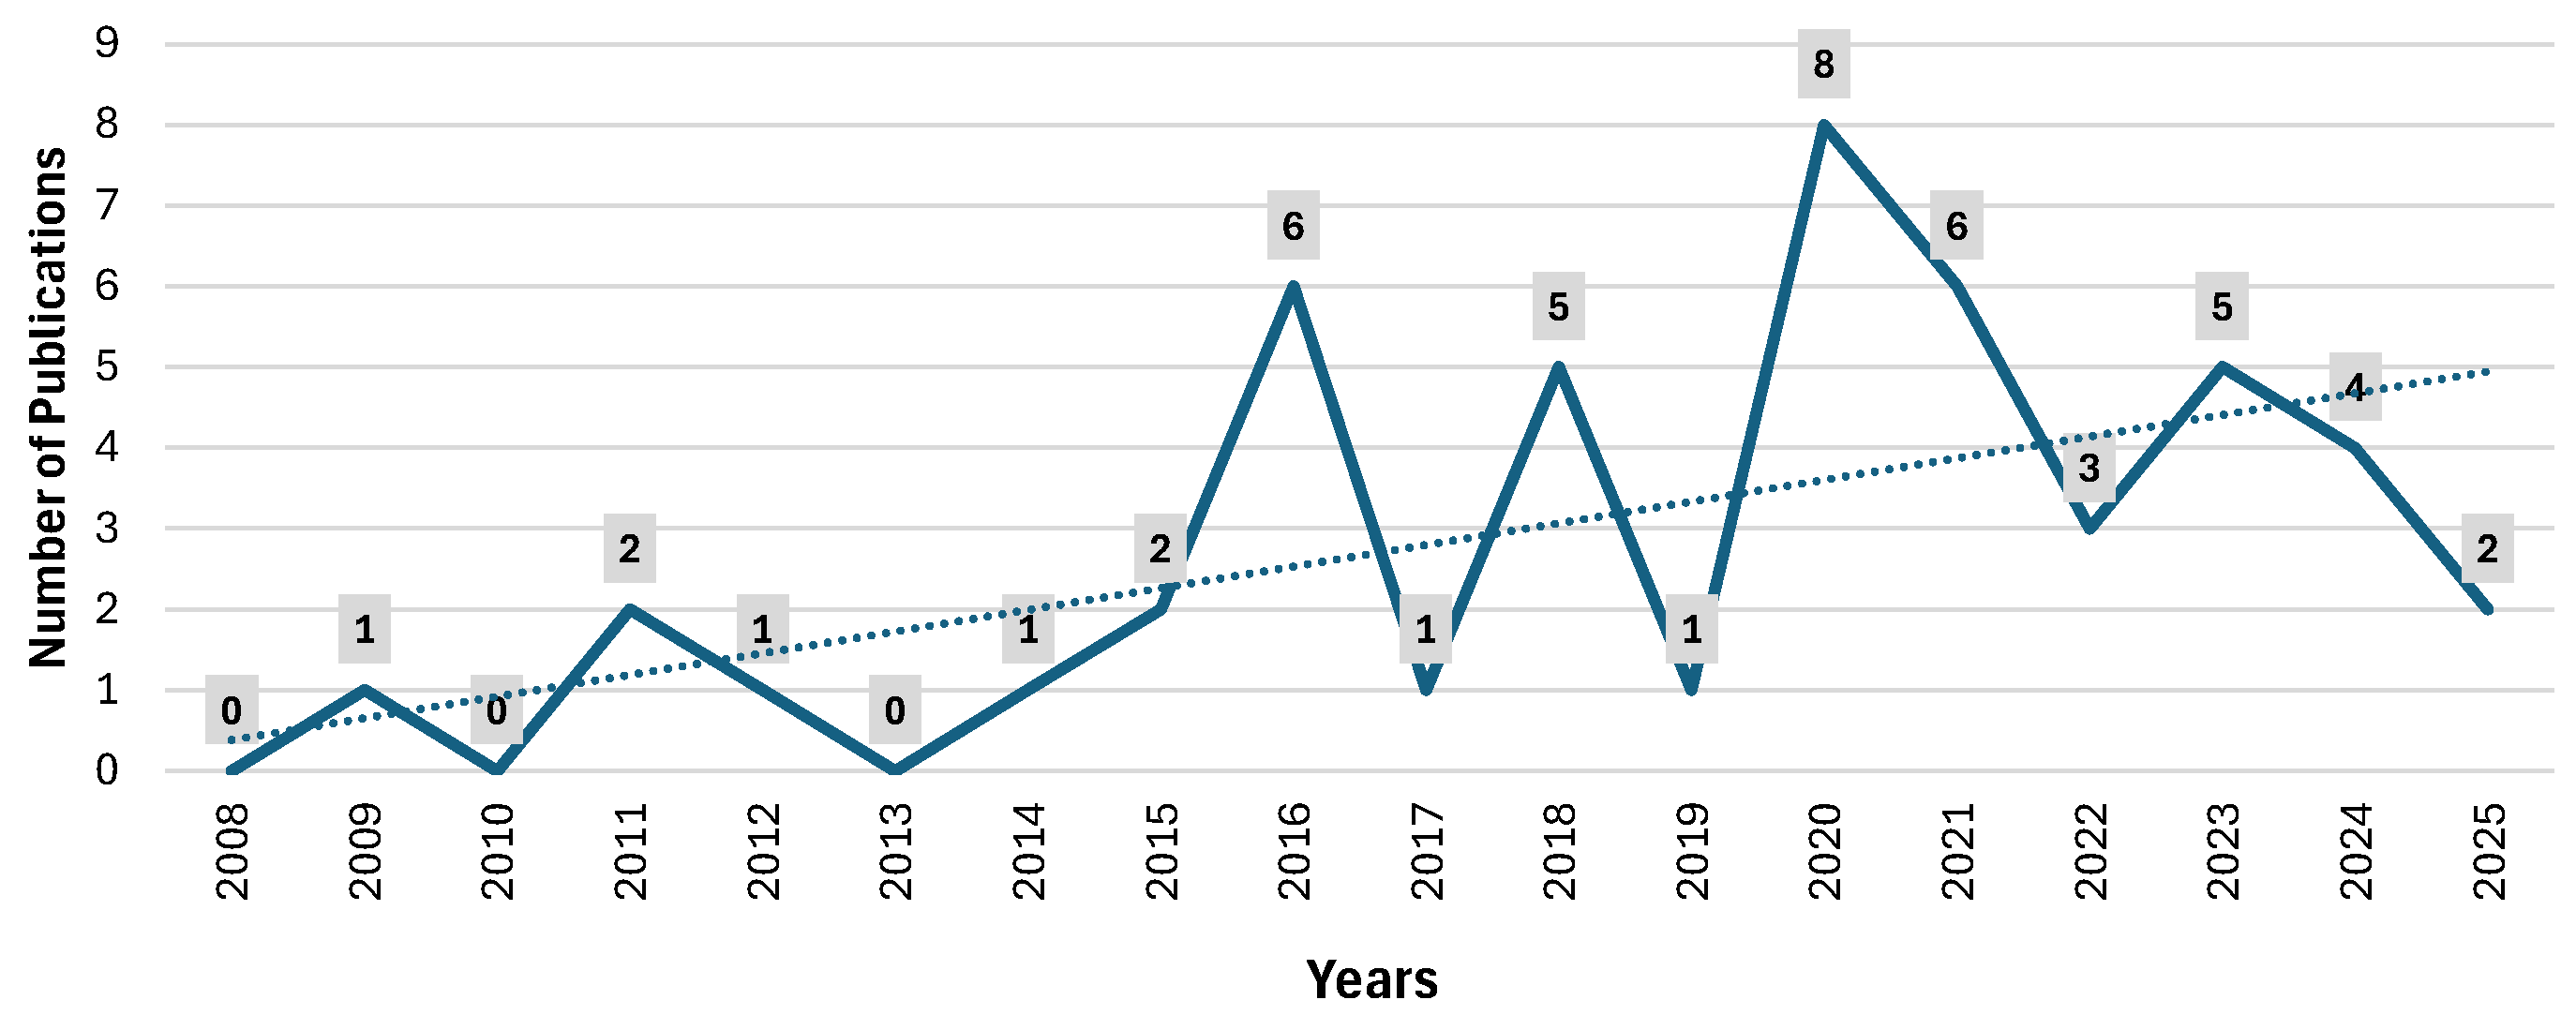
Figure 2.
Data collection and analysis stages.

Figure 3.
(a) Average number of papers – GS1, (b) Average number of citations – GS2 (per discipline).
Figure 3.
(a) Average number of papers – GS1, (b) Average number of citations – GS2 (per discipline).
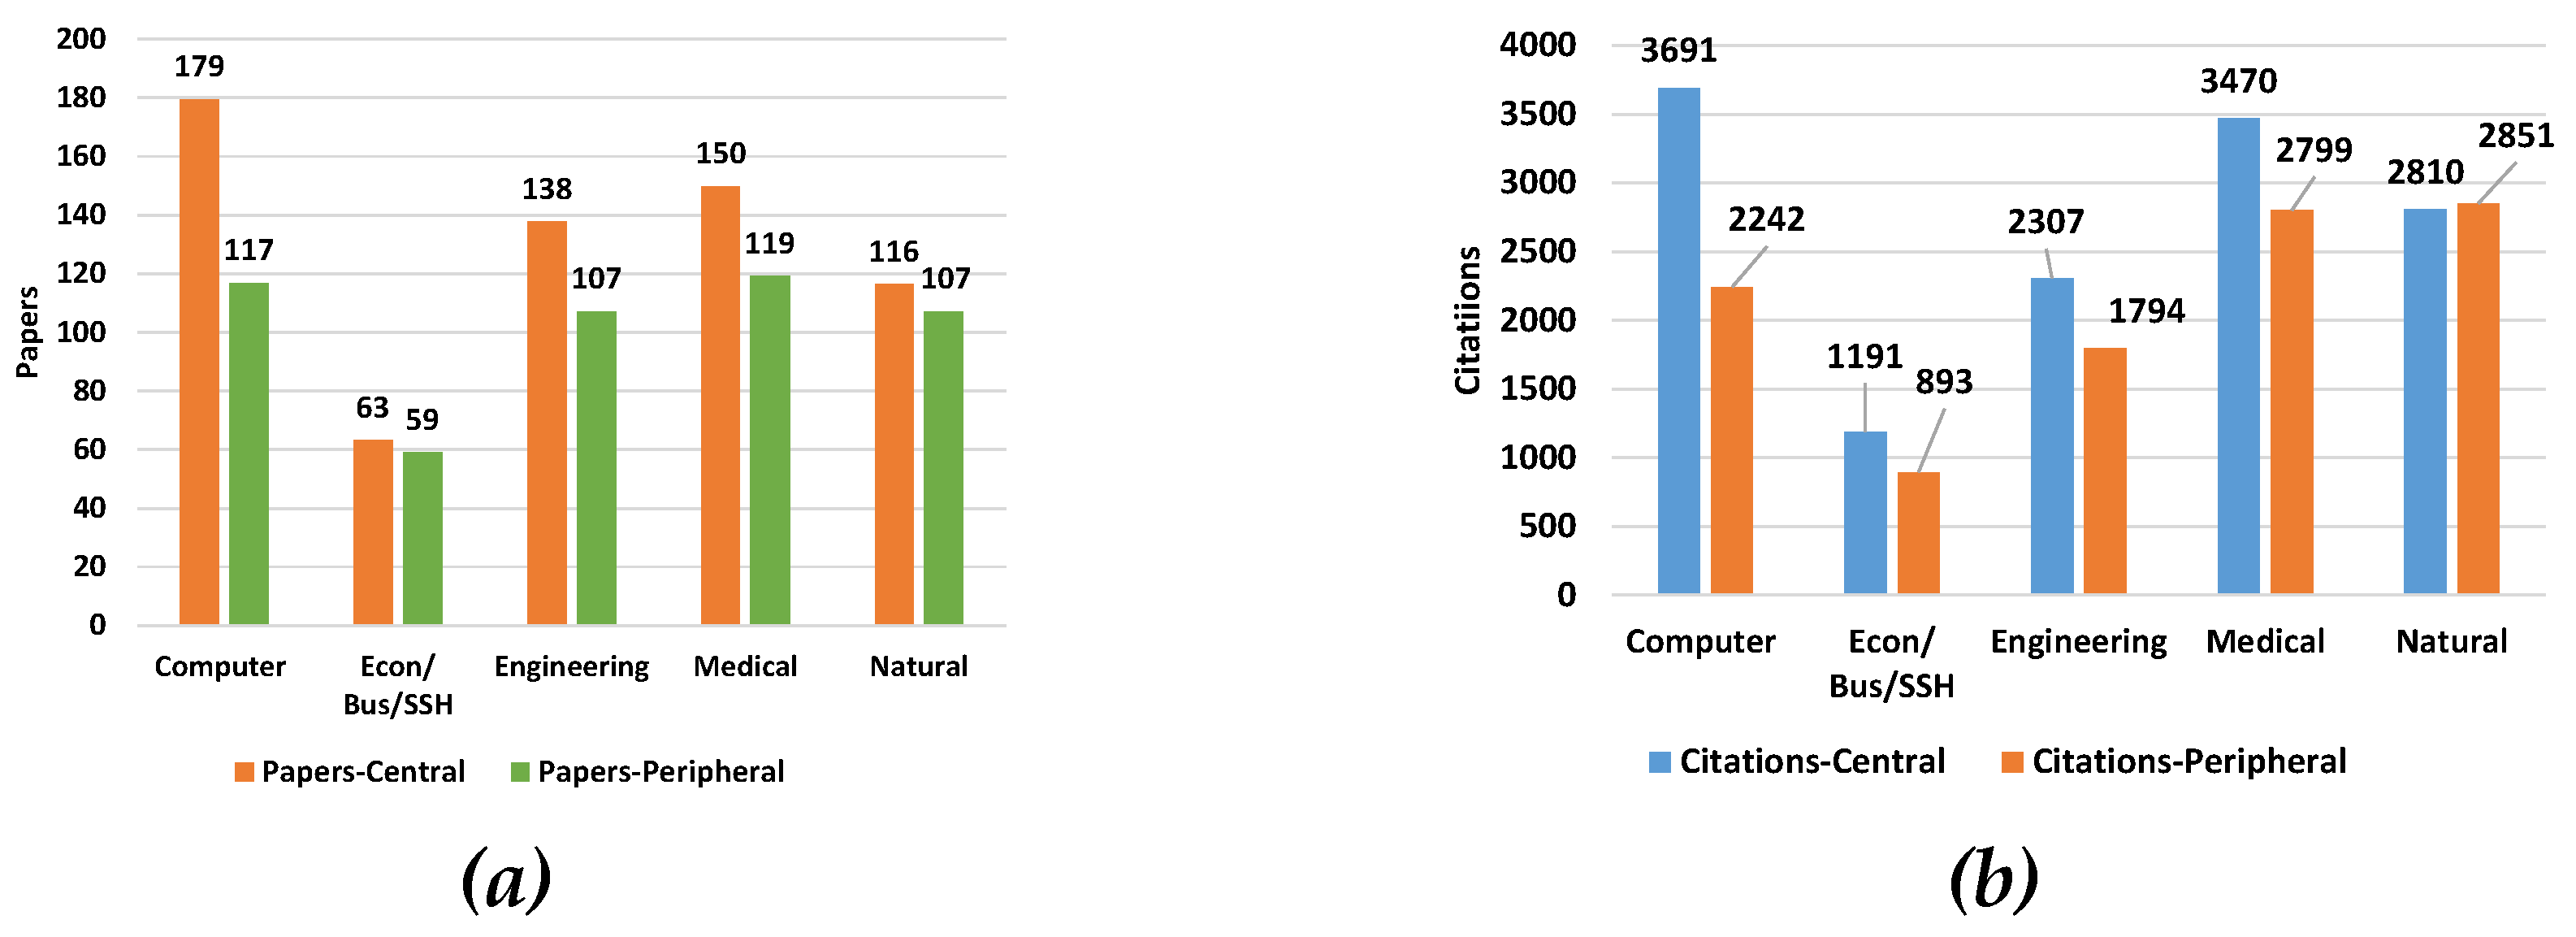
Figure 4.
Academic ranks female gender representation per discipline in Greek HEIs.
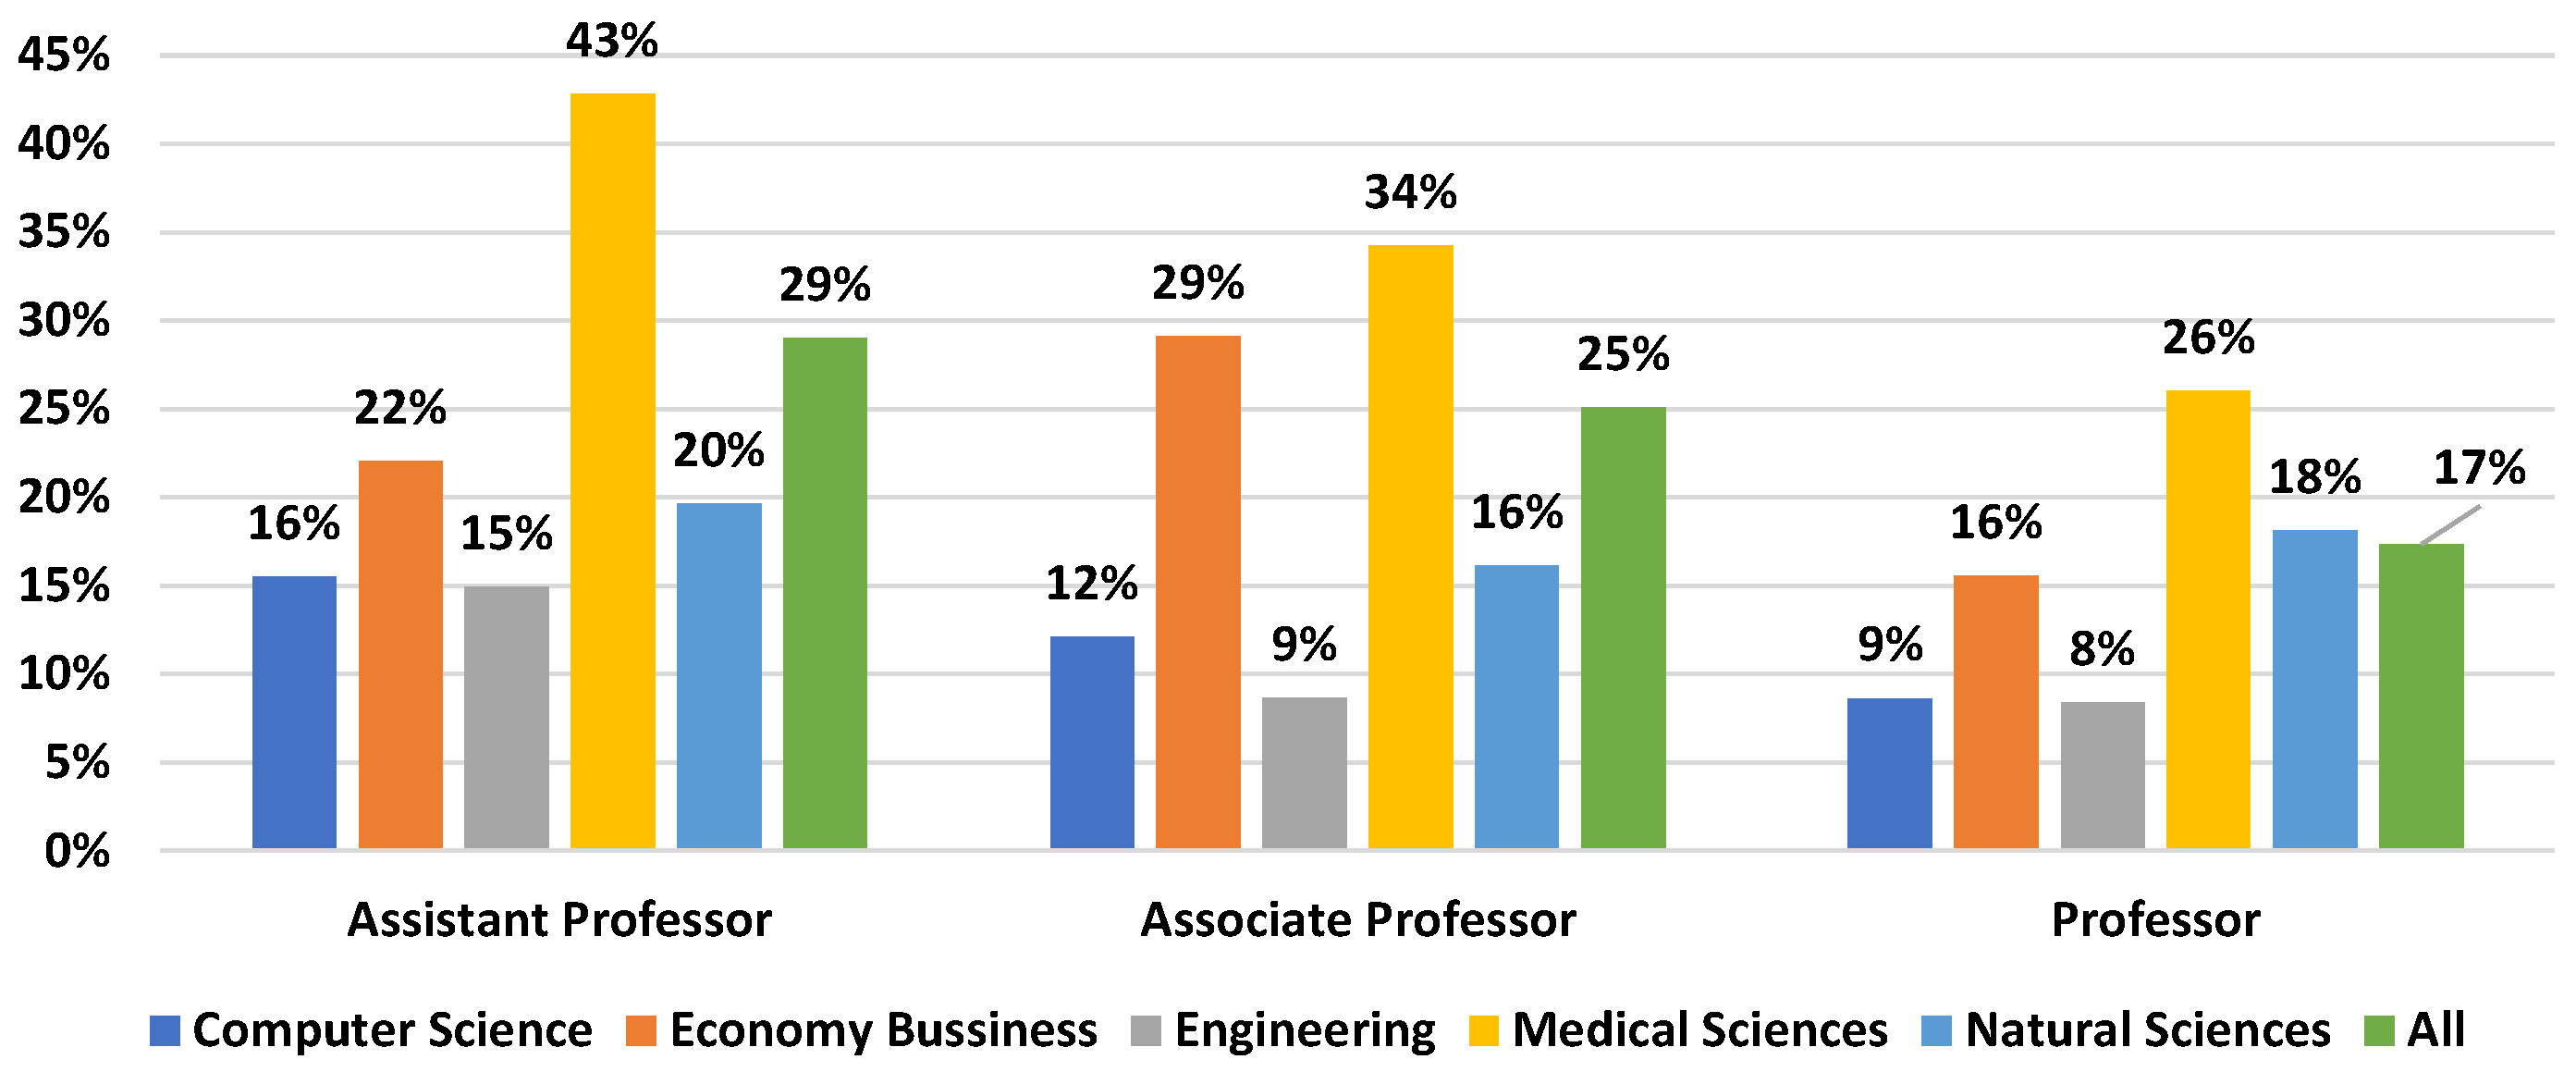

Table 1.
Google Scholar, Scopus, and derived indicators.
| Google Scholar Indicators | ||
| GS1 | Paper | Total number of documents |
| GS2 | Citations | The sum of the citation counts across all documents |
| GS3 | Cites per Year (CpY) | The sum of the citation counts across all documents, divided by the Years. |
| GS4 | Cites per Paper (CpP) | The sum of the citation counts across all documents, divided by the total number of papers. |
| GS5 | Papers per Author (PpA) | For each document, 1/author_count is calculated to give the normalized author count for the paper. The normalized author counts are then summed across all documents to provide the number of papers per author. |
| GS6 | Cites per Author (CpA) | Each document’s citation count is divided by the number of authors to give the normalized per-author citation count. The normalized citation counts are then summed across all documents to provide the number of citations per author over the result set. |
| GS7 | Authors per Paper (ApP) | The sum of the author counts across all documents is divided by the total number of documents. |
| SCOPUS Indicators | ||
| SC1 | Papers | Total number of documents in the Scopus citation index |
| SC2 | Citations | The sum of the citation counts across all documents in Scopus |
| Derived Indicators | ||
| DE1 | Ratio P | The ratio of documents in GS and Scopus [GS1/SC1] |
| DE2 | Ratio C | The ratio of citations in GS and Scopus [GS2/SC2] |
Table 2.
Demographic data – Initial and final sample.
| Gender / Location / Scientific field | Assistant Professor | Associate Professor | Professor | Total | |||||
|---|---|---|---|---|---|---|---|---|---|
| Total per level | 769 | 517 | 805 | 598 | 1251 | 900 | 2825 | 2015 | |
| Gender | Female | 223 | 142 | 202 | 148 | 217 | 147 | 642 | 437 |
| Male | 546 | 375 | 603 | 450 | 1034 | 753 | 2183 | 1578 | |
| Location | Central | 398 | 270 | 440 | 332 | 743 | 536 | 1581 | 1138 |
| Peripheral | 371 | 247 | 365 | 266 | 508 | 364 | 1244 | 877 | |
| Scientific field | Computer Sciences | 58 | 46 | 66 | 61 | 139 | 123 | 263 | 230 |
| Economics/Business/SSH | 136 | 70 | 79 | 47 | 193 | 116 | 408 | 233 | |
| Engineering | 134 | 95 | 127 | 102 | 250 | 192 | 511 | 389 | |
| Medical Sciences | 334 | 234 | 409 | 301 | 415 | 297 | 1158 | 832 | |
| Natural Sciences | 107 | 72 | 124 | 87 | 254 | 172 | 485 | 331 | |
Table 3.
Papers, citations, cites per year, cites per paper per scientific field.
| Scientific fields (Samples) / Metric | Computer Sciences (230) | Economics Business SSH (233) | Engineering (389) | Medical Sciences (832) |
Natural Sciences (331) |
|---|---|---|---|---|---|
| Papers (GS1) | 143 | 62 | 124 | 138 | 112 |
| Citations (GS2) | 2847 | 1062 | 2080 | 3208 | 2828 |
| Cites per Year (GS3) | 110,2 | 45,3 | 78,4 | 127,7 | 103,3 |
| Cites per paper (GS4) | 18,3 | 16,9 | 15,6 | 23,1 | 22,7 |
Table 4.
Papers per author (PpA - GS5) – Paper (GS1), ratio D1=Paper(GS1)/PpA(GS5), citations per author (CpA – GS6) – Citations (GS2), ratio DE1=Citations (GS2)/CpA(GS6) and Author per Paper (ApP-GS7) per scientific field.
Table 4.
Papers per author (PpA - GS5) – Paper (GS1), ratio D1=Paper(GS1)/PpA(GS5), citations per author (CpA – GS6) – Citations (GS2), ratio DE1=Citations (GS2)/CpA(GS6) and Author per Paper (ApP-GS7) per scientific field.
| Scientific fields (Samples) / Metric | Computer Sciences (230) | Economics Business SSH (233) | Engineering (389) | Medical Sciences (832) |
Natural Sciences (331) |
|---|---|---|---|---|---|
| Papers per Author (PpA – GS5) – Paper (GS1) | 49 (143) | 29 (62) | 43 (124) | 32 (138) | 37 (112) |
| Ratio DE1=Papers (GS1) /PpA (GS5) | 2,9 | 2,1 | 2,9 | 4,3 | 3,0 |
| Cites per Author (CpA-GS6) – Citations (GS2) | 983 (2847) | 498 (1062) | 707 (2080) | 703 (3208) | 866 (2828) |
| Ratio DE2=Citations (GS2) /CpA(GS6) | 2,9 | 2,1 | 2,9 | 4,6 | 3,3 |
| Authors per Paper (ApP-GS7) | 3,6 | 2,7 | 3,6 | 5,0 | 5,0 |
Table 5.
Paper (GS1) - Paper (SC1), % Ratio Papers SC1/GS1, Citations (GS1) - Citations (SC1), % Ratio Citations SC1/GS1 per scientific field.
Table 5.
Paper (GS1) - Paper (SC1), % Ratio Papers SC1/GS1, Citations (GS1) - Citations (SC1), % Ratio Citations SC1/GS1 per scientific field.
| Scientific fields (Samples) / Metric | Computer Sciences (230) | Economics Business SSH (233) | Engineering (389) | Medical Sciences (832) |
Natural Sciences (331) |
|---|---|---|---|---|---|
| Paper (GS1) - Paper (SC1) | 143 - 95 | 62 - 27 | 124 - 80 | 138 - 86 | 112 - 76 |
| % Ratio Papers SC1/GS1 | 66% | 43% | 64% | 63% | 68% |
| Citations (GS1) - Citations (SC1) | 2847 - 1399 | 1062 - 386 | 2080 - 1184 | 3208 - 2151 | 2828 - 2007 |
| % Ratio Citations SC1/GS1 | 49% | 36% | 57% | 67% | 71% |
Table 6.
Academic productivity (papers/citations) by gender in Google Scholar and Scopus.
| Samples | Papers GS1 | Citations GS2 | Papers SC1 | Citations SC1 | |
|---|---|---|---|---|---|
| All | 2,015 | 122.8 | 2,638.3 | 77.5 | 1,650.7 |
| Male | 1,578 | 127.8 | 2,709.4 | 82.0 | 1,688.0 |
| Female | 437 | 104.9 | 2,381.4 | 61.4 | 1,515.8 |
| Ratio | - | 82.1% | 87.9% | 74.9% | 89.8% |
| Computer Sciences | |||||
| Male | 203 | 147.3 | 2,904.0 | 99.6 | 1,417.9 |
| Female | 27 | 110.6 | 2,417.0 | 61.1 | 1,257.9 |
| Ratio | 75.1% | 83.2% | 61.4% | 88.7% | |
| Economics, Business, and SSH | |||||
| Male | 194 | 62.3 | 1,056.2 | 27.3 | 386.8 |
| Female | 39 | 57.4 | 1,090.5 | 24.0 | 382.9 |
| Ratio | - | 92.1% | 103.2% | 87.9% | 99.0% |
| Engineering | |||||
| Male | 352 | 125.5 | 2,140.1 | 81.1 | 1,223.9 |
| Female | 37 | 113.2 | 1,506.0 | 69.4 | 807.9 |
| Ratio | - | 90.2% | 70.4% | 85.6% | 66.0% |
| Medical Sciences | |||||
| Male | 552 | 151.0 | 3,526.3 | 96.8 | 2,370.1 |
| Female | 280 | 111.9 | 2,580.2 | 65.2 | 1,718.3 |
| Ratio | 74.1% | 73.2% | 67.4% | 72.5% | |
| Natural Sciences | |||||
| Male | 277 | 115.9 | 2,820.5 | 78.8 | 2,027.9 |
| Female | 54 | 94.1 | 2,865.1 | 63.5 | 1,897.9 |
| Ratio | - | 81.2% | 101.6% | 80.6% | 93.6% |
Table 7.
Rank and scientific field percentile targets for the annual number of publications/citations.
Table 7.
Rank and scientific field percentile targets for the annual number of publications/citations.
| Medical Sciences - High-productivity / impact scientific field | |||||
|---|---|---|---|---|---|
| Rank | Sample | 25th %ile | 50th %ile | 75th %ile | 90th %ile |
| Professor | 297 | 3.4 / 68 | 5.5 / 120 | 9.1 / 205 | 14.2 / 391 |
| Associate | 301 | 2.6 / 42 | 4.2 / 76 | 6.6 / 142 | 10.6 / 233 |
| Assistant | 234 | 1.6 / 25 | 3.0 / 56 | 6.1 / 106 | 9.3 / 199 |
| Computer Sciences - High-productivity / impact scientific field | |||||
| Rank | Sample | 25th %ile | 50th %ile | 75th %ile | 90th %ile |
| Professor | 123 | 2.9 / 34 | 5.7 / 88 | 8.8 / 167 | 10.8 / 298 |
| Associate | 61 | 3.0 / 40 | 4.5 / 68 | 8.1 / 139 | 11.8 / 220 |
| Assistant | 46 | 1.9 / 11 | 2.5 / 27 | 4.6 / 63 | 7.9 / 153 |
| Engineering - Moderate productivity/impact scientific field | |||||
| Rank | Sample | 25th %ile | 50th %ile | 75th %ile | 90th %ile |
| Professor | 192 | 2.5 / 24 | 4.3 / 53 | 7.2 / 109 | 11.1 / 233 |
| Associate | 102 | 2.4 / 22 | 4.1 / 44 | 6.0 / 91 | 8.6 / 181 |
| Assistant | 95 | 1.6 / 13 | 2.6 / 25 | 4.1 / 56 | 5.9 / 94 |
| Natural Sciences - Moderate productivity/impact scientific field | |||||
| Rank | Sample | 25th %ile | 50th %ile | 75th %ile | 90th %ile |
| Professor | 172 | 2.3 / 35 | 3.8 / 79 | 6.1 / 158 | 9.4 / 271 |
| Associate | 87 | 1.9 / 24 | 2.9 / 61 | 4.5 / 111 | 6.6 / 197 |
| Assistant | 72 | 1.7 / 13 | 2.5 / 29 | 3.6 / 79 | 5.8 / 182 |
| Economics, Business, and SSH fields - Low productivity/impact scientific field | |||||
| Rank | Sample | 25th %ile | 50th %ile | 75th %ile | 90th %ile |
| Professor | 116 | 1.7 / 18 | 2.7 / 39 | 3.6 / 71 | 5.2 / 134 |
| Associate | 47 | 1.5 / 15 | 2.1 / 27 | 4.1 / 55 | 4.7 / 94 |
| Assistant | 70 | 1.3 / 7 | 1.8 / 18 | 2.5 / 39 | 4.5 / 60 |
Disclaimer/Publisher’s Note: The statements, opinions and data contained in all publications are solely those of the individual author(s) and contributor(s) and not of MDPI and/or the editor(s). MDPI and/or the editor(s) disclaim responsibility for any injury to people or property resulting from any ideas, methods, instructions or products referred to in the content. |
© 2025 by the authors. Licensee MDPI, Basel, Switzerland. This article is an open access article distributed under the terms and conditions of the Creative Commons Attribution (CC BY) license (http://creativecommons.org/licenses/by/4.0/).
Copyright: This open access article is published under a Creative Commons CC BY 4.0 license, which permit the free download, distribution, and reuse, provided that the author and preprint are cited in any reuse.


