
Submitted:
25 August 2025
Posted:
26 August 2025
You are already at the latest version
Abstract
This study addresses critical bottlenecks in photocatalytic water treatment technologies, including difficulties in recovering traditional powdered catalysts, low mass transfer efficiency in immobilized reactors, and limited structural diversity. By integrating topology optimization with 3D printing technology, we designed and fabricated five types of triply periodic minimal surface photocatalytic reactors (TPMS-PCRs) with hierarchical porous structures—Fischer-Radin-Dunn (FRD), Neovius (N), Diamond (D), I-graph Wrapped Package (IWP) and Gyroid (G). Using fused deposition modeling (FDM), these TPMS configurations were manufactured from polylactic acid (PLA), 1.5 wt% TiO2/PLA, and 2.5 wt% TiO2/PLA. The catalytic degradation performance of these structurally distinct reactors for organic pollutants varied significantly. Notably, the FRD-type TPMS-PCR loaded with 2.5 wt% TiO2 achieved a methylene blue (MB) degradation rate of 93.4 % within 2.5 hours under rotational flow conditions, compared to 87.5 % under horizontal flow conditions.
Keywords:
triply periodic minimal surface (TPMS) model
; photocatalytic reactor
; TiO2/PLA composite
1. Introduction
Semiconductor photocatalysis, particularly utilizing titanium dioxide (TiO2) for water treatment, is regarded as a highly promising solution to environmental pollution problems. However, several critical bottlenecks hinder its transition from laboratory-scale research to large-scale practical application. Traditional nano-sized TiO2 powder catalysts, despite their high activity, suffer from issues such as tendency to agglomerate, difficulty in recovery, potential secondary pollution, and low mass transfer efficiency in practical reactor systems[1,2,3]. Although immobilization techniques (e.g., loading catalysts onto flat plates or granular supports) partially address the recovery problem, they often sacrifice the catalyst's specific surface area and introduce new mass transfer limitations, resulting in reduced overall catalytic efficiency. Furthermore, conventional manufacturing processes restrict the complexity and design flexibility of reactor structures, making it challenging to optimize the internal flow and light distribution within the reactor, which further limits performance[4,5].
The emergence of additive manufacturing (3D printing) technology offers a revolutionary new approach to overcoming the above challenges. Among various 3D printing techniques, Fused Deposition Modeling (FDM) has shown great potential in fabricating functional devices due to its operational simplicity, low cost, and broad material compatibility[6,7,8]. For particulate materials lacking viscosity, such as catalysts, FDM technology can employ thermoplastic polymers (e.g., PLA, ABS) as support materials and binders. By pre-mixing catalyst particles with polymer pellets and feeding them into a screw extruder, the polymer melts at high temperatures and encapsulates the catalyst particles, enabling co-extrusion to ultimately produce monolithic catalysts with complex three-dimensional structures[9]. This method not only achieves perfect catalyst immobilization but also provides the carrier structure with a high degree of design freedom.
Recent years have seen researchers increasingly exploring the application of FDM in the field of catalysis. For instance, Binetti et al. [10] used PET polymer to fabricate monolithic supports with customized internal channels via FDM technology and systematically studied the impact of their structure on NOx removal performance. More recently, Liu et al. [11] developed an innovative strategy: first embedding chlorella powder into an ABS/TPU matrix and forming a porous scaffold (ATCh40) via FDM, followed by subsequent treatment to grow Fe₂O₃ successfully on the scaffold surface (ATCh40-Fe₂O₃), effectively addressing the immobilization and active site exposure issues of powder catalysts. These studies signify that 3D printing is evolving from merely manufacturing supports to "printing functionally active materials themselves."
To maximize the efficacy of 3D-printed structures, selecting the optimal topological configuration is crucial. Triply Periodic Minimal Surfaces (TPMS) are abstract surfaces that exhibit periodicity in all three spatial dimensions and possess zero mean curvature, such as Gyroid (G), Diamond (D), and Primitive (P) structures[12,13]. TPMS structures translate mathematical elegance into exceptional engineering performance: they offer extremely high specific surface area, fully interconnected channels (ensuring excellent mass transfer), self-supporting robust structures, and highly tunable geometric parameters (e.g., unit cell size, porosity)[14].
By assigning thickness to TPMS surfaces, ideal porous models can be obtained. Such structures exhibit very high porosity, and their internally continuous and tortuous channels create superior conditions for fluid mixing and mass transfer. Simultaneously, the enormous specific surface area allows for the attachment of large amounts of photocatalytic material, thereby providing abundant photoactivation sites under UV irradiation, ultimately significantly enhancing photocatalytic degradation efficiency[15]. Therefore, integrating TPMS design with 3D printing technology opens up new avenues for constructing a new generation of high-performance, customizable photocatalytic reactors.
Figure 1.
TPMS Types and Corresponding Unit Cells[77].
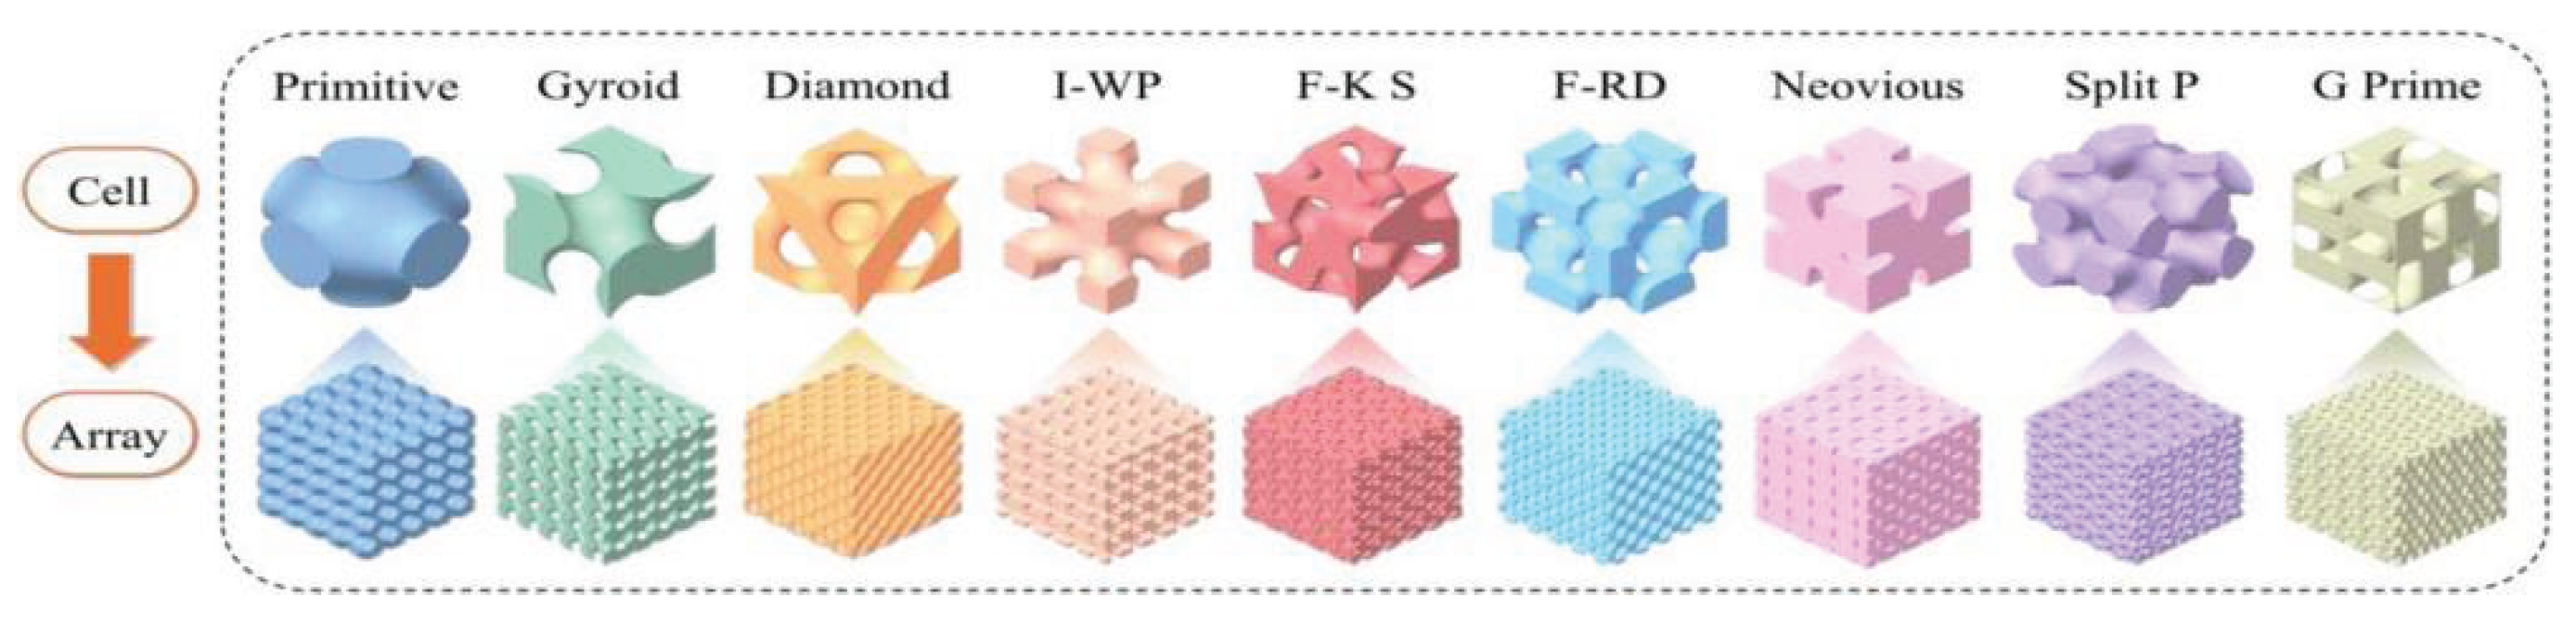
This study utilizes TiO2/PLA composite material, synthesized from titanium dioxide nanoparticles and the thermoplastic polymer polylactic acid (PLA), as the printing feedstock for fused deposition modeling (FDM). Five types of triply periodic minimal surface (TPMS) function models, including FRD, N, D, G, and IWP, were selected for investigation. The geometric node flowchart of the TPMS structures was designed using the 3D modeling software Blender, enabling the fabrication of TPMS-based photocatalytic reactors (TPMS-PCRs) via FDM 3D printing. The synthesized TPMS-PCRs were characterized by XRD, FTIR, and SEM/EDS. Furthermore, the degradation performance of the FDM-printed TPMS-PCRs was evaluated by examining different flow fields and varying TiO2 catalyst loading levels.
2. Experimental
2.1. Synthesis of TiO2/PLA Composite Filament
The twin-screw 3D printing filament extruder was switched on and preheated for 30 minutes, with the temperature parameters for each processing zone set as detailed in Table 1. Once the actual temperatures of all temperature-controlled zones reached the preset values, the single-phase air-cooling system was activated. The extruder was initially purged with pure polylactic acid (PLA). The purging process was considered complete when the extrudate emerged as a milky-white, impurity-free semi-formed PLA filament.
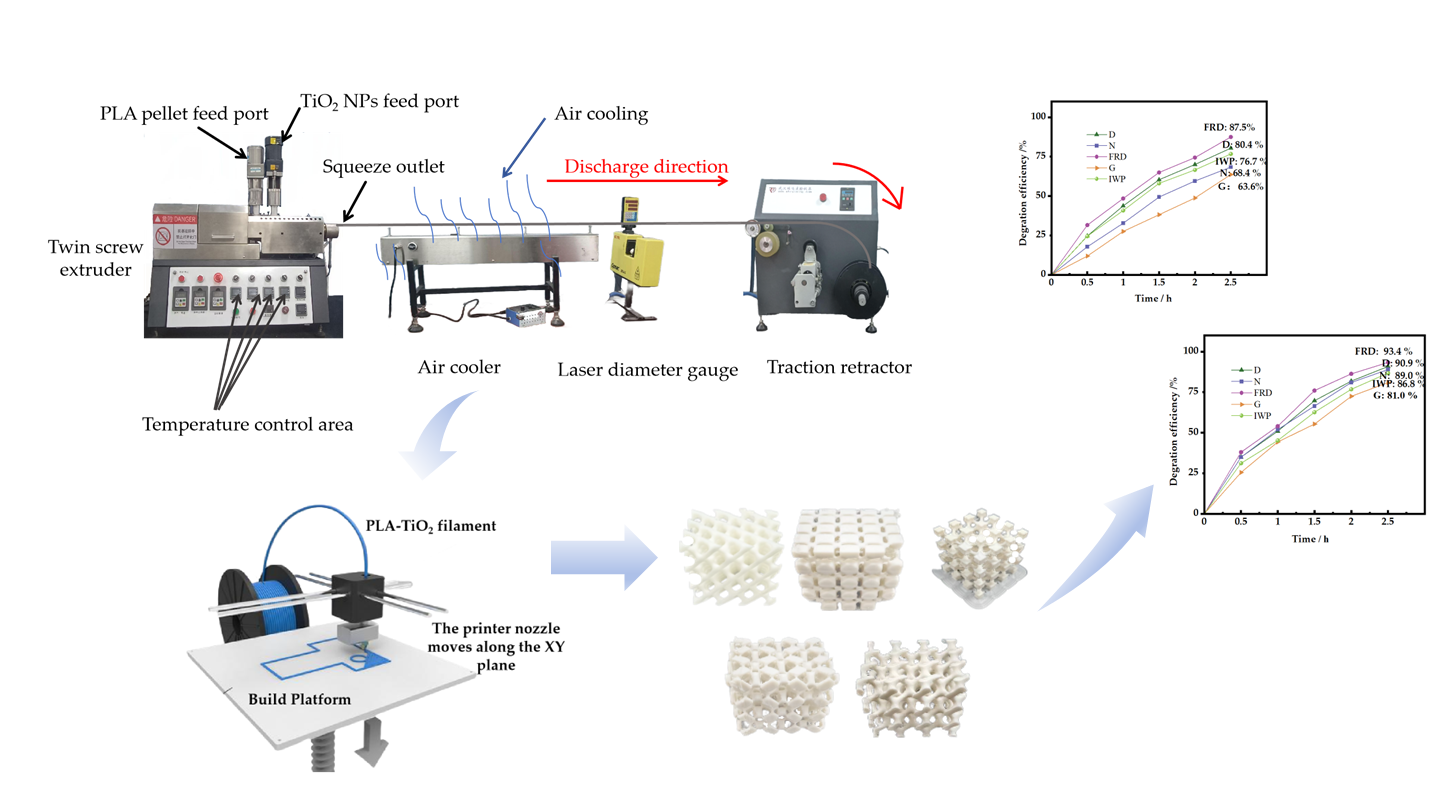
Titanium dioxide nanoparticles (TiO2 NPs) and PLA raw pellets were pre-dried separately at 120 ℃ for 4 hours. The TiO2 NPs were incorporated at mass fractions of 1.5% and 2.5%. After drying, the mixtures were gradually fed into the extruder through the feeding zone. The temperature profile of the twin-screw extruder was set as follows: Zone 1: 175 ℃, Zone 2: 185 ℃, Zone 3: 190 ℃, Die Zone 1: 180 ℃, and Die Zone 2: 175 ℃. The composites were melt-blended at high temperatures and extruded through the discharge outlet. The extruded filament was cooled in an air-cooling chamber and then passed through a laser diameter gauge before being directed into the traction winder (Figure 2).
The winding speed was adjusted based on real-time diameter measurements from the laser gauge to synchronize with the extrusion rate, thereby ensuring the production of uniform cylindrical composite pellets. The filament was manufactured to meet the standard diameter of 1.75 mm for fused deposition modeling (FDM). The rotational speeds of the air-cooling chamber and the traction winder were maintained at 130 rad/min and 3.1 rad/min, respectively. Following the operational parameters of the twin-screw extruder outlined in Table 1, TiO2/PLA composite 3D printing filaments with varying ratios were successfully fabricated. Filament uniformity is critical to printing accuracy; therefore, the diameter deviation was controlled within ±0.05 mm.
2.2. Fabrication of Triply Periodic Minimal Surface (TPMS) Reactors via 3D Printing
The design of photocatalytic reactors must address several critical requirements: the catalyst support should possess a high specific surface area, achievable through hierarchical pore structures, nanocomposite materials, and customized 3D-printed carriers, to enhance active site density; light transmission and refractive index control must be optimized to minimize optical loss and improve photon utilization efficiency; the reactor should exhibit strong compatibility with light sources, ensuring that the emission spectrum aligns with the catalyst's bandgap for improved energy efficiency and treatment performance; fluid channel configurations should enhance mass transfer to reduce diffusion resistance and avoid mass-transfer-limited reaction rates; lastly, sufficient loading stability and mechanical strength are essential to prevent frequent reactor failure.
TPMS structures allow precise control over the parameter C in their mathematical formulation, enabling high specific surface area, excellent light transmittance, high connectivity, structural stability, and light source adaptability—making them ideally suited for efficient photocatalytic reactor design. Using a 3D printing plugin in Blender, TPMS models were designed and evaluated via geometric node analysis to compute key structural parameters. The main structural parameters corresponding to different values of C used in this study are summarized in Appendix Table A1.
The parameter C strongly influences volume and porosity. It controls the amplitude of periodic variation in the TPMS surface: as C decreases, the structural “depressions” become shallower, the solid fraction increases, and the overall volume rises. Porosity is positively correlated with C: higher C values result in higher porosity, making them suitable for applications requiring high permeability or low density (e.g., filtration, lightweight materials).
The surface area of the FRD type decreases slightly with decreasing C, while other types (e.g., Gyroid, Diamond) exhibit an increase. Different TPMS mathematical expressions respond differently to changes in C: the N-type surface shows more pronounced fractal characteristics with increased wrinkling as C decreases. All types exhibit a decrease in specific surface area (S/V ratio) as C declines. Thus, high-C values are suitable for catalytic reactions (requiring high active site exposure), while low-C values are preferable for structural support (requiring high mechanical strength).
The G-type demonstrates balanced performance: at C = 1.2, the S/V ratio reaches 17.94 cm²/cm³ with a porosity of 89.56%, making it ideal for ultra-light porous supports or highly efficient adsorption applications. The N-type at C = 0.5 shows a porosity of 78.02%, higher than that of FRD (66.20%) and D-type (53.32%) under the same parameter, rendering it suitable for high-permeability fluid channel designs. The D-type exhibits low specific surface area characteristics: at C = 0.1, the S/V ratio is 8.79 cm²/cm³, representing a dense structure potentially applicable in load-bearing multifunctional components.
In summary, parameter C is a central variable for tuning TPMS structural properties. A decrease in C leads to increased volume, reduced porosity, and lower S/V ratio, though the sensitivity to C varies significantly among different structural types. Design should be tailored to specific applications (e.g., catalysis, filtration, lightweight structures) through optimization of C and selection of the appropriate TPMS type. The TPMS parameters and corresponding structural properties used in this study are listed in Table 2 below.
Using the FDM method (Figure 3), the models were printed with a layer height of 0.1 mm, 100% infill density, a nozzle temperature of 210 °C (slightly above the melting point of PLA), and a printing speed of 50 mm/s. Brim-type support was applied to ensure the stability of the bottom layers. As a result, triply periodic minimal surface structures with dimensions of 4 × 4 × 4 cm and containing 1.5 and 2.5 wt% TiO₂ were successfully fabricated (Figure 4).
3. Results
3.1. Structural and Morphological Analysis
3.1.1. X-ray Diffraction
X-ray diffraction (XRD) was characterized on a Bruker D8 Advance diffractometer (Bruker, Germany) using Cu Kα (1.5418 nm).
As shown in Figure 5, the XRD diffraction pattern of the powder sample exhibits characteristic peaks at 2θ values of 25.36°, 27.44°, 37.05°, 41.23°, and 48.15°. Comparison with standard reference patterns confirms that the sample consists of a mixture of anatase (PDF #76-0649) and rutile (PDF #73-1764) phases of TiO2.
3.1.2. Contact Angle Test
The contact angles of PLA and TiO2/PLA composites were measured using an SDC-100 contact angle analyzer to evaluate their wettability. As shown in Table 3, the contact angle of pure PLA was 80.771°, indicating its hydrophobic nature. The incorporation of TiO2 nanoparticles, which are rich in surface hydroxyl groups (-OH), enhanced the hydrophilicity of the composites. With increasing TiO2 content, more hydrophilic -OH groups were introduced, leading to a reduction in surface energy. Furthermore, the presence of TiO2 nanoparticles increased the surface roughness, which also contributed to the improved hydrophilicity of the TiO₂/PLA composites. The consistent contact angle values between the left and right sides suggest a uniform dispersion of TiO2 within the PLA matrix and demonstrate the high reproducibility of the sample preparation process.
3.1.3. SEM/EDS表征
The morphology of the photocatalytic reactor was observed using a Hitachi SU 8010 high-resolution field emission scanning electron microscope (SEM). Simultaneously, qualitative and semi-quantitative elemental analysis of the target sample was performed using energy dispersive spectroscopy (EDS).
Figure 6 and Figure 7 show the SEM and EDS images of N-PCR fabricated by fused deposition modeling (FDM), respectively. It can be observed that FDM employs a layer-by-layer additive manufacturing approach, resulting in a relatively rough surface. The presence of TiO2 distributed within the TiO2/PLA-based PCR matrix is evident. As the proportion of TiO2 in the TiO2/PLA composite filament increases, the gaps in the N-PCR produced by FDM printing are significantly reduced, which may be attributed to the intermolecular interactions between TiO2 and PLA.
EDS analysis indicates that Ti elements are uniformly distributed in the N-PCR printed using 1.5 wt% and 2.5 wt% TiO2/PLA composite filaments. The homogeneous distribution is observed both between and within the layers of the PCRs. As the TiO2 content increases, the distribution of Ti elements becomes more concentrated.
3.2. Analysis of Photocatalytic Performance
The three-dimensional photocatalytic reactor sample fabricated by fused deposition modeling was subsequently placed into the photocatalytic reaction apparatus. The photocatalytic tests were conducted under the condition of a chilled water circulation system to maintain the internal temperature of the reactor at 20 °C. A 500 W mercury lamp with an irradiation wavelength range of 254–700 nm was used as the light source in the photocatalytic reaction system. A methylene blue solution with a mass fraction of 0.05% was selected as the target pollutant. The discoloration of the dye was evaluated by measuring its absorbance using an A360 UV-Vis spectrophotometer (supplied by Aoyi Instruments, Shanghai Co., Ltd.). Five types of TPMS-PCRs—IWP, G, N, D, and FRD—were placed in both horizontal and rotational flow fields (Figure 8) to evaluate their performance in degrading methylene blue under different hydrodynamic conditions.
In the horizontal flow field configuration, a glass tube measuring 20 cm in height and 11 cm in diameter was utilized. The inlet and outlet ports were aligned horizontally and positioned 7 cm above the base, each with a diameter of 1 cm. These openings were centrally aligned with the TPMS-PCRs structures. A methylene blue solution was circulated through the system via a peristaltic pump at a flow rate of 500 mL/min, and samples were collected at 30-minute intervals for analysis.
For the rotational flow field setup, a magnetic stirrer was placed below the TPMS-PCR sample, operating at a stirring speed of 1200 rad/min. This generated an average fluid velocity of approximately 0.5 m/s. The reaction was conducted in a glass vessel with a height of 10 cm and a diameter of 8 cm, with the model secured 3 cm above the bottom. The beaker was maintained level and placed 2 cm from the light source. All samples were exposed to a mercury lamp for 2.5 hours, with aliquots taken every 30 minutes.
In both flow systems, the samples were initially maintained in complete darkness for 5 hours to eliminate interference from the adsorption behavior of the five TPMS-PCR structures (IWP, G, N, D, and FRD) under non-irradiated conditions, thereby ensuring accurate assessment of their subsequent photocatalytic degradation performance. Following this dark adaptation period, the methylene blue solutions were analyzed using an A360 UV-Vis spectrophotometer (supplied by Aoyi Instruments, Shanghai Co., Ltd.) to measure dye discoloration based on absorbance at the characteristic peak of 664 nm. The blank absorbance was denoted as A0, the absorbance after catalytic degradation as A1. The degradation efficiency was calculated using Equation (1).
4. Discussion
Firstly, the FRD-PCR was selected to investigate the effect of varying parameter C on the photocatalytic performance. As illustrated, the FRD-PCR with C=0.3 exhibited photocatalytic degradation efficiencies of 76.4% (under rotational flow field) and 54.4% (under horizontal flow field) after 2.5 hours, both of which were lower than those achieved by the FRD-PCR with C=0.5, which reached 87.5% and 63.3%, respectively. Furthermore, the C=0.5 configuration demonstrated advantages in terms of material consumption, cost efficiency, and moderate operational stability. Therefore, for comparative analysis with other reactors, the FRD-PCR with a parameter C value of 0.5 was employed.

Table 4.
Effect of parameter C on the photocatalytic degradation efficiency of FRD-PCRs.
| Parameter C | Photocatalytic degradation efficiency after 2.5 h | |
|---|---|---|
| ( 1.5wt%TiO2/PLA, rotational flow field ) | (1.5wt%TiO2/PLA, horizontal flow field ) | |
| 0.5 | 87.5 % | 63.3 % |
| 0.3 | 76.4 % | 54.4 % |
Figure 9a,b illustrate the photocatalytic degradation performance of FDM-printed 1.5 wt% TiO₂/PLA-based TPMS-PCRs under horizontal and rotational flow fields, respectively. The photocatalytic degradation rate and overall efficiency were consistently lower under horizontal flow conditions compared to rotational flow conditions. Among the tested configurations, the G-PCR exhibited the lowest overall photocatalytic degradation rate (as indicated by its shallow slope) and the lowest degradation efficiencies (42.6% under horizontal flow and 63.6% under rotational flow). In contrast, the FRD-PCR demonstrated the highest degradation rate and efficiency, achieving 63.3% and 87.5% under horizontal and rotational flow fields, respectively. The D-PCR and IWP-PCR showed comparable photocatalytic degradation performances, with no significant difference between them.
Figure 9c,d depict the corresponding degradation results for structures printed with 2.5 wt% TiO₂/PLA composite filaments. Increasing the TiO₂ content led to improved degradation performance across all architectures. The FRD-PCR, which outperformed all other designs, reached a degradation efficiency of 93.4% in the rotational flow field. The N-PCR also exhibited a substantial enhancement in photocatalytic activity. Conversely, the G-PCR remained the least effective, with degradation efficiencies of 74.6% and 81.0% in the horizontal and rotational flow fields, respectively.
According to the literature [16], a reduction in the pore size of TPMS structures diminishes the optical penetration depth, whereas elevated porosity improves both light utilization efficiency and internal fluid flow dynamics. Consequently, the photocatalytic performance of TMPS-PCRs is co-determined by three key structural parameters: porosity, which governs light penetration and permeability; specific surface area, which dictates catalyst loading and active site availability; and average pore size, which influences mass transfer and light scattering behavior.
Table 5 summarizes the porosity, specific surface area, average pore size, and photocatalytic efficiency of TMPS-PCRs, using 2.5 wt% TiO₂/PLA composites under rotational flow field conditions as an example, and provides an analysis of the corresponding structure–performance relationships. Meanwhile, In the design of TPMS structures, the parameter C serves as a fundamental mathematical variable controlling the geometric morphology by altering the isosurface threshold in the implicit function equation. It directly governs key structural properties including porosity, pore size distribution, and specific surface area. Increasing the value of C generally leads to reduced porosity and a more densely packed structure, whereas decreasing C promotes the formation of open porous networks with high permeability. This trend aligns closely with the photocatalytic performance observed in our study: the FRD, N and D structures with C = 0.5 showed higher apparent catalytic efficiency. These results demonstrate that tuning C enables synergistic optimization of light harvesting, mass transfer, and active site exposure, providing a critical theoretical basis for the design of high-efficiency catalytic substrates.
5. Conclusions
In this study, TiO2/PLA as the supporting matrix to successfully fabricate composite filaments. Five types of TPMS-based photocatalytic reactors (TPMS-PCRs), namely N, D, FRD, G, and IWP structures, were manufactured via FDM 3D printing technology through modeling and slicing processes. This approach significantly improved the reusability of the photocatalytic reactors while reducing production costs.
With increasing TiO2 content, the reactors exhibited enhanced hydrophilicity, improving their wetting behavior and contact with the aqueous solution, thereby facilitating the catalytic degradation process. The triply periodic minimal surface (TPMS) porous architecture provided extended optical pathways and increased light reflection, greatly improving light utilization and activating more catalytic sites on the reactor surface.
The fabricated photocatalytic reactors demonstrated excellent degradation performance across different flow configurations. Among them, the FRD-type porous scaffold printed with 2.5 wt% TiO2/PLA composite filament exhibited the highest photocatalytic activity, achieving a methylene blue (MB) degradation rate of 93.4 % within 2.5 hours under rotational flow conditions, compared to 87.5 % under horizontal flow conditions.
Furthermore, the factors influencing photocatalytic efficiency were systematically discussed, leading to the conclusion that the photocatalytic performance of the TMPS-PCRs is co-determined by three key structural parameters: porosity, specific surface area, and average pore size.
Author Contributions
Conceptualization, Xi Chen and Chenxi Zhang; methodology, Xiao Chen; software, Qi Chen; writing—original draft preparation, Qi Chen; writing—review and editing, Ningning Li
Funding
This research was funded by 2023 Henan Province Research-Oriented Teaching Reform Research and Practice Project:”Construction and Practice of a Dual-Wing, Multi-Element Research-Based Teaching Model for Cultivating Innovative Materials Science Talents”.
Data Availability Statement
The original contributions presented in this study are included in the article/supplementary material. Further inquiries can be directed to the corresponding author.
Acknowledgments
During the preparation of this manuscript, DeepSeek was utilized for text refinement. The authors have thoroughly reviewed and edited all AI-generated content and assume full responsibility for the publication.
Conflicts of Interest
The authors declare no conflicts of interest.
Abbreviations
The following abbreviations are used in this manuscript:
| TPMS | Triply Periodic Minimal Surface |
| PCR | PhotocatalyticReactors |
| FRD | Fischer-Radin-Dunn |
| N | Neovius |
| D | Diamond |
| IWP | I-graph Wrapped Package |
| G | Gyroid |
Appendix A
Appendix A.1
Table A1 summarizes the principal structural parameters of the 4 cm × 4 cm × 4 cm TPMS-based photocatalytic reactors corresponding to varying design parameter C values.
Table A1.
Main structural parameters corresponding to different design parameter C values (4 cm ×4 cm× 4 cm).
Table A1.
Main structural parameters corresponding to different design parameter C values (4 cm ×4 cm× 4 cm).
| TPMS | Parameter C | Volume (cm3) |
Surface area (cm2) |
Poosity (%) |
Specific surface area (cm2/cm3) |
|---|---|---|---|---|---|
| FRD | 0.5 | 20.2806 | 252.8271 | 66.20% | 12.47 |
| 0.4 | 24.3341 | 263.4307 | 59.44% | 10.83 | |
| 0.3 | 28.1025 | 262.088 | 53.16% | 9.33 | |
| 0.2 | 31.5176 | 260.35 | 47.47% | 8.26 | |
| 0.1 | 34.7453 | 254.8902 | 42.09% | 7.34 | |
| N | 0.5 | 28.0057 | 276.1458 | 78.02% | 14.17 |
| 0.4 | 29.399 | 283.1603 | 71.65% | 12.12 | |
| 0.3 | 30.7664 | 288.2382 | 65.40% | 10.62 | |
| 0.2 | 32.1576 | 292.0641 | 59.25% | 9.46 | |
| 0.1 | 33.5395 | 294.8173 | 53.14% | 8.51 | |
| D | 0.5 | 13.1894 | 186.8994 | 53.32% | 9.86 |
| 0.4 | 17.0088 | 206.1038 | 51.00% | 9.63 | |
| 0.3 | 20.758 | 220.4739 | 48.72% | 9.37 | |
| 0.2 | 24.453 | 231.291 | 46.40% | 9.08 | |
| 0.1 | 28.114 | 239.2879 | 44.10% | 8.79 | |
| G | 1.2 | 6.265 | 112.3928 | 89.56% | 17.94 |
| 1 | 10.8215 | 141.5935 | 81.96% | 13.08 | |
| 0.8 | 15.175 | 161.8086 | 74.71% | 10.66 | |
| 0.6 | 19.4092 | 177.3254 | 67.65% | 9.14 | |
| IWP | 2.0 | 14.9278 | 172.6605 | 75.12% | 11.57 |
| 1.8 | 16.9145 | 181.4704 | 71.81% | 10.73 | |
| 1.6 | 18.8147 | 188.9283 | 68.64% | 10.04 |
References
- Rostami, M.; Badiei, A.; Ganjali, M.R.; Rahimi-Nasrabadi, M.; Naddafi, M.; Karimi-Maleh, H. Nano-architectural design of TiO2 for high performance photocatalytic degradation of organic pollutant: A review. Environ. Res. 2022, 212, 113347. [Google Scholar] [CrossRef] [PubMed]
- Ijaz, M.; Zafar, M. Titanium dioxide nanostructures as efficient photocatalyst: Progress, challenges and perspective. Int. J. Energy Res. 2021, 45, 3569–3589. [Google Scholar] [CrossRef]
- Li, Y.Z.; Ma, Y.J.; Li, K.; Chen, S.H.; Yue, D.T. Photocatalytic Reactor as a Bridge to Link the Commercialization of Photocatalyst in Water and Air Purification. Catalysts 2022, 12, 724. [Google Scholar] [CrossRef]
- Mei, J.N.; Gao, X.M.; Zou, J.; Pang, F. Research on Photocatalytic Wastewater Treatment Reactors: Design, Optimization, and Evaluation Criteria. Catalysts 2023, 13, 974. [Google Scholar] [CrossRef]
- Al-Yahyaey, S.; Kyaw, H.H.; Myint, M.T.Z.; Al-Hajri, R.; Al-Sabahi, J.; Al-Abri, M. Multi-channel flow reactor design for the photocatalytic degradation of harmful dye molecules. J. Nanopart. Res. 2024, 26, 72. [Google Scholar] [CrossRef]
- Dewada, S.S.; Telang, A. A review of recently developed polymer composite materials for fused deposition modeling 3D printing. Mater. Res. Express 2021, 8, 122001. [Google Scholar] [CrossRef]
- Mackiewicz, E.; Wejrzanowski, T.; Adamczyk-Cieslak, B.; Oliver, G.J. Polymer-Nickel Composite Filaments for 3D Printing of Open Porous Materials. Materials 2022, 15, 1360. [Google Scholar] [CrossRef] [PubMed]
- Sangiorgi, A.; Gonzalez, Z.; Ferrandez-Montero, A.; Yus, J.; Sanchez-Herencia, A.J.; Galassi, C.; Sanson, A.; Ferrari, B. 3D Printing of Photocatalytic Filters Using a Biopolymer to Immobilize TiO2 Nanoparticles. J. Electrochem. Soc. 2019, 166, H3239–H3248. [Google Scholar] [CrossRef]
- Fagundes, A.P.; Neiva, E.G.C.; Zimmermann, L.M.; Padoin, N.; Riella, H.G. Melting and solution mixing in the production of photocatalytic filaments for 3D printing. Chem. Eng. Sci. 2025, 302, 120862. [Google Scholar] [CrossRef]
- Basterrechea, G.F.B.; Montesinos, V.N.; Quici, N. Photocatalytic NOx removal with TiO2-impregnated 3D-printed PET supports. Heliyon 2023, 9, e22635. [Google Scholar] [CrossRef] [PubMed]
- Liu, D.Y.; Cai, H.J.; Zhou, W.M.; Lei, D.D.; Cao, C.L.; Xia, X.S.; Xiao, L.R.; Qian, Q.R.; Chen, Q.H. Application of 3D printing technology for green synthesis of Fe2O3 using ABS/TPU/chlorella skeletons for methyl orange removal. RSC Adv. 2024, 14, 1501–1512. [Google Scholar] [CrossRef] [PubMed]
- Yeranee, K.; Rao, Y. A Review of Recent Research on Flow and Heat Transfer Analysis in Additively Manufactured Transpiration Cooling for Gas Turbines. Energies 2025, 18, 3282. [Google Scholar] [CrossRef]
- Antonietti, M. Introduction to Porous Materials. Angew. Chem. Int. Ed. 2020, 59, 13693. [Google Scholar] [CrossRef]
- Arsentev, M.; Topalov, E.; Balabanov, S.; Sysoev, E.; Shulga, I.; Akhmatnabiev, M.; Sychov, M.; Skorb, E.; Nosonovsky, M. Crystal-Inspired Cellular Metamaterials and Triply Periodic Minimal Surfaces. Biomimetics 2024, 9, 285. [Google Scholar] [CrossRef] [PubMed]
- D'Accolti, L.; De Cataldo, A.; Montagna, F.; Corcione, C.E.; Maffezzoli, A. The Role of 3D Printing in the Development of a Catalytic System for the Heterogeneous Fenton Process. Polymers 2023, 15, 580. [Google Scholar] [CrossRef] [PubMed]
- Li, N.N.; Zhan, H.W.; Tong, K.; Chen, Z.D.; Kong, Y.Q.; Yang, L.J.; Du, X.Z. Lattice Boltzmann method to simulate photocatalytic reduction of CO2 over PCN-601 coated on transparent porous substrate. Phys. Scr. 2025, 100, 015532. [Google Scholar] [CrossRef]
Figure 2.
TiO2/PLA composite 3D printing wire production process.
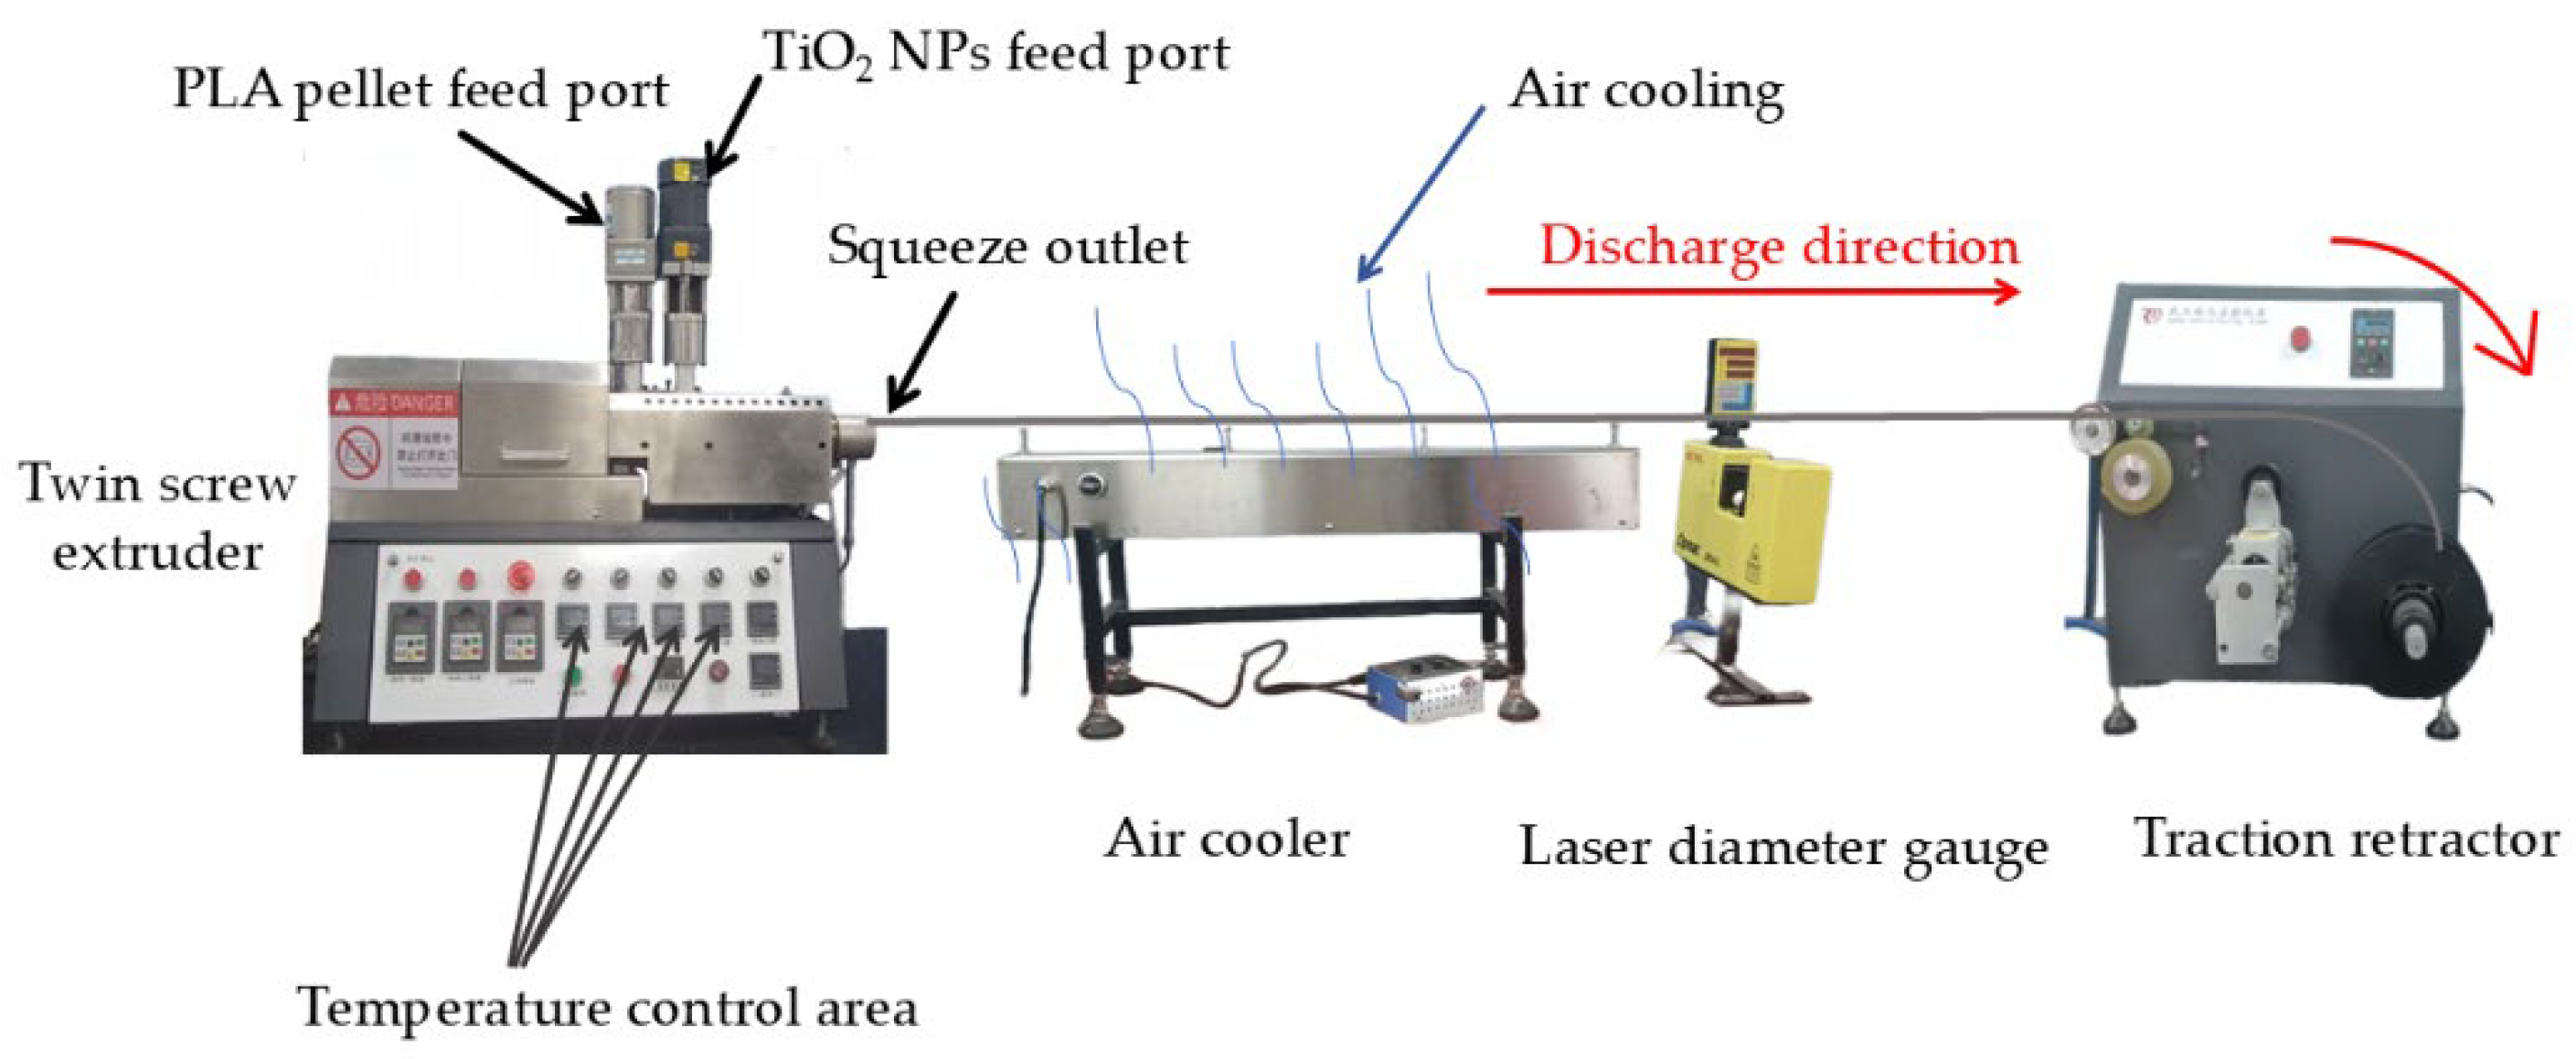
Figure 3.
FDM 3D printing Process.
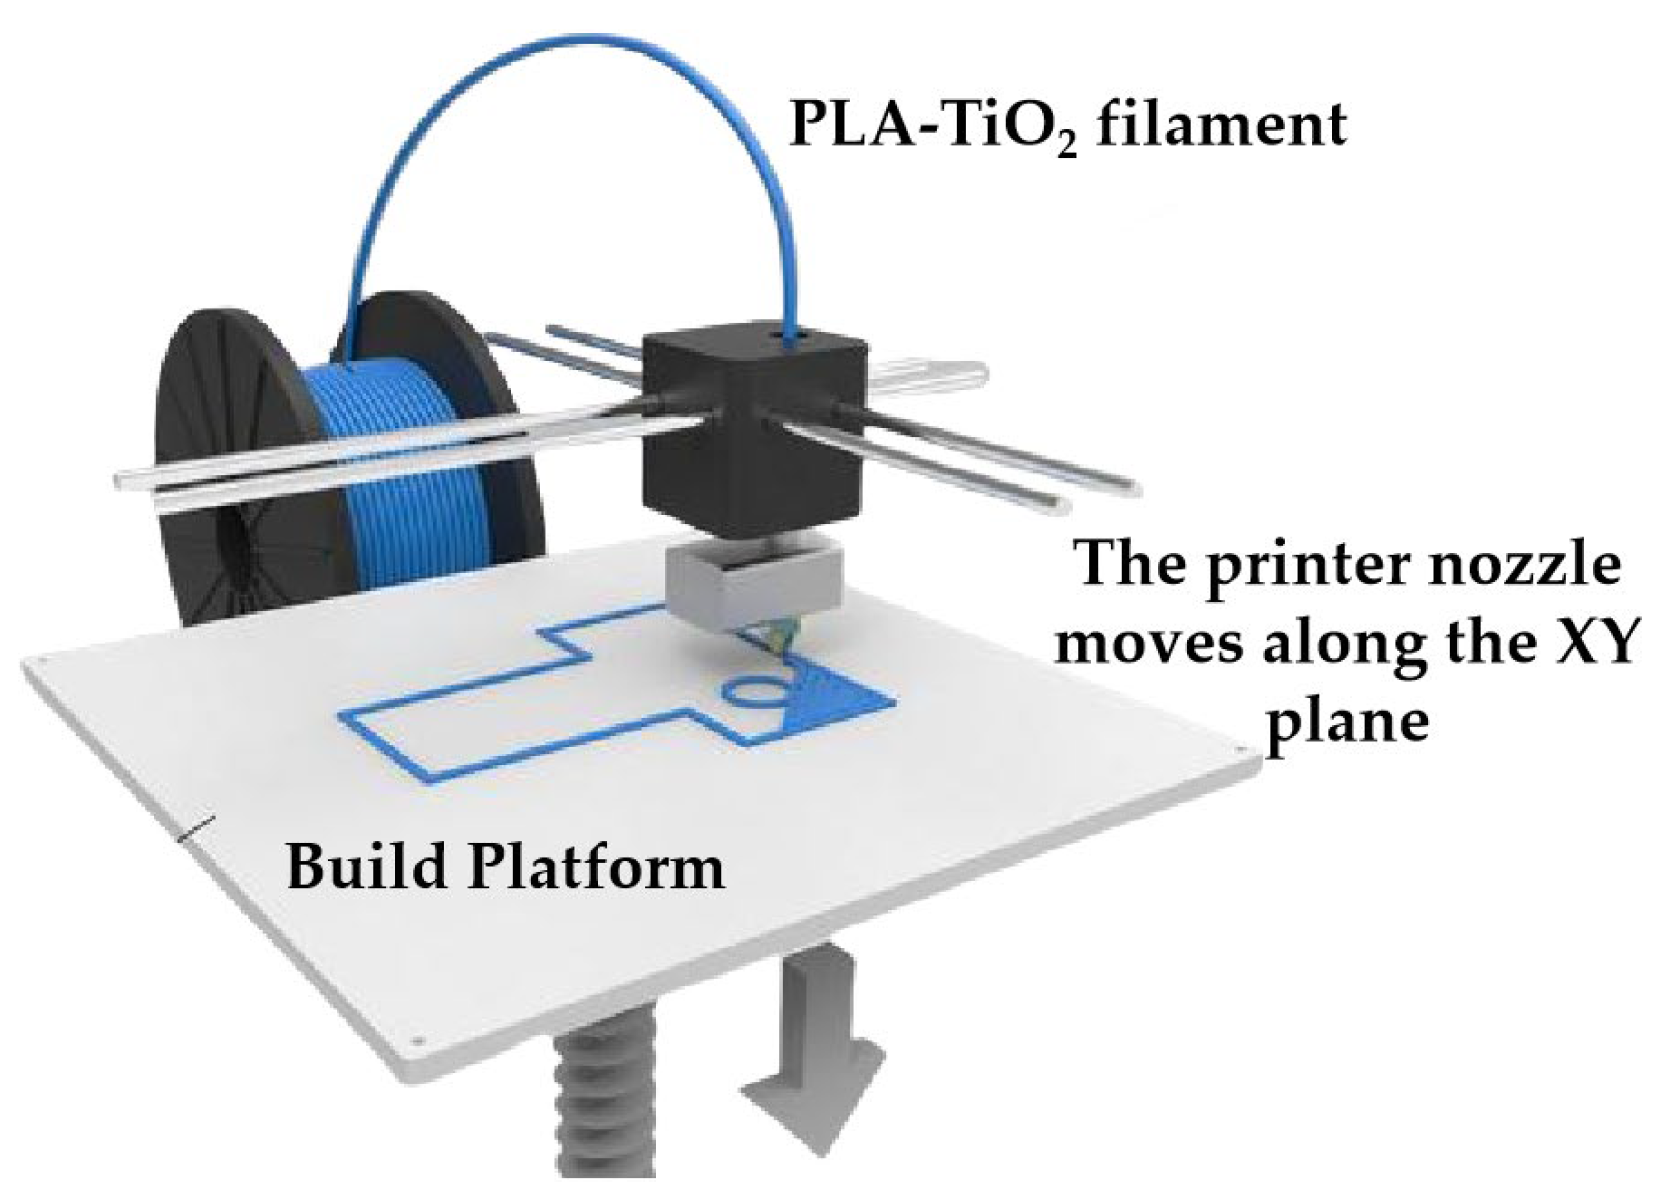
Figure 4.
TPMS-PCR printing by TiO2/PLA melt deposition.
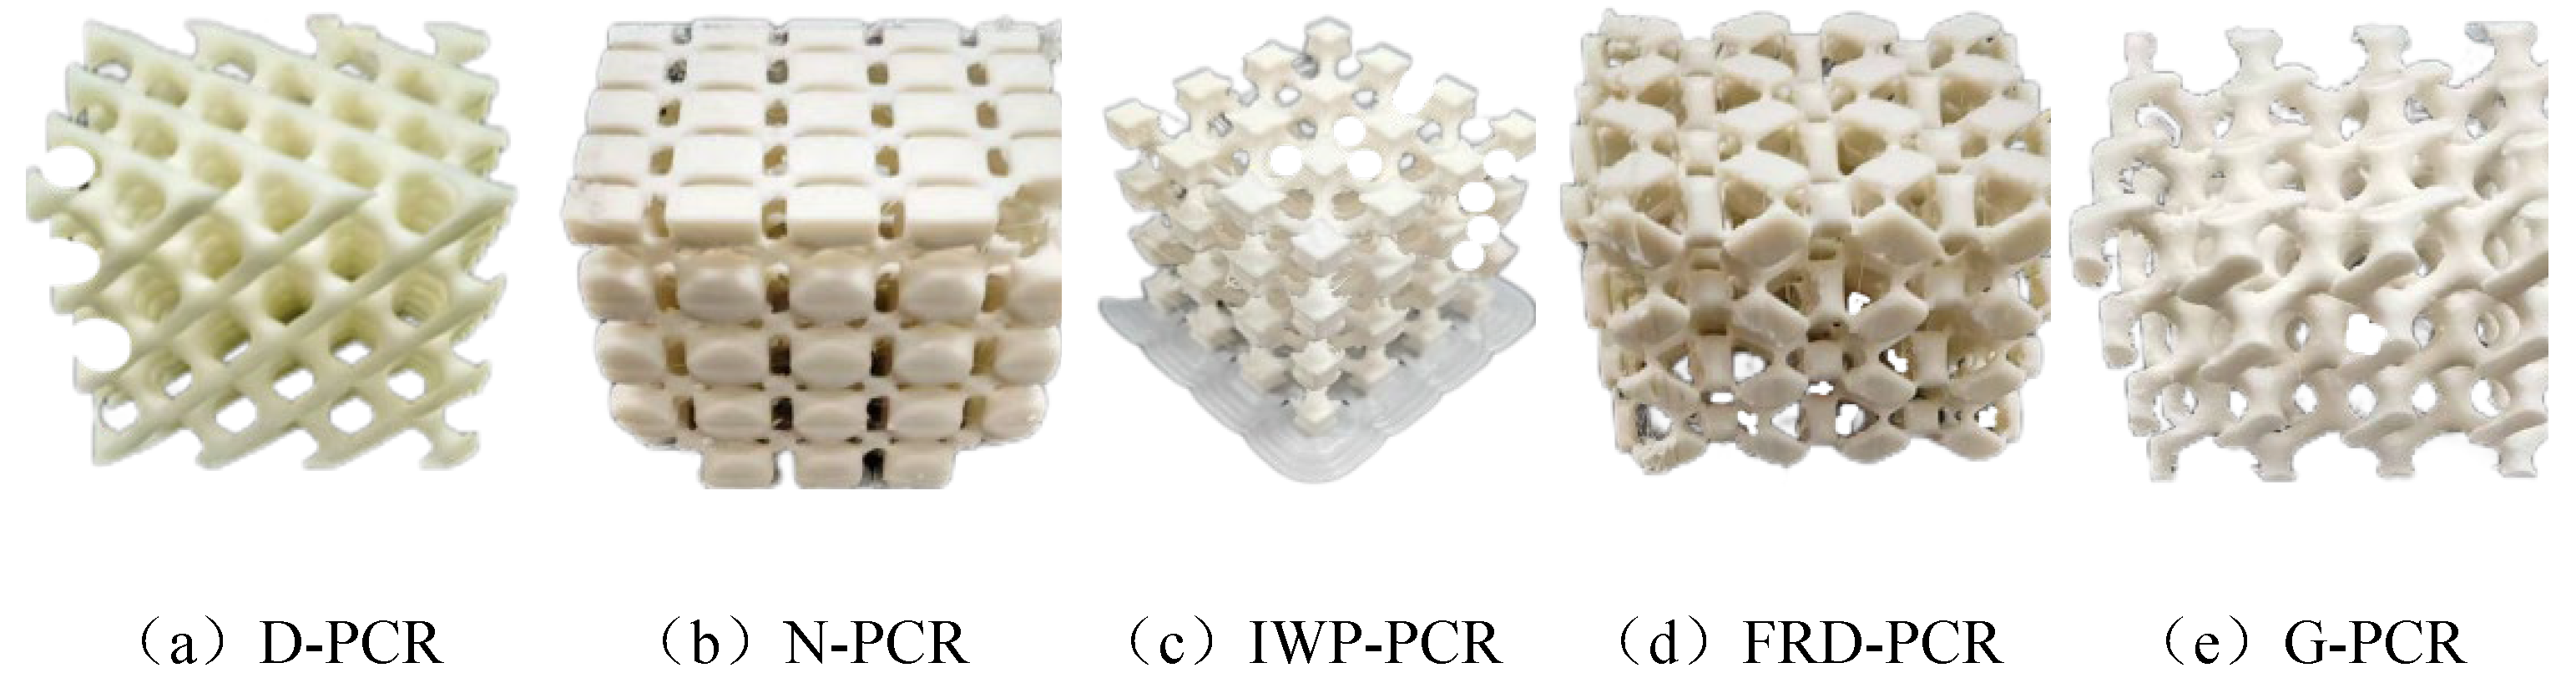
Figure 5.
XRD pattern of nanometer titanium dioxide.
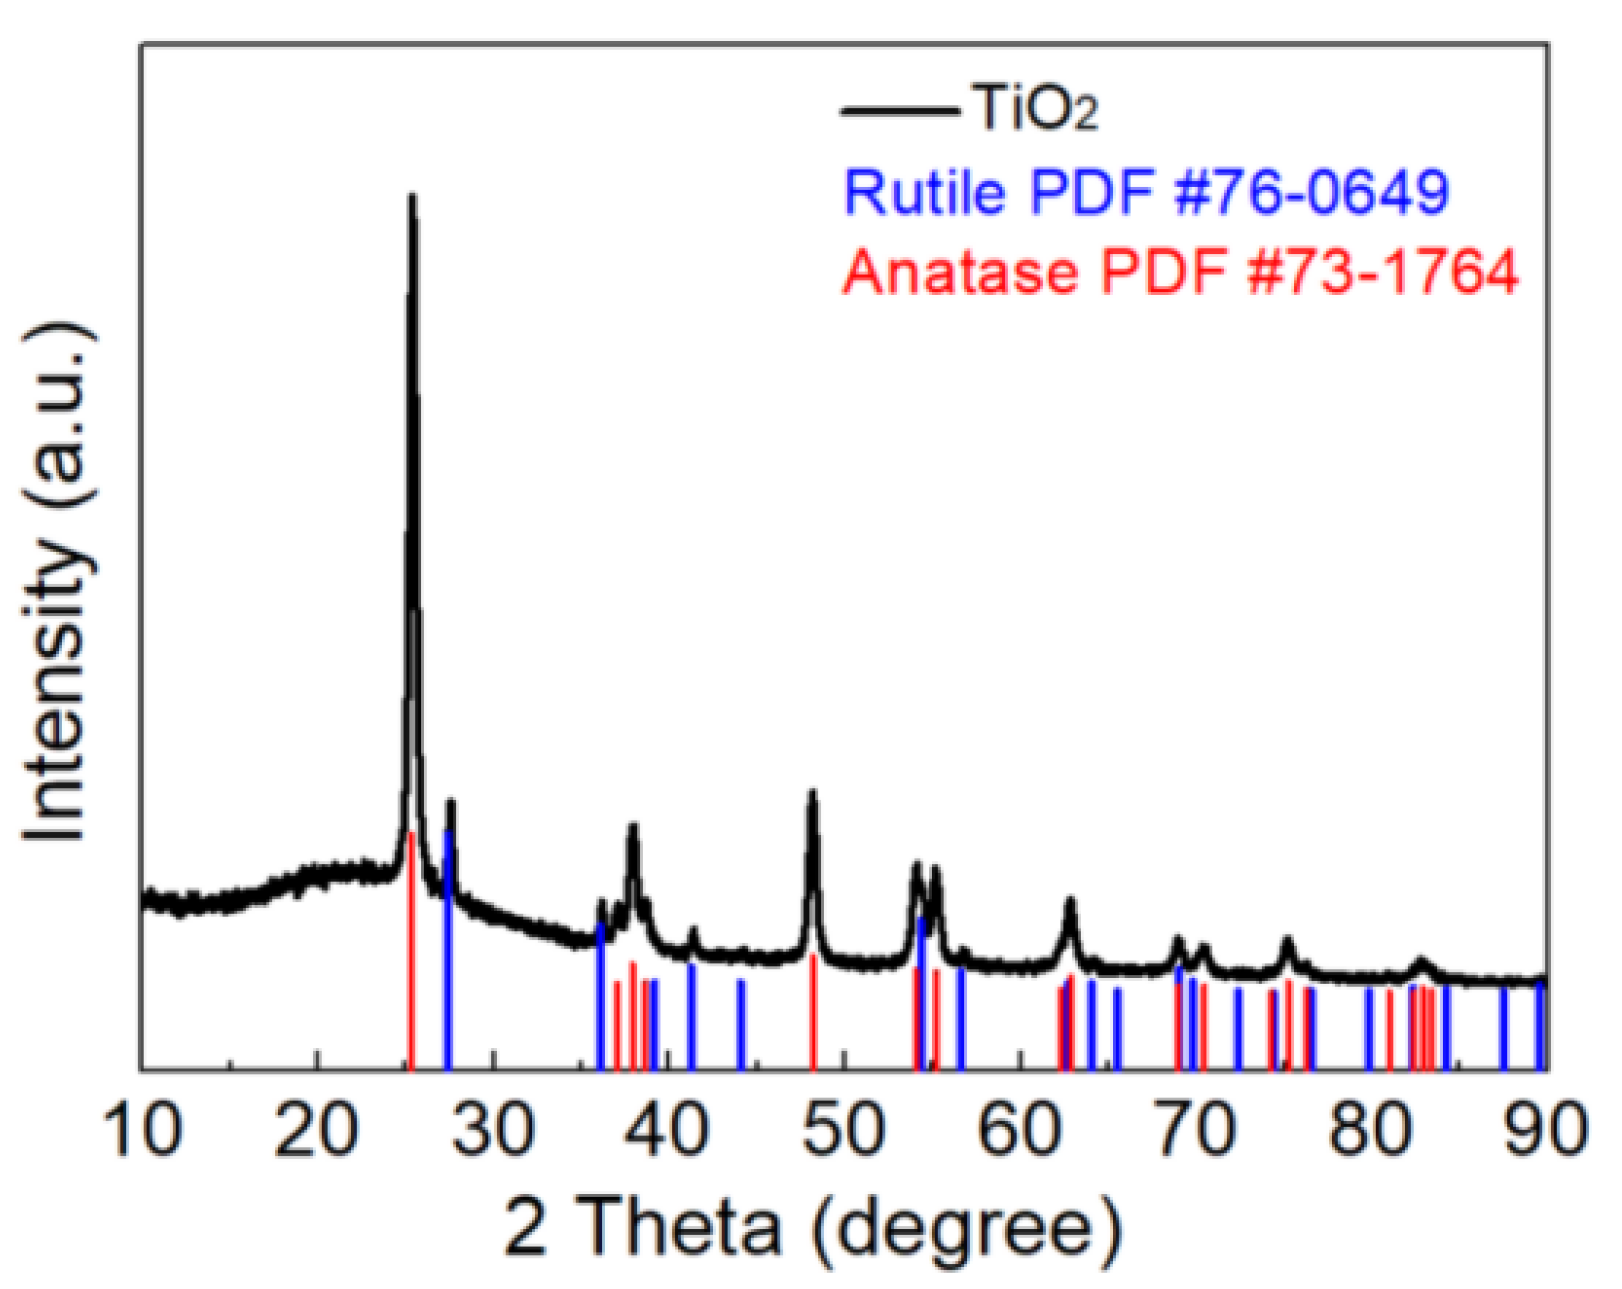
Figure 6.
SEM of N-PCR surface (a and b: fabricated using pure PLA; c and d:fabricated using 1.5wt%TiO2/PLA; e and f: fabricated using 2.5wt%TiO2/PLA).
Figure 6.
SEM of N-PCR surface (a and b: fabricated using pure PLA; c and d:fabricated using 1.5wt%TiO2/PLA; e and f: fabricated using 2.5wt%TiO2/PLA).
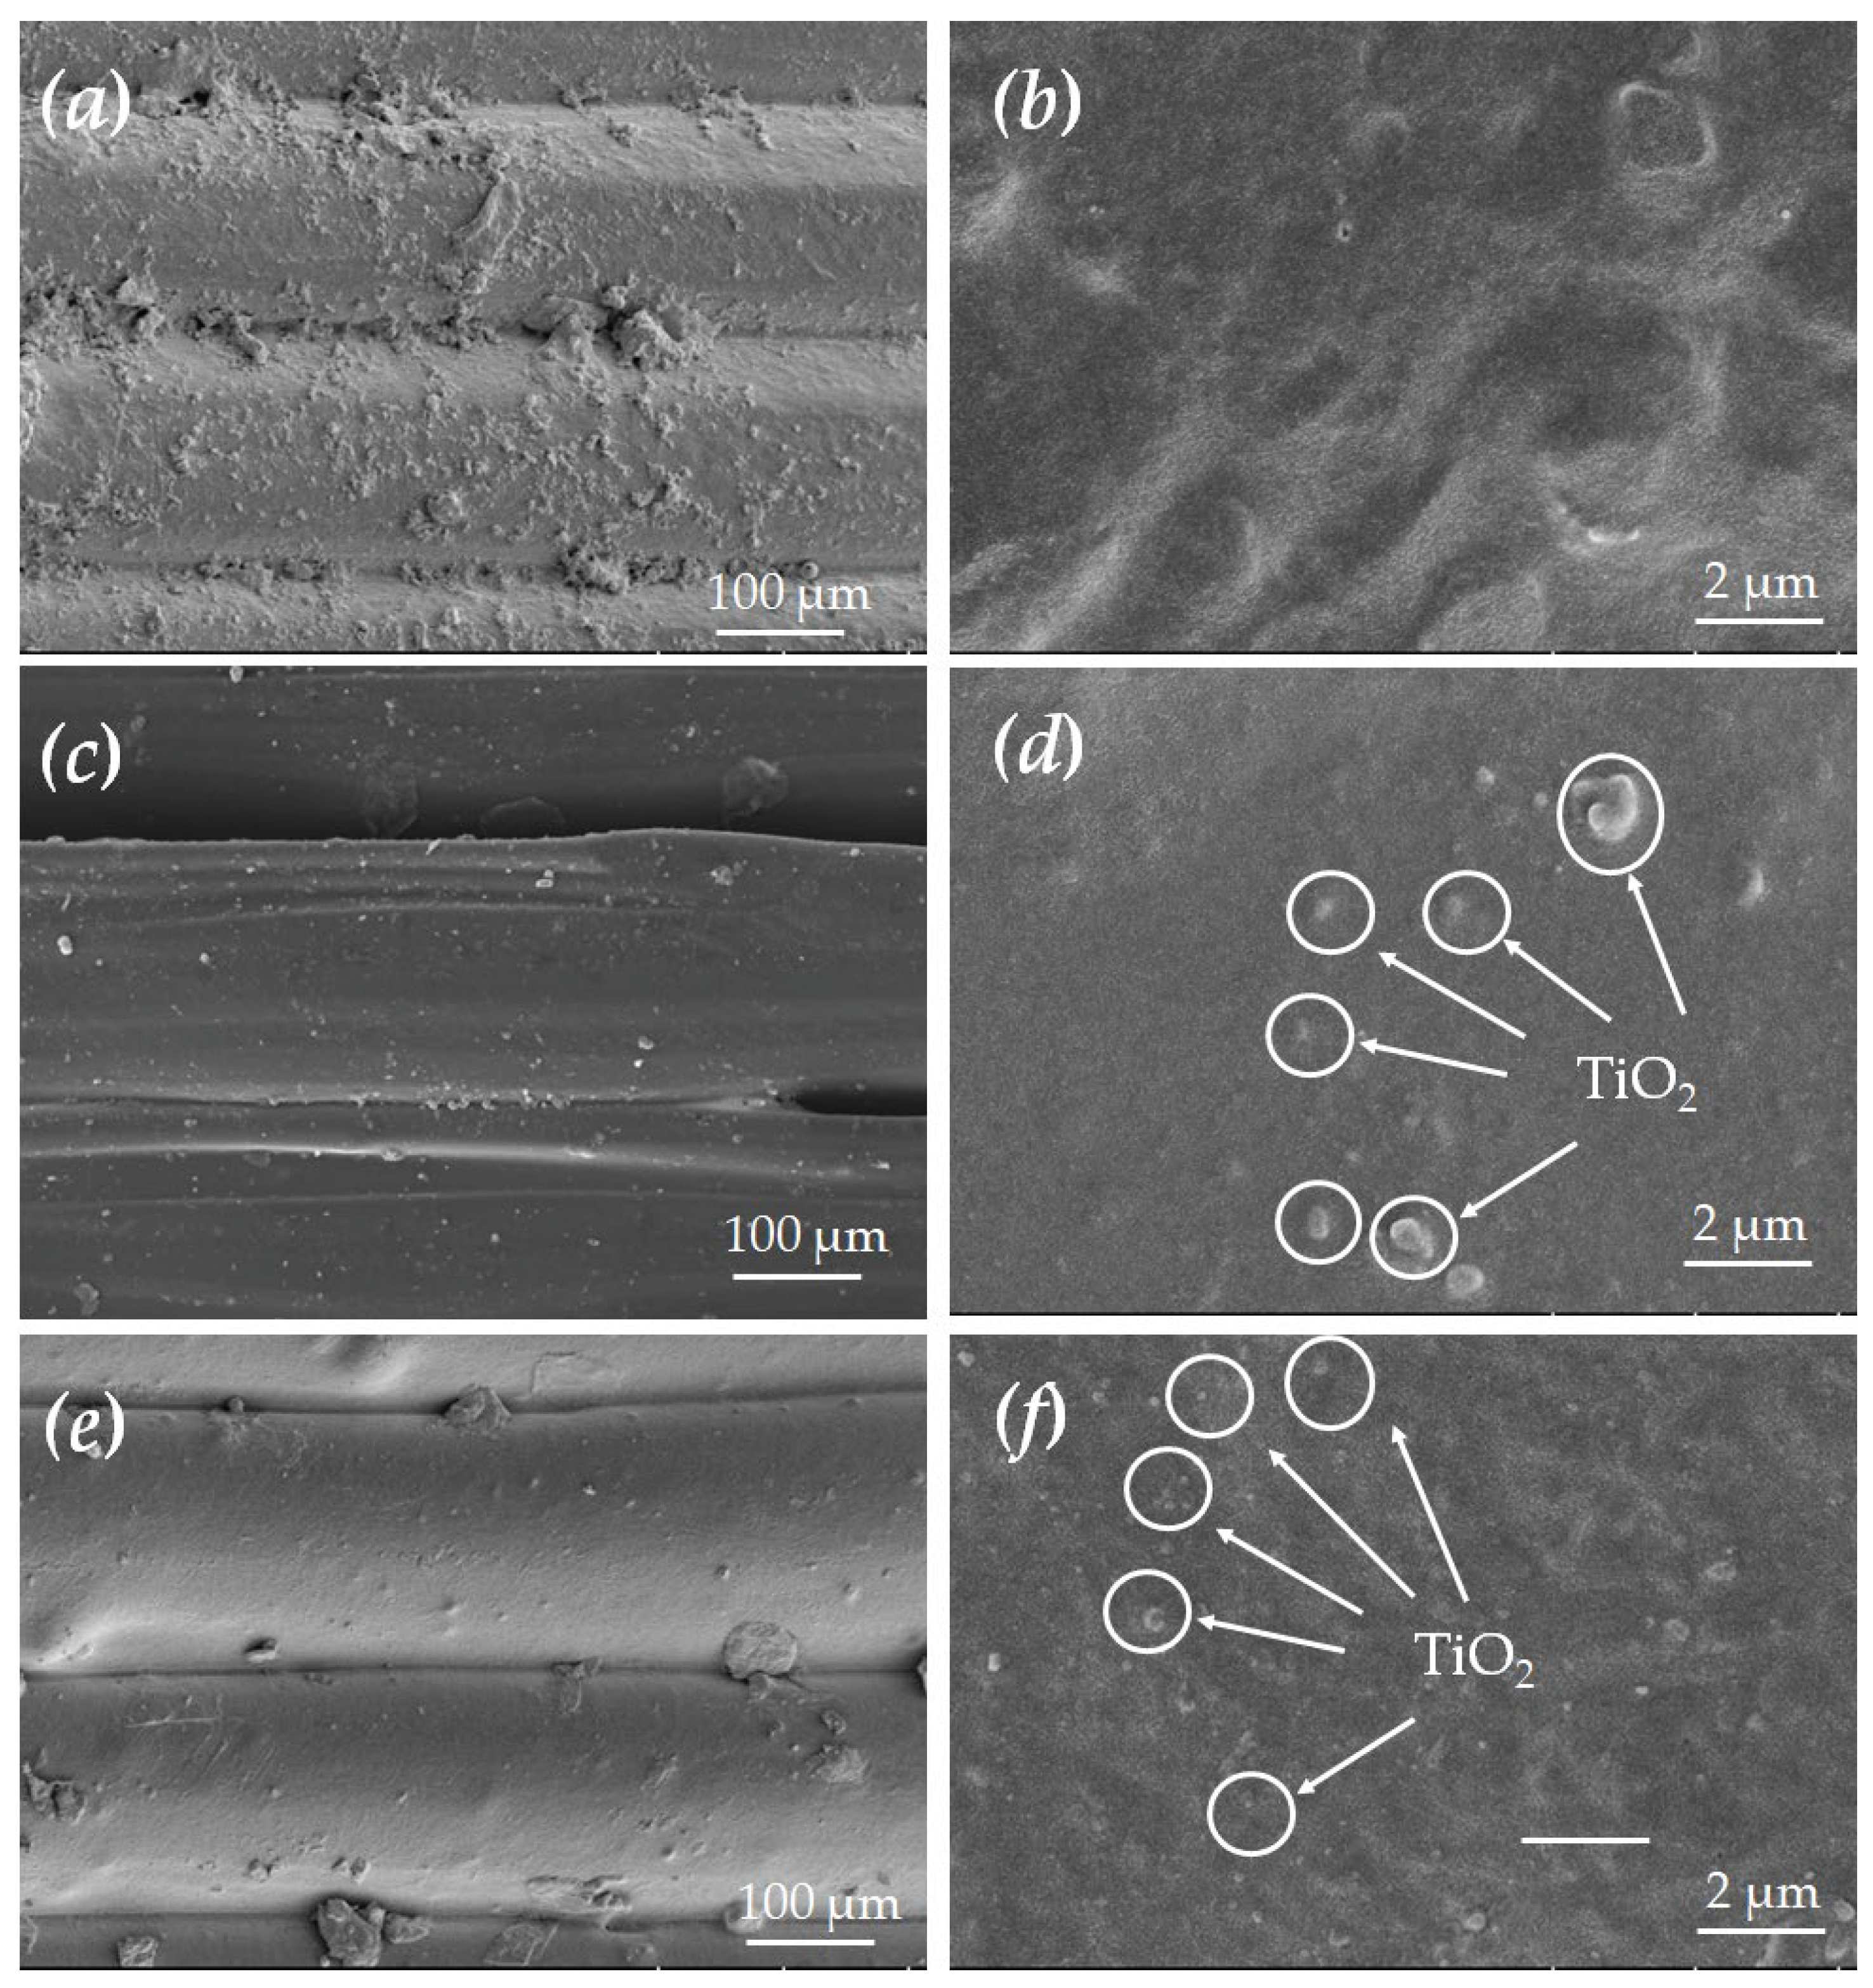
Figure 7.
EDS electron microscopy of N-PCR surface printed by 1.5wt% and 2.5wt%TiO2/PLA.
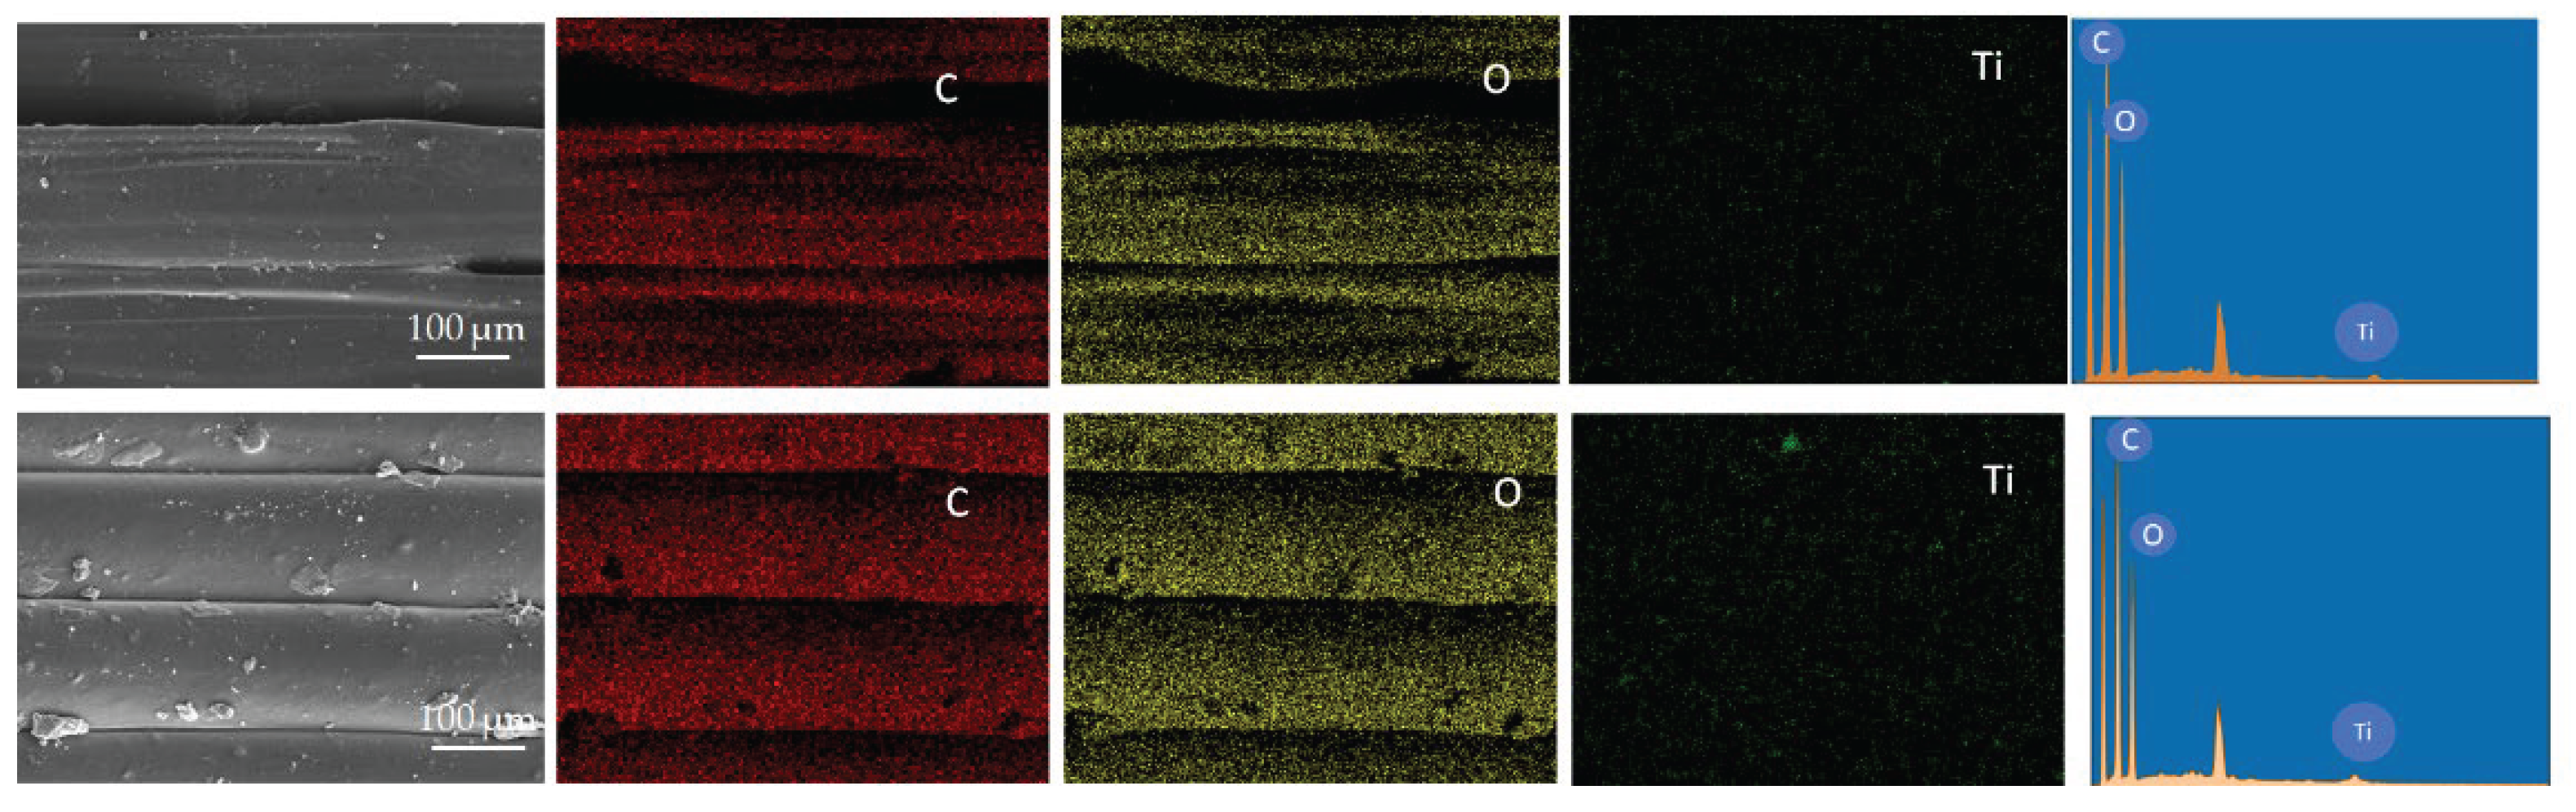
Figure 8.
Two flow field performance tests (a: rotational flow field; b: horizontal flow field).
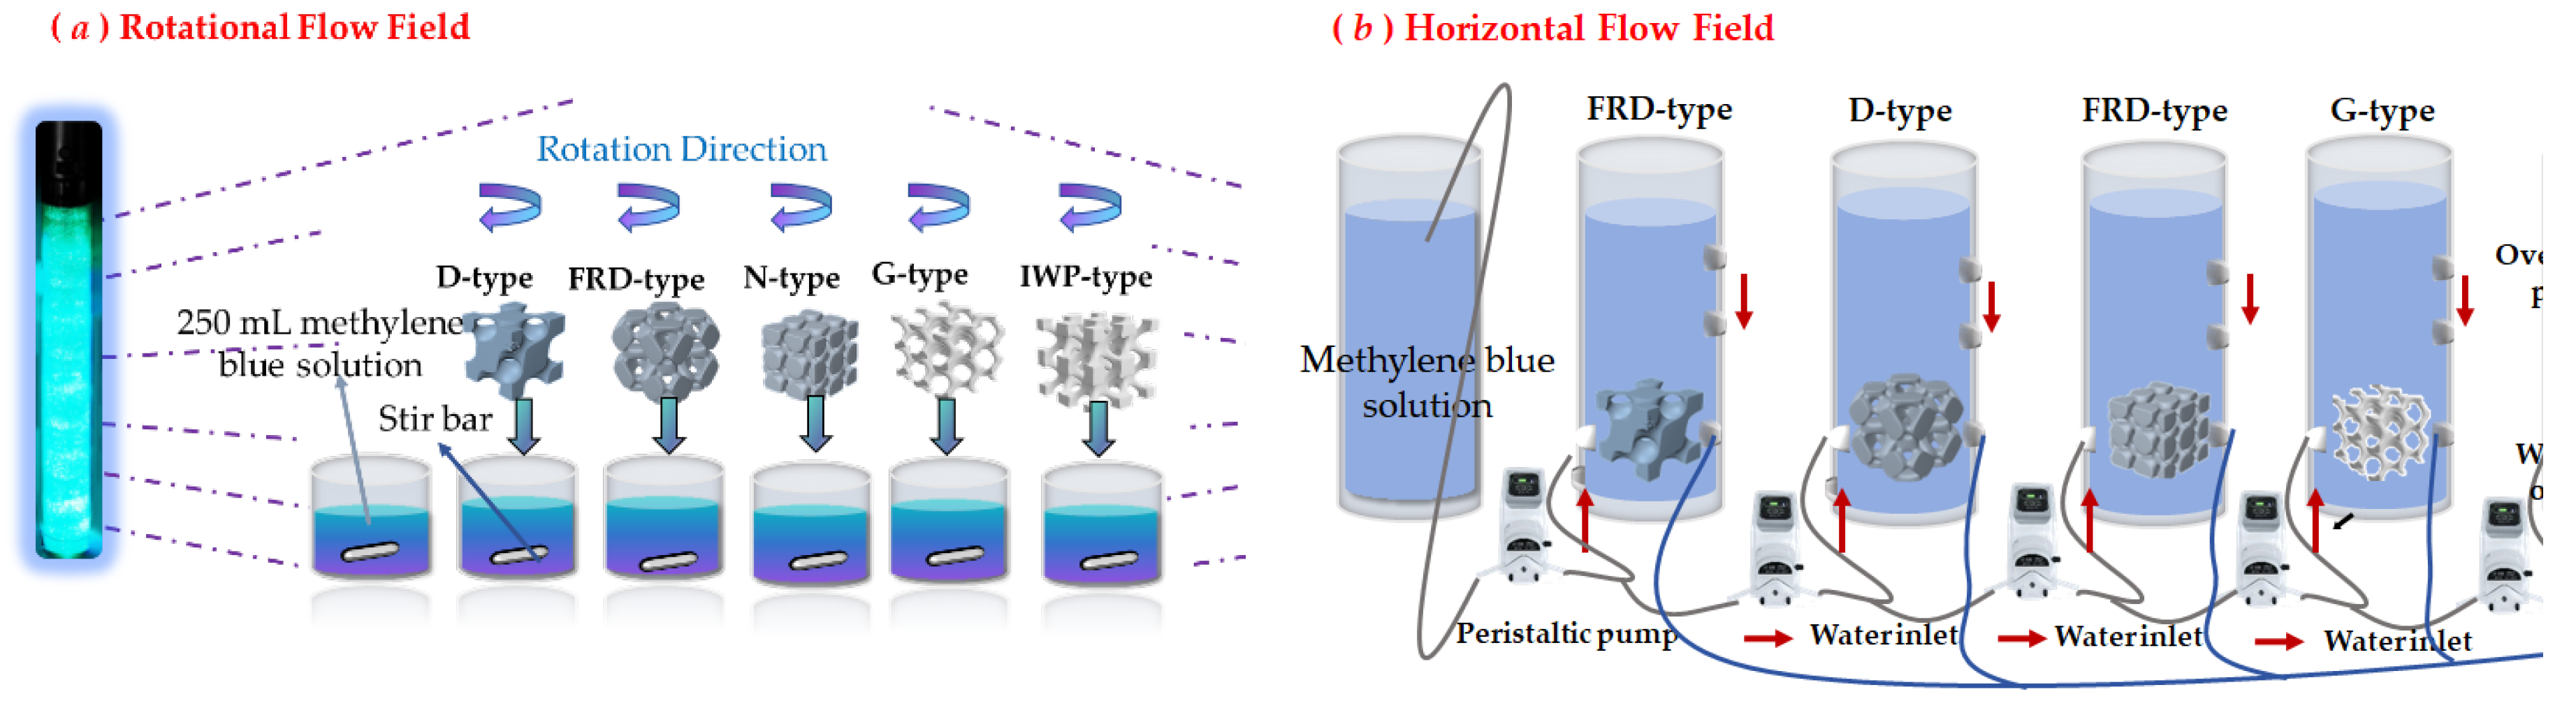
Figure 9.
Degration efficiency of TPMS PCRs printed by 1.5 wt% ( a: horizontal flow field; b: rotational flow field) and 2.5 wt% TiO2/PLA melt ( c: horizontal flow field; d: rotational flow field) .
Figure 9.
Degration efficiency of TPMS PCRs printed by 1.5 wt% ( a: horizontal flow field; b: rotational flow field) and 2.5 wt% TiO2/PLA melt ( c: horizontal flow field; d: rotational flow field) .
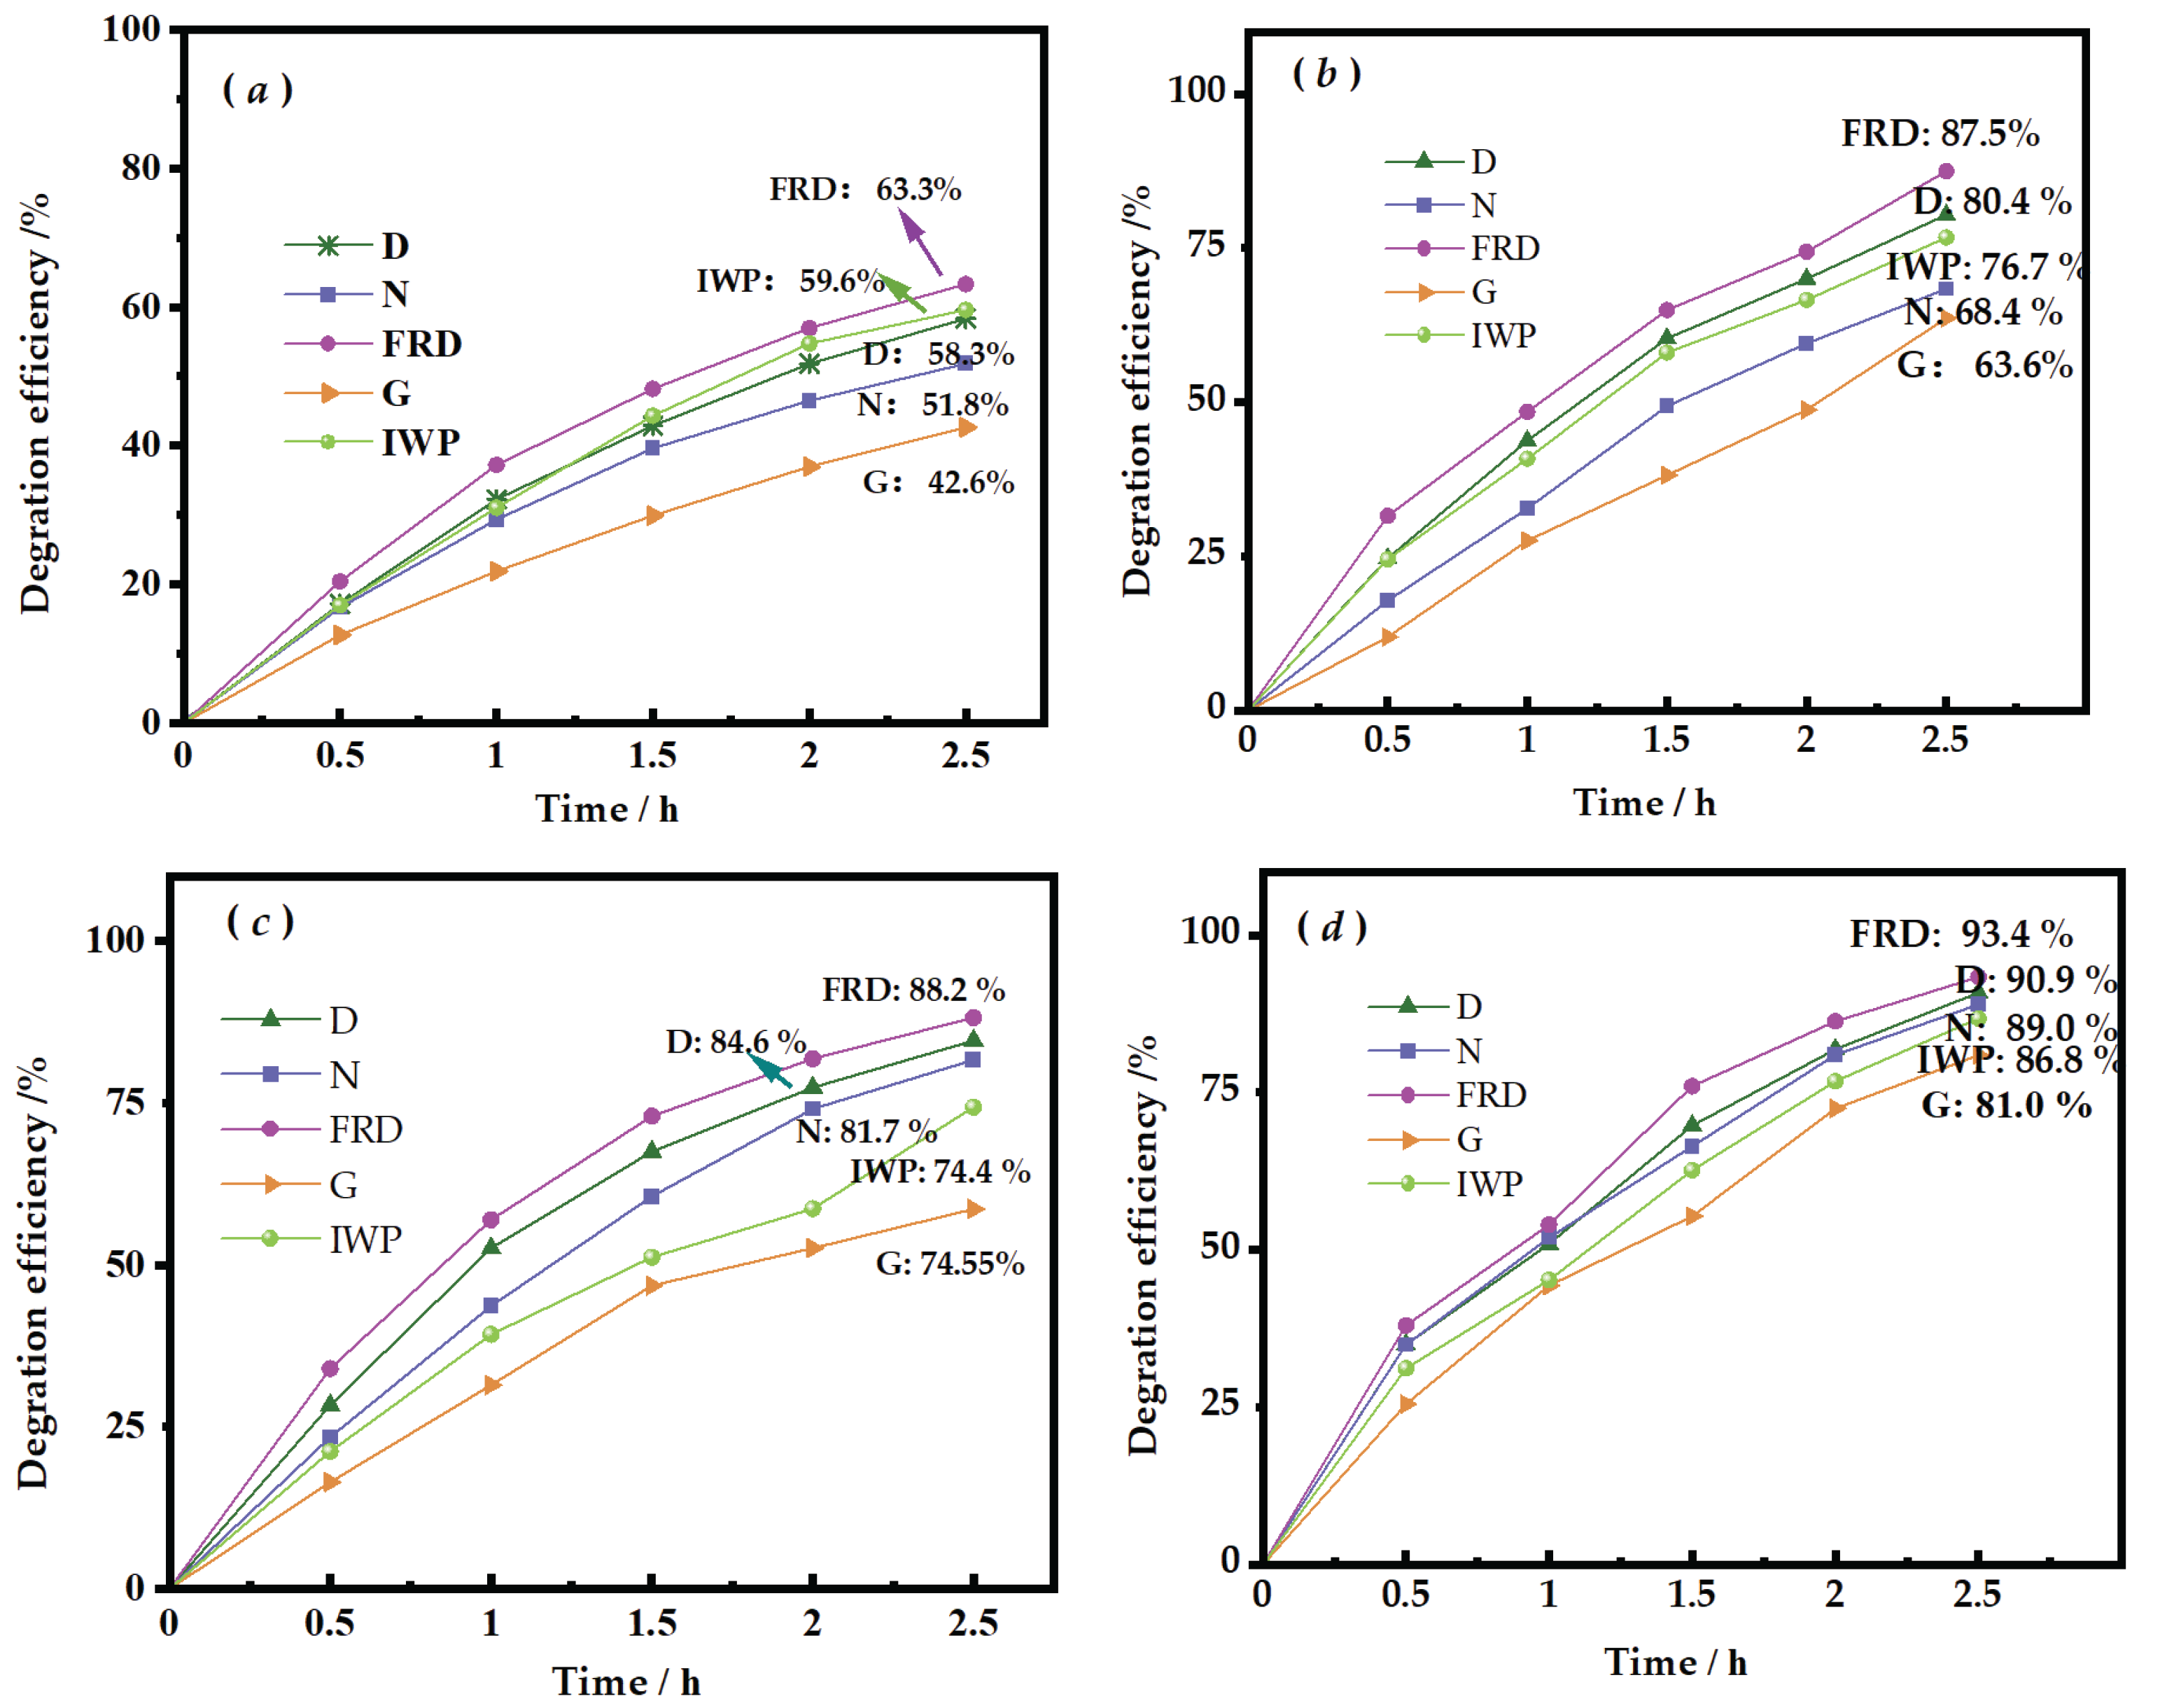
Table 1.
Main parameters of twin-screw extruder.
| Feed Port Speed (rad/min) |
Heating Zone Temperature Control (℃) | Discharge Port Temperature Control (℃) | ||||
|---|---|---|---|---|---|---|
| (Pellet) Feed Port Speed |
(Powder) Feed Port Speed | Zone 1 | Zone 2 | Zone 3 | Discharge Zone 1 |
Discharge Zone 2 |
| 10 | 8 | 175 | 185 | 190 | 180 | 175 |
Table 2.
Selected TPMS parameters and corresponding main structural parameters (4 cm ×4 cm× 4 cm).
| TPMS | Parameter C | Volume ( cm3 ) |
Surface area ( cm2 ) |
Porosity ( % ) |
Specific surface area ( cm2/cm3 ) |
|---|---|---|---|---|---|
| FRD | 0.5 | 20.2806 | 252.8271 | 66.20% | 12.47 |
| 0.3 | 28.1025 | 262.088 | 53.16% | 9.33 | |
| N | 0.5 | 28.0057 | 276.1458 | 78.02% | 14.17 |
| D | 0.5 | 13.1894 | 186.8994 | 53.32% | 9.86 |
| G | 1.2 | 6.265 | 112.3928 | 89.56% | 17.94 |
| IWP | 2.0 | 14.9278 | 172.6605 | 75.12% | 11.57 |
Table 3.
Contact Angle test data.
| Sample | Left contact angle/° | Right contact angle/° |
|---|---|---|
| Pure PLA | 80.771 | 80.771 |
| 1.5%wt.TiO2/PLA | 62.587 | 62.587 |
| 2.5%wt.TiO2/PLA | 62.301 | 62.301 |
Table 5.
The relationship of porosity, specific surface area, average pore size, and photocatalytic efficiency.
Table 5.
The relationship of porosity, specific surface area, average pore size, and photocatalytic efficiency.
| TPMS type |
Parameter C | Porosity ( % ) |
Specific surface area ( cm2/cm3 ) |
Average Pore Size ( mm ) | Photocatalytic Efficiency | Interpretation |
|---|---|---|---|---|---|---|
| FRD | 0.5 | 66.20% | 12.47 | 8.41 | 93.4 % | The largest pore size provides excellent mass transfer, enabling rapid diffusion of reactants/products. Although porosity and specific surface area are moderate, its performance is superior under rotational flow conditions due to enhanced convective transport. |
| N | 0.5 | 78.02% | 14.17 | 6.74 | 89.0 % | A balanced structure with relatively high porosity and specific surface area, combined with a moderate pore size, achieves an optimal trade-off among light harvesting, mass transfer, and active site availability |
| D | 0.5 | 53.32% | 9.86 | 5.1 | 90.9 % | Possesses the lowest porosity, specific surface area, and smallest pore size. Although typically associated with inferior performance, its high efficiency here may be attributed to unique pore connectivity and optimized light distribution under specific flow conditions (e.g., low velocity). |
| G | 1.2 | 89.56% | 17.94 | 7.89 | 81.0 % | Exhibits the highest porosity and specific surface area, which facilitate light transmission and catalyst loading. However, the relatively large pore size may lead to insufficient light utilization (e.g., partial light penetration without reaction) or non-uniform flow distribution, resulting in sub-optimal efficiency. |
| IWP | 2.0 | 75.12% | 11.57 | 7.83 | 86.8 % | Displays well-balanced properties. The large pore size enhances mass transfer, but the relatively low specific surface area limits the number of reactive sites. |
Disclaimer/Publisher’s Note: The statements, opinions and data contained in all publications are solely those of the individual author(s) and contributor(s) and not of MDPI and/or the editor(s). MDPI and/or the editor(s) disclaim responsibility for any injury to people or property resulting from any ideas, methods, instructions or products referred to in the content. |
© 2025 by the authors. Licensee MDPI, Basel, Switzerland. This article is an open access article distributed under the terms and conditions of the Creative Commons Attribution (CC BY) license (http://creativecommons.org/licenses/by/4.0/).
Copyright: This open access article is published under a Creative Commons CC BY 4.0 license, which permit the free download, distribution, and reuse, provided that the author and preprint are cited in any reuse.


