Submitted:
25 August 2025
Posted:
26 August 2025
You are already at the latest version
Abstract
Renewable energy policies are fundamental structural elements driving countries' energy transitions. The effectiveness of these policies plays a decisive role not only in achieving national goals but also in contributing to regional and global energy integration. This study compares the current renewable energy situation, future projections, and implemented incentive mechanisms, as well as their effectiveness in achieving policy objectives, in selected European Union (EU) countries and Turkey. Unlike studies in the literature, which typically focus on a limited number of countries and specific incentive models, this research expands both the country sample and incentive types. In particular, Turkey's renewable energy policies and incentive structure are systematically compared with EU countries from a temporal perspective, revealing their strengths and weaknesses. The findings provide a comprehensive assessment and strategic guidance for policymakers, academic researchers, and energy sector actors.
Keywords:
Renewable Energy Policy
; Incentives
; Energy Projection
; Energy Policy
1. Introduction
Traditional energy sources are losing their effectiveness globally due to their environmental damage, time-consuming depletion, and production challenges. In this context, countries and societies are turning their attention to renewable energy. Renewable resources, which can be considered new, are rapidly advancing and developing.
Renewable energy systems are relatively new to the world. Therefore, they need to be incentivized to increase their deployment and include communities in their installations. These incentives should be high enough to attract widespread attention at the initial stage and to adapt to market conditions over time. Therefore, countries need to approach global standards in renewable energy installations and provide the right and sufficient incentives to keep pace with this global renewable energy trend.
Research conducted in this context examines incentive systems. These studies: In a study that analyzes the policies implemented in EU countries and the compatibility of these policies, the compatibility of incentives has been examined [1], in another study, renewable incentive policies have been evaluated by comparing EU countries and US states [2], in another study, the effectiveness of FIT, quota system and green certificates in EU countries has been examined [3], in a study conducted on the example of Malaysia, a study has been conducted that matches Malaysia’s renewable energy progress and renewable energy status in the last 10 years [4], FIT, tax incentives and green certificates that can be applied to reduce carbon emissions have been examined in detail and their effectiveness has been examined [5], in a study that offers an analysis for successful penetration of policy makers and renewable energy investors, incentives are analyzed depending on the country and for different sectors [6], in another study, renewable energy incentives; FIT, green certificates, auctions and net metering systems have been analyzed in detail and their effectiveness has been examined. Latin American countries were analyzed in comparison with Brazil [7]. A study conducted in five selected EU countries analyzed the effectiveness of incentives and examined how much of an increase in incentives increased production [8]. A study conducted in EU countries analyzed the biogas policy area in depth and offered suggestions that could provide solutions to the complex structure of this area. These suggestions are presented in comparison with other countries [9]. Another review study presents an examination of sustainable energy policy for the promotion of renewable energy by introducing the development history of energy policy in five countries, namely the United States, Germany, the United Kingdom, Denmark, and China [10]. A study conducted in Iran aims to examine trends in energy demand, policies, and the development of renewable energies, and the causal relationship between renewable and non-renewable energies and economic growth using two methodologies [11]. A study conducted in Turkey examines the general status of renewable energy sources in different countries, and Turkey, and the incentive methods given for the production of electrical energy from these sources [12]. This study provides a comparative analysis of the current state of renewable energy in selected EU countries and Turkey, their future provisions and targets, the incentives and policies implemented to achieve these targets, and the impact of renewable policy implementation rates on national renewable energy success. The incentive methods employed are analyzed and explained, along with the ways they are implemented in these countries. This study examines the renewable energy status, incentives, and future provisions of selected countries and Turkey, and presents the findings for policymakers, academic researchers, and industry representatives. Unlike other studies, this study examines the main incentive models implemented in the EU region, using a broader selection of countries, presenting Turkey’s incentive and policy developments over time, and conducting a comparative analysis. Previous academic studies have focused on a narrower sample size of countries and incentive methods. While a single incentive method or a few are analyzed, this study broadens the scope of both countries and incentive methods. While other studies analyze different countries and regions, this study conducts a comparative analysis of Turkey and EU countries. Turkey’s low renewable energy level, despite its high renewable capacity and installed electricity capacity, was analyzed. Data obtained from an extensive literature review were analyzed comparatively for Turkey and EU countries.
2. EU Countries and Turkey Renewable Energy Status and Future Provision
The European Union is home to approximately 6% of the world’s population. It meets approximately 10% of global energy demand. The European Union’s population is expected to reach 425 million in 2050, with a GDP of $35.1 trillion, and the goal of achieving net zero by 2050. The goal is to eliminate fossil fuel dependency by 2050.
- A.
- Germany
Current Status: Germany’s installed capacity is approximately 235 GW by 2025. Wind energy accounts for approximately 34% of this capacity, solar energy 14%, and biomass and other renewable resources 8.4% [13].
By 2024, Germany will meet approximately 56% of its energy production from renewable sources.
Future Provision: Germany aims to generate 80% of its energy production from renewable sources. The deadline for this target is 2030. Furthermore, the goal of climate neutrality is aimed at achieving the 2045 vision. Germany’s ultimate renewable energy vision is 2035. This vision aims to meet all of its energy demand from renewable sources.
- B.
- France
Current Status: FranCE has an installed capacity of 136 GW by 2024. 72% of this will be nuclear energy, 10% hydroelectricity, 8% wind energy, 4% solar energy, and 6% fossil fuels (IEA).
Future Provision: France has adopted the goal of becoming carbon-neutral by 2050. It aims for renewable energy to account for 40% of its total installed capacity by 2030. It plans to increase its offshore wind energy potential to 40 GW. France is making all these plans to meet the EU Green Deal standards.
- C.
- Belgium
CurrentStatüs: The total installed capacity in Belgium is 22 GW. 35% of this is natural gas and fossil fuels, 22% wind energy, 30% solar energy, 10% nuclear energy, and 3% other energy sources [17]. Future Provision: Belgium’s future provision includes visions for 2030 and 2050. The 2030 targets include reducing gas emissions by 55%, increasing renewable energy to 42%, increasing wind capacity to 6 GW, and increasing solar power to 10 GW. The 2050 targets include achieving carbon neutrality and generating all energy from renewable sources, increasing offshore wind power to 11 GW, increasing the use of green hydrogen, and transforming North Sea islands into energy islands.
- D.
- Netherlands
Current Status: The Netherlands has a total installed capacity of approximately 45 GW. 40% of this comes from natural gas and fossil fuels, 21% from wind energy, 33% from solar energy, and 5% from biomass energy.
Future Provision: The Netherlands has two visions for renewable energy: 2030 and 2050. The 2030 goals include reducing carbon emissions by 55%, increasing the share of renewable energy to 70%, increasing wind energy to 21 GW, and increasing solar energy to 30 GW by activating rooftop projects [18]. The 2050 goals include becoming a carbon-neutral country, establishing large-scale energy storage systems, and increasing energy efficiency by increasing smart grids.
- E.
- Austria
Current Situation: Austria’s installed capacity is approximately 28 GW. This consists of 53% hydroelectric power, 14% wind power, 11% solar power, 7% biomass energy, and 15% natural gas and fossil fuels.
Future Provision: Austria has adopted the 2030 and 2050 future provision targets. The 2030 targets include utilizing 100% renewable energy sources, increasing wind power to 10 GW, solar power to 14 GW, and installing energy storage systems. The 2050 targets include neutralizing carbon emissions, increasing green hydrogen production, and aligning with the EU Green Deal [19].
- F.
- Swedish
Current Situation: Sweden’s installed capacity is approximately 47 GW. This includes 36% hydroelectric power, 18% nuclear power, 32% wind power, 3% solar power, and 11% biomass and other energy sources.
Future Provision: Sweden has visions for renewable energy for 2030 and 2045. The 2030 vision includes increasing the renewable share to 90%, reaching 25 GW in wind power, increasing solar power to 5 GW, converting all vehicles to electric vehicles, developing energy storage systems, and increasing green hydrogen production. 2045 targets include transitioning to a 100% renewable, carbon-neutral energy system, increasing wind power capacity to over 50 GW, providing all industrial and residential heating with renewable energy, and increasing energy trade with Northern European countries.
- G.
- Norway
Current status: Norway’s total installed capacity is approximately 43 GW. This comprises 83% hydroelectric power, 11% wind power, 0.5% solar power, 2% biomass and other energy sources, and 4% natural gas and fossil fuels [21].
Future Provision: Norway has renewable energy visions for 2030 and 2050. The 2030 vision targets include transitioning to fully renewable energy, reaching 15 GW of wind energy, increasing the use of renewables in transportation, developing energy trade with Nordic countries, and increasing the use of electric vehicles to 100%. The 2050 vision aims to transition to a carbon-neutral energy system, increasing the North Sea energy potential to 50 GW, increasing green hydrogen production, increasing the capacity of energy storage systems, and increasing renewable energy efficiency in the industry, transportation, and residential sectors [21].
- H.
- Finland
Current status: Finland’s total installed capacity is 18 GW. Of this, 26% is nuclear energy, 29% is wind energy, 19% is hydroelectric energy, 19% is biomass and other energy sources, and 7% is natural gas and fossil fuels.
Future Provision: Finland has visions for 2035 and 2050. The 2035 vision includes becoming a carbon-neutral country, reaching 10 GW of wind energy, developing sustainable forest management for biomass energy, increasing solar energy efficiency in cities and industry, and developing green hydrogen production [22,23]. The 2050 vision includes the development of green hydrogen, increasing smart grid integration, increasing energy exchanges with Northern Europe, and zeroing out carbon emissions by switching to a circular energy model.
- I.
- Spain
Current Status: Spain’s installed capacity stands at approximately 118 GW. Approximately 25% of this comes from solar energy, 25% from wind energy, 17.23% from hydroelectricity, 6.12% from nuclear energy, and 25.84% from other sources. Future Provision: Spain has a 2030 vision as its future goals. Within this scope, Spain aims to increase the share of renewable resources in its total energy resources to 81%. Green hydrogen production is also among Spain’s main agenda items. The aim is to increase its electrolyzer capacity to 11 GW by 2030.
- J.
- Portugal
Current Status: Portugal has a total installed capacity of 20.7 GW. Approximately 35% of this comes from hydroelectric power, 27.1% from wind power, 13.1% from solar power, and 24.5% from other sources.
Future Provision: Portugal has a 2030 vision as its future goal. This vision aims to meet 85% of its electricity consumption from renewable sources. It also aims to increase its installed solar power capacity to 20.4 GW, increase its green hydrogen capacity to 6 GW, and increase its installed wind power capacity to 10.4 GW.
- K.
- Italy
Current status: Italy’s installed capacity is known to be approximately 120 GW. This consists of 42% natural gas, 18% hydroelectricity, 7% wind energy, 9% solar energy, 2% biomass energy, 9% coal energy, and 13% other sources.
Future Provision: Italy has a 2030 vision for renewable energy. Within the scope of this vision, it aims to provide 65% of its electricity consumption from renewable sources by 2030. It aims to increase solar capacity to 79 GW and wind energy to 28.1 GW by 2030 [26,28].
- L.
- Greece
Current status: Greece has approximately 34.7 GW of installed electricity capacity. Approximately 23.5% of this comes from lignite, 28% from natural gas, 19.1% from hydroelectricity, and 29.3% from renewable energy sources.
Future Provision: Greece has a 2030 renewable energy vision. This vision aims to increase total renewable energy capacity to 28 GW by 2030, energy storage capacity to 8 GW, and wind energy capacity to 9.2 GW [30].
- M.
- Poland
Current Status: Poland has approximately 65 GW of installed electrical capacity. Of this, 70% is coal energy, 16.9% is renewable energy, and 13.1% is natural gas.
Future Provision: Poland has a 2030 renewable energy vision. Within the scope of this vision, it is planned to increase its renewable energy capacity to 22 GW by 2030. Solar energy is planned to reach approximately 14 GW, and wind energy to 7 GW [31].
- N.
- Czech Republic
Current Status: The Czech Republic has an installed capacity of approximately 22 GW. This consists of 50% coal, 35% nuclear energy, and 15% renewable energy sources.
Future Provision: The Czech Republic has a 2033 energy vision. Within the scope of this vision, it plans to phase out coal use by 2033. It is planned to replace coal with nuclear and renewable energy sources [32].
- O.
- Romania and Hungary
Current Status and Future Provisions: Romania has an installed capacity of approximately 24 GW. This capacity consists of 30% coal power plants, 25% natural gas, 20% hydroelectric power plants, 15% wind energy, and 5% solar energy. Romania has a 2030 vision, which plans to add 6.9 MW of renewable capacity by 2030. Hungary has an installed electricity capacity of approximately 8.5 GW. This capacity consists of 50% nuclear power sources, 20% natural gas sources, 15% coal sources, and 15% renewable energy sources. Hungary has a 2030 renewable energy vision. Within the scope of this vision, the company aims to generate electricity from green and carbon-neutral sources by 2030.
- P.
- Turkey
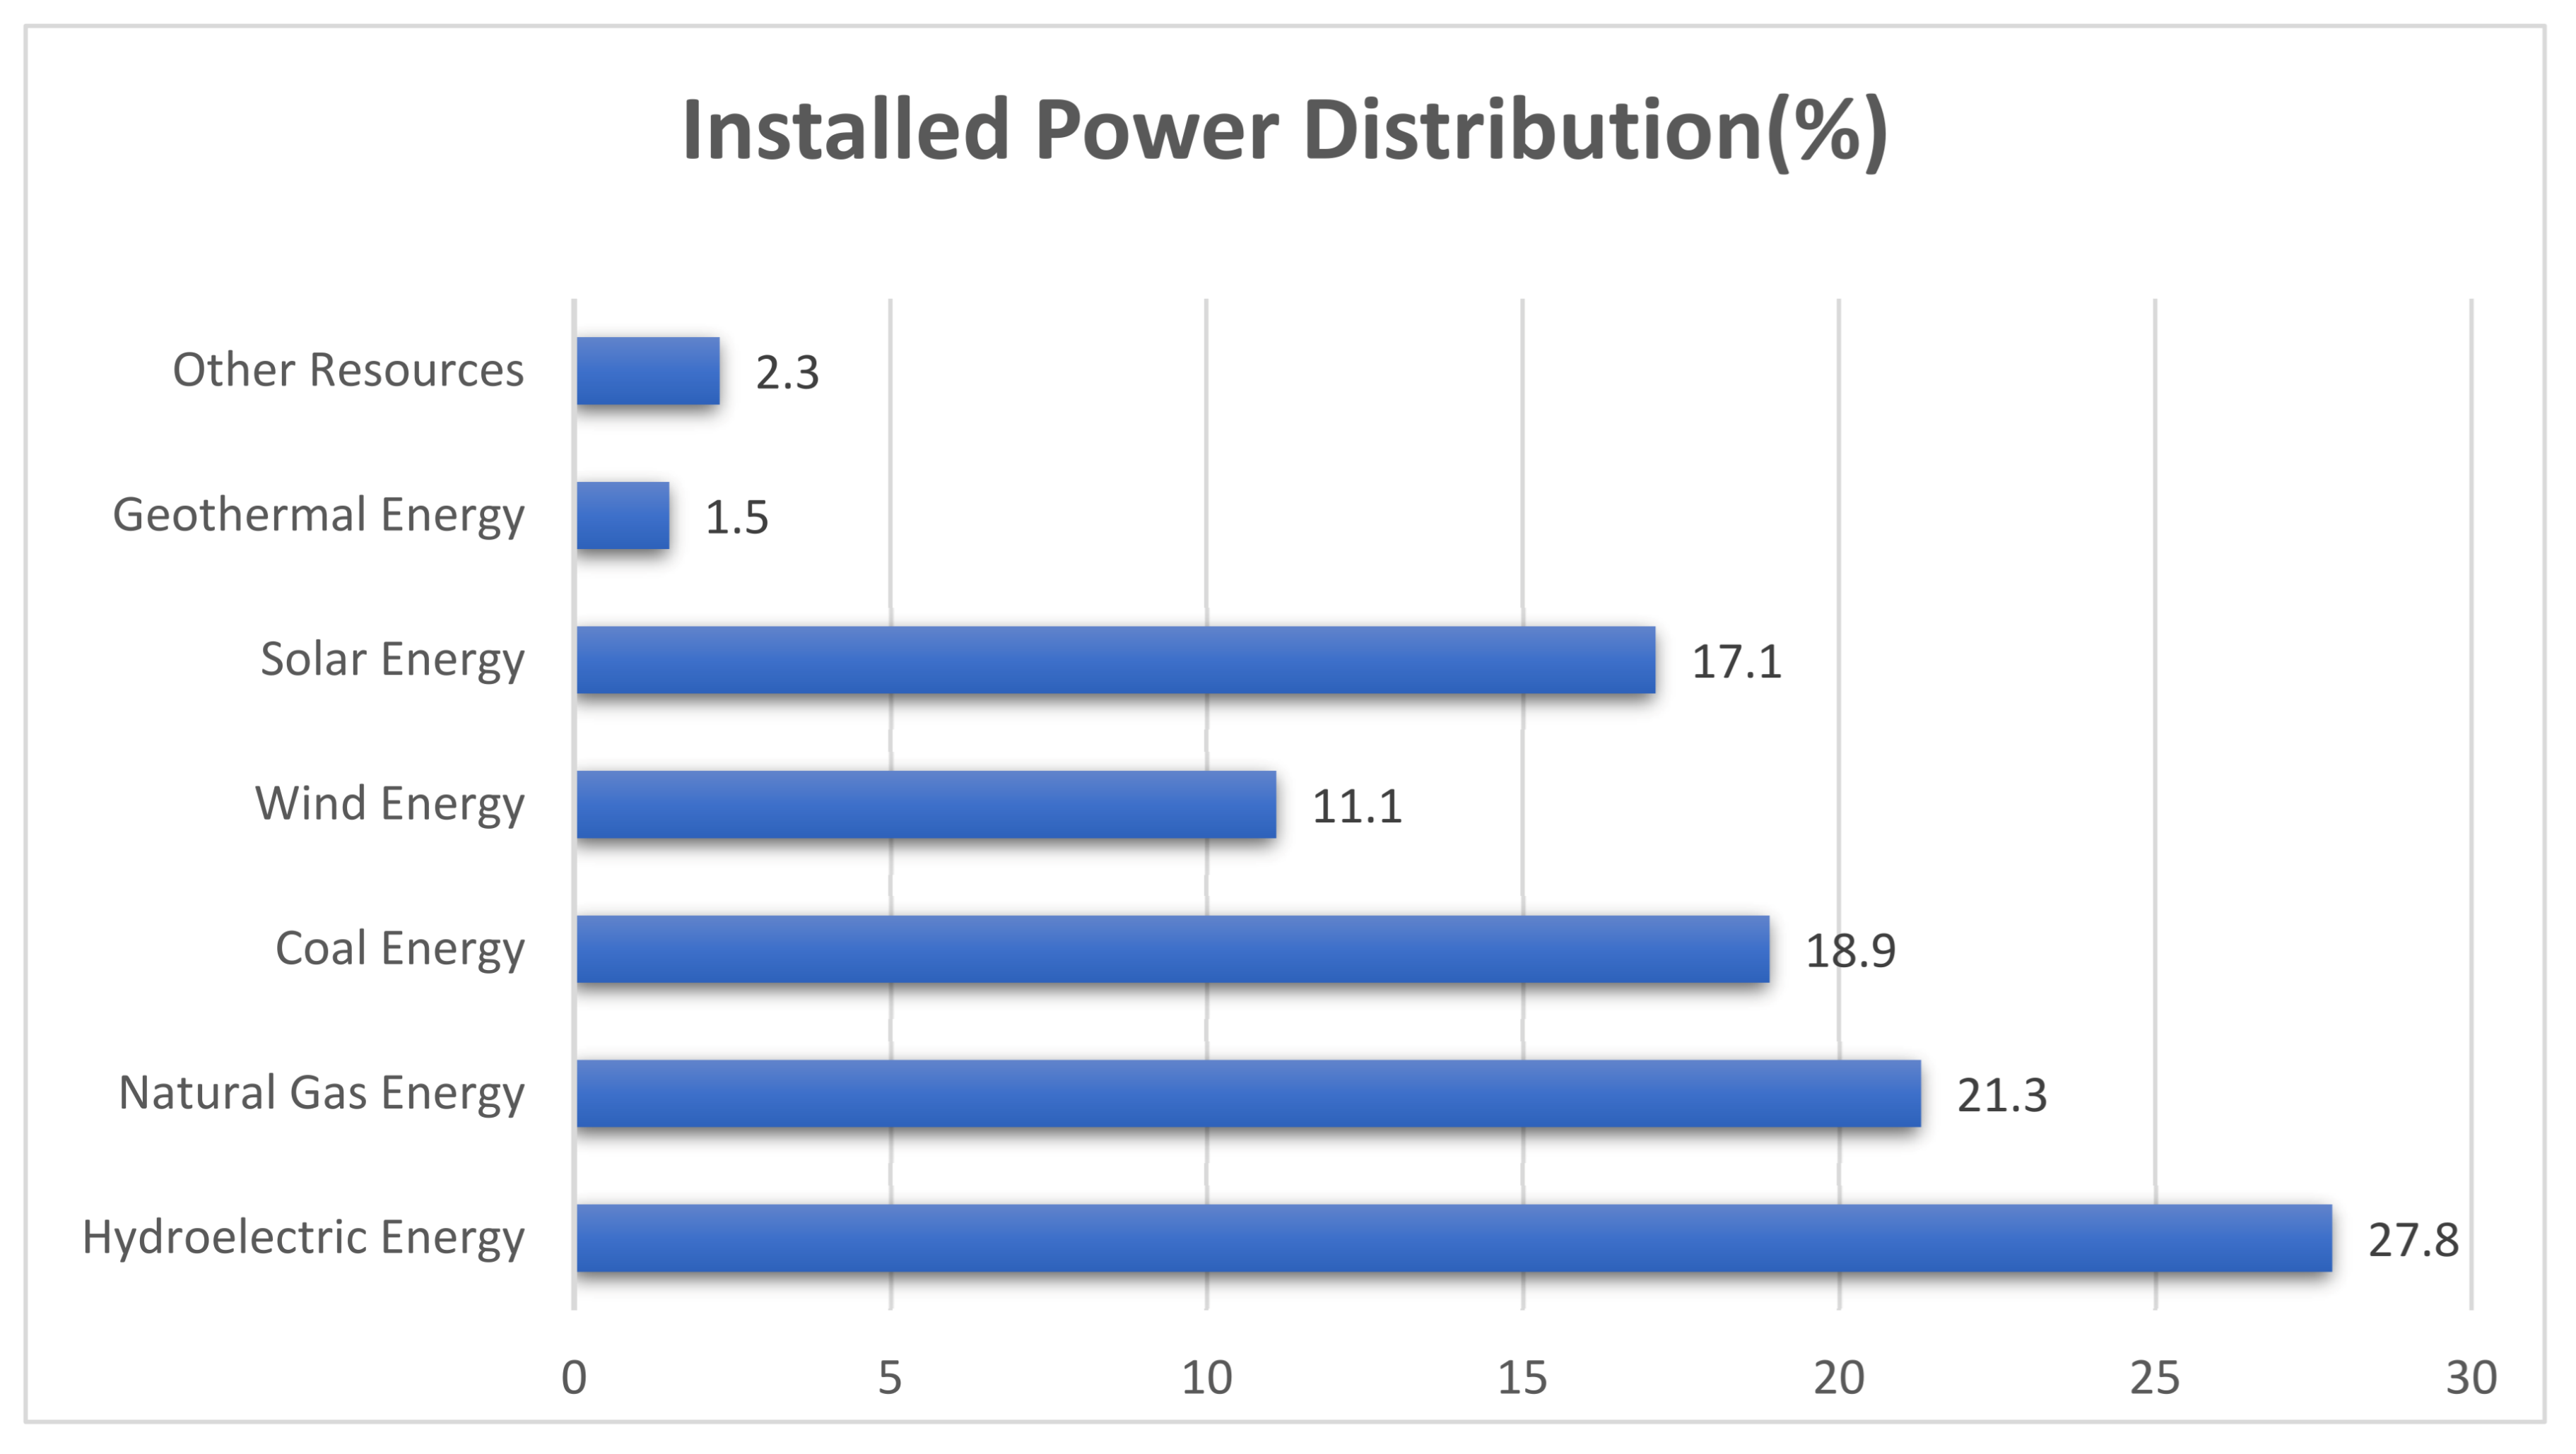
Turkey’s installed capacity is approximately 116 GW, according to December 2024 data. This represents 27.8% hydroelectric power, 21.3% natural gas, 18.9% coal, 11.1% wind, 17.1% solar, 1.5% geothermal, and 2.3% other sources. In 2024, an installed capacity increase of 6.5 GW was achieved, 99% of which came from renewable energy sources.
Future Provision: Turkey has visions for 2023, 2030, and 2053. The 2030 vision aims to increase solar energy capacity to 30 GW, wind energy capacity to 20 GW, geothermal energy capacity to 5 GW, and hydroelectric energy to 35 GW. The goal is to increase the proportion of renewable energy in national energy to 60% by 2030. The 2053 vision aims to have a carbon-neutral energy system [36].
Figure 1.
Installed Power of Turkey.
3. Analysis of Renewable Energy Incentives and Policies Implemented in EU Countries and Turkey
Incentives that facilitate the expansion of renewable energy systems in EU countries are divided into eight main groups. These are: Feed-in Tariff, Feed-in Premium (FiP), Green Certificates, Tax Incentives, Investment Grants, Net Metering, Tender and Competitive Incentive Systems, and Special applications.
3.1. Feed-in Tariff (FIT)
This system provides investors with a guaranteed purchase price for the energy produced by renewable energy systems. This incentive system limits the purchase guarantee to a fixed number of years, and the purchase price is fixed regardless of market conditions. This rationalizes the economic feasibility of the investment and increases predictability. The EU countries where FIT incentives are used and their prominent features are shown in Table 1.
3.2. Feed-in Premium (FIP)
These are systems that provide premiums in addition to the market price of electricity. These premiums, in addition to the market price, shorten the investment amortization period and make investment feasibility more attractive [45,46,47,48,49,50,51]. The EU countries where FIP incentives are used and their prominent features are shown in Table 2.
3.3. Tax Incentives
These are systems that provide tax exemptions for investments. VAT exemptions and equipment investment incentives are implemented [53,54,55,56].
Advantage: Shortens investment amortization period, reduces lifecycle costs, and provides investors with an economically predictable investment environment.
Disadvantage: Creates a long-term economic burden on public finances.
Example European Countries: Denmark, the Netherlands, Italy.
3.4. Certificate Supports
This system grants certificates to industry representatives. These certificates are also made legally obligatory, thus supporting renewable energy [57,58,59,60].
Advantage: With the certificate requirement, investments are market-driven. The investment budget is not provided by the public sector. It does not create an economic burden on the public sector.
Disadvantage: If implemented as a standalone incentive policy, a competitive incentive system cannot be achieved.
Example European Countries: Belgium, Sweden, Norway, Poland.
3.5. Investment Supports
These are financial supports provided directly to investors. Low-interest loans reduce initial investment and depreciation costs for investors and lower financing costs [62,63,64].
Advantage: Reduces initial investment and financing costs.
Disadvantage: Creates a financial burden on the public budget and public banks.
Applied Example European Countries: Finland, Austria, Czech Republic.
3.6. Net Metering
These systems establish a balance between production and consumption. Produced energy is primarily used for domestic consumption, while excess energy is fed into the national grid. Here, the energy supplied to the national grid is paid to investors via a fixed payment method. This incentive system is generally implemented in conjunction with the FIT system. It is implemented with a 10- to 20-year purchase guarantee [65,66,67,68,69].
Advantage: The purchase guarantee offers investors a predictable income model. Because it is demand-oriented, it reduces national grid line congestion, as this system is generally connected to the grid through distribution lines.
Disadvantage: It creates a financial burden on the public budget. Because it requires connections from different points of the grid, it can negatively impact grid dynamics and cause electrical harmonics.
Example European Countries: Netherlands, Belgium, Denmark, Germany, etc.
3.7. Tender Incentives
Renewable systems are made available to investors en masse through publicly held tenders. This allows for large-scale, collectively-constructed projects and competitive incentive systems [70,71,72,73].
Advantage: Large installations are organized at minimal costs.
Disadvantage: Small investors are excluded from the system, and projects proceed solely under the monopoly of large investors.
Example European Countries: Spain, Portugal, Greece, etc.
3.8. Special Projects
These are specially designed incentive systems that support rooftop systems, microgrids, small projects under a certain power level, and SMEs.
Advantage: By supporting small projects, projects become more attractive to end users. Because incentives are broken down into smaller units, the pace of renewable energy system installation is faster.
Disadvantage: As the rate of connection to the system increases for smaller users, monitoring of incorrect installations becomes more difficult, and grid disruptions may increase, leading to increased grid harmonics.
Example European Countries: United Kingdom, Switzerland, Hungary.
3.9. Carbon Trading Credit Incentive
Under the carbon trading system, renewable energy investors earn carbon credits for reducing carbon emissions. These carbon credits can be used for commercial purposes. This system is implemented in Romania and Hungary.
4. Regional and Country-Specific Evaluation of Incentives and Policies Implemented by the EU Region and Turkey
Living conditions vary across regions within the European Union. This section examines regional differences and their key characteristics.
4.1. Western Europe
It is the region that includes Germany, France, Belgium, the Netherlands, and Austria. Its main characteristics are shown in Table 3.
- A.
- Germany
German renewable energy incentives and policies date back to 2000. The renewable energy law was adopted, and legal incentives were established.
In this context, the fixed feed-in tariff (FIT), grid priority, auction system, investment supports, tax incentives, financing supports, and R&D incentives were implemented [74].
Incentives were provided by prioritizing renewable resources for grid connection, and the fixed feed-in tariff determined the number of years for purchases. The purchase guarantee was provided for 20 years. Purchase prices are provided at 8 euro cents per kWh. Specific applications for scaled systems are also being implemented in Germany. For installations up to 10 kW, incentives of 10-11 euro cents per kWh are applied, and for installations up to 40 kW, incentives of 9-10 euro cents per kWh are applied. For large systems (up to 1 MW), incentives of 7-8 euro cents per kWh are applied. For biogas plants, this value increases to 13-15 euro cents.
Germany implements an auction incentive system for large projects. Thus, the purchase guarantee value is determined by the auction method. A local and regional incentive system is also in place in Germany. Municipalities are also provided with special support for small projects. Emission incentives encourage renewable energy investments in institutions.
- B.
- France
Primarily, public support programs include tax exemptions, tender support mechanisms, and R&D support.
France provides €11 billion in financing for offshore wind energy projects. Furthermore, tender support encourages mass installations. Tender initiatives were held in 2021 and 2022, resulting in the allocation of 4.2 GW of capacity. 931 MW of wind power plant capacity has also been allocated to onshore wind energy installations [75].
- C.
- Belgium
Renewable energy incentives in Belgium are categorized as certificate incentives, tax incentives, grant incentives, R&D support, and cooperative incentives.
Under the certificate system, energy supply companies are required to source a certain portion of their energy from renewable sources. This incentive system has been implemented in Flanders and Wallonia. Tax incentives include VAT exemptions, income tax reductions, and property tax exemptions.
Belgium supports offshore wind power plants through grant incentives. In this context, a 700 MW wind farm project in the North Sea was approved, and a government grant of €682 million was provided. Belgium is the first European country to support and implement offshore floating energy projects.
Belgium provides separate support to energy cooperatives. Cooperatives are gaining prominence as systems whose use will increase globally in the coming years [76].
- D.
- Netherlands
The Netherlands implements financial, tax, and financing support as renewable energy incentives. The SDEE+ program provides support for solar, wind, geothermal, and biomass energy systems. In this context, 4,400 MW power plants have been financially supported. VAT exemption incentives have exempted renewable energy plants from the 21% VAT. Low-interest loans are provided for projects as investment and financing support. The Dutch Development Bank supports projects in this context [77].
- E.
- Austria
Renewable energy incentives in Austria: VAT exemptions, financial subsidies, incentives for hydrogen distribution and storage systems, and sector-specific incentives are being implemented.
Incentives related to renewable energy use are being provided in the agricultural sector. In this context, €100 million in incentives have been provided until 2025.
The VAT exemption is implemented in the form of a zero rate. Initially, VAT was zeroed for solar energy systems.
4.2. Northern Europe
Northern Europe encompasses Sweden, Norway, Finland, and Denmark. Different incentive policies are implemented within the region, depending on regional and national conditions. The main characteristics of Northern Europe in terms of incentives and policy are shown in Table 4.
- A.
- Sweden
Sweden uses green certificate programs, financial supports, tax exemptions, R&D supports, and public-private projects as renewable energy incentives [79].
With FIP incentives, producers receive a green certificate for every MW they produce. They generate income by selling these certificates. VAT exemptions and income tax incentives are used as tax incentives. Wind, solar, and biogas facilities are prioritized in these incentives. Large projects are incentivized through a public-private tender system. The FIP system provides additional payments to the market price.
- B.
- Norway
Norway effectively uses renewable energy certificate incentives. Investors are offered the opportunity to sell these certificates in the free market, generating additional income [80]. Investors are provided with financial support through low-interest loans. Tax exemptions are also used as a renewable energy incentive system.
- C.
- Finland
Finland primarily uses two incentive systems: FIT and tax incentives. FIT agreements are made based on a predetermined market price. However, this value is updated based on market prices. This provides predictability for investors [81]. An incentive system has been additionally detailed for projects undertaken in small-scale and rural areas.
4.3. Southern Europe
The main characteristics of Northern Europe in terms of incentives and policy are shown in Table 5.
- A.
- Spain
Tax incentives, financial credit incentives, small-scale project incentives, and R&D incentives are implemented in Spain.
VAT support is applied to solar energy equipment and energy storage elements. Income tax exemptions are also among the implemented systems [82].
Rooftop PV system support and individual production facilities are also included in Spain’s incentive systems. VAT exemptions are applied to rooftop systems and individual systems. A 30% tax reduction is offered to individuals who establish their production systems in residences.
Municipalities provide exemptions from construction permit taxes and property taxes for renewable energy facilities.
A microfinancing model is implemented for small-scale projects. Low-interest financing is provided for these projects through a joint EU-Spain partnership.
- B.
- Italy
Three main incentive policies are implemented in Italy: FIT (Fit), tax incentives, and green certificate systems.
Italy stands out in the FIT system with its contracts for difference. Contracts for difference and an auction incentive model are implemented. Thus, a system that provides bilateral offsetting and covers consumers’ electricity costs is being established [83].
The Conto Energia program is among the incentives implemented. These incentives are also broken down specifically for rooftop systems.
- C.
- Portugal
Portuguese renewable energy incentives primarily consist of tax reductions, financing supports, tendering, and net metering systems.
Renewable energy investors are provided with low-interest funding, VAT exemptions on renewable energy equipment, and income and corporate tax reductions [84]. Direct grants are provided for wind, solar, and biomass energy. Small investors are supported through microfinance programs. A net metering system is in place. This system provides incentives to achieve the goal of self-sufficiency.
- D.
- Greece
Greece utilizes incentives such as FIT, contracts for difference, tax exemptions, financing and grant programs, and R&D support in its renewable energy systems.
The FIT program is applied to small-scale projects and provides a fixed purchase guarantee. These incentives are heavily focused on micro solar and wind power generation facilities [85].
Market forecasting has increased through the contract for difference method. Predetermined purchase prices are indexed to market prices, increasing market flexibility.
Tax incentives include VAT exemptions, property tax reductions, and corporate tax reductions.
Financing and grant support include low-interest loans and EU-area support, which are provided as direct subsidies to investors.
4.4. Eastern Europe
The main characteristics of Eastern Europe in terms of incentives and policy are shown in Table 6.
- A.
- Poland
Poland benefits from EU area support for renewable energy incentives. The EU has provided Poland with €22.5 billion in support for wind energy investments. These funds are needed for the construction of wind power plants in the North Sea.
Poland has the National Renewable Energy Support System (RES), which offers a fixed price and purchase guarantee for renewable energy. This program has created predictable market conditions for investors. The purchase guarantee and fixed price support in the RES system are valid for 15 years. Surplus energy produced can be sold to the national grid at a fixed purchase price for 15 years [86]. Poland provides investment incentives and tax exemptions for renewable energy facilities. Furthermore, through the green certificate system, investors are granted certificates that they can sell on the free market.
Poland refunds the full VAT levied on renewable energy equipment, thus providing VAT exemption.
- B.
- Czech Republic
The Czech Republic provides fixed price support to renewable energy investors. The fixed purchase support was reduced from approximately USD 0.55-0.60 per kWh of renewable energy to USD 0.12-0.20 as of 2014 [87].
The Czech Republic provides renewable energy investors with priority connection to the national grid. This priority granted during grid connection supports renewable energy installations.
In addition to the fixed purchase guarantee, the Czech Republic organizes renewable energy tenders for large-scale projects. This reduces the public burden by offering the most favorable purchase prices and increases the number of large-scale projects.
- C.
- Hungary
The FIT system is a leading renewable energy incentive system in Hungary. The purchase guarantee period is set at 15 years. Another incentive system implemented is the tender system. This tender system reduces the public burden and rapidly increases the level of renewable energy installations with large-scale projects [88].
Hungary also implements a VAT exemption system for renewable energy investments. VAT refunds on renewable energy investments are granted subject to certain conditions.
Hungary also effectively utilizes the Green Certificates system. The green certificates issued are converted into cash at market conditions. Hungary externally supports hybrid systems. Hungary also provides low-interest loans and funding for renewable energy investments.
- D.
- Romania
Romania’s renewable energy incentives include FIT (FIT), Green certificates, investment incentives, tax incentives, and a carbon trading system [88].
Under the green certificate system, renewable energy producers receive certificates and can use these certificates in the free trade market.
The FIT system and fixed purchase guarantee are among the incentives provided to investors. The purchase guarantee is valid for 15 years. Low-interest credit support is provided as an investment incentive. Incentives are being increased, especially for projects in rural areas. Under the carbon trading system, renewable energy producers earn carbon credits for reducing carbon emissions and can generate income through trading with these credits.
4.5. Turkey
Turkey is among the countries with high external dependence on energy. Therefore, supply diversification policies are vital. In this context, Turkey is among the countries that should focus heavily on renewable energy. Turkey established the first legal regulation to provide incentives for renewable energy with the “Law on the Use of Renewable Energy Resources for the Purpose of Generating Electricity” enacted in 2005. Incentive mechanisms, which were not fully implemented until 2013, began to be incentivized with legal amendments and capacity allocations implemented this year. This law incentivized solar systems, followed by wind energy systems, hydroelectric production systems, geothermal energy systems, and biomass energy systems. These incentive values are shown in Table 7. These incentive models are categorized according to whether domestically produced equipment is used or not [89,90,91,92,93,94,95].
Incentives initially implemented in Turkey include VAT exemptions for purchasing investment equipment from domestic or international sources, customs duty exemptions, an 85% discount on power transmission line usage fees during the investment and operation phases, a 10-year purchase guarantee of 13.3 cents/USD, and incentives for using domestic products. These incentives and practices are valid for power plants commissioned until December 31, 2019. The unit energy (KWh) incentive value can reach higher values for the use of domestically produced equipment. These incentives accelerate installations. This is illustrated in Table 7 and Table 8.
Domestic cell production in Turkey is expected to begin in 2023. Domestic panel production accelerated after 2012. Many domestic production companies were established and began production. Therefore, the full implementation of this incentive model was delayed, and new legislative revisions were implemented before full implementation was achieved [96,97,98,99,100]. In 2016, the YEKDEM mechanism was implemented, establishing a centralized management organization. In 2017, large-scale projects were supported through tenders through Renewable Resource Areas (YEKA) tenders. This reduced the public burden, and large projects began to be tendered with lower purchase prices. In 2020, YEKDEM purchase guarantee prices were updated in Turkish Lira and in line with market conditions. After 2023, self-consumption incentives for rooftop systems were introduced, enabling offsetting and imposing a self-consumption obligation. This aimed to reduce the transfer of excess electricity to the grid [101,102].
These revisions accelerated in 2019 and 2022, and the most recent legislative revision was implemented on August 11, 2022.
These incentives underwent some revisions with the regulation issued on May 12, 2019.
These are summarized below.
- Regulations made within the scope of the Unlicensed Electricity Generation Regulation in the Electricity Market emphasized the possibility of rooftop and facade solar power installations. This has shifted the focus to rooftop systems.
- The new regulation allows businesses and citizens to install projects without the need to establish a company or obtain a license.
- The sale of self-consumption surpluses from energy installed up to 10 kW for residential subscribers and up to 5 MW for all businesses and public institutions has been made possible.
- The new regulation introduced monthly production and consumption offsetting.
- The scope of unlicensed power plants has been increased to 5 MW.
- The legislative update on August 11, 2022, introduced the following regulations:
- The possibility of differentiating consumption zones and production zones has been made possible. This paves the way for consumption points without an established installation area to establish production facilities and offset them anywhere in Turkey, provided technical conditions are met.
- Production facilities will be permitted based on their consumption value, but organized industrial zones have been designated as exceptions, allowing production values higher than consumption. This encourages the development of organized industrial facilities.
5. Findings and Discussion
5.1. Comparative Analysis of Renewable Energy Current Status and Future Provisions
When the current situation of renewable energy in EU countries and Turkey and its share in installed electrical power were examined, the following findings were obtained:
- Germany has the highest installed capacity with 235 GW. France follows with 136 GW, Italy with 120 GW, Spain with 118 GW, and Turkey with 116 GW.
- The country with the lowest installed capacity is Hungary with 8.5 GW installed capacity.
- The country with the highest renewable energy usage rate is Norway, at 96%. Austria follows with 86%.
- When compared to Turkey in terms of installed power capacity, Germany is ahead of Turkey with 119 GW, France with 136 GW, Italy with 120 GW, and Spain with 118 GW. The Netherlands, Hungary, and Austria are behind Turkey by 71 GW, 88 GW, and 107.5 GW, respectively. This is shown in Table 8.

Table 8.
Installed Renewable Energy Capacity (2024, GW).
| Installed Renewable Energy Capacity (2024, GW) | |||
|---|---|---|---|
| Country | Installed Capacity (GW) | Rank | Compared to Turkey |
| Germany | 235 | 1 | +119 GW |
| France | 136 | 2 | +20 GW |
| Italy | 120 | 3 | +4 GW |
| Spain | 118 | 4 | +2 GW |
| Turkey | 116 | 5 | — |
| Netherlands | 45 | 6 | -71 GW |
| Austria | 28 | 7 | -88 GW |
| Hungary | 8. May | 16 | -107.5 GW |
- The Netherlands, Austria, Norway, and Finland are countries with a short-term goal of switching to 100% renewable energy.
- One of the most important renewable energy targets of European countries is the goal of becoming carbon-neutral.
- When renewable energy incentives were ranked in terms of efficiency, Turkey received 36 points out of 50, ranking 7th. The efficiency ranking was created by considering the incentives implemented, installed capacity, and renewable energy capacity. This is shown in Table 9.
- In European countries, short-term plans generally refer to the years 2030-2035, while long-term plans refer to the years 2045-2050.
- Turkey ranks 7th among selected countries in terms of achieving its renewable energy target. It has a 57.5% achievement rate.
- When EU countries and Turkey are evaluated in terms of structural and market barriers, Turkey is at a disadvantage compared to EU countries due to its low market forecasts and high inflation. However, these disadvantages have been mitigated through domestic production incentives. This situation is shown in Table 10.
- Another prominent long-term goal is green hydrogen targets. Detailed comparison results are shown in Table 11.
- Germany, Sweden, and the Netherlands have consistent, multi-level incentives. Their high level of policy development ensures a high level of renewable energy.
- Renewable energy tenders and green certificate incentives are widely used throughout EU countries. However, Turkey does not implement a green certificate incentive system.
- EU countries not only promote renewable energy sources through these certificate programs but also manage their electricity sales markets through these regulations.
- Turkey maintains a moderate-to-medium position in its renewable energy policies.
- Turkey is focused on large-scale renewable energy projects after 2022. While this trend increases the pace of installation, it also pushes medium-sized investors out of the sector. This, in turn, reduces renewable energy penetration and consumer penetration.
- When Turkey is compared in terms of installed capacity, renewable rate, and 2030 targets, the findings are shown in Table 12 with their pros and cons.
Comparative findings showing the installed capacities and the share of renewable energy in them are shown in Figure 2.
In terms of short-term renewable energy targets, Turkey is one of the countries closest to achieving them. While policies appear to have been implemented successfully to achieve these targets, the targets remain below Turkey’s achievable levels, given its renewable energy potential. This situation is shown in Figure 3.
The short- and long-term incentives implemented by Turkey and leading EU countries are shown in Table 13, along with their highlights. This table shows the prominent policies for each country.
- Different incentive policies are implemented in the EU and Turkey. These incentive policies vary depending on the countries’ economic situation, climatic conditions, development and education levels, and regional characteristics.
- Regionally, Western and Northern Europe, due to their higher levels of economic development, have developed more complex, structured, and highly incentive-based policies. In Southern and Eastern Europe, simpler, more direct, and unstructured incentives are preferred.
- An examination of the short- and long-term policies of EU countries and Turkey reveals that Turkey is more determined than Poland and Hungary. However, Germany exhibits more moderate policies than France and Portugal. This situation is shown in Table 14 with all its outputs.
- Due to the high solar potential in Southern European countries, there has been a tendency towards large-scale projects.
- Tax incentives and net metering incentive systems have been implemented in Northern Europe due to low insolation levels.
- Western European energy markets have greater freedom than Eastern Europe. Therefore, markets increase the effectiveness of incentives. Eastern Europe, on the other hand, has less freedom and more publicly supported progress.
- When examining net metering for individual residential use, Turkey ranks low compared to other European countries. Turkey’s low individual use is one of the negative factors affecting its installed renewable energy capacity. This situation is shown in Table 15.
- When examining the EU region in terms of installed renewable energy, Germany leads the pack. This is due to the breakdown of renewable energy incentives and the effective implementation of multiple incentive systems. The high level of rooftop system installation is due to the prevalence of detached housing. Furthermore, the high level of industrial development increases the rate of installation on industrial rooftops. Compared to Turkey, Turkey adopted the incentive system late and has a lower level of economic development. Because the housing type is mass housing, rooftops are not suitable for domestic consumption. The implementation of incentive systems and incentive amounts are also lower than in Germany.
- Turkey’s incentive structure is at a medium level of complexity. In this sense, Germany, France, and the Netherlands have more complex incentive systems than Turkey. Hungary and Poland, on the other hand, implement less comprehensive incentive methods. This is illustrated in Table 16.
- FIT, Green Certificates, and tax incentives are widely implemented incentive systems throughout the European Union member states. In Turkey, tax incentives and FIT are effectively implemented. However, market activity and high inflation rates negatively impact predictable market conditions in Turkey, and renewable energy incentives are also negatively impacted by these factors.
- Romania, Denmark, and Hungary implement the Carbon Trading Credit system. This incentive system accelerates investments by directing commercial investors to renewable energy.
- Hungary is the European country with the lowest renewable energy rates and investments. One of the analyzed reasons for this is the lack of effective incentive systems. Targets similar to the 2030 and 2050 targets implemented throughout Europe are not implemented in this country. In this respect, Hungary lags behind both EU countries and Turkey.
- EU countries implement short- and long-term incentives. Achieving Carbon Neutrality has been a vision for almost all member states in their long-term goals. Another incentive area highlighted by long-term goals is green hydrogen production. Countries without long-term goals also show low renewable energy installation rates.
- In Turkey, short- and long-term plans include increasing the renewable energy installation rate and achieving Carbon Neutrality targets.
- Tax incentives are available in almost all EU countries and Turkey. These incentives primarily include VAT exemptions and income tax exemptions.
- In Turkey, large-scale renewable energy facilities are incentivized through YEKA project incentives. The most important feature of YEKAs is that purchase guarantee prices match market prices, reducing the public economic burden.
5.2. Policy Recommendations
The following policy recommendations are being made to improve renewable energy policies and incentives:
- Green bonds, tax deductions, and low-interest loans should be effectively offered to investors, and their effectiveness should be monitored.
- Microgrids based on the principle of decentralized on-site production should be encouraged.
- Rooftop photovoltaic production facilities should be used to bring production to the point of consumption. This will reduce losses and the need for transmission line and transformer investments.
- R&D efforts should be increased for measurement, and digital metering and net metering reforms should be enhanced.
- The effectiveness of established policies should be continuously monitored, with increased bureaucratic collaboration and integration oversight.
- Market foresight should be enhanced by reducing policy changes. This will create a predictable market environment for investors.
- Domestic production should be supported, and equipment incentives should be provided. This will limit foreign-dependent production.
6. Conclusions
This study comparatively analyzed the renewable energy policies, current installed capacity structures, incentive mechanisms, structural and regional differences, short- and long-term targets, and implementation levels of European Union countries and Turkey. The findings reveal that countries implement significantly different incentive systems based on their levels of economic development, climate conditions, market structures, and regional characteristics.
In terms of installed capacity, Germany stands out with 235 GW, while Turkey follows Italy and Spain with 116 GW. Norway has the highest renewable energy usage rate at 96%. Turkey ranks 7th with a target achievement rate of 57.5% and maintains its ranking in terms of incentive effectiveness with a score of 36 out of 50.
While multifaceted incentive mechanisms such as FIT (FIT), green certificates, tax exemptions, and carbon trading systems are widely implemented in EU countries, Turkey primarily implements guaranteed-purchase YEKA (Yeka) projects, tax incentives, and medium-complexity support systems. However, low market predictability and high inflation rates in Turkey negatively impact the effectiveness of incentives. Furthermore, Turkey’s low level of individual net metering implementation emerges as another significant factor limiting renewable energy installation rates. The primary reasons for this include late implementation, low levels of economic development, apartment-type housing density, and limited rooftop availability.
Regionally, Western and Northern European countries have more complex, structured, and effective incentive policies, while Eastern and Southern European countries prefer simpler, more direct, and publicly supported incentive methods. While countries like Germany, Sweden, and the Netherlands have achieved high renewable energy penetration through multi-tiered systems, installation rates are quite low in countries like Hungary due to inadequate incentive structures and a lack long-term visions such as the 2030–2050 targets.
While Turkey’s incentive policies are more decisive and comprehensive than those of countries like Poland and Hungary, they exhibit a less integrated and complex structure compared to countries like Germany, France, and the Netherlands. Turkey has focused on large-scale projects in the post-2022 period; This has driven medium-sized investors away from the sector, reducing energy penetration and individual participation.
As part of their long-term goals, most EU countries have adopted a carbon neutrality vision and integrated new incentives, such as green hydrogen production, into their policies. Turkey has similarly incorporated carbon neutrality targets into both its short- and long-term plans.
This comprehensive analysis provides policymakers, energy sector stakeholders, and academia with an important reference for understanding the current situation and making forward-looking strategic decisions. The policy recommendations developed based on the findings provide guidance for making Turkey’s renewable energy policies more sustainable, effective, and inclusive.
References
- Kitzing, L.; Mitchell, C.; Morthorst, P.E. Renewable energy policies in Europe: Converging or diverging? Energy Policy 2012, 51, 192–201. [Google Scholar] [CrossRef]
- Kilinc-Ata, N. The evaluation of renewable energy policies across EU countries and US states: An econometric approach. Energy Sustain. Dev. 2016, 31, 83–90. [Google Scholar] [CrossRef]
- Fouquet, D.; Johansson, T.B. European renewable energy policy at crossroads—Focus on electricity support mechanisms. Energy Policy 2008, 36, 4079–4092. [Google Scholar] [CrossRef]
- Hashim, N.; Ho, W.S. Renewable energy policies and initiatives for a sustainable energy future in Malaysia. Renew. Sustain. Energy Rev. 2011, 15, 4780–4787. [Google Scholar] [CrossRef]
- Abolhosseini, S.; Heshmati, A. The main support mechanisms to finance renewable energy development. Renew. Sustain. Energy Rev. 2014, 40, 876–885. [Google Scholar] [CrossRef]
- Abdmouleh, Z.; Alammari, R.A.M.; Gastli, A. Review of policies encouraging renewable energy integration & best practices. Renew. Sustain. Energy Rev. 2015, 45, 249–262. [Google Scholar] [CrossRef]
- Aquila, G.; Pamplona, E.O.; de Queiroz, A.R.; Junior, P.R.; Fonseca, M.N. An overview of incentive policies for the expansion of renewable energy generation in electricity power systems and the Brazilian experience. Renew. Sustain. Energy Rev. 2017, 70, 1090–1098. [Google Scholar] [CrossRef]
- Nicolini, M.; Tavoni, M. Are renewable energy subsidies effective? Evidence from Europe. Renew. Sustain. Energy Rev. 2017, 74, 412–423. [Google Scholar] [CrossRef]
- Gustafsson, M.; Anderberg, S. Dimensions and characteristics of biogas policies—Modelling the European policy landscape. Renew. Sustain. Energy Rev. 2021, 135, 110200. [Google Scholar] [CrossRef]
- Lu, Y.; Khan, Z.A.; Alvarez-Alvarado, M.S.; Zhang, Y.; Huang, Z.; Imran, M. A critical review of sustainable energy policies for the promotion of renewable energy sources. Sustainability 2020, 12, 5078. [Google Scholar] [CrossRef]
- Solaymani, S. A review on energy and renewable energy policies in Iran. Sustainability 2021, 13, 7328. [Google Scholar] [CrossRef]
- Yücel, U.; Özdemir, E.; Ayaz, M. Yenilenebilir enerji kaynaklarından üretilen elektrik enerjisi teşvik yöntemlerinin incelenmesi. Düzce Üniversitesi Bilim Ve Teknol. Derg. 2021, 9, 774–790. [Google Scholar] [CrossRef]
- Hansen, K.; Mathiesen, B.V.; Skov, I.R. Full energy system transition towards 100% renewable energy in Germany in 2050. Renew. Sustain. Energy Rev. 2018, 102, 1–13. [Google Scholar] [CrossRef]
- Fantidis, J.G.; Vordos, A.A.; Bandekas, D. Renewable energy policy in Greece. Renew. Sustain. Energy Rev. 2014, 39, 117–123. [Google Scholar]
- Kalogirou, S.A. Solar Energy Engineering: Processes and Systems, 2nd ed.; Academic Press: Cambridge, MA, USA, 2014. [Google Scholar]
- Akella, A.K.; Saini, R.P.; Sharma, M.P. Social, economical and environmental impacts of renewable energy systems. Renew. Energy 2009, 34, 390–396. [Google Scholar] [CrossRef]
- Li, T.; Qiu, Y. Small vs. large: A comparative study of FIT policies for renewable energy in Germany and China. Renew. Sustain. Energy Rev. 2015, 49, 346–355. [Google Scholar]
- Hvelplund, F.; Meyer, N.I.; Nørgård, H.K.; Østergaard, H. Renewable energy and the need for local energy markets. Energy 2006, 31, 2293–2302. [Google Scholar] [CrossRef]
- Verbruggen, R.; Lauber, A. Basic concepts for designing renewable electricity support aiming at a full-scale transition by 2050. Energy Policy 2012, 40, 507–516. [Google Scholar] [CrossRef]
- Pearce, J.M. A review of open source ventilators for COVID-19 and future pandemics. F1000 Res. 2020, 9, 218. [Google Scholar] [CrossRef]
- Wiser, R.; Porter, K.; Bolinger, M.; Raitt, H. Does it have to be this hard? Implementing the nation’s most aggressive renewable portfolio standard in California. Energy Policy 2005, 33, 1335–1347. [Google Scholar] [CrossRef]
- Agnolucci, S. The evolution of feed-in tariff policies in the European Union. Energy Policy 2006, 34, 2123–2134. [Google Scholar] [CrossRef]
- del Río, M.; Gual, P. An integrated assessment of the feed-in tariff system in Spain. Energy Policy 2007, 35, 994–1012. [Google Scholar] [CrossRef]
- Bird, L.; Bolinger, M.; Gagliano, T.; Wiser, R.; Brown, M.; Parsons, B. Policies and market factors driving wind power development in the United States. Energy Policy 2005, 33, 1397–1407. [Google Scholar] [CrossRef]
- Ragwitz, M.; Held, A.; Resch, G.; Faber, T.; Haas, R.; Huber, C.; Morthorst, P.E.; Jensen, S.; Konstantinaviciute, L.; Heyder, B. OPTRES: Assessment and Optimization of Renewable Energy Support Schemes in the European Electricity Market; Fraunhofer Institute Systems and Innovation Research: Karlsruhe, Germany, 2007. [Google Scholar]
- Rickerson, B.; Bennhold, F.; Bradbury, J. Feed-İn Tariffs and Renewable Energy in the USA—A Policy Update; White Paper; World Future Council and Heinrich Böll Foundation North America: Washington, DC, USA, 2008. [Google Scholar]
- Resch, G.; Held, A.; Ragwitz, M.; Faber, T.; Haas, R. Feed-in tariffs and quotas for renewable energy in Europe. Energy Policy 2008, 36, 1419–1431. [Google Scholar] [CrossRef]
- Stephens, J.C.; Wilson, E.J.; Peterson, T.P.; Meadowcroft, J. Getting smart? Climate change and the electric grid. Chall. Sustain. 2013, 1, 38–45. [Google Scholar] [CrossRef]
- Joskow, P.L. Comparing the costs of intermittent and dispatchable electricity generating technologies. Am. Econ. Rev. Pap. Proc. 2010, 100, 238–241. [Google Scholar] [CrossRef]
- Jenner, S.; Groba, G.; Indvik, J. Assessing the strength and effectiveness of renewable electricity feed-in tariffs in European Union countries. Energy Policy 2013, 52, 385–401. [Google Scholar] [CrossRef]
- Jansen, J.C.; Boots, M.G.; Scheepers, M.J.J. Designing effective and efficient support schemes for renewable energy sources. Energy Policy 2006, 34, 319–331. [Google Scholar] [CrossRef]
- Bhattacharyya, S.C.; Timilsina, G.R. Modelling energy demand of developing countries: Are the specific features adequately captured? Energy Policy 2010, 38, 1979–1990. [Google Scholar] [CrossRef]
- Bhattacharyya, S.C. Review of alternative methodologies for analyzing off-grid electricity supply. Renew. Sustain. Energy Rev. 2012, 16, 677–694. [Google Scholar] [CrossRef]
- Markard, E.K.; Truffer, B. Technological innovation systems and the multi-level perspective: Towards an integrated framework. Res. Policy 2008, 37, 596–615. [Google Scholar] [CrossRef]
- Sovacool, B.K. The importance of comprehensiveness in renewable electricity and energy-efficiency policy. Energy Policy 2009, 37, 1529–1541. [Google Scholar] [CrossRef]
- Sovacool, B.K. Rejecting renewables: The socio-technical impediments to renewable electricity in the United States. Energy Policy 2009, 37, 4500–4513. [Google Scholar] [CrossRef]
- Lockwood, M. The political dynamics of green transformations: Feedback effects and institutional context. İn The Politics of Green Transformations; Scoones, I., Leach, M., Newell, P., Eds.; Routledge: London, UK, 2015; pp. 86–101. [Google Scholar]
- Geels, F.W. Technological transitions as evolutionary reconfiguration processes: A multi-level perspective and a case-study. Res. Policy 2002, 31, 1257–1274. [Google Scholar] [CrossRef]
- Jacobsson, S.; Bergek, A. Transforming the energy sector: The evolution of technological systems in renewable energy technology. Ind. Corp. Change 2004, 13, 815–849. [Google Scholar] [CrossRef]
- Bazilian, M.; Rogner, H.; Howells, M.; Hermann, S.; Arent, D.; Gielen, D.; Steduto, P.; Mueller, A.; Komor, P.; Tol, R.; et al. Considering the energy, water and food nexus: Towards an integrated modelling approach. Energy Policy 2011, 39, 7896–7906. [Google Scholar] [CrossRef]
- Sovacool, B.K.; Dworkin, M.H. Global Energy Justice: Problems, Principles, and Practices; Cambridge University Press: Cambridge, UK, 2014. [Google Scholar]
- Couture, T.; Cory, K.; Kreycik, C.; Williams, E. A Policymaker’s Guide to Feed-İn Tariff Policy Design; National Renewable Energy Laboratory (NREL): Golden, CO, USA, 2010; Technical Report NREL/TP-6A2-44849; Available online: https://www.nrel.gov/docs/fy10osti/44849.pdf.
- Geels, F.W. The dynamics of transitions in socio-technical systems: A multi-level analysis of the transition pathway from horse-drawn carriages to automobiles (1860–1930). Technol. Anal. Strateg. Manag. 2005, 17, 445–476. [Google Scholar] [CrossRef]
- Gielen, D.; Boshell, F.; Saygin, D.; Bazilian, M.D.; Wagner, N.; Gorini, R. The role of renewable energy in the global energy transformation. Energy Strategy Rev. 2019, 24, 38–50. [Google Scholar] [CrossRef]
- Hueting, D.A. Why environmental sustainability can most probably not be attained with growing production. Ecol. Econ. 1998, 27, 249–270. [Google Scholar] [CrossRef]
- Wüstenhagen, R.; Wolsink, M.; Bürer, M.J. Social acceptance of renewable energy innovation: An introduction to the concept. Energy Policy 2007, 35, 2683–2691. [Google Scholar] [CrossRef]
- Morrison, G.M.; Yeh, S. Consumer impacts of transportation electrification: A review of modeling studies. Renew. Sustain. Energy Rev. 2019, 115, 109399. [Google Scholar] [CrossRef]
- Stoft, S. Power System Economics: Designing Markets for Electricity; IEEE Press & Wiley-Interscience: Piscataway, NJ, USA, 2002. [Google Scholar]
- Geels, F.W. Technological Transitions and System İnnovations: A Co-Evolutionary and Socio-Technical Analysis; Edward Elgar Publishing: Cheltenham, UK, 2005. [Google Scholar]
- Sovacool, B.K.; Drupady, I.M. Energy Access, Poverty, and Development: The Governance of Small-Scale Renewable Energy in Developing Asia. Ashgate Publishing: Farnham, UK, 2012. [Google Scholar]
- Çiçek, A.; Güzel, S.; Erdinç, O.; Catalão, J.P.S. Comprehensive survey on support policies and optimal market participation of renewable energy. Electr. Power Syst. Res. 2021, 201, 107522. [Google Scholar] [CrossRef]
- Tryndina, N.; An, J.; Varyash, I.; Litvishko, O.; Khomyakova, L.; Barykin, S.; Kalinina, O. Renewable energy incentives on the road to sustainable development during climate change: A review. Front. Environ. Sci. 2022, 10, 1016803. [Google Scholar] [CrossRef]
- Al Garni, A.; Awasthi, M. Techno-economic feasibility analysis of 100% renewable energy systems in the GCC countries. Renew. Sustain. Energy Rev. 2021, 143, 110856. [Google Scholar] [CrossRef]
- Hossain, M.; Rahman, M.F.; Hannan, M.A.; Mamun, J.A. A review on techno-economic analysis of renewable energy-based power generation for off-grid rural electrification: A case study of Bangladesh. Sustain. Energy Technol. Assess. 2021, 44, 101025. [Google Scholar]
- Navarro-Espinosa, K.B.; Martí, J.R.; Monti, A. Smart grid planning and renewable energy incentives: A comparative study. Renew. Sustain. Energy Rev. 2021, 144, 111032. [Google Scholar] [CrossRef]
- Alam, M.R.; Masoum, M.A.S.; Masoum, M.A.S. Smart grid storage planning with renewable energy integration: Review and techno-economic assessment. Renew. Sustain. Energy Rev. 2020, 134, 110301. [Google Scholar] [CrossRef]
- Rejeb, A.; Simske, K.; Treiblmaier, L.G.; Rejeb, A. Blockchain technology in the smart grid and renewable energy systems: A comprehensive review. Technol. Forecast. Soc. Change 2022, 174, 121203. [Google Scholar] [CrossRef]
- Hasanuzzaman, M.; Rahim, N.A.; Saidur, R. Performance evaluation of a grid-connected photovoltaic system in Malaysia. Energy Convers. Manag. 2015, 106, 897–905. [Google Scholar] [CrossRef]
- Mohamed, F.A.; Koivo, H.N. System modelling and online optimal management of microgrid using mesh adaptive direct search. Int. J. Electr. Power Energy Syst. 2011, 33, 805–813. [Google Scholar] [CrossRef]
- Kougias, A.; Szabó, S. Policy implications for the deployment of renewable energies: A review of the Mediterranean region. Renew. Sustain. Energy Rev. 2020, 134, 110356. [Google Scholar] [CrossRef]
- Ruiz, P.; Douzou, C.; Simoën, M. A new energy paradigm in France: Policies and instruments. Renew. Energy 2020, 162, 2359–2373. [Google Scholar] [CrossRef]
- Eltawil, D.M.; Zhao, Z. Grid-connected photovoltaic power systems: Technical and potential problems—A review. Renew. Sustain. Energy Rev. 2010, 14, 112–129. [Google Scholar] [CrossRef]
- Rickerson, P.C.B.; Grace, B.C.; Cory, S.D. Feed-in tariffs and renewable energy in the USA: A policy update. Energy Policy 2007, 35, 1426–1430. [Google Scholar] [CrossRef]
- Haas, R.; Panzer, C.; Resch, G.; Ragwitz, M.; Reece, G.; Held, A. A historical review of promotion strategies for electricity from renewable energy sources in EU countries. Renew. Sustain. Energy Rev. 2011, 15, 1003–1034. [Google Scholar] [CrossRef]
- Sovacool, B.K. The importance of comprehensiveness in renewable electricity and energy-efficiency policy. Energy Policy 2012, 49, 15–24. [Google Scholar] [CrossRef]
- Pérez-Arriaga, I.; Knittel, C. Utility of the future: An MIT energy initiative response to an industry in transition. MIT Energy Initiative. 2016. Available online: https://energy.mit.edu/research/utility-future-study/.
- Ritchie, H.; Roser, M. Renewable Energy. Our World in Data. 2020. Available online: https://ourworldindata.org/renewable-energy.
- Delucchi, M.A.; Jacobson, M.Z. Providing all global energy with wind, water, and solar power, Part I: Technologies, energy resources, quantities and areas of infrastructure, and materials. Energy Policy 2011, 39, 1154–1169. [Google Scholar] [CrossRef]
- Khan, M.; Liu, Z.; Zhang, D.; Huang, S. From turbulence to resilience: A bibliometric insight into the complex interactions between energy price volatility and green finance. Renew. Sustain. Energy Rev. 2023, 183, 113378. [Google Scholar] [CrossRef]
- Bergman, N.; Foxon, T.J. Reframing policy for the energy efficiency challenge: Insights from housing retrofits in the United Kingdom. Energy Res. Soc. Sci. 2020, 63, 101386. [Google Scholar] [CrossRef]
- Nwaoha, M.D.; Anyaeji, C.O.; Ugwu, K.I. Renewable energy development in sub-Saharan Africa: A review of policies and investment trends. Renew. Sustain. Energy Rev. 2021, 146, 111116. [Google Scholar] [CrossRef]
- Asif, M. Growth and challenges of solar PV in South Asia: A review. Renew. Sustain. Energy Rev. 2021, 143, 110903. [Google Scholar] [CrossRef]
- Ferrero, R.; Guillen, S.; Dimeas, A.L. A decision-making method for optimal renewable energy technologies mix for microgrids. Renew. Energy 2020, 159, 56–69. [Google Scholar] [CrossRef]
- Jurasz, J.; Canales, F.A.; Kies, A.; Guezgouz, J.; Kies, A.A. Assessing the future of a renewable powered hydrogen economy: An interdisciplinary perspective. Renew. Sustain. Energy Rev. 2021, 138, 110538. [Google Scholar] [CrossRef]
- Ogunjuyigbe, B.A.; Ayodele, T.R.; Akinola, O.O. Optimal allocation and sizing of PV/Wind/Split-diesel/Battery hybrid energy system for minimizing life cycle cost, carbon emission and energy loss. J. Renew. Sustain. Energy 2017, 9, 025901. [Google Scholar] [CrossRef]
- Bhatti, M.S.; Dey, B.Z.; Shukla, A.S.; Khan, B.H. Design and analysis of a hybrid renewable energy system for power generation in remote areas of India: A case study. Mater. Today Proc. 2021, 45, 6262–6269. [Google Scholar] [CrossRef]
- Lotfi, H.R.; Khodaei, A. Hybrid microgrid planning—Part I: Problem formulation. IEEE Trans. Smart Grid 2015, 6, 1389–1396. [Google Scholar]
- Rahman, S.A.; Zhang, L. Toward fast and efficient real-time simulation of hybrid renewable energy systems. IEEE Access 2020, 8, 213537–213549. [Google Scholar]
- Espinosa, V.I.; Peña-Ramos, J.A.; Recuero-López, F. The Political Economy of Rent-Seeking: Evidence from Spain’s Support Policies for Renewable Energy. Energies 2021, 14, 4197. [Google Scholar] [CrossRef]
- Li, L.; Lin, J.; Wu, N.; Xie, S.; Meng, C.; Zheng, Y.; Wang, X.; Zhao, Y. Review and outlook on the international renewable energy development. Energy Built Environ. 2022, 3, 139–157. [Google Scholar] [CrossRef]
- Min, H.Q.; Huang, L.; Liu, Y. Electricity Load Forecasting Using Support Vector Regression with Differential Evolution Algorithm. Energy Procedia 2019, 158, 2923–2928. [Google Scholar] [CrossRef]
- Kumar, P.; Biradar, S.R. Hybrid Model Based on LSTM and SVR for Electricity Consumption Forecasting. Int. J. Adv. Comput. Sci. Appl. IJACSA 2021, 12, 239–246. [Google Scholar] [CrossRef]
- Abdullah, M.A.M.; Mamat, R.; Said, F.; Anuar, K. Support Vector Regression Based Forecasting Model for Electric Load Demand. J. Adv. Res. Dyn. Control Syst. 2018, 10, 1599–1607. [Google Scholar]
- Bala, L.N.; Razaq, T.A. Forecasting Electrical Load Demand Using Support Vector Regression Optimized with PSO. Indones. J. Electr. Eng. Comput. Sci. 2021, 23, 814–821. [Google Scholar]
- Kaur, A.; Anand, R.S. Electric Load Forecasting Using SVR with Firefly Algorithm. Procedia Comput. Sci. 2018, 132, 1083–1090. [Google Scholar] [CrossRef]
- Chandel, S.S.; Agarwal, S.; Kumar, A. Electricity Load Forecasting Using Support Vector Regression with Fuzzy Kernel. Int. J. Electr. Power Energy Syst. 2016, 83, 458–469. [Google Scholar] [CrossRef]
- Islam, M.A.; Hossain, M.S. Forecasting Monthly Electricity Demand Using SVR and BPNN Optimized with GSA. Energies 2020, 13, 1703. [Google Scholar] [CrossRef]
- Wang, Z.; Zhang, G.; Dai, H. An SVR-Based Electricity Forecasting Model Incorporating Weather Factors. Sustainability 2020, 12, 4122. [Google Scholar] [CrossRef]
- Özgül, S.; Koçar, G.; Eryaşar, A. The progress, challenges, and opportunities of renewable energy cooperatives in Turkey. Energy Sustain. Dev. 2020, 59, 107–119. [Google Scholar] [CrossRef]
- Bölük, G.; Kaplan, R. Effectiveness of renewable energy incentives on sustainability: Evidence from dynamic panel data analysis for the EU countries and Turkey. Environ. Sci. Pollut. Res. 2022, 29, 26613–26630. [Google Scholar] [CrossRef]
- Elmalı, B.; Tetik, Ş. Assessment of renewable energy usage in the world and Turkey: Future policies and challenges. Renew. Sustain. Energy Rev. 2021, 152, 111645. [Google Scholar] [CrossRef]
- Karabulut, A.; Aydoğan, M. An overview of renewable energy support mechanisms in Turkey. Renew. Energy 2021, 175, 1121–1133. [Google Scholar] [CrossRef]
- Günay, A.; Kaya, Y.; İnan, K. A comparative evaluation of feed-in tariffs and auction systems in renewable energy policies: Turkey and the European Union. Energy Policy 2021, 156, 112422. [Google Scholar] [CrossRef]
- İbiş, S.; Bayrakçı, M.C.; Çetin, T. Assessment of renewable energy development in Turkey using SWOT-AHP and SWOT-TOPSIS methods. Energy Policy 2021, 151, 112172. [Google Scholar] [CrossRef]
- Akçay, N.; Altuğ, F. Electricity demand forecasting in Turkey using LSTM and Prophet models: A comparative analysis. J. Electr. Eng. Autom. 2021, 3, 162–168. [Google Scholar]
- Güneş, Y. Evaluation of renewable energy investments in Turkey using multi-criteria decision-making methods. Renew. Energy 2021, 163, 2034–2045. [Google Scholar] [CrossRef]
- Çiftçi, F.E.; Aydın, R. Energy transition in Turkey: Drivers, challenges and policy recommendations. Energy Policy 2021, 154, 112285. [Google Scholar] [CrossRef]
- Şimşek, H.; Koyuncu, M.; Demir, F. Renewable energy and green growth nexus in Turkey: Evidence from asymmetric causality. Environ. Sci. Pollut. Res. 2021, 28, 35662–35674. [Google Scholar]
- Erat, S.; Telli, A.; Ozkendir, O.M.; Demir, B. Turkey’s energy transition from fossil-based to renewable up to 2030: Milestones, challenges and opportunities. Clean Technol. Environ. Policy 2021, 23, 401–412. [Google Scholar] [CrossRef]
- Samour, A.; Pata, U.K. The impact of the US interest rate and oil prices on renewable energy in Turkey: A bootstrap ARDL approach. Environ. Sci. Pollut. Res. 2022, 29, 50352–50361. [Google Scholar] [CrossRef]
- Horasan, M.B.; Kilic, H.S. A multi-objective decision-making model for renewable energy planning: The case of Turkey. Renew. Energy 2023, 215, 1164–1175. [Google Scholar] [CrossRef]
- Lamnatou, C. Renewable energy sources as a catalyst for energy transition: The case of France. Renew. Energy 2024, 185, 451–460. [Google Scholar] [CrossRef]
- Guetlein, M.-C.; Jenal, J.; Rode, C. Empirical insights into enabling and impeding factors for citizen investments in renewable energy communities in France. Energy Policy 2024, 173, 113352. [Google Scholar] [CrossRef]
- Lam, S.X.; Lavrillier, H.B.; Vasseur, L. Agrivoltaics in France: The multi-level and uncertain regulation of decarbonised energy. Environ. Innov. Soc. Transit. 2024, 49, 30–45. [Google Scholar] [CrossRef]
- Van Steenberghe, M.; D’hulster, A.; Weytjens, J.; Ovaere, M. Tracking demographic and financial trends in renewable energy cooperatives in Belgium, 2012–2022. Humanit. Soc. Sci. Commun. 2025, 12, 54447. [Google Scholar]
- Coppitters, D.; Wiest, G.; Göke, L.; Contino, F.; Bardow, A.; Moret, S. Identifying dealbreakers and robust policies for the energy transition amid unexpected events: A case study for Belgium. arXiv 2025. [Google Scholar] [CrossRef]
- Di Foggia, G.; Beccarello, M. European roadmaps to achieving 2030 renewable energy targets: Evaluating national strategies including Belgium. Renew. Sustain. Energy Rev. 2024, 184, 101729. [Google Scholar]
- Netherlands Enterprise Agency. The Netherlands 2024—Main policy support mechanism: Sustainable Energy Transition Incentive Scheme (SDE+/SDE++). In IEA & Government of the Netherlands Energy Policy Review; Netherlands Enterprise Agency: Hague, The Netherlands, 2025. [Google Scholar]
- Anatolitis, V. Policy relevant lessons from research on renewable energy auctions: Trade-offs in design across EU jurisdictions. Energy Policy 2025, 203, 114624. [Google Scholar] [CrossRef]
- Fichera, A. Ten questions concerning renewable energy communities: The Netherlands’ emerging virtual scheme and subsidy design. Renew. Energy 2025, 281, 113193. [Google Scholar]
- Crichton, R. The impact of Austria’s climate strategy on renewable energy consumption. Energy Policy 2023, 178, 114915. [Google Scholar] [CrossRef]
- Kettner, C. Support measures for Austrian households in the energy crisis: Social effectiveness and efficiency incentives. Energy Effic. 2025, 18, 225–238. [Google Scholar] [CrossRef]
- Gaugl, R.; Sommer, M.; Kettner, C.; Bachhiesl, U.; Klatzer, T.; Gruber, L.; Böheim, M.; Kratena, K.; Wogrin, S. Integrated power and economic analysis of Austria’s transition to 100% renewable electricity by 2030. Energies 2023, 16, 2229. [Google Scholar] [CrossRef]
- Vardanyan, Y. Energy Communities in Sweden: Barriers and Driving Forces. Current Sustain./Renewable Energy Rep. 2025, 12, 10. [Google Scholar] [CrossRef]
- Yamout, R.; Krayem, A.; Wallin, F. Energy communities in Sweden: The case study of Sätra, Västerås. Energy Res. Soc. Sci. 2025, 115, 1–13. [Google Scholar]
- Mohiti, M.; Mazidi, M.; Steen, D.; Tuan, L.A. A Decentralized Local Flexibility Market for Local Energy Communities to Mitigate Grid Congestion: A Case Study in Sweden. arXiv 2025. [Google Scholar] [CrossRef]
- Nygaard, B. Offshore wind in Norway: Evolving policy narratives and regulatory frameworks. Energy Policy 2025, 161, 112345. [Google Scholar]
- Roithner, M.; Herrejon, P.V.; van Greevenbroek, K.; Grochowicz, A.; Zeyringer, M. Balancing Act: The Cost of Wind Restrictions in Norway’s Electricity Transition. Environ. Res. Energy 2025, 2, 035003. [Google Scholar] [CrossRef]
- Solbu, G. The unsung heroes of Norway’s sustainability transition? Exploring energy citizenship among low-income households. Energy Res. Soc. Sci. 2025, 87, 102423. [Google Scholar]
- Lieskoski, S. A review of the current status of energy storage in Finland and its role in renewable incentives. Energy Rep. 2024, 10, 250–265. [Google Scholar] [CrossRef]
- Matschoss, K. Disruptions and energy demand: How Finnish households respond to rising costs and solidarity expectations. Energy Res. Soc. Sci. 2025, 76, 102058. [Google Scholar] [CrossRef]
- Lukkarinen, J.P. Citizen energy lost in sustainability transitions: Finland’s transition policies and community uptake. Energy Res. Soc. Sci. 2023, 90, 102507. [Google Scholar] [CrossRef]
- Rodríguez, R.C.; Sánchez, R.M.; Benzal, A.Z.; Ferrández, D. Open Energy Data in Spain and Its Contribution to Sustainability: Content and Reuse Potential. Sustainability 2025, 17, 6731. [Google Scholar] [CrossRef]
- Vilches, R.R.; Martínez, F.M.; Miralles, Á.S.; de la Cámara, J.R.G.; Delgado, S.M. Methodology to assess prosumer participation in European electricity markets. Renew. Sustain. Energy Rev. 2024, 191, 114179. [Google Scholar] [CrossRef]
- Silveira, B.; Santos, M.E.M.D.; Fernando Joaquim Ferreira MAIA; Basso, A.P.; Singh, J.N.; de Medeiros Costa, H.K. Incentives for photovoltaic energy generation. Renew. Energy 2024, 54, 101415. [Google Scholar]
- Rego, N. Sustainable energy trading and fair benefit allocation in renewable energy communities: A Portuguese model. Util. Policy 2025, 96, 101986. [Google Scholar] [CrossRef]
- Vieira, M. Future of marine renewable energy in Portugal and Macaronesia: Projections for 2030. Energy Policy 2024, 175, 114403. [Google Scholar]
- Belmar, F. Modeling renewable energy communities in Lisbon: Design typologies, trading, and technology uptake. Energy Sustain. Soc. 2023, 13, 45. [Google Scholar]
- Raimondi, G.; Spazzafumo, G. Integrating renewable energy communities and Italian policy frameworks. E-Prime—Adv. Electr. Eng. Electron. Energy 2024, 10, 100819. [Google Scholar] [CrossRef]
- Ronchetti, G. Analyzing wind and photovoltaic plant development toward Italy’s energy strategy objectives. Renew. Energy Rev. 2025.
- Carfora, A. Fiscal incentives for energy poverty in Italy. Energy Res. Soc. Sci. 2025, 126, 104161. [Google Scholar] [CrossRef]
- Dębicka, A.; Olejniczak, K.; Radomski, B.; Kurz, D.; Poddubiecki, D. Renewable Energy Investments in Poland: Goals, Socio-Economic Benefits, and Development Directions. Energies 2024, 17, 2374. [Google Scholar] [CrossRef]
- Musibau, H. Poland’s net zero pathways: Moderating role of carbon tax. J. Environ. Manag. 2025, 380, 124848. [Google Scholar] [CrossRef]
- Żuk, P. Energy self-defence against official policy: Prosumer perceptions in Poland and other V4 countries. Energy Res. Soc. Sci. 2025, 127, 104202. [Google Scholar] [CrossRef]
- Georgopoulos, G. Regulatory incentives and active trading reduce hydrogen production costs in Greece. Commun. Earth Environ. 2025, 6, 349. [Google Scholar] [CrossRef]
- Chatzinikolaou, D. Integrating sustainable energy development with energy ecosystems in Greece: Trends and prospects. Sustainability 2025, 17, 1487. [Google Scholar] [CrossRef]
- Psarros, G.N.; Dratsas, P.A.; Papathanassiou, S.A. Electricity storage requirements to support the transition to high RES penetration: The Greek power system case study. J. Energy Storage 2024, 55, 105748. [Google Scholar] [CrossRef]
- Żuk, P.; Mazač, J.; Muth, D.; Tichý, L. Energy self defence against official policy: Prosumer motives and tactics in the Czech Republic, Poland, Slovakia and Hungary. Energy Res. Soc. Sci. 2025, 127, 104202. [Google Scholar] [CrossRef]
- Pechancová, V.; Pavelková, D. Community Renewable Energy in the Czech Republic: Value Proposition Perspective. Front. Energy Res. 2022, 10, 821706. [Google Scholar] [CrossRef]
- Fichera, A. Ten questions concerning renewable energy communities. Build. Environ. 2025, 281, 113193. [Google Scholar] [CrossRef]
- Gabriel, I.G.C.; Zamfir, A. Romania’s renewable energy policy frameworks: Stability, incentives and socio-economic impact. Energy Policy 2024, 189, 113815. [Google Scholar]
- Popescu, J.; Ionescu, M.; Petrescu, C. Romanian onshore wind and solar auction scheme under CfD: Design, uptake and early impacts. Renew. Energy 2025, 215, 90–104. [Google Scholar]
- Mitrea, L.; Ban, O. Consumer attitudes toward renewable incentives and prosumerism in Romania. Energy Res. Soc. Sci. 2025, 94, 102512. [Google Scholar]
- Żuk, P.; Mazač, J.; Muth, D.; Tichý, L. Energy self-defence against official policy: Prosumer motives and tactics in the V4 countries. Energy Res. Soc. Sci. 2025, 127, 104202. [Google Scholar] [CrossRef]
- Mączka, K. Are Poland and Hungary pushed toward or pulled by EU reforms? Comparative policy insights. Energy Policy 2025, 200, 114557. [Google Scholar] [CrossRef]
- OECD/IEA Contributors. Hungary 2022: Energy Policy Review and National Strategy. In IEA Policy Report; IEA: Paris, France, 2025. [Google Scholar]
- International Energy Agency. World Energy Outlook 2024; IEA Publications: Paris, France, 2024; Available online: https://www.iea.org/reports/world-energy-outlook-2024.
- International Energy Agency. Global Energy Review 2025. IEA Publications: Paris, France, 2025; Available online: https://www.iea.org/reports/global-energy-review-2025.
- European Commission. EU Energy Statistical Pocketbook 2024; Directorate-General for Energy: Brussels, Belgium, 2024; Available online: https://energy.ec.europa.eu/publications/eu-energy-statistical-pocketbook-2024_en.
- Eurostat. Energy Balance Sheets—2024 Edition; Publications Office of the European Union: Luxembourg, 2024; Available online: https://ec.europa.eu/eurostat/web/energy/data/energy-balances.
- Agency for the Cooperation of Energy Regulators (ACER). Annual Report on the Results of Monitoring the Internal Electricity and Natural Gas Markets in 2024; ACER: Ljubljana, Slovenia, 2025; Available online: https://acer.europa.eu/Official_documents/Acts_of_the_Agency/Publication.
- European Environment Agency (EEA). Trends and Projections in Europe 2024: Tracking Progress Towards Europe’s Climate and Energy Targets; EEA Report No. 13/2024; EEA: Copenhagen, Denmark, 2024; Available online: https://www.eea.europa.eu/publications/trends-and-projections-in-europe-2024.
- Gökçe, B.; Doğan, M.E. Impact of Renewable Energy Resources on the Turkish Electricity Market: Investment Priorities and Policy Effects. Int. J. Energy Econ. Policy 2024, 14, 123–134. [Google Scholar] [CrossRef]
- Dumrul, C.; Işık, İ.; Aykaç, F. Evaluation of Turkey’s Renewable Energy Alternatives Using IF-EDAS: Institutional Fuzzy Assessment. Energy Policy 2024, 172, 113641. [Google Scholar]
- Simşek, H.A.; Simşek, N. Recent Incentives for Renewable Energy in Turkey. Energy Policy 2013, 63, 521–530, (Although older, this remains a widely cited foundational study on Turkey’s YEKDEM and fiscal incentives for renewables.). [Google Scholar] [CrossRef]
Figure 2.
Comparative findings showing the installed capacities and the share of renewable energy.
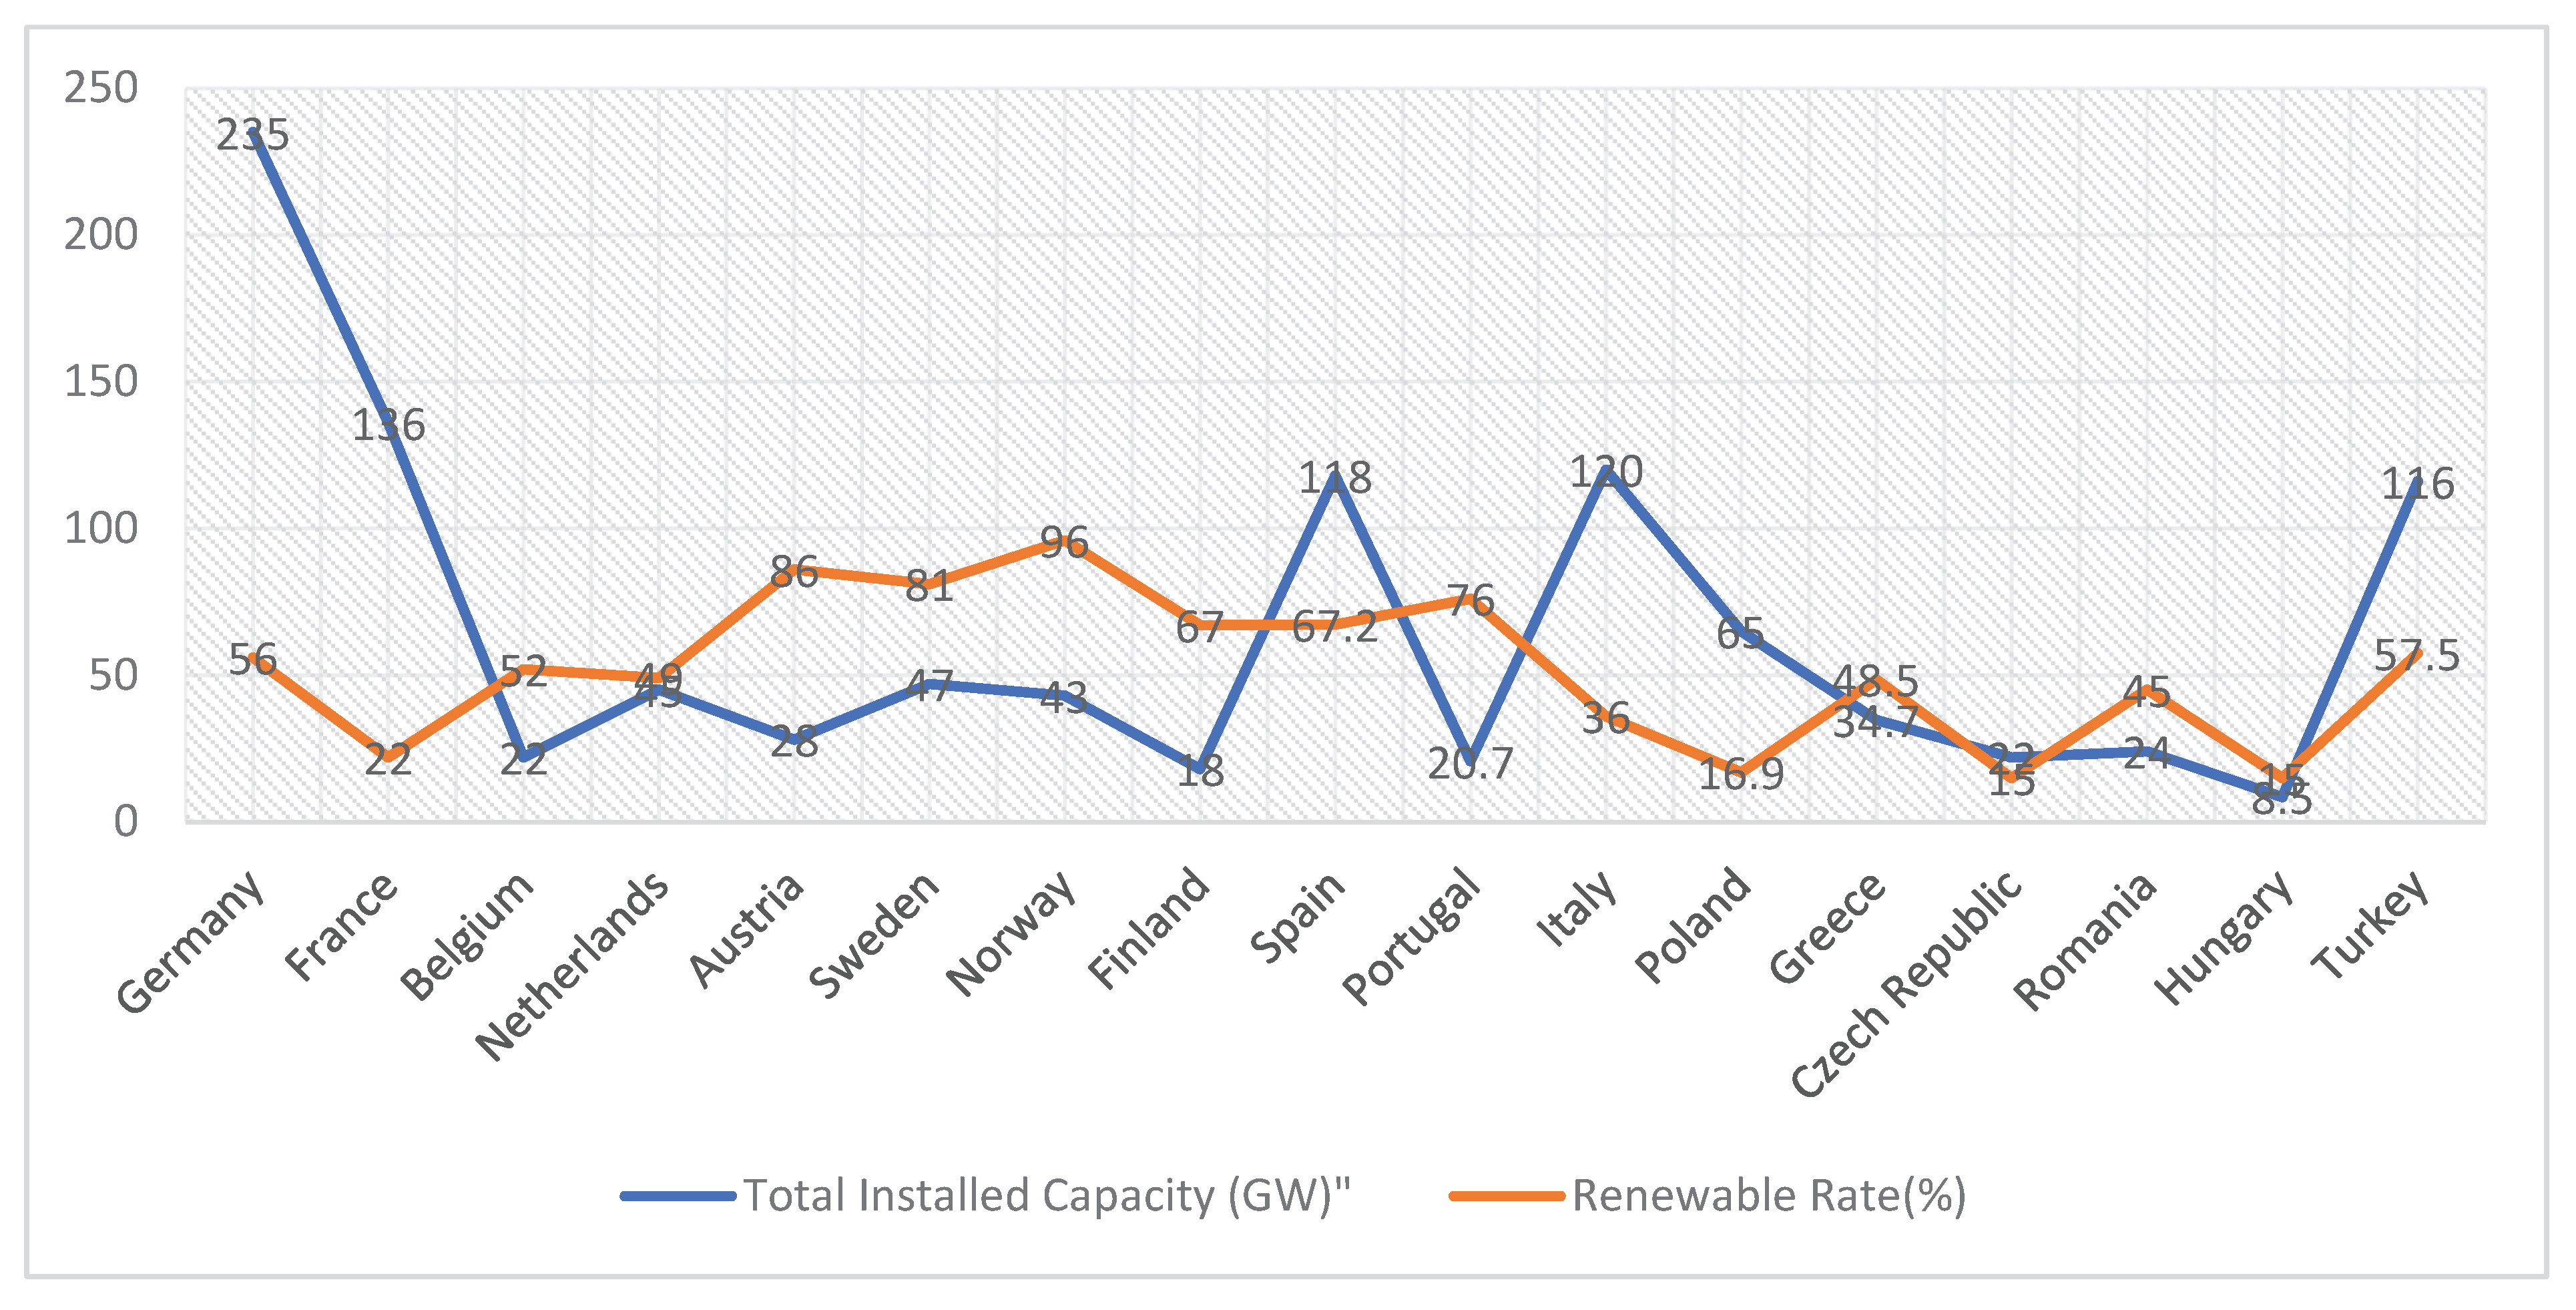
Figure 3.
Comparative findings showing the installed capacities and the share of renewable energy.
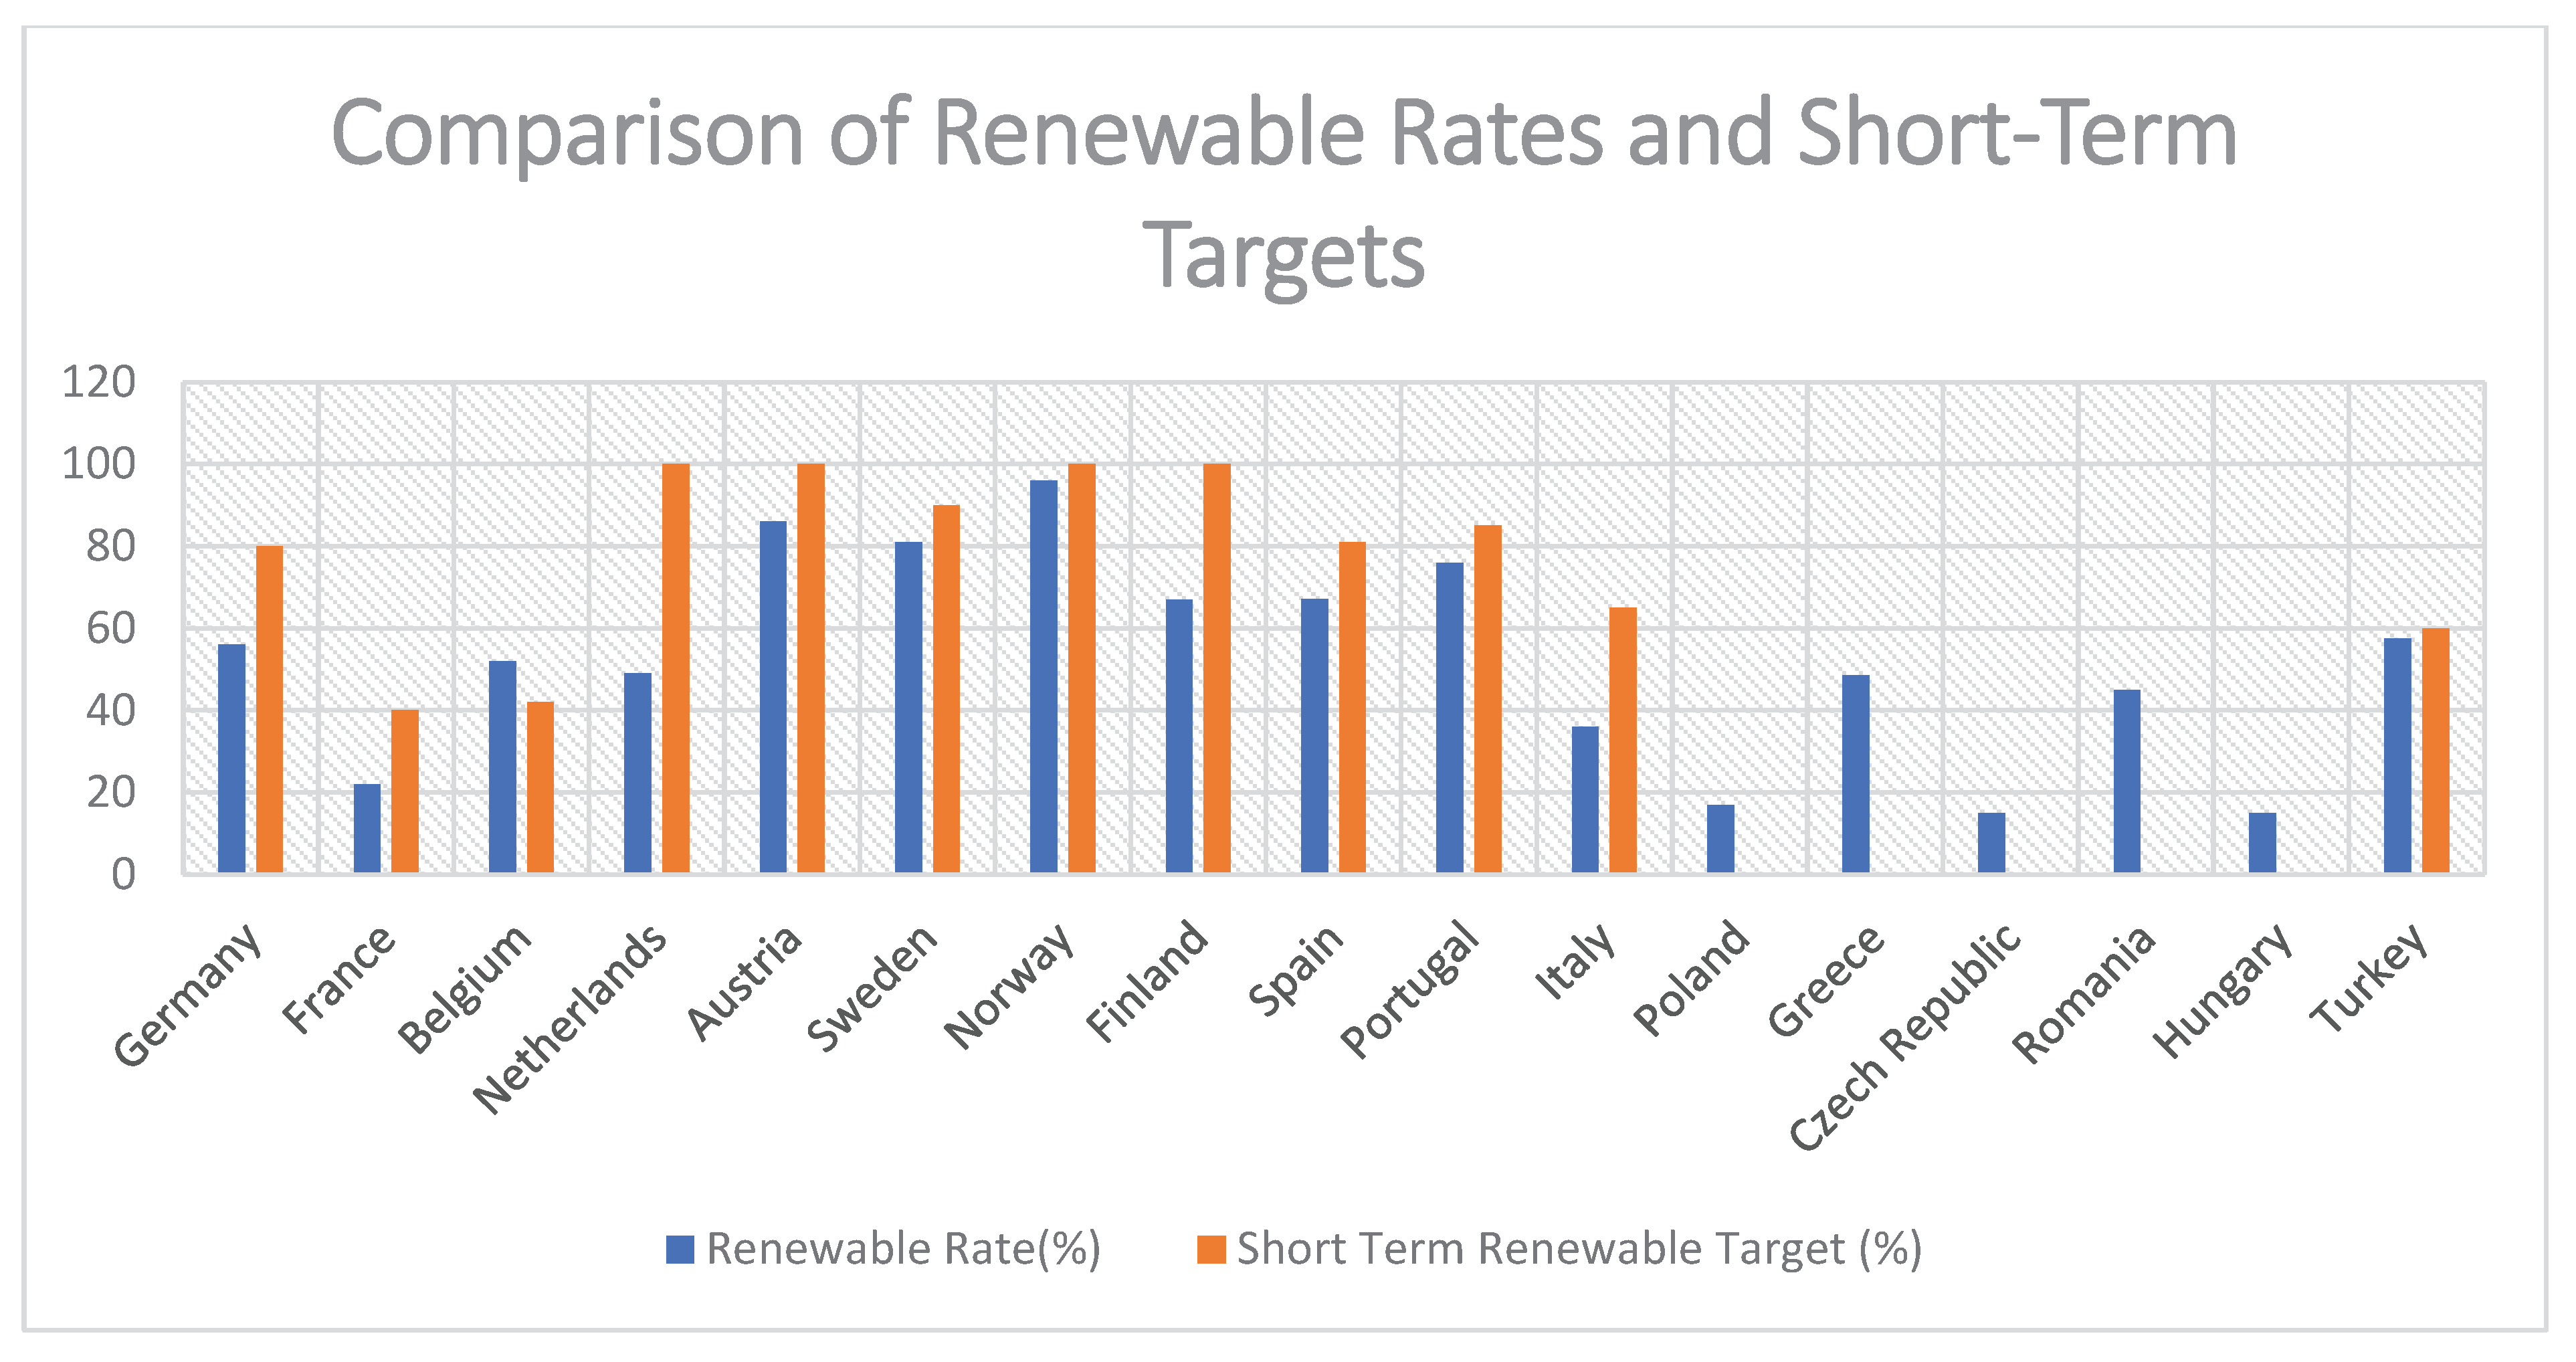
Table 1.
The EU Countries Where FIT Incentives Are Used and Their Prominent Features.
| Country | System Description | Benefits | Disadvantages | References |
|---|---|---|---|---|
| Germany | Germany rapidly expanded its PV capacity in the 2000s thanks to the FiT. | Investor security has been ensured, and the market has grown. | Burden on the public budget. | [35,36,37,38,39] [40,41,42,43,44] |
| France | FiT was particularly effective in rooftop systems. | Suitable for individual producers. | Limited to medium and large-scale projects. | [35,36,37,38,39] [40,41,42,43,44] |
| Italy | Conto Energia achieved PV growth, and Germany became a global leader after 2010. | Rapid capacity expansion. | System changes following cost increases. | [35,36,37,38,39] [40,41,42,43,44] |
Advantage: Market forecasting is provided to the investor, economic feasibility studies can be done in advance, and the accuracy rate is high. Disadvantage: It creates a burden on the public budget in the medium and long term. Example European Countries Implementing: Germany, France, Italy, Greece.
Table 2.
The EU countries where FIP incentives are used and their prominent features.
| Country | System Description | Benefits | Disadvantages | |
|---|---|---|---|---|
| Spain | With the transition to FiP after FiT, growth continued, and cost efficiencies were achieved. | Compatibility with market dynamics. | Complicated administration compared to FiT. | [45,46,47,48,49,50,51,150,151,152,153,154,155] |
| Netherlands | The SDE++ program brought stability to the sector and reduced costs. | Low public costs. | Less attractive to small producers. | [45,46,47,48,49,50,51,150,151,152,153,154,155] |
| Sweden | Thanks to FiP, renewable energy production increased, and system flexibility was achieved. | Integration into the certification system. | Impact of fluctuating market prices. | [45,46,47,48,49,50,51,150,151,152,153,154,155] |
Advantage: Alignment with market prices reduces the risk of economic fluctuations. Investors are supported by a shorter amortization period. Disadvantage: Creates a burden on the public budget. Market values, which are recalculated every period, create a complex market situation. Example European Countries: Spain, the Netherlands, Sweden.
Table 3.
Main Characteristics of Western Europe.
| Types of Incentives Applied | Feed-in tariffs, premium guarantees, investment supports, and certificate supports were provided. |
| Basic Principles of Incentives | Incentives were provided, prioritizing small and medium-sized projects. |
| Main Features | FIT implementation became the main incentive method. |
| Main Differences | Economic and environmental factors were incentivized together through projects such as SDEE+. |
Table 4.
The main characteristics of Northern Europe in terms of incentives and policy.
| Types of Incentives Applied | Green certificates, tax incentives, net metering |
| Basic Principles of Incentives | Small and medium-sized projects connected to local and regional grids, connected to distribution lines. |
| Main Features | Small-scale project support has been provided, and green certificate-focused incentives have been provided in collaboration with Sweden and Norway. |
| Main Differences | Incentives for large projects are lower compared to other regions. Due to low population density and residential structures, a focus has been placed on micro-power plants. |
Table 5.
The main characteristics of Southern Europe in terms of incentives and policy.
| Types of Incentives Applied | FIT, FIP |
| Basic Principles of Incentives | Maximizing energy potential |
| Main Features | In Italy, solar potential was effectively utilized through the Conto Energia program. |
| Main Differences | Cost-effectiveness incentives were also on the agenda in Spain and Portugal. |
Table 6.
The main characteristics of Eastern Europe in terms of incentives and policy.
| Types of Incentives Applied | Green Certificates, Investment Supports, Grants, FIT, Carbon Trading System | [86,87,88,150,151,152,153,154,155] |
| Basic Principles of Incentives | Developing renewable resources by prioritizing the PV sector | [86,87,88,150,151,152,153,154,155] |
| Main Features | Poland provides domestic PV production with green certificates. | [86,87,88,150,151,152,153,154,155] |
| Main Differences | The Czech Republic and Hungary provide renewable incentives by supporting SMEs. | [86,87,88,150,151,152,153,154,155] |
Table 7.
FIT values assigned to renewable resources under the Law on the Use of Renewable Energy Resources for Generating Electricity.
Table 7.
FIT values assigned to renewable resources under the Law on the Use of Renewable Energy Resources for Generating Electricity.
| Renewable Energy-Based Production | Applicable Prices (USD cents/KWh) |
| Facility Type | 7,3 |
| Hydroelectric Production Facility | 7,3 |
| Wind Energy-Based Production Facility | 10,5 |
| Geothermal Energy-Based Production Facility | 13,3 |
| Biomass Energy-Based Production Facility | 13,3 |
Table 8.
FIT values assigned to renewable resources within the scope of the law on the use of renewable energy resources for electrical energy generation.
Table 8.
FIT values assigned to renewable resources within the scope of the law on the use of renewable energy resources for electrical energy generation.
| Facility Type | Domestically Produced | Local Contribution Supplement USD cent/KWh |
|---|---|---|
|
Photovoltaic Energy |
0,8 | |
| 1) PV Panel Integration and Solar Structural Mechanics Manufacturing | 1,3 | |
| 2) PV Modules | 3,5 | |
| 3) Cells that Make Up the PV Module | 0,6 | |
| 4) Inverter | 0,5 |
Table 9.
Renewable Incentive Effectiveness Ranking (Score out of 50).
| Renewable Incentive Effectiveness Ranking (Score out of 50) | |||
|---|---|---|---|
| Country | Composite Score | Rank | Relative to Turkey (36) |
| Germany | 49 | 1 | Much higher |
| Netherlands | 44 | 2 | Higher |
| Austria | 43 | 3 | Higher |
| France | 42 | 4 | Higher |
| Spain | 41 | 5 | Higher |
| Portugal | 41 | 5 | Higher |
| Italy | 40 | 6 | Slightly higher |
| Turkey | 36 | 7 | — |
| Poland | 34 | 8 | Lower |
| Hungary | 33 | 9 | Lower |
| Romania | 30 | 10 | Lower |
Table 10.
Structural and Market Barriers.
| Structural and Market Barriers | |||||
|---|---|---|---|---|---|
| Country | Collective Housing Issue | Inflation Risk | Market Predictability | Local Production Incentive | Compared to Turkey |
| Germany | Low | Low | High | ✖ | More stable |
| France | Medium | Low | Medium-High | ✖ | Stronger regulation |
| Turkey | High | High | Medium-Low | ✔ | — |
| Poland | Medium-High | Medium | Medium-Low | ✖ | Similar challenges |
| Hungary | High | Medium | Low | ✖ | Weaker structure |
| Netherlands | Low | Low | High | ✖ | Better environment |
Table 11.
Detailed comparison results of Short and Long Therm Targets.
| Countries | Total Installed Capacity(GW) | Renewable Rate(%) | Short Term Renewable Target (%) | Future Provision Date | Long-Term Future Provision Targets |
|---|---|---|---|---|---|
| Germany | 235 | 56 | 80 | 2035-2045 | Carbon Neutral |
| France | 136 | 22 | 40 | 2050 | Carbon Neutral |
| Belgium | 22 | 52 | 42 | 2030-2050 | Carbon Neutral |
| Netherlands | 45 | 49 | 100 | 2030-2050 | Carbon Neutral |
| Austria | 28 | 86 | 100 | 2045 | 100% Renewable Energy |
| Sweden | 47 | 81 | 90 | 2030-2045 | Carbon Neutral |
| Norway | 43 | 96 | 100 | 2050 | Carbon Neutral |
| Finland | 18 | 67 | 100 | 2035-2050 | Carbon Neutral -Green Hydrogen |
| Spain | 118 | 67,2 | 81 | 2030 | Green Hydrogen |
| Portugal | 20,7 | 76 | 85 | 2030 | - |
| Italy | 120 | 36 | 65 | 2030 | - |
| Poland | 65 | 16,9 | x | 2030 | 22 GW Renewable Capacity Increase |
| Greece | 34,7 | 48,5 | x | 2030 | Increasing Renewable Energy Capacity to 28 GW |
| Czech Republic | 22 | 15 | x | 2030 | Eliminating Coal Use |
| Romania | 24 | 45 | x | 2030 | 6.9 Renewable Capacity Addition |
| Hungary | 8,5 | 15 | x | 2030 | Movement to Green and Carbon-Free Resources |
| Turkey | 116 | 57,5 | 60 | 2030-2053 | Carbon Neutral |
Table 12.
Overall Renewable Capacity and Target Achievement.
| Overall Renewable Capacity and Target Achievement | ||||
|---|---|---|---|---|
| Country | Installed Capacity (GW) | 2024 Renewable Share (%) | 2030 Target (%) | Compared to Turkey (57.5%) |
| Germany | 235 | 56 | 80 | Similar (but more ambitious) |
| France | 136 | 34 | 40 | Lower performance |
| Italy | 120 | 40 | 65 | Lower but accelerating |
| Spain | 118 | 44 | 81 | Higher target |
| Turkey | 116 | 57.5 | 60 | — |
| Austria | 28 | 86 | 100 | Higher share, more ambition |
| Norway | 43 | 96 | 100 | Much higher achievement |
| Poland | 47 | 16. Eyl | 45 | Much lower |
| Hungary | 8.May | 15 | 50 | Much lower |
Table 13.
The short- and long-term incentives implemented by Turkey and leading EU countries.
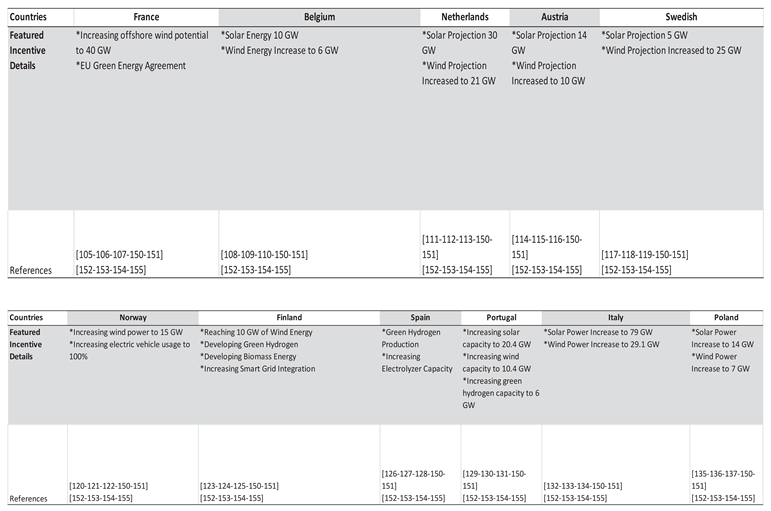
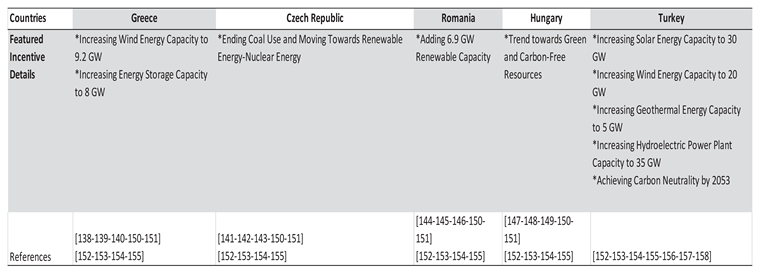
Table 14.
Long-term Renewable Targets.
| Long-term Renewable Targets | |||
|---|---|---|---|
| Country | 2030 Target (%) | 2050 Target | Compared to Turkey (60% by 2030) |
| Germany | 80 | Carbon neutrality 2045 | More ambitious |
| France | 40 | Carbon neutrality 2050 | Less ambitious (2030) |
| Portugal | 85 | Full decarbonization | More ambitious |
| Turkey | 60 | Carbon neutrality 2053 | — |
| Poland | 45 | TBD | Less ambitious |
| Hungary | 50 | Carbon-free electricity | Similar |
Table 15.
Structural Barriers to Rooftop Solar Adoption.
| Country | Individual Housing Prevalence | Net Metering Implementation | Compared to Turkey |
|---|---|---|---|
| Austria | High | Fully integrated | Much better |
| Spain | Medium | Strong support | Better |
| Germany | High | Municipal-scale systems | Better |
| Turkey | Low (collective housing) | Revised 2023 | — |
| Poland | Low | Limited | Similar |
| Hungary | Low | Developing stage | Similar |
Table 16.
Policy Complexity and Incentive Mechanisms.
| Policy Complexity and Incentive Mechanisms | |||
|---|---|---|---|
| Country | Incentive Structure Complexity | Key Incentives | Compared to Turkey |
| Germany | High | FiT, Auctions, Carbon Trading | More diversified |
| France | Medium-High | Offshore Tenders, Tax Exemptions | More project-based |
| Netherlands | High | SDE++, CO2 Metrics, Loans | More market-based |
| Turkey | Medium | FiT, YEKA, Tax Incentives | Reference |
| Poland | Low | Basic FiT, Grants | Less diversified |
| Hungary | Low | Tax Relief, Public Grants | Less market-focused |
Disclaimer/Publisher’s Note: The statements, opinions and data contained in all publications are solely those of the individual author(s) and contributor(s) and not of MDPI and/or the editor(s). MDPI and/or the editor(s) disclaim responsibility for any injury to people or property resulting from any ideas, methods, instructions or products referred to in the content. |
© 2025 by the authors. Licensee MDPI, Basel, Switzerland. This article is an open access article distributed under the terms and conditions of the Creative Commons Attribution (CC BY) license (http://creativecommons.org/licenses/by/4.0/).
Copyright: This open access article is published under a Creative Commons CC BY 4.0 license, which permit the free download, distribution, and reuse, provided that the author and preprint are cited in any reuse.


