
Submitted:
25 August 2025
Posted:
26 August 2025
You are already at the latest version
Abstract
Soil electrical conductivity (ECe) is a key indicator of soil salinity and sustainability, particularly in semi-arid and arid regions. Estimation of ECe is vital for managing soil salinity and ensuring crops productivity. A multi-tool approach that integrates statistical
software, various soil parameters, including Texture, SOC, TN, CEC and EC 1:5, measured, was applied to predict ECe and develop a robust predictive model. The performance of each pedotransfer function was systematically evaluated, demonstrating a significant accuracy: PTFs (1) yielded an R2 value of 0.85, PTFs (2) shows a R2 of 0.71 for Stepwise regression model, another PTFs (3) has developed with an R2 of 0.84, Lasso/Ridge re-gression as PTFs (4) achieved an R2 value of 0.89, lastly the PTFs (5) model provided an R2 of 0.83. Our findings revealed a regional variation in soil salinity, with certain areas showing elevated ECe levels that could potentially affect environment sustainability. Consequently, C-Predictive Regression Tree (C-RT), highlighted the importance of integrating non-linear approaches to improve predictive accuracy, presenting an R2 of 0.77. This research underscores the importance of PTFs in predicting soil salinity from soil properties, especially EC1:5 provides valuable insights for sustainable soil management strategies in Northeastern Tunisia.
Keywords:
soil
; ECe
; EC1:5
; salinization
; pedotransfer functions
; north east Tunisia
1. Introduction
Soil salinity represents one of the most critical environmental challenges, determining the suitability of soil for agriculture and crop production, and posing a threat to environmental sustainability particularly in arid and semi-arid regions where irrigation with poor water quality is commonly used [1,2,3,4,5].
Salinization, in arid and semi-arid regions is often exacerbated by climate change and overuse of saline water in irrigation. High temperature and insufficient rainfall alter the hydrological cycle, leading to water deficits that fail to meet crop water requirements. In addition, frequent and intense evaporation events cause salt accumulation in root zone, further reducing crop productivity [6,7]. Globally, soil salinity reduces the availability of essential nutrients (especially carbon and nitrogen) for plant uptake and interferes with microbial activity. Many studies, have shown that salinity can alter soil organic carbon (SOC) dynamics, influencing the release of greenhouse gases (GHGs) such as carbon dioxide (CO2), methane (CH4), and nitrous oxide (N2O), with outcomes that vary depending on soil conditions [8,9]. However, salinity is a major global issue that contributes to soil degradation causing desertification and damaging approximately 350 million hectares [10]. Over time, inadequate agriculture methods, such as irrigation with saline water and ineffective drainage systems, combined with climate change, have significantly led to soil salinization [11,12]. Human-induced factors, including improper irrigation techniques and insufficient drainage infrastructure, compromise environmental sustainability by reducing soil fertility, lowering crop yields and diminishing biodiversity. These factors also intensify desertification by disrupting plants growth cycles, biomass production, and nutrient cycling. In a broader sense, salinity endangers food security by reducing crop productivity through land degradation, thereby exacerbating environmental decline. This underscores the urgent need to detect and predict soil salinity in order to prevent ecological degradation and to implement effective mitigation strategies for soil and biodiversity conservation [13]. Today, global population growth and rising food demand are placing increasing pressure on land resources, while salinized areas are expanding at a rate of approximately 1 to 2 million hectares per year [14]. Climate change further intensifies the degradation of these valuable salt-affected lands. Additionally, salinity reduces crop yields by impairing plant growth through mechanisms such as ion toxicity, osmotic stress, and mineral deficiencies [15]. As a major environmental threat, salinity not only compromises agricultural productivity and environmental sustainability, but also exerts negative socioeconomic impacts, including reduced food security, increased poverty and lower profits for farmer [16]. Other studies showed that salinity has affected approximately 1 billion hectares of land, equivalent to 7% of the earth's continental surfaces. [17,18].
This widespread phenomenon poses a serious threat to environmental integrity and human well-being. Consequently, detecting and monitoring soil salinity has become a research priority to better understand its linkage with land degradation and to support the development of sustainable agriculture strategies [5,19,20]. While recent studies have shown that overexploiting aquifers, particularly in arid and semi-arid regions, leads to secondary salinization of soil and water resources, others neglect to explore the relationships between salinity and soil biogeochemistry, land use, and biodiversity [21,22].
Although salinization has a severe economic impact, as reported by [23], who estimated annual global revenue losses of approximately $27.3 billion, it continues to challenge farmers and local economies. Salt-affected areas currently extend over an estimated 935 million hectares worldwide, with around 70% are located in arid and semi-arid regions, including Africa, China, the Middle East and various Asian countries [10]. These ecological, socio-economic, and environmental consequences have increasingly driven research efforts toward the prediction of soil salinity. In particular, there is the growing interest in developing robust models based on easily measurable in-situ soils parameters, such EC 1:5, pH, and others, to facilitate salinity estimation and support the implementation of sustainable soil management strategies. Salts consist of electrically charged ions derived from natural resources, such as shallow groundwater, and anthropogenic inputs, including fertilizers and low-quality irrigation water.
Studies conducted by [14], define the anthropogenic salinization as a form of secondary salinization resulting from improper management practices. The latter reduce the soil capacity to support high quality crop production and disrupt normal plant growth. The main causes of this type of salinization include:
- (i)
- irrigation using brackish or saline water, often characterized by moderate to high solute concentration;
- (ii)
- irrigation of soils containing naturally occurring fossil salts, especially in arid and semi-arid regions;
- (iii)
- deposition of salt-particles from marine aerosols;
- (iv)
- rising saline water tables, often associated with deforestation and poor drainage infrastructure.
Several studies [15,24], have also highlighted that secondary salinization results from the combined effect of low-quality irrigation water, inadequate drainage systems and excessive use of fertilizers. Globally, 20% of irrigated areas are affected by anthropogenic salinization [25]. Salinity is measured using either the electrical conductivity of the saturated paste extract (ECe) or the 1:5 soil-to-water extract (EC1:5). The saturated paste method (ECe) involves preparing a soil paste at saturation point, followed by the extraction of the solution for conductivity measurements. Although this method is time-consuming and relatively expensive, it provides a reliable estimate of the concentration of soluble salts at field saturation [27]. It’s the reference parameter used for classify soils and evaluate the grade of soil salinity for crop suitability. The 1:5 soil-to-water extract method (EC 1:5) is a widely used alternative for assessing soil salinity. It is simpler, less time-consuming, and more cost-effective than the saturated paste method. EC 1:5 involves mixing soil and deionized water in a fixed 1:5 ratio, allowing for standardized procedures and the development of conversion factors to estimate Ece [27]. However, this method may not accurately fit for all soil types, particularly for clay-rich soils, due to their high buffering capacity and water retention characteristics. Electrical conductivity, typically expressed in dS.m-1, is an essential parameter in agriculture for characterizing soil–water–plant interactions under saline conditions. It reflects the concentration of soluble ions in the soil solution: the higher the ion concentration, the greater the electrical conductivity. As salts dissolve in water, they dissociate into charged ions capable of conducting an electric current, making EC a reliable indicator of soil salinity.
Throughout the last century, various prediction methods of soils salinity have been established, including statistical, remote sensing and machine learning methods, which have greatly impacted global researchers for boosting strategies for environmental sustainability. Soil degradation is further exacerbated by the expansion of irrigated agricultural areas, leading to a continuous increase in salt affected soils. Tunisia is one of the countries severely impacted by this phenomenon. Northern Tunisia, in particular, represents a typical semi-arid area characterized by high temperature and moderate precipitation, groundwater table and elevated concentrations of soluble salts.
Conventional methods for predicting soil salinity often face limitations due to insufficient data availability and their inability to capture complex interactions among soil properties. The northeastern region of Tunisia, namely the focus of the study, is one of the country’s most important agricultural areas covering approximately 12 032 Km2 and accounting for nearly 60% of the national wheat production [28]. This region is characterized by moderate levels of soil organic carbon (SOC) and high soil salinity, along with considerable spatial variability in soil properties. Such heterogeneity underscores the need for accurate predictive models capable of estimating ECe [29].
Soil salinity poses a major challenge for irrigated agriculture in this area, affecting most crops and leading to severe effects such as nutrients imbalances, degradation of soil fertility, deterioration of physical properties and reduced crop productivity [30].
In the present study, the field survey was conducted with a random sampling strategy, where sub-surfaces soil samples are collected depending on specific diverse crop cultivation, water irrigation sources, soil textures across Manouba province, in north-east of Tunisia. The goals were: (i) develop robust Pedotransfer functions (PTFs) for predicting ECe based on easily measurable soil properties; (ii) identify the most effective covariates to support practical prediction tools for farmers and to promote sustainable soil use; (iii) identify areas in Manouba province, a semi-arid land within the Mediterranean basin of Tunisia, that are prone to salt accumulation; (iv) provide practical recommendations for sustainable soil management by developing accurate models to determine salinity. The innovative aspects of the study involve the improvement of the accuracy of ECe prediction by integrating multi-statistical techniques.
2. Materials and Methods
2.1. Study Sites
This study was conducted in Tunisia; a region located in Northern Africa between latitudes 32° and 38° North and longitudes 7° and 12° East. Known for its geographical diversity, with its northern areas influenced by the Mediterranean Sea and the south bordered by the Sahara Desert. This variation contributes to a different range of climate conditions, including dry summers and wet winters, making it susceptible to soil salinity degradation [31]. The investigated area was specifically Manouba province, situated in the northeastern part of Tunisia. The study area covers approximately 1,137 km², representing about 1.12% of Tunisia’s total surface area. It is geographically located around 36°4’28” N latitude and 10°6’4” E longitude (Figure 1). Characterized by a Mediterranean climate, the mean annual rainfall is about 450 mm year-1, and the average temperature is approximately 18.7°C.
The governorate is known for its varied topography, which includes hills and fertile plains. Such diversity makes it an ideal area for exploring soil salinity and its impact on crop productivity and food security [29]. Manouba province, known by the important number of irrigated perimeters, the majority of them were established after Tunisia independence, shows a crucial expansion of water management infrastructures and drainage systems [32]. Studies show the predominance of alluvial soil formations characterized by limestone series ranging from continental Mio-Pliocene to middle-upper Pleistocene. The lithology of the area includes an alternation of clayey deposits of limestone crusts, varying according to the topography, soils and types of crops [33].
Soil samples were collected during the dry and wet seasons (2022-2024), using a random sampling strategy to ensure a global representative distribution of soil characteristics across the province. A total of 46 soil samples were gathered from most of the region’s agricultural plots (Figure 1). Sixteen samples were obtained from the southern part of the Medjerda River, particularly within the Jedeida district. Additional ten samples were collected from the northern side of the Medjerda River. Overall, the remaining 20 samples were collected across the entire province to ensure a spatial coverage. Moreover, samples coordinates were recorded by GPS, considering the topography and landscape characteristics. This geospatial data will ensure a precise mapping and analysis of soil salinity patterns across the region. Our sampling strategies permits the capture of the natural soil variability (physico-chemical properties and salinity), provides a comprehensive dataset for salinity analysis. As a result, in order to empower soil management strategies, predicting soil electrical conductivity provides a precise evaluation of soil salinity across various soils classes within Manouba province. According to the WRB classification, the sampled soils predominantly correspond to Calcisols, with two samples (M1 and M2) identified as Acrisols.
2.2. Soil Chemical-Physical Analyses
Laboratory analyses were conducted to characterize the physical and chemical properties of the soil samples, following a standardized multi-step preparation process to ensure reliable results and support the development of predictive models for soil electrical conductivity (ECe). Soil samples were collected from the topsoil (0–20 cm depth), air-dried, manually ground, and sieved through a 2 mm mesh to remove coarse fragments and organic debris. The processed samples were then stored in labelled plastic bags prior to analysis. The following methods were used for determining soil properties
- Sedimentation method was used to determine soil texture;
- Walkley-Black method was used for soil organic carbon (SOC) measurement.
- kjeldhal digestion method was used for determining Total Nitrogen levels;
- BaCl₂-MgSO₄ complexometric titration method using EDTA (Ethylene-diamine-tetra-acetic acid) as titrant was used for measuring Cation Exchange Capacity (CEC);
- Soil pH was measured in a 1:2.5 soil-to-water suspension.
Finally, two complementary methods were used for measuring the electrical conductivity, namely the EC 1:5 and the ECe methods:
(i) EC 1:5 method: 20 g of soil were mixed with deionized water in a 1:5 ratio, shaken at 150 rpm for 120 minutes at 25°C, and then filtered. The electrical conductivity of the supernatant was measured using a conductivity meter.
(ii) Saturated paste extract (ECe): 200 g of soil were gradually moistened and mixed until a saturated paste consistency was achieved, as described by [26]. The paste was covered and left to equilibrate for 24 hours at room temperature. The pore water was then extracted using suction filtration with Whatman no. 42 filter paper in a Buchner funnel, and its conductivity was measured using a standard conductivity meter.
2.3. Data Elaboration
Descriptive statistical analysis was performed using Excel (Microsoft office plus, 2019), to determine the distribution of the data, including the calculation of means, medians and standard deviations (Table 1). R (4.4.1 version) and Tanagra data mining software (1.4 version) were used for advanced statistical analysis and predictive modelling of ECe distribution. The integration of these multi-tools streamlined the development of a robust and multi pedotransfer-functions of the soil salinity prediction. Regression is a data mining technique used to model the relationship between variables by fitting an equation to a data set. There are two types of linear regression: Simple Linear Regression (SLR) who involves one dependent (outcome or response) variable and one independent (predictor or explanatory) variable, uses the equation of a straight line. The relationship between ECe and EC 1:5 has been described and collected models to predict salinity by [34]. We selected PTFs used and applied from different studies from literature to predict electrical conductivity from soil parameters [34]. The selection was based on EC 1:5 measured in the laboratory as input variables, and ECe as output.
PTFs selected in this study, particularly for clayey soils in arid and semi-arid regions similar to north Tunisia. The two PTFs were presented on the following Eqs I and II, results are shown on Table 2:
[35] model: ECe = 6.53 × EC 1:5 - 0.108 Eq. I
[36] model: ECe = 9.70 × EC 1:5 Eq. II
Generating a new PTFs, based on the following steps; Calibration and validation procedures. Starting with building new models using the ancient equations developed by other researchers, selected in Table 2 as calibration procedure. Then, changing the PTFs parameters in the equation as a validation procedure to establish a new one [37].
The second type of regression is the Multiple Linear Regression (MLR) applied to the entire dataset, with ECe as the dependent variable (target). Input variables including Soil Organic Carbon (SOC), Total Nitrogen (TN), Cation Exchange Capacity (CEC) and other soil characteristics, were selected based on their known influence on soil electrical conductivity. Another part of our work focused on outliers detection, as an important step to evaluate the influence of each observation. [38], in their research mentioned that outliers deviate from other observations and appear inconsistent with the rest of the data.
The models were evaluated by calculating the predictor errors as the mean absolute error which measure the average absolute magnitude of errors (MAE), the mean squared errors, which measure the average square magnitude or error (MSE), the root mean squared error (RMSE), measuring the square root of the average squared magnitude of error and the coefficient of determination (R²), which indicates the proportion of variance in the observed values that is explained by the model. Higher R² values suggest a better fit between predicted and observed data [38]. Whether simple or multiple, regression models can fit more complex models by using advanced techniques which incorporate more than one input variables.
3. Results
The collected samples contain a range of soil textures classes, including sandy loam, clay loam, and silt loam soils. Each sample was analyzed for key parameters such as Soil Organic Carbon (SOC), Total Nitrogen (TN), Cation Exchange Capacity (CEC), pH, Clay, Sand and Silt contents, EC 1:5, which are essential for understanding soil health and predicting electrical conductivity (ECe) (Table 1).
The Coefficient of Variation (CV%), that is one important index resuming the variation or heterogeneity for each parameter measured, highlights the variability of our soils characteristics. For the soil salinity indicators EC 1:5 and ECe, shows a significant variability, with an important coefficient of variation (CV%) values of 215.94% and 110.46%, respectively. This large range of salinity levels throughout the Manouba province, revealed the diversity of soil classes and conditions that may require different management strategies for soil health and sustainability. Meanwhile SOC (2.18%), and total nitrogen (4.25%) presents very low CV% values, showing a homogenous (uniform) soil characteristics across the study area. In contrast, CEC display a moderate CV% (38.58%) suggesting few variabilities for soils nutriments retention capacity.
As texture is a significant parameter in our studies, including clay (5.41%), silt (5.02%), and sand (5.63%), present a very low CV% values, this leads that soil textures of our samples across the study area are consistent. Understanding the soil properties variation is critical step to develop soil salinity predictions models for implanting efficiency soil management strategies.
For the predictive statistics and multiple linear regression models, only variables demonstrating statistical significance at the 0.01 level were used into predictive equations and incorporated in the final results. The reliability of the model was evaluated using the percentage of variance explained (R2 values). Using all the available parameters, multiple linear regression (MLR) was employed to evaluate the combined effects of soil properties on electrical conductivity at saturation (ECe). The MLR resulted on the following Eq.1:
(1)
The developed pedotransfer-function shows a strong predictive capability with an R2 of 0.85, demonstrating that 85% of the variance of ECe observed data is explained by the model. As for the prediction errors; MAE of 0.80, RMSE of 1.11, moderate and confirm the homogeneity distribution of errors.
Overall, this PTF is derived from only 46 samples. The limited number of explanatory variables also restricts the equation's applicability.
Consequently, additional multiple linear regression (MLR) analyses were performed by incorporating others textural parameters (silt and sand content) consistently yielded the same explained variance, but with slightly difference in R2. The procedure used in this part initially was a Stepwise linear regression model (Eq.2) and MLR model (Eq.3) containing all soil parameters, to predict ECe, which allowed independent variables to be added or eliminated at each step of the regression, ultimately refining the model to include only the significant factors.
(2)
The Stepwise linear regression model shows a mean absolute error (MAE) of 0.829, and a root mean squared error (RMSE) of 1.160. the fact of RMSE is slightly higher than MAE with R2 of 0.71 suggest the presence of some predictors. However, this model presents a useful predictive accuracy.
(3)
The model predicts ECe with high accuracy, demonstrating an average error (MAE) of 0.81 lower than a typical RMSE of 1.10. An R2 of 0.84, alongside long errors values, confirm the strong predictive performance of the PTF.
In order to improve the predictions, two linear regressions models were conducted, the Ridge and lasso regression, presented on the following Eq.4.
(4)
Lasso and Ridge regression both improve ECe prediction with a higher R² of 0.89, a slight high error is showed in Ridge regression (MAE= 0.85, RMSE=1.13). While Lasso demonstrates a more accuracy model with similar predictor errors values a more (MAE =0.81, RMSE= 1.12). Following the clustering process, selection of crucial predictors of soil electrical conductivity, another pedotransfer-function (PTFs) was developed using electrical conductivity of saturated paste (ECe) as dependent variable while the optimal predictor variables selected were soil organic carbon (SOC), total nitrogen (TN), Cation exchange capacity (CEC), and EC 1:5.
The fifth PTFs resulted in Eq.5:
(5)
This PTF demonstrates strong capability and predictive performance, with a R2 of 0.83, a low MAE of 0.82 and RMSE of 1.157. These values show a consistent and accurate predictive model with minimal errors across the data. Conducting a MLR analysis on a large dataset would be immensely time-consuming. Leading to perform with C- predictive regression tree models (C-RT), where outcomes reveal a tree containing 3 leaves displayed the best results, with the lowest mean squared error (MSE) during both the growing (1.1579) and pruning (2.9832) stages. This configuration showed the minimum standard error (SE) of 1.6202. Trees with a smaller number of leaves generally presented reduced MSE values, suggesting superior accuracy in predicting the target variable. In conclusion, the 3-leaf tree structure demonstrated the optimal performance for prediction soil salinity, creating a best balance between model complexity and error minimization
Tree Visualization:
•EC 1:5 < 0.7100 then avg (ECe)=1.5458 (std.dev=1.0466 with 21 examples (70.00%))
•EC 1:5 >= 0.71000
├── EC 1:5 < 8.4150 then avg (ECe)= 4.4012 (std.dev=1.3537, with 8 examples (26.67%))
└── EC 1:5 > 8.4150 then avg (ECe)= 11.2400 (std.dev=-99999.0000, with 1 example (3.33%))
The data is categorized by the C-RT regression tree using EC 1:5 measurements to estimate ECe. As EC 1:5 values below 0.7100, the ECe average is 1.5458, englobing 70% of the samples. When EC 1:5 surpasses 0.7100, the tree splits further to two more categories. Results suggest that ECe averages increase from 4.4012 for values under 8.4150 and to 11.2400 for those exceeding 8.4150. However, the group created with EC 1:5 > 8.4150 contains one sample (few examples), an atypical result. The C-RT regression algorithm split our dataset into two categories: a growing set and a pruning set. This algorithm generates a maximum number of trees that fits with the growing set, while assessing subtrees using the cost-complexity principle. The pruning set is utilized to quantify regression error (RE). The final result tree displayed a predictive accuracy for soil electrical conductivity (ECe), accounting a reduction in RE, confirming the effectiveness of removing unnecessary branches.
Both SLR and MLR models were applied to assess soil electrical conductivity prediction and soil covariates capability. Figure 2 illustrate the predicted ECe values based on single covariates EC 1:5, with R2 of 0.83, highlighting the alignment relationships between observed and predicted data. Alternatively, Figure 3 represent the ECe predicted by MLR, with R2 of 0.83 also, showing a significant correlation across the observed and predicted dataset.
Table 2 resume all the predictive pedotransfer-functions developed by a multi-tool statistical approach, either the tested SLR models that correlate with soils classes and textures in semi-arid region of Northeastern Tunisia.
4. Discussion
This research presents a comprehensive assessment of soil salinity in Northeast Tunisia, using a diverse set of statistical software to develop 5 predictive Pedotransfer functions (PTFs).
The high R2 values of 0.85 for PTFs (1) developed by Excel, R2 =0.83 of PTFs (5) generated by Tanagra, and PTFs (4) with R2 of 0.89 determined with R, highlighted the strength of these models in predicting electrical conductivity (ECe). These findings underscore the major role of various soil characteristics such as soil organic carbon, total nitrogen, cation exchange capacity, soil texture, and EC 1:5 in determining the ECe. However, a minimal difference in predictive accuracy has been remarked (R² = 0.85 vs. 0.83) highlighting the effectiveness of adding soil parameters, such as calcium carbonates (CaCO3), as covariates for multiple linear regression (MLR). The first PTF shown slightly a better performance with R² = 0.85, displaying the importance of incorporating all soil properties to determinate ECe. Nevertheless, using an advanced data response, stepwise linear regression model including its capabilities and adaptability in data handling, access to complexes analysis, shows how variable selection can create an efficient second PTF with R2=0.84. Some studies align with our approach that emphasized the importance of selecting predictors to specific modelling and research goals. The salinity predictions highlighted the importance of identifying significant predictors to maintain models predictive accuracy while reducing complexity and redundancy. The first PTF shown a better performance with R² = 0.85, presenting the importance of incorporating all soil properties to determinate ECe. Alternatively, regression techniques such as multiple linear regression (MLR), stepwise linear regression (MLSR), and lasso/ridge regression are more evident to predict a dependent variable using one or more independent variables.
For time-consuming and accuracy, it is essential to select the important covariates from all the measured soil parameters [39]. Stepwise linear regression model is a combination of forward and backward elimination of inputs, including its capabilities and adaptability in data handling to generate a best model [40,41]. This regression technique is an available method for access to complexes analysis by eliminating the multicollinearity problem between covariates, demonstrates an efficient second PTF with R2=0.84. [42], in his research in south Algeria, align with this approach, using a stepwise regression to ensure soil salinity prediction through soil covariates selection.
Similarly, the identification of organic carbon, total nitrogen, and CEC as key predictors matched with study’s findings by [43], on soil salinity in arid and semi-arid regions. Although, linear models provided effective predictions, the C-Predictive Regression Tree (C-RT) model achieved either an optimal results with R² = 0.77 by capturing non-linear relationships between variables. This suggests that non-linear approaches can enhance predictive capabilities, particularly in heterogeneous soils with complex interactions. Other research conducted by [44], has shown that non-linear models perform well in predicting salinity, especially in areas with heterogenous soil types and poor water management strategies. Reliability of this approach is crucial for promoting sustainable soil management in north-east Tunisia, where salinity poses a significant problem to agricultural productivity and soil health. Regression models represent the significant impact of soil properties as EC 1:5, soil organic carbon, clay content, and cation exchange capacity (CEC) on predicting electrical conductivity at saturation (ECe). As R² values, ranging from 0.83 to 0.89, models obtained displayed a robust predictive capability due to the optimal chosen predictors. The simple linear regression models using one predictor EC 1:5, including the two tested models of [35,36], are particularly applicable to clayey soils in arid and semi-arid climates, for our soils they demonstrated a robust accuracy with R2 of 0.89. The inclusion of additional soil parameters in MLR significantly improved the models efficiency, confirmed by [45], on his findings he underscores the importance of EC 1:5 and soil organic carbon in the evaluation of the potential of machine leaning to predict soil salinity and mapping.
The first PTF demonstrated strong predictive power with an R² of 0.85, regarding the importance of pH, soil organic carbon, and CEC in predicting soil salinity. On behalf, three PTFs generated from our results, including stepwise regression, MLR, lasso and ridge offered insights into variable selection by reducing predictors to EC 1:5 and pH or adding others soil parameters while maintaining a robust R² ranging from 0.71 to 0.89. The MLR model with R2= 0.84 improves predicting soil electrical conductivity by focusing on key predictors (Textures, pH, soil organic carbon, total nitrogen ...).
However, Ridge and Lasso regression models generates further a predictive performance with R² = 0.89, showing their ability to define multicollinearity with many variables. Seems lasso/Ridge linear regression is the star player here, optimized variable selection, while both stepwise linear regression and MLR, confirmed the relationships between soil covariates selection and ECe prediction. Those three pedotransfer-function providing the best soil electrical conductivity estimation due to the optimization of variable selection, this outcome aligns with [45] observations on the superior performance of regularization techniques in salinity prediction. This research study holds significant practical implications for sustainable soil management in Northeast Tunisia, were salinity poses a critical problem to crop productivity. The developed models can inform farmers interventions, including managing irrigation practices, optimizing drainage systems and modifying soil characteristics to combat salinity. For instance, a study in the United Arab Emirates (UAE) conducted a region-specific relationship between ECe and TSS in Abu Dhabi soils, diverging from the standardized relationships by the US Salinity Laboratory Staff (1954) [46]. This divergence highlights the necessity for calibration in salinity measurement techniques, in order to reinforce the approach for forecasting clayey soils in northeastern lands of Tunisia.
Studies in Morocco, have been integrated soil and water management practices with the cultivation of salt-tolerant crops to mitigate soil salinity [43]. The Moroccan experience displays the importance of combining different statistical methods in order to estimate soil hydraulic properties, using soils covariates like clay and silt contents, soil organic carbon, they found that multiple linear regression models using performed best than Cubist algorithm, regression tree and Random Forest, which aligns with the multi-tool approach used in this study [43].
A final pedotransfer-function (5) generated with a variable selection, showed a R2 of 0.83. Hence, ECe is the reference parameter for soil classification and for the determination of the grade of soil salinity in agricultural plots. Although the C- predictive Regression Tree (C-RT) model achieved a high accuracy (R² = 0.77), indicating a non-linear relationship that linear models might overlook. [47] in his research, emphasized the advantages of non-linear methods(N-MBL) algorithm using visible near-infrared (vis-NIR) spectroscopy in regions with heterogeneous soils, especially with complex interactions between soils variables. This suggests that integrating non-linear approaches can significantly enhance predictive accuracy, particularly when soil properties have a complex interaction. By accurately predicting areas at risk of high salinity, the models developed can guide agricultural practices and policy decisions to prevent soil degradation.
For example, regions identified with elevated ECe levels can be selected for specific management interventions such as leaching, optimizing drainage, or starting salt-tolerant crops cultivation [48].
For this study, each predictive model effectiveness was methodically assessed to identify the most suitable approach for ECe prediction.
Cross-validation methods were employed to ensure the models accuracy resilience and applicability. Significant regional variations in soil salinity were observed, with certain areas exhibiting elevated ECe levels. The practical implications of this research are significant for soil management in Northeast Tunisia. Consequently, the study aim is to predict soil salinity from soil parameters, according to predictive accuracy, the PTF (1) are the most appropriate, exhibiting the highest R² (0.85) with a huge number of covariates.
However, for reasons of simplicity and practicality, PTF (5) is the best option, achieving an important R² (0.83) with a reduced number of predictors that are more less time-consuming and cost-effective for farmers to measure:
ECe=1.2264 +(0.9055) ×EC 1:5 +(−0.1053) × TN+(0.2209) × SOC+(−0.0054) ×CEC
R2 = 0.83 and P-value = 3.07e-15
The small p-value of 3.07e-15 <0.05, confirm that the relationship between soil parameters and ECe that we are testing is statistically significant. It would appear that EC 1:5 may be the most significant predictor, demonstrating a very strong relationship with ECe.
Moreover, the integrated approach using multiple computational tools provides a more detailed and accurate assessment of soil salinity than any single method alone.
These PTFs can serve as a model for other arid and semi-arid regions facing similar challenges. Our findings not only contribute to the local and national context but also offer insights that can be adapted and applied globally, as a transferable methodology for addressing salinity challenges worldwide.
5. Conclusions
This research provides comprehensive understanding of soil salinity patterns in north-east of Tunisia, where salinity poses a critical problem to crop productivity and agriculture sustainability. Hence, ECe is the reference parameter for soil classification and for the determination of the grade of soil salinity in agricultural plots. While other factors such as total nitrogen (TN), soil organic carbon (SOC), and cation exchange capacity (CEC) influence ECe estimation, seems reasonable to admit the major role of EC 1:5 in the development of PTFs. Excel software demonstrated a robust model fit, besides the advanced capabilities of R language program and the non-linear models (C-RT) in Tanagra software offers valuable insights for optimizing predictive accuracy with variables selection and clustering. Accordingly, these statistical tools show a comprehensive framework for of soil salinity prediction, where developed models can inform farmers about soil salinity status, including managing irrigation practices and optimizing drainage systems. Traditional statistical methods such as SLR and MLR provide a significant model but advanced regression techniques like Ridge and Lasso regression optimize predictions for diverse soil conditions offering a more detailed and accurate assessment than any single method alone. This multi-tool statistical approach highlights the value of soil covariates selection by generating PTFs for semi-arid regions.
In conclusion, long-term monitoring of soil salinity and the impacts of different irrigation practices will provide deeper insights into the dynamics of soil salinity, highlighting the necessity of developing strategies for soil health and agricultural sustainability in arid and semi-arid regions.
Author Contributions
Conceptualization, O.H.,P.B and G.L.P ; methodology, G.L.P and O.H; software, O.H.; validation, O.H. and G.L.P.; formal analysis, O.H.; investigation, O.H,F.S,N.B and G.LP; ; data curation, O.H. and G.L.P; writing—original draft preparation, O.H.; writing—review and editing, P.B. F.S and G.L.P; visualization, O.H, F.S, N.B ,P.B, , and G.L.P.; supervision, G.L.P. Authors have read and agreed to the published version of the manuscript.
Data Availability Statement
Data will be available on request.
Conflicts of Interest
Authors declare no conflicts of interest.
Abbreviations
| ECe | Electrical conductivity by saturated Paste |
| EC1:5 | Electrical conductivity 1:5 water soil ratio |
| PTFs | Pedotransfer-function |
References
- Rhoades, J.D.; Kandiah, A.; Mashali, A.M. The Use of Saline Waters for Crop Production; FAO: Rome, Italy, 1992.
- Hoffman, G.J.; Shalhevet, J. Managing Irrigation Water Quality for Sustainable Agriculture. Springer Science & Business Media 2007. [CrossRef]
- Nawar, S.; Corstanje, R.; Halcro, G.; Mulla, D.; Waine, T. Delineation of Soil Management Zones for Variable Rate Irrigation. Computers and Electronics in Agriculture 2014, 104, 27–38. [Google Scholar]
- Li, J.; Wang, N.; Wang, E.; Liu, S.; Yu, Q. Modelling the Impact of Climate Change on Rice Phenology and Grain Yield in China. Field Crops Research 2015, 175, 112–121. [Google Scholar] [CrossRef]
- Shahid, S.A.; Zaman, M.; Heng, L. Soil Salinity: Historical Perspectives and a World Overview of the Problem. In Guideline for Salinity Assessment, Mitigation and Adaptation Using Nuclear and Related Techniques; Springer: Cham, 2018. [Google Scholar] [CrossRef]
- Eswar, D.; Karuppusamy, R.; Chellamuthu, S. Drivers of Soil Salinity and Their Correlation with Climate Change. Current Opinion in Environmental Sustainability 2021, 50, 310–318. [Google Scholar] [CrossRef]
- Okur, B.; Örçen, N. Soil Salinization and Climate Change. In Climate Change and Soil Interactions; Elsevier: 2020; pp. 331–350. ISBN 9780128180327.
- Poffenbarger, H.J.; Barker, D.W.; Helmers, M.J.; Miguez, F.E.; Olk, D.C.; Sawyer, J.E.; Six, J.; Castellano, M.J. Maximum Soil Organic Carbon Storage in Midwest U.S. Cropping Systems When Crops Are Optimally Nitrogen-Fertilized. PLoS ONE 2017, 12(3), e0172293. [CrossRef]
- Shahariar, S.; Farrell, R.; Soolanayakanahally, R.; Bedard-Haughn, A. Elevated Salinity and Water Table Drawdown Significantly Affect Greenhouse Gas Emissions in Soils from Contrasting Land-Use Practices in the Prairie Pothole Region. Biogeochemistry 2021, 155, 127–146. [Google Scholar] [CrossRef]
- Ivuskin, K.; Bartholomeus, H.; Bregt, A.K.; Pulatov, A.; Kempen, B.; de Sousa, L. Global Mapping of Soil Salinity Change. Remote Sensing of Environment 2019, 231, 111260. [Google Scholar] [CrossRef]
- Shrivastava, P.; Kumar, R. Soil Salinity: A Serious Environmental Issue and Plant Growth Promoting Bacteria as One of the Tools for Its Alleviation. Saudi J. Biol. Sci. 2015, 22, 123–131. [Google Scholar] [CrossRef]
- Momirović, N.; Kadović, R.; Perović, V.; Marjanović, M.; Baumgertel, A. Spatial Assessment of the Areas Sensitive to Degradation in the Rural Area of the Municipality Čukarica. International Soil and Water Conservation Research 2019, 7(1), 71–80. [Google Scholar] [CrossRef]
- Mohanavelu, A.; Naganna, S.R.; Al-Ansari, N. Irrigation Induced Salinity and Sodicity Hazards on Soil and Groundwater: An Overview of Its Causes, Impacts and Mitigation Strategies. Agriculture 2021, 11, 983. [Google Scholar] [CrossRef]
- Hassani, A.; Azapagic, A.; Shokri, N. Global Predictions of Primary Soil Salinization Under Changing Climate in the 21st Century. Nature Communications 2021, 12, 6663. [Google Scholar] [CrossRef]
- Tedeschi, A.; Schillaci, M.; Balestrini, R. Mitigating the Impact of Soil Salinity: Recent Developments and Future Strategies. Ital. J. Agron. 2023, 18, 2173. [Google Scholar] [CrossRef]
- Singh, A. Soil Salinity: A Global Threat to Sustainable Development. Soil Use and Management 2022, 38(1), 39–67. [Google Scholar] [CrossRef]
- Metternicht, G.; Zinck, J.A. Remote Sensing of Soil Salinity: Potentials and Constraints. Remote Sensing of Environment 2003.
- Yensen, N.P. Halophyte Uses for the Twenty-First Century. In Ecophysiology of High Salinity Tolerant Plants; 2006; pp. 367–396.
- Mandal, S.; Singh, R.D.; Patra, A.K.; Dwivedi, B.S. Changes in Soil Quality in Response to Short-Term Application of Municipal Sewage Sludge in a Typic Haplustept Under Cowpea-Wheat Cropping System. Environmental Nanotechnology, Monitoring & Management 2015, 4, 37–41. [Google Scholar]
- Haj-Amor, Z.; Ibrahimi, M.K.; Feki, N.; Lhomme, J.P.; Bouri, S. Soil Salinisation and Irrigation Management of Date Palms in a Saharan Environment. Environmental Monitoring and Assessment 2016, 188, 497. [Google Scholar] [CrossRef] [PubMed]
- Saleh, A.M.; Abd-Elwahed, M.; Metwally, Y.; Arafat, S. Capabilities of Hyperspectral Remote Sensing Data to Detect Soil Salinity. Arab Univ. J. Agric. Sci. 2021, 29. [Google Scholar] [CrossRef]
- Hopmans, J.W.; Qureshi, A.S.; Kisekka, I.; Munns, R.; Grattan, S.R.; Rengasamy, P.; Ben-Gal, A.; Assouline, S.; Javaux, M.; Minhas, P.S.; Raats, P.A.C.; Skaggs, T.H.; Wang, G.; De Jong van Lier, Q.; Jiao, H.; Lavado, R.S.; Lazarovitch, N.; Li, B.; Taleisnik, E. Chapter One—Critical Knowledge Gaps and Research Priorities in Global Soil Salinity. In Advances in Agronomy; Sparks, D.L., Ed.; Academic Press: Amsterdam, The Netherlands, 2021; Volume 169. [Google Scholar]
- Qadir, M.; Quillérou, E.; Nangia, V.; Murtaza, G.; Singh, M.; Thomas, R.J.; Drechsel, P.; Noble, A.D. Economics of Salt-Induced Land Degradation and Restoration. Natural Resources Forum 2014, 38(4), 282–295. [Google Scholar] [CrossRef]
- Tomaz, A.; Palma, P.; Alvarenga, P.; Gonçalves, M.C. Soil Salinity Risk in a Climate Change Scenario and Its Effect on Crop Yield. In Climate Change and Soil Interactions; Prasad, M.N.V., Pietrzykowski, M., Eds.; Elsevier: Amsterdam, The Netherlands, 2020; pp. 351–396. ISBN 9780128180327. [Google Scholar]
- Glick, B.R.; Todorovic, B.; Czarny, J.; Cheng, Z.; Duan, J.; McConkey, B. Promotion of Plant Growth by Bacterial ACC Deaminase. Critical Reviews in Plant Sciences 2007, 26(5–6), 227–242. [CrossRef]
- Rhoades, J.D. (1982). Soluble salts. In: Page, A.L. et al. (eds.), Methods of Soil Analysis, Part 2. Chemical and Microbiological Properties. Agronomy Monograph No. 9 (2nd ed.), ASA and SSSA, Madison, WI, pp. 167–179.
- Liu-Khorsandi, F.; Yazdi, F.A. Estimation of Saturated Paste Extracts’ Electrical Conductivity from 1:5 Soil/Water Suspension and Gypsum. Communications in Soil Science and Plant Analysis 2011, 42(3), 315–321. [Google Scholar] [CrossRef]
- FAO. Rapport de synthèse par pays. Tunisie, 30 Mai 2024. https://www.fao.org/giews/countrybrief/country.jsp?code=TUN.
- Brahim, N.; Ibrahim, H.; Jaouadi, J.; Bol, R. Impact of Secondary Salinization in Alluvial Soils on Organic Carbon Stock: A Case of the Lower Medjerda Valley in Northern Tunisia. In Recent Research on Environmental Earth Sciences, Geomorphology, Soil Science, Paleoclimate, and Karst, MedGU 2021. Advances in Science, Technology & Innovation, Springer: Cham, 2023. [CrossRef]
- Shrivastava, P.; Kumar, R. Soil Salinity: A Serious Environmental Issue and Plant Growth Promoting Bacteria as One of the Tools for Its Alleviation. Saudi Journal of Biological Sciences 2014, 22, 123–133. [Google Scholar] [CrossRef]
- Brahim, N.; Bernoux, M.; Gallali, T. Pedotransfer Functions to Estimate Soil Bulk Density for Northern Africa: Tunisia Case. Journal of Arid Environments 2012, 81, 77–83. [Google Scholar] [CrossRef]
- Smaali, H. Une alternative cartographique pour l’évaluation des performances de la gestion collective de l’irrigation : le cas des GDA du gouvernorat de la Manouba (Nord-Est de la Tunisie). Geo-Eco-Trop. 2021, 4(45), 681–698. https://www.geoecotrop.be/uploads/publications/pub_454_13.pdf.
- Commissariat Régional au Développement Agricole (CRDA) de la Manouba. Rapport annuel de l’activité du CRDA pour l’année 2019. 2020, 114 p.
- Calzolari, C.; Ungaro, F. Analisi e valutazione dei dati di salinità in relazione al metodo di misura di laboratorio e di campagna e alla definizione di funzioni di trasferimento per la stima della densità apparente dei suoli a tessitura grossolana. Rapporto 1.3, CNR IRPI, Unità Operativa di Sesto Fiorentino - Pedologia Applicata, 2011.
- Kargas, G.; Chatzigiakoumis, I.; Kollias, A.; Spiliotis, D.; Massas, I.; Kerkides, P. Title: Soil Salinity Assessment Using Saturated Paste and Mass Soil:Water 1:1 and 1:5 Ratios Extracts Journal: Water 2018, 10(11), 1589.
- Ahmed, A.; Yamamoto, T.; Bakheit, C.; Cookson, P. Soil Salinity Assessment by Some Destructive and Non-Destructive Methods in Calcareous Soils. Journal of the Japanese Society of Soil Physics 2006, 104, 27–40. [Google Scholar]
- Contreras, C.P.; Bonilla, C.A. A Comprehensive Evaluation of Pedotransfer Functions for Predicting Soil Water Content in Environmental Modeling and Ecosystem Management. Science of the Total Environment 2018, 644, 1580–1590. [Google Scholar] [CrossRef]
- Srimani, P.K.; Koti, M.S. Application of Data Mining Techniques for Outlier Mining in Medical Databases. Int. J. Curr. Res. 2011, 3(6), 402–407. [Google Scholar]
- Zhou, M.; Yonghua, L.; Xiaoyong, L. Digital Mapping and Scenario Prediction of Soil Salinity in Coastal Lands Based on Multi-Source Data Combined with Machine Learning Algorithms. Remote Sensing 2024. [CrossRef]
- Zounemat-Kermani, M.; Scholz, M. Modeling of Dissolved Oxygen Applying Stepwise Regression and a Template-Based Fuzzy Logic System. Journal of Environmental Engineering 2014, 140, 69–76. [Google Scholar] [CrossRef]
- Zounemat-Kermani, M.; Ramezani-Charmahineh, A.; Razavi, R.; et al. Machine Learning and Water Economy: A New Approach to Predicting Dams Water Sales Revenue. Water Resources Management 2020, 34, 1893–1911. [Google Scholar] [CrossRef]
- Boudibi, S.; Sakaa, B.; Benguega, Z.; et al. Spatial Prediction and Modeling of Soil Salinity Using Simple Cokriging, Artificial Neural Networks, and Support Vector Machines in El Outaya Plain, Biskra, Southeastern Algeria. Acta Geochimica 2021, 40, 390–408. [Google Scholar] [CrossRef]
- Beniaich, A.; Otten, W.; Shin, H.-C.; Cooper, H.V.; Rickson, J.; Soulaimani, A.; El Gharous, M. Evaluation of Pedotransfer Functions to Estimate Some Soil Hydraulic Characteristics in North Africa: A Case Study from Morocco. Frontiers in Environmental Science 2023, 11, 1090688. [Google Scholar] [CrossRef]
- Zhou, Y.; Chen, S.; Hu, B.; Ji, W.; Li, S.; Hong, Y.; Xu, H.; Wang, N.; Xue, J.; Zhang, X.; et al. Global Soil Salinity Prediction by Open Soil Vis-NIR Spectral Library. Remote Sens. 2022, 14(21), 5627. [Google Scholar] [CrossRef]
- Liu, W.; Ye, T.; Jägermeyr, J.; Müller, C.; Chen, S.; Liu, X.; Shi, P. Future Climate Change Significantly Alters Interannual Wheat Yield Variability Over Half of Harvested Areas. Environmental Research Letters 2021, 16(9), 094045. [Google Scholar] [CrossRef]
- Abdelfattah, M.A.; Shahid, S.A. A Comparative Characterization and Classification of Soils in Abu Dhabi Coastal Area in Relation to Arid and Semi-Arid Conditions Using USDA and FAO Soil Classification Systems. Arid Land Research and Management 2007, 21(3), 245–271. [Google Scholar] [CrossRef]
- Zheng, W.; Songchao, C.; Lu, R.; Xianglin, Z.; Yuxin, M.; Zhou, S. Non-Linear Memory-Based Learning for Predicting Soil Properties Using a Regional Vis-NIR Spectral Library. Geoderma 2024. [CrossRef]
- Qadir, M.; Oster, J.D.; Schubert, S.; Noble, A.D.; Sahrawat, K.L. Phytoremediation of Sodic and Saline-Sodic Soils. Advances in Agronomy 2007, 96, 197–247. [Google Scholar]
Figure 1.
Geographical localisation of the study area and sampling points.
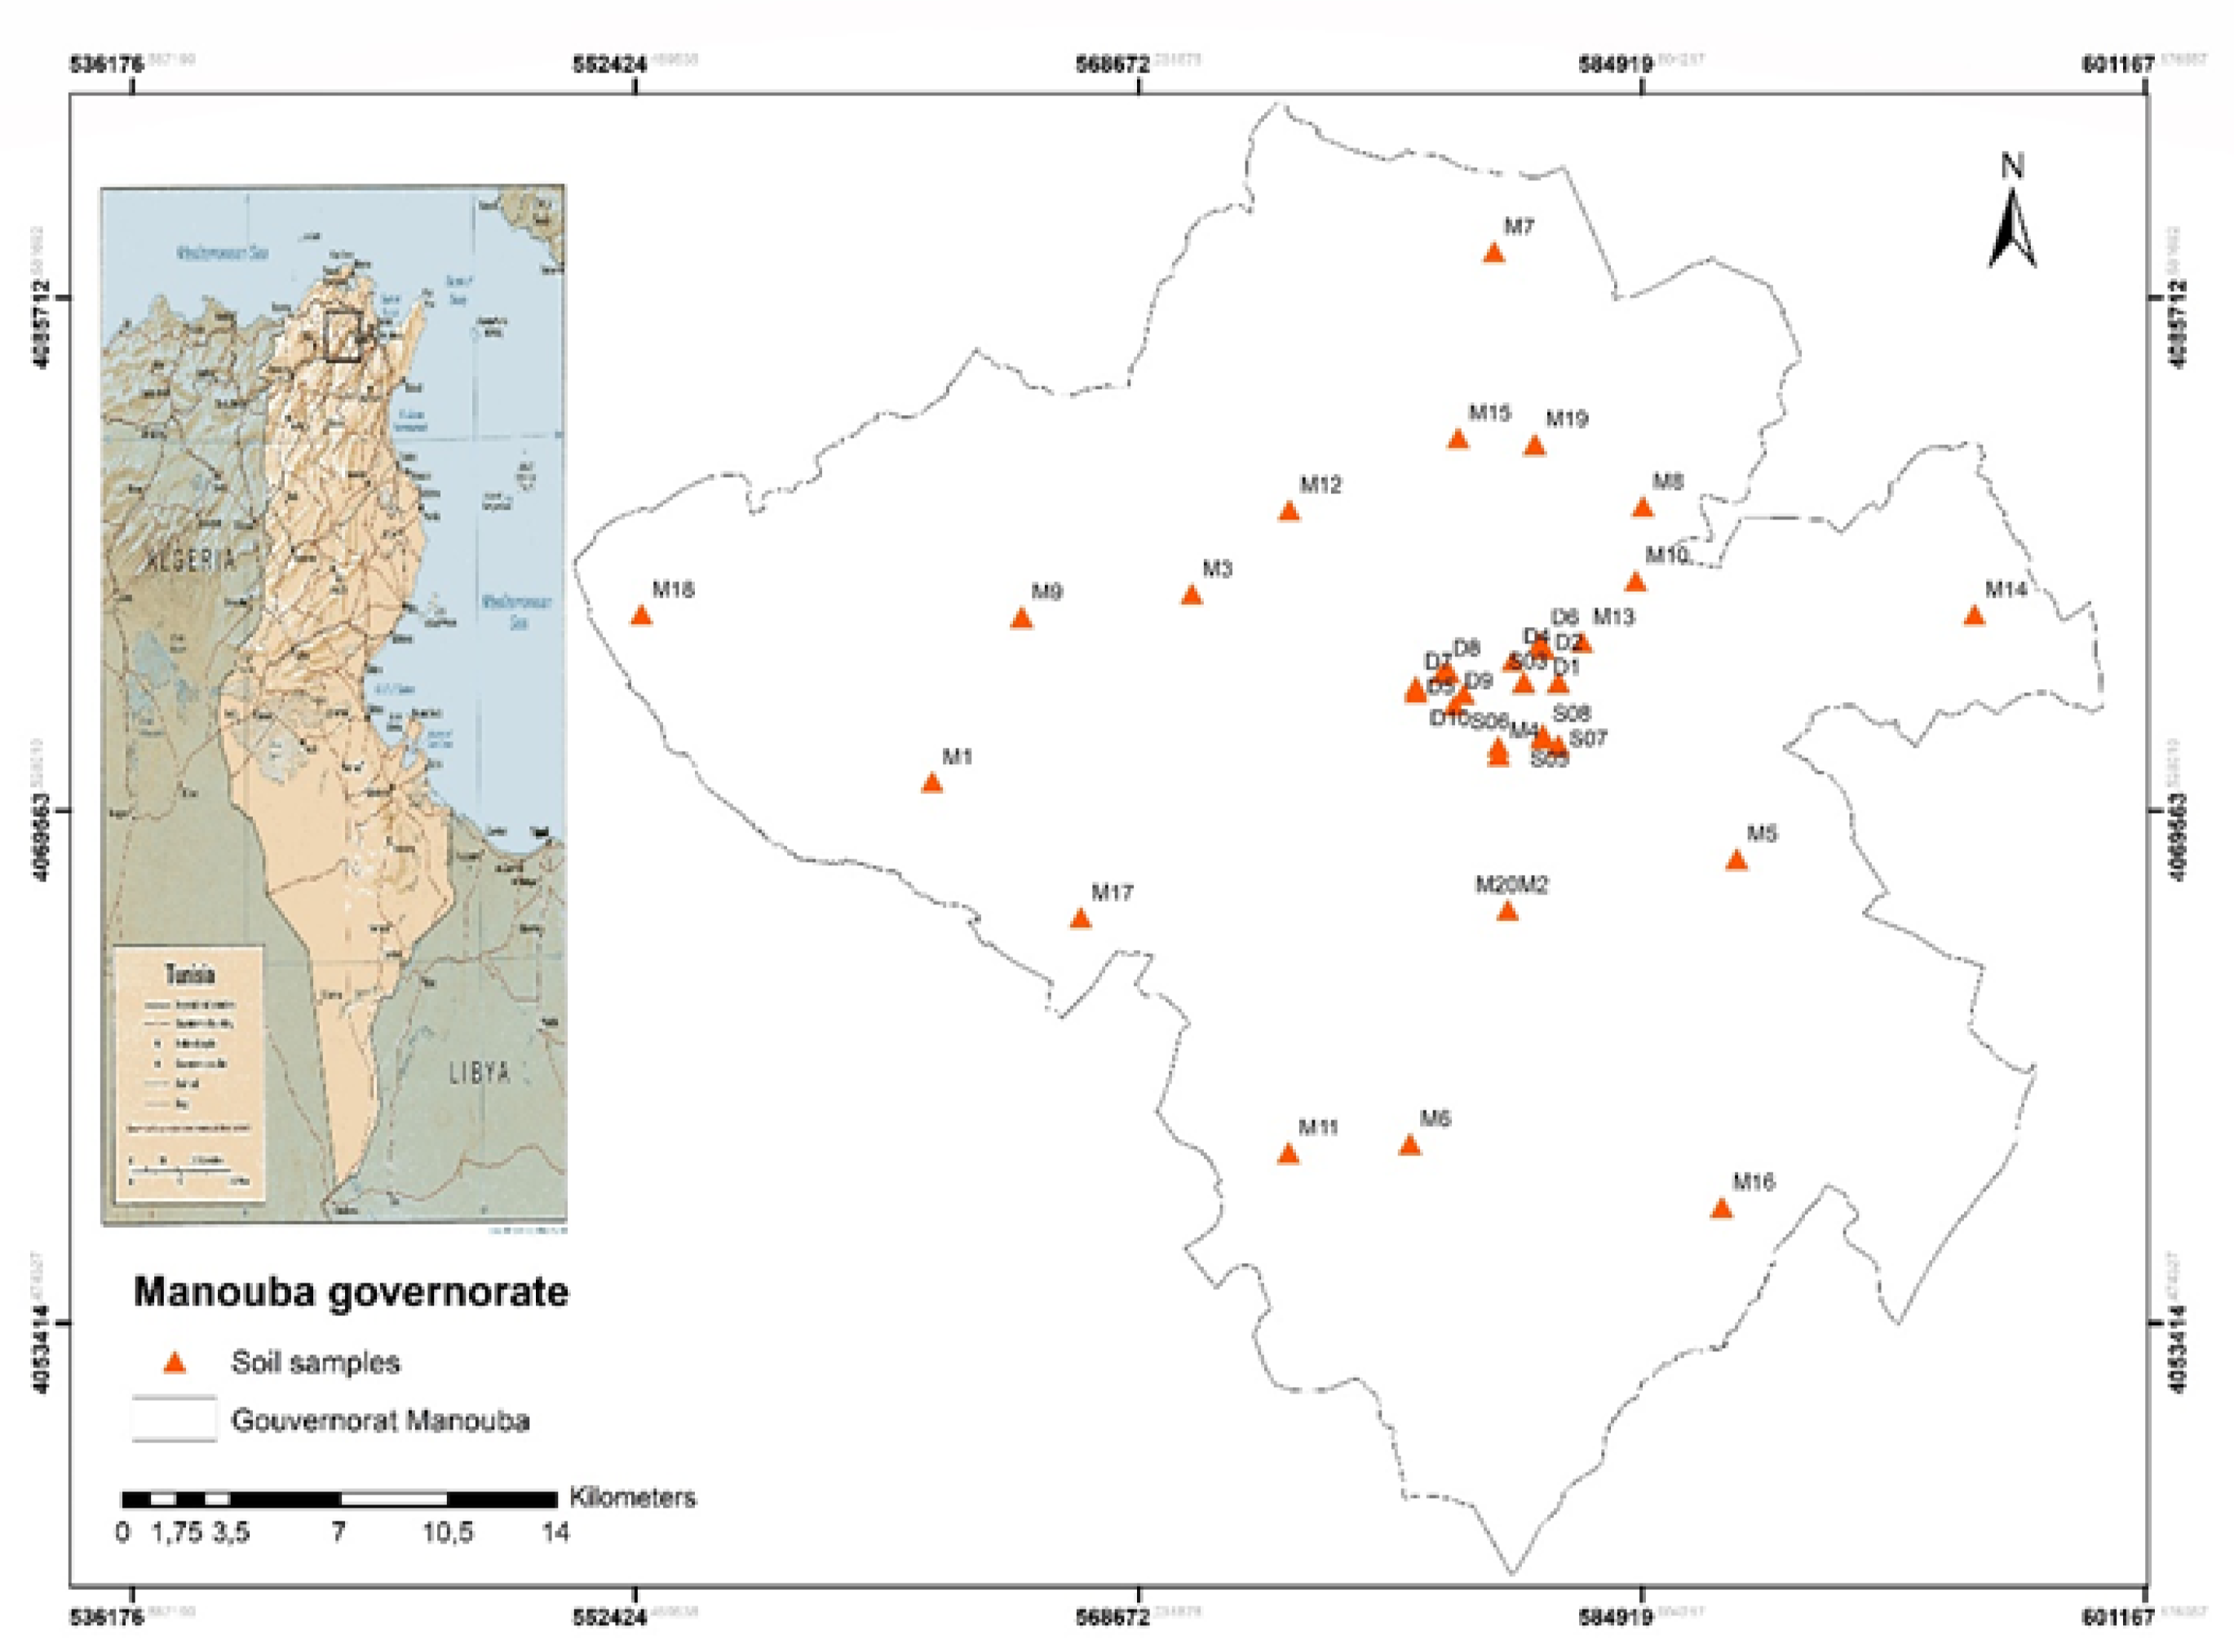
Figure 2.
Bivariate relationship between electrical conductivity measured by saturation pastes extracts ECe and EC 1:5 soil: water ratio.
Figure 2.
Bivariate relationship between electrical conductivity measured by saturation pastes extracts ECe and EC 1:5 soil: water ratio.
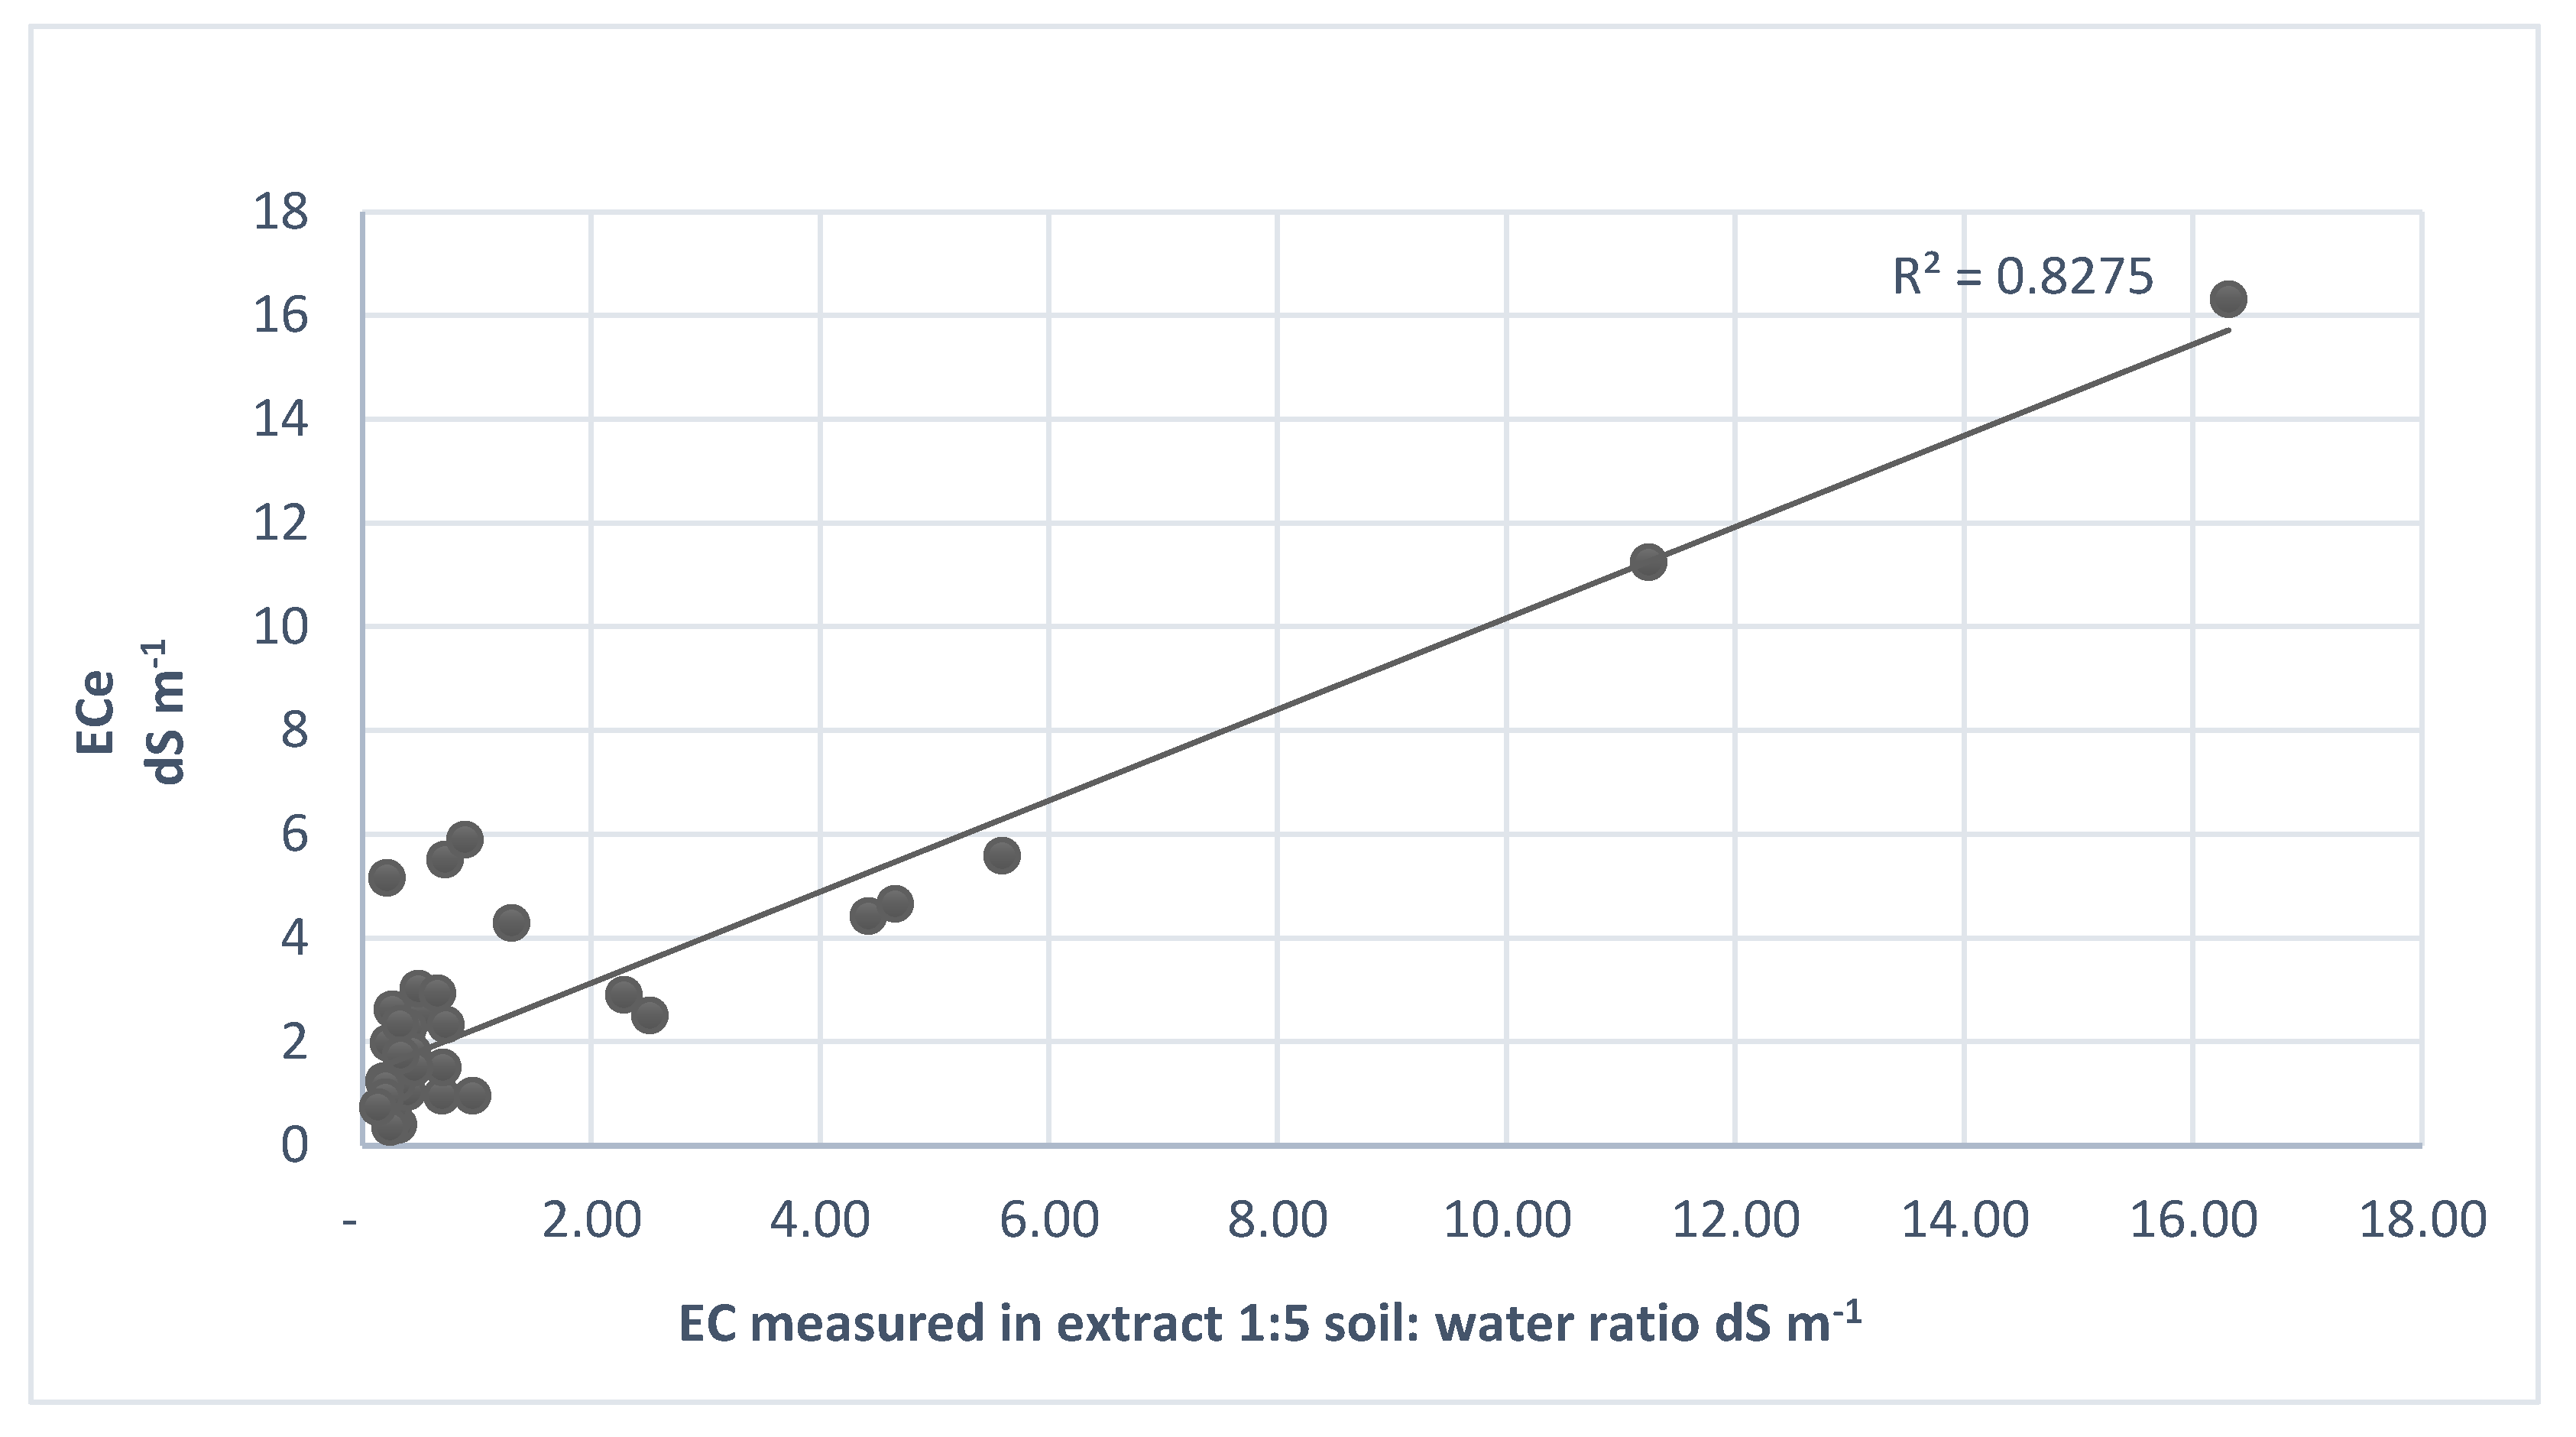
Figure 3.
ECe predicted by MLR.
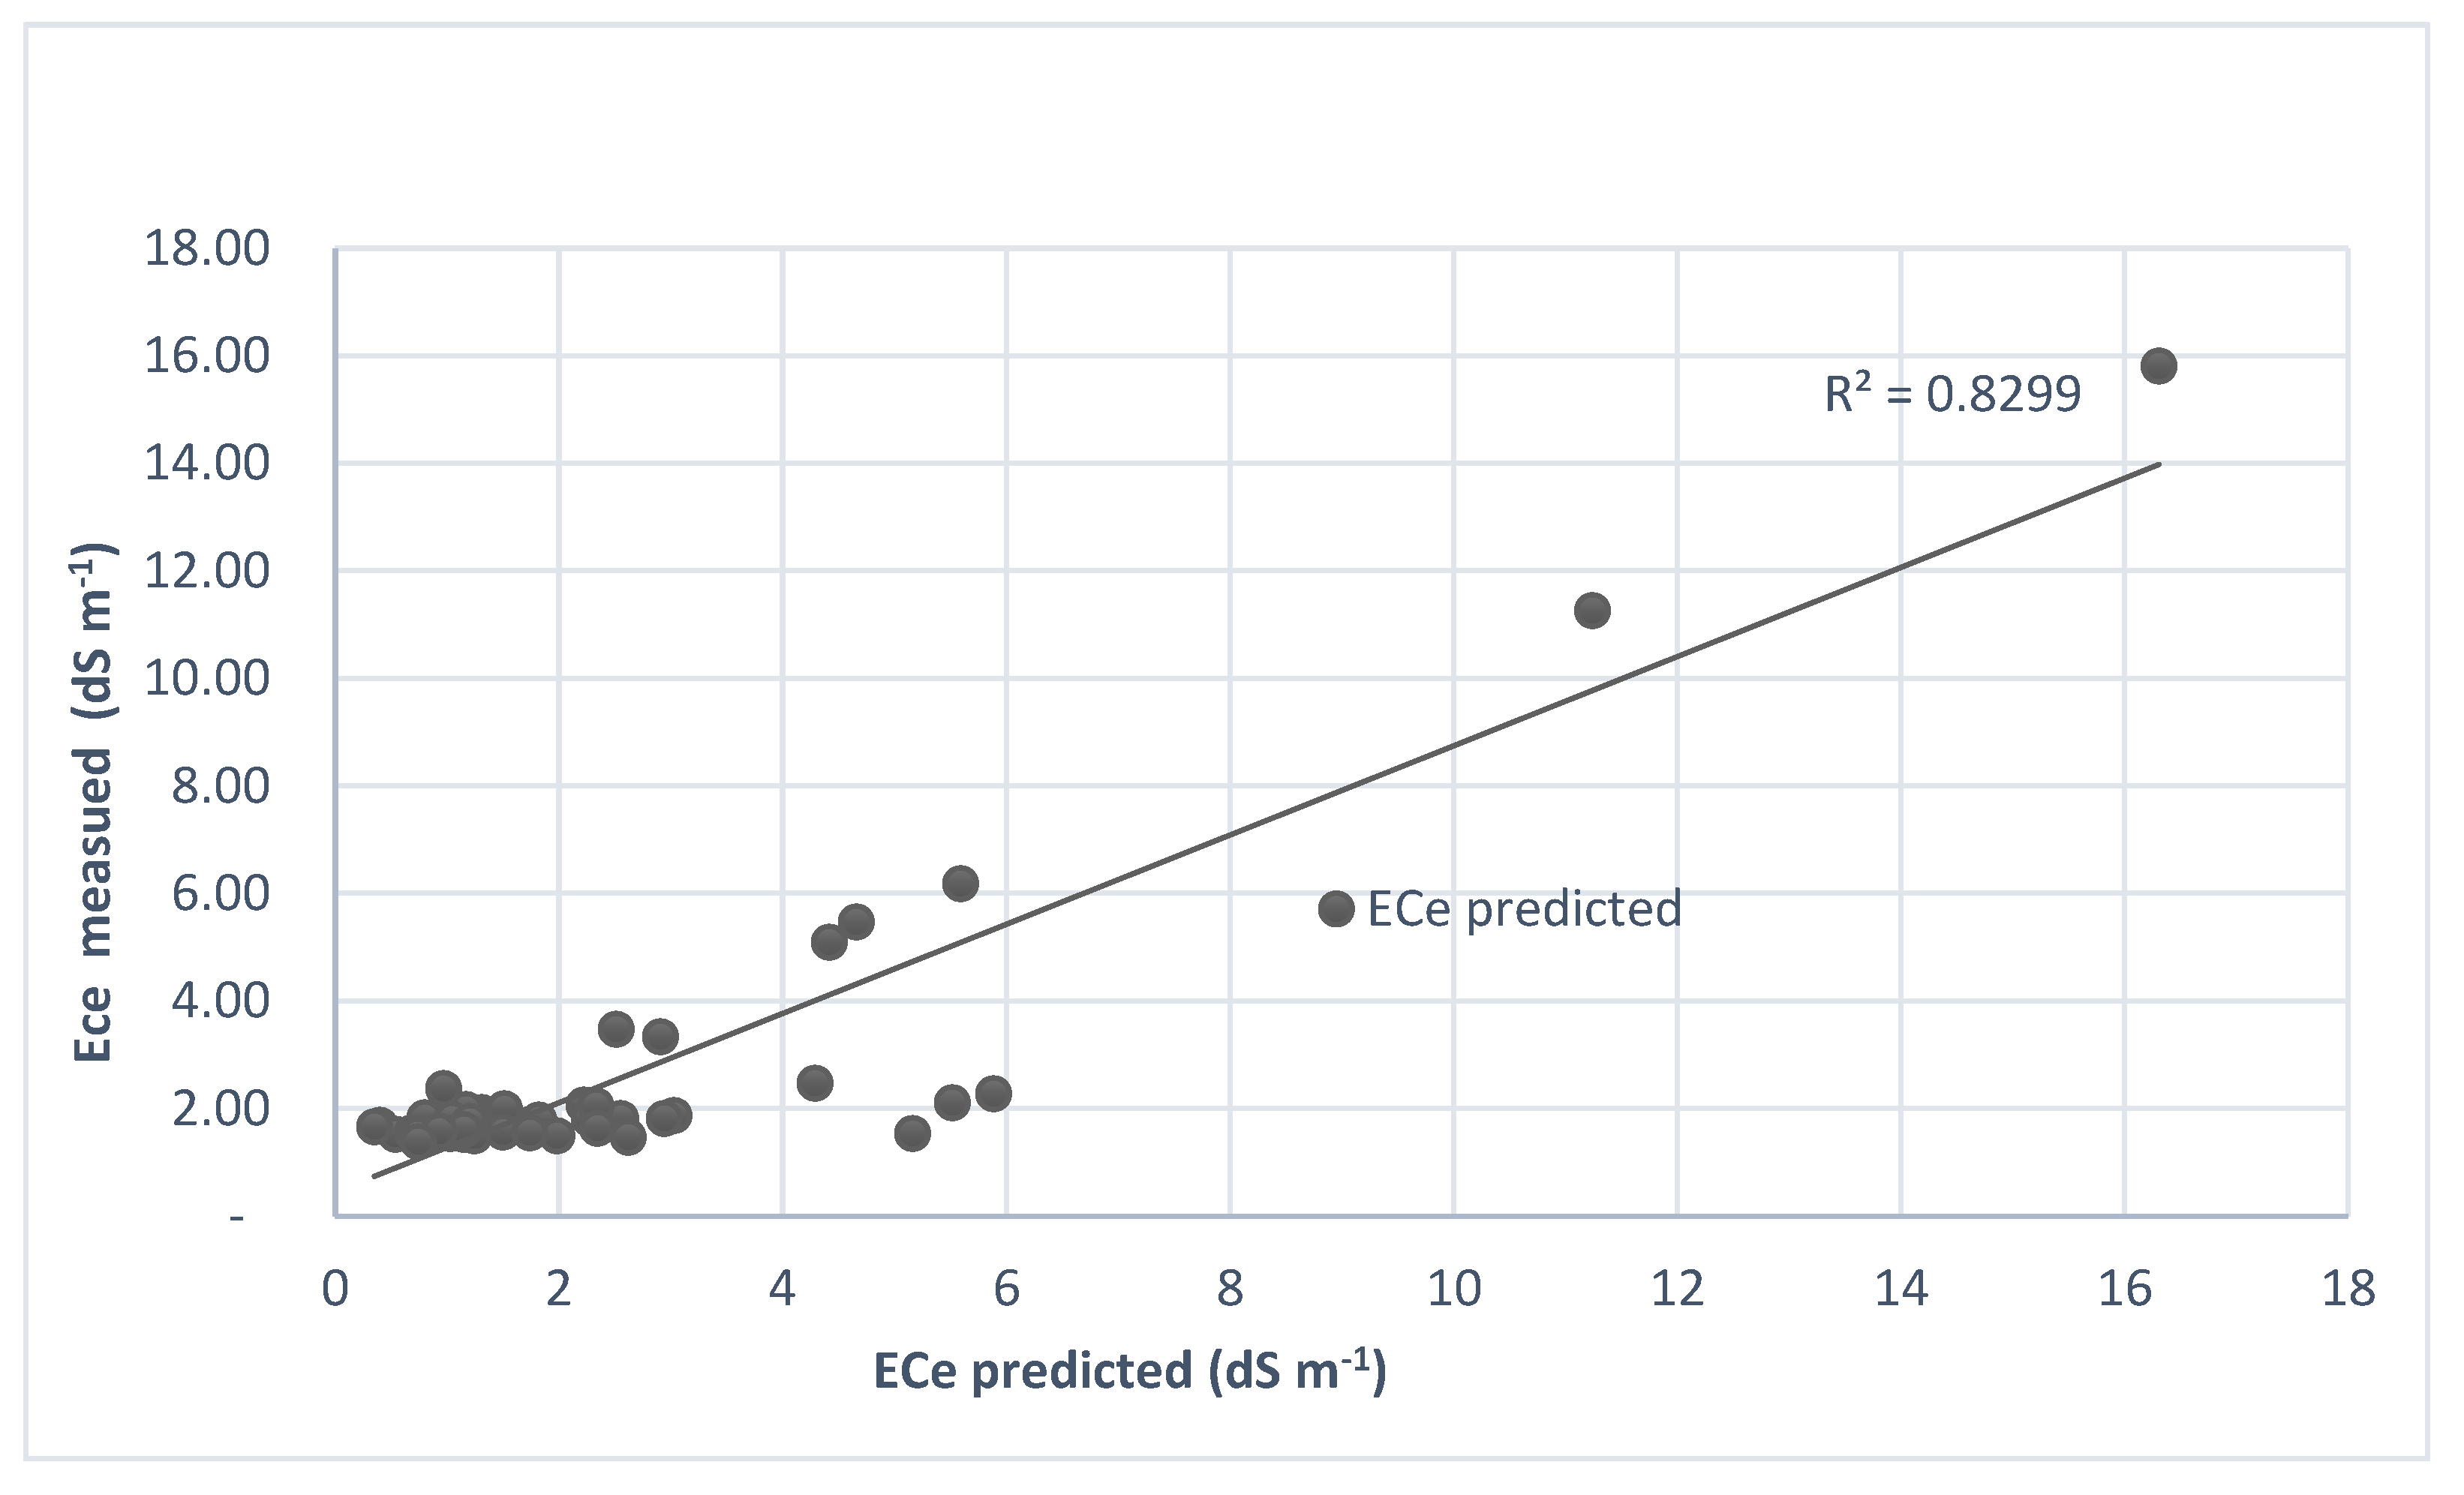

Table 1.
Descriptive statistics of soil physical-chemical parameters (n=46).
| Soil Parameters | Unit | Mean | SD* | Min | Max | Range | Skewness | Kurtosis | CV%* |
| EC 1:5 * | dS m−1 | 1.38 | 2.97 | 0.13 | 16.31 | 16.18 | 16.17 | 3.88 | 215.94 |
| ECe* | dS m-1 | 2.59 | 2.87 | 0.35 | 16.31 | 15.96 | 12.25 | 3.18 | 110.46 |
| pH* | --- | 7.39 | 0.33 | 6.44 | 8.04 | 1.60 | 0.78 | -0.32 | 4.46 |
| CaCO3* | % | 25.57 | 14.26 | 0.85 | 47.86 | 47.01 | -1.39 | -0.18 | 8.23 |
| SOC* | % | 33.53 | 0.73 | 0.00 | 2.86 | 2.86 | -0.46 | 0.21 | 2.18 |
| Nt* | % | 1.17 | 0.05 | 0.03 | 0.22 | 0.19 | -0.10 | 0.73 | 4.25 |
| CEC* | Cmol (+) Kg-1 | 0.11 | 9.43 | 1.88 | 50.00 | 48.12 | 0.85 | -0.10 | 38.58 |
| Clay* | % | 38.91 | 14.21 | 7.25 | 65.00 | 57.75 | -0.14 | -0.64 | 5.41 |
| Silt* | % | 27.07 | 9.20 | 8.35 | 45.00 | 36.65 | -0.59 | -0.04 | 5.02 |
| Sand* | % | 33.53 | 18.88 | 6.55 | 75.50 | 68.95 | -0.28 | 0.62 | 5.63 |
EC1:5 =Soil electrical conductivity measured in extract soil: water 1:5 ratio; ECe*= Soil electrical conductivity measured in a saturated paste; pH*= Soil reaction; CaCO3*= Calcium carbonates; SOC*= Soil organic Carbon; Nt*= Total nitrogen; CEC*= Cation exchange capacity; Clay*= Percentage of fine soil particles 0.002 mm in diameter. Silt*= Percentage of intermediate soil particles between 0.002 and 0.05 mm in diameter; Sand*= Percentage of coarse soil particles > 0.05 to 2 mm in diameter; SD*=standard deviation; CV%*=coefficient of variation.
Table 2.
Tested SLR model and generated Pedotransfer-function.
| Models/PTFs | Soil covariates | Equations | R2 value |
| [35] model | EC 1:5 | ECe = 6.53 × EC 1:5-0.108 |
0.87 |
| [36] model | EC 1:5 | ECe= 9.70× EC 1:5 | 0.87 |
| PTFs (1) Multiple linear regression |
EC 1:5 – pH CEC – Clay CaCO3 – SOC TN |
ECe=8.58+ (0.90) × EC1:5 +(0.0047) × CEC + (-0.916) × pH+ (-0.002) ×Clay +(0.020) ×CaCO3+ (0.14) ×SOC +(-1.10) ×TN |
0.85 |
| PTFs (2) Stepwise linear regression |
EC 1:5 – pH | ECe= 7.63+ (0.83) × EC1:5 + (-0.85) ×pH | 0.71 |
| PTFs (3) Multiple linear regression |
EC 1:5 – pH CEC – Clay-Silt-Sand CaCO3 – SOC TN |
ECe= -0.34+(0.86) × EC1:5 +(0.003) ×CEC + (-0.96) ×pH +(-0.019) ×CaCO3 +(0.089) ×Clay + (0.098) × Silt + (0.091) × Sand + (0.07) ×SOC + (-0.70) ×TN |
0.84 |
| PTFs (4) Lasso & Ridge regression |
EC 1:5 – pH CEC – Clay CaCO3 – SOC TN |
ECe= 15.39+(0.76) × EC1:5 +(0.002) × CEC +(-1.58) ×pH +(-0.04) × CaCO3 + (-0.04) × Clay + (-0.23) × SOC +(2.62) × TN |
0.89 |
| PTFs (5) Multiple linear regression |
EC 1:5 - pH CEC-SOC TN |
ECe= 1.226+(0.905) × EC1 :5 +(-0.005) × CEC + (0.220) × SOC + (-0.105) × TN |
0.83 |
Disclaimer/Publisher’s Note: The statements, opinions and data contained in all publications are solely those of the individual author(s) and contributor(s) and not of MDPI and/or the editor(s). MDPI and/or the editor(s) disclaim responsibility for any injury to people or property resulting from any ideas, methods, instructions or products referred to in the content. |
© 2025 by the authors. Licensee MDPI, Basel, Switzerland. This article is an open access article distributed under the terms and conditions of the Creative Commons Attribution (CC BY) license (http://creativecommons.org/licenses/by/4.0/).
Copyright: This open access article is published under a Creative Commons CC BY 4.0 license, which permit the free download, distribution, and reuse, provided that the author and preprint are cited in any reuse.


