Submitted:
23 August 2025
Posted:
26 August 2025
You are already at the latest version
Abstract
Enabled by the deep integration of new-generation information technologies, Smart Tourism optimizes resource allocation and enhances service efficacy through intelligent systems, delivering streamlined and personalized experiences to tourists. This study first conceptualizes the fundamental characteristics of Smart Tourism, then establishes a four-dimensional framework for tourist satisfaction within smart tourism ecosystems. Focusing on representative A-level smart attractions in Datong City, we construct a multidimensional satisfaction evaluation model and propose theoretical hypotheses to examine interaction mechanisms among variables. Empirical data collected via questionnaires were analyzed using Structural Equation Modeling (SEM). Findings demonstrate statistically significant positive impacts of technology-enabled experience and service quality on satisfaction, with technological factors exhibiting dominant influence. This reveals tourists’ heightened expectations for system convenience and personalization. The study innovatively integrates sustainable development principles with smart tourism satisfaction mechanisms, advancing theoretical discourse on sustainable tourism governance.
Keywords:
tourist satisfaction
; sustainable development
; smart tourism
; structural equation modeling (SEM)
1. Introduction
The dual drivers of digital transformation and tourism consumption upgrading have established Smart Tourism as a pivotal innovation paradigm that restructures industrial ecosystems through deep integration of next-generation information technologies. Intelligent service systems under this paradigm enable precision resource allocation and systemic service enhancement while concurrently fulfilling contemporary tourists’ demands for seamless and personalized experiences. Amid global sustainable development consensus and post-pandemic industry recovery, the synergy between Smart Tourism and sustainable travel practices has been recognized as a critical interdisciplinary frontier. This trajectory is reinforced by China’s Smart Tourism Innovation Development Action Plan (STIDAP, May 2024) – jointly issued by five ministries – which codifies six measurable targets for 2027: economic scale expansion, infrastructure strengthening, management efficacy improvement, marketing optimization, product diversification, and experiential enhancement, alongside twenty prioritized cross-domain initiatives signifying policy-technology institutional embeddedness.
Technological permeation is evidenced by big data analytics, IoT, and AI applications across tourism value chains, wherein tourist-facing hyper-personalization transcends conventional service boundaries and destination management systems achieve dynamic resource optimization through real-time visitor flow analytics, while platform-layer ecosystems drive market scaling via traffic aggregation and service standardization. Such technological integration resonates with UNWTO’s sustainable travel mandates, with the 2025 Sustainable Travel Report indicating eco-conscious behavioral willingness among 91 percent of Chinese tourists, thereby revealing substantial untapped green experience potential.
China’s Smart Tourism expansion is propelled by supply-side policy impetus (e.g., national “Internet + Tourism” strategy; regional exemplars like Datong’s “Digital + Culture-Tourism” project) and demand-side experiential upgrading, wherein digital transformation has elevated internet application standards across cultural facilities and attractions. Market-driven innovations – typified by VR heritage interpretation systems and the video game Black Myth: Wukong – demonstrate statistically significant tourist engagement enhancement. Persistent sectoral constraints nevertheless persist, including digital capability asymmetry between premium and medium-small attractions, escalating data privacy-security conflicts from intensive data harvesting, and regional resource allocation disparities hampering holistic tourism advancement.
As a historical-cultural metropolis undergoing resource-based urban transition, Datong (Shanxi) leverages its UNESCO World Heritage sites (e.g., Yungang Grottoes, Hanging Temple of Hengshan) and post-industrial development opportunities to position Smart Tourism as the core pathway for cultural tourism revitalization. The 14th Five-Year Plan for Cultural Tourism Integration in Datong and Digital Datong Construction Action Plan establish the “Cloud Tour Datong” initiative as an implementation vehicle, constructing a distinctive framework characterized by “digital heritage conservation + contextualized technological application”: (1) Protective heritage development is enabled through 5G-dedicated network coverage at key sites and photogrammetric 3D artifact archiving; (2) The “Datong Cultural Tourism Hub” platform integrates reservation management with smart navigation featuring AR artifact reconstruction and bespoke lodging curation; (3) Digital twin technologies transform coal industrial relics into immersive tourism routes; (4) Blockchain-based traceability systems authenticate cultural commodities, collectively forming a frontier paradigm of “heritage stewardship + technological empowerment + transitional growth”.
The 3S Theory of Smart Tourism (Zhang, 2012) conceptualizes three constitutive dimensions: Subject (stakeholder ecosystem), Science & Technology (innovation drivers), and Service (value delivery mechanisms). Within the Subject dimension, multi-agent actors—including governmental regulators, tourists, enterprises, and local residents—are governed by tourism ecosystem supply-demand dynamics, directly determining system sustainability. Crucially, service scopes extend beyond tourists to embed tourism management within regional development matrices, representing a fundamental evolution from conventional models. Tourist satisfaction (the core efficacy metric) is fundamentally mediated by technology-enabled pain point resolution: contactless transactions reduce physical friction; big-data-driven personalization accommodates heterogeneous demands; real-time crowd alerts enable adaptive itineraries; AR interactivity deepens experiential immersion; cryptographic protocols reinforce user trust. Current scholarly limitations, however, reside in insufficient interrogation of multidimensional factor interactions—including technology acceptance thresholds, cultural experience congruence, and price sensitivity perceptions—requiring granular theoretical modeling to optimize service architectures.
Future trajectories will manifest through technological convergence (e.g., generative AI catalyzing human-machine co-creation beyond functional support), sustainability internalization (carbon incentive mechanisms aligning with global ESG frameworks), and governance innovation (polycentric “government-enterprise-tourist” collaboration resolving resource fragmentation via standardized data-sharing protocols). The ontological essence of Smart Tourism thus transcends technological efficiency gains, constituting an ecosystemic reconfiguration centered on user value actualization, wherein dynamic equilibria among technological advancement, experiential optimization, and sustainable praxis must be negotiated to synchronize economic outputs, societal benefits, and environmental stewardship.
2. Literature Review
Smart Tourism, as an innovative paradigm integrating information technologies and tourism sectors, has undergone conceptual evolution alongside technological advancements and scholarly refinement. Following its initial proposition in the early 21st century, the World Tourism Organization categorized it into four hierarchical tiers. Subsequent research has progressively reconceptualized its definition through lenses of resource optimization, managerial transformation, tourist-city interaction, and technological convergence, ultimately establishing consensus that positions Information and Communication Technologies (ICT) as the core enabler focusing on tourist demand fulfillment, experiential enhancement, efficient resource allocation, and sustainable development [1,2,3]. In practical applications, intelligent technologies (e.g., cloud computing, big data analytics, virtual reality) have permeated critical scenarios including destination management, tourist decision-making, and service innovation, substantially elevating tourism convenience and experiential richness.
International scholarship demonstrates early-mover dominance with multidisciplinary coverage spanning informatics, management science, and marketing, currently shifting focus toward emergent technology R&D and tourist satisfaction optimization. Conversely, domestic research—propelled by smart city initiatives—has evolved from preliminary technological experimentation to constructing smart tourism destinations and service platforms, progressively deepening into cultural-tourism public service integration and “resident-visitor shared” cloud ecosystems, thereby forming a dual-driven development pathway synergizing policy impetus with technological empowerment.
Three critical research gaps persist:
Policy & Governance Mechanisms: Strategic frameworks for governments to enhance smart tourism competitiveness globally remain underexplored, particularly regarding inter-local governmental collaboration models and supplier governance regimes. The development of smart destination competitiveness index systems warrants urgent scholarly attention [4].
Tourist Behavioral Segmentation: Granular investigations into smart tourism preferences based on psychological profiles and generational/cultural disparities are essential to decode the cultural and intergenerational mechanisms influencing technology adoption [5,6].
Impact Mechanism Elucidation: Existing studies predominantly emphasize cross-sectional analyses of positive effects, lacking longitudinal dissection of latent mechanisms through which smart tourism transforms tourist experiences. Empirical validation through experimental approaches (e.g., wearable biometric sensors) is imperative to establish causality, alongside developing context-specific theoretical models.
Sustainable Tourism, as a strategic response to tourism’s real-world challenges and opportunities, has constituted a discrete research domain since the early 1990s. Its conceptual foundation originates from the application of sustainable development principles within tourism, emphasizing the imperative to holistically address contemporary and future environmental impacts, economic efficacy, and social well-being—ultimately serving the collective interests of destination communities, ecosystems, tourists, and industry stakeholders [7,8]. This conceptual breadth and complexity engender inherently interdisciplinary scholarship, spanning diverse foci from ecological conservation to community participation, and from technological deployment to policy architecture.
The core connotations of sustainable tourism have been continuously enriched in development, and although different studies have different perspectives on its definition, “environmental sustainability, economic feasibility, and social equity” have always been the three recognized pillars [10]. Early research focused on the balance between environmental protection and economic benefits, and as the tourism industry scaled up, the importance of the social dimension gradually emerged — not only including the protection of the natural environment but also involving the enhancement of the welfare of destination communities, the living inheritance of cultural heritage, and the fair distribution of tourism benefits. The United Nations World Tourism Organization defines it as “tourism that takes full account of the current and future environmental, economic, and social impacts, serving the interests of host communities, the environment, tourists, and the industry,” which strengthens the necessity of cross-sectoral collaboration, requiring a comprehensive assessment of the direct and indirect impacts of tourism on the material environment and human ecology of the destination, and incorporating a broader regional development effect.
From the perspective of theoretical evolution, sustainable tourism has gone through a process from a single environmental perspective to a systematic integration. Initial studies focused on ecological protection, such as reducing carbon footprints and waste management; then gradually incorporating economic elements, exploring the path of tourism contributing to local development through job creation and tax revenue growth; in the past decade, more emphasis has been placed on social equity, focusing on the community’s right to participate in tourism planning, the maintenance of cultural identity, and the rationality of benefit distribution. This evolution reflects the transformation of the tourism industry from “resource consumption type” to “value co-creation type,” especially after the COVID-19 pandemic, “greener and healthier” sustainable tourism has become an important direction for destination recovery, promoting scenic spots to upgrade to ecologically friendly and community-benefiting models [11,12].
In practice, the implementation of sustainable tourism depends on the collaboration of multiple stakeholders. In terms of the environment, technical means such as carbon footprint calculation tools, renewable energy applications, and biodiversity conservation projects are used to reduce ecological costs; in terms of the economy, models such as community tourism cooperatives and local product supply chains are used to ensure that benefits remain local and enhance regional economic resilience; in terms of society, the living inheritance of cultural heritage is emphasized to avoid the erosion of community cultural identity by excessive commercialization, such as developing intangible cultural heritage experience projects and supporting local cultural festivals. Developing countries often use eco-tourism income to subsidize nature protection, forming a virtuous cycle of “protection-development-benefit.” Academic research on sustainable tourism involves multiple fields such as geography, economics, and sociology, with core issues including the quantification of environmental impacts, the design of benefit distribution mechanisms, and technological empowerment innovation (such as blockchain traceability, digital twin protection of heritage), emphasizing its status as a systematic project requiring the collaboration of governments, businesses, communities, and tourists — governments set standards and regulations, businesses develop low-carbon products, communities participate in services, and tourists choose responsible consumption. There are differences in the research perspectives of domestic and foreign studies due to different stages of development and cultural contexts. Foreign early studies focused on concept clarification and practical paths of three-dimensional balance [13,14,15], while domestic studies pay more attention to the local practice of sustainable concepts, especially in cultural heritage sites such as Pingyao in Shanxi and Lijiang in Yunnan, proposing the principle of “protective development,” achieving a balance between culture and economy through mechanisms such as restricting tourist flow and using income to subsidize protection. After the pandemic, the connotation of sustainable tourism has expanded to include public health safety and community resilience construction, and the combination of technology and environmental protection has given birth to new products such as “carbon-neutral travel,” turning environmental concepts into perceptible consumer choices and promoting the transformation of green intentions into actions [16,17,18,19].
In general, the essence of sustainable tourism is to reconstruct the value logic of the tourism industry through conceptual and practical innovation, shifting from scale growth to quality improvement [20,21], from resource extraction to co-construction and sharing. Its theoretical development responds to challenges such as environmental crises and cultural homogenization, promoting the tourism industry to become an important field for practicing sustainable development goals. In the future, further exploration of cross-scale collaboration mechanisms, technological ethics, and community empowerment paths is needed to ensure that sustainable tourism transforms from concept to replicable practice, achieving the development vision of “environmentally friendly, economically viable, and socially inclusive.” Integrating existing research on smart tourism from a sustainable perspective [22,23,24,25,26,27,28], the research path of this manuscript is shown in Figure 1.
3. Theoretical Model
Based on relevant theories, this manuscript first proposes research hypotheses related to the key factors affecting tourist satisfaction and the relationships between these factors. The key factors affecting customer satisfaction include tourist expectations, perceived value, and perceived quality, while the hypotheses regarding the relationships between factors mainly involve the impact of tourist expectations on perceived quality and the impact of tourist expectations on perceived value.
Tourist expectations, as a key variable, continuously influence tourists’ satisfaction evaluations [34,35]. Taking the smart tourism scenic area in Datong City as an example, the study found that the expectations established by tourists before the experience directly affect their satisfaction levels. At the same time, destination attractiveness can meet tourists’ needs and expectations, providing a rich tourism experience. Therefore, destination attractiveness is categorized as part of tourist expectations. Perceived value refers to tourists’ comparison of the benefits obtained and the costs paid during the consumption process, which usually includes factors such as time, money, and effort. It directly affects tourists’ satisfaction because when tourists believe that the returns from their consumption exceed or equal their input, satisfaction usually increases. Specifically for smart tourism scenic areas, tourists perceived value is not only related to the scenic area’s service quality, facilities, and content of activities but also closely related to factors such as price, convenience, and personalized experiences. Tourism quality is closely related to the process of the services felt and the results of the services enjoyed. Perceived quality has two quality dimensions: technical quality means the result; and functional quality means the process. In many empirical studies in the tourism industry, most studies support the leading role of quality in affecting tourists’ satisfaction.
Tourists’ expectations have a significant impact on perceived quality [36]. When tourists’ expectations are high, if the actual experience fails to meet these expectations, perceived quality will decrease, leading to dissatisfaction and disappointment; on the contrary, if the actual experience exceeds tourists’ expectations, perceived quality will significantly increase, leading to higher satisfaction and loyalty. Therefore, tourism service providers need to manage tourists’ expectations through accurate promotion and transparent information transmission, ensuring that service quality matches expectations, thereby enhancing tourists’ overall experience and satisfaction, and thus enhancing word-of-mouth effects and re-visit rates. In this manuscript’s research, it is believed that tourists’ expectations before tourism will also affect the perceived quality of tourists’ actual experience. Tourists perceived quality directly affects their perceived value of the tourism experience. When tourists feel high-quality services, excellent facilities, and a pleasant overall experience during their trip, they often believe that the fees they paid have been fully rewarded, thereby enhancing perceived value. Conversely, if tourists experience poor service, facilities that do not meet expectations, or unsatisfactory factors, their perceived quality will decrease, leading to a reduction in perceived value. This relationship between perceived quality and perceived value also reflects tourists’ overall assessment of tourism products or services, affecting their satisfaction, loyalty, and future consumption decisions. Therefore, tourism destinations and service providers need to focus on improving service quality to ensure that tourists’ expectations can be effectively met, thereby enhancing perceived value.
In summary, this manuscript’s satisfaction model combines the SERVQUAL and Kano models. In the model construction process, the variable of perceived quality is dissected, combined with the actual experiences of smart tourism tourists in Datong City, and divided into two potential variables: smart infrastructure quality and smart service quality. By sorting out and logically reasoning the relationships among the six main variables—destination attractiveness, tourist expectations, smart infrastructure quality, smart service quality, perceived value, and tourist satisfaction—this manuscript proposes related research hypotheses, as shown in Table 1.
4. Pre-Study
This study employed both field interviews and questionnaire surveys to gather and measure the various variables required for this research. During the questionnaire design phase, existing research findings and well-established scales were integrated, and adjustments were made to the existing scales according to the actual survey situation. Specifically, when designing the questionnaire, standardized measurement tools from both domestic and international fields were first referenced. In line with the characteristics of the smart tourism sector and the actual conditions of Datong City, the original scales were optimized for localization. For instance, in measuring variables such as perceived quality, tourist expectations, and perceived value, validated scales were utilized, and certain questions were customized according to the research focus to ensure that the questionnaire could more accurately reflect the true feelings of the target group.
Furthermore, to ensure the validity and applicability of the questionnaire, feedback was collected through pre-investigations and pilot tests with experts, and the questionnaire content was further adjusted and optimized based on this feedback, refining the phrasing of questions and the setting of options. Ultimately, this manuscript constructed an initial measurement scale adapted to the context of this study and ensured its high reliability and validity. In the data collection phase, in addition to relying on questionnaire surveys, this manuscript also conducted field interviews to gain an in-depth understanding of tourists’ actual needs and perceptions, providing richer background information for quantitative analysis. The specific measured variables are organized as shown in Table 2.
4.1. Questionnaire Design
Questionnaire design is a commonly used method of data collection in fields such as social science research, market research, and psychological studies [40]. The research initially conducts a pilot study, performs reliability and validity analysis on the collected data, and further optimizes the questionnaire based on the results of field interviews with tourists to ensure its practical applicability. Through the aforementioned steps, the final formal questionnaire is determined. In this study, the questionnaire design regarding tourist satisfaction includes the following three dimensions, as shown in Table 3.
The outline of the pre-study interview content is shown in Figure 2. In the pre-study, this manuscript first reviewed the literature related to smart tourism and sustainable tourism to clarify the progress of existing research, research gaps, and deficiencies. An initial questionnaire targeting tourists was designed, including content on tourists’ basic information, frequency of use of smart tourism technology, perception of tourist experience, awareness of sustainable tourism, and satisfaction, etc. Adhering to the principle of simple random sampling, a pre-survey of online questionnaires was conducted among tourists visiting Datong City. A total of 236 questionnaires were collected, with 9 invalid questionnaires removed, resulting in 227 valid questionnaires, achieving a questionnaire validity rate of 96.19%. The data for each item is shown in the table below, as Table 4.
The variable coding involved in this manuscript is shown in Table 5.
4.2. Reliability and Validity Analysis
Reliability refers to the consistency and stability of a measurement tool across different times and environments [41]. In essence, reliability measures the consistency and dependability of the measurement results. If a measurement tool has high reliability, it can provide similar or consistent results when used multiple times or in different contexts. Pre-study reliability analysis assesses the consistency and stability of various measurement tools in a scale to ensure the reliability of the data. Cronbach’s alpha is a commonly used statistical indicator for measuring the consistency among items in a scale or questionnaire. It helps us evaluate the reliability of a questionnaire or scale, especially the internal consistency among items. A high Cronbach’s alpha indicates that the various items in the scale are highly correlated, reflecting that they measure the same underlying construct. Therefore, this manuscript uses Cronbach’s alpha to test the variables in the metric scale. The formula for calculating Cronbach’s alpha is as follows [42]:
where a is the number of items in the scale, b is the variance of each item, and c is the variance of the total score of the scale. Reliability analysis was conducted on the pre-study data using SPSS. The reliability analysis results for the tourist expectation scale are shown in Table 6.
From the analysis, it is evident that the Cronbach’s α values for each coded indicator, when compared to the revised Cronbach’s α values, do not show a significant increase after modification. This indicates that there is no need to make any changes to the values of the measured variables. Validity is an important concept used to measure whether a measurement tool truly measures what it claims to measure [43]. The purpose of validity analysis in pre-study is to test the effectiveness of the scale, ensuring that the measurement tool accurately reflects the target concept of the research. In this pre-study, expert review was conducted for each scale to confirm whether each item in the scale corresponds with the research objectives and theoretical framework. Through expert review, it is ensured that each scale can effectively measure the relevant dimensions, and that each item is clearly and accurately stated, avoiding conceptual bias.
Firstly, this manuscript conducted KMO (Kaiser-Meyer-Olkin) and Bartlett’s test of sphericity. The KMO result was 0.877, which is greater than 0.8 and therefore acceptable, and the p-value was 0, which is less than 0.05, indicating statistical significance [43,44]. The specific data can be seen in Table 7, laying the foundation for factor analysis.
Based on the KMO and Bartlett's test of sphericity, structural validity analysis is conducted to further analyze the data. This manuscript employs exploratory factor analysis (EFA) to assess the structural validity of the scale. The results shown in Table 8 indicate that the various items in the scale can be grouped into the expected factors, and the explained variance of each factor meets the research requirements. In EFA, the maximum likelihood method typically retains only components with eigenvalues greater than 1. This is because components with eigenvalues less than 1 explain less variance than a single variable and are therefore considered to have no practical significance [45]. Consequently, in this study, data from items 7 to 20 will not be extracted and rotated. The first six factors are sufficient to demonstrate that the scale has good structural validity and can effectively reflect the different dimensions being measured.
5. Empirical Analysis
After obtaining certain conclusions from preliminary research and analysis, this manuscript will conduct empirical research to further analyze the factors affecting the satisfaction of smart tourism in Datong City.
5.1. Data Collection and Descriptive Statistics
Currently, Datong City has 35 A-level tourist attractions, including 1 5A-level tourist attraction and 11 provincial-level tourist resorts. Taking into account the development status and regional distribution of each smart scenic spot, a total of 17 smart scenic spots were selected from Table 9 as research survey objects.
5.2. Testing and Analysis
In this empirical study, multiple smart scenic spots within Datong City were selected as research objects, targeting tourists for the collection of relevant data. To ensure the representativeness of the sample and the scientific nature of the data, random sampling methods were employed for both online and offline questionnaire distribution and collection. During the research process, after effective distribution and collection of questionnaires, a total of 600 questionnaires were collected. After data cleaning and validity screening, 496 valid questionnaires were ultimately selected, with a questionnaire efficiency rate of 82.67%, as detailed in Table 10.
Common Method Bias (CMB) is a common phenomenon in social science, behavioral science, and management research, especially in studies that rely on self-reported data collection. It refers to systematic biases in data that result from using the same measurement methods or sources in research. In this study, to test for the existence of common method bias, the researcher used Harman’s single-factor test. This test involves conducting principal component analysis (PCA) or factor analysis to check whether the variance of all variables can be explained by a single factor. According to the analysis results, if a single factor can explain most of the variance, then common method bias may exist.
The data analysis results of this study show that there are 6 factors with eigenvalues greater than 1, which meets the basic conditions for conducting multi-factor analysis. However, the principal component analysis results indicate that the largest factor can only explain 31.62% of the total variance, a proportion significantly lower than the critical standard of 50%. This finding suggests that there is no single dominant factor in the data, and the explanatory power of each factor is relatively balanced.
Based on the principle of Harman’s single-factor test, it can be concluded that there is no serious common method bias problem in the data of this study. This means that the research results are unlikely to be affected by the influence of a single measurement method or source, thereby increasing the reliability and validity of the research results.
5.3. Empirical Reliability and Validity Analysis
As mentioned earlier, the empirical analysis reliability test is carried out using the statistical software SPSS to calculate the Cronbach’s Alpha coefficients for six potential variables as well as the overall questionnaire. Generally, the value of Cronbach’s Alpha should be greater than 0.7, with 0.7-0.8 considered good, 0.8-0.9 considered excellent, and above 0.9 considered very good. If the coefficient is too low, less than 0.6, it suggests that the scale’s reliability is poor, and there may be a need to modify the questions in the questionnaire. Additionally, it is necessary to organize the Cronbach’s α values for each latent variable and the Cronbach’s α values after removing each item, and then analyze and make judgments based on the results presented in Table 11.
The first step in validity testing is to carry out the KMO and Bartlett's test of sphericity. The results show that the KMO value is 0.977, which is much greater than 0.9; at the same time, the P-value is 0.000, which is less than 0.05 and is significant. Table 12 indicates that the empirical research data meets the relevant testing standards, proving that the data is suitable for subsequent factor analysis.
Continuing with SPSS, we conduct an exploratory factor analysis to check whether each question in the questionnaire can be appropriately allocated to the correct factors based on theoretical constructs. The results of the exploratory factor analysis in the empirical study are shown in Table 13.
Similarly, if the factor loadings, which represent the loading of each question on its factor, are greater than 0.4-0.5, and each factor has a high proportion of explained variance, it is generally considered that the construct validity is good. According to the results displayed in the table, there are six factor components with eigenvalues greater than 1, indicating that six common factors can be extracted; and their cumulative explained variance percentage reaches 64.887%, which is greater than 60%, meeting the required evaluation criteria.
The measurement model fit test refers to the use of statistical methods to assess the effectiveness of a measurement model in fitting data, ensuring that the model can appropriately reflect the structure of observed data. The fit assessment of the measurement model for the six variables shows that the standardized factor loadings of all measurement indicators are greater than the acceptable threshold of 0.5. In the model fit test, the Root Mean Square Error of Approximation (RMSEA) is below the critical value of 0.08, and all other fit indices have reached the ideal level. Based on the analysis of various indices, the measurement model has a good fit and has passed the model fit test. After concluding that the model fits well, an analysis of inflammatory factors is also necessary. This manuscript uses AMOS software for this analysis, obtaining the factor loading values of each variable in the model and calculating the Composite Reliability (CR) and Average Variance Extracted (AVE) for each latent variable. The specific results are shown in Table 14. Unlike the preliminary research mentioned earlier, to ensure the reliability and accuracy of the research analysis, this manuscript adopts the AVE method for discriminant validity test [48,49,50].
The results from the table indicate that the square roots of the AVE values for each latent variable are 0.789, 0.757, 0.734, 0.723, 0.873, and 0.812. The table also presents the correlation coefficients between each pair of latent variables. After a careful comparison and analysis of these data, it can be observed that the square root of the average variance extracted (AVE) for each latent variable exceeds the correlation coefficients between them and other latent variables. Moreover, the correlations between each pair of latent variables are maintained within an appropriate range. Based on this, we can conclude that the variables in the model constructed in this study exhibit excellent discriminant validity.
5.4. Hypothesis Testing
Hypothesis testing is an important step in analyzing the satisfaction of smart tourism from a sustainable perspective, and first of all, it is necessary to verify the model’s fit. According to the previous explanation of the structural equation model fit indicators, this manuscript selects CMIN, DF, CMIN/DF, GFI, IFI, AGFI, and RMSEA, a total of 7 fit indicators for model testing. The specific results are shown in Table 15.
From the table, it can be seen that CMIN/DF is 1.738, below 3, RMSEA is 0.012, below 0.05, both meeting the ideal standards; other indicators are all above 0.9, meeting the expected requirements. Therefore, the smart tourism passenger satisfaction model in this study meets the fit standards and can proceed with hypothesis testing. Similarly, the correlation data between variables is obtained using the software’s built-in functions. The study systematically organizes the effect indicators obtained from the model analysis and integrates them into a data summary table. This table fully presents the test results of each hypothetical path in the theoretical model, including non-standardized regression coefficients, standardized regression coefficients, and their significance levels, etc., providing intuitive data support for the interpretation of research conclusions on the impact factors of tourist satisfaction from a sustainable perspective in Datong City.
According to the data results in Table 16, this manuscript has tested the hypotheses proposed in this study one by one. The P-values for the direct influence paths of the six latent variables of destination attractiveness, tourist expectations, smart infrastructure quality, smart service quality, perceived value, and tourist satisfaction on tourist satisfaction are all less than 0.05, indicating that these factors have a significant positive impact on tourist satisfaction. Therefore, hypotheses H1, H2, H3, H4, and H5 are all verified.
The P-values for the influence paths of tourist expectations and destination attractiveness on smart infrastructure quality and smart service quality are all less than 0.05, reaching a significant level, indicating that these two variables have a significant positive impact on smart infrastructure quality and smart service quality. Therefore, hypotheses H6, H7, H8, and H9 are supported.
The P-values for the influence paths of tourist expectations and destination attractiveness on smart infrastructure quality and smart service quality are all less than 0.05, reaching a significant level, indicating that these two variables have a significant positive impact on smart infrastructure quality and smart service quality. Therefore, hypotheses H6, H7, H8, and H9 are supported.
The P-values for the direct influence paths of destination attractiveness and tourist expectations on perceived value are all less than 0.05, meeting the significance requirements, indicating that these two variables have a significant positive impact on perceived value. Therefore, hypotheses H10 and H11 are supported. However, the P-values for the influence paths of smart infrastructure quality and smart service quality on perceived value are all greater than 0.05, not reaching the significance level, indicating that these two factors do not significantly affect perceived value. Therefore, hypotheses H12 and H13 are not supported.
6. Conclusions
This study primarily relies on data from tourists at Datong City’s tourist attractions for analysis. Due to limited capabilities, not all scenic spots were selected, hence there is a geographical limitation to the sample. Tourists’ satisfaction is influenced by various subjective factors such as personal experiences, emotions, and cognition. Although this study analyzes through questionnaire surveys and empirical data, tourists’ satisfaction may still be affected by psychological factors that cannot be quantified. Different tourists may have significant differences in their cognition and feelings towards the same smart tourism service, so some factors in the study may not fully cover all dimensions affecting tourists’ satisfaction. This study is based on a one-time empirical survey, lacking long-term tracking data on tourists’ satisfaction. The perception and attitude of tourists towards smart tourism services may change over time, therefore, future research can explore the dynamic changes and long-term influencing factors of tourists’ satisfaction through long-term data collection.
This study, based on the tourist data from Datong City’s tourist attractions, systematically investigates the key factors affecting tourists’ satisfaction under the context of smart tourism. The study finds that tourists’ demographic characteristics have a significant impact on their satisfaction. Specifically, age is an important distinguishing variable: the youth tourist group shows a significant preference for technology products and intelligent services, as well as a higher degree of technology acceptance; in contrast, the elderly tourist group has differences in needs and adaptability in this regard. Income level also constitutes a key influencing factor: tourists with higher incomes show a higher demand for high-end services in smart tourism, and their expectations for service quality correspondingly increase, making the achievement of their satisfaction particularly important for the brand value enhancement of scenic spots and tourism enterprises. Additionally, factors such as education level also show relevance.
The role of sustainable tourism concepts in the practice of smart tourism cannot be ignored, and its core principles: protecting natural resources, promoting social equity, and ensuring economic benefits also profoundly affect tourists’ satisfaction. This study confirms that when tourist destinations integrate sustainability principles such as environmental protection, cultural heritage, and community development into smart tourism planning and operations, tourists’ satisfaction significantly increases. This is particularly crucial in areas with limited tourism resources or environmentally sensitive areas, emphasizing the importance of balancing tourists’ needs with the carrying capacity of the environment. The perception of destination ecological protection and community responsibility is highly positively correlated with overall satisfaction, and smart tourism destinations with sustainable characteristics are more likely to win the trust and positive evaluation of tourists.
The completeness and performance of smart tourism facilities have been confirmed as core determinants affecting tourists’ satisfaction. This includes: efficient and convenient intelligent information service systems, real-time interactive feedback mechanisms, and seamless integration of transportation navigation and electronic payment methods. The study specifically points out that the gap between tourists’ service expectations and actual experience perception is an important cause of dissatisfaction and a decline in satisfaction. Therefore, ensuring that smart tourism facilities have efficiency, reliability, and user-friendliness, and striving to closely match technological applications with tourists’ needs and expectations, is the core element in improving satisfaction.
Author Contributions
I have read and agreed to the published version of the manuscript.
Data Availability Statement
The data set can be obtained if any email at 13934775884@163.com.
Acknowledgments
I would like to express my sincere gratitude to the Datong Culture and Tourism Bureau, the visitors who came to Datong's A-level scenic spots, and the visitors who cooperated with this research survey! I would also like to thank Mr. Yao, who guided me in this research, for his help in enabling me to conduct the analysis and research smoothly.
Conflicts of Interest
The author declare no conflicts of interest.
References
- Deng, N.; Zhang, Y.J. Smart Tourism: Dialectical Thinking from Stakeholder Perspectives. Tour. Trib. 2023, 38, 3–5. [Google Scholar]
- Zhang, X.Y. Research on Smart Tourism Construction and Development Path from Information Ecology Perspective. Econ. Probl. 2018, (05), 124–128.
- Zhao, Y. Research on Guizhou Tourism Development Strategy Based on Smart Tourism. Macroecon. Manag. 2017, (S1), 8–9.
- Li, Q.Y. Research on Coupling Between Tourism Information and Regional Tourism Cooperation Under Big Data Background. Inf. Sci. 2016, 34, 129–132. [Google Scholar]
- Cvetic, M.; Batinic, D.D.; Kadic, S.; et al. Employees’ Technology Adoption in the Context of Smart Tourism Development: The Role of Technological Acceptance and Technological Readiness. Eur. J. Innov. Manag. 2024, 27, 2457–2482. [Google Scholar]
- Yue, J.Y. Research on Smart Tourism Experience Platform Construction and Management Innovation Based on Information Technology. Manage. Modernization 2017, 37, 41–43+77. [Google Scholar]
- Dong, Y.J.; Tian, B. Optimization of Urban Tourism Supply System Based on Smart Tourism. Resour. Dev. Mark. 2015, 31, 1391–1394. [Google Scholar]
- Li, W.; Li, H.F.; Yang, J. Evaluation of Scenic Area Website Service Functions from Smart Tourism Perspective: Case Study of 10 5A Tourist Attractions in North China. Resour. Dev. Mark. 2015, 31, 1149–1152. [Google Scholar]
- Jia, H.Y. Public Information Service Strategy Under Smart Tourism Background. Inf. Sci. 2015, 33, 145–149. [Google Scholar]
- Huang, J.F.; Lu, L.; Zhang, Y. Research on Connotation System and Construction Strategy of Smart Scenic Spots Based on Technology Acceptance Perspective. Sci. Technol. Manag. Res. 2015, 35, 164–168+178. [Google Scholar]
- Du, P.; Yang, L. Research on Smart Tourism System Construction and Development Strategy. Sci. Technol. Manag. Res. 2013, 33, 44–49. [Google Scholar]
- Qiao, X.J. Smart Tourism Empowers High-Quality Tourism Development. Tour. Trib. 2022, 37, 10–12. [Google Scholar]
- Guo, Y.R. How Can Smart Tourism Become “Smarter”? People’s Trib. 2019, (08), 76–77.
- Wu, H.Y. Theory and Practice of Developing All-for-One Tourism from Smart Tourism Perspective. Inquiry Econ. Issues 2018, (08), 60–66.
- Zhou, B.; Zhou, L.Q. Research on Foreign Smart Tourism Business Models and Enlightenment to China. Tour. Trib. 2016, 31, 8–9. [Google Scholar]
- Chen, T.; Liu, Q.L. Big Data Application Research Under Smart Tourism Background: Tourism Demand Forecasting Case Study. E-Government 2015, (09), 6–13.
- Avcikurt, A. Sustainability, Smart Tourism Destinations and Evolving Visitor Preferences. Worldw. Hosp. Tour. Themes 2024, 16, 675–679. [Google Scholar]
- Wu, W.; Xu, C.; Zhao, M.; et al. Digital Tourism and Smart Development: State-of-the-Art Review. Sustainability 2024, 16, 10382. [Google Scholar] [CrossRef]
- Siddik, B.A.; Forid, S.M.; Yong, L.; et al. Artificial Intelligence as a Catalyst for Sustainable Tourism Growth and Economic Cycles. Technol. Forecast. Soc. Chang. 2025, 210, 123875. [Google Scholar] [CrossRef]
- Dai, X.J.; Ding, D.S.; Lin, C. Measurement Issues of Tourism Environmental Carrying Capacity Under Sustainable Tourism. Hum. Geogr. 2002, (06), 32–36.
- Si, J.L. Three-Dimensional Docking Research of Tourism Consumption-Oriented Tourism Industry Development. Reform Econ. Syst. 2001, (04), 134–137.
- Tao, W. Sustainable Tourism Development Research on China’s “World Heritage”. Tour. Trib. 2000, (05), 35–41.
- Wang, F.Y. Theory and Practice of Sustainable Tourism. Manag. World 1999, (04), 82–87.
- Jeelani, P.; Shah, A.S.; Dar, N.S.; et al. Managing Mass Tourism in Mountain Ecosystems Through Instrument of Sustainable Tourism Indicators. Environ. Dev. Sustain. 2024, (2), 1–28. [CrossRef]
- Liu, J.M.; Yang, X.J. Preliminary Study on Sustainable Tourism Planning of Ecotourism Destinations. J. Nat. Resour. 1999, 14, 80–84. [Google Scholar]
- Su, M.M. Sustainable Tourism and Tourism Destination Community Development. Tour. Trib. 2014, 29, 8–9. [Google Scholar]
- Zhong, L.S. Discussion on Sustainable Tourism Development History and Future Research Topics. Tour. Trib. 2014, 29, 6–7. [Google Scholar]
- Jin, Y. Exploration of Ecotourism Theory and Practice: Case Study of Southern Mountainous Area in Jinan. Dongyue Trib. 2011, 32, 123–125. [Google Scholar]
- Saranjam, B.; Amjad, A.; Ullah, S.K. Exploring the Interplay of Tourism Impacts, Quality of Life, and Community Engagement in Developing Sustainable Nature-Based Tourism in Pakistan. GeoJournal 2024, 89. [Google Scholar] [CrossRef]
- Thi Pham, B.; Nguyen, V.D.P. Sustainable Tourism Branding: A Bibliographic Analysis. Cogent Soc. Sci. 2023, 9. [Google Scholar] [CrossRef]
- Shoghi, S.; Jafari, S.; Rajabzadeh Ghatari, A.; et al. Developing Sustainable Tourism Destinations Through Smart Technologies: A System Dynamics Approach. J. Simul. 2023, 17, 477–498. [Google Scholar]
- Molina, J.J.; Fernandez, G. Sustainable Tourism Destinations. J. Hosp. Tour. Res. 2022, 46, 1239–1240. [Google Scholar] [CrossRef]
- Lin, C.; Yin, J. A Study on the Relationship Between Tourist Satisfaction and Tourism Image Perception Based on Web Text and Gra Model. Tour. Manag. Technol. Econ. 2022, 5. [Google Scholar]
- Singh, S.J.; Kumar, M.K.; Kumar, V.P. Impact of Sustainable Tourism on Tourist’s Satisfaction: Evidence from India. Bus. Perspect. Res. 2023, 11, 173–189. [Google Scholar]
- Le, H.T.; Tri, M.H.; Le, T.Q. Visitor Satisfaction Mediating Perceived Quality and Behavioural Intention: A Gender-Based Multigroup Analysis. J. Int. Bus. Entrep. Dev. 2024, 16, 236–260. [Google Scholar] [CrossRef]
- Law, M.W.L.; Millar, K.J.; Dash, M. Augmented and Virtual Reality in Hotels: Impact on Tourist Satisfaction and Intention to Stay and Return. Int. J. Hosp. Manag. 2024, 116. [Google Scholar]
- Weng, L.; Tan, L.; Yu, Y. The Effects of Perceived Cultural and Tourism Public Services on Visitor Satisfaction and Quality of Life: A Multiple Mediation Model. Land 2023, 12. [Google Scholar] [CrossRef]
- Liu, F.C.; Liu, A.L.; Liu, M. Tourist Satisfaction: Connotation, Measurement and Formation Mechanism—Review of Foreign Relevant Research. Areal Res. Dev. 2017, 36, 97–103. [Google Scholar]
- Lai, X.F.; Xie, J.X.; Wang, X.R. Quality Elements of Rural Tourist Attractions and Their Impact on Visitor Satisfaction—Kano Model Based on Explainable Neural Networks. Tour. Sci. 2023. [Online First]. [Google Scholar]
- Li, R.Y.; Shi, Z.Y. Mechanism of Tourist Value Co-Creation Behavior on Tourism Satisfaction—A Moderated Mediation Model. J. Arid Land Resour. Environ. 2022, 36, 201–208. [Google Scholar]
- Zhou, X.J.; Lü, H.J. Research on Relationship Between Image of Popular Tourist Destinations and Tourist Loyalty Under Tourist Involvement. J. Arid Land Resour. Environ. 2022, 36, 192–200. [Google Scholar]
- Qiu, Y.Y.; Wang, E.D.; Yu, Y. Research on Leisure Fishing Tourist Satisfaction Based on Bayesian Multivariate Ordered Probit Model. Oper. Res. Manag. Sci. 2021, 30, 147–152. [Google Scholar]
- Zuo, J.J.; Tang, H.Q. Impact of Smart Tourism Construction on Tourist Satisfaction—Research Based on Shanghai Disneyland. Consum. Econ. 2020, 36, 79–89. [Google Scholar]
- Zhao, C.Y.; Chen, M.A. Analysis of Tourist Satisfaction Influencing Factors Based on Web Text Analysis. Stat. Decis. 2019, 35, 115–118. [Google Scholar]
- Gao, J.; Xu, C.L.; Liu, C.J. Impact of Familiarity on Tourist Satisfaction Evaluation of Tourism Destinations—Comparison of Chinese and Western Tourists Visiting Xi’an. East China Econ. Manag. 2015, 29, 111–116. [Google Scholar]
- Zou, B. Measurement and Path Simulation of Tourism Product Customer Satisfaction. Stat. Decis. 2014, (17), 58–61.
- Yang, C.M.; Zhao, B.F. Study on Tourist Satisfaction Perception and Promotion Strategy of Tourism Destinations—Case of Harbin, Heilongjiang. J. Arid Land Resour. Environ. 2014, 28, 177–182. [Google Scholar]
- Zhou, X.J.; Yang, Y. Relationship Between Tourist Satisfaction and Loyalty in Summer Resorts Based on SEM—Case of Huangshui Town, Chongqing. Resour. Dev. Mark. 2014, 30, 231–234. [Google Scholar]
- Luo, W.B.; Xu, F.X.; Timothy, D.J.; et al. Impact of City Characteristics on Urban Tourist Satisfaction—Quantitative Analysis Based on Probit Model. Tour. Trib. 2013, 28, 50–58. [Google Scholar]
- Ma, H.Q.; Liu, Y.X.; Yan, M.Q.; et al. Tourist Satisfaction with Public Tourism Services Based on SEM and IPA Model. J. Arid Land Resour. Environ. 2021, 35, 192–199. [Google Scholar]
Figure 1.
The research path.
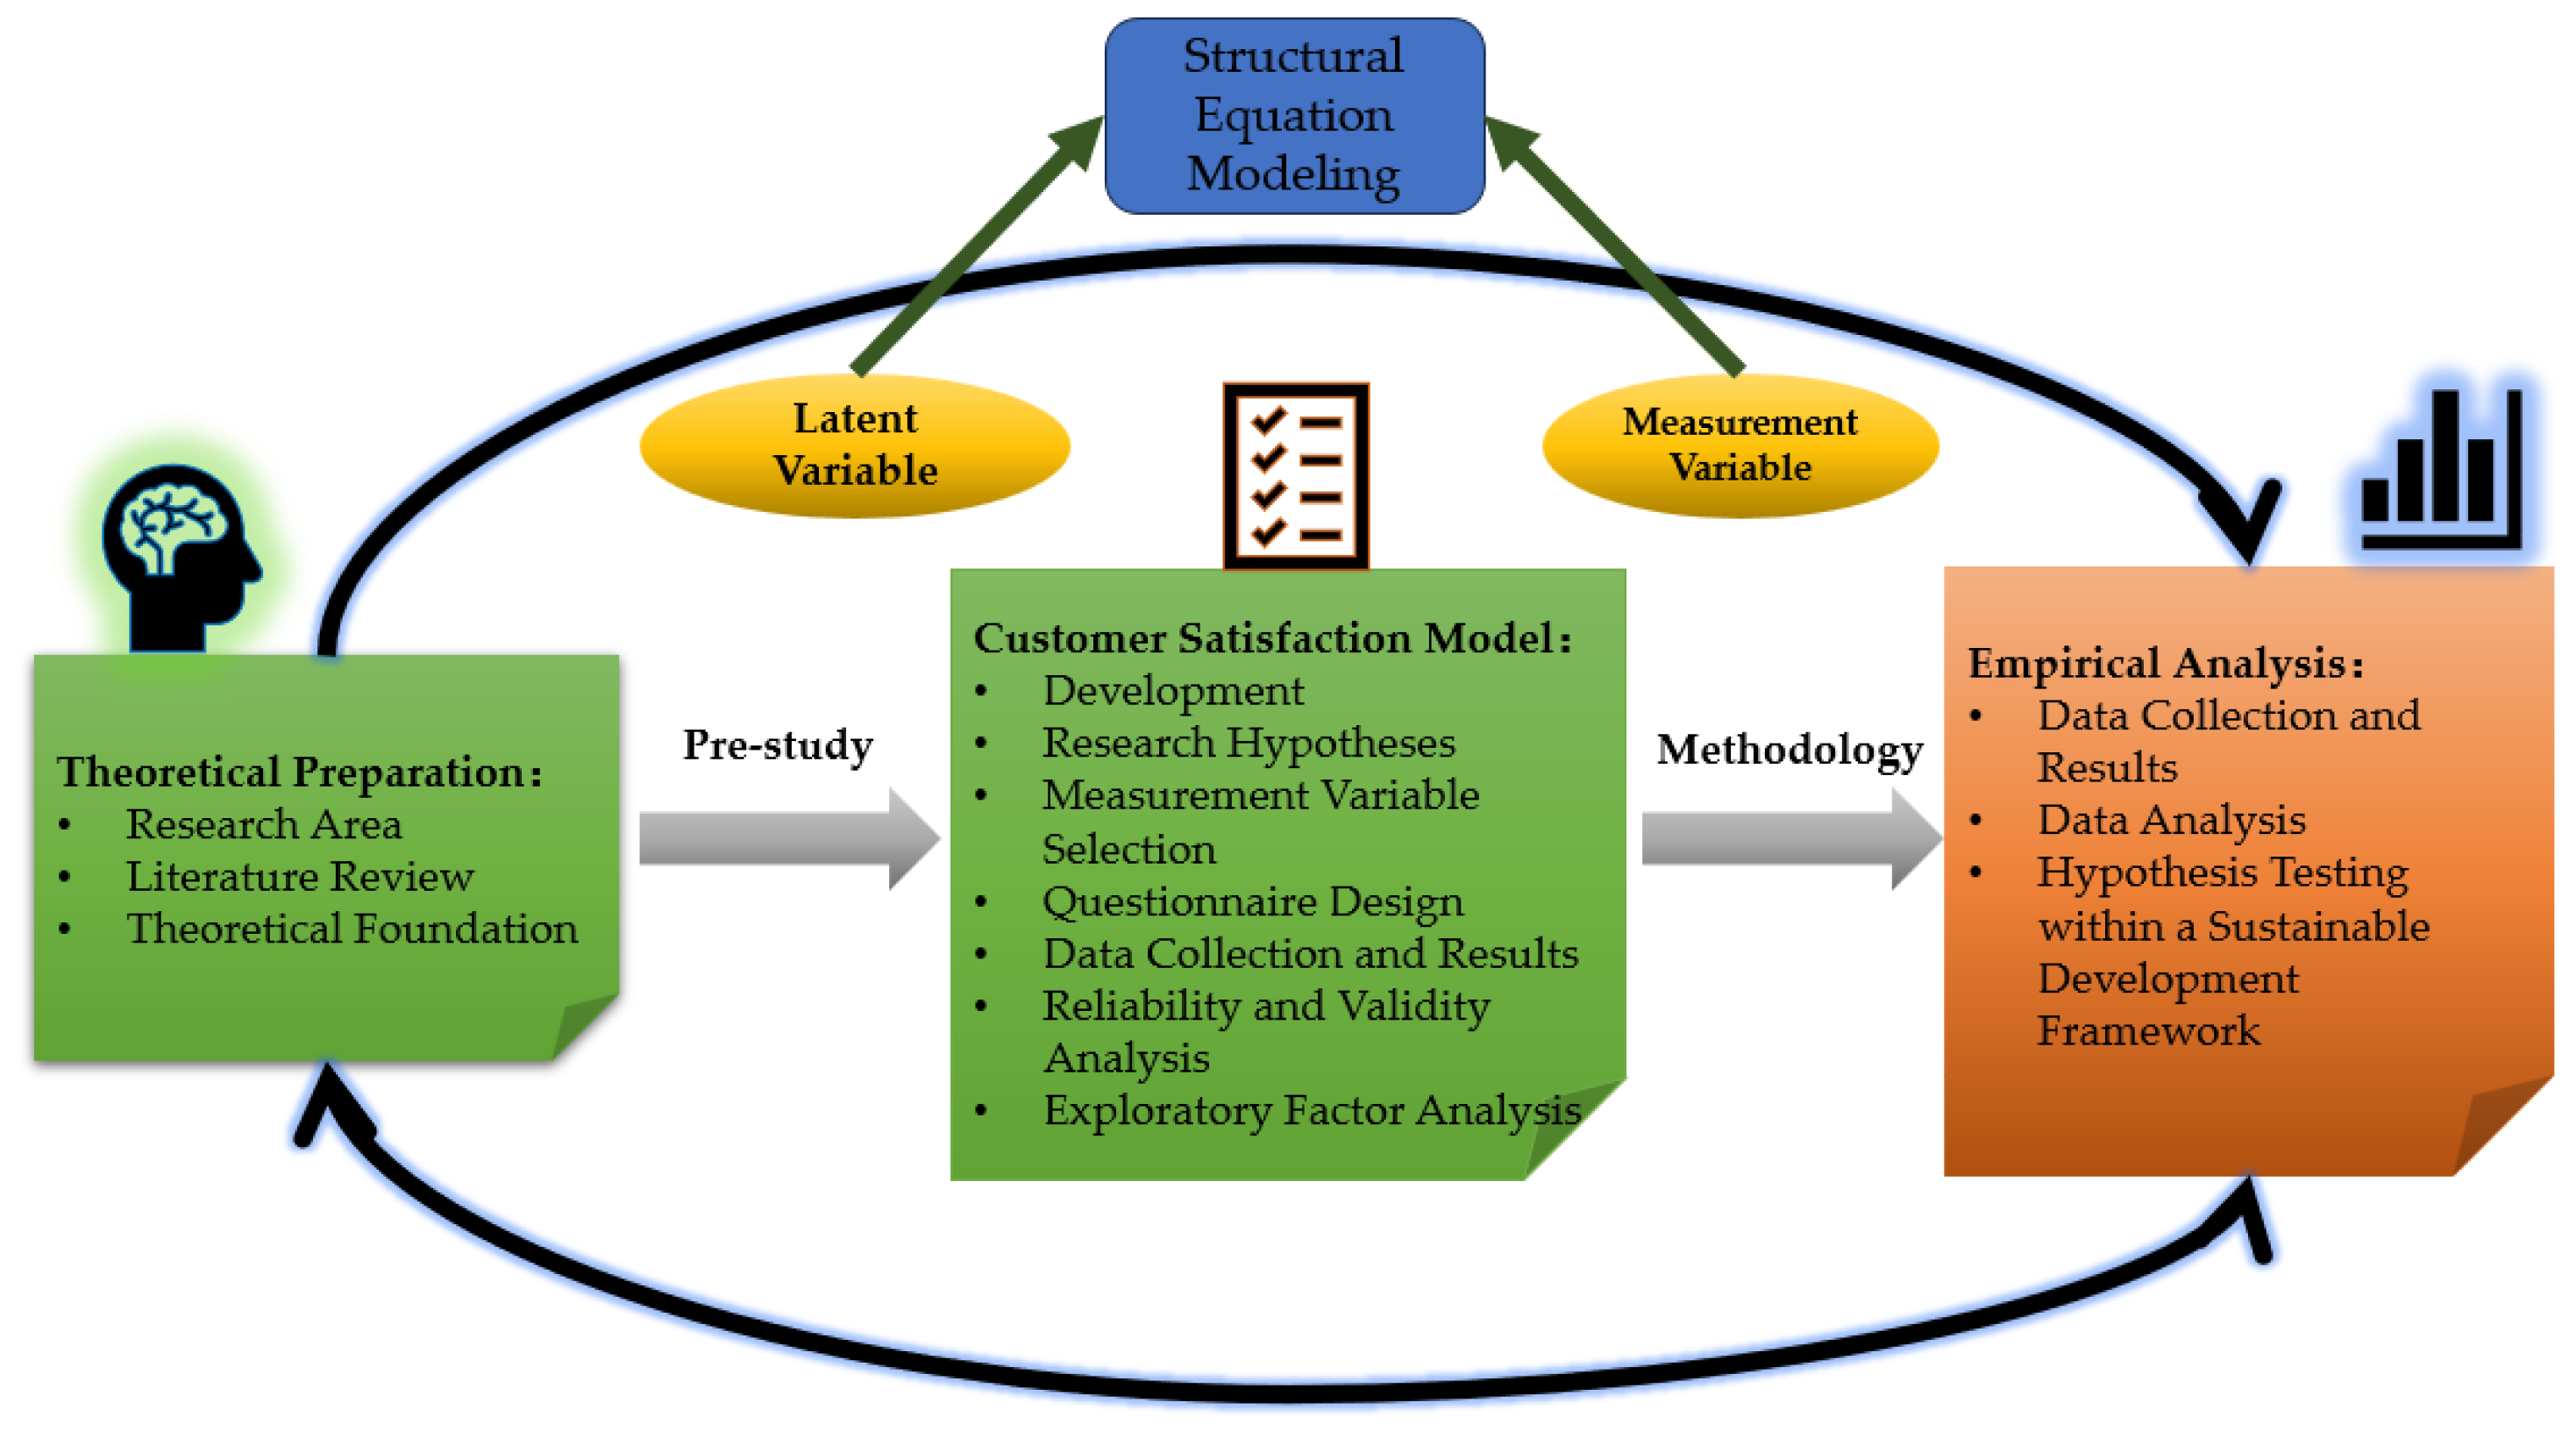
Figure 2.
The outline of the questionnaire.
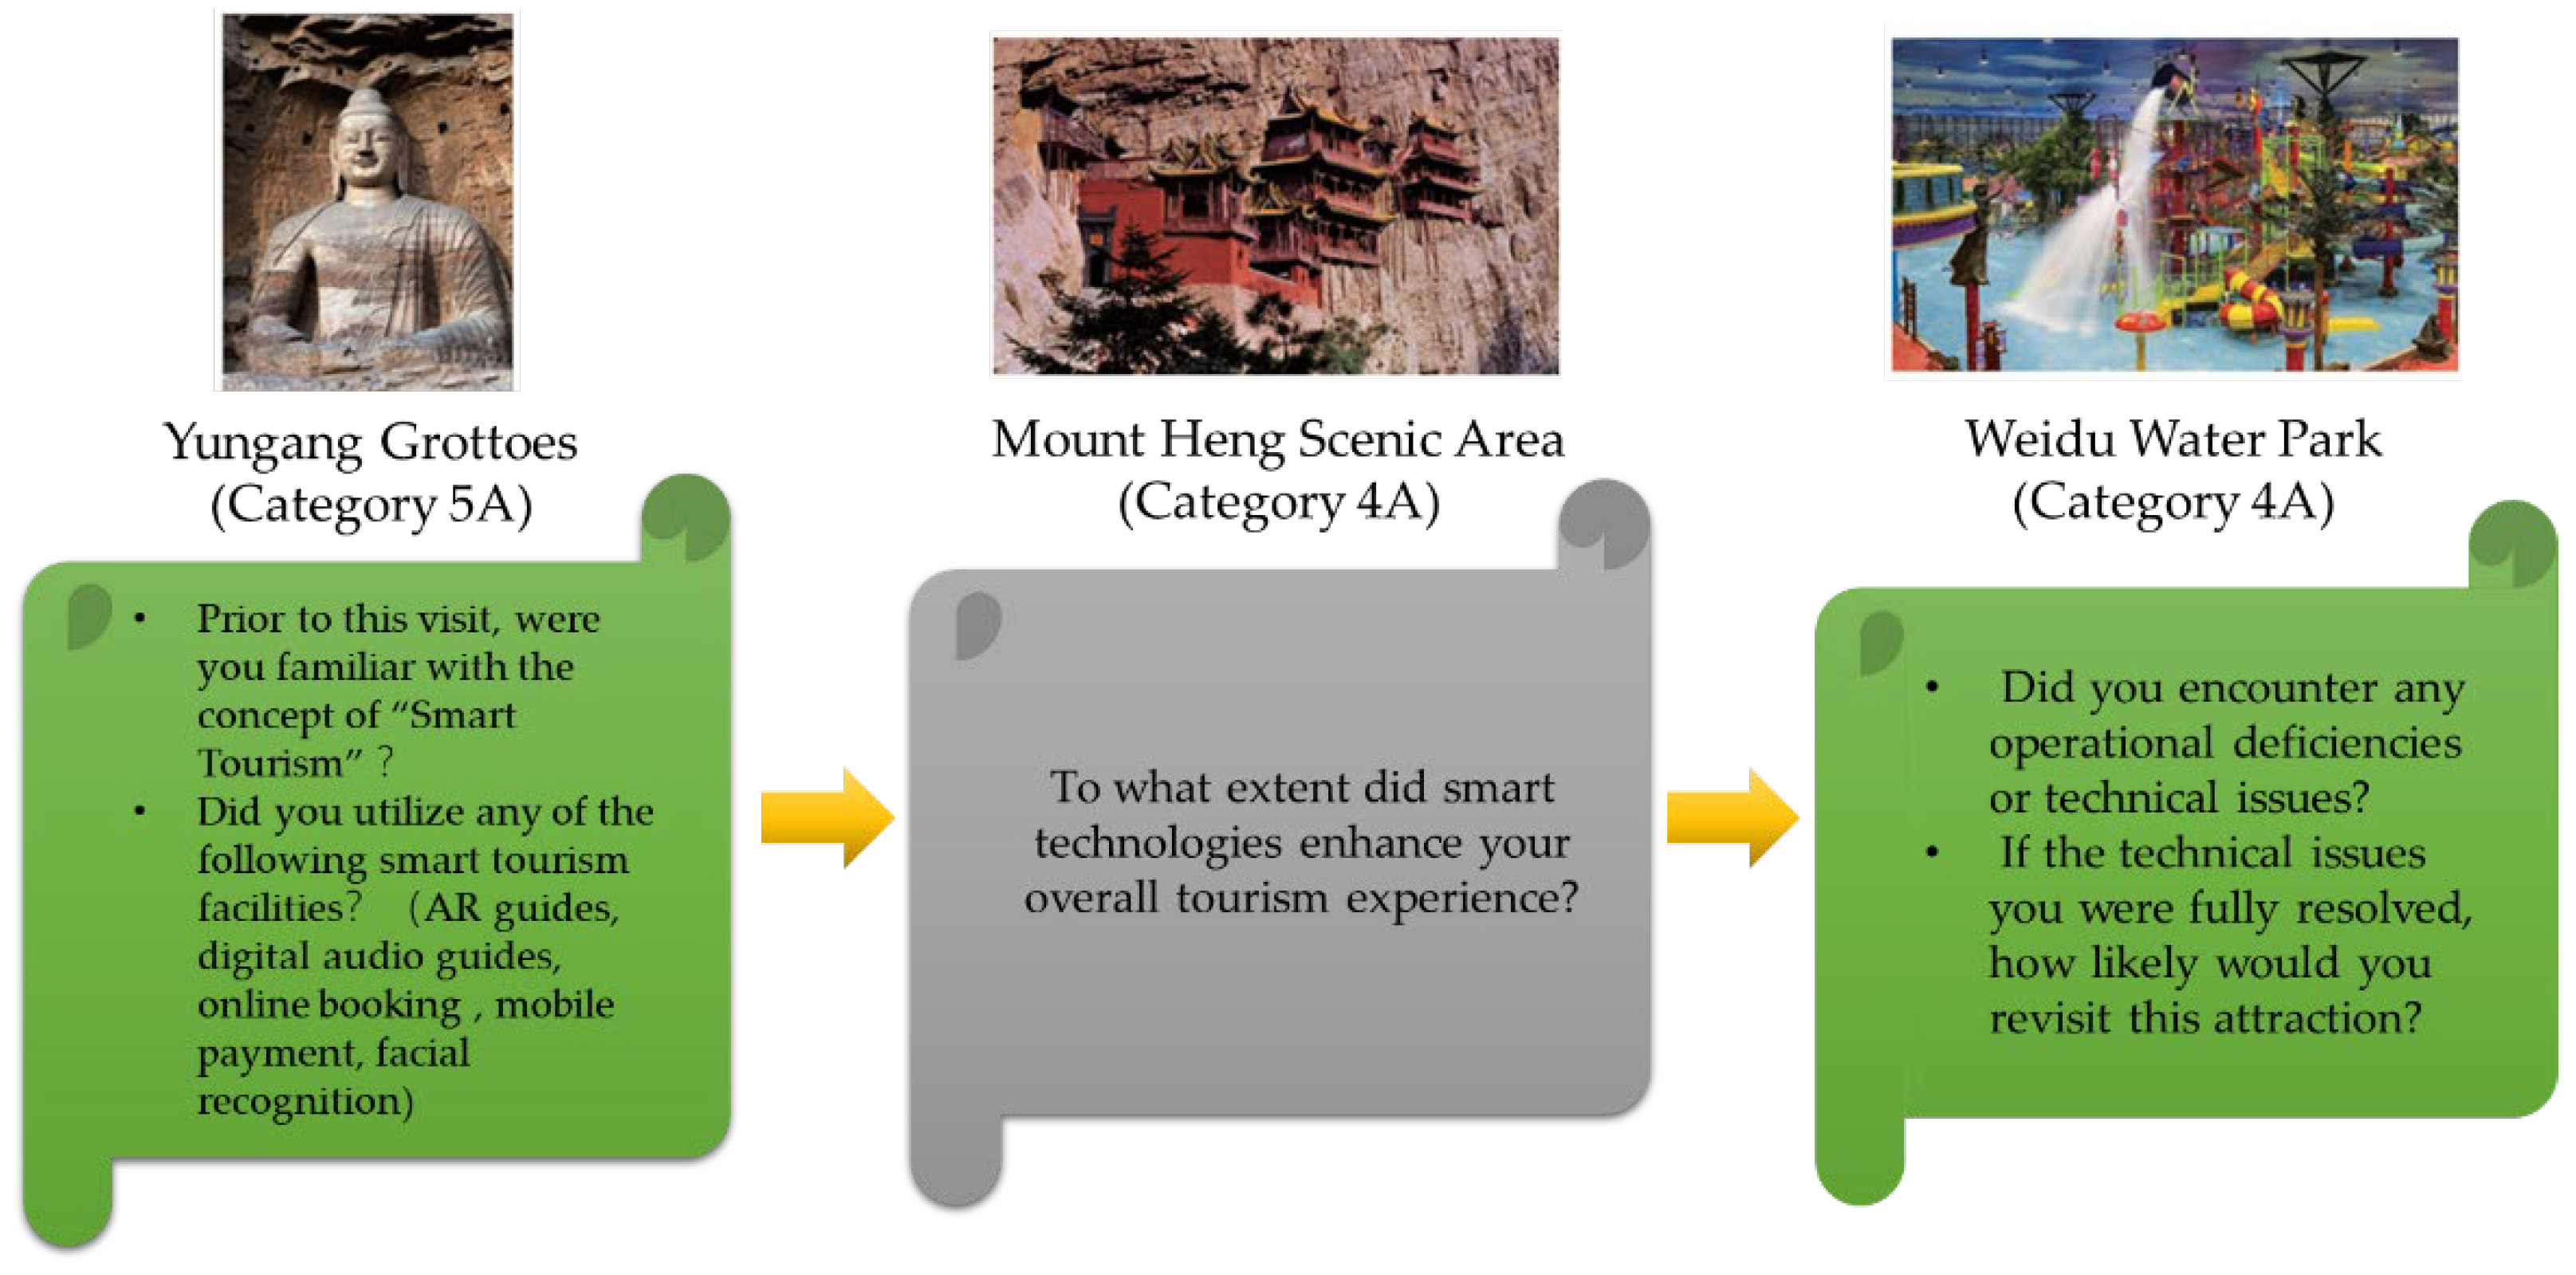

Table 1.
Hypotheses of Satisfaction Model Study.
| Hypotheses number | Hypotheses |
|---|---|
| H1 | Destination attractiveness has a positive impact on tourist satisfaction [37]. |
| H2 | Tourist expectations have a positive impact on tourist satisfaction. |
| H3 | Perceived value of tourists has a positive impact on tourist satisfaction. |
| H4 | Quality of smart infrastructure has a positive impact on tourist satisfaction. |
| H5 | Quality of smart services has a positive impact on tourist satisfaction. |
| H6 | Destination attractiveness has a positive impact on the quality of smart infrastructure. |
| H7 | Destination attractiveness has a positive impact on the quality of smart services. |
| H8 | Tourist expectations have a positive impact on the quality of smart infrastructure. |
| H9 | Tourist expectations have a positive impact on the quality of smart services. |
| H10 | Destination attractiveness has a positive impact on perceived value. |
| H11 | Tourist expectations have a positive impact on perceived value. |
| H12 | Quality of smart infrastructure has a positive impact on perceived value. |
| H12 | Quality of smart services has a positive impact on perceived value. |
Table 2.
Measurement Variables.
| Latent Variable | Measurement Variable |
|---|---|
| Service Quality of Smart Tourism | Network Speed; Smart Parking System; Time for System to Process Requests; Interface Design; Smart Ticket Service; Smart Catering Service [38] |
| Perceived Value | Cost Perception; Time Perception; Overall Perception [39] |
| Tourist Satisfaction | Compared to Expectations; Compared to Ideal; Overall Satisfaction |
Table 3.
Questionnaire Content.
| Content | Purpose |
|---|---|
| Basic Information of Tourists | Information such as the age, occupation, and whether it is the first time visiting Datong for tourists. |
| Tourism Experience Satisfaction | Involves six key dimensions: Destination Attractiveness, Tourist Expectations, Quality of Smart Infrastructure, Quality of Smart Services, Perceived Value, and Overall Tourist Satisfaction. Rated using a 7-point Likert scale, with scores ranging from 1 to 7, where higher scores indicate stronger satisfaction with the relevant factors. |
| Intention to Recommend and Suggestions for Improvement in the Future | Interview design, this manuscript adopts a fully open-ended interview approach, aiming to guide respondents to express their opinions and experiences without leading questions. |
Table 4.
Pre-study Questionnaire Data Statistics.
| Characteristic | Information | Number | Percentage |
|---|---|---|---|
| Gender | Male | 101 | 44.49 |
| Female | 126 | 55.51 | |
| Age | Under 18 | 12 | 5.29 |
| 18-30 | 83 | 36.56 | |
| 30-50 | 79 | 34.80 | |
| Over 50 | 53 | 23.35 | |
| Education Level | High School or below | 59 | 25.99 |
| Junior College | 58 | 25.55 | |
| Bachelor’s degree or above | 110 | 48.46 | |
| Monthly Income | Less than 3000 RMB | 46 | 20.26 |
| 3000-8000RMB | 122 | 53.74 | |
| 8000RMB-15000RMB | 37 | 16.30 | |
| More than 15000 RMB | 22 | 9.69 | |
| Number of Visits to Datong City | 1 time | 113 | 49.78 |
| 2 times | 61 | 26.87 | |
| 3 times | 53 | 23.35 |
Table 5.
Variable Coding.
| Latent Variable | Measurement Variable | Code |
|---|---|---|
| Tourist Expectations | Overall Expectations | V11 |
| Expectations of Unique Features | V12 | |
| Information Release | V13 | |
| Complaint Handling | V14 | |
| Crowd Control | V15 | |
| Destination Attractiveness | Natural Landscape Attractiveness | V21 |
| Cultural and Historical Attractiveness | V22 | |
| Quality of Smart Infrastructure | Coverage of Smart Devices | V31 |
| Network Speed | V32 | |
| Smart Parking System | V33 | |
| Quality of Smart Services | System Processing Time | V41 |
| Interface Design | V42 | |
| Ticket Service | V43 | |
| Catering Service | V44 | |
| Perceived Value | Cost Perception | V51 |
| Time Perception | V52 | |
| Overall Perception | V53 | |
| Tourist Satisfaction | Compared to Expectations | V61 |
| Compared to Ideal | V62 | |
| Overall Satisfaction | V63 |
Table 6.
Results of Variable Reliability Analysis.
| Latent Variable | Cronbach’s α value | Code | Revised Cronbach’s α value |
| Tourist Expectations | 0.955 | V11 | 0.899 |
| V12 | 0.811 | ||
| V13 | 0.856 | ||
| V14 | 0.891 | ||
| V15 | 0.884 | ||
| Destination Attractiveness |
0.912 | V21 | 0.851 |
| V22 | 0.865 | ||
| Quality of Smart Infrastructure | 0.889 | V31 | 0.863 |
| V32 | 0.825 | ||
| V32 | 0.836 | ||
| Quality of Smart Services | 0.876 | V41 | 0.822 |
| V42 | 0.870 | ||
| V43 | 0.866 | ||
| V44 | 0.829 | ||
| Perceived Value | 0.933 | V51 | 0.895 |
| V52 | 0.871 | ||
| V53 | 0.859 | ||
| Tourist Satisfaction | 0.915 | V61 | 0.896 |
| V62 | 0.905 | ||
| V63 | 0.911 |
Table 7.
KMO and Bartlett’s Test of Sphericity Results.
| KMO | 0.877 | |
| Bartlett’s test of sphericity. | approximate chi-square | 2812.77 |
| df | 587 | |
| Sig | 0.000 | |
Table 8.
Results of Pre-study Exploratory Factor Analysis.
| Component | Initial Eigenvalue |
Extraction Sum of Squared Loadings |
Rotation Sum of Squared Loadings |
||||||
| Total | Variance | Sum | Total | Variance | Sum | Total | Variance | Sum | |
| 1 | 12.873 | 32.762 | 31.675 | 12.873 | 32.762 | 31.675 | 3.947 | 12.477 | 12.477 |
| 2 | 3.193 | 9.738 | 38.646 | 3.193 | 9.738 | 38.646 | 3.878 | 10.866 | 23.478 |
| 3 | 2.996 | 7.855 | 47.082 | 2.996 | 7.855 | 47.082 | 3.602 | 9.974 | 32.984 |
| 4 | 2.992 | 7.652 | 55.655 | 2.992 | 7.652 | 55.655 | 3.415 | 9.768 | 42.415 |
| 5 | 1.787 | 6.726 | 60.092 | 1.787 | 6.726 | 60.092 | 3.102 | 9.142 | 51.877 |
| 6 | 1.892 | 5.659 | 66.432 | 1.892 | 5.659 | 66.432 | 3.089 | 8.992 | 62.792 |
| 7 | 1.092 | 3.492 | 70.182 | ||||||
| 8 | 0.772 | 1.961 | 73.798 | ||||||
| 9 | 0.349 | 1.813 | 77.072 | ||||||
| 10 | 0.544 | 1.754 | 78.669 | ||||||
| 11 | 0.512 | 1.621 | 81.792 | ||||||
| 12 | 0.543 | 1.581 | 84.229 | ||||||
| 13 | 0.529 | 1.530 | 86.510 | ||||||
| 14 | 0.578 | 1.484 | 88.913 | ||||||
| 15 | 0.499 | 1.446 | 91.029 | ||||||
| 16 | 0.479 | 1.255 | 93.024 | ||||||
| 17 | 0.393 | 1.148 | 95.927 | ||||||
| 18 | 0.377 | 1.094 | 97.337 | ||||||
| 19 | 0.277 | 0.904 | 99.173 | ||||||
| 20 | 0.239 | 0.700 | 100.000 | ||||||
Table 9.
Research Area of Smart Tourism.
| Number | A-level | Grade |
| 1 | Yungang Grottoes Scenic Area, Yungang District | 5A |
| 2 | Datong Volcano Group Scenic Area, Yunzhou District | 4A |
| 3 | Li Ergou Great Wall Scenic Area, Tianzhen County | 4A |
| 4 | Pingxingguan Great Victory Scenic Area, Lingqiu County | 4A |
| 5 | Weidu Water World Scenic Area, Pingcheng District | 4A |
| 6 | Datong Fantawild Adventure World Scenic Area, Pingcheng District | 4A |
| 7 | Datong Ancient City Wall Scenic Area, Pingcheng District | 4A |
| 8 | Jinhua Guan Well Exploration Tour Scenic Area, Yungang District | 4A |
| 9 | Beiyue Hengshan Scenic Area, Hunyuan County | 4A |
| 10 | Shanhua Temple Scenic Area, Pingcheng District | 4A |
| 11 | Huayan Temple Scenic Area, Pingcheng District | 4A |
| 12 | Daquan Mountain Ecological Tourism Area, Yanggao County | 4A |
| 13 | Ciyun Temple Scenic Area, Tianzhen County | 3A |
| 14 | Liyuan Water Village Carnival Ecological Agriculture Scenic Area, Yunzhou District | 3A |
| 15 | Shanshui Baiyang Scenic Area, Guangling County | 3A |
| 16 | Motianling Scenic Area, Zuoyun County | 3A |
| 17 | Kongzhong Grassland Scenic Area, Lingqiu County | 3A |
Table 10.
Descriptive Statistics of Empirical Analysis of Smart Tourism.
| Characteristic | Information | Number | Percentage |
|---|---|---|---|
| Gender | Male | 254 | 51.21 |
| Female | 242 | 48.79 | |
| Age | Under 18 | 70 | 14.11 |
| 18-30 | 167 | 33.67 | |
| 30-50 | 153 | 30.85 | |
| Over 50 | 106 | 21.37 | |
| Education Level | High School or below | 106 | 21.37 |
| Junior College | 164 | 33.06 | |
| Bachelor’s degree or above | 226 | 45.56 | |
| Monthly Income | Less than 3000 RMB | 159 | 32.06 |
| 3000-8000RMB | 109 | 21.98 | |
| 8000RMB-15000RMB | 172 | 34.68 | |
| More than 15000 RMB | 56 | 11.29 | |
| Number of Visits to Datong City | 1 time | 246 | 49.60 |
| 2 times | 142 | 28.63 | |
| 3 times | 108 | 21.77 |
Table 11.
Empirical Reliability Analysis.
| Latent Variable | Cronbach’s α value | Code | Revised Cronbach’s α value |
| Tourist Expectations | 0.995 | V11 | 0.879 |
| V12 | 0.816 | ||
| V13 | 0.852 | ||
| V14 | 0.878 | ||
| V15 | 0.984 | ||
| Destination Attractiveness |
0.952 | V21 | 0.877 |
| V22 | 0.896 | ||
| Quality of Smart Infrastructure | 0.911 | V31 | 0.897 |
| V32 | 0.889 | ||
| V32 | 0.869 | ||
| Quality of Smart Services | 0.976 | V41 | 0.823 |
| V42 | 0.889 | ||
| V43 | 0.859 | ||
| V44 | 0.899 | ||
| Perceived Value | 0.975 | V51 | 0.871 |
| V52 | 0.891 | ||
| V53 | 0.897 | ||
| Tourist Satisfaction | 0.817 | V61 | 0.801 |
| V62 | 0.795 | ||
| V63 | 0.771 |
Table 12.
Empirical Validity Analysis.
| KMO | 0.977 | |
|---|---|---|
| Bartlett’s test of sphericity. | approximate chi-square | 7985.796 |
| df | 659 | |
| Sig | 0.000 | |
Table 13.
Empirical Exploratory Factor Analysis.
| Component | Initial Eigenvalue | Extraction Sum of Squared Loadings |
Rotation Sum of Squared Loadings |
||||||
|---|---|---|---|---|---|---|---|---|---|
| Total | Variance | Sum | Total | Variance | Sum | Total | Variance | Sum | |
| 1 | 11.846 | 35.263 | 35.263 | 11.846 | 35.263 | 35.263 | 3.998 | 12.746 | 12.746 |
| 2 | 3.684 | 8.573 | 39.446 | 3.684 | 8.573 | 39.688 | 3.764 | 11.022 | 25.866 |
| 3 | 3.215 | 7.536 | 46.983 | 3.215 | 7.536 | 47.792 | 3.558 | 10.894 | 36.284 |
| 4 | 1.948 | 7.106 | 54.088 | 1.948 | 7.106 | 56.902 | 3.402 | 9.472 | 44.749 |
| 5 | 1.849 | 5.637 | 59.725 | 1.849 | 5.637 | 60.072 | 3.102 | 9.14 | 54.889 |
| 6 | 1.562 | 5.105 | 64.83 | 1.562 | 5.105 | 64.887 | 3.002 | 8.825 | 63.762 |
| 7 | 1.347 | 3.391 | 70.182 | ||||||
| 8 | 0.691 | 1.979 | 73.682 | ||||||
| 9 | 0.634 | 1.821 | 77.137 | ||||||
| 10 | 0.605 | 1.763 | 78.713 | ||||||
| 11 | 0.582 | 1.682 | 81.625 | ||||||
| 12 | 0.543 | 1.585 | 84.319 | ||||||
| 13 | 0.52 | 1.53 | 86.51 | ||||||
| 14 | 0.505 | 1.484 | 88.913 | ||||||
| 15 | 0.493 | 1.446 | 91.029 | ||||||
| 16 | 0.473 | 1.255 | 93.024 | ||||||
| 17 | 0.39 | 1.148 | 95.927 | ||||||
| 18 | 0.372 | 1.094 | 97.337 | ||||||
| 19 | 0.273 | 0.904 | 99.173 | ||||||
| 20 | 0.238 | 0.7 | 100 | ||||||
Table 14.
Results of Empirical Average Variance Extracted (AVE) Analysis.
| Latent Variable | Code | Unstd. | S.E. | t-value | std. | SMC | CR | AVE |
|---|---|---|---|---|---|---|---|---|
| Tourist Expectations |
V11 | 1 | 0.806 | 0.65 | ||||
| V12 | 1.002 | 0.057 | 17.181 | 0.711 | 0.619 | 0.888 | 0.613 | |
| V13 | 0.974 | 0.058 | 16.828 | 0.758 | 0.61 | |||
| V14 | 0.988 | 0.058 | 16.839 | 0.758 | 0.589 | |||
| V15 | 1.004 | 0.057 | 16.837 | 0.783 | 0.546 | |||
| Destination Attractiveness |
V21 | 1 | 0.746 | 0.589 | ||||
| V22 | 1.002 | 0.050 | 14.285 | 0.719 | 0.523 | 0.879 | 0.545 | |
| Quality of Smart Infrastructure |
V31 | 1 | 0.784 | 0.513 | ||||
| V32 | 0.985 | 0.060 | 14.066 | 0.724 | 0.523 | |||
| V33 | 0.936 | 0.062 | 13.567 | 0.744 | 0.598 | |||
| Quality of Smart Services |
V41 | 1 | 0.723 | 0.558 | 0.878 | 0.523 | ||
| V42 | 0.998 | 0.069 | 14.783 | 0.718 | 0.514 | |||
| V43 | 1.001 | 0.070 | 14.022 | 0.708 | 0.513 | |||
| V44 | 1.002 | 0.069 | 13.987 | 0.716 | 0.529 | |||
| Perceived Value | V51 | 1 | 0.723 | 0.679 | 0.865 | 0.540 | ||
| V52 | 1.005 | 0.071 | 13.646 | 0.746 | 0.562 | |||
| V53 | 0.936 | 0.073 | 13.757 | 0.754 | 0.645 | |||
| Tourist Satisfaction | V61 | 1 | 0.749 | 0.635 | 0.859 | 0.635 | ||
| V62 | 1.004 | 0.071 | 13.841 | 0.724 | 0.622 | |||
| V63 | 1.025 | 0.072 | 14.036 | 0.748 | 0.615 |
Table 15.
Results of Empirical Model Testing.
| Index Name | Evaluation Criteria | Result | Fit Status |
|---|---|---|---|
| CMIN | The smaller, the better | 752.883 | * |
| DF | The smaller, the better | 417 | * |
| CMIN/DF | Ideal <3, Acceptable <5 | 1.738 | Fitting |
| GFI | Ideal >0.9, Acceptable >0.8 | 0.913 | Fitting |
| AGFI | Ideal >0.9, Acceptable >0.8 | 0.917 | Fitting |
| CFI | Ideal >0.9, Acceptable >0.8 | 0.952 | Fitting |
| RMSEA | Ideal <0.05, Acceptable <0.08 | 0.012 | Fitting |
Table 16.
Results of Empirical Hypothesis Testing.
| Hypothesized Path | Unstandardized Effect Coefficient | S.E. | C.R. | P | Standardized Effect Coefficient |
|---|---|---|---|---|---|
| 1 | 0.135 | 0.081 | 2.517 | *** | 0.141 |
| 2 | 0.286 | 0.061 | 3.719 | *** | 0.311 |
| 3 | 0.346 | 0.069 | 4.562 | *** | 0.387 |
| 4 | 0.179 | 0.059 | 5.192 | *** | 0.193 |
| 5 | 0.198 | 0.048 | 5.887 | *** | 0.217 |
| 6 | 0.394 | 0.081 | 4.903 | *** | 0.192 |
| 7 | 0.352 | 0.091 | 9.102 | *** | 0.361 |
| 8 | 0.141 | 0.093 | 4.913 | *** | 0.157 |
| 9 | 0.287 | 0.051 | 5.901 | *** | 0.282 |
| 10 | 0.163 | 0.063 | 3.187 | *** | 0.173 |
| 11 | 0.234 | 0.059 | 6.913 | *** | 0.194 |
| 12 | 0.014 | 0.057 | 0.863 | 0.413 | 0.012 |
| 13 | -0.031 | 0.081 | 0.072 | 0.382 | 0.031 |
Disclaimer/Publisher’s Note: The statements, opinions and data contained in all publications are solely those of the individual author(s) and contributor(s) and not of MDPI and/or the editor(s). MDPI and/or the editor(s) disclaim responsibility for any injury to people or property resulting from any ideas, methods, instructions or products referred to in the content. |
© 2025 by the authors. Licensee MDPI, Basel, Switzerland. This article is an open access article distributed under the terms and conditions of the Creative Commons Attribution (CC BY) license (http://creativecommons.org/licenses/by/4.0/).
Copyright: This open access article is published under a Creative Commons CC BY 4.0 license, which permit the free download, distribution, and reuse, provided that the author and preprint are cited in any reuse.


