
Submitted:
22 August 2025
Posted:
25 August 2025
You are already at the latest version
Abstract
We present the design of a predictive digital twin for large-scale Varroa management in honey bee apiaries. The system couples a wireless sensor network for continuous hive sensing with remote actuation of treatment commands. It captures and analyzes images from beehives for automated mite detection. It also uses generative time-series models to forecast colony dynamics, reveal environmental and operational drivers, and conduct counterfactual analyses. Inter-colony spread is modeled with a statistical network model that, together with the time-series models, enables prediction and what-if evaluation of treatment strategies. The digital twin and its embedded models are updated as new measurements arrive. To address limited field data at deployment, we pretrain the models by creating synthetic datasets from bee–mite population-dynamics models and network-level spread. We also propose a dynamic monitoring strategy that adjusts surveillance intensity to current Varroa transmission conditions. Feasibility is assessed with a node-level energy budget for sensing, communication, and in-beehive treatment applicators. This digital twin forecasts infestation trajectories, supports what‑if planning, and enables timely, targeted interventions. The system improves over time through continuous online updates from field data. Overall, the results show a scalable path to real-time Varroa management across apiary networks from regional to national and cross-border scales.
Keywords:
digital twins
; varroa mite mitigation
; generative time-series models
; wireless sensor networks
; bee colony health monitoring
; precision agriculture
1. Introduction
The Varroa mite (Varroa destructor) presents a significant risk to honey bee colonies, which can lead to their decline and eventual collapse within a few years [1]. This issue affects not only beekeeping but also broader agricultural sectors reliant on bee pollination. Detected in Western Europe in the 1970s [2], the Varroa mite has since become a global concern. By June 2022, it had reached Australia, the last region previously unaffected, indicating its worldwide spread [3].
Various strategies are available for managing Varroa mites, often combined within an integrated pest management (IPM) framework. These strategies can be classified into cultural, mechanical, biological, and chemical [4]. Cultural controls involve breeding resistant bee lines selected for their genetic capacity to reduce mite populations, though achieving optimal effectiveness with this approach may take decades. Mechanical controls include techniques such as hyperthermia, screened bottom boards, and drone brood trapping, all of which physically remove mites from colonies. Biological controls employ parasitic fungi [5,6] and natural predators like pseudoscorpions [7] to organically reduce mite levels. Lastly, chemical methods utilize both natural treatments, such as formic and oxalic acids, and synthetic treatments like Amitraz, which offer more aggressive mite control.
Each method varies in terms of risk, efficacy, and response time. Cultural approaches typically pose the lowest risks and may be more sustainable in the long term, but their effectiveness is currently limited and needs improvement. Chemical methods are highly effective but are associated with higher risks, including the potential for residue accumulation in wax and honey, environmental hazards [2], and the development of resistant mite populations. The hyperthermia method, a mechanical approach, provides a balanced option, offering moderate effectiveness with manageable risks. Thermal treatments exploit the tolerance difference between bees (°45C) and mites (°41C), aiming to eliminate mites without harming bees, yet precise temperature control remains challenging [2].
A need-based strategy, closely monitoring the infection ratio and responding accordingly, is recommended [2]. An implementation of this approach called traffic light warning system categorizes infestation rates into three thresholds (red, orange, green) tailored to specific regions and times, guiding appropriate actions [2]. However, traditional infestation assessments are labor-intensive, requiring manual sampling of about 300 worker bees to detect mites [8,9], stressing bees, and potentially missing early infestation stages [10]. This inefficiency has motivated efforts towards automation and precision, mainly through image or video analysis [10,11,12,13,14] or other sensor technologies [15,16], aiming for early and accurate detection.
Incorporating these detection methods into a wireless sensor network (WSN) could streamline beehive health monitoring, reducing manual inspection errors and labor [17,18,19]. WSN offers a robust framework for continuous health surveillance in beehives.
From another angle, modeling disease spread and population impacts across colonies provides a comprehensive understanding of infestation dynamics and underpins effective management strategies. Machine learning and mathematical approaches allow analysis of mite reproduction, bee population dynamics, and environmental drivers of Varroa spread. For example, a mathematical model captures the coupled spread of Varroa mites and associated diseases within colonies [20]. Other models offer insight into colony behavior and dynamics under Varroa pressure [21,22].
Exploring the spread of Varroa mite also involves analyzing how infestations move between colonies. Spatial network analysis offers a method to model these interactions, focusing on the pathways through which Varroa mite invades and affects bee populations [23]. Such models are instrumental in identifying effective control measures by understanding the spatial dynamics of disease spread.
Digital twins sit at the intersection of predictive modeling and sensor networking for effective Varroa management . A Digital twin is a virtual model that mirrors a physical entity, combining various data inputs for processing and ensuring two-way data exchange between the virtual and physical realms. It requires synchronization to accurately reflect changes in the physical object’s condition or actuate processes or mechanisms within them [24]. Digital twins transcend the notion of being mere digital replicas; they can be augmented through the integration of simulations and predictive models [25].
Digital twins, are being applied in various agricultural sectors [26], extended to beekeeping, offering insights into hive anomalies and broader ecological considerations [27]. Though current applications are broad and less focused, they suggest development of targeted and effective Varroa mite management strategies, emphasizing precision and proactive intervention using digital twins.
This study presents the design of a digital twin system aimed at effectively controlling the spread of Varroa mites. The proposed system incorporates a WSN for real-time data acquisition and integrates generative artificial intelligence (AI) models for time series to predict both vertical and horizontal transmission pathways of the Varroa mite. Furthermore, these models facilitate the development of treatments, such as hyperthermia. The system dynamically updates the machine learning models based on the latest data collected from the WSN, ensuring the provision of accurate forecasts of population dynamics and optimal treatment recommendations. The effectiveness of the proposed design has been validated through simulations.
2. Design Components
Figure 1 depicts the main components of our digital twin design, where Figure 2 shows the main workflow.
As illustrated in Figure 1, the digital twin system consists of the physical beehives (Figure 1 A) and their corresponding digital twin counterparts (Figure 1 B). Some of the beehives are equipped with sensors, and additional methods are employed to monitor environmental conditions (Figure 1 C). The digital twin instances are integrated with models for predicting infection spread, running what-if simulations, and recommending treatments (Figure 1 E). Furthermore, the system includes components for implementing planned interventions and treatments (Figure 1 D). Finally, a wireless sensor network facilitates communication between the components (Figure 1 F).
The workflow of our digital twin system is structured as a loop, indicated by the flow of thick blue lines. The current status of the beehives, particularly infection levels, is used to predict potential future scenarios and assess responses to various treatment strategies, as illustrated in Figure 2.
In this workflow (Figure 2), the infection status of beehives is continuously monitored by sampling data through a WSN (1). The digital twin instances are then updated with the latest beehive conditions (2). These updates are derived from either direct sensor readings, extrapolation of sampled data, or models, with parameters adjusted based on the most recent sensor data.
Based on the updated status, prediction about the progression of Varroa mite infection is generated (4). To address these predicted scenarios, a response must be developed, taking into account environmental and infrastructural constraints, as well as overarching agricultural and environmental policies. To formulate this response, various feasible target scenarios are envisioned, each reflecting different trade-offs between capacity and environmental considerations (5-).
Each envisioned scenario results in a response characterized by varying levels of cost, impact, and feasibility (6-). After the initial cycle in the workflow, the effectiveness of prior interventions –reflected in actual outcomes— becomes an additional parameter (6) that is updated alongside other parameters (3).
Finally, based on policy considerations, managerial decisions, and the assessed cost, impact, and feasibility of each scenario, one is selected as the optimal choice (7). The chosen intervention is then implemented (8), often through remote commands to applicators in the beehives to perform specific actions, such as adjusting the temperature for hyperthermia treatment.
The intervention or the natural progression of the situation will result in new conditions, which will be sensed and fed back into the system as part of the loop (1).
3. Mite Detection System
Detection of Varroa mite in a beehive and measuring its level of spread is a crucial step in the digital twin system design. Visual detection of Varroa mites utilize a series of techniques [28,29], ranging from conventional object detection [10,28] to hyperspectral imagery [30]. The actual source of images are taken from brood cells, sticky boards, hive entrance, and hive frames [31].
A wide range of object-detection methods is available, and new variants appear rapidly. For the purpose of detecting Varroa mites, studies have applied YOLO and Faster R-CNN [10,31,32]. Recent work also positions vision transformer (ViT) (Vision Transformer) models as competitive in accuracy for image-based tasks [33], although practical deployment on constrained devices requires care [31,34]. This gap is narrowing as edge-efficient transformer designs continue to improve [35]. Accordingly, we consider ViT-based detectors within our digital twin framework while remaining model-agnostic pending in situ testing. The attention mechanism in transformer-based models may further help focus on salient regions and support interpretability in hive images. Overall, this integration strengthens the digital twin’s ability to mirror real-world conditions using state-of-the-art visual detection, while allowing flexibility to adopt newer or lighter models as evidence accumulates.
4. Modeling Vertical and Horizontal Dynamics
The spread of mites within a single bee colony, referred to as vertical spread, is often studied using population models. By contrast, the spread between colonies, or horizontal spread, is typically examined with network-based models. Both processes can be investigated through mathematical or computational approaches [36]. Mathematical models, particularly those based on differential equations, offer a structured framework to describe disease transmission using parameters such as infection, recovery, and mortality rates [37,38]. Computational approaches, on the other hand, frequently rely on simulations –such as agent-based, stochastic, or network models– to capture the more complex dynamics that emerge from individual behaviors and spatial interactions [39].
In both cases, the complexity of biological processes is simplified into a smaller set of essential parameters, such as survival rates, transmission rates, and grooming rates, along with their interactions. This reductionist approach has its challenges, as it may not fully reflect the complexities of real-world conditions. By reducing processes to a small set of parameters or clear-cut interactions, these models may overlook relevant variables and the natural variability that occurs in actual settings, leading to large discrepancies between model predictions and actual outcomes.
Furthermore, traditional models often rely on coarse abstractions and are generally poorly suited for what-if analyses. Such analyses depend on many drivers beyond within-colony dynamics or disease transmission between colonies. Important drivers include but not limited to beekeeping practices, monitoring and response routines, agricultural policies at regional and national levels, broader economic and industrial trends that shape land use and transportation, and both short-term variability and long-term trends in climate. While data and stand-alone predicting models may be available for many of these factors, integrating them into a single model of Varroa mite spread remains a significant challenge.
To address these challenges, we adopt two complementary directions. First, we develop digital twins that capture the real-time states of hives and other key entities. These twins continuously aggregate and update measurements, providing a consistent foundation for monitoring, visualization, forecasting, and what-if analysis. Second, we employ generative models for time series to project future trajectories and simulate counterfactual interventions. Such models learn from historical data, avoid restrictive assumptions about factor interactions, and can uncover important dependencies that may be locally relevant or overlooked in previous analyses. They also enable the integration of diverse drivers, including biological, environmental, and operational factors, into a single predictive framework. Because of their generative nature, these models can be conditioned on alternative policies, practices, interventions, and timings, thus supporting rigorous what-if evaluation without the risks and costs of real-world trials.
A digital twin for each hive and other key entities (such as apiaries, treatment devices, or local climate inputs) provides a living, data-driven representation of the system. It continuously integrates sensor streams and field logs to maintain up-to-date estimates of colony conditions, including brood temperature, forager activity, and inferred mite load, with quantified uncertainty. This unified perspective supports high-resolution monitoring and facilitates the early detection of abnormal patterns. The twin also records interventions and contextual information, ensuring traceability and auditability of outcomes. When combined with generative models for time series, it can simulate alternative conditions and schedules, creating a practical workspace for what-if analysis and decision support. Moreover, the approach can be scaled to large numbers of hives with minimal additional effort, delivering consistent summaries, insights, and alerts that enable timely action by beekeepers and policymakers.
Several classes of neural network based generative models for time series are currently prominent and applicable to predicting and performing counterfactual analyses of beehive conditions. At present, transformers are the most widely used sequence models. However, they have certain characteristics that may limit their suitability for modeling Varroa mite spread. Transformers require fixed time steps in their input data and demand substantial computational resources when extending the attention window to capture long sequences, where distant past events can strongly influence current conditions. While transformers have revolutionized language-related sequence modeling and serve as the backbone of large language models (LLMs), with famous implementations such as ChatGPT, these same characteristics make them less practical for modeling beehive dynamics, where events and sampling often occur at irregular intervals and time series can extend over long horizons.
For the above reasons, in modeling Varroa mite dynamics we favor state-space families of machine learning models. Examples include structured state-space sequence models (such as S4 [40] and Mamba [41]), neural ordinary differential equation (N-ODE) [42], and deep Markov model (DMM) [43]. We chose this family for three main reasons. First, beehive data is typically irregular and multi-rate: hive measurements, environmental covariates, agricultural and beekeeping policies, and planned interventions arrive on different timelines with non-uniform sampling. State-space models naturally support event-time updates and continuous-time formulations. Second, we require long-horizon forecasts at high temporal resolution. These state-space model families follow approaches that avoid the window-size computational challenges of transformers [40,41,42,43]. Third, the datasets contain many temporal and spatial gaps in hive health variables as well as environmental and policy data. State-space models can handle missing data through filtering, smoothing, and latent-state inference, although different subfamilies achieve this in different ways. In practice, only a subset of hives can be fully instrumented with measurement devices, and deploying sensors to every colony is infeasible. For many colonies, we must extrapolate from instrumented hives or rely on sparse, opportunistic observations (e.g., spot checks of mite loads and other health indicators). These characteristics make state-space models particularly suitable for data with both temporal and spatial missingness.
To provide a deeper understanding of how these state-space neural network models support prediction and what-if analysis in beehive colonies, we now focus on the architecture of DMM. Figure 3 illustrates a DMM during training, while Figure 4 shows its application for prediction and counterfactual analysis.
During the training phase, we have a set of observations describing beehive states along with environmental and policy indicators. These are represented as vectors denoted by , where corresponds to the vector of all observations recorded at time or step t. The DMM model receives these observations as input (shown at the bottom of Figure 3) and produces outputs denoted by (shown at the top of Figure 3). The model parameters are optimized so that the generated series closely match their corresponding series. The series represents intervention inputs, which may include intentional actions such as Varroa mite treatments or unintentional factors such as weather changes. The vector encodes baseline characteristics of each hive that generally remain constant over time. The vector denotes the internal (latent) state of the model at time or step t. Although it is usually difficult to map the elements of directly to real-world indicators –since they are automatically learned– these latent variables can be interpreted as analogous to important features in traditional modeling, such as grooming rate, mite reproductive rate, or queen egg-laying rate. The sequence neural network that processes the series is a predictive architecture (e.g., recurrent neural network (RNN), gated recurrent unit (GRU), or long short-term memory (LSTM)) that learns temporal dependencies. However, these architectures alone do not naturally capture probabilistic or continuous transitions of the system’s internal state, nor are they well suited for what-if simulations. Therefore, only their hidden states are used to construct . The transition neural network models the dynamics of changes in the latent state conditioned on interventions () and baseline characteristics (), while the emission neural network is trained to translate latent states into observable outputs.
In prediction mode, we retain the transition and emission neural networks that have already been trained to capture how the internal state of the system (the beehive alone, or the beehive together with its surrounding environment) evolves over time under different interventions () and baseline characteristics (). The emission network has already learned to translate these internal states into observable outputs about the beehives, which we now denote as at each time step. For prediction tasks, we provide new sets of actual interventions () and baseline characteristics (). For what-if (counterfactual) analysis, we instead supply alternative interventions and baseline characteristics. It should be noted that both the treatment model and the vertical spread model, depicted in component E of Figure 1, are implemented within the same underlying architecture shown in Figure 3 and Figure 4; they represent different uses of the same model by providing different intervention input data.
An important feature of this approach is that, within the digital twin system, training does not occur only once but is continuously repeated. This iterative process tunes the model to improve its predictive accuracy and to capture factors and dynamics that may have been previously overlooked. It corresponds to the feedback loop illustrated in Figure 1 between components B and E. Such a loop also helps address data drift and concept drift [44], where the underlying distributions and dynamics evolve over time and the model must be updated to reflect these changes.
When it comes to vertical spread modeling, there is a growing and promising body of research [45,46] that applies neural networks, particularly graph neural network (GNN), and more specifically temporal–spatial graph neural network (TS-GNN). There are also approaches that employ frameworks such as exponential random graph model (ERGM) enhanced with neural network-based estimators of parameters or posteriors [47,48]. While these newer models may require time to mature and demonstrate consistent applicability, a comprehensive modeling of Varroa mite dynamics within each colony can already provide valuable inputs for more traditional ERGM-based approaches.
To summarize, digital twins of hives and other key entities, combined with generative state-space time series models, provide a unified framework that integrates biological, environmental, and operational factors. This framework enables high-resolution, near-real-time monitoring of current colony conditions while also supporting forecasting and counterfactual what-if analysis of events, including different treatment decisions. Such what-if analysis not only allows simulation of alternative scenarios but also assists in intervention scheduling and provides insights by quantifying uncertainty in the predicted results.
5. Pretraining the Models for Population Dynamics and Mite Spread
A common challenge in applying neural networks to model Varroa spread, both within colonies (vertical) and between colonies (horizontal), is the large volume of training data required and the time needed to collect it from beehives. To address this challenge, we propose using existing mathematical and computational models to generate synthetic simulation data for the initial training phase. This strategy provides a well-informed baseline for the digital twin models, ensuring that they start close to realistic operating conditions. In turn, it can accelerate deployment and shorten the time needed to reach higher predictive accuracy.
There are several approaches for mathematically and computationally modeling the dynamics of vertical (within-colony) and horizontal (between-colony) spread of Varroa mites. To generate initial data for vertical (intra-colony) dynamics, we draw on the mathematical models of Torres and Torres [22] and Messan et al. [49], which we describe in the next section. An alternative that can be used in the same way is the agent-based model BEEHAVE [21,36,50], which simulates honey bee colony dynamics under Varroa pressure alongside other stressors such as viruses, pesticides, and landscape change. The BEEHAVE model is a viable option to consider for future studies and for generating synthetic training data.
For horizontal (inter-colony) spread, we model infection transmission with an ERGM. In this formulation, colonies are nodes and ties represent opportunities for Varroa transfer (e.g., drifting or robbing bees, shared forage, equipment movement, or managed colony relocations). ERGMs specify the probability of these ties as a function of network structure (such as distance, clustering, or shared apiary) and colony attributes. The fitted model thus captures how spatial arrangement and management connectivity shape Varroa transmission between hives and enables simulation of spread under alternative network configurations or interventions.
5.1. Vertical Spread Model, Within a Colony
Torres’s model uses systems of differential equations to track daily bee populations and account for caste-specific survival rates [22]. Messan’s study employs nonlinear delay differential equations (DDEs), incorporating explicit time delays and seasonal forcing, to analyze honey bee-mite population dynamics [49]. Either model can be combined with a horizontal spread component, for example by casting the infectious states within an susceptible, exposed, infectious (SEI) or susceptible, exposed, infected, recovered (SEIR) framework for epidemiological invasion.
The population model for each colony was based on Torres’ model (Equation (1)), where represents the bee population at age i, is the survival rate for that age group, and is the rate at which hive bees become foragers.
The following equation describes the population dynamics of healthy hive bees, accounting for their life cycle, mite infestation, and recovery rates [22]:
In this equation, represents the transition from healthy to infested bees, with indicating the proportion of infested bees, showing the infection’s spread within the colony. For infested hive bees, the dynamics are given by:
This equation captures the effect of mite infestation on survival rates and the potential for recovery, with indicating the number of infested bees and their reduced survival rate. To represent the mite population, we used this equation:
Here, is the mite population at age i, with as their daily survival rate, which varies with the seasons. accounts for mite deaths from grooming and the mortality of pupae in capped cells. The simulation began with an infected node at the network’s centroid to study the impact of a central infection on the wider health of bee colonies. By adjusting parameters such as infection range (r) and infection rate (), the model adapts to the changing landscape of Varroa mite transmission, providing valuable training data for training the digital twin models.
There is already research applying these equations, beginning with the original formulation by Torres and Torres [22] and extending to studies that explore different contexts and treatment schedules [19,51]. For example, Dasyam et al. [19] show that varying treatment intensity and timing can markedly alter population trajectories, enabling recovery and sustained colony health when interventions are guided by what-if analysis.
5.2. Horizontal Spread Model, Among Colonies
We integrated an ERGM (using EpiModel in R) which is approximated on geographic coordinates of bee apiaries in southern Sweden [52] to simulate regional Varroa transmission. The model represents three transmission pathways: self-mediated dispersal, where infection spreads to nearby nodes according to a negative exponential distance kernel; intra-locality dispersal, which captures spread within a defined area driven by local interactions (for example, contacts among beekeepers and markets); and inter-locality dispersal, which accounts for long-distance transmission, potentially via trade, migratory beekeeping, or equipment movement. The layout of these nodes is shown in Figure 5, with distribution statistics provided in Table 1.
Repeating the simulations with varying base infection and spread rates revealed several important patterns. As expected, the number of infected and high-risk colonies increases significantly when colonies are located in close proximity. Enhanced surveillance of high-risk nodes allows for rapid identification and management of new infection epicenters. The model further demonstrates that early interventions can substantially slow the spread of infection. In addition, the results indicate the presence of critical thresholds beyond which containment measures become less effective, emphasizing the importance of timely detection and intervention. We anticipate that a digital twin system enhanced with predictive models would be capable of identifying these critical thresholds and epicenters, thereby making timely detection and intervention more feasible.
5.3. Pretraining the Models for Treatment Effects
In addition to modeling population dynamics and mite spread, it is also important to pretrain the models on the effects of treatments used to control Varroa infestations (Figure 6). Among the available strategies, hyperthermia, a heat-based method that reduces mite populations by exposing them to controlled elevated temperatures, provides a well-studied example [53]. While a single hyperthermia session does not eradicate mites completely, it significantly lowers their numbers and thus changes the trajectory of colony dynamics. By incorporating such treatment events into simulations, we extend the training data beyond natural progression and include realistic intervention scenarios.
This approach allows digital twins to capture not only how infestations develop but also how different treatment strategies can alter outcomes. For example, simulations without intervention often lead to colony collapse within a relatively short period, whereas regular treatments can enable recovery and long-term colony survival (Figure 7). Such contrasting scenarios enrich the training data with both successful and unsuccessful outcomes, which are crucial for robust model pretraining.
Finally, environmental conditions (e.g., seasonal cycles) play a major role in shaping bee population trajectories, with fluctuations driven by changes in birth rates and resource availability. Incorporating these cycles alongside intervention events makes the training data more representative of real-world conditions.
6. Dynamic Monitoring Strategy for Mitigating Disease Spread
Digital twins must consider the constraints in sensing and communication resources while implementing effective and efficient treatment strategies. Thus, in our simulation, we considered a threshold of surveillance intensity needed for an effective treatment strategy. Our horizontal spread simulation highlighted the importance of specific parameters, such as the disease transmission rate and the spatial dynamics of the infection. Additionally, our model showed that infection rates and node susceptibility could differ greatly at various stages of an outbreak. As a result, a strategy of dynamic monitoring thresholds should be factored into digital twin design. This approach involves adjusting surveillance intensity in real-time, based on the observed patterns of disease spread.
To evaluate the effects of different infection intensities, we conducted several simulation runs, each time changing the infection rate value to represent various rates of disease spread. Through these simulations, one can monitor the emergence of high-risk nodes, which require increased surveillance to facilitate the early detection and treatment of new infestations. This adaptive response mechanism demonstrates the digital twins’ ability to adjust to changing infection dynamics, where the diffusion of data from the sensor network updates the model and informs optimal interventions–such as hyperthermia treatment–based on the latest information.
7. Feasibility of Implementing Digital Twins
Our digital twin design employs a WSN for sensing, data exchange, and dispatching intervention commands. The network spans a large area and consists of nodes with heterogeneous resource levels. A typical node includes (i) a camera for Varroa mite detection, (ii) a communication module for uplink and downlink, (iii) temperature sensors to monitor hive and treatment conditions when hyperthermia is used, and (iv) a heating applicator to deliver hyperthermia. To ensure practicality, we quantify per-node energy consumption to assess the feasibility of continuous monitoring and on-demand treatment at a single hive, since node-level budgets ultimately determine system-level viability.
Power estimates in our feasibility analysis draw on measurements reported for widely used components. For the camera (e.g., ESP32-CAM), reported consumption is in deep sleep and about – during active image capture [54]. For the WSN uplink, an NB-IoT modem (e.g., Quectel BC66) typically draws at during uplink (), with idle/paging currents around and power-saving-mode currents in the microamp range [55]. For temperature sensing, low-power digital sensors such as the DHT22 draw roughly 1– while measuring and tens of microamps in standby [56]. Heaters used for Varroa control span a broad range, from low-power silicone pads around to vaporizer-class devices near , depending on the treatment method [57]. These sources provide practical baselines for sizing monitoring and treatment energy in the proposed digital twin system.
Table 2 shows the energy used during a single monitoring cycle by various components and operations. Using this data, we can estimate the annual energy requirements, considering both regular and increased monitoring schedules.
Treatment requires using a heater for 2.5 hours per cycle [58]. Table 3 details the energy consumption for one treatment cycle, including both the heater and microcontroller operations.
It’s important to note that these energy consumption calculations are based on typical values, considering certain fixed parameters specific to regions and devices. An advantage of digital twins is their ability to provide more accurate and factual calculations and predictions of these consumption patterns by incorporating variable environmental and device factors.
8. Conclusion
The digital twin system design presented in this paper demonstrates how adaptive monitoring and treatment strategies can be achieved through a continuous cycle of sensing, model updating, exploration of what-if scenarios, and interventions. By integrating real-time data with predictive and counterfactual models, the system dynamically adapts to changing conditions in mite spread, enabling more effective and timely responses. Additionally, our approach of synthetically generating training data for a range of population, spread, and treatment scenarios enables pre-training of the digital twin system. This strategy facilitates smoother deployment and accelerates the achievement of effective results.
The simulated scenarios further underscore the importance of treatment timing in mitigating disease impact, highlighting the need for a system capable of adapting its actions based on real-time conditions and predictions. This aligns closely with the concept of digital twins, where the physical state of bee colonies is continuously mirrored in a virtual model to determine the most effective intervention strategies. Evaluations in mite detection and energy consumption, together with the simulations for controlling Varroa mites, demonstrate the functional feasibility of our proposed digital twin system design.
Further investigation is needed to evaluate different generative models for time series with respect to their capacity for modeling long-horizon time series, accommodating diverse data characteristics, and generating both factual and counterfactual scenarios for what-if analysis in the context of Varroa mite control. The overall system will also require a WSN capable of monitoring a large number of beehives across wide areas, ensuring accurate inputs for effective mite management strategies. In addition, further work is necessary on visualization and user-friendly interaction design, as the digital twin system is ultimately intended to support beekeepers’ decision-making for timely interventions. Scaling and real-time testing remain critical areas for future exploration to fully realize the potential of digital twins in Varroa mite control.
Funding
This research received no external funding.
Data Availability Statement
The data used in this study is available by contacting the corresponding author.
Conflicts of Interest
The authors declare no conflicts of interest.
References
- Rosenkranz, P.; Aumeier, P.; Ziegelmann, B. Biology and Control of VarroaDestructor. Journal of Invertebrate Pathology 2010, 103, S96–S119. [Google Scholar] [CrossRef]
- van der Steen, J.; Vejsnæs, F. Varroa Control: A Brief Overview of Available Methods. Bee World 2021, 98, 50–56. [Google Scholar] [CrossRef]
- Australian Government. Varroa Mite (Varroa Destructor) | Outbreak, 2023.
- Guichard, M.; Dietemann, V.; Neuditschko, M.; Dainat, B. Advances and Perspectives in Selecting Resistance Traits against the Parasitic Mite Varroa Destructor in Honey Bees. Genetics Selection Evolution 2020, 52, 71. [Google Scholar] [CrossRef] [PubMed]
- Hamiduzzaman, M.M.; Sinia, A.; Guzman-Novoa, E.; Goodwin, P.H. Entomopathogenic Fungi as Potential Biocontrol Agents of the Ecto-Parasitic Mite, VarroaDestructor, and Their Effect on the Immune Response of Honey Bees (ApisMellifera L.). Journal of Invertebrate Pathology 2012, 111, 237–243. [Google Scholar] [CrossRef] [PubMed]
- Noël, A.; Le Conte, Y.; Mondet, F. Varroa Destructor: How Does It Harm Apis Mellifera Honey Bees and What Can Be Done about It? Emerging Topics in Life Sciences 2020, 4, 45–57. [Google Scholar] [CrossRef]
- Read, S.; Howlett, B.G.; Donovan, B.J.; Nelson, W.R.; van Toor, R.F. Culturing Chelifers (Pseudoscorpions) That Consume Varroa Mites. Journal of Applied Entomology 2014, 138, 260–266. [Google Scholar] [CrossRef]
- Lee, K.V.; Moon, R.D.; Burkness, E.C.; Hutchison, W.D.; Spivak, M. Practical Sampling Plans for Varroa Destructor (Acari: Varroidae) in Apis Mellifera (Hymenoptera: Apidae) Colonies and Apiaries. Journal of Economic Entomology 2010, 103, 1039–1050. [Google Scholar] [CrossRef]
- Dietemann, V.; Ellis, J.D.; Neumann, P. The COLOSS BEEBOOK Volume I: Standard Methods for Apis Mellifera Research; Vol. 52, International Bee Research Association IBRA: Treforest, 2013. [Google Scholar]
- Liu, M.; Cui, M.; Xu, B.; Liu, Z.; Li, Z.; Chu, Z.; Zhang, X.; Liu, G.; Xu, X.; Yan, Y. Detection of Varroa Destructor Infestation of Honeybees Based on Segmentation and Object Detection Convolutional Neural Networks. AgriEngineering 2023, 5, 1644–1662. [Google Scholar] [CrossRef]
- Kaur, M.; Ardekani, I.; Sharifzadeh, H.; Varastehpour, S. A CNN-Based Identification of Honeybees’ Infection Using Augmentation. In Proceedings of the 2022 International Conference on Electrical, Computer, 2022, Communications and Mechatronics Engineering (ICECCME); pp. 1–6. [CrossRef]
- Voudiotis, G.; Moraiti, A.; Kontogiannis, S. Deep Learning Beehive Monitoring System for Early Detection of the Varroa Mite. Signals 2022, 3, 506–523. [Google Scholar] [CrossRef]
- Schurischuster, S.; Kampel, M. Image-Based Classification of Honeybees. In Proceedings of the 2020 Tenth International Conference on Image Processing Theory, Tools and Applications (IPTA); 2020; pp. 1–6. [Google Scholar] [CrossRef]
- Bjerge, K.; Frigaard, C.E.; Mikkelsen, P.H.; Nielsen, T.H.; Misbih, M.; Kryger, P. A Computer Vision System to Monitor the Infestation Level of VarroaDestructor in a Honeybee Colony. Computers and Electronics in Agriculture 2019, 164, 104898. [Google Scholar] [CrossRef]
- Szczurek, A.; Maciejewska, M.; Bąk, B.; Wilde, J.; Siuda, M. Semiconductor Gas Sensor as a Detector of VarroaDestructor Infestation of Honey Bee Colonies – Statistical Evaluation. Computers and Electronics in Agriculture 2019, 162, 405–411. [Google Scholar] [CrossRef]
- Schweizer, T.; Senger, D.; Johannsen, C.; Kluss, T.; Vellekoop, M.J. Supervising Varroa Treatment of Honey Bees with Smart Sensor Systems. In Proceedings of the MikroSystemTechnik Congress 2021; Congress; 2021; pp. 1–4. [Google Scholar]
- Edwards-Murphy, F.; Magno, M.; Whelan, P.M.; O’Halloran, J.; Popovici, E.M. b+WSN: Smart Beehive with Preliminary Decision Tree Analysis for Agriculture and Honey Bee Health Monitoring. Computers and Electronics in Agriculture 2016, 124, 211–219. [Google Scholar] [CrossRef]
- Senger, D.; Johannsen, C.; Kluss, T. Anomaly Detection at the Apiary: Predicting State and Swarming Preparation Activity of Honey Bee Colonies Using Low-Cost Sensor Technology. In Proceedings of the 2022 IEEE Conference on Technologies for Sustainability (SusTech); 2022; pp. 1–7. [Google Scholar] [CrossRef]
- Dasyam, V.; Eivazzadeh, S.; Pokuri, S.; Zhao, J.; Khatibi, S. Designing a Wireless Sensor Network Solution for Varroa Control in Bee Colonies. In Proceedings of the 2024 IEEE Tenth International Conference on Communications and Electronics (ICCE), Da Nang, Vietnam; 2024. [Google Scholar]
- Ibrahim, M.A.; Dénes, A. A Mathematical Model for the Spread of Varroa Mites in Honeybee Populations: Two Simulation Scenarios with Seasonality. Heliyon 2022, 8, e10648. [Google Scholar] [CrossRef] [PubMed]
- Becher, M.A.; Grimm, V.; Thorbek, P.; Horn, J.; Kennedy, P.J.; Osborne, J.L. BEEHAVE: A Systems Model of Honeybee Colony Dynamics and Foraging to Explore Multifactorial Causes of Colony Failure. The Journal of Applied Ecology 2014, 51, 470–482. [Google Scholar] [CrossRef] [PubMed]
- Torres, D.J.; Torres, N.A. Modeling the Influence of Mites on Honey Bee Populations. Veterinary Sciences 2020, 7, 139. [Google Scholar] [CrossRef]
- Adiga, A.; Palmer, N.; Baek, Y.Y.; Mortveit, H.; Ravi, S.S. Network Models and Simulation Analytics for Multi-scale Dynamics of Biological Invasions. Frontiers in Big Data 2022, 5. [Google Scholar] [CrossRef]
- van der Valk, H.; Haße, H.; Möller, F.; Otto, B. Archetypes of Digital Twins. Business & Information Systems Engineering 2022, 64, 375–391. [Google Scholar] [CrossRef]
- Drummond, D.; Gonsard, A. Definitions and Characteristics of Patient Digital Twins Being Developed for Clinical Use: Scoping Review. Journal of Medical Internet Research 2024, 26, e58504. [Google Scholar] [CrossRef]
- Lin, Z. Digital Twins’ Technology for Smart Agriculture. In Encyclopedia of Digital Agricultural Technologies; Zhang, Q., Ed.; Springer International Publishing: Cham, 2023; pp. 348–355. [Google Scholar] [CrossRef]
- Johannsen, C.; Senger, D.; Kluss, T. A Digital Twin of the Social-Ecological System Urban Beekeeping. In Proceedings of the Advances and New Trends in Environmental Informatics; Kamilaris, A.; Wohlgemuth, V.; Karatzas, K.; Athanasiadis, I.N., Eds., Cham, 2021; Progress in IS; pp. 193–207. [Google Scholar] [CrossRef]
- Bilik, S.; Kratochvila, L.; Ligocki, A.; Bostik, O.; Zemcik, T.; Hybl, M.; Horak, K.; Zalud, L. Visual Diagnosis of the Varroa Destructor Parasitic Mite in Honeybees Using Object Detector Techniques. Sensors (Basel, Switzerland) 2021, 21, 2764. [Google Scholar] [CrossRef]
- Odemer, R. Approaches, Challenges and Recent Advances in Automated Bee Counting Devices: A Review. Annals of Applied Biology 2022, 180, 73–89. [Google Scholar] [CrossRef]
- Duma, Z.S.; Zemcik, T.; Bilik, S.; Sihvonen, T.; Honec, P.; Reinikainen, S.P.; Horak, K. Varroa Destructor Detection on Honey Bees Using Hyperspectral Imagery. Computers and Electronics in Agriculture 2024, 224, 109219. [Google Scholar] [CrossRef]
- Kriouile, Y.; Ancourt, C.; Wegrzyn-Wolska, K.; Bougueroua, L. Nested Object Detection Using Mask R-CNN: Application to Bee and Varroa Detection. Neural Computing and Applications 2024, 36, 22587–22609. [Google Scholar] [CrossRef]
- Divasón, J.; Martinez-de-Pison, F.J.; Romero, A.; Santolaria, P.; Yániz, J.L. Varroa Mite Detection Using Deep Learning Techniques. In Proceedings of the Hybrid Artificial Intelligent Systems; García Bringas, P.; Pérez García, H.; Martínez de Pisón, F.J.; Martínez Álvarez, F.; Troncoso Lora, A.; Herrero, Á.; Calvo Rolle, J.L.; Quintián, H.; Corchado, E., Eds., Cham; 2023; pp. 326–337. [Google Scholar] [CrossRef]
- Shehzadi, T.; Hashmi, K.A.; Stricker, D.; Afzal, M.Z. Object Detection with Transformers: A Review 2023. [CrossRef]
- Wang, X.; Zhang, L.L.; Wang, Y.; Yang, M. Towards Efficient Vision Transformer Inference: A First Study of Transformers on Mobile Devices. In Proceedings of the Proceedings of the 23rd Annual International Workshop on Mobile Computing Systems and Applications, New York, NY, USA, 2022. [CrossRef]
- Pan, J.; Bulat, A.; Tan, F.; Zhu, X.; Dudziak, L.; Li, H.; Tzimiropoulos, G.; Martinez, B. EdgeViTs: Competing Light-Weight CNNs on Mobile Devices with Vision Transformers. In Proceedings of the Computer Vision – ECCV 2022; Avidan, S.; Brostow, G.; Cissé, M.; Farinella, G.M.; Hassner, T., Eds., Cham, 2022; Lecture Notes in Computer Science; pp. 294–311. [Google Scholar] [CrossRef]
- Chen, J.; DeGrandi-Hoffman, G.; Ratti, V.; Kang, Y.; Chen, J.; DeGrandi-Hoffman, G.; Ratti, V.; Kang, Y. Review on Mathematical Modeling of Honeybee Population Dynamics. Mathematical Biosciences and Engineering 2021, 18, 9606–9650. [Google Scholar] [CrossRef]
- Grassly, N.C.; Fraser, C. Mathematical Models of Infectious Disease Transmission. Nature Reviews Microbiology 2008, 6, 477–487. [Google Scholar] [CrossRef] [PubMed]
- Hoang, M.T.; Ehrhardt, M. Differential Equation Models for Infectious Diseases: Mathematical Modeling, Qualitative Analysis, Numerical Methods and Applications. SeMA Journal 2025. [Google Scholar] [CrossRef]
- Duan, W.; Fan, Z.; Zhang, P.; Guo, G.; Qiu, X. Mathematical and Computational Approaches to Epidemic Modeling: A Comprehensive Review. Frontiers of Computer Science 2015, 9, 806–826. [Google Scholar] [CrossRef] [PubMed]
- Gu, A.; Goel, K.; Ré, C. Efficiently Modeling Long Sequences with Structured State Spaces. 2022; arXiv:cs/2111.00396. [Google Scholar] [CrossRef]
- Gu, A.; Dao, T. Mamba: Linear-Time Sequence Modeling with Selective State Spaces. 2024; arXiv:cs/2312.00752. [Google Scholar] [CrossRef]
- Kidger, P.; Morrill, J.; Foster, J.; Lyons, T. Neural Controlled Differential Equations for Irregular Time Series. In Proceedings of the Advances in Neural Information Processing Systems. Curran Associates, Inc., Vol. 33; 2020; pp. 6696–6707. [Google Scholar]
- Krishnan, R.G.; Shalit, U.; Sontag, D. Structured Inference Networks for Nonlinear State Space Models. In Proceedings of the Proceedings of the Thirty-First AAAI Conference on Artificial Intelligence, San Francisco, California, USA, 2017.
- Lu, J.; Liu, A.; Dong, F.; Gu, F.; Gama, J.; Zhang, G. Learning under Concept Drift: A Review. IEEE Transactions on Knowledge and Data Engineering 2019, 31, 2346–2363. [Google Scholar] [CrossRef]
- Kraemer, M.U.G.; Tsui, J.L.H.; Chang, S.Y.; Lytras, S.; Khurana, M.P.; Vanderslott, S.; Bajaj, S.; Scheidwasser, N.; Curran-Sebastian, J.L.; Semenova, E.; et al. Artificial Intelligence for Modelling Infectious Disease Epidemics. Nature 2025, 638, 623–635. [Google Scholar] [CrossRef]
- Liu, Z.; Wan, G.; Prakash, B.A.; Lau, M.S.; Jin, W. A.; Lau, M.S.; Jin, W. A Review of Graph Neural Networks in Epidemic Modeling. In Proceedings of the Proceedings of the 30th ACM SIGKDD Conference on Knowledge Discovery and Data Mining, Barcelona Spain, 2024; Lau, M.S. [CrossRef]
- Fan, Y.; White, S. E: Posterior Estimation on Exponential Random Graph Models, 2025; arXiv:stat/2504.09349. [CrossRef]
- Mele, A. Estimating Network Models Using Neural Networks, 2025, [5123084]. [CrossRef]
- Messan, K.; Rodriguez Messan, M.; Chen, J.; DeGrandi-Hoffman, G.; Kang, Y. Population Dynamics of Varroa Mite and Honeybee: Effects of Parasitism with Age Structure and Seasonality. Ecological Modelling 2021, 440, 109359. [Google Scholar] [CrossRef]
- Becher, M. BEEHAVE, 2023.
- Dasyam, V.S.A.; Pokuri, S. Wireless Sensor Network for Controlling the Varroasis Spread within Bee Colonies across a Geographical Region; 2024.
- Liljeberg, C. The Apiary Map - Beekeepers and Apiaries on a Map, 2024.
- Kablau, A.; Berg, S.; Rutschmann, B.; Scheiner, R. Short-Term Hyperthermia at Larval Age Reduces Sucrose Responsiveness of Adult Honeybees and Can Increase Life Span. Apidologie 2020, 51, 570–582. [Google Scholar] [CrossRef]
- SunFounder. ESP32 CAM — SunFounder GalaxyRVR Kit for Arduino 1.0 Documentation, 2025.
- Quectel. LPWA BC660K-GL NB2 | Quectel, 2025.
- Industries, A. DHT22 Temperature-Humidity Sensor + Extras, 2025.
- Sandrock, C.; Wohlfahrt, J.; Brunner, W.; Brunner, P. Efficacy and Trade-Offs of an Innovative Hyperthermia Device to Control Varroa Destructor in Honeybee Colonies. Journal of Pest Science 2023. [Google Scholar] [CrossRef]
- Kablau, A.; Berg, S.; Härtel, S.; Scheiner, R. Hyperthermia Treatment Can Kill Immature and Adult Varroa Destructor Mites without Reducing Drone Fertility. Apidologie 2020, 51, 307–315. [Google Scholar] [CrossRef]
Figure 1.
Main components of the digital twin system.
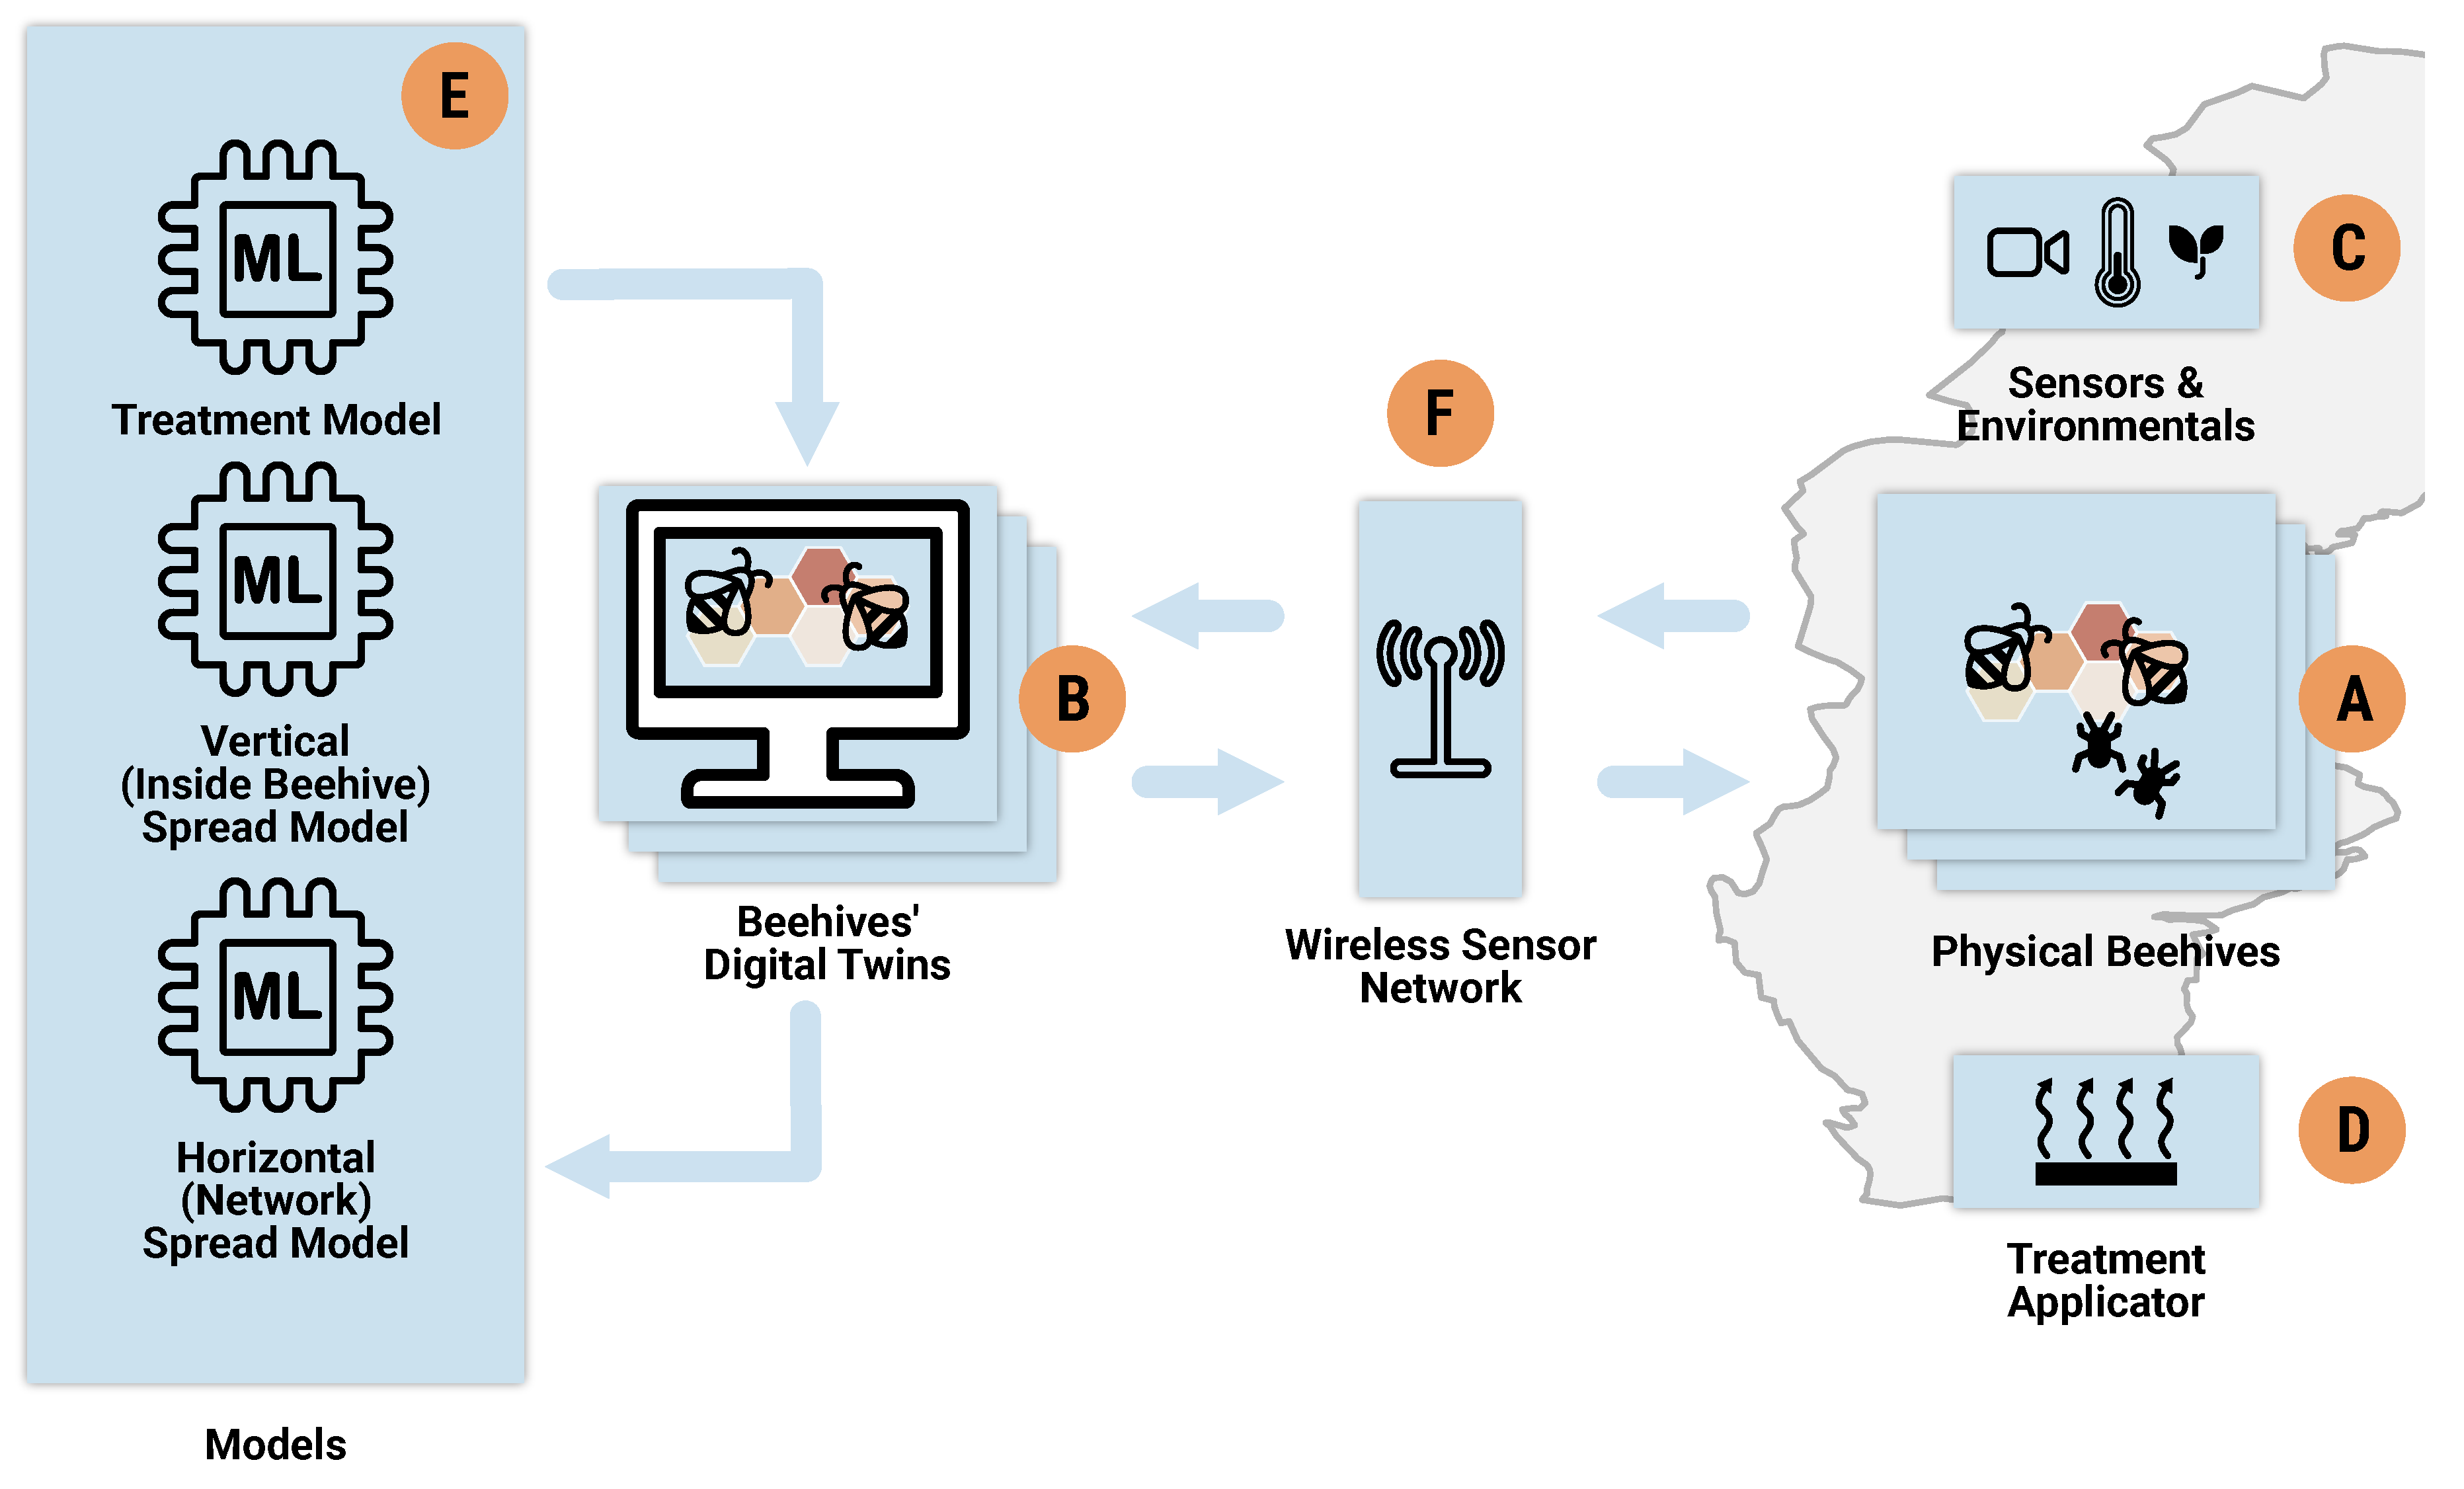
Figure 2.
Main workflow of the digital twin system.
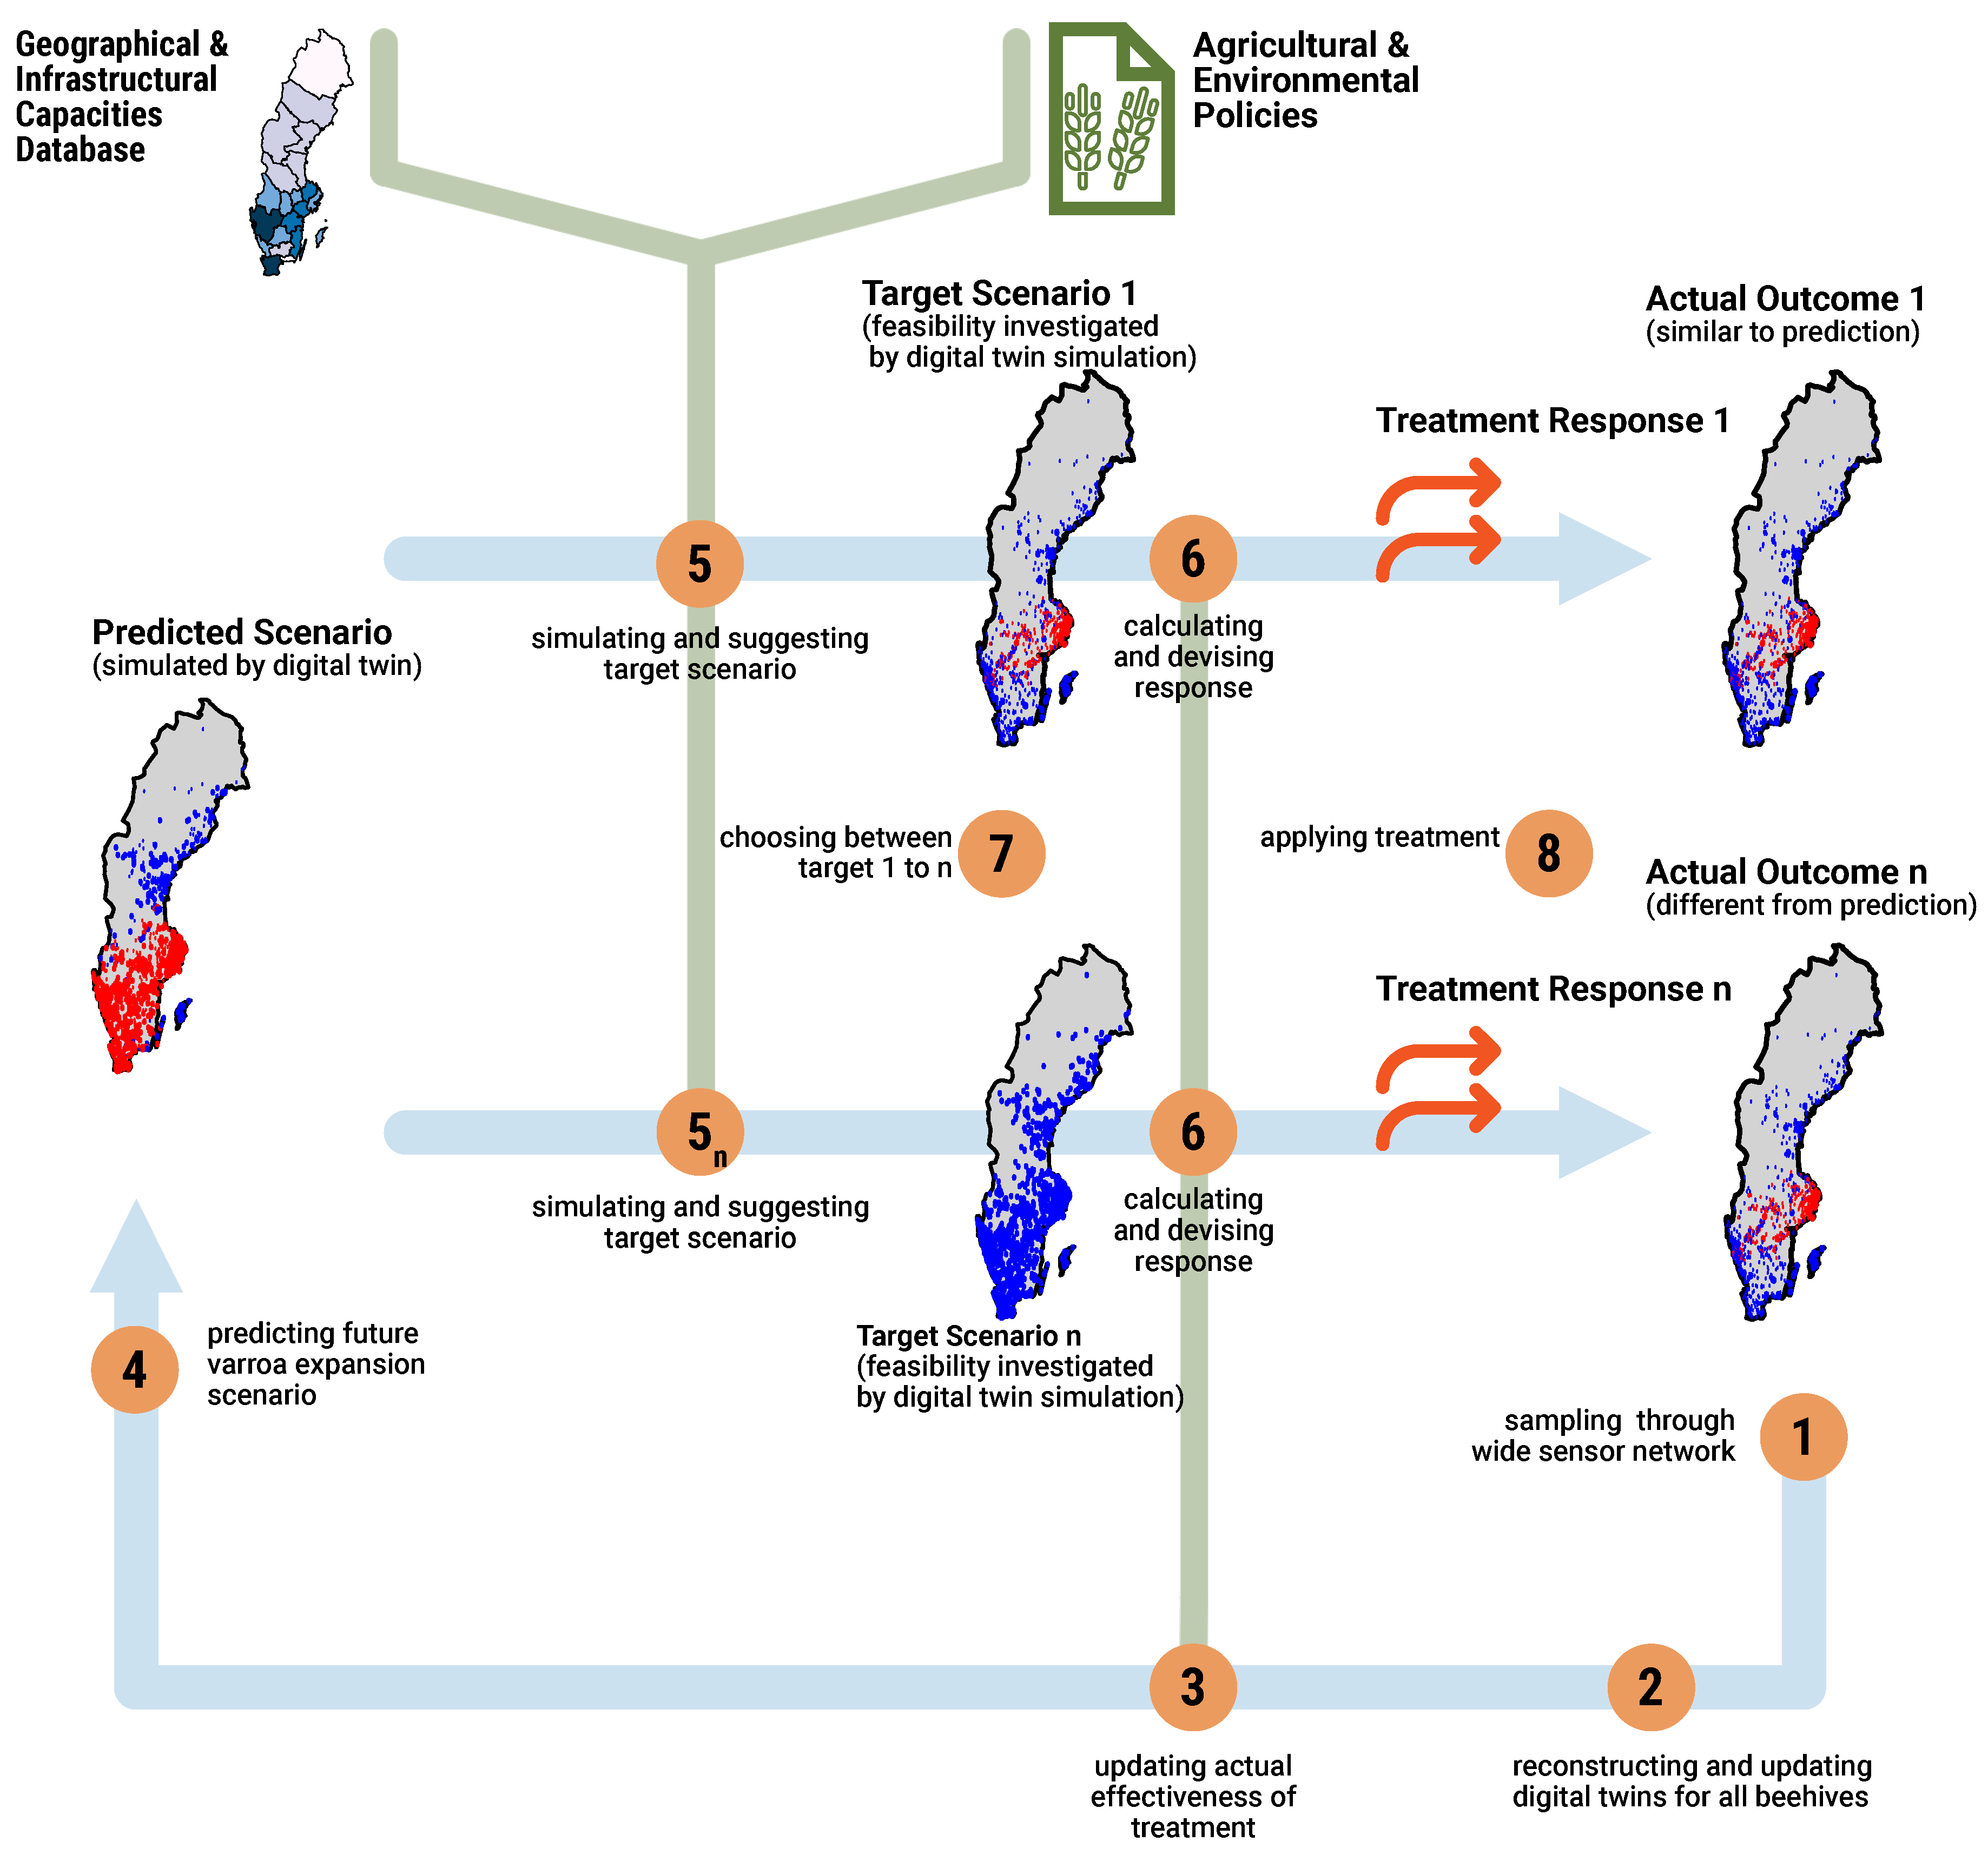
Figure 3.
Training deep Markov model for beehive internal dynamics, conditioned on external factors.
Figure 3.
Training deep Markov model for beehive internal dynamics, conditioned on external factors.
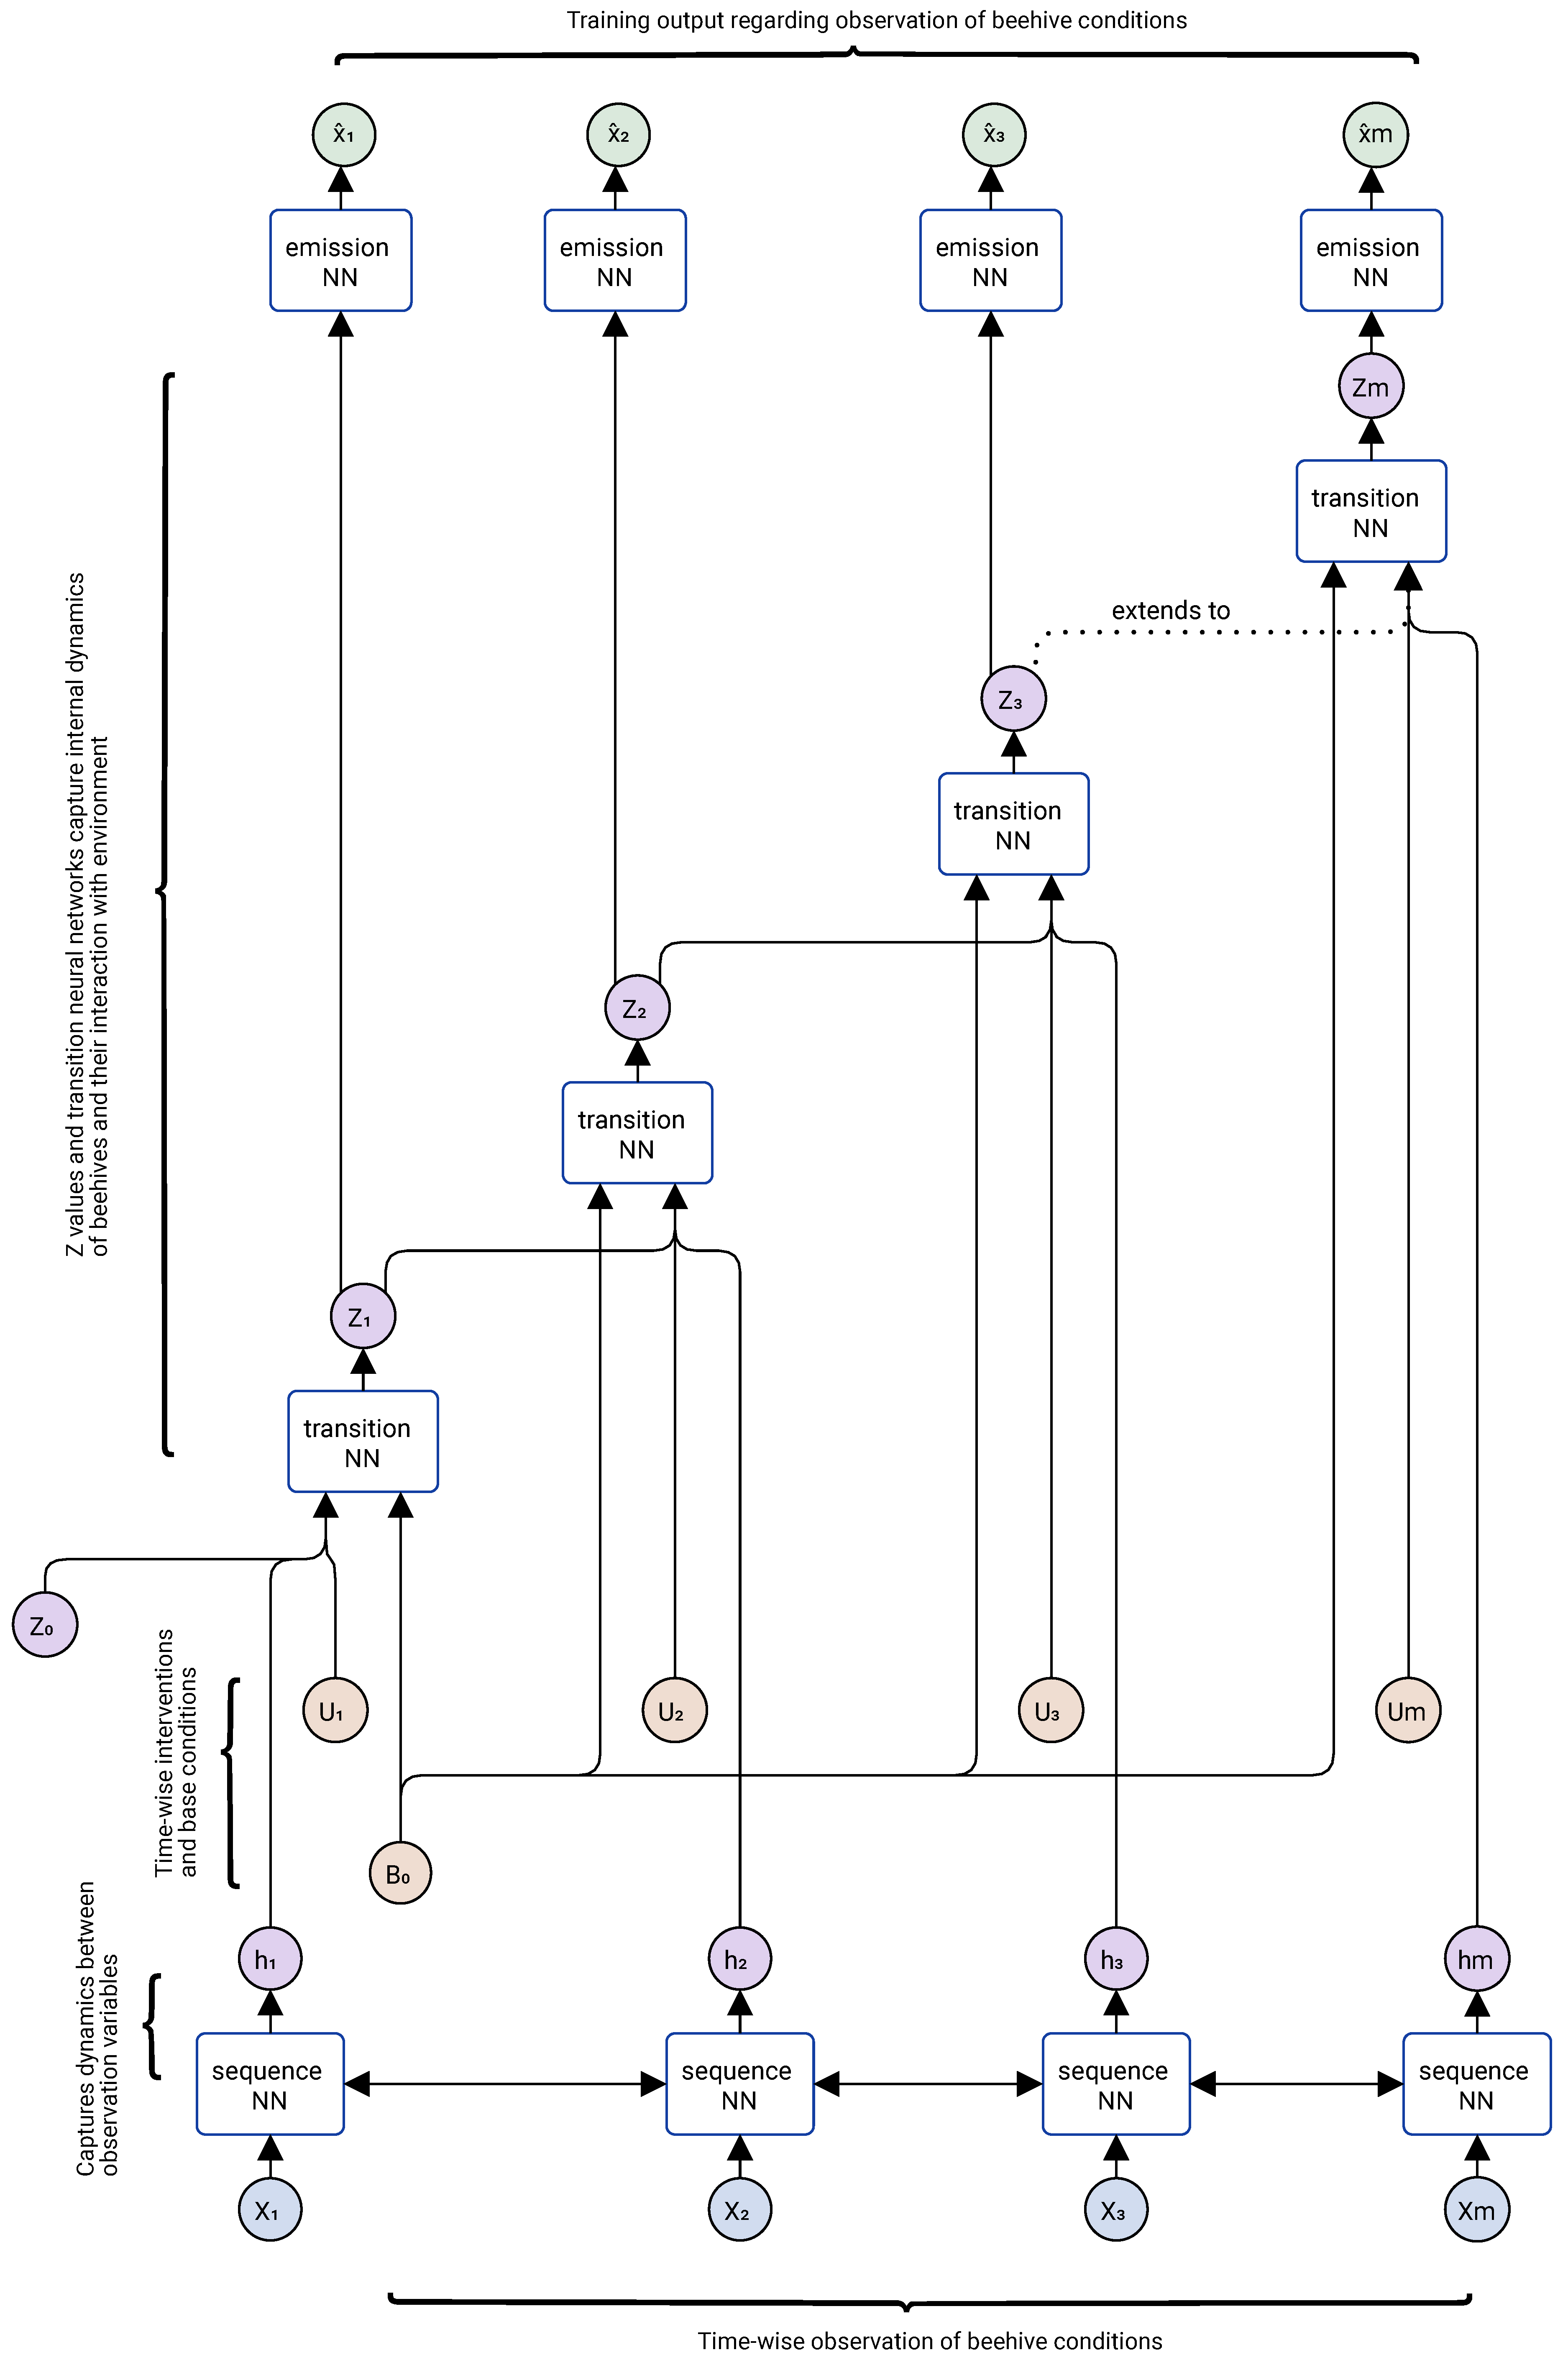
Figure 4.
Predicting and what-if analysis of beehive conditions using trained deep Markov model.
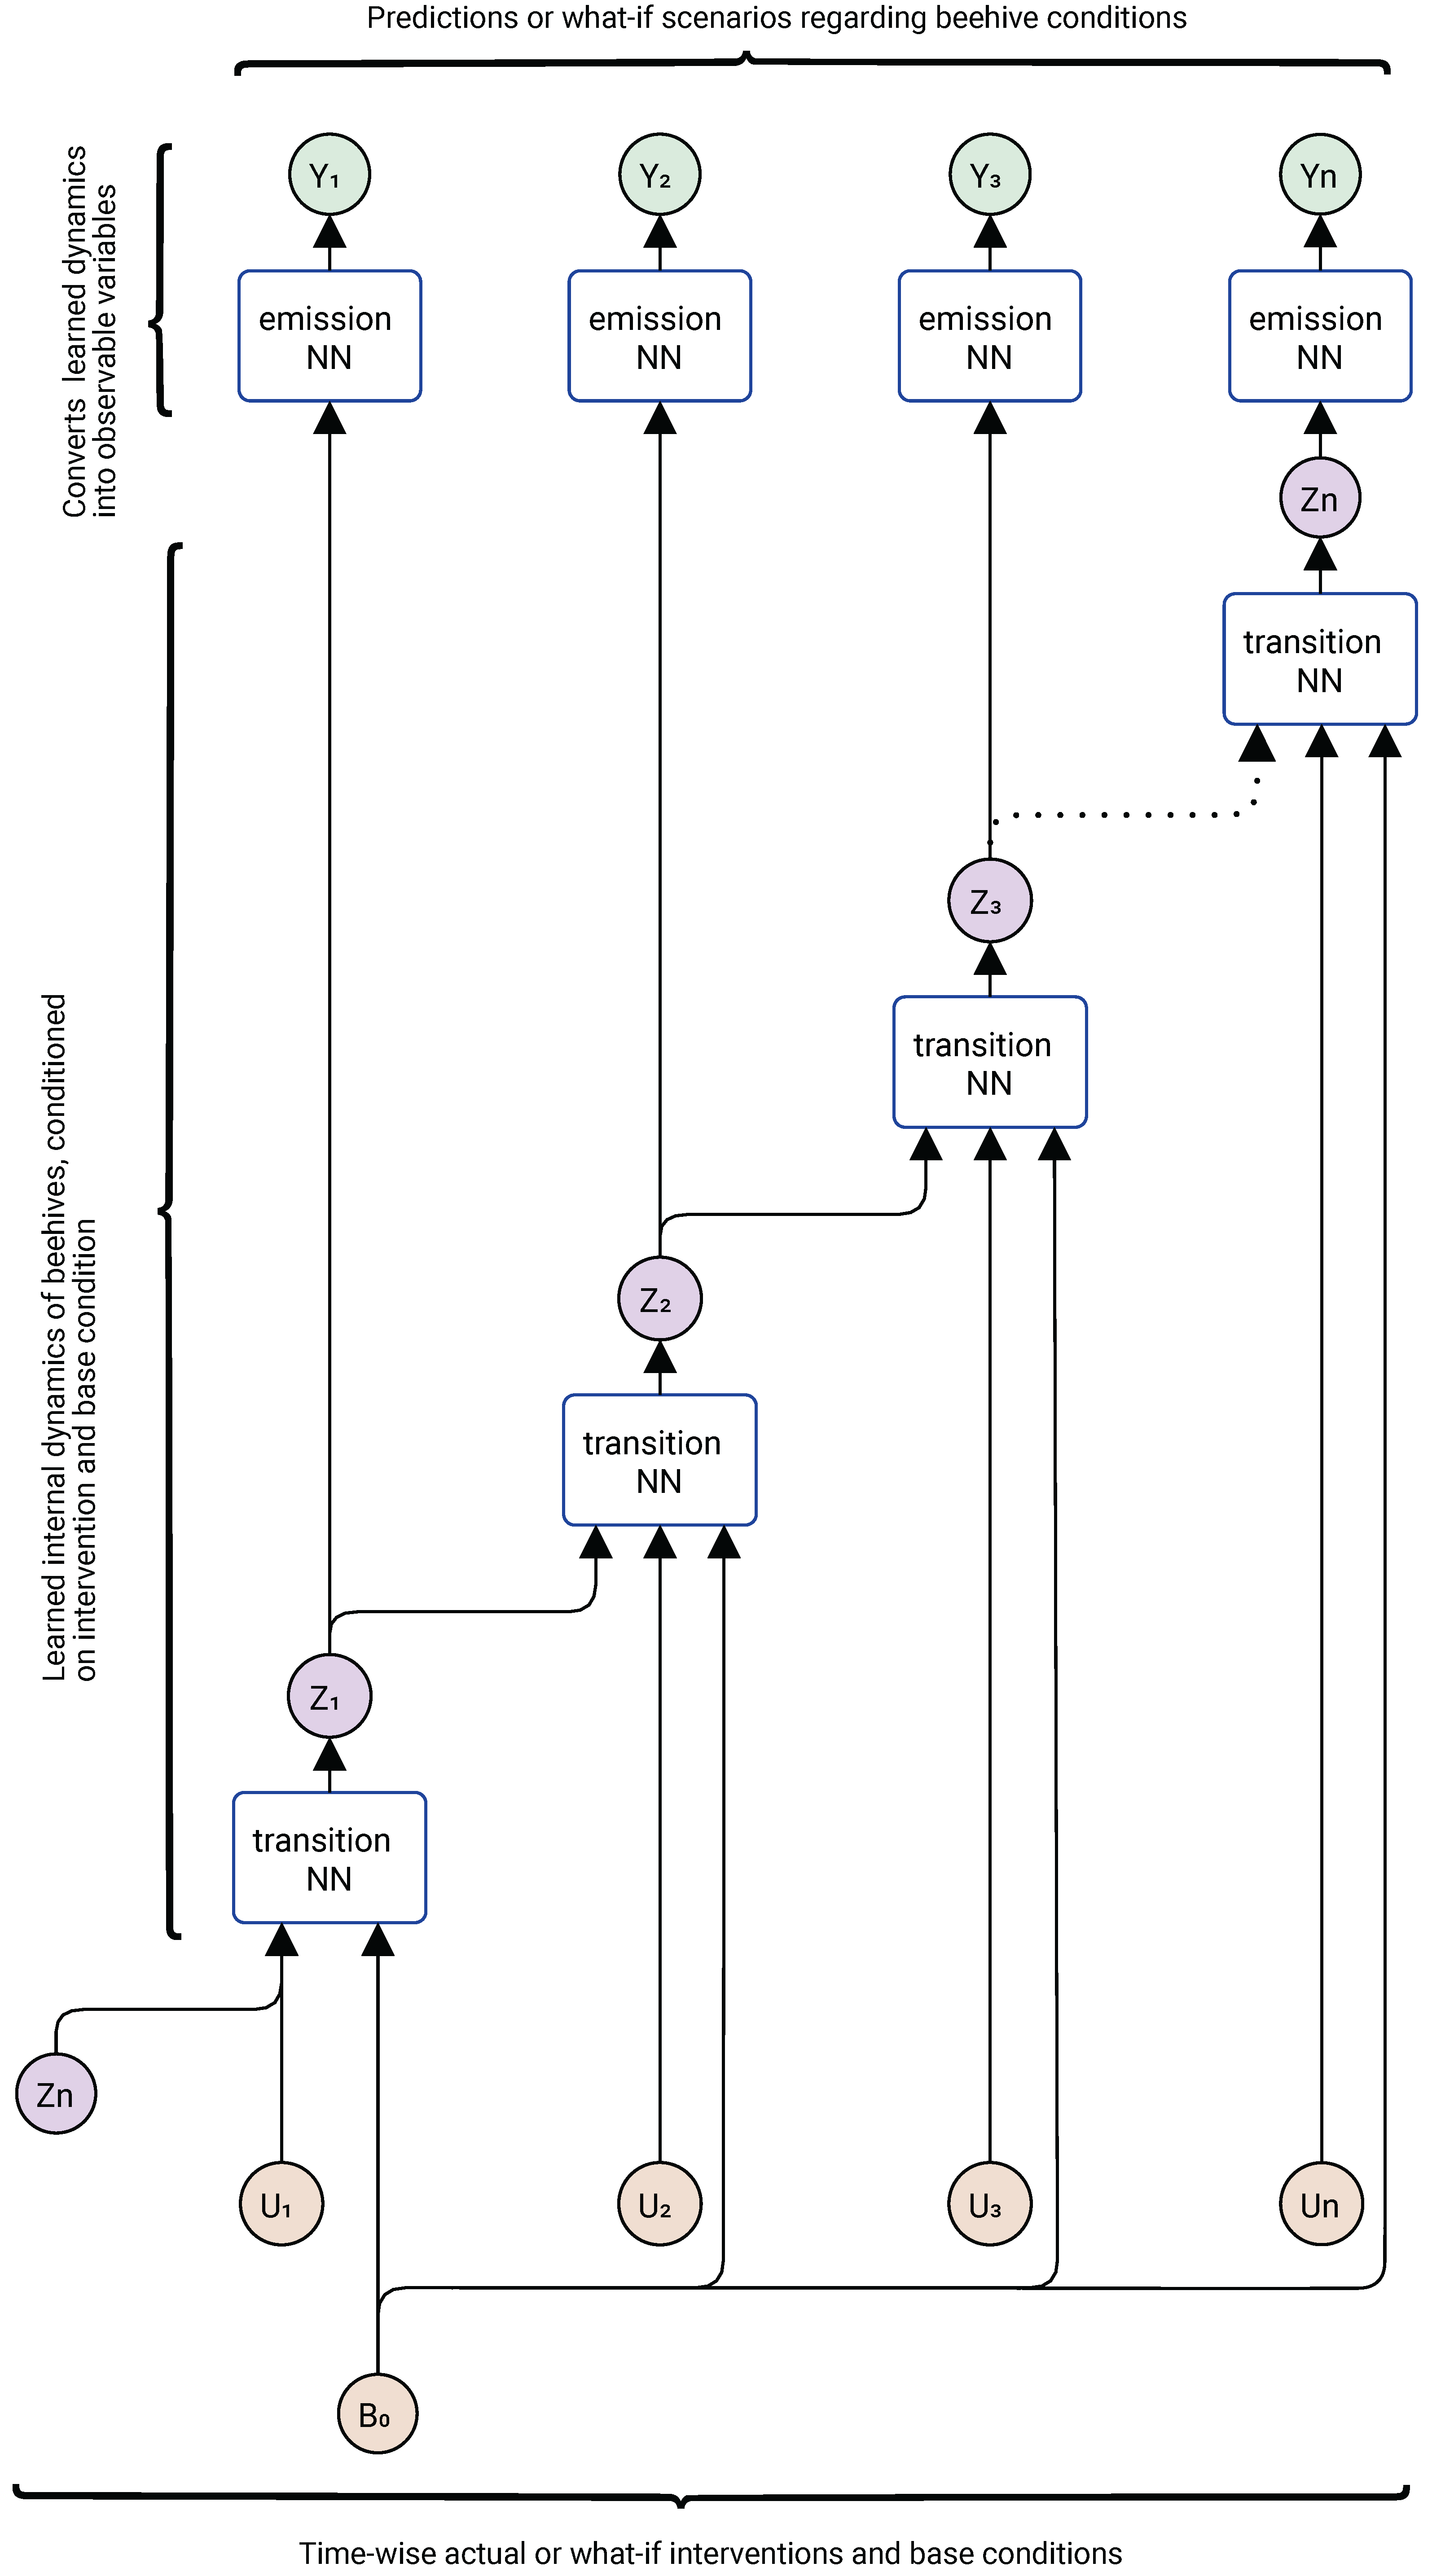
Figure 5.
Varroa Mite Spread Simulation: No intervention scenario. Infected colonies shown in red, non-infected ones are in blue.
Figure 5.
Varroa Mite Spread Simulation: No intervention scenario. Infected colonies shown in red, non-infected ones are in blue.
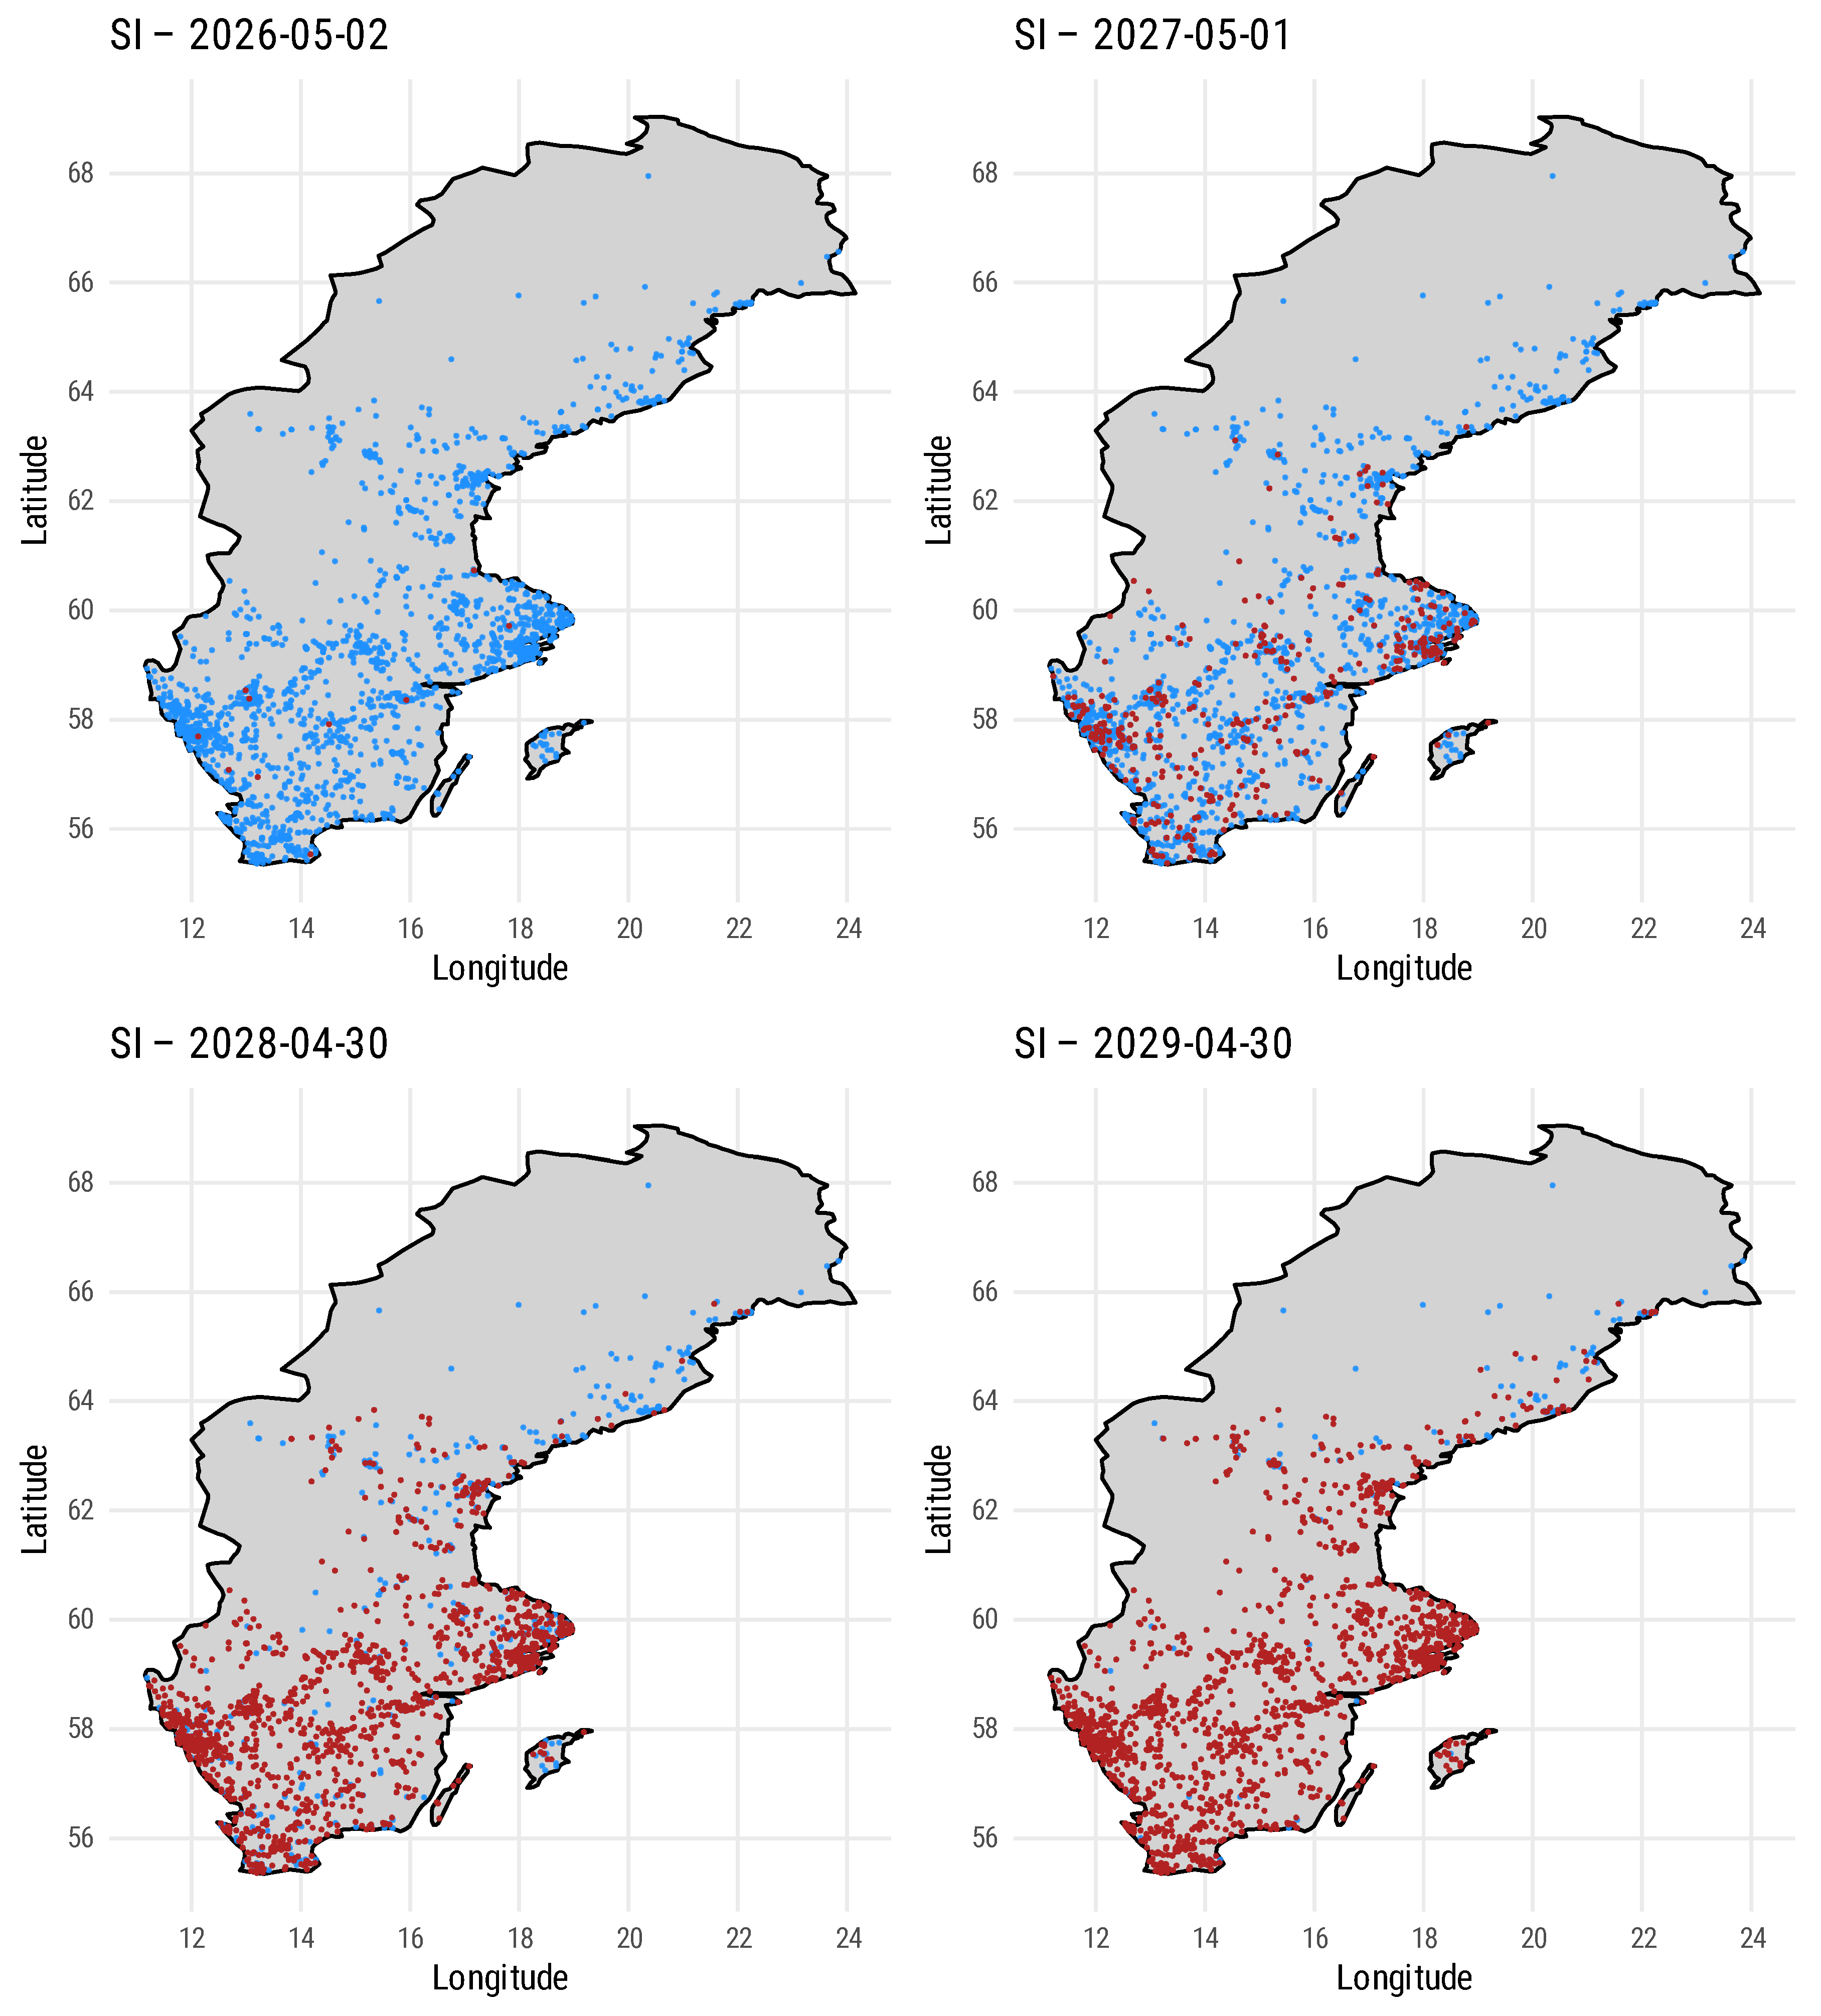
Figure 6.
Varroa Mite Spreed Simulation: Perdiodic treatments scenario. Infected colonies (red) and recovered ones (gray) are shown enlarged for the sake of visibility.
Figure 6.
Varroa Mite Spreed Simulation: Perdiodic treatments scenario. Infected colonies (red) and recovered ones (gray) are shown enlarged for the sake of visibility.
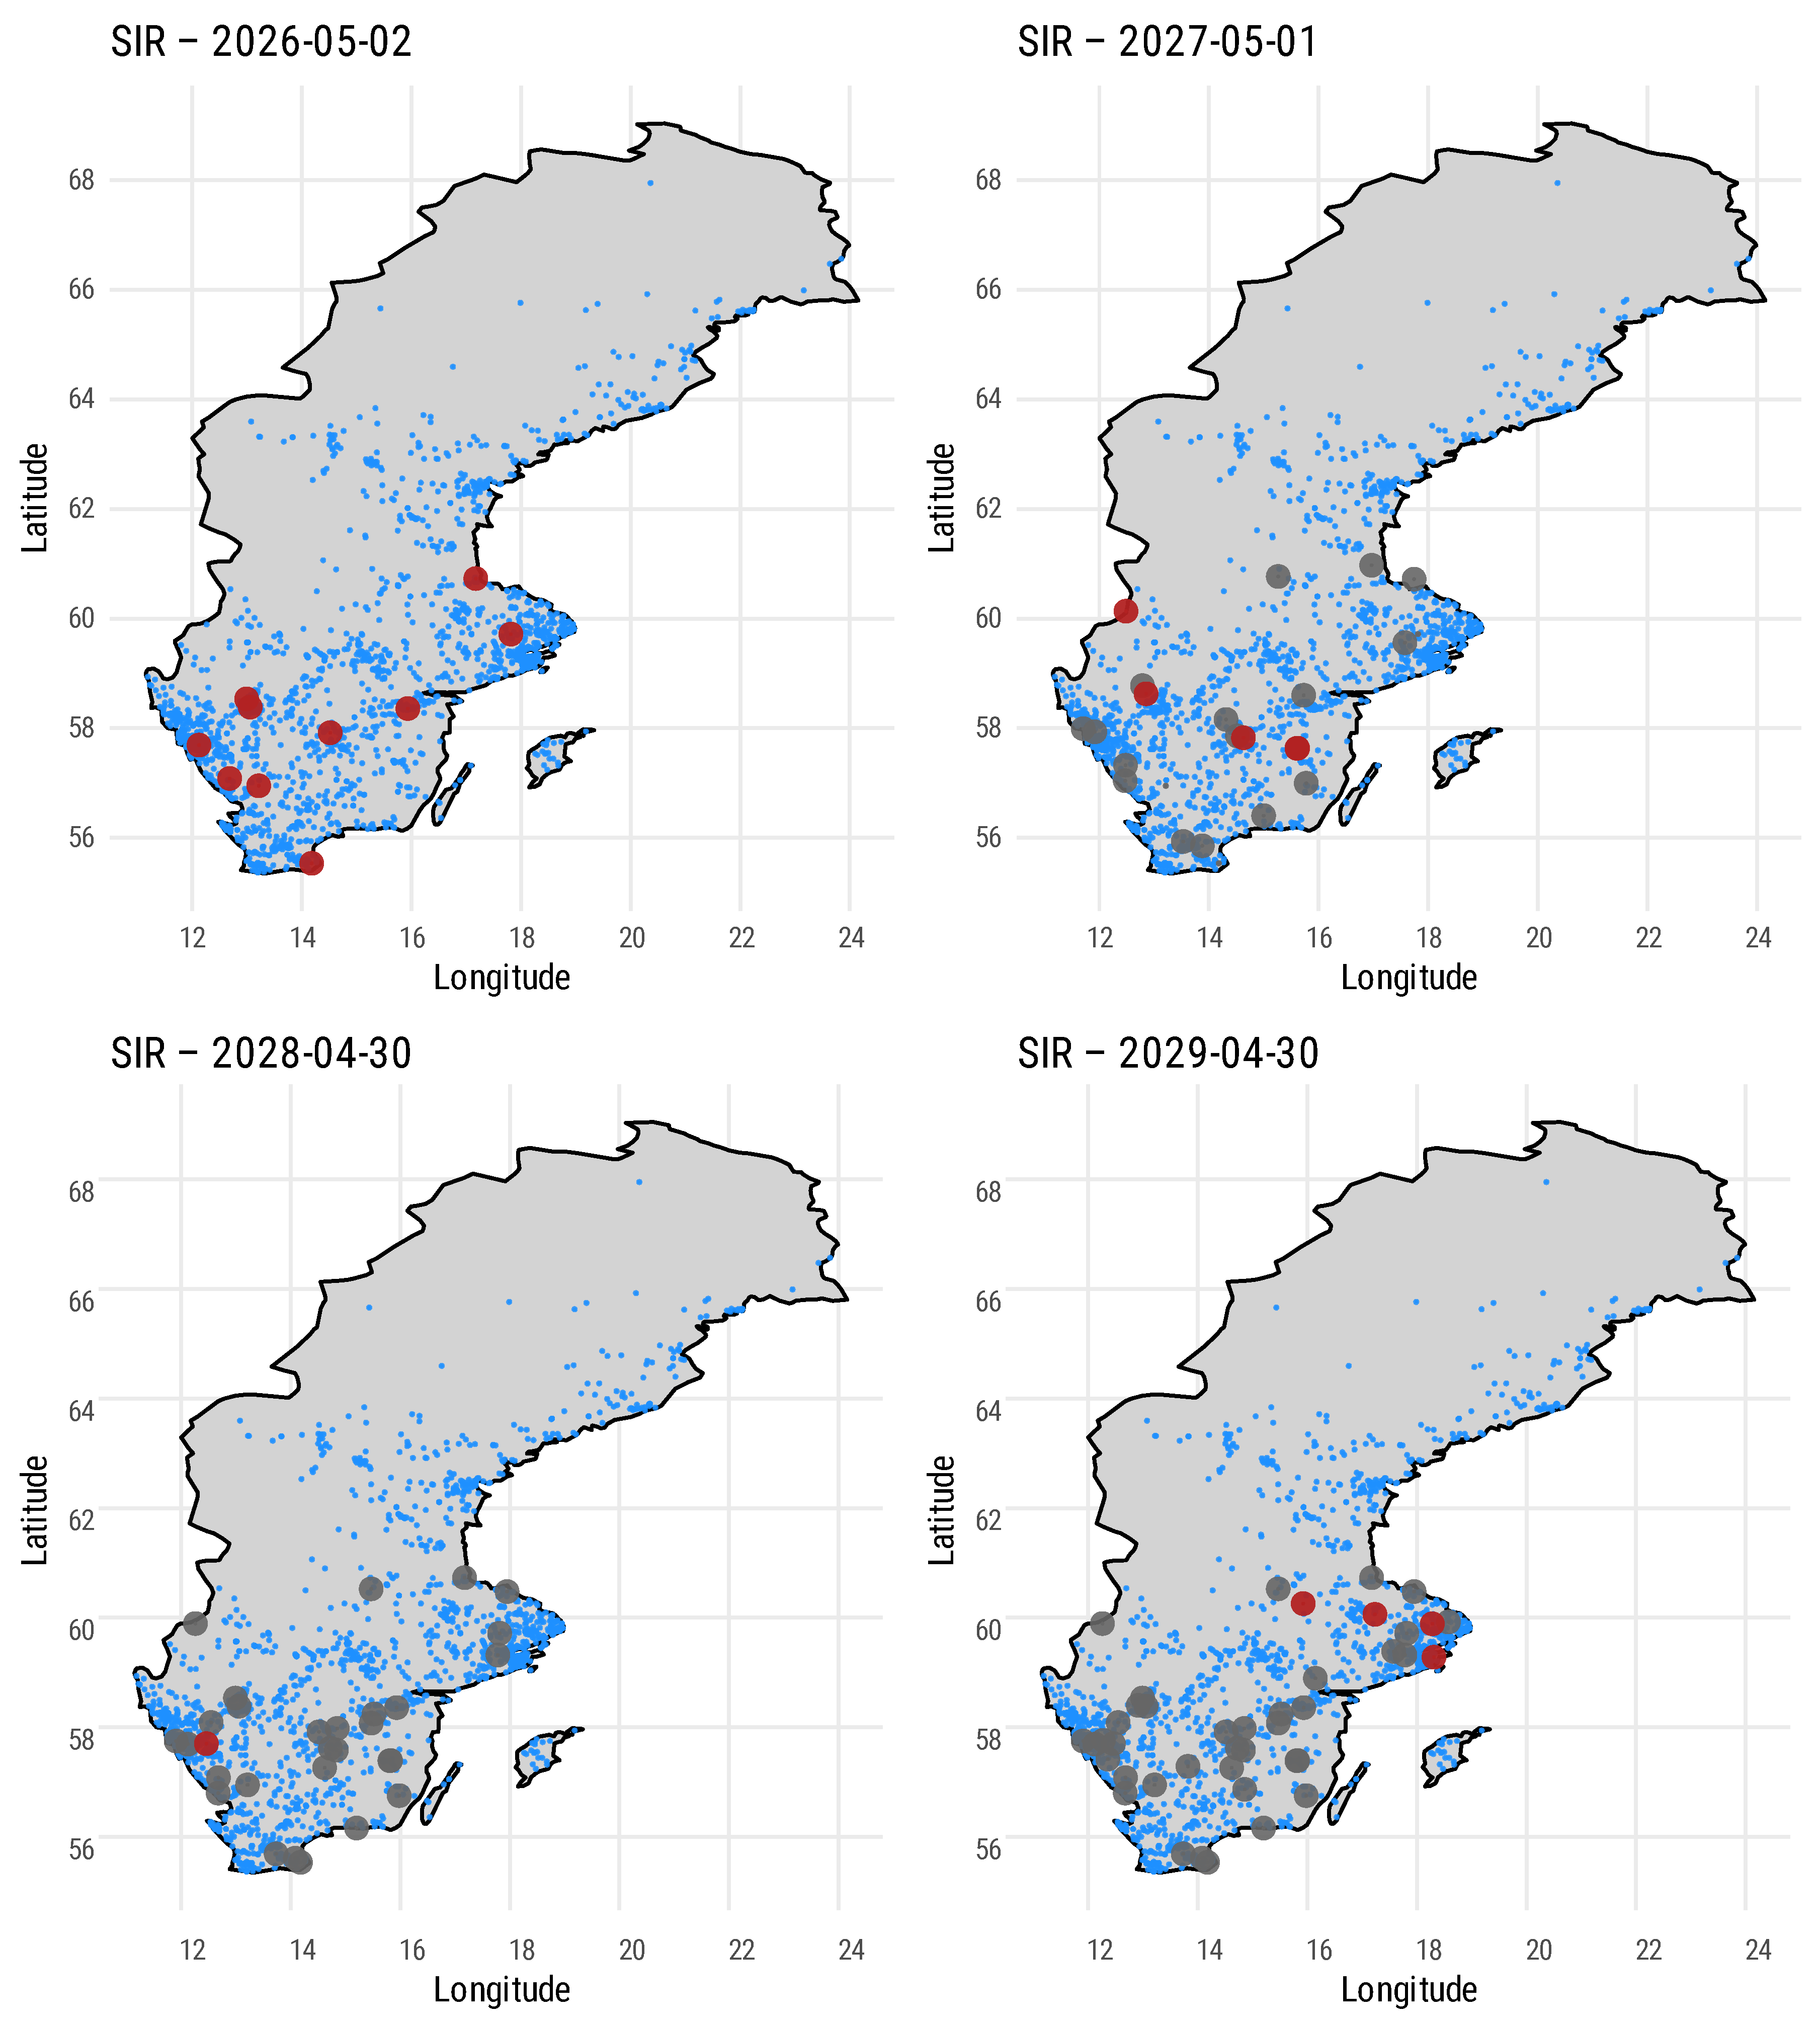
Figure 7.
Varroa mite control through treatment scheduling. In the absence of intervention, within-colony dynamics are well approximated by an susceptible, infected (SI) process, and infection tends toward widespread prevalence. When treatments (e.g., hyperthermia) are applied on a schedule, the system resembles an susceptible, infected, recovered (SIR) process, allowing prevalence to be maintained below target thresholds and preventing system-wide takeover.
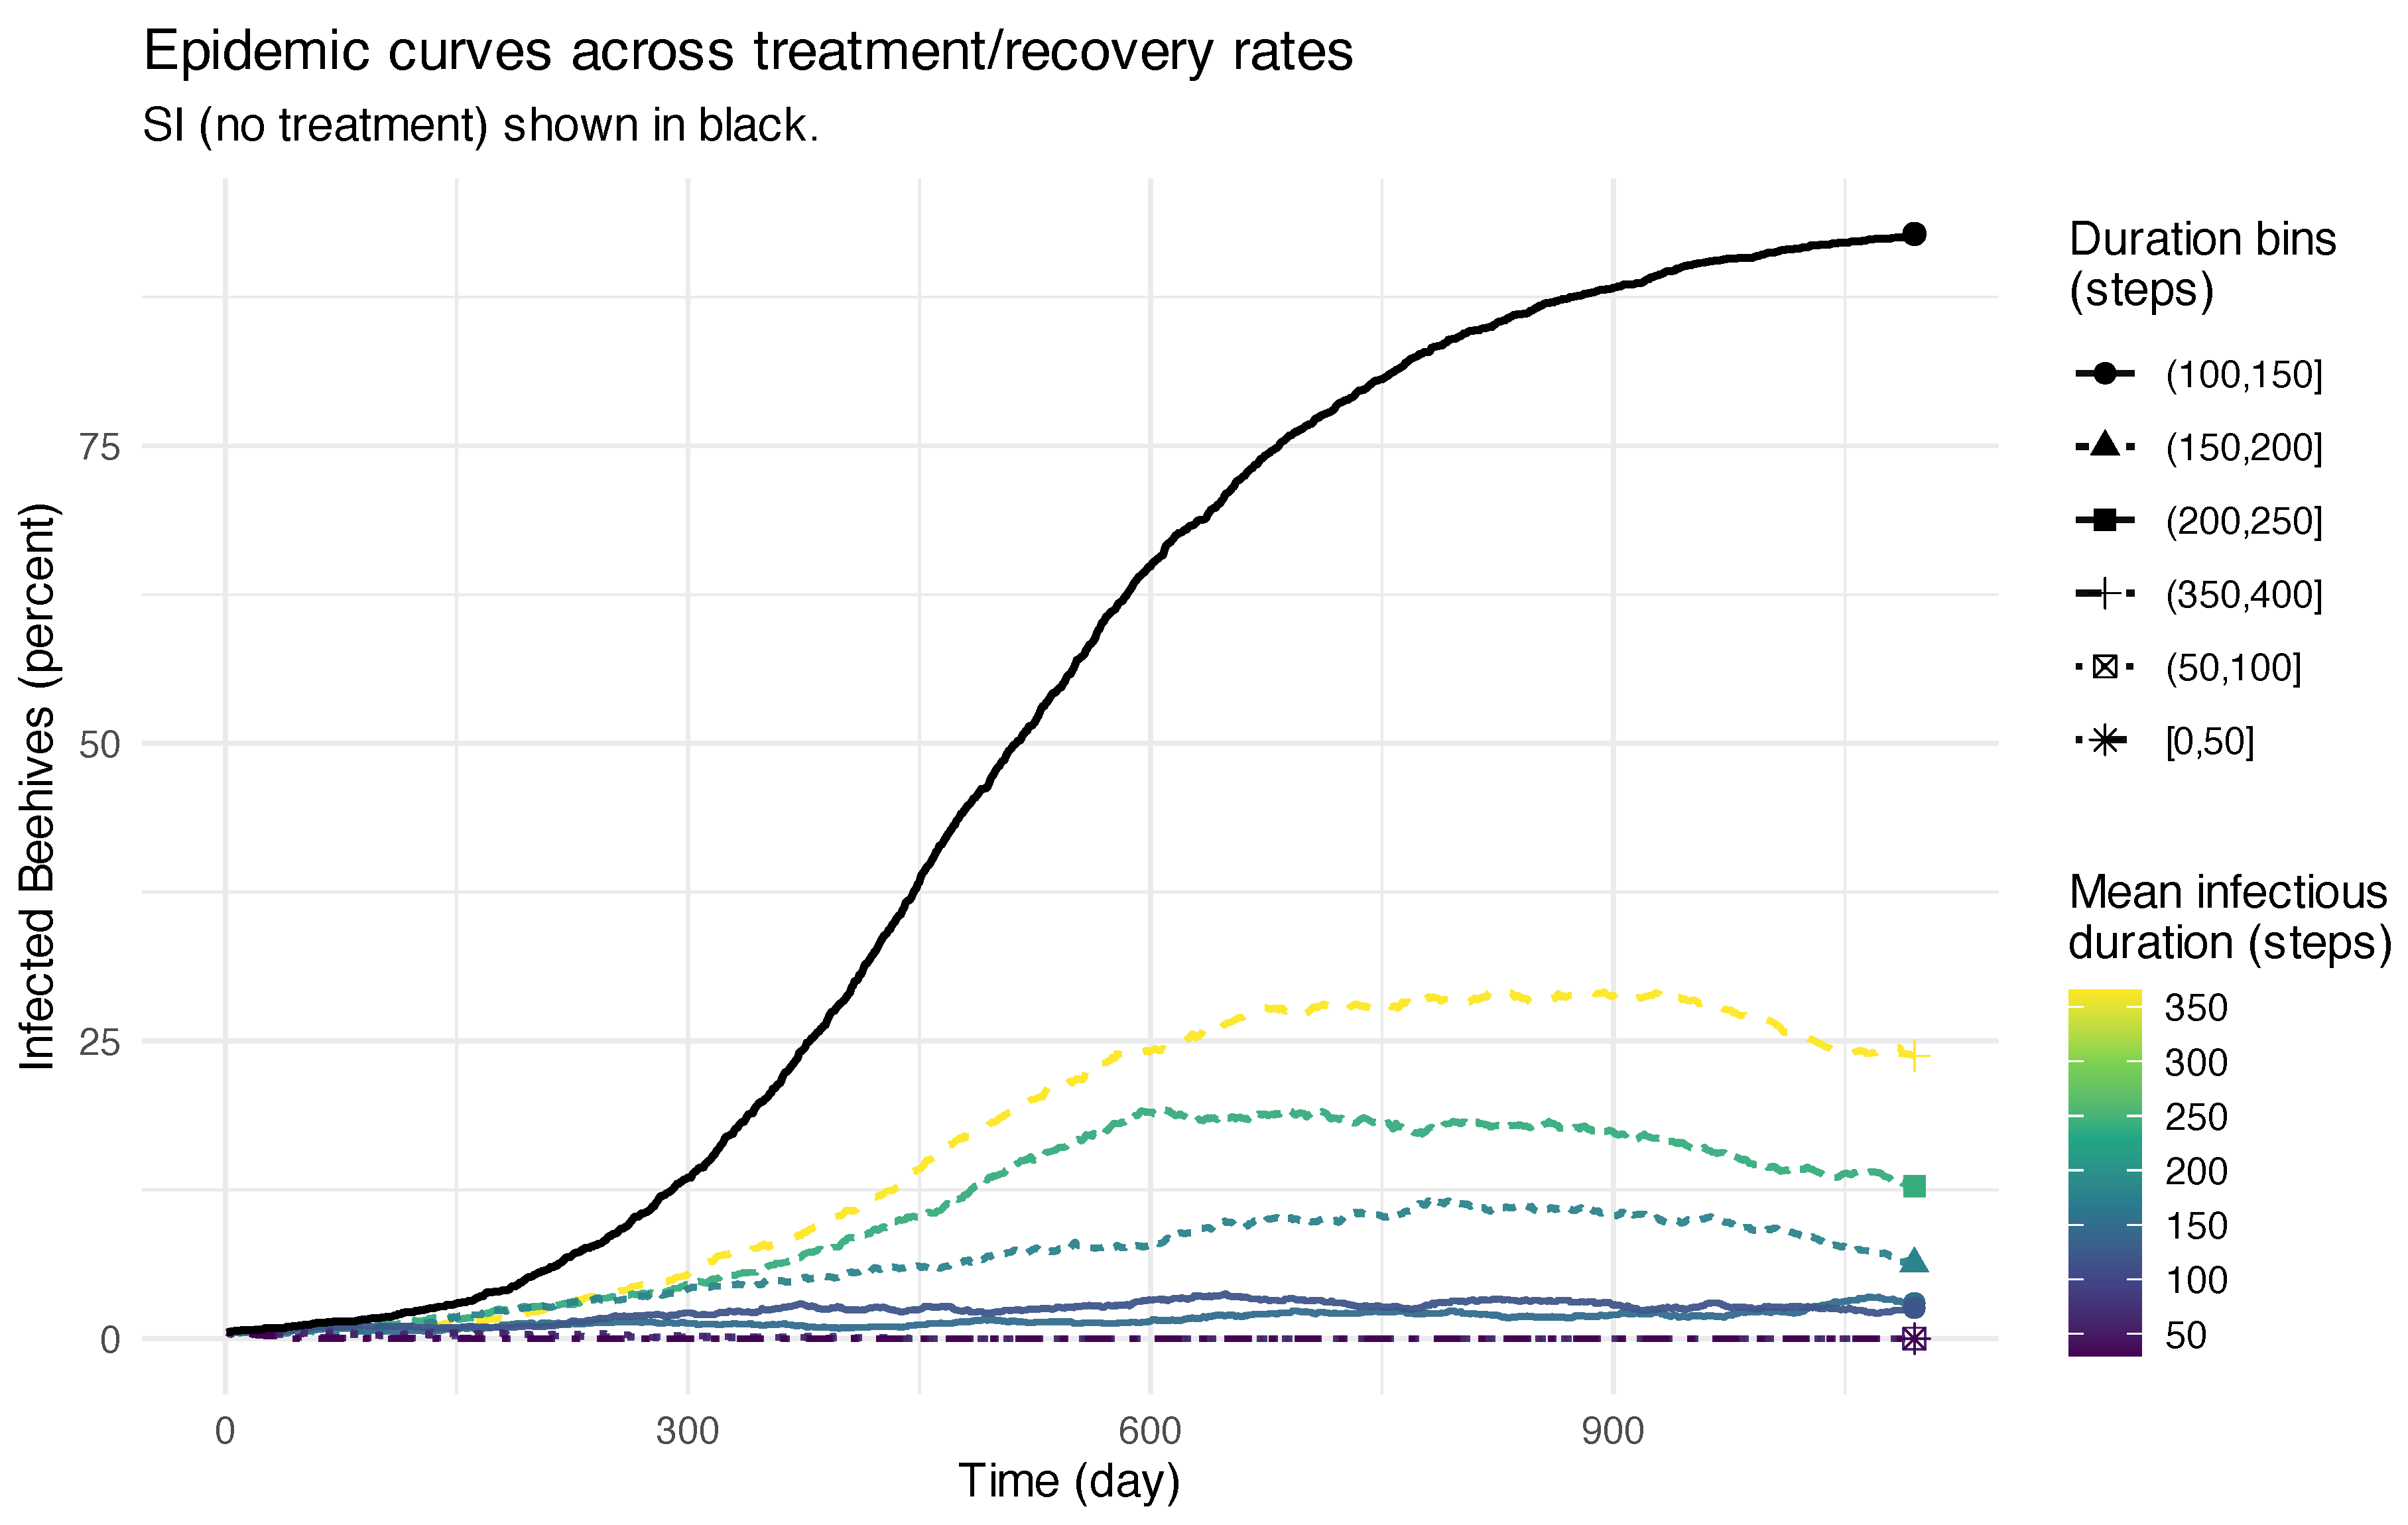

Table 1.
Bee colony node distribution details.
| Parameter | Value |
|---|---|
| Total Nodes | 1891 |
| Average Distance Between Nodes | 332.66 km |
| Distance Variability (SD) | 219.59 km |
| Maximum Distance Between Nodes | 1449.02 km |
| Minimum Distance Between Nodes | 0 km |
| Network Centroid | (latitude 59.0077, longitude 15.2920) |
Table 2.
Energy consumption per monitoring cycle.
| Component | Operation | Power (W) | Duration (s) | Energy (W-s) |
|---|---|---|---|---|
| Camera Module (ESP32-CAM) | Capturing 5 images | 0.90 | 20 | 18.00 |
| DHT22 Sensor | Measuring temperature and humidity | 0.0125 | 20 | 0.25 |
| Microcontroller (ESP32) | Modem/light sleep | 0.10 | 20 | 2.00 |
| NB-IoT Modem (Quectel BC66) | Uplink transmission | 0.36 | 5 | 1.80 |
| NB-IoT Modem (Quectel BC66) | Idle/paging | 0.0008 | 15 | 0.012 |
| Total per Cycle | 22.06 W-s |
Table 3.
Energy consumption for a single treatment cycle (2.5 h heating).
| Component | Operation | Power (W) | Duration (s) | Energy (W-h) |
|---|---|---|---|---|
| Microcontroller (ESP32) | Temperature regulation (active) | 0.10 | 9000 | 0.25 |
| Heater (low-power pad) | Hyperthermia heating | 12 | 9000 | 30.00 |
| Total per cycle (12 W heater) | 30.25 W-h | |||
| Heater (medium pad) | Hyperthermia heating | 65 | 9000 | 162.50 |
| Total per cycle (65 W heater) | 162.75 W-h |
Disclaimer/Publisher’s Note: The statements, opinions and data contained in all publications are solely those of the individual author(s) and contributor(s) and not of MDPI and/or the editor(s). MDPI and/or the editor(s) disclaim responsibility for any injury to people or property resulting from any ideas, methods, instructions or products referred to in the content. |
© 2025 by the authors. Licensee MDPI, Basel, Switzerland. This article is an open access article distributed under the terms and conditions of the Creative Commons Attribution (CC BY) license (http://creativecommons.org/licenses/by/4.0/).
Copyright: This open access article is published under a Creative Commons CC BY 4.0 license, which permit the free download, distribution, and reuse, provided that the author and preprint are cited in any reuse.


