
Submitted:
22 August 2025
Posted:
22 August 2025
You are already at the latest version
Abstract
The rainstorm in Hong Kong on the morning of 14 August 2025 disrupted the daily lives of the public and significantly impacted airport operations. A series of artificial intelligence (AI)-based products were prepared for integration into operations for forecasting/nowcasting purposes, including quantitative precipitation forecasts by several global AI models and an AI-driven mesoscale numerical weather prediction model, AI-based rainfall nowcasting methods, and AI-based guidance-on-guidance. In this study, we document the synoptic, mesoscale, and storm-scale processes that lead to heavy rainfall and evaluate the performance of conventional and AI-enabled models. The AI products appeared to work well in providing timely alerts for this heavy rain episode. Their performances and potential applications are presented herein, which could be useful references for other meteorological authorities facing similar flash flooding challenges in coastal areas. This is the first analysis of the persistent initialisation of convection in an isolated area and the appearance of circulating weather radar echoes, based on a three-dimensional wind field retrieved from weather radars. Directions for future studies of this rainstorm are also discussed.
Keywords:
rainstorm
; radar
; AI
; nowcasting
1. Introduction
In association with the southwest monsoon, a black rainstorm warning signal, the highest category of the colour-coded rainstorm warning system in Hong Kong which refers to widespread areas experiencing hourly rainfall rates of ≥ 70 mm (HKO, 2025), was issued five times in late July and early to mid-August 2025. In some cases, heavy rain was also enhanced in the proximity of remnant tropical cyclones. This breaks the record for the annual frequency of black rainstorms in Hong Kong since the existing rainstorm warning system was established in 1998.
This study documents the dynamic and thermodynamic features of a black rainstorm on the morning of 14 August 2025. This case is novel because artificial intelligence (AI)-based products were established and tested for a severe weather event, and were found to provide useful information for early public warning systems (in the public weather forecast and issuance of special alert messages) and nowcasting (operation of the rainstorm warning signal) of black rainstorms. This case can be a useful reference for other meteorological authorities facing similar challenges of flash flooding in coastal areas during the summer.
The Hong Kong Observatory (HKO) is a meteorological authority in Hong Kong. With the emergence of global AI models, such as Pangu-Weather (Bi et al., 2023), Fuxi (Chen et al., 2023), and Graphcast (Lam et al., 2023), the HKO started to reference global AI models for its daily formulation of weather forecasts in mid-2023 (He and Chan, 2025). Since then, the application of AI has become more widespread, including (1) newer generation of AI models with finer spatial resolutions (Han et al., 2024); (2) the provision of rainfall forecasts from state-of-the-art global AI models and the use of such forecasts in quantitative precipitation forecast (QPF) in southern China in the next 15 days; (3) using global AI models to drive a mesoscale atmosphere-ocean-wave coupled model (UWIN-CM; Lai et al., 2024); (4) developing AI-based algorithms for nowcasting of heavy rain in the next couple of hours in Hong Kong, with six algorithms in operational use since early 2025; and (5) arranging trial-use of guidance, which includes conventional and AI-based nowcasting tools, for assessing the chance of rainstorms (amber, red and black rainstorm warning signals) in roughly the next hour, to provide early alerts to the public (in the form of push messages) and to advise other government departments to conduct timely preventive/corrective measures to alleviate the chance of flooding in various districts in Hong Kong (e.g., clearing the trash covering the drains). All these aspects are discussed in this paper, and their application values and limitations for handling severe rainstorms in Hong Kong are presented.
The daily rainfall on 14 August 2025 over Hong Kong is shown in Figure 1(a). In the 200–300 mm region, the northern part of Lantau Island (including the Hong Kong International Airport [HKA] at Chek Lap Kok), western part of Hong Kong Island, and southeastern corner of Hong Kong Island had the largest amount of rainfall. At HKA, the running 60-min rainfall of 114.3 mm ending at 8:44 a.m. HKT and the running 120-min rainfall of 179.8 mm ending at 9:46 a.m. HKT on 14 August are both the highest on record since 2002. Persistent heavy rain leads to significant disruption of airport operations, resulting in flight delays and rescheduling. The three major rain areas affected by Hong Kong also appear clearly in the weather radar imagery (Figure 1(b)). As discussed in later sections, they are related to some micro-/storm-scale features, as analysed from weather radar data.
2. Synoptic and Mesoscale Situations
In the synoptic and mesoscale patterns, the heavy rain along the coast of Guangdong was related to the southwest monsoon prevailing over the northern part of the South China Sea and the vortex of the weakened Severe Typhoon Podul over the inland Guangdong area, as shown in the surface isobaric chart (Figure 2(a)) and 850 hPa operational analysis from the European Centre for Medium Range Weather Forecast [ECMWF] Integrated Forecast System [IFS] at 00 UTC, 14 August 2025 (Figure 2(b)). From the analysed wind field at these two levels, there was significant convergence between the northwesterly winds associated with Podul’s circulation to the north and the southwest monsoon to the south, which appears as a southwesterly jet, reaching a strong force and providing abundant moisture.
In the middle troposphere, the Pearl River Estuary area is covered by the circulation of Podul in the 500 hPa geopotential height field (Figure 2(c)). The 500 hPa geopotential height in Hong Kong reached a low value of 5839 m. At 200 hPa, there was a significant directional divergence over the eastern coast of Guangdong, with southerly winds to the northeast of Hong Kong and northerly winds to the southwest. The divergence is highly favourable for the occurrence of a heavy rain band to the south of the centre of Podul, taking the form of a mesoscale convective system (MCS). Such components, including the low-level moisture convergence and enhanced upper-level divergence, are canonical precursors to heavy rainfall and organised convection (Doswell et al., 1996; Houze, 2004).
The HKO operationally uses local radiosonde and microwave radiometer/wind profiler data to perform hourly upper-air sounding analysis. The real-time value of a particular meteorological parameter (dynamic, humidity, and instability) was compared with the climatological distribution of that particular parameter from the data from 2016 to 2020 in that season (July to September) around the time of the real-time data under consideration. As an example, the upper air sounding analysis at 20 UTC on 13 August 2025 is shown in Figure 3, compared with the climatological records around that time of day (17–23 UTC). The real-time value from the sounding is represented by a horizontal dotted line for each parameter, and the climatological value distributions are shown as box and whisker plots. If it reached a high or extreme value, the box of the corresponding parameter was highlighted in red or purple. As shown in Figure 3, the dynamic parameters are not particularly high (left column). Humidity-related parameters are generally high (middle two columns). In particular, the precipitable water vapour exceeds 60 mm. Instability-related parameters are particularly high (the fourth and fifth columns). The convective available potential energy has a high value of > 4000 J/kg. A highly unstable and humid troposphere is favourable for the occurrence of heavy rain.
3. Storm-Scale Features
As shown in the weather radar imagery (Figure 1(b)), the heavy rainband over Hong Kong is oriented west-northwest and east-southeast, which is generally consistent with the low-level convergence between the northwesterly to the north and the southwest monsoon to the south. Within this rainband, two major features sustained the development of intense convection over Hong Kong and the occurrence of three heavy rain areas, as discussed in Section 1. From the animation of the radar reflectivity images (not shown), two features are apparent: (1) a quasi-stationary and localised convective development zone over the sea just to the northwest of Chek Lap Kok, with new convection continuously initiated, developed, and then drifted in the east-southeast direction following the mid-tropospheric flow, affecting Lantau Island and Hong Kong Island; and (2) circulating echoes near the point of convection initiation in (1) above, over the sea between Lantau Island and Hong Kong Island, and over the sea to the southeast of Hong Kong Island. These two storm-scale features are indicative of persistent heavy rains in Hong Kong. These two features were analysed using a three-dimensional wind retrieval method based on weather radar data in Hong Kong following the method of Chan et al. (2025).
For the persistent initiation of convection just to the northwest of Chek Lap Kok, the 3-km wind field (Figure 4(a)) showed persistent horizontal convergence in the northwesterly winds, namely northwesterly winds with more northerly components to the north and northwesterly winds with more westerly components to the south. This convergence area was associated with an area of significant upward motion (Figure 4(a)) and intense weather radar echoes (Figure 4(b)). Vertical cross-sections were made of this convergence area, namely along the generally northwesterly winds (Figure 5(a)) and across that region (Figure 5(b)). For the former, there was an upward motion in the strong reflectivity core along the northwesterly flow, followed by a downward motion downstream. For the latter, vertical circulations were observed on the two sides of the convergence area, converging at the lower levels (between 2 and 4 km above sea level), with an upward motion at the reflectivity core in the middle troposphere and divergence in the upper levels (between 8 and 10 km above sea level). Sinking motions occurred approximately 3–5 km away from the reflectivity core. Therefore, there are two closed vertical circulations on both sides of the reflectivity core.
The physical mechanism for the occurrence of this persistent low-level convergence area with associated vertical circulations on either side requires further investigation such as storm-scale numerical weather prediction (NWP) experiments. This is beyond the scope of the current study and will be investigated in future studies.
For the second feature, circulating radar reflectivity echoes, the analysed wind field showed nearly closed horizontal circulation/significant waves at 3 km above sea level (Figure 6(a)), with upward motion ahead of the wave. The vertical cross-section across the waves (Figure 6(b)) showed significant downward and upward motions. The occurrence of the middle to upper tropospheric waves is consistent with radar wind profiler observations in downtown Hong Kong (Figure 7(a)). In contrast, in the lower troposphere (Figure 7(b)), the weather radar wind profiler in Hong Kong (near the airport at Chek Lap Lok) showed the passage of Podul circulation only, namely, changing from northwesterly winds to strong (blue wind barbs) and gale-forced (red wind barbs) southwesterly winds associated with the southwest monsoon.
4. Performance of Numerical Models
Some weather prediction models accurately captured the occurrence of heavy rain on the morning of 14 August 2025, thus enabling the early issuance of alert messages to members of the public. Both global and mesoscale models are discussed.
4.1. Global NWP and AI Models
The HKO routinely refers to multiple global NWP models and various global AI models when formulating weather forecasts for the next nine days. As an example, the rainfall forecasts of the ECMWF IFS and Pangu global model initialized at 00 UTC on 13 August 2025 were considered. Figure 8 shows the surface isobaric patterns and rainfall forecasts. Both models forecast the occurrence of significant rain over or near Hong Kong on the morning of 14 August 2025. However, the rainfall forecast of the ECMWF IFS (Figure 8(a) and 8(b)) was underestimated compared with the actual observations, with 3-hourly rainfall in the region of 10 mm only. The rainy area near Hong Kong also does not appear to be consistent with the actual observations (e.g., weather radar imagery in Figure 1(b)). However, the timing, intensity, and orientation of heavy rain in the Pangu forecast (Figure 8(c) and 8(d)) are consistent with the actual observations. The 6-hourly rainfall could exceed 100 mm, which is of the same order of magnitude as in reality. The Pangu model (together with other AI models, not shown) provides confidence to weather forecasters about the occurrence of heavy rain, as well as its timing over Hong Kong, at least one day before the heavy rain event, so that timely alert messages can be issued to the public.
4.2. Mesoscale NWP Models
Two mesoscale NWP models were considered: the Tropical Regional Atmospheric System (TRAMS, Chen et al., 2008) and UWIN-CM (Lai et al., 2024). The time series of the forecast rainfall at two major stations in Hong Kong by the TRAMS and UWIN-CM, namely the HKO Headquarters and HKA, are shown in Figure 9(a) and 9(b), respectively, for a number of model runs. For the TRAMS (Figure 9(a)), only isolated runs (four in total) manage to capture the heavy rain at HKO. The same applies to HKA with a persistent underestimation of rainfall. For the UWIN-CM (Figure 9(b)), the peak rainfall at HKO was well captured, although with some overestimation of rainfall and differences in the timing of heavy rain compared to reality (mostly within 3 h).For HKA, the peak rainfall for both timing and intensity was persistently well captured.
As an example, the model runs initialised at 00 UTC on 13 August 2025 are shown in Figure 10(a) and 10(b) for 21-h and 24-h forecasts by TRAMS and in Figure 10(c) and 10(d) for those by the UWIM-CM. The TRAMS forecast rainfall amount over Hong Kong was significantly underestimated; that is, rain was mostly associated with the main circulation in Podul. Conversely, the intensity and orientation of the major rainband near Hong Kong were well forecasted by the UWIN-CM, although the rainband arrived 3 h earlier than the actual observations. Upon close inspection of the forecast meteorological fields at various levels of the atmosphere, one major factor contributing to the difference in rainfall forecasts by the two models was the handling of the 200 hPa wind field. The 200 hPa actual wind observations at 00 UTC on 14 August 2025 are shown in Figure 11(a), overlaid over the false-colour meteorological satellite imagery. Consistent with the analysis in Figure 2(d), the significant directional divergence in the upper troposphere was a major contributing factor to the occurrence of heavy rain, as shown by an extensive MCS to the south of the circulation of Podul in the satellite imagery. The corresponding 200 hPa forecast by the TRAMS and UWIN-CM at 200 hPa is shown in Figure 11(b) and 11(c), respectively. Although both models showed significant divergence near Hong Kong, the orientation of the 200 hPa divergence line near Hong Kong in the UWIN-CM forecast (Figure 11(c)) may have contributed to a more accurate forecast of the orientation and intensity of heavy rain. In particular, the west-northwest to east-southeast orientation of the 200 hPa divergence across Hong Kong is evident in the 24-h forecast of UWIN-CM.
The major differences between the TRAMS and UWIN-CM include: (a) the source of initial conditions and lateral boundary conditions for the regional model, where the TRAMS takes the forecast from the ECMWF IFS and the UWIN-CM uses the Pangu global model; (b) the handling of convection, namely the TRAMS with 9 km horizontal resolution uses the new Scale-Aware Simplified Arakawa-Schubert cumulus convection and WSM6 microphysical schemes; whereas UWIN-CM with 1.33-km horizontal resolution in its inner domain resolves convection explicitly with the same microphysical scheme; and (c) that the TRAMS is an atmosphere-only model, whereas UWIN-CM couples with ocean and wave information. As a preliminary study of the impact of various factors, a numerical experiment was conducted to drive the UWIN-CM using the ECMWF IFS initialized at 00 UTC on 13 August 2025. The resultant 200 hPa wind and divergence and the surface rainfall in the 24-h forecast are shown in Figure 12(a) and 12(b). A significant divergence was predicted near Hong Kong. For the major rainband, the orientation was correctly forecasted (west-northwest to east-southeast), although the heavy rain areas (coloured purple, with 3-hourly rainfall of > 50 mm) were more patchy compared with the original UWIN-CM forecast (Figure 10(d)). As such, the driving model makes some contributions, but does not seem to be the determining factor in forecasting the timing, intensity, and orientation of the major rainband over Hong Kong. It is envisaged that the differences in spatial resolution (convection resolving) and the air-ocean-wave coupling are important in this case to make more accurate rainfall predictions. This is a preliminary study, and a more in-depth investigation into the various factors is required.
5. Nowcasting Aspect
From 6:00–7:00 a.m. HKT on 14 August 2025, the initiation and intensification of radar reflectivity due to the convergence of unstable northwesterly winds and the southwest monsoon became more pronounced over the Pearl River Estuary. Precipitation nowcasting products based on conventional radar extrapolation using optical flow and several deep learning nowcast models indicate that heavy rain will persist in the territory for the following couple of hours. The panels in Figure 13 depicts the actual quantitative precipitation estimate (QPE) of hourly rainfall at 8:45 a.m. based on radar and rain gauge observations, the 1-h QPFs generated from radar extrapolation using optical flow initialised approximately an hour earlier, and the deep learning nowcast models (Wong, 2024) currently in operational trials. The QPFs generally provide good agreement on more significant rainfall in the southern part of the territory, with maxima on Lantau Island and in the vicinity of HKA. Hourly precipitation nowcasts exceeding 70 mm were captured well using the optical flow extrapolation nowcast, diffusion, ConvLSTM-GAN, and Earthformer. A nowcast rainfall exceeding 110 mm was revealed in the radar extrapolation and diffusion nowcasts derived from a consensus of an eight-member ensemble. A more detailed discussion of the technical configurations and performance of this multi-model nowcasting suite for rainstorms in 2025 will be provided in another paper.
To facilitate the assessment of rainstorm development and decision-making by weather forecasters to ensure timeliness and early warning as far as practicable, the above radar extrapolation and deep learning nowcast outputs were further integrated to generate a probabilistic nowcast guidance for the chance (high/medium-high/medium/medium-low/low) of rainstorm warning for the next 2 h. Briefly, a long-short-term memory model combined with a video transformer was trained using past rain gauge observations with QPFs from optical flow extrapolation and selected deep learning nowcasts. This AI-based nowcast guidance is expected to optimise the predictive skills regarding the percentage of rain gauges reaching rainstorm warning levels (amber, red, and black) by considering various nowcast QPFs for the following 2-h period.
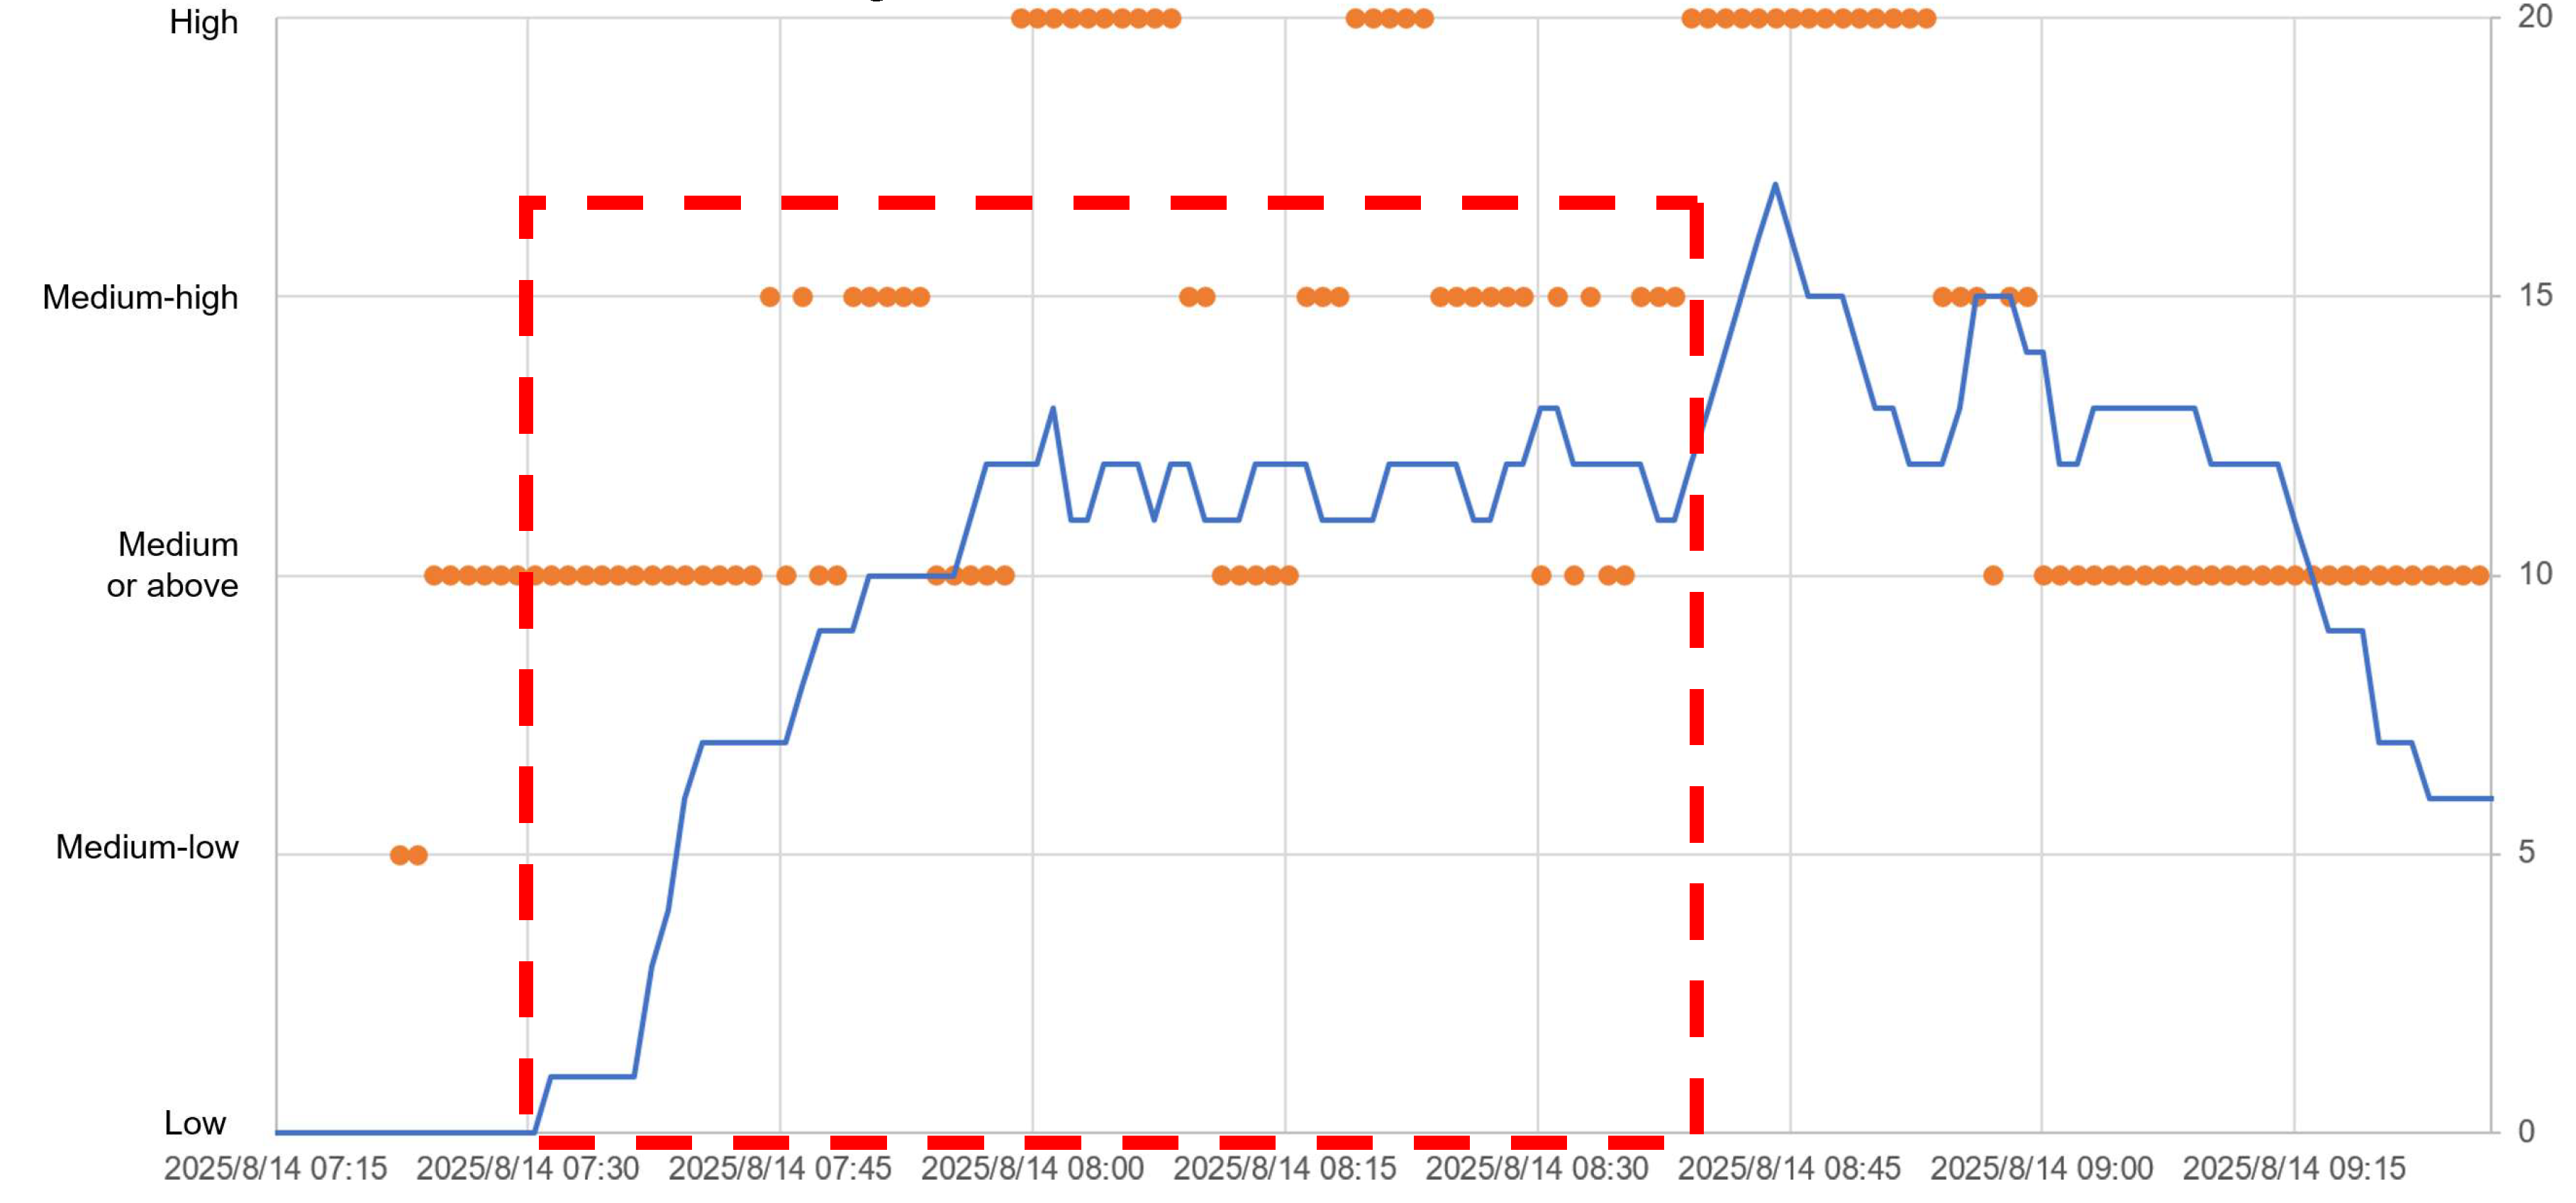
Figure 14 shows a time series of the number of rain gauges with an hourly accumulated rainfall of ≥ 70 mm from 7:15 a.m. to 9:30 a.m. on 14 August 2025. A substantial increase in the number of rain gauges (blue line) was observed after 7:30 a.m., exceeding 10 before 8:00 a.m. and peaking by 8:45 a.m. The probabilistic guidance (orange dots) indicates that the chance of a black rainstorm in the following 2 h is medium or above (>= 50%) after 7:25 a.m. and becoming medium-high (high) by 7:45 (8:00) a.m. The AI-based probabilistic assessment provided a useful indication to weather forecasters about the likelihood of continual heavy rain development in the following couple of hours when the black rainstorm warning was issued at 7:50 a.m.
6. Conclusions
The persistent heavy rain on the morning of 14 August 2025 was related to synoptic, mesoscale, and micro-/storm-scale features. The three-dimensional retrieved wind field based on weather radar data revealed, for the first time, the possible reasons for the heavy rain, namely the horizontal convergence with associated vertical circulations to the northwest of Chek Lap Kok and the appearance of a series of microscale cyclones/waves in the middle to upper troposphere. These small-scale features, embedded in the background environment of tropical cyclone Podul, the southwest monsoon, and significant upper-tropospheric directional divergence, resulted in heavy rain in Hong Kong. At HKA, the running 60-min rainfall of 114.3 mm ending at 8:44 a.m. on 14 August and the running 120-minute rainfall of 179.8 mm ending at 9:46 a.m. on that day were both the highest since the first record in 2002. The persistent heavy rain led to significant disruption of airport operations, resulting in delays and re-scheduling of flights, with impacts lasting until 16 August 2025 (2 days later).
AI-based forecasting and nowcasting products appear to provide advance alerts to weather forecasters regarding the timing and strength of heavy rains in Hong Kong. With the advancement of AI technology, alerts may be made to the public and aviation stakeholders (together with other special users) with confidence 12–24 h ahead of the occurrence of exceptionally heavy and persistent rain. This would have significant implications for preparing for various activities, such as informing air travellers and planning flights. Of course, AI-based products are rather new, and their performance has yet to be tested. The present case appears to have been successful; however, long-term performance monitoring is still required.
References
- Bi, K.; Xie, L.; Zhang, H.; Chen, X.; Gu, X.; Tian, Q. Accurate medium-range global weather forecasting with 3D neural networks. Nature 2023, 619, 533–538. [Google Scholar] [CrossRef]
- Chan, Y.W.; Chan, P.W.; Cheung, P. Observation of downburst associated with intense thunderstorms encountered by an aircraft at Hong Kong International Airport. Applied Sciences 2025, 15, 2223. [Google Scholar] [CrossRef]
- Chen, D.H.; Xue, J.S.; Yang, X.S.; Zhang, H.L.; Shen, X.S.; Hu, J.L.; Wang, Y.; Ji, L.R.; Chen, J.B. New generation of multi-scale NWP system (GRAPES): general scientific design. Chinese Science Bulletin 2008, 53, 3433–3445. [Google Scholar] [CrossRef]
- Chen, L.; Zhong, X.; Zhang, F.; Cheng, Y.; Xu, Y.; Qi, Y.; Li, H. FuXi: a cascade machine learning forecasting system for 15-day global weather forecast. npj Climate and Atmospheric Science 2023, 6, 190. [Google Scholar] [CrossRef]
- Doswell, C.A.I.I.I.; Brooks, H.E.; Maddox, R.A. Flash flood forecasting: An ingredients-based methodology. Weather and Forecasting 1996, 11, 560–581. [Google Scholar] [CrossRef]
- Han, T.; Guo, S.; Ling, F.; Chen, K.; Gong, J.; Luo, J.; Gu, J.; Dai, K.; Ouyang, W.; Bai, L. FengWu-GHR: Learning the Kilometer-scale Medium-range Global Weather Forecasting. arXiv 2024, arXiv:2402.00059. [Google Scholar] [CrossRef]
- He, Y.H.; Chan, P.W. A study of the extended-range weather forecasts by artificial intelligence models Pangu-Weather and FengWu. Weather 2025, 80, 134–138. [Google Scholar] [CrossRef]
- HKO. (2025) Rainstorm Warning System. Hong Kong Observatory. https://www.hko.gov.hk/en/wservice/warning/rainstor.htm (Accessed August 2025).
- Houze, R.A., Jr. Mesoscale convective systems. Reviews of Geophysics 2004, 42, RG4003. [Google Scholar] [CrossRef]
- Lai, S.K.; Chan, P.W.; He, Y.; Chen, S.S.; Kerns, B.W.; Su, H.; Mo, H. Real-time operational trial of atmosphere–ocean–wave coupled model for selected tropical cyclones in 2024. Atmosphere 2024, 15, 1509. [Google Scholar] [CrossRef]
- Lam, R.; Sanchez-Gonzalez, A.; Willson, M.; Wirnsberger, P.; Fortunato, M.; Alet, F.; Ravuri, S.; Ewalds, T.; Eaton-Rosen, Z.; Hu, W.; Merose, A.; Hoyer, S.; Holland, G.; Vinyals, O.; Stott, J.; Pritzel, A.; Mohamed, S.; Battaglia, P. Learning skillful medium-range global weather forecasting. Science 2023, 382, eadi2336. [Google Scholar] [CrossRef] [PubMed]
- Wong, W.K. (2024) AI Technology in Nowcasting. WMO WMC Beijing Workshop on New Technology and Products, Guangzhou, 12–14 November 2024 (presentation available at https://rsmc.hko.gov.hk/nowcast/papers/AI-Nowcasting-Technology.pdf).
Figure 1.
(a) Daily rainfall distribution over Hong Kong and (b) the weather radar imagery of Hong Kong at 8:00 a.m. (00 UTC, with Hong Kong time = UTC + 8 h) on 14 August 2025.A, B, and C are three major convection development areas.
Figure 1.
(a) Daily rainfall distribution over Hong Kong and (b) the weather radar imagery of Hong Kong at 8:00 a.m. (00 UTC, with Hong Kong time = UTC + 8 h) on 14 August 2025.A, B, and C are three major convection development areas.
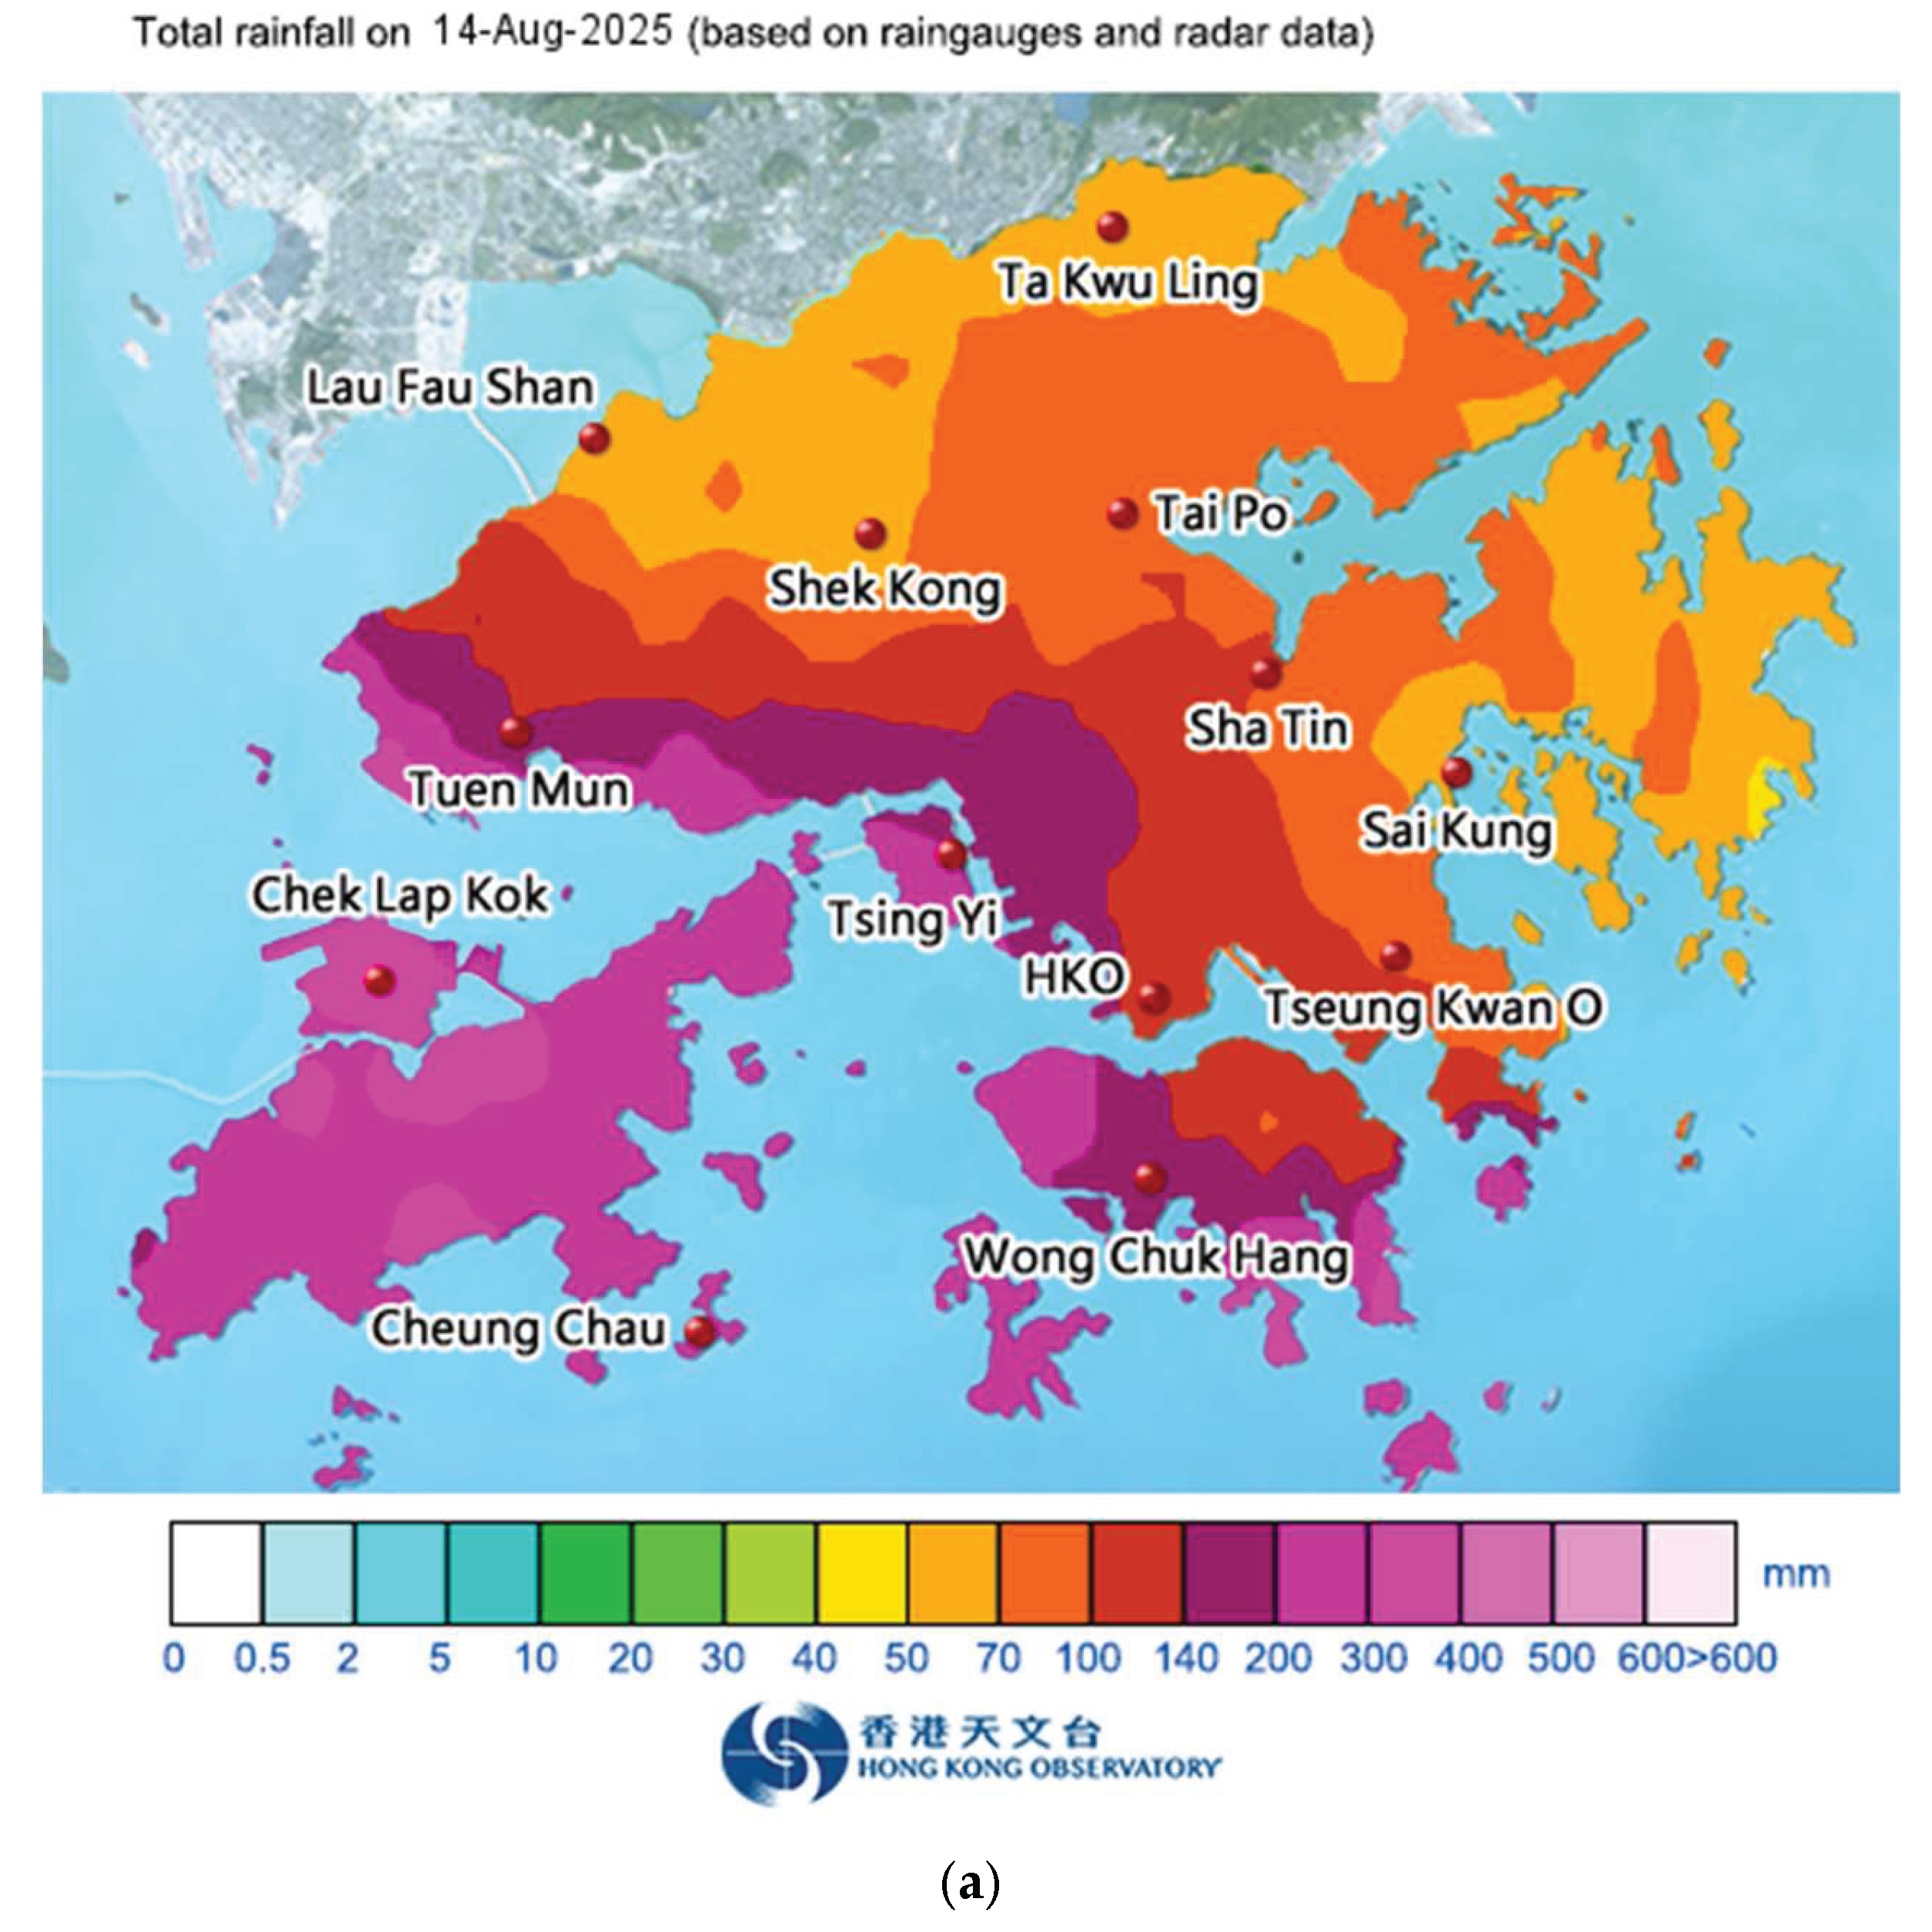
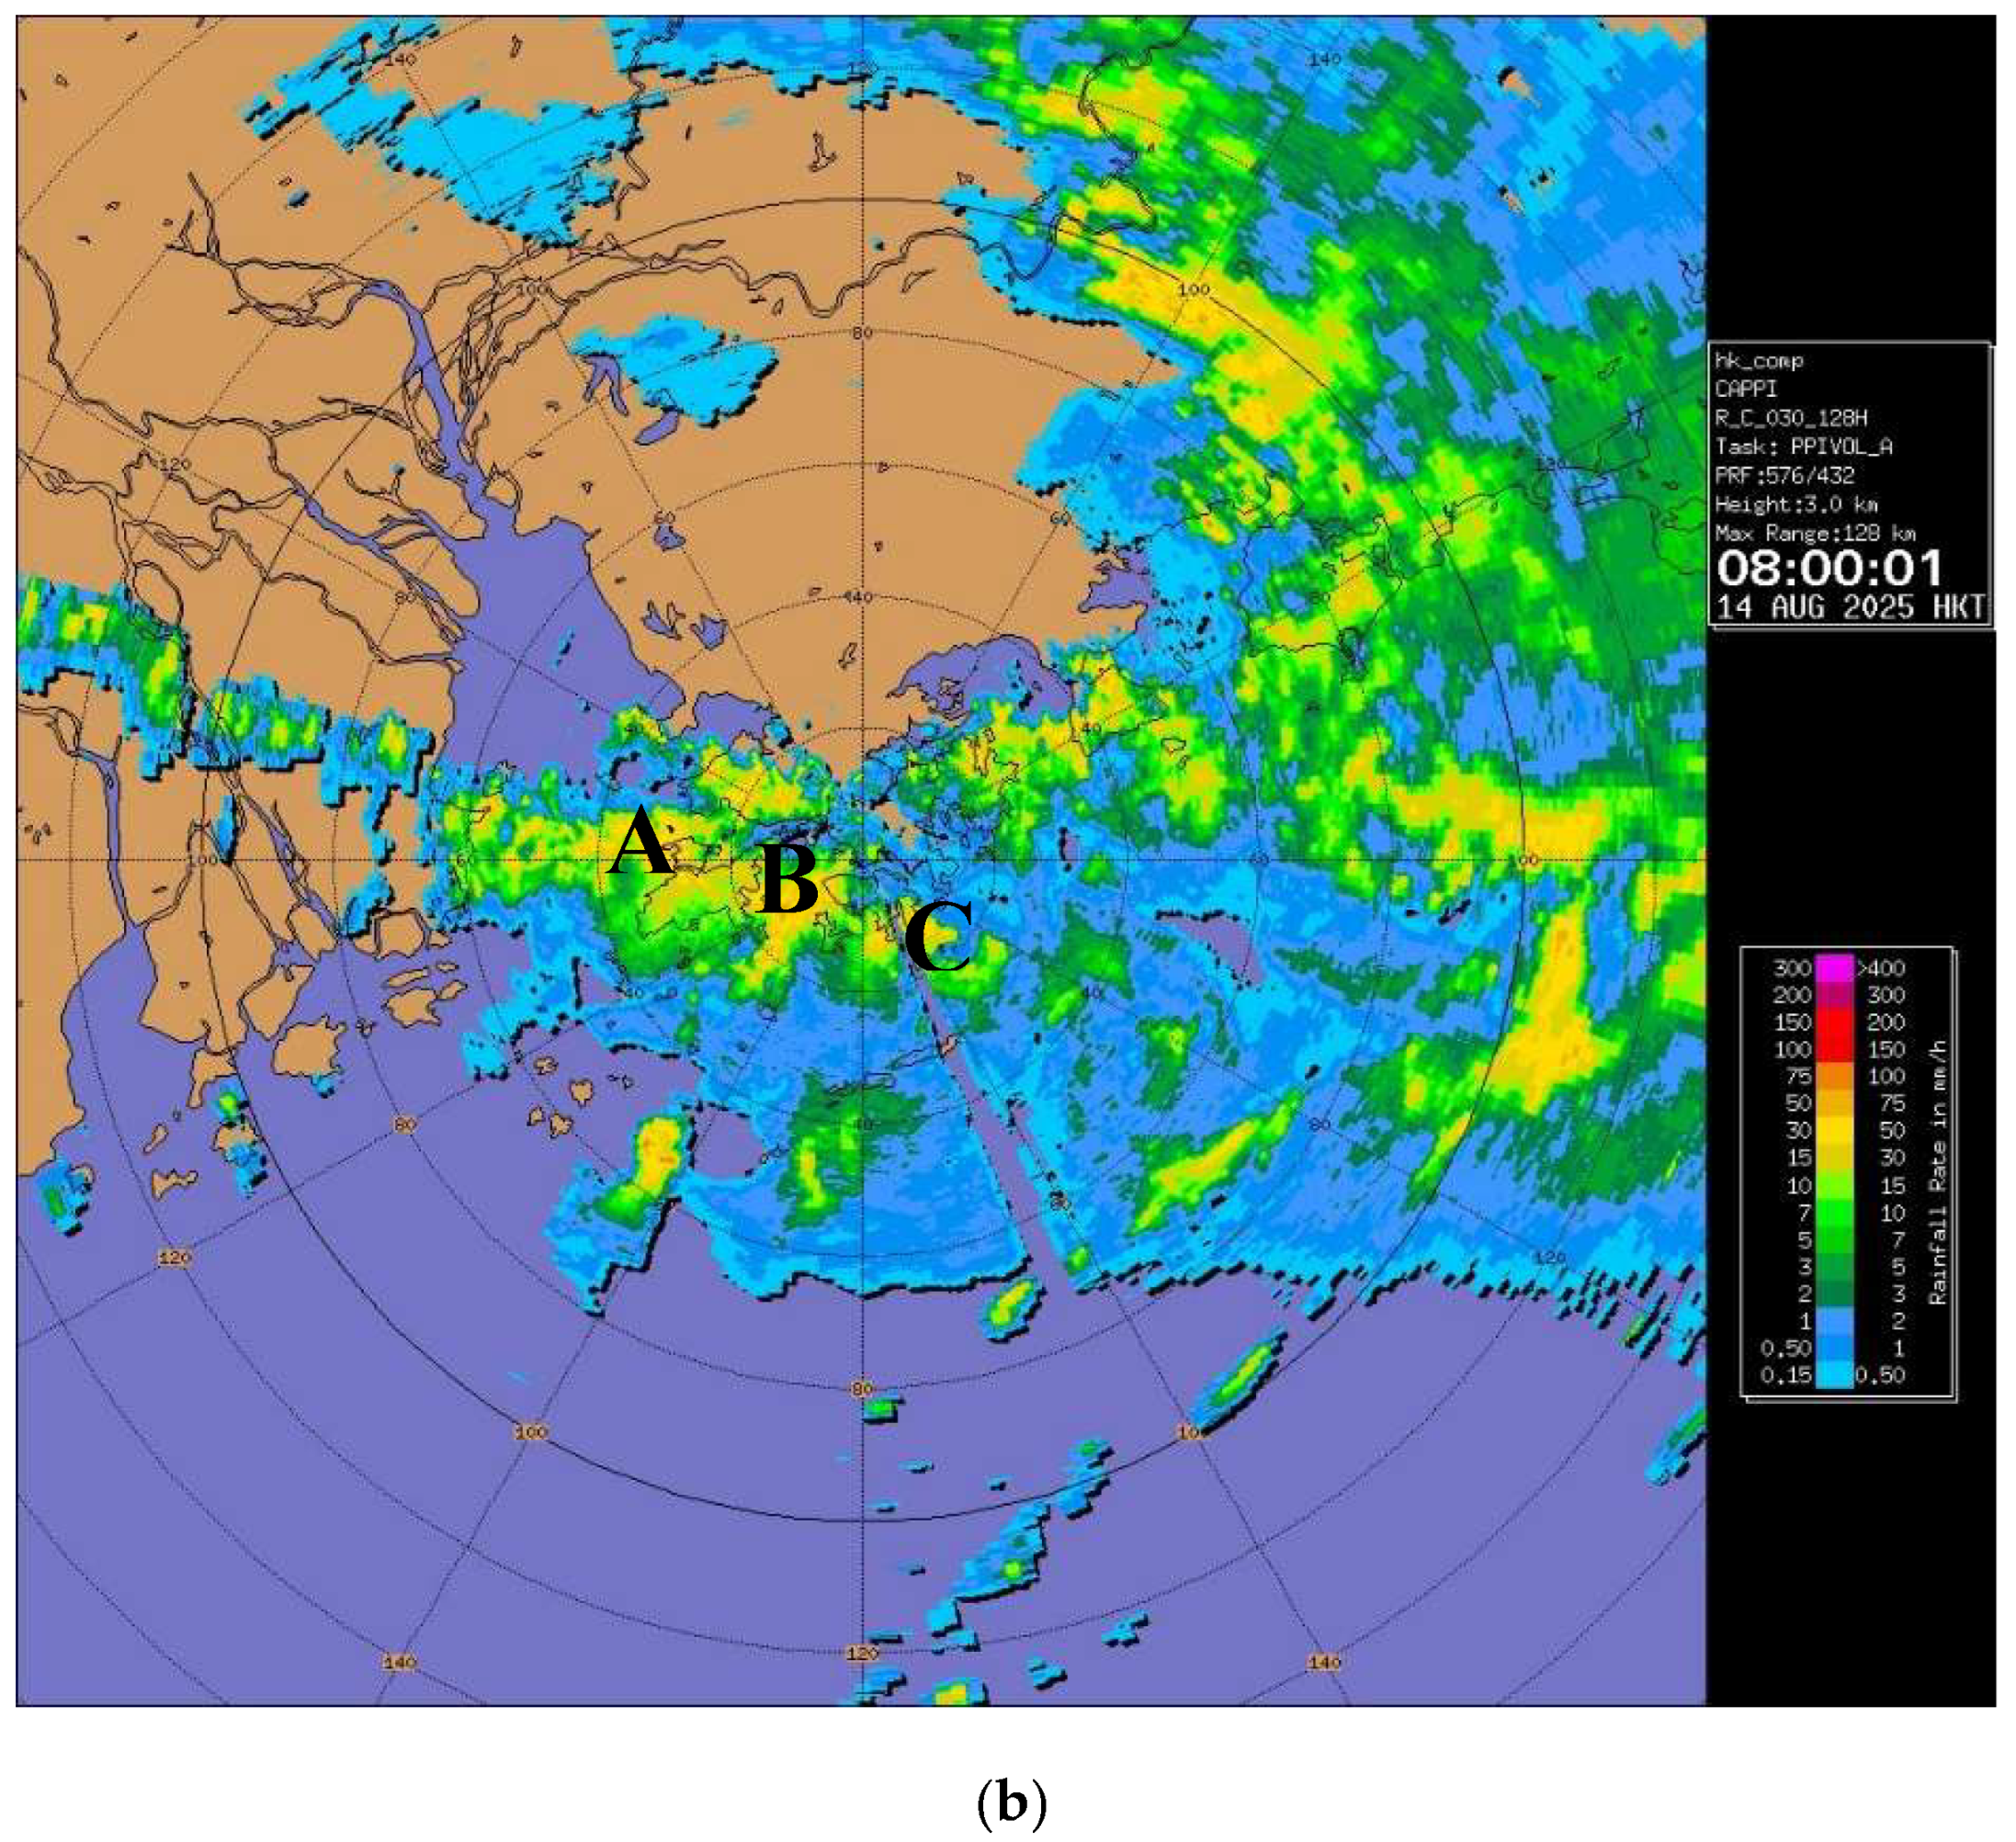
Figure 2.
Surface isobaric analysis at 00 UTC on 14 August 2025 (a). ECMWF IFS analysis of 850 hPa wind and humidity (b), 500 hPa geopotential height (c), and 200 hPa wind and divergence (d).
Figure 2.
Surface isobaric analysis at 00 UTC on 14 August 2025 (a). ECMWF IFS analysis of 850 hPa wind and humidity (b), 500 hPa geopotential height (c), and 200 hPa wind and divergence (d).
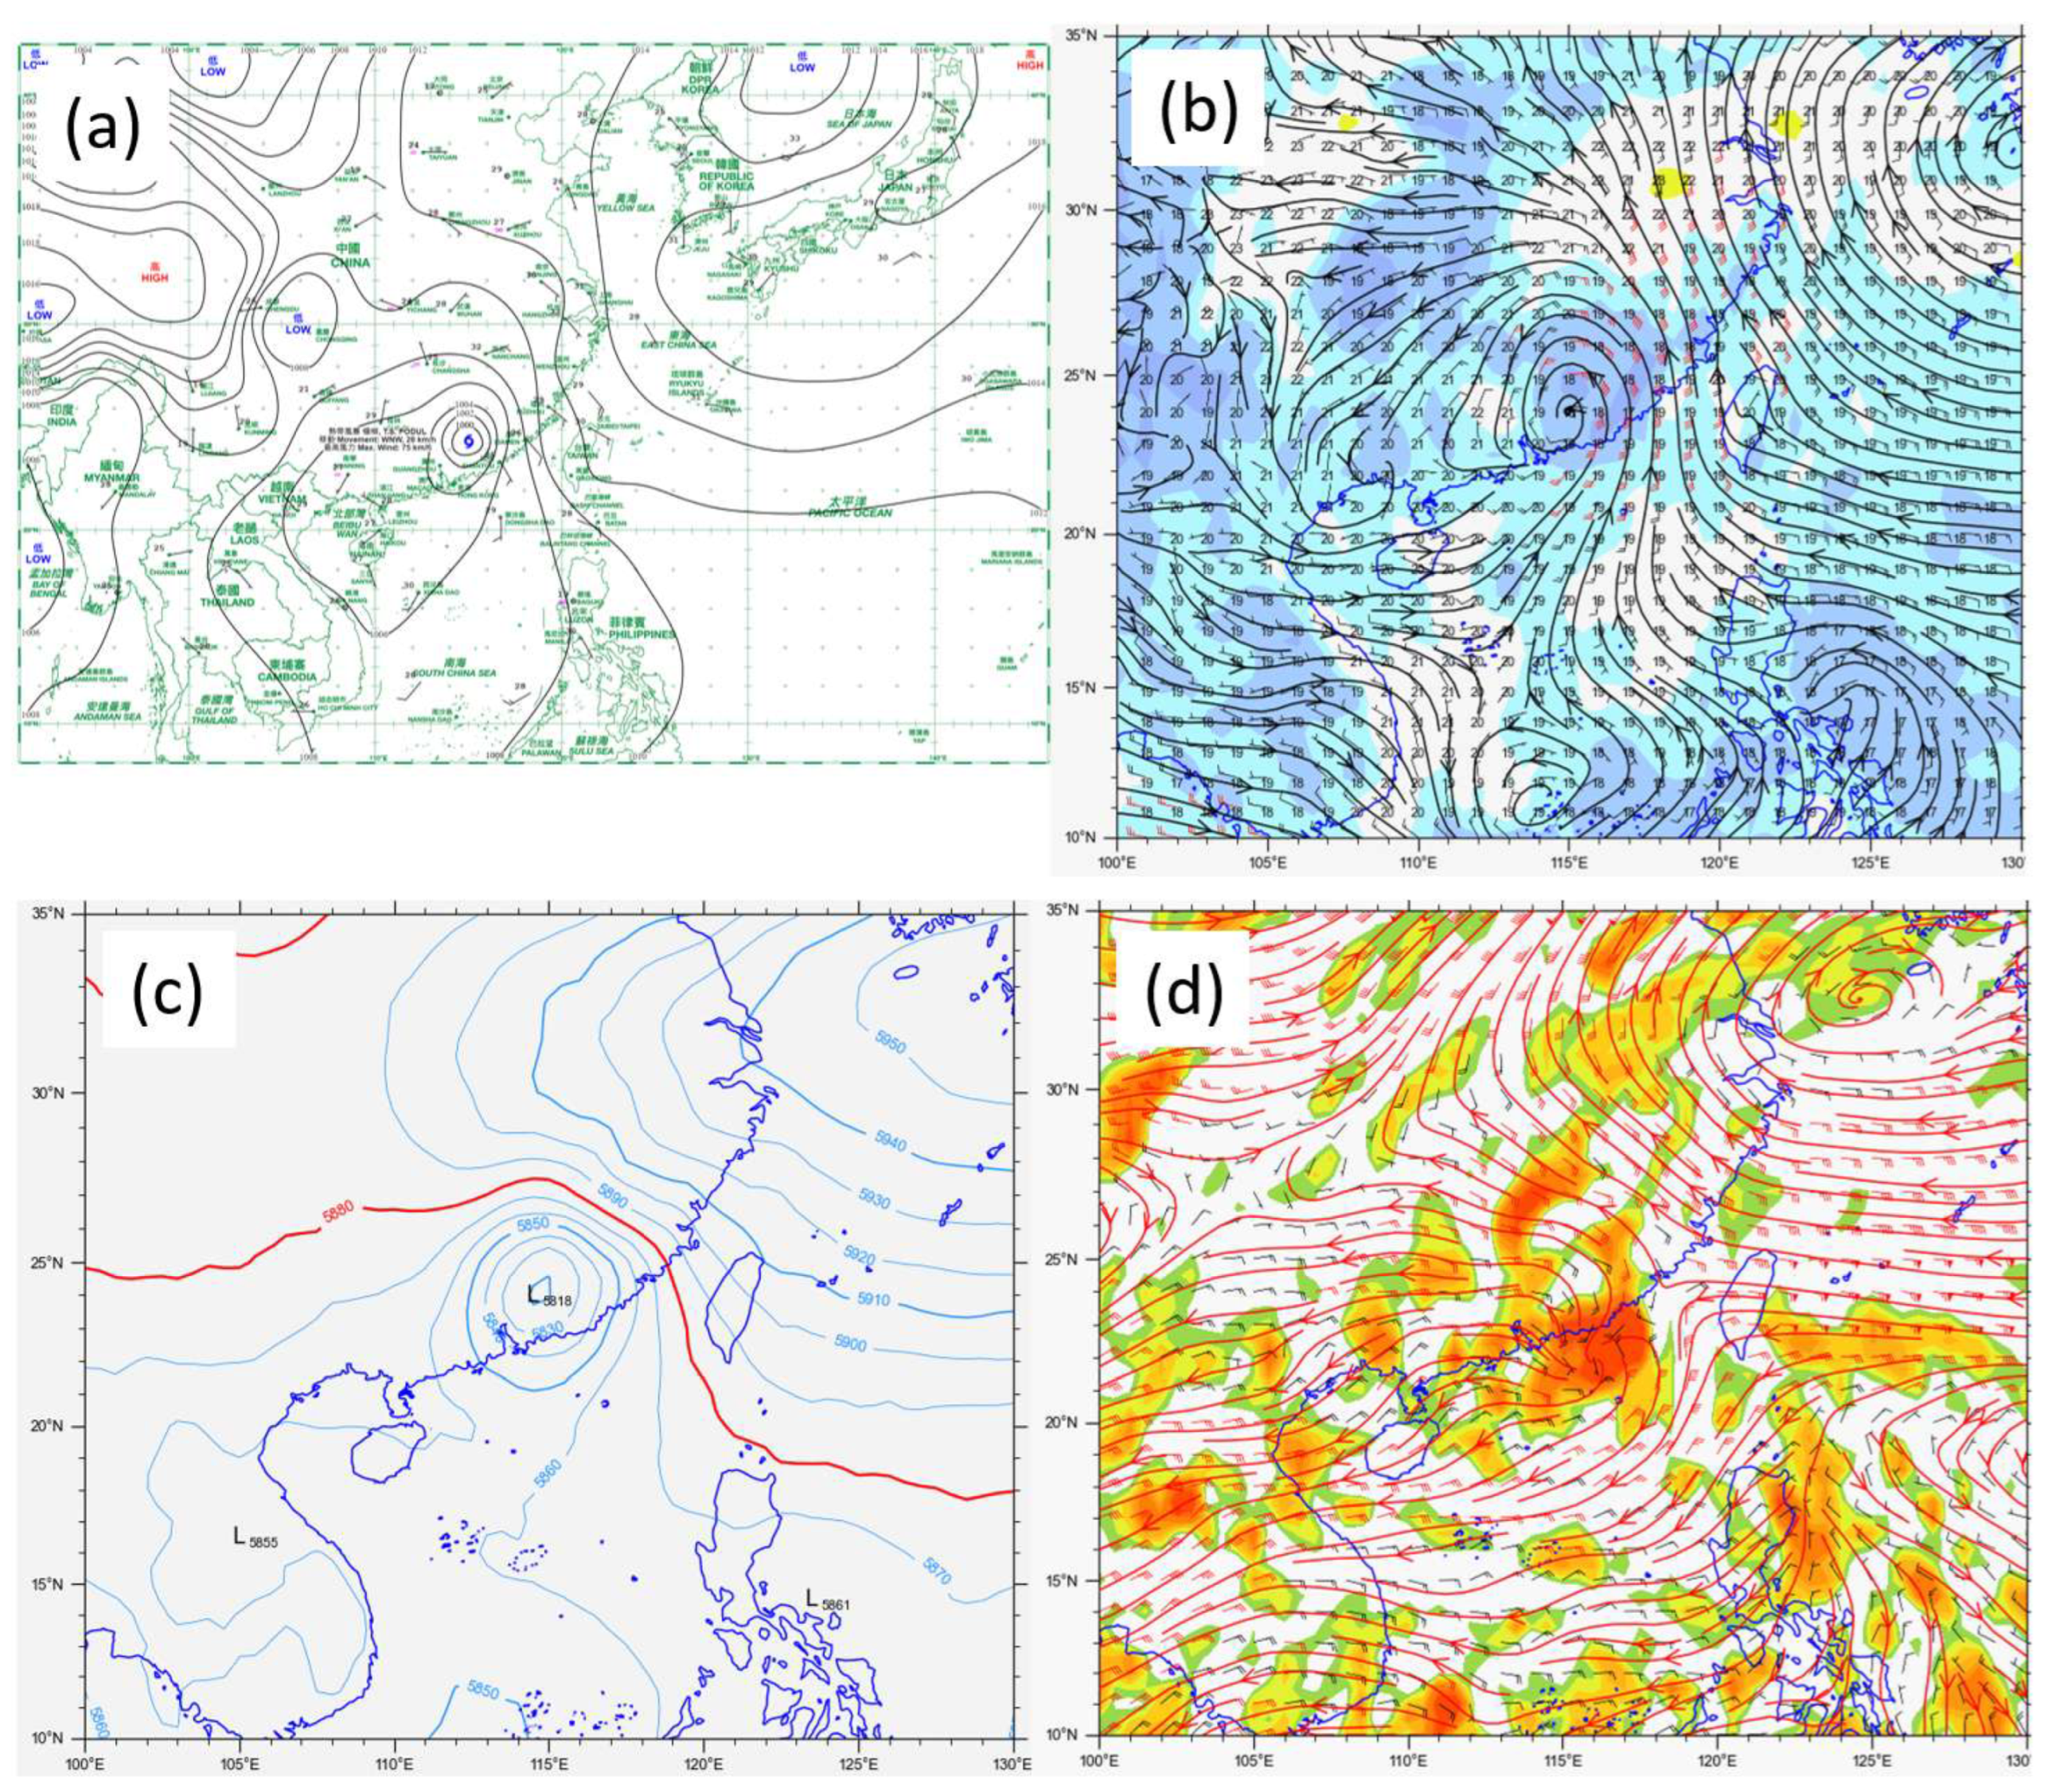
Figure 3.
Upper-air sounding analysis of Hong Kong at 20 UTC on 13 August 2025.
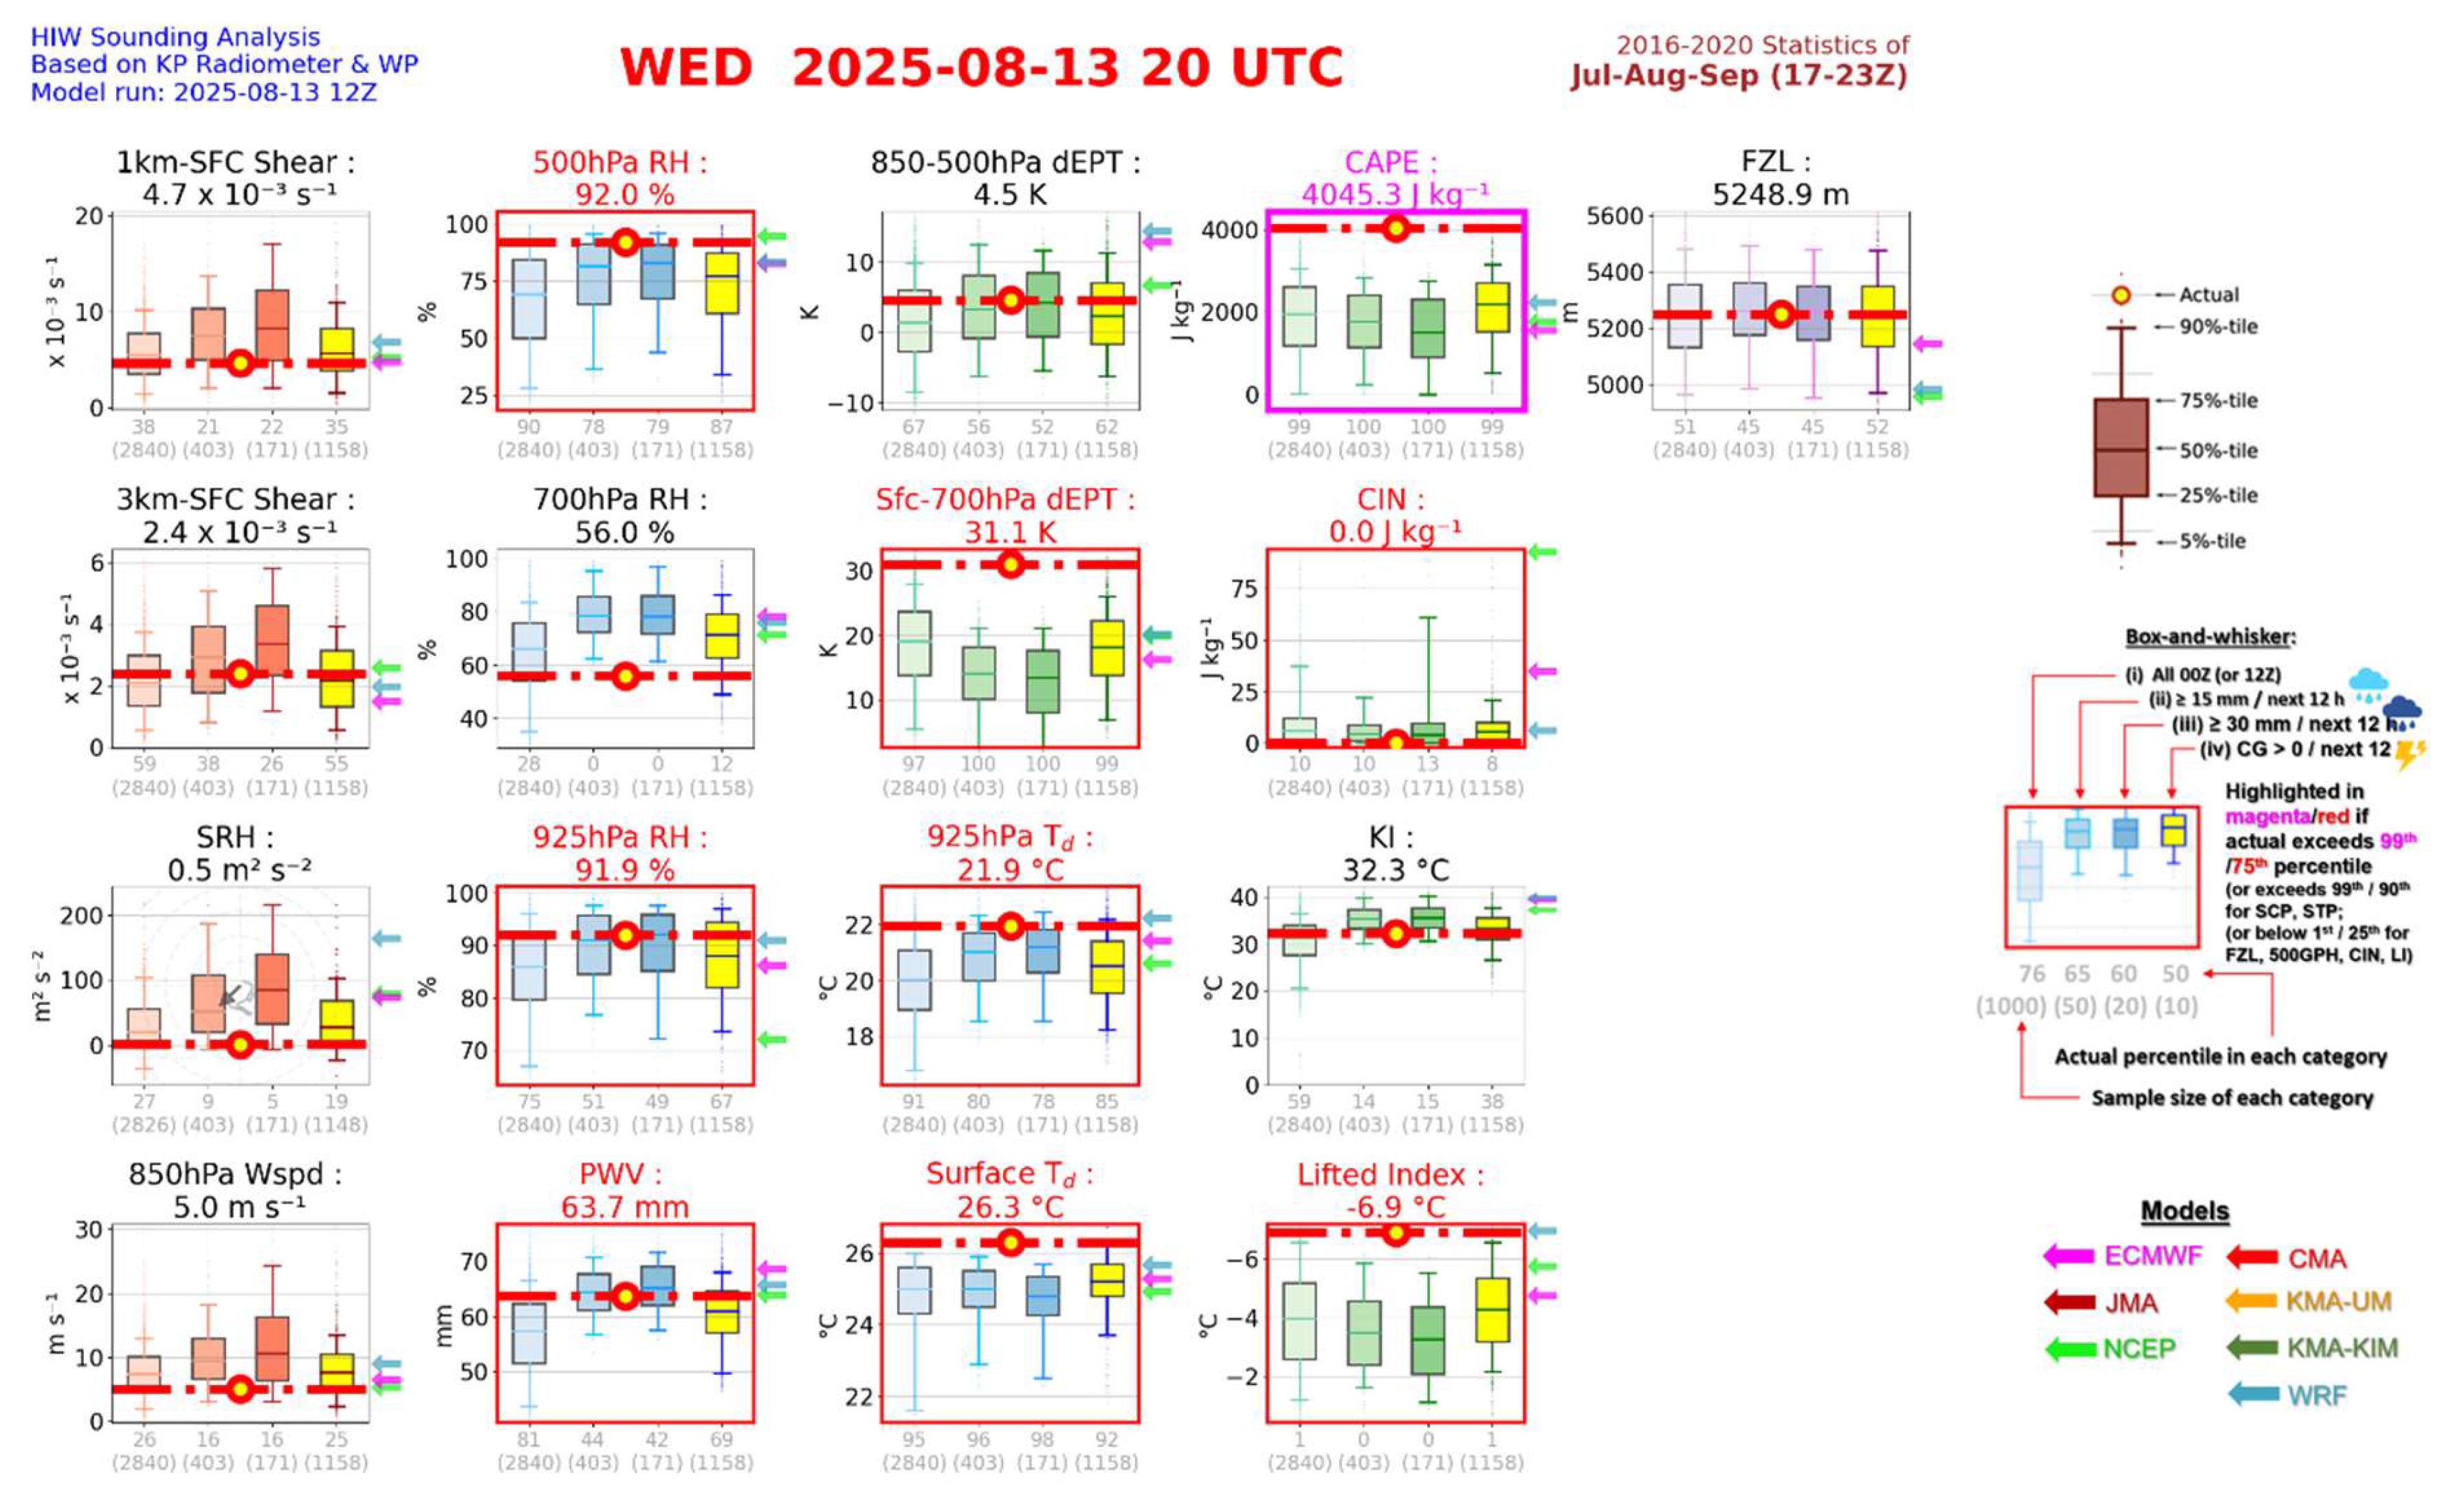
Figure 4.
Retrieved wind field at 3 km above sea level together with the vertical velocity at 2 km (a), and overlaid on the 3 km radar reflectivity (b), showing the convergence area (encircled).
Figure 4.
Retrieved wind field at 3 km above sea level together with the vertical velocity at 2 km (a), and overlaid on the 3 km radar reflectivity (b), showing the convergence area (encircled).
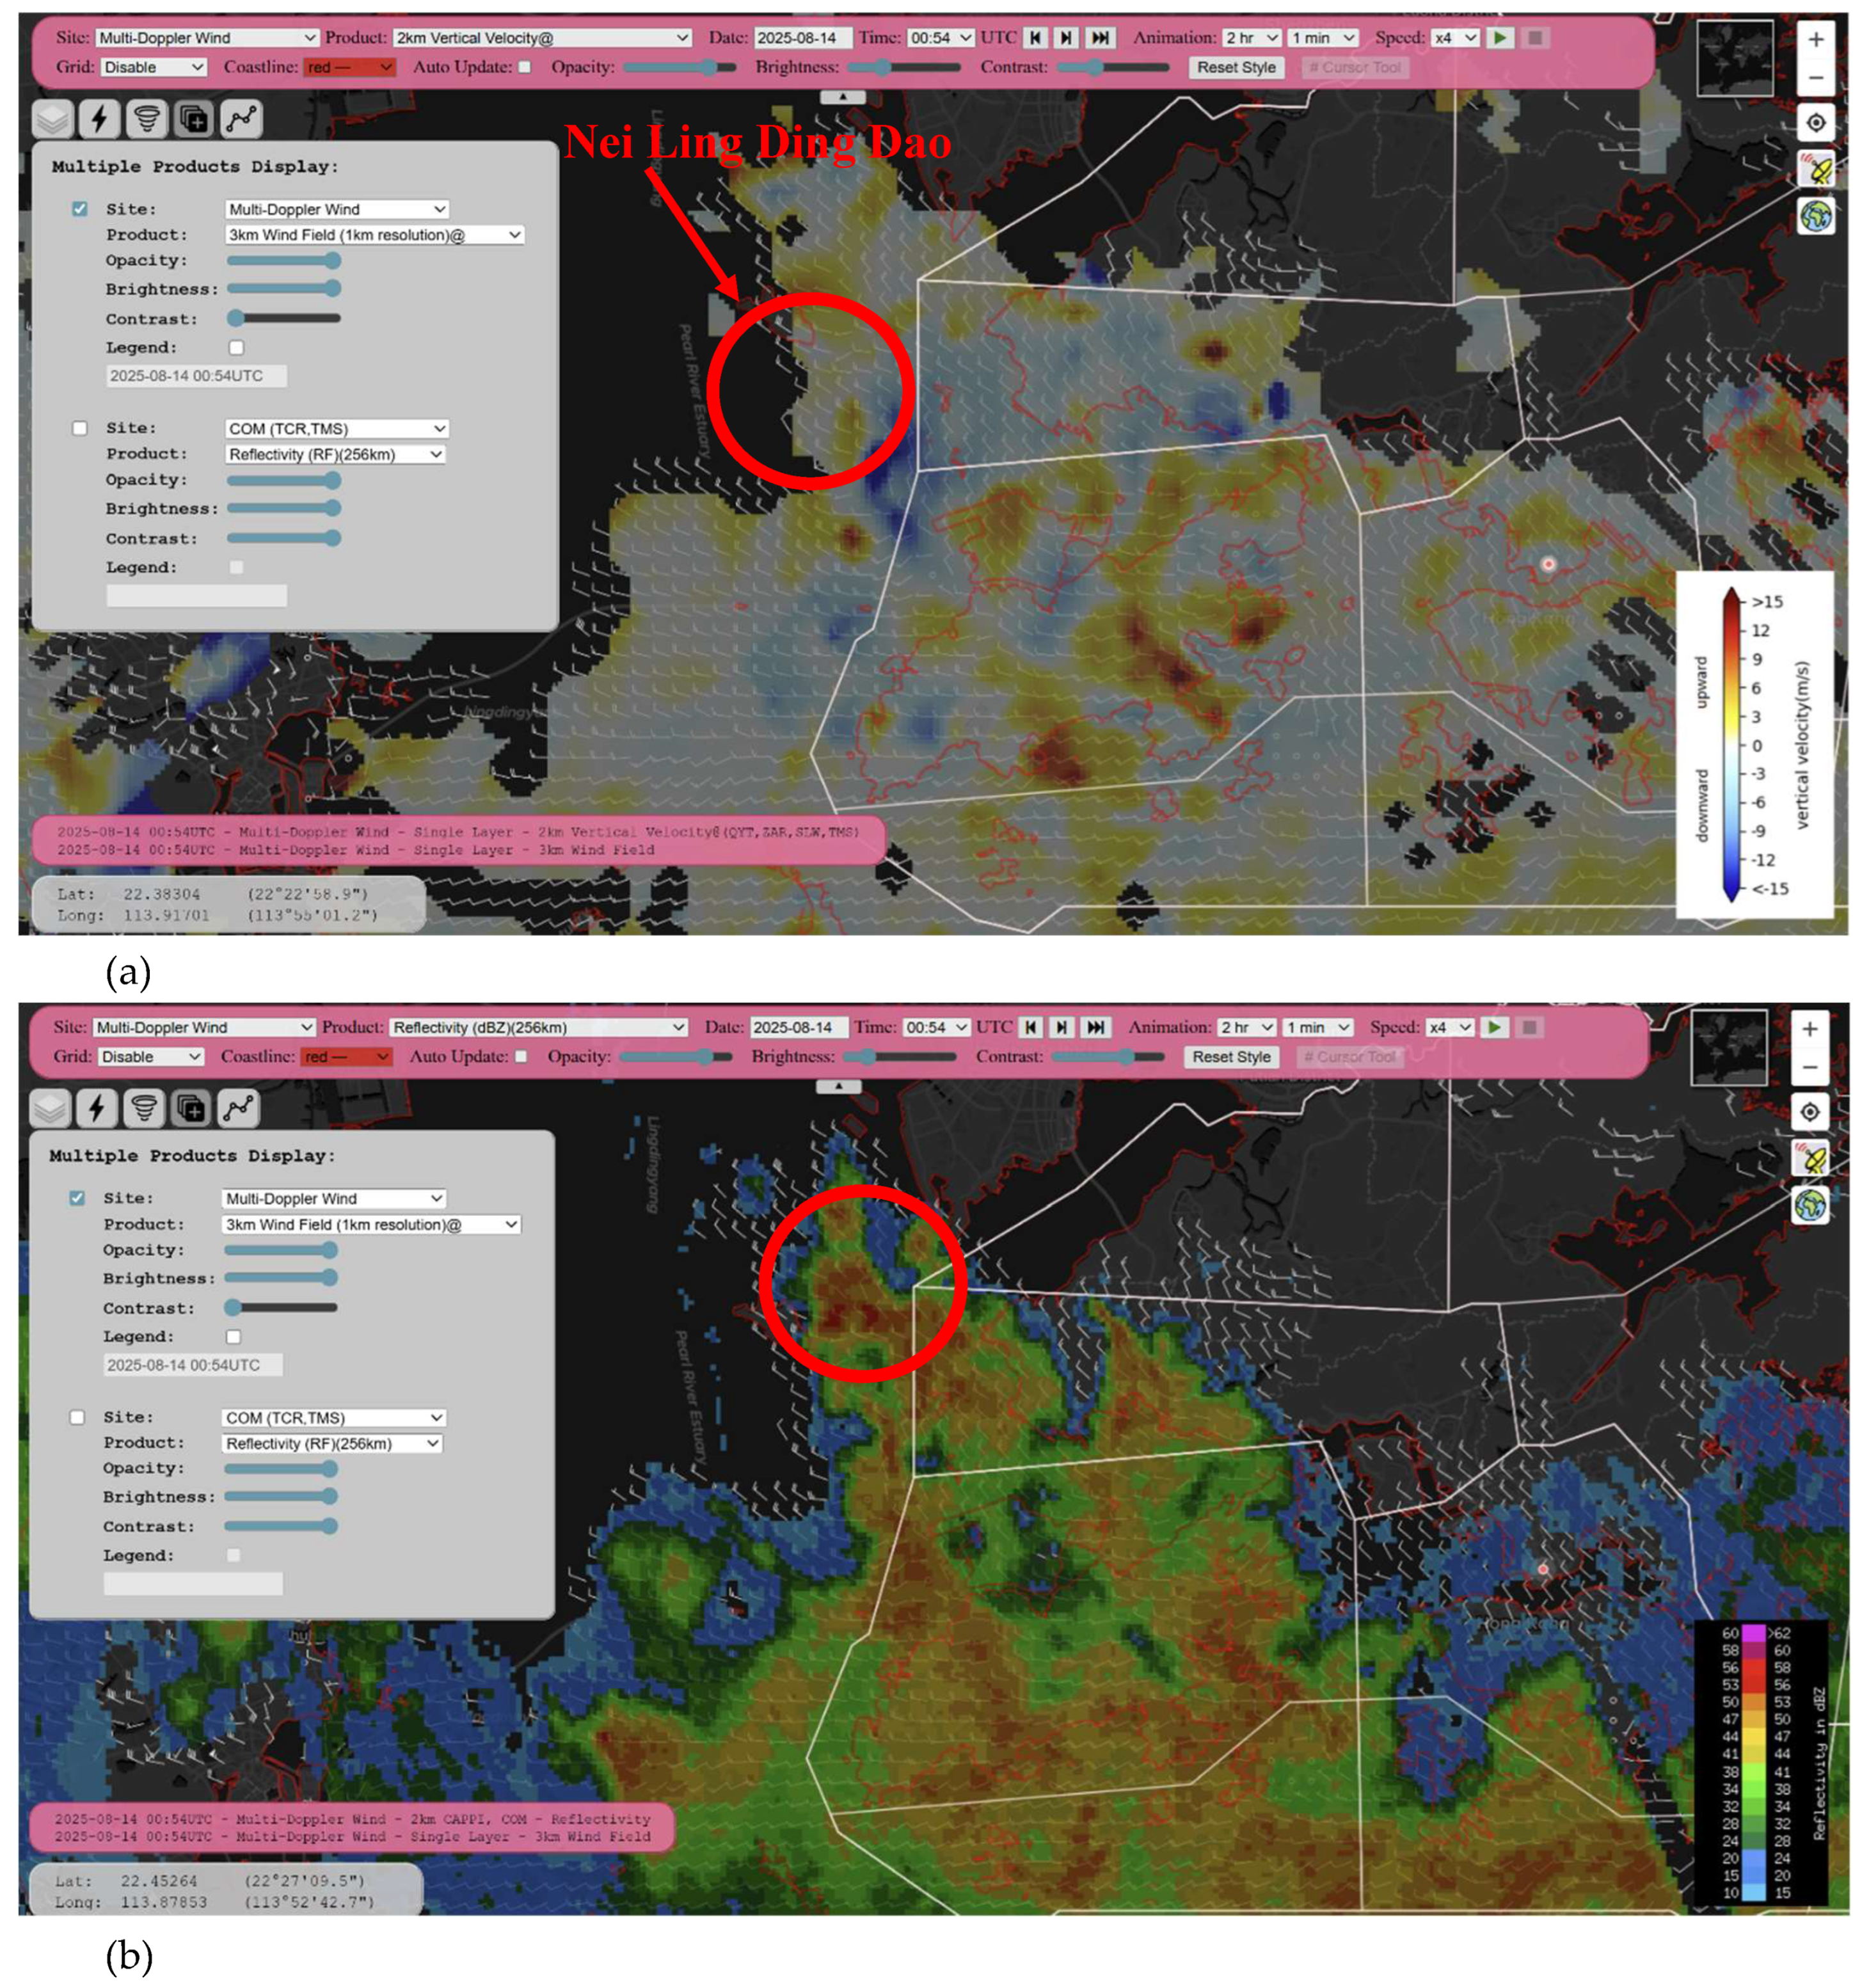
Figure 5.
Vertical cross-section along (a) and across (b) the convergence area.
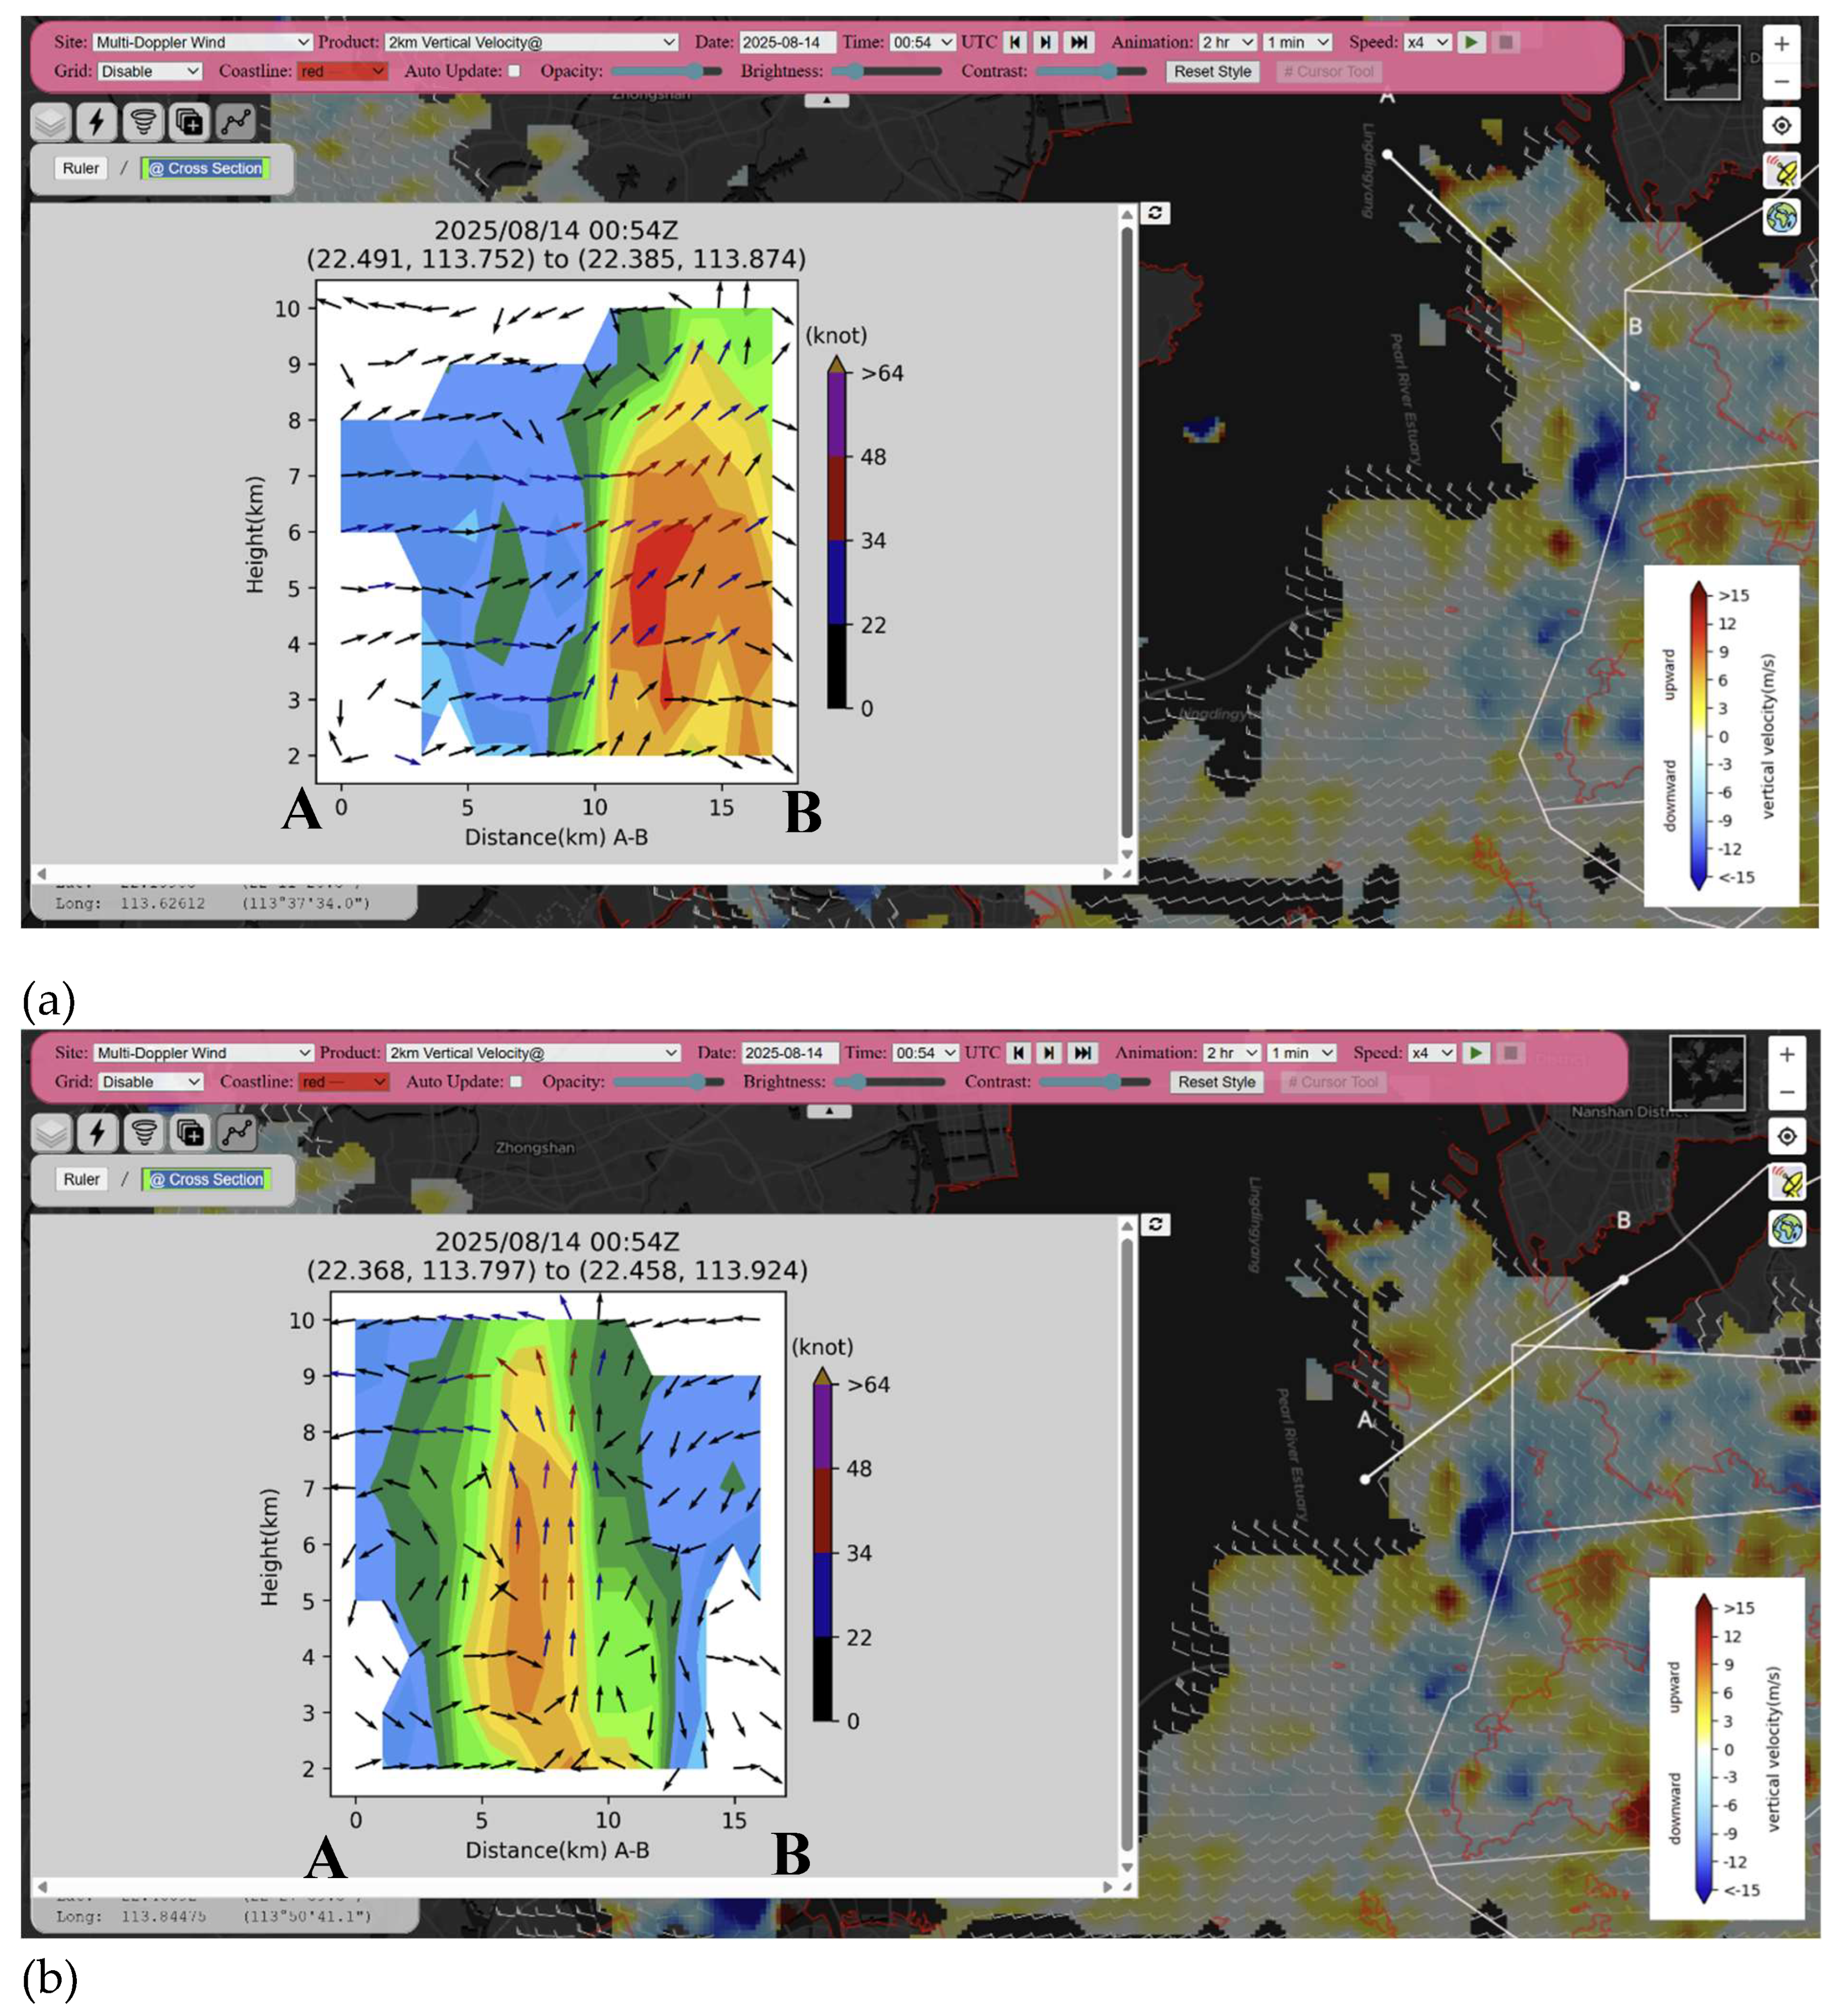
Figure 6.
The 3-km wind field with the areas of nearly closed horizontal circulation/waves (A, B, and C), corresponding to the heavy rain near Chek Lap Kok (airport), western side of Hong Kong Island, and southeastern corner of Hong Kong Island (a); vertical cross section across the circulation/wave (b).
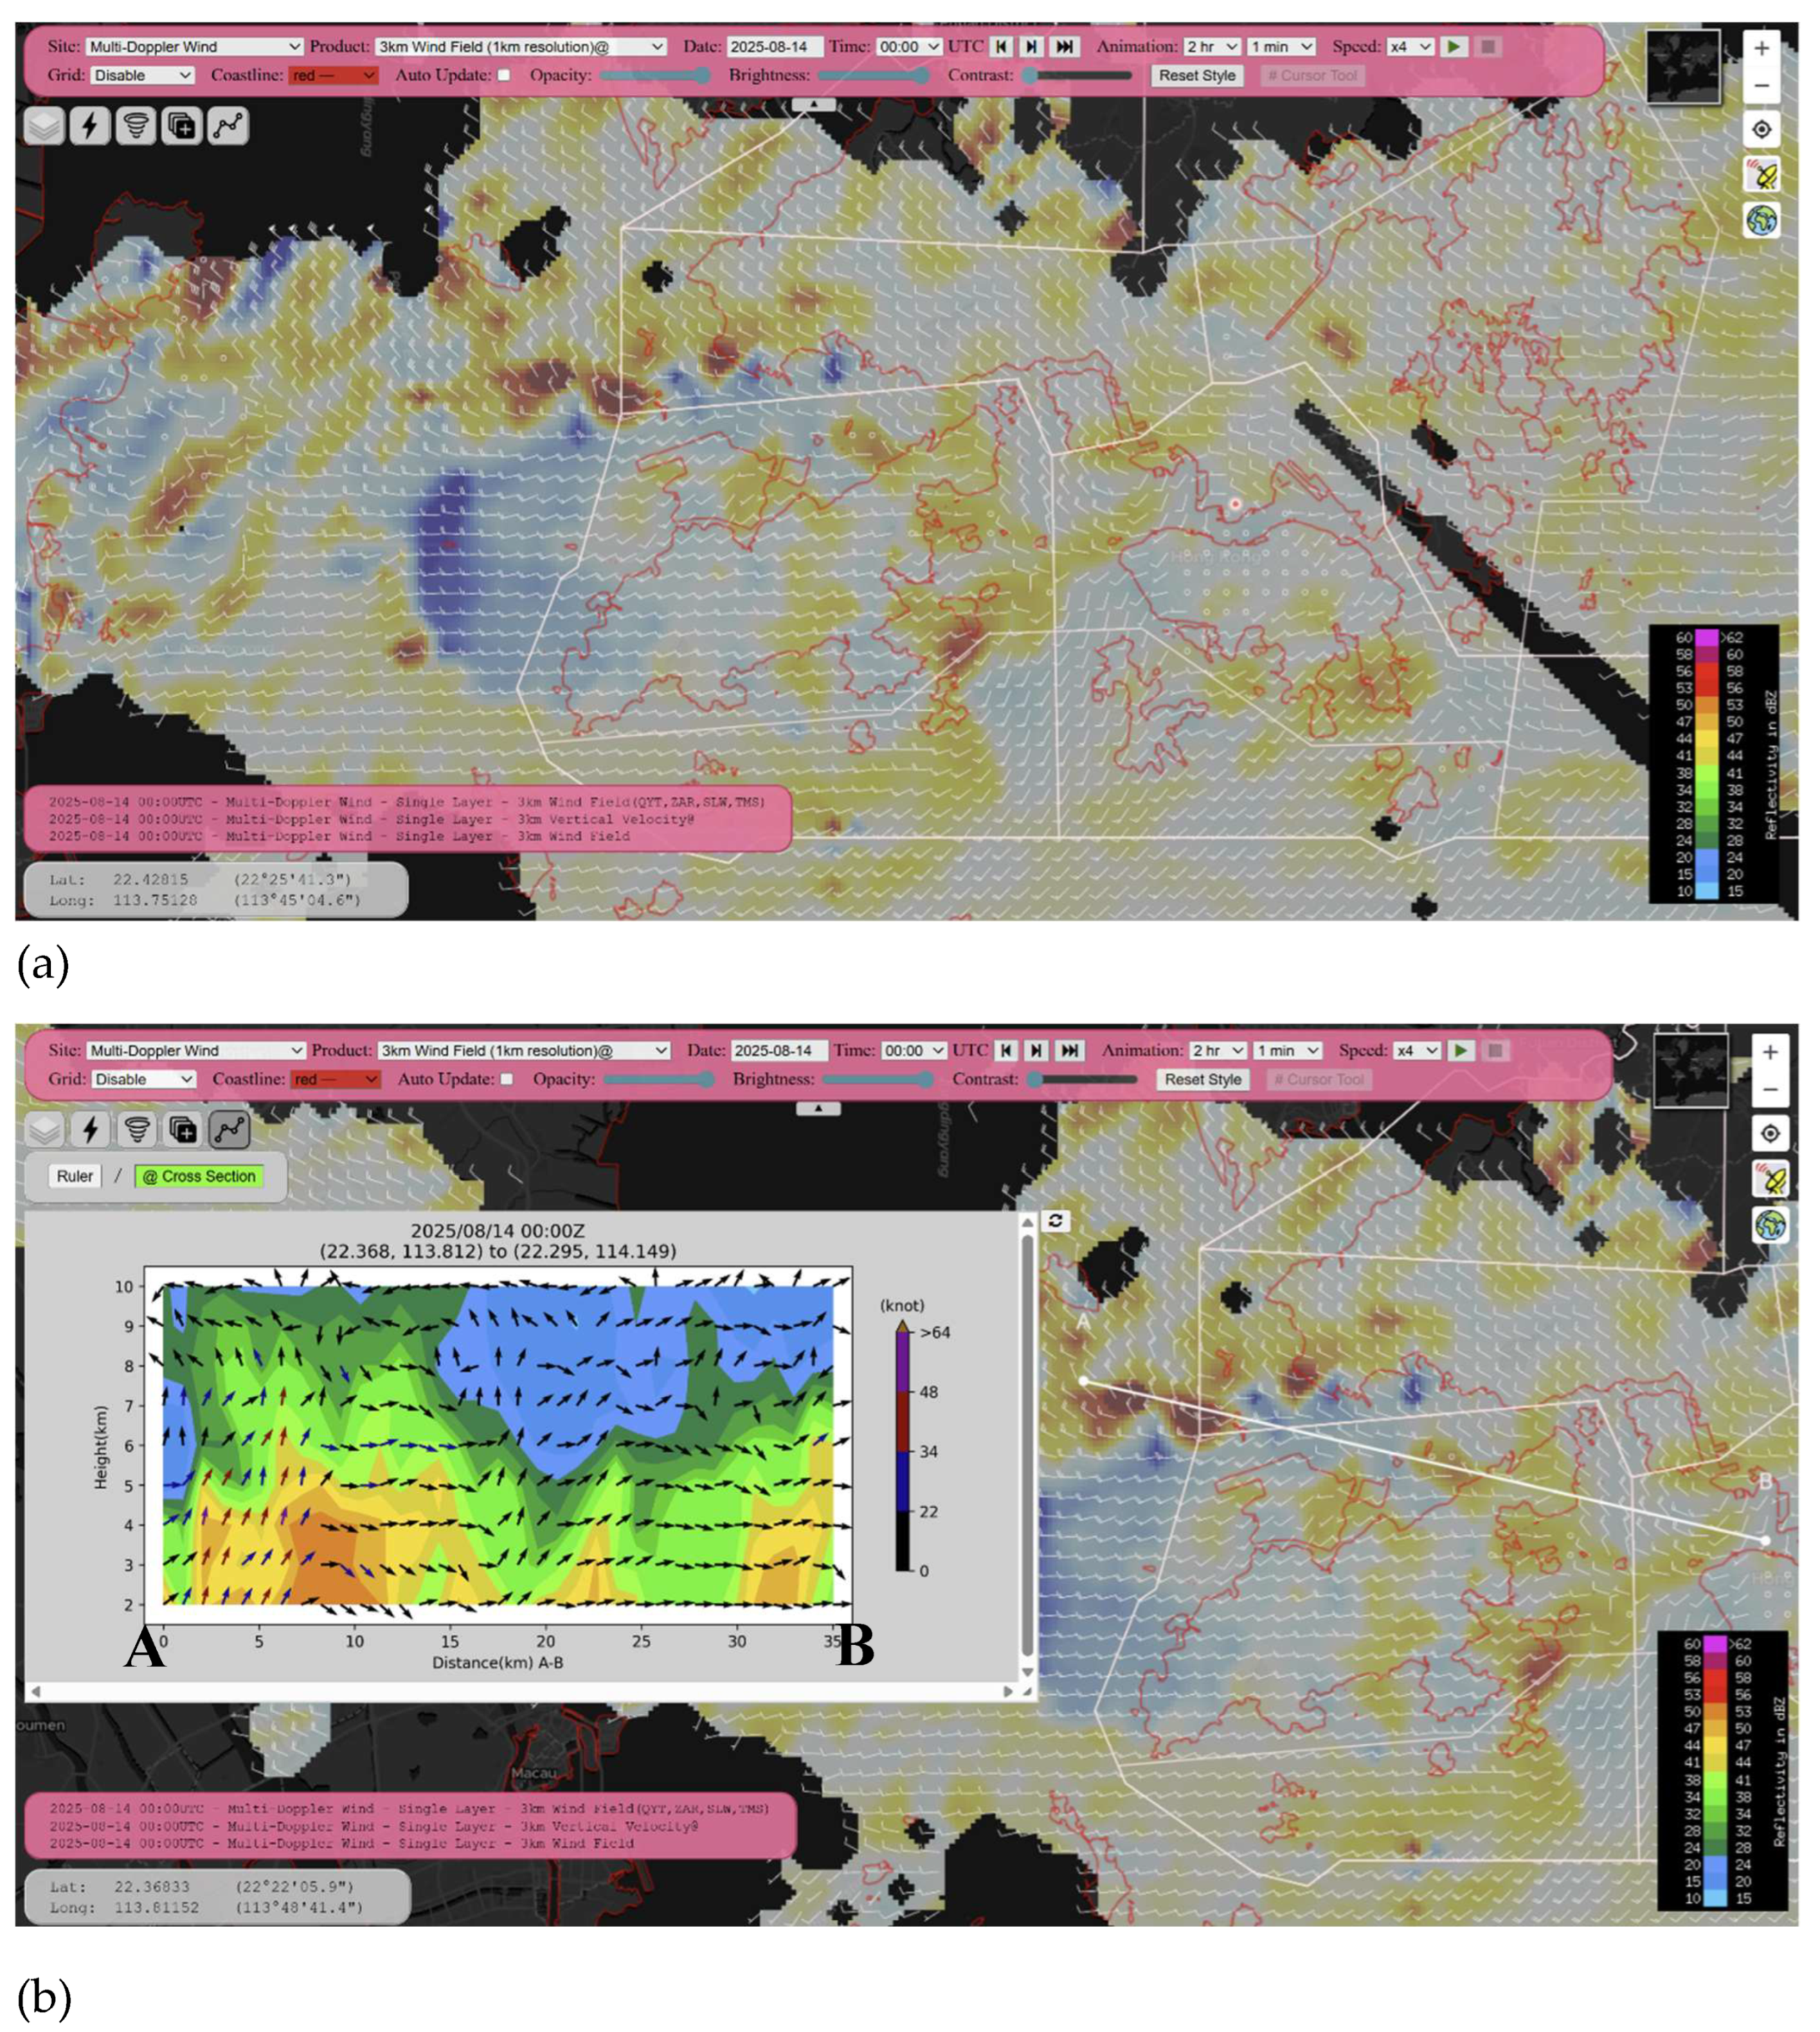
Figure 7.
Radar wind profiler observations in downtown Hong Kong (a) and near HKA (b).
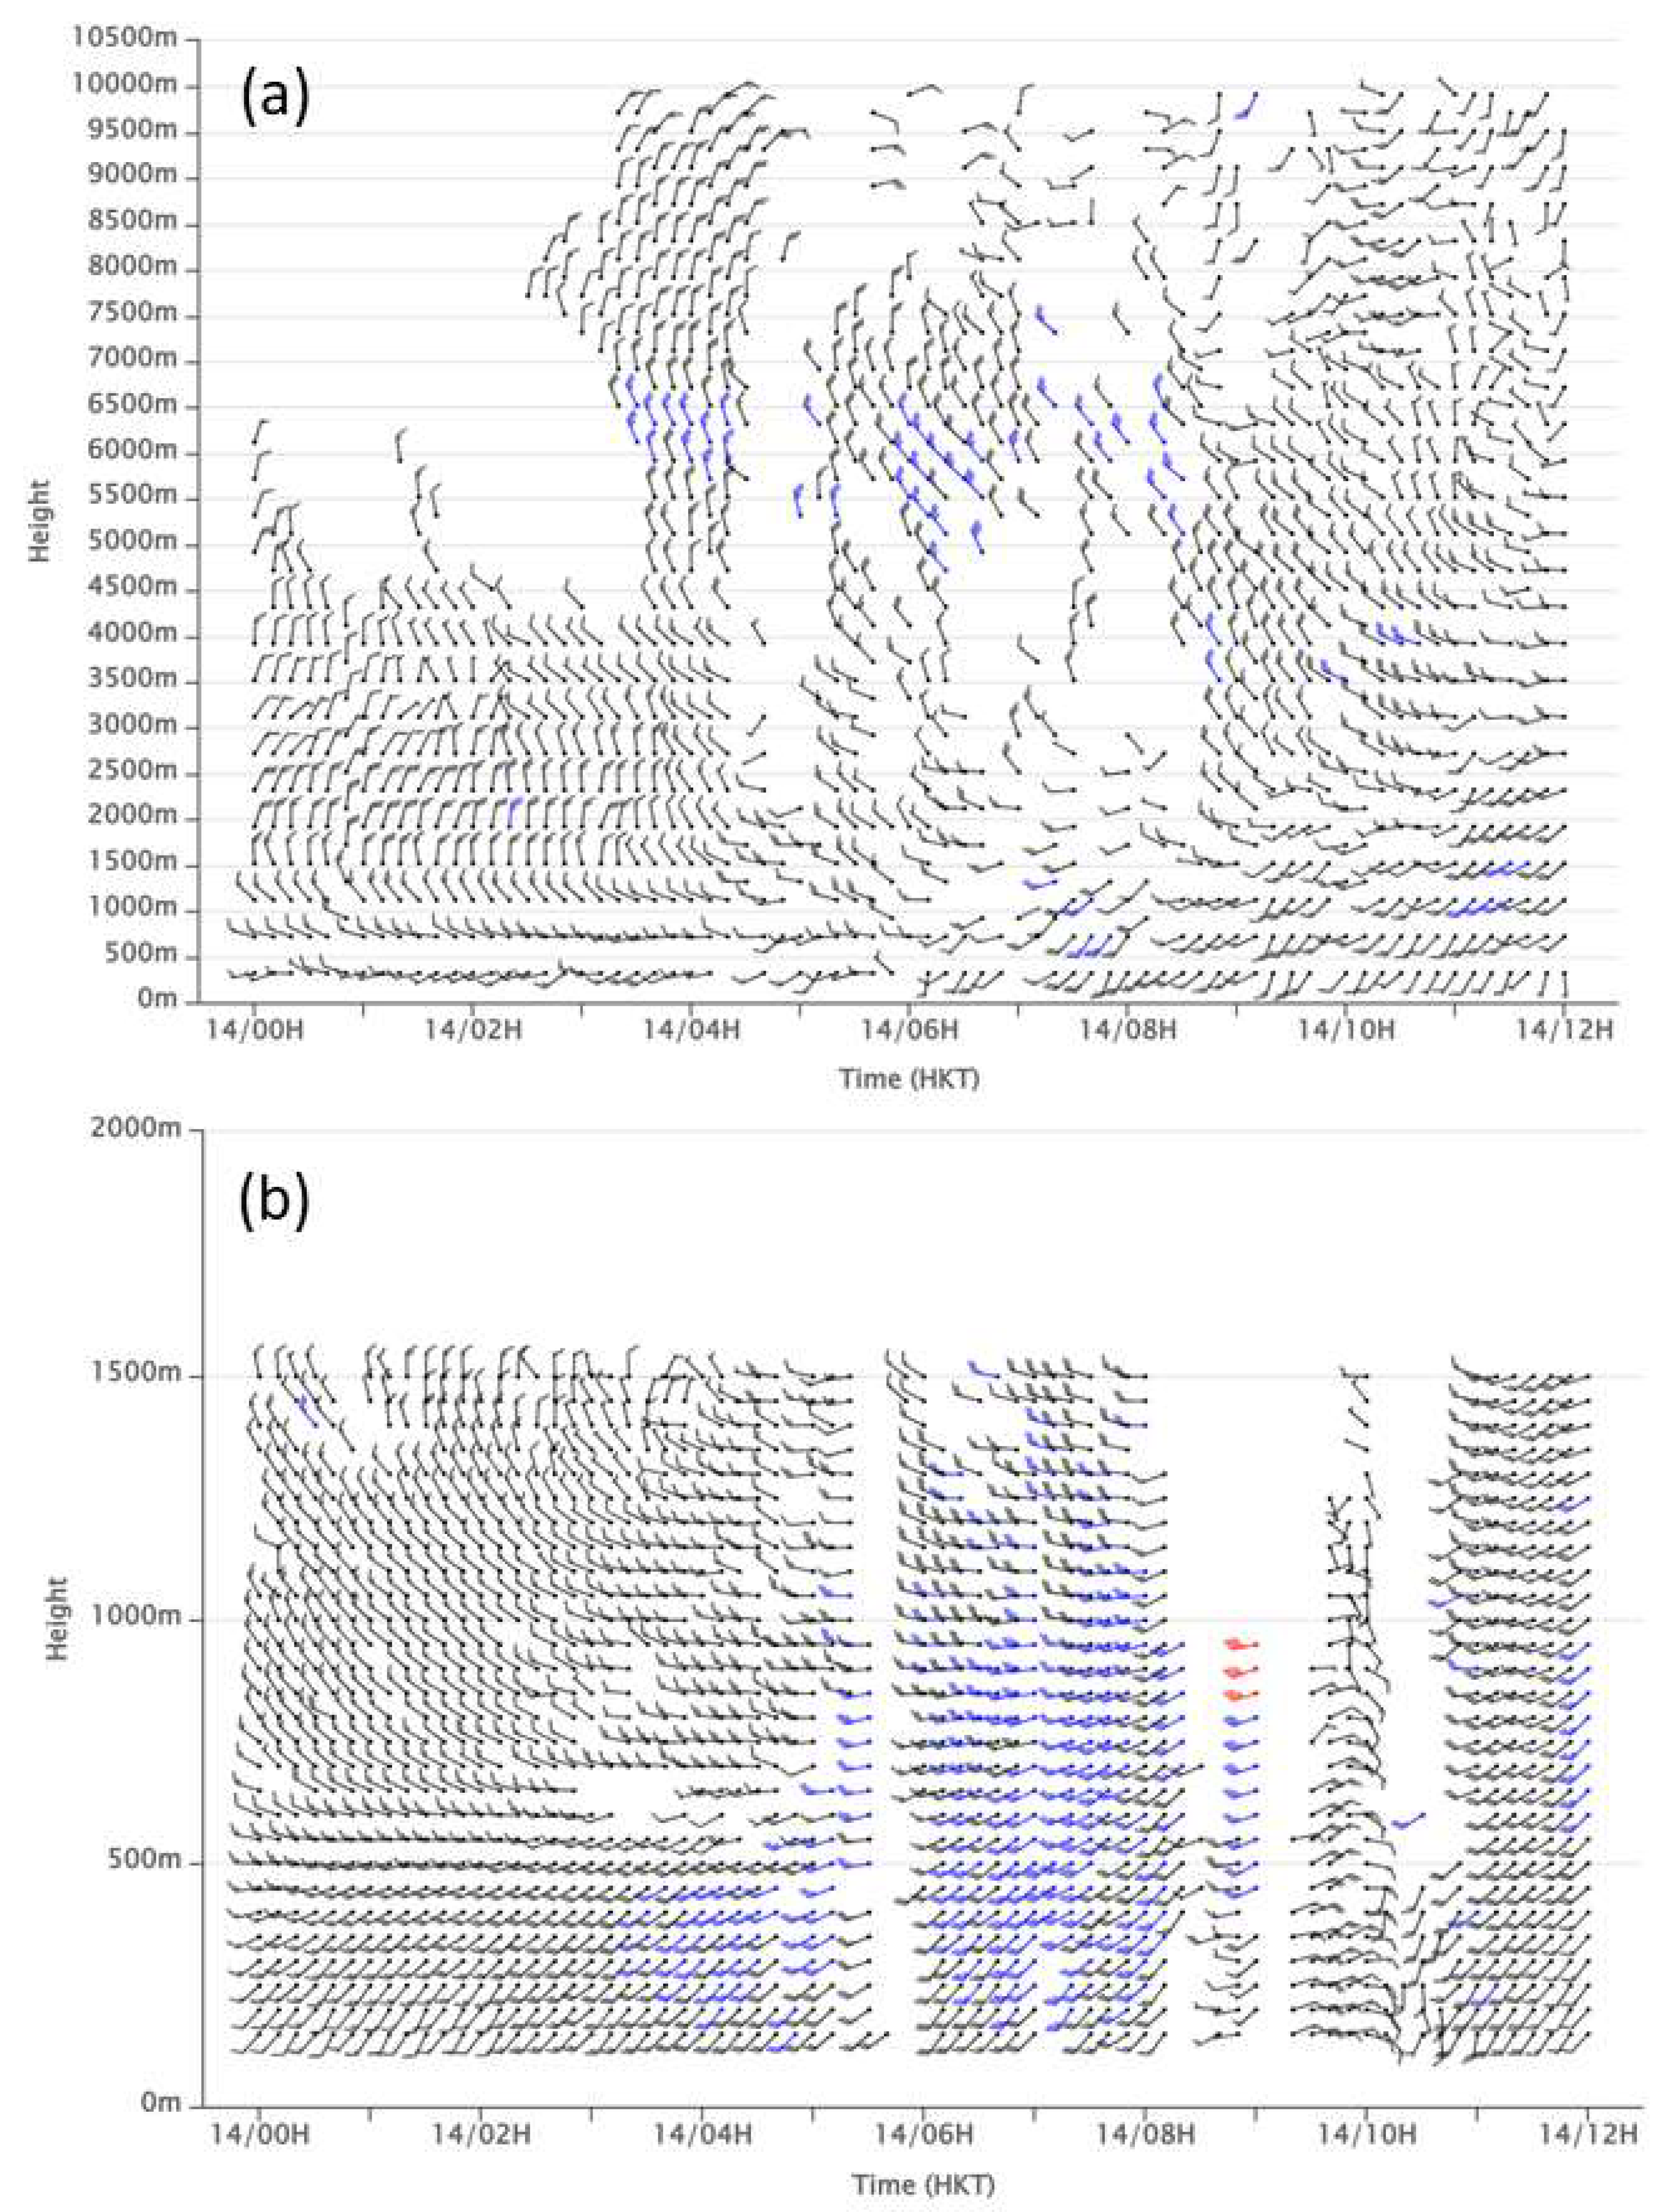
Figure 8.
(a) and (b) show the forecasts by the ECMWF IFS as initialised at 00 UTC, 21 UTC, and 00 UTC on the 13, 13, and 14 August 2025, respectively, for surface isobars, surface wind, and past 3 h accumulated rainfall (colour-coded). (c) and (d) show the forecasts by the Pangu model as initialised at 00 UTC on 13 August 2025 with the past 6 h accumulated rainfall and valid time at 18 UTC on 13 August and 00 UTC on 14 August.
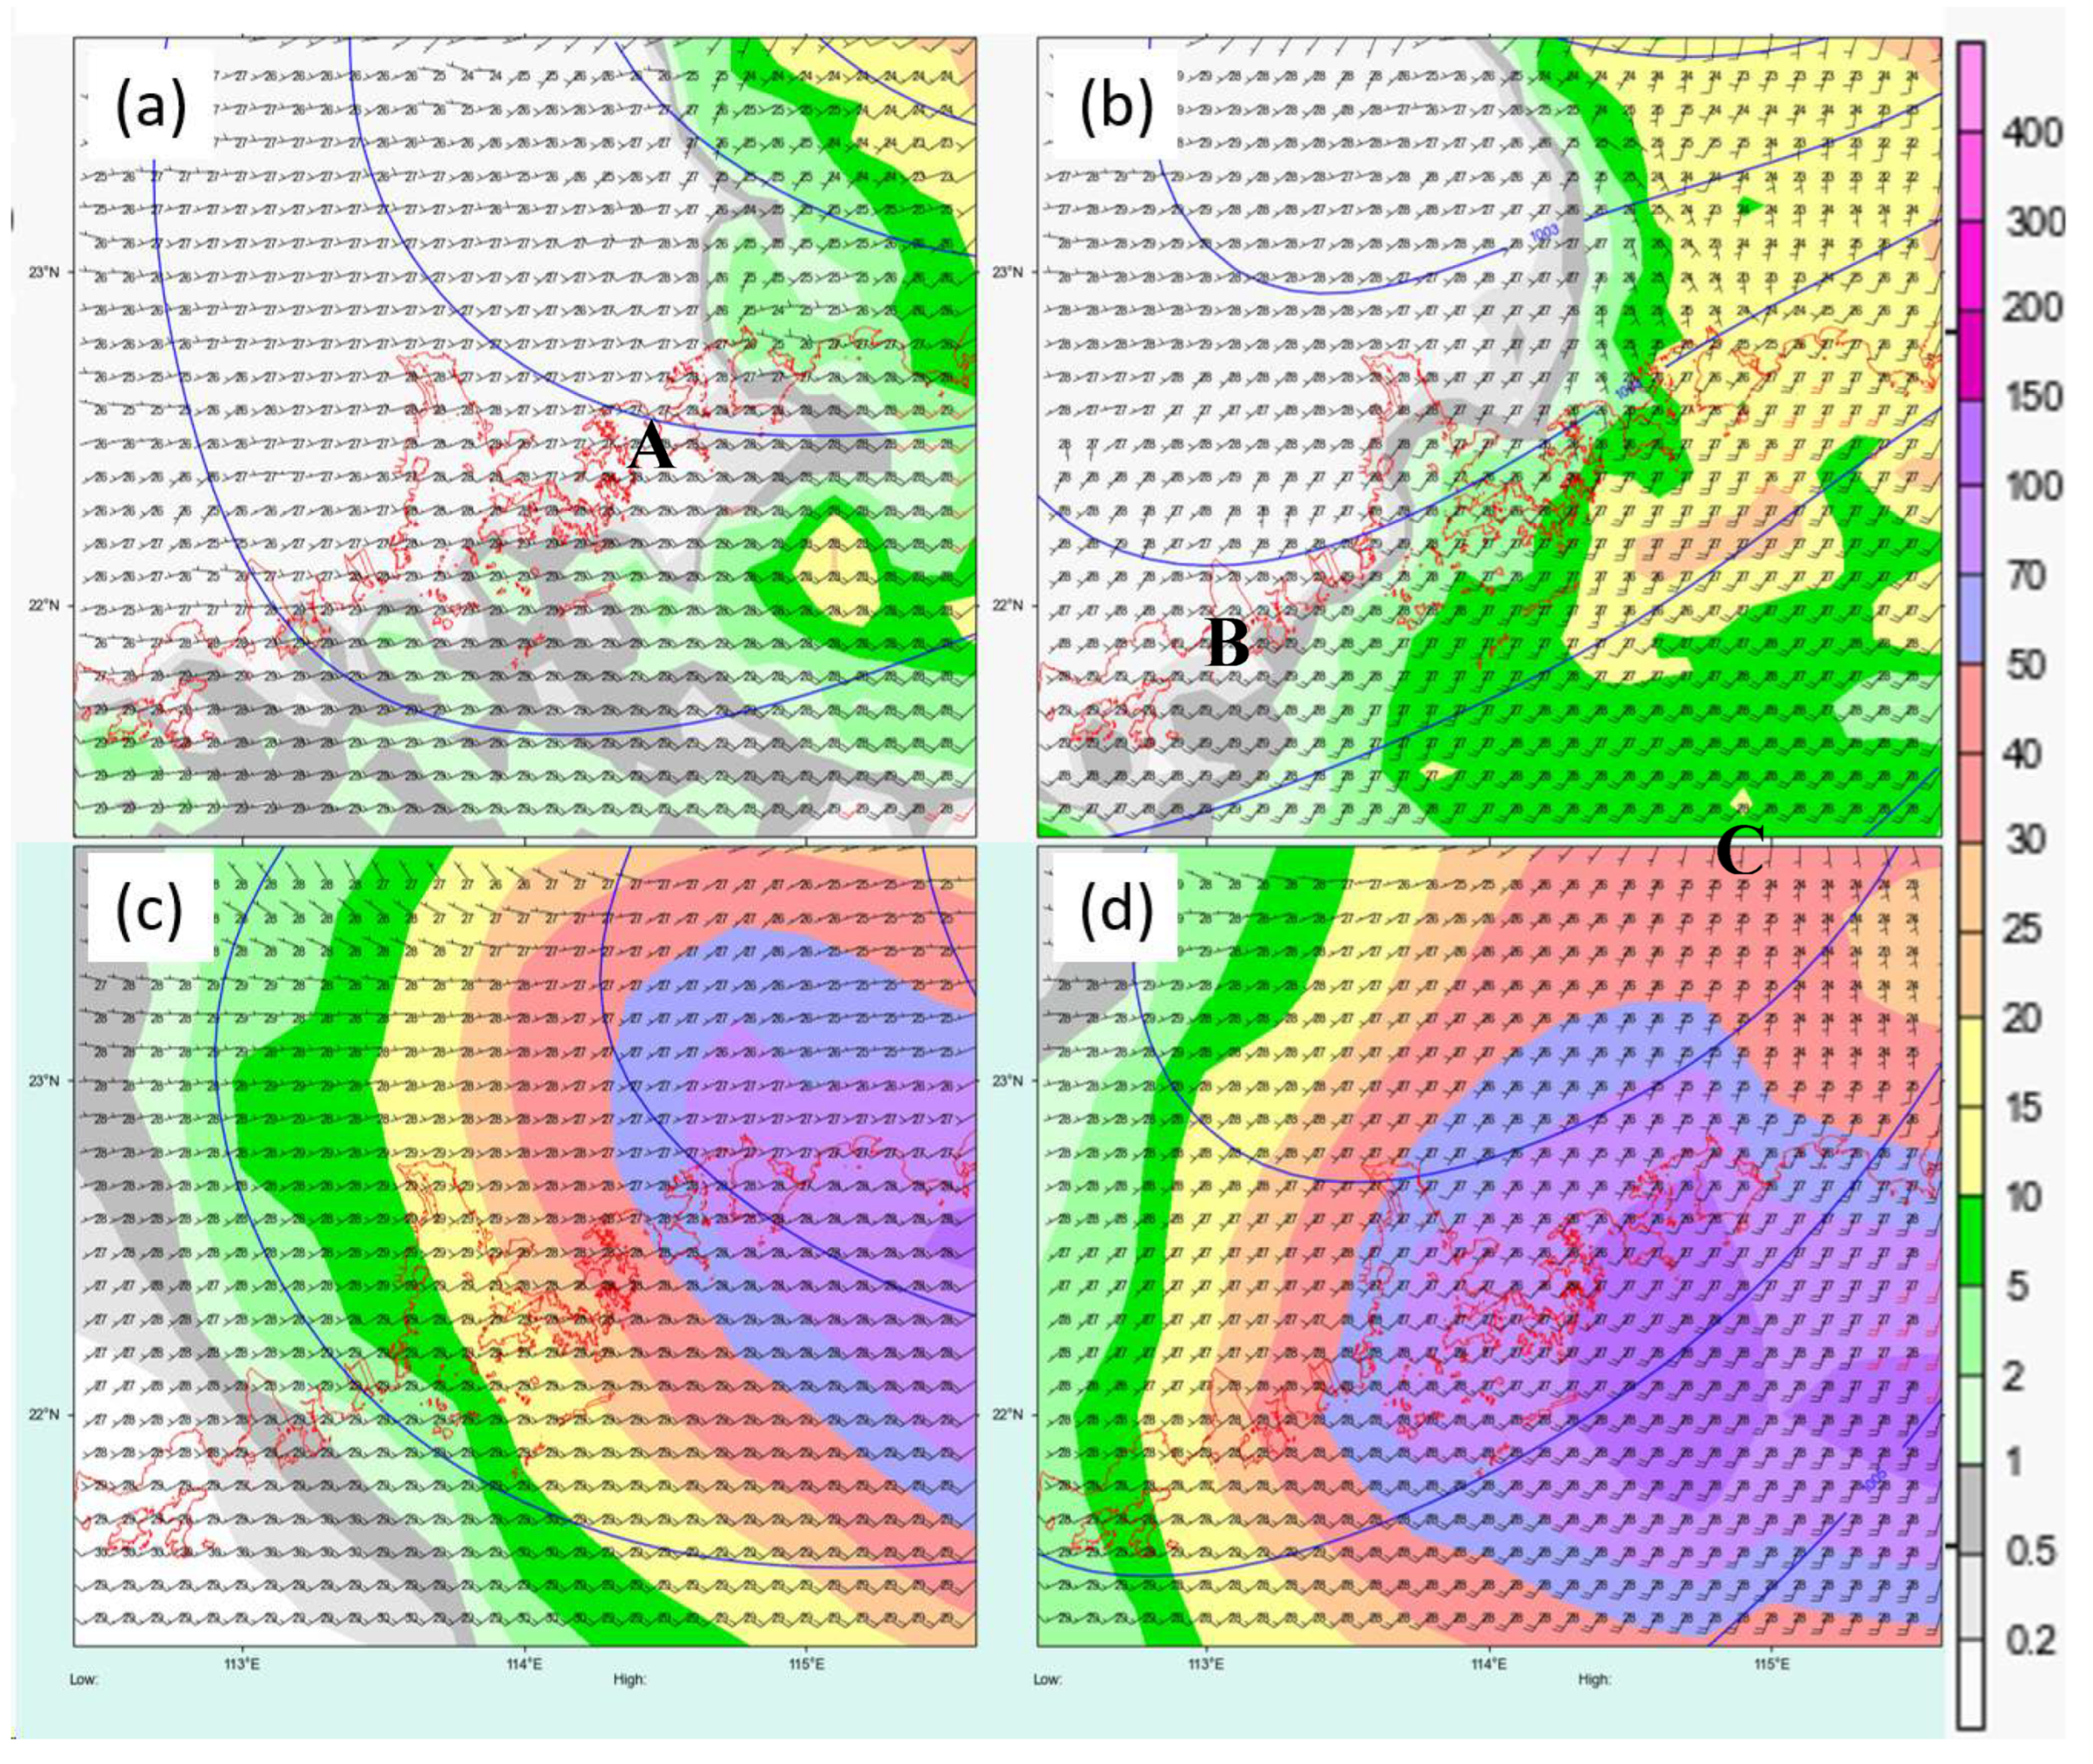
Figure 9.
(a) Time series of 3-hourly rainfall forecasts by the TRAMS for the various model runs as compared with actual observations (black) at HKO and HKA; (b) corresponding forecasts by the UWIN-CM.
Figure 9.
(a) Time series of 3-hourly rainfall forecasts by the TRAMS for the various model runs as compared with actual observations (black) at HKO and HKA; (b) corresponding forecasts by the UWIN-CM.
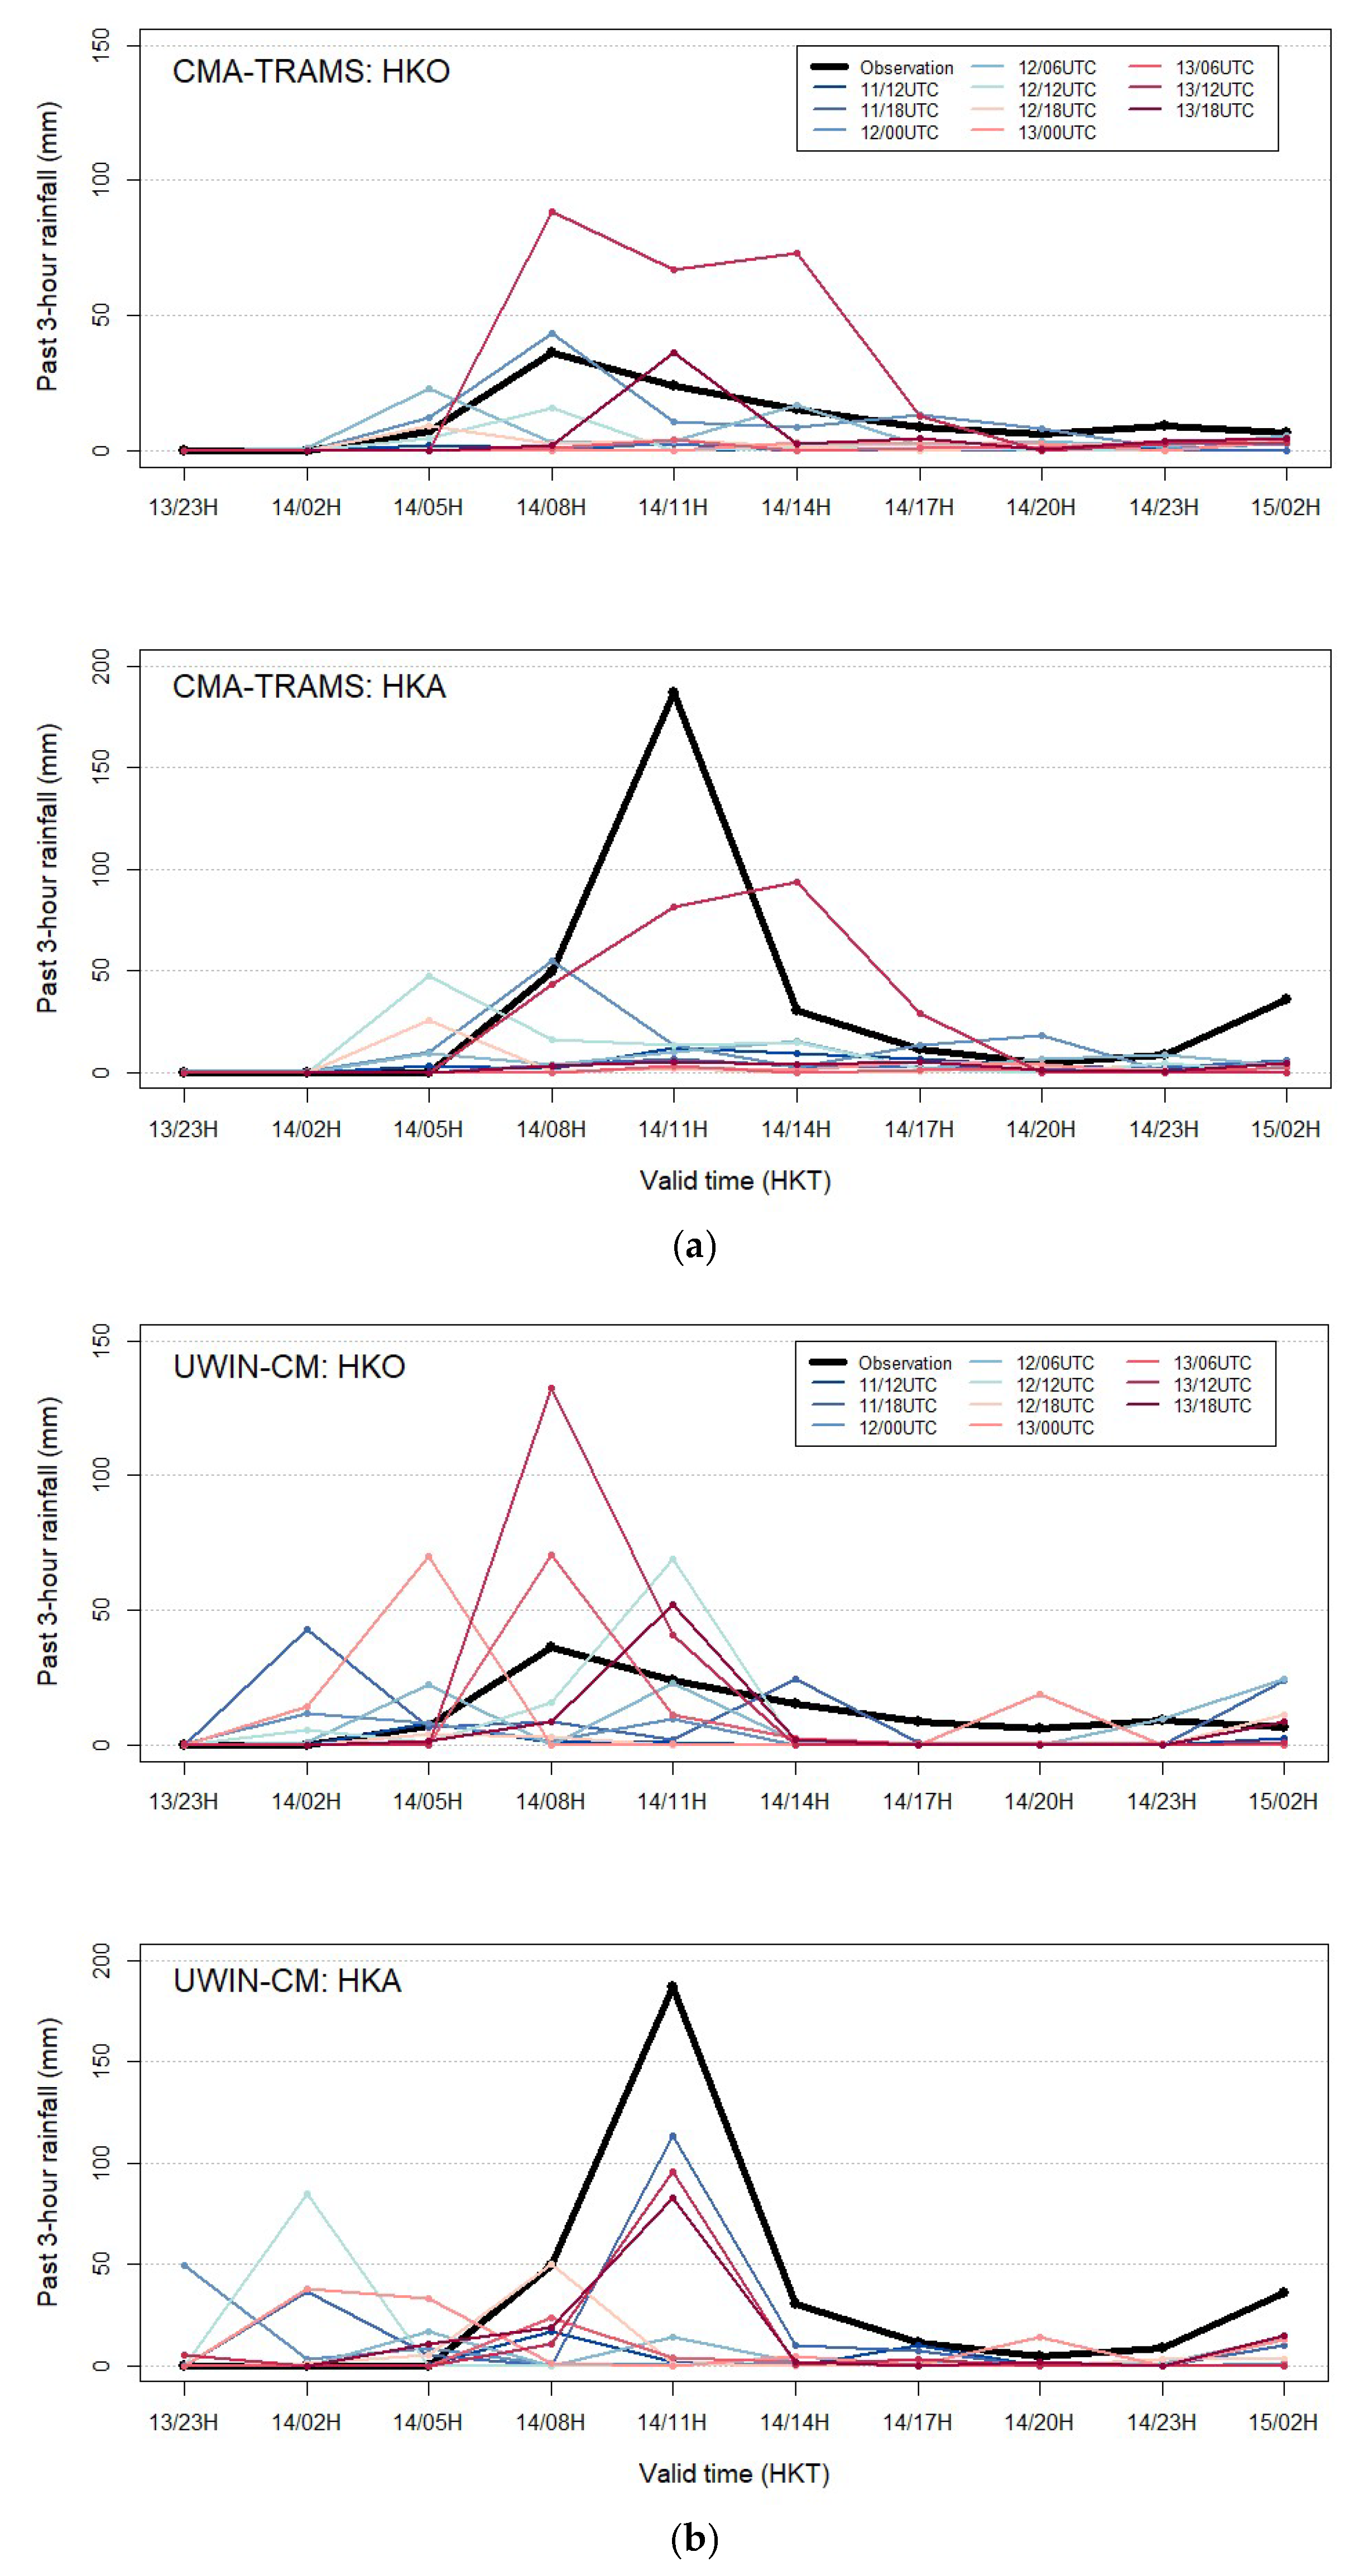
Figure 10.
(a) and (b) show the forecasts by the TRAMS as initialised at 00 UTC, 21 UTC, and 00 UTC on the 13, 13, and 14 August 2025, respectively, for surface isobars, surface wind, and past 3 h accumulated rainfall (colour-coded). (c) and (d) show the corresponding forecasts by the UWIN-CM.
Figure 10.
(a) and (b) show the forecasts by the TRAMS as initialised at 00 UTC, 21 UTC, and 00 UTC on the 13, 13, and 14 August 2025, respectively, for surface isobars, surface wind, and past 3 h accumulated rainfall (colour-coded). (c) and (d) show the corresponding forecasts by the UWIN-CM.
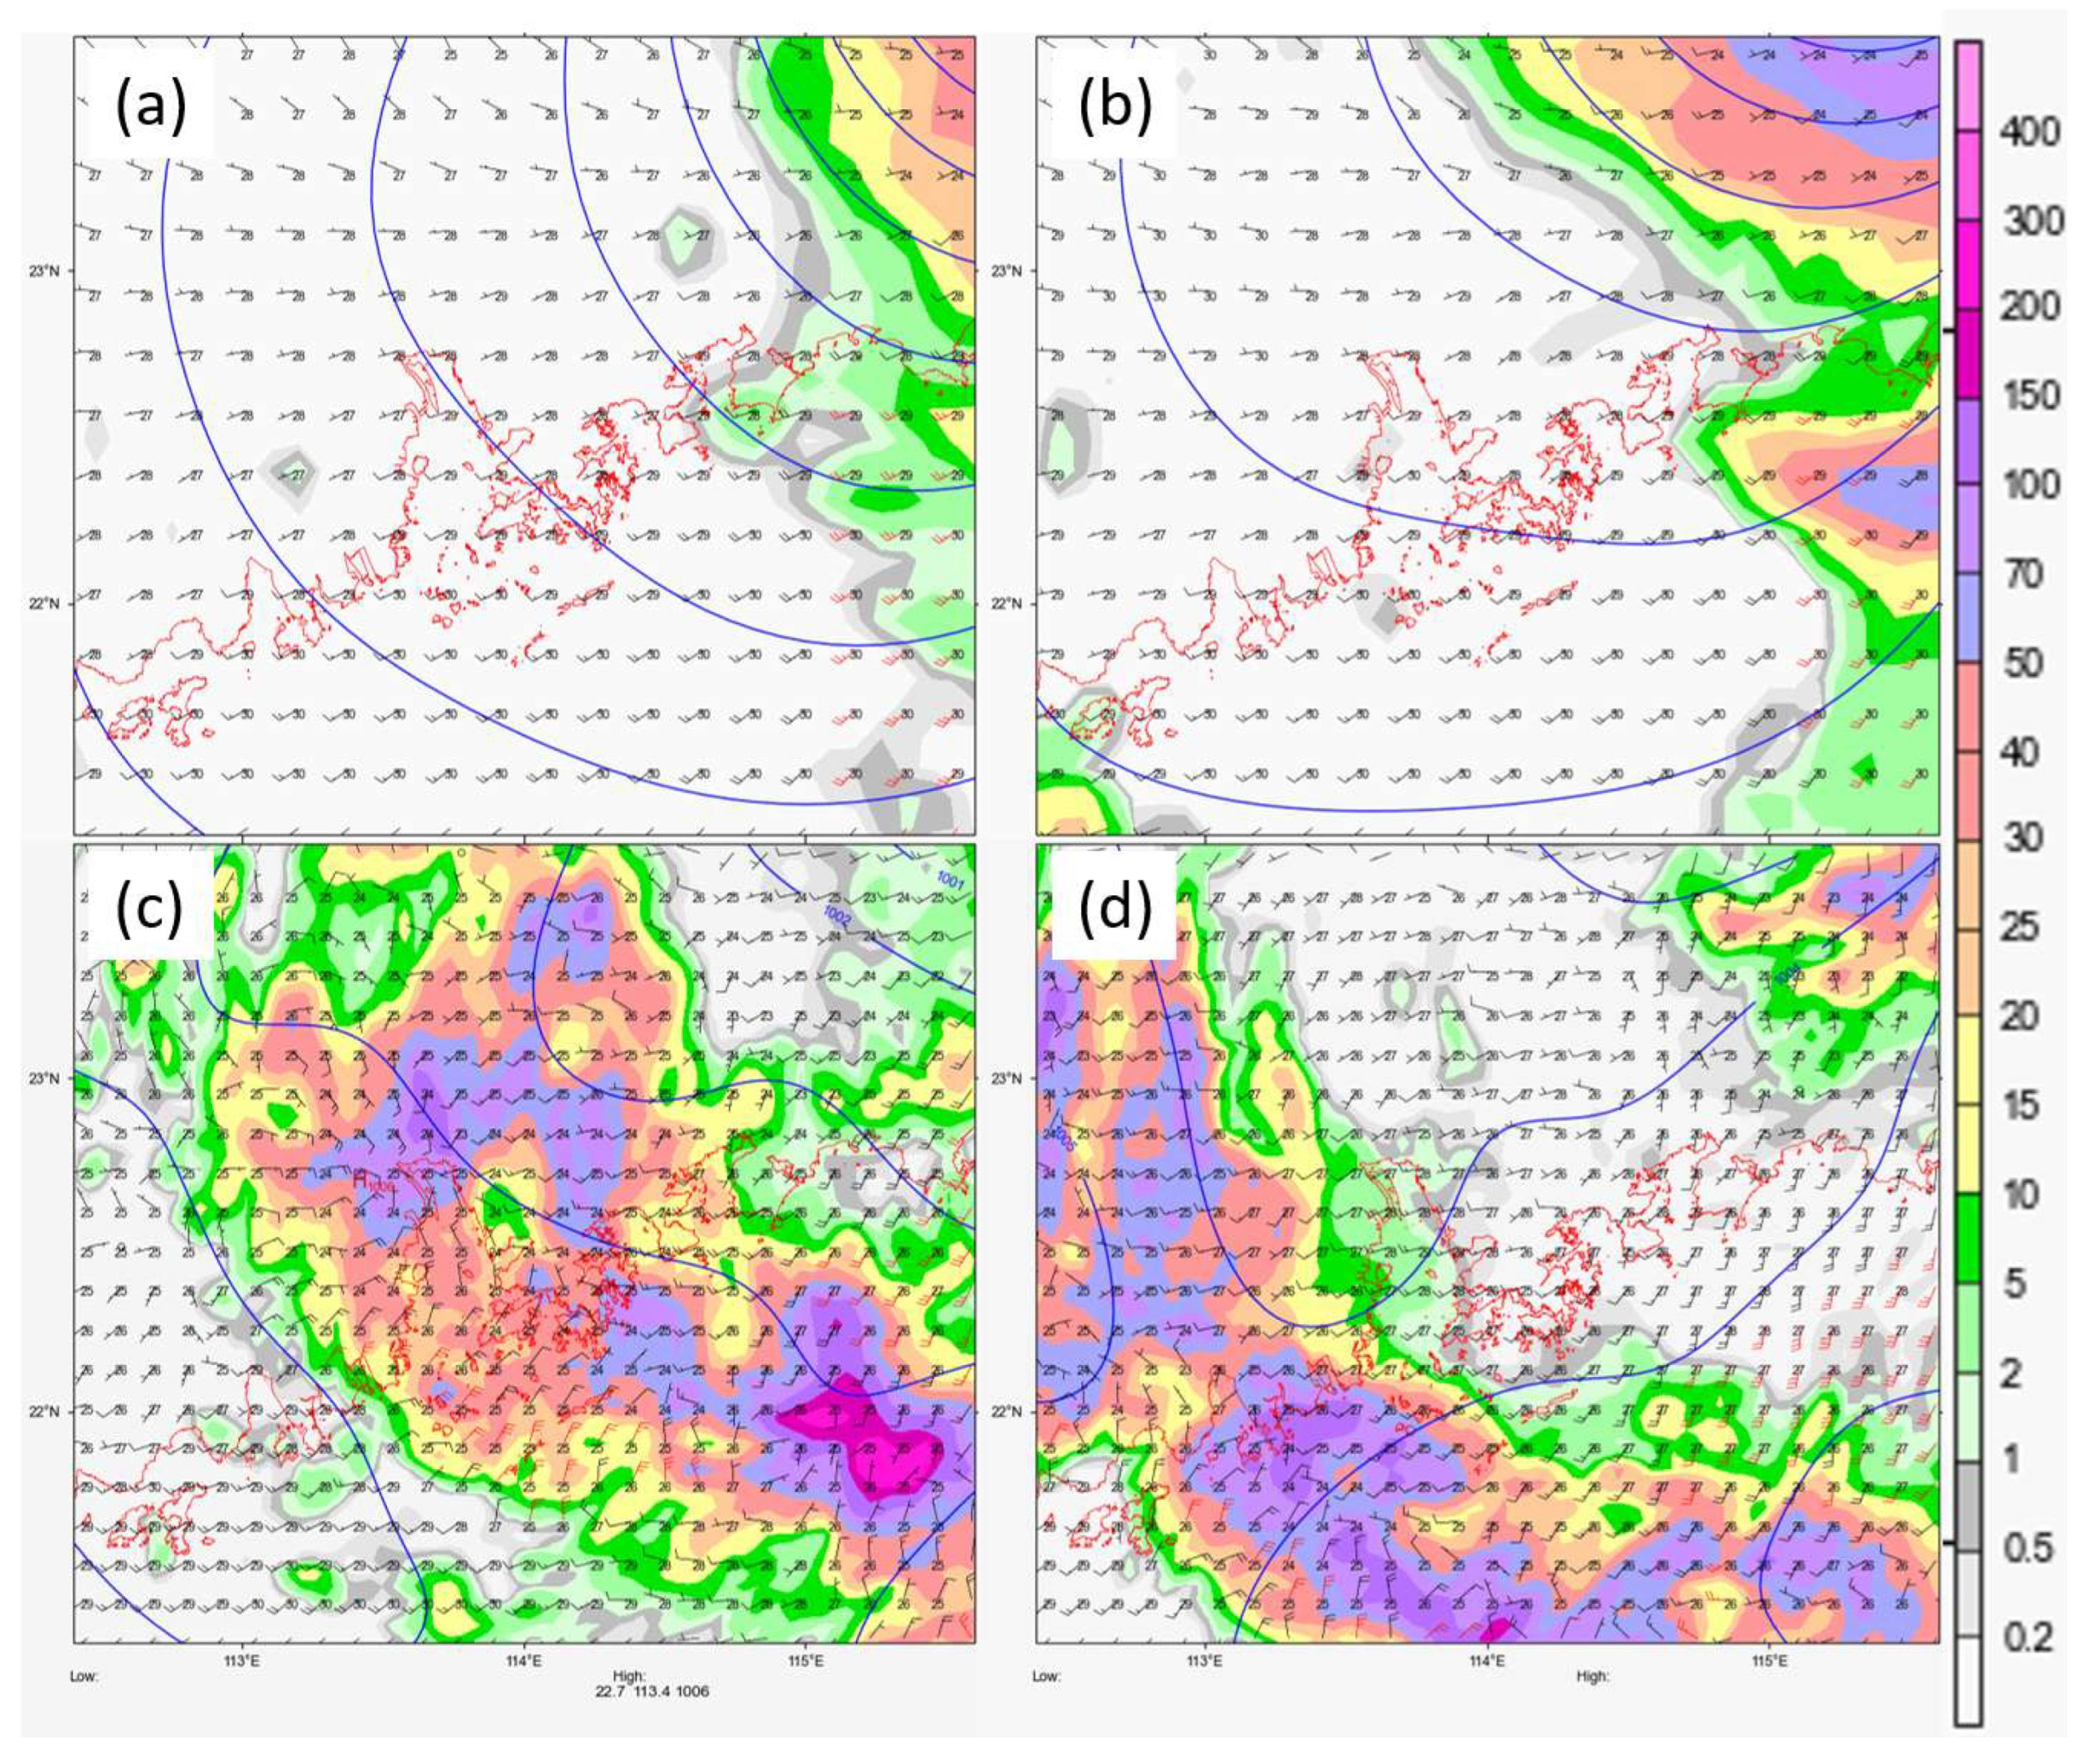
Figure 11.
(a) 200 hPa actual observations (retrieved from wind profilers and satellite winds) at 00 UTC on 14 August 2025, overlaid on the false-colour visible and infrared satellite imagery; (b) 24-h forecast wind and divergence at 200 hPa by the TRAMS as initialized at 00 UTC on 13 August 2025; (c) the corresponding forecast by the UWIN-CM.
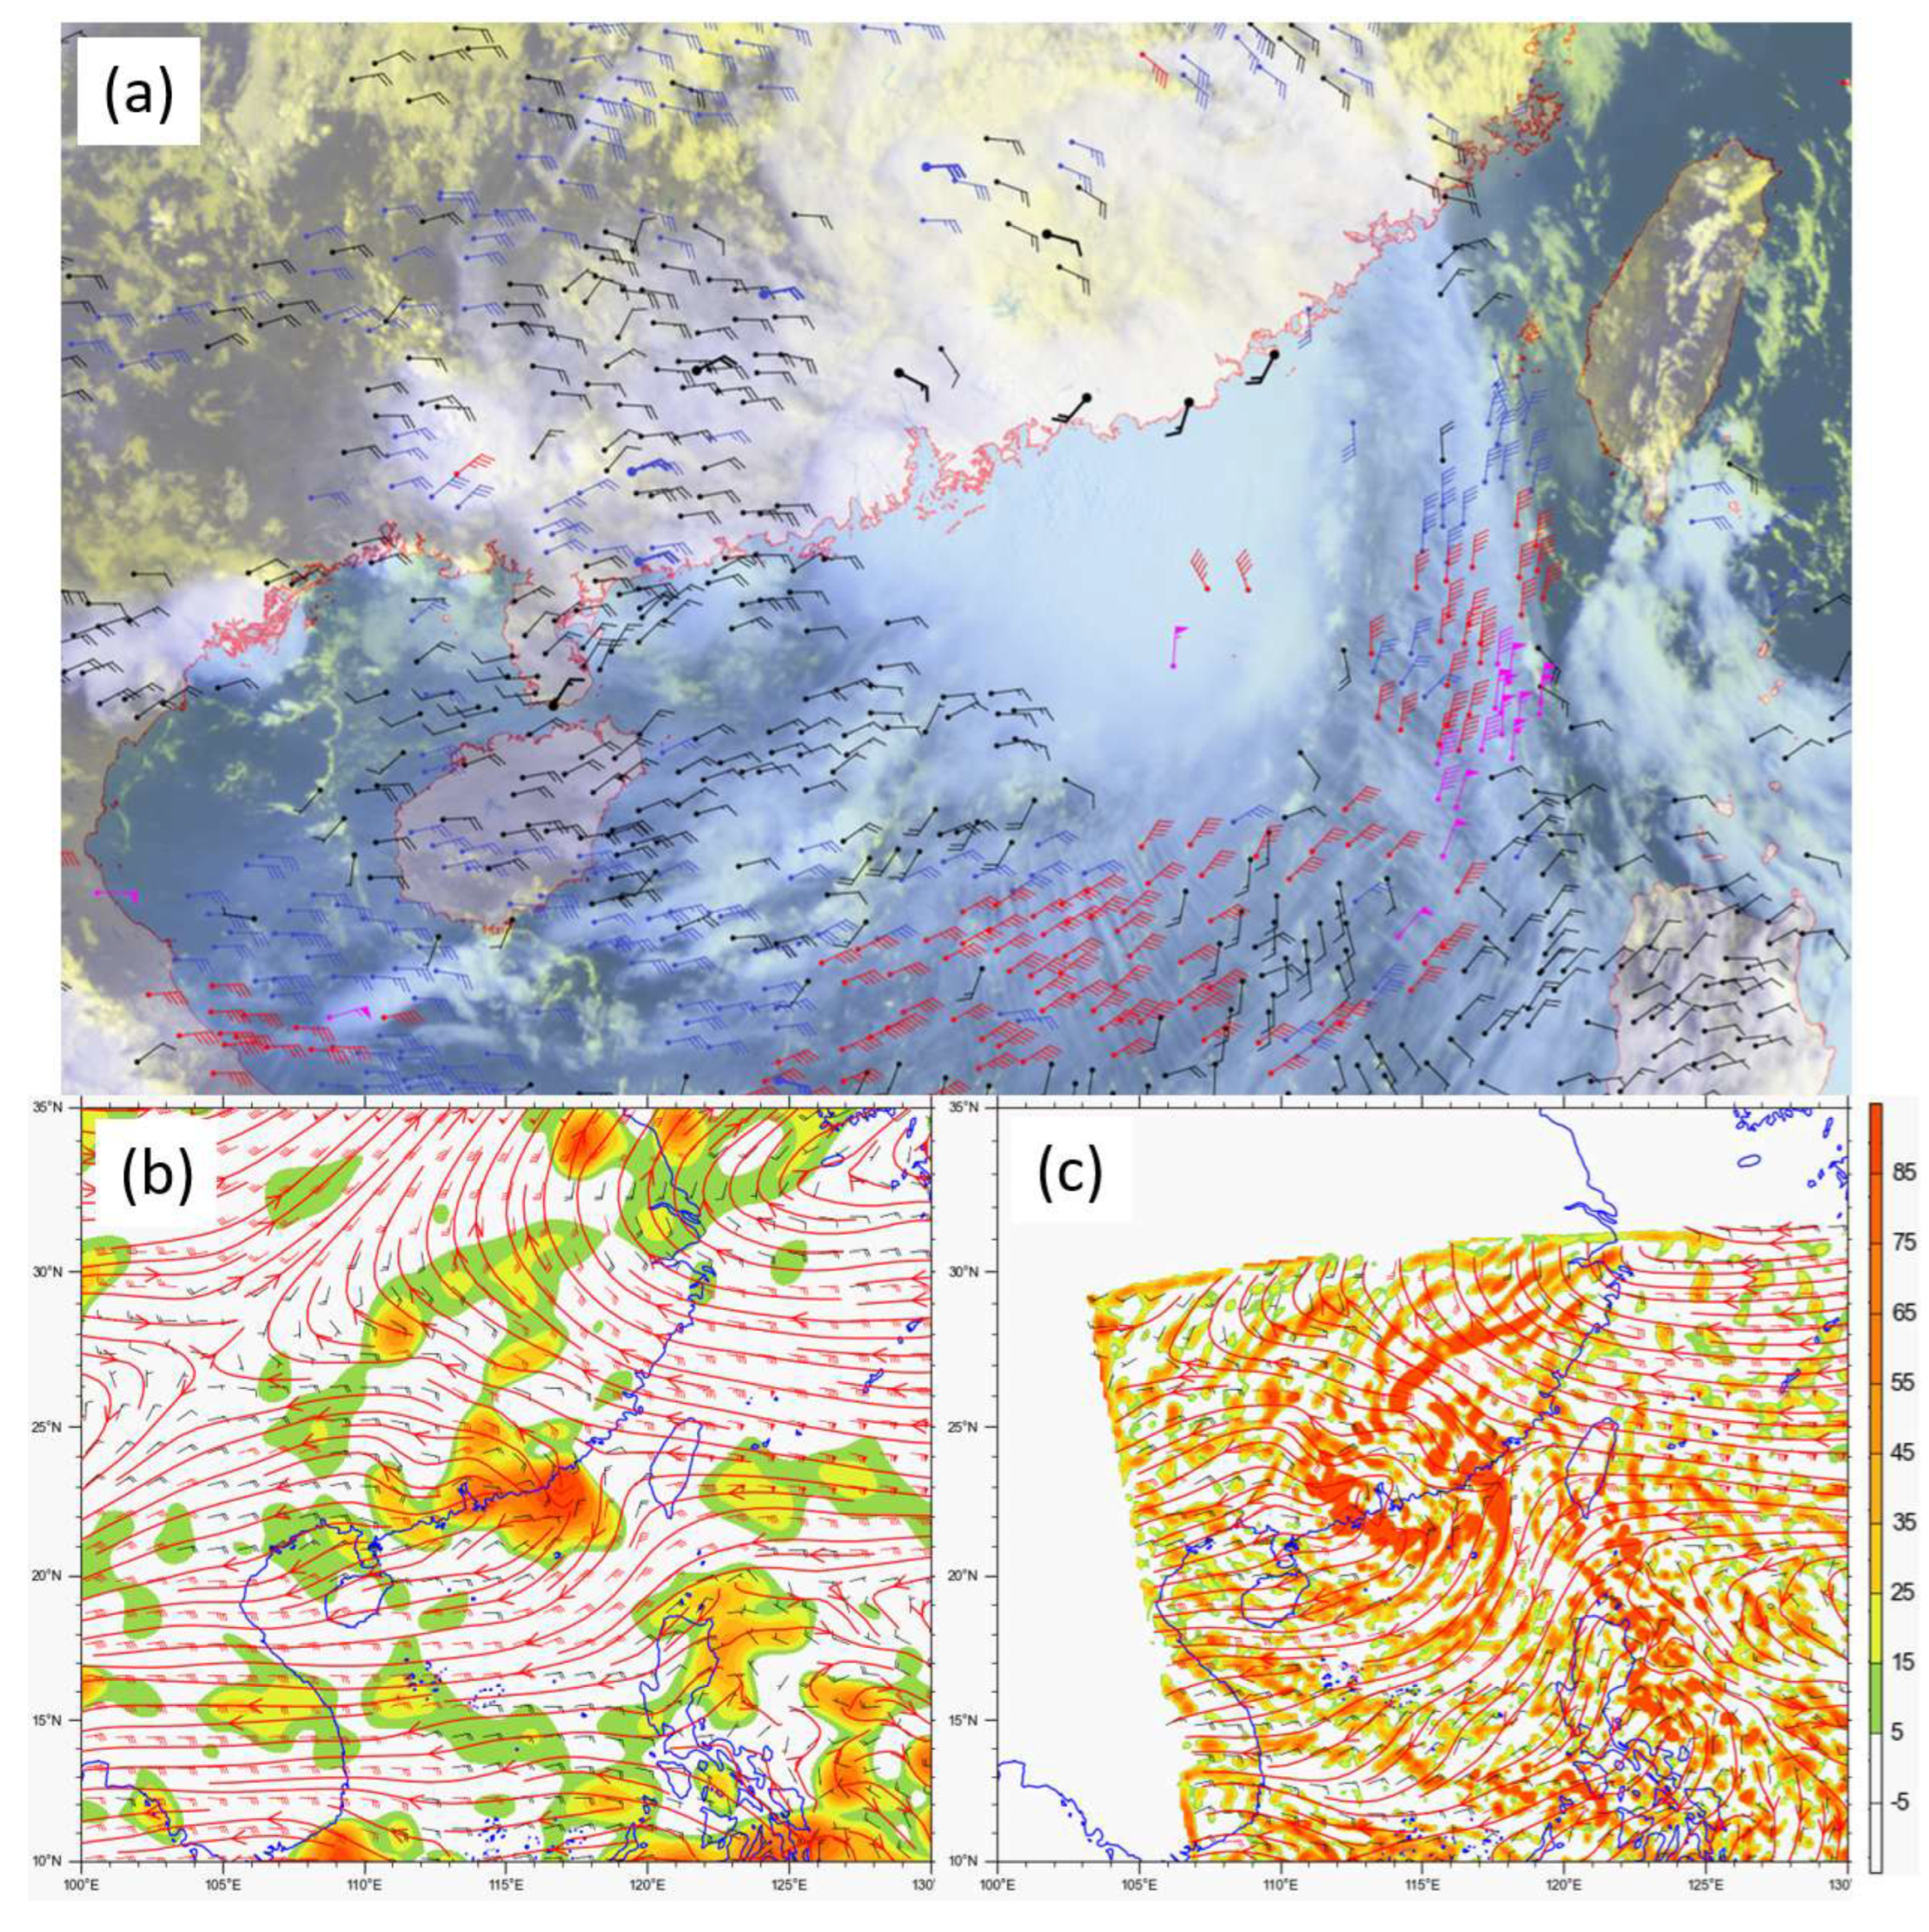
Figure 12.
The 24-h forecast of the 200 hPa wind field and divergence (a) and forecast of surface isobars, wind fields, and 3-hourly rainfall (b) by the UWIN-CM as initialized at 00 UTC on 13 August 2025 and driven by the ECMWF IFS.
Figure 12.
The 24-h forecast of the 200 hPa wind field and divergence (a) and forecast of surface isobars, wind fields, and 3-hourly rainfall (b) by the UWIN-CM as initialized at 00 UTC on 13 August 2025 and driven by the ECMWF IFS.
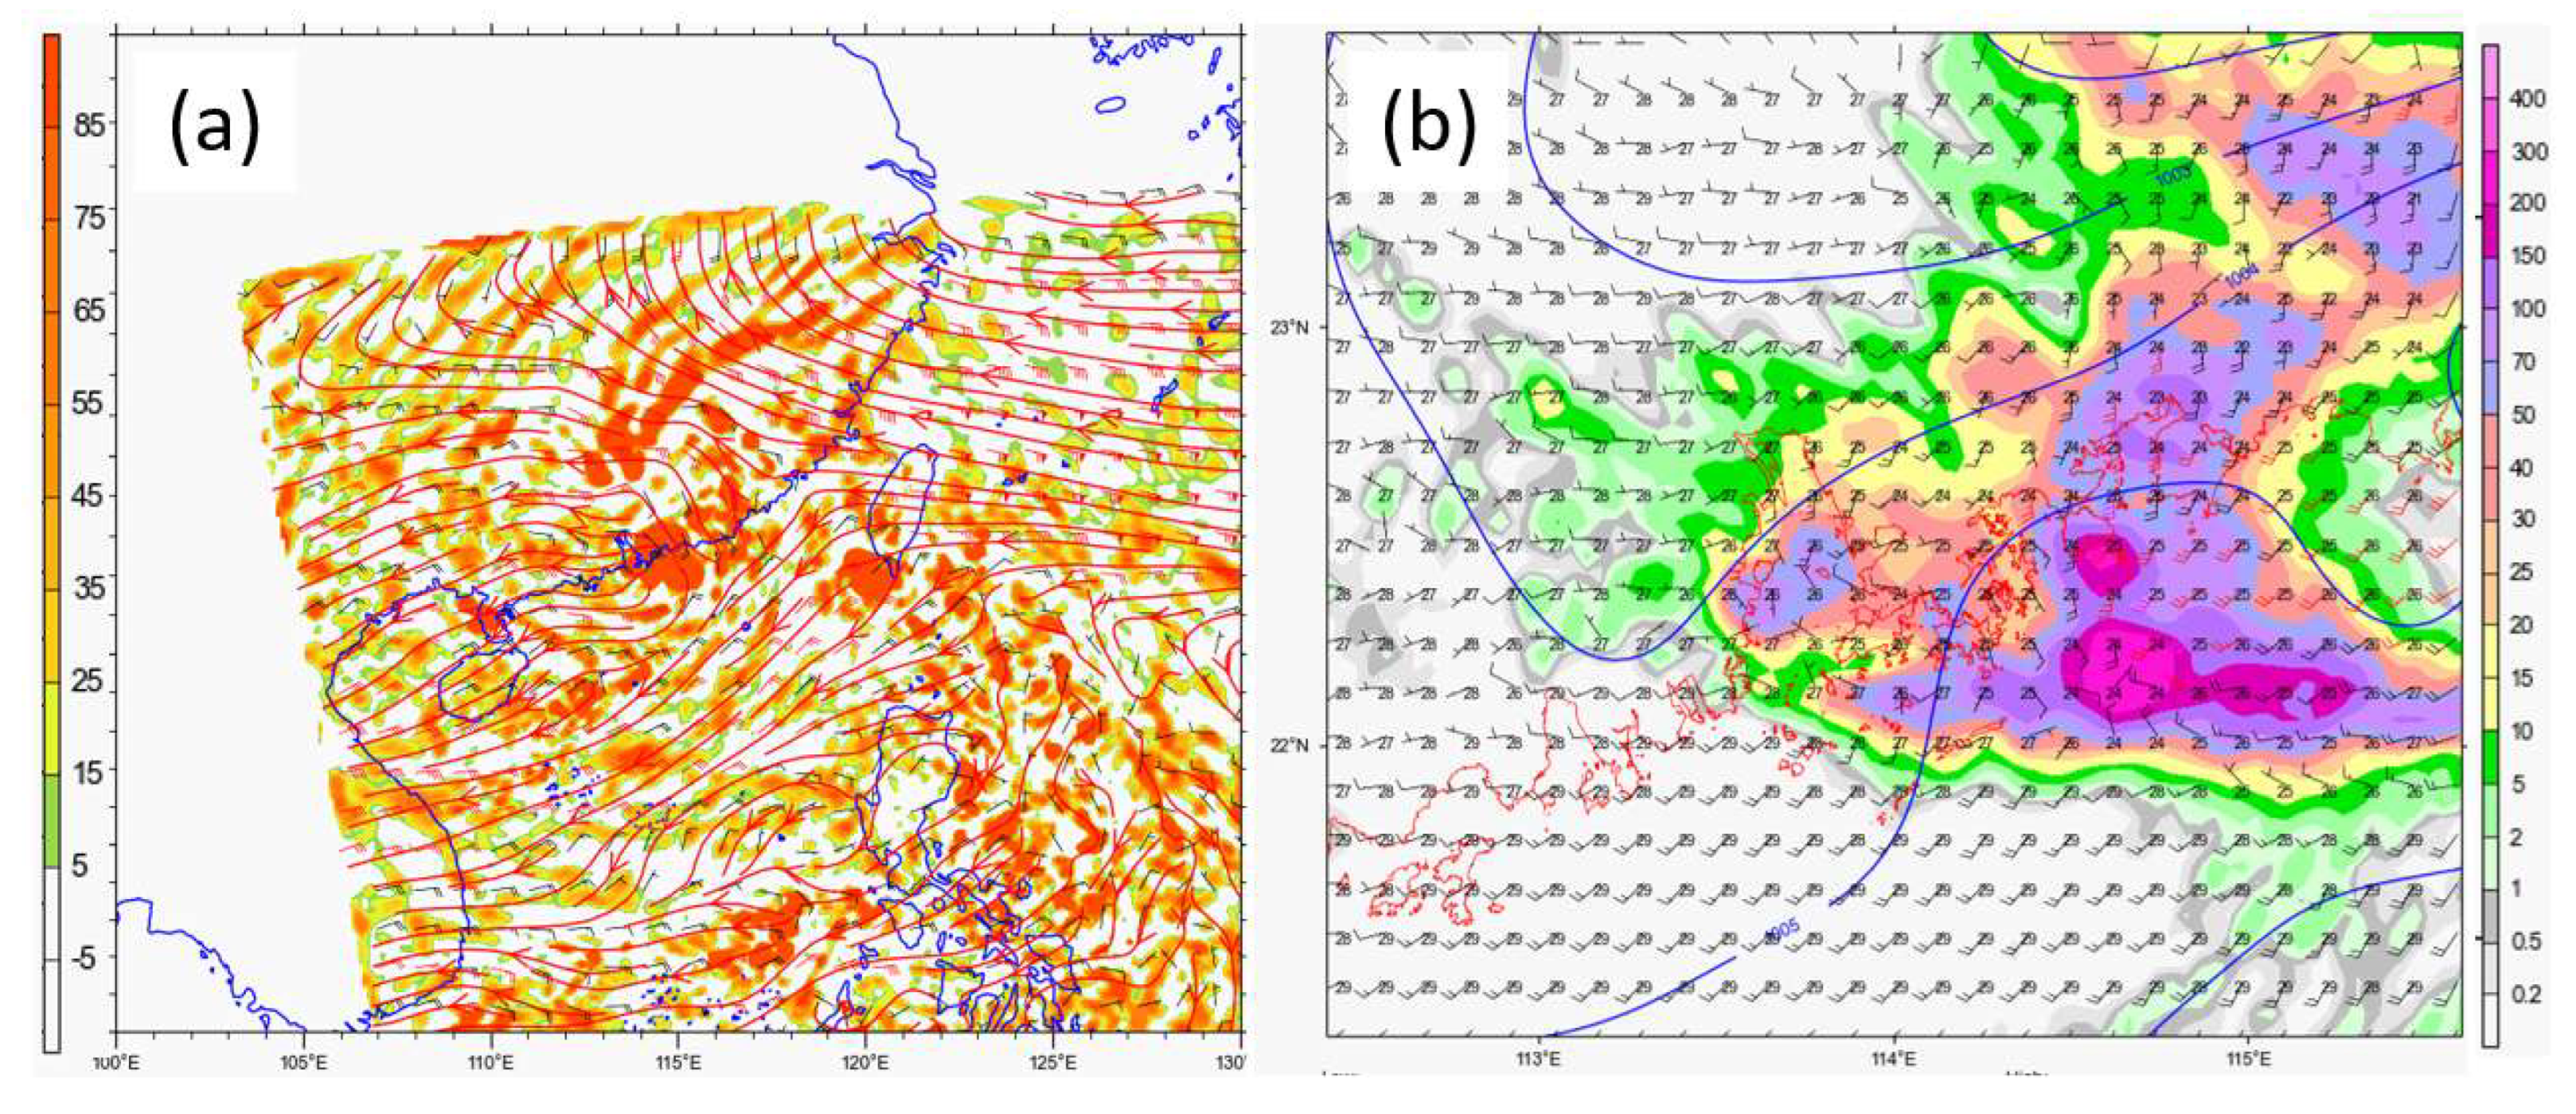
Figure 13.
Radar-rain gauge QPE of 1-h rainfall ending at 8:45 a.m. on 24 August 2025 (top left). QPFs of 1-h rainfall from radar-based extrapolation based on optical flow (bottom left) and the six deep learning nowcast models initialized at approximately 1 h prior.
Figure 13.
Radar-rain gauge QPE of 1-h rainfall ending at 8:45 a.m. on 24 August 2025 (top left). QPFs of 1-h rainfall from radar-based extrapolation based on optical flow (bottom left) and the six deep learning nowcast models initialized at approximately 1 h prior.
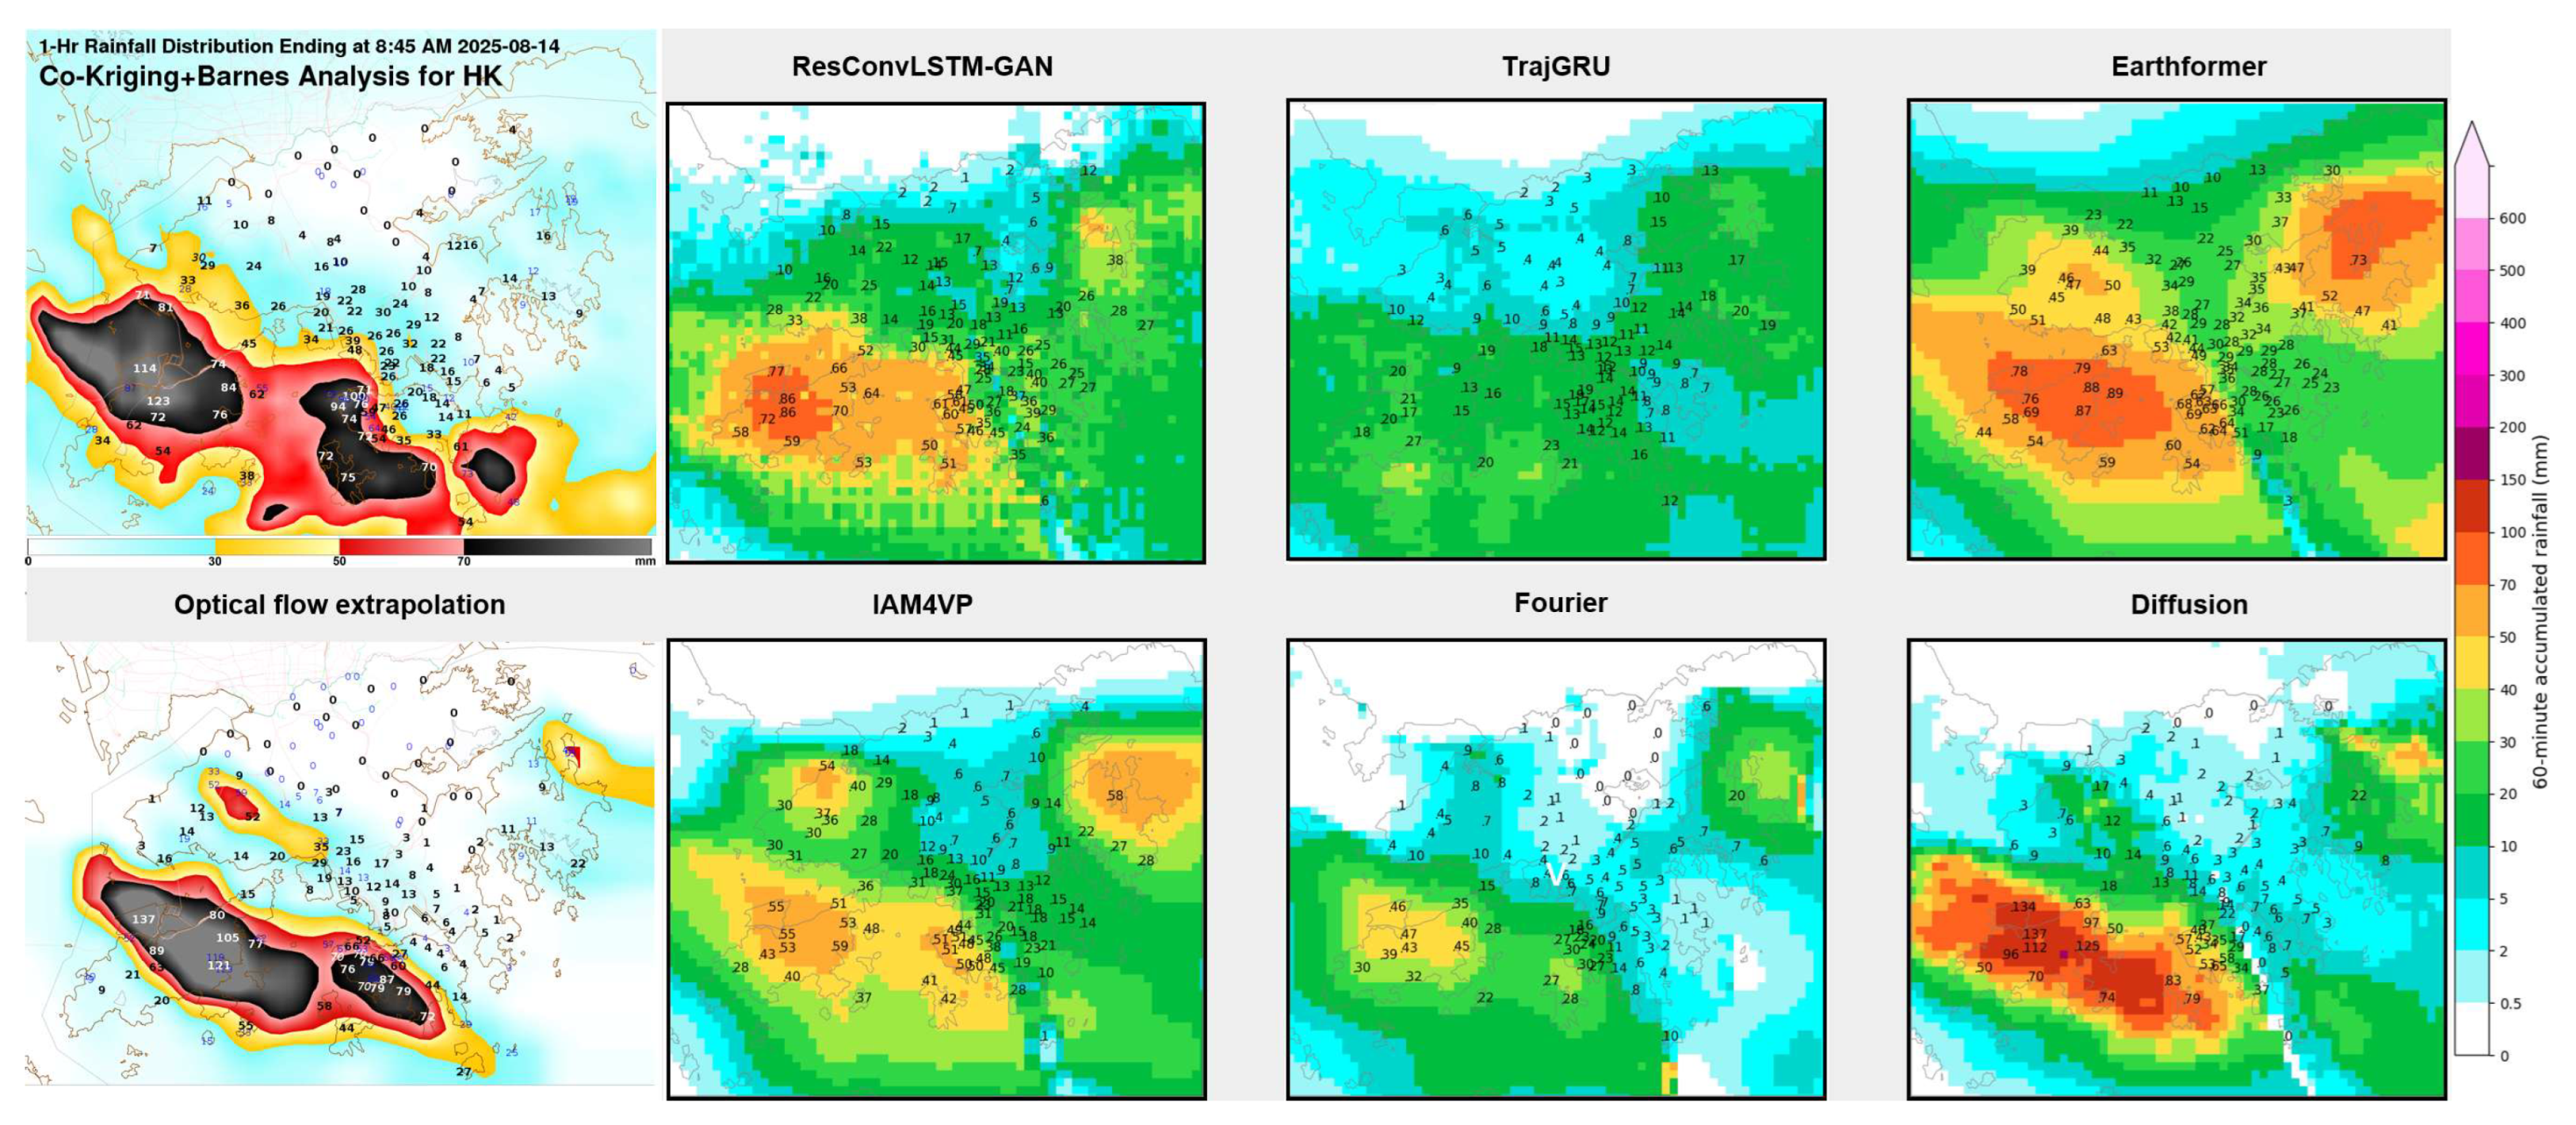
Figure 14.
Time series of the number of rain gauges with 1-h accumulated rainfall reaching ≥ 70 mm (blue line) from 7:15 a.m. to approximately 9:30 a.m. on 24 August 2025. The probability of black rainstorms from the AI-based nowcast guidance is shown in orange dots. The lead time is enclosed in a rectangle with broken lines.
Disclaimer/Publisher’s Note: The statements, opinions and data contained in all publications are solely those of the individual author(s) and contributor(s) and not of MDPI and/or the editor(s). MDPI and/or the editor(s) disclaim responsibility for any injury to people or property resulting from any ideas, methods, instructions or products referred to in the content. |
© 2025 by the authors. Licensee MDPI, Basel, Switzerland. This article is an open access article distributed under the terms and conditions of the Creative Commons Attribution (CC BY) license (http://creativecommons.org/licenses/by/4.0/).
Copyright: This open access article is published under a Creative Commons CC BY 4.0 license, which permit the free download, distribution, and reuse, provided that the author and preprint are cited in any reuse.


