
Submitted:
21 August 2025
Posted:
21 August 2025
You are already at the latest version
Abstract
Although the 15 minute city promotes equity in terms of proximity to have more accessible cities, this study shows that even geographic closeness does not necessarily mean equitable access, particularly for people with disabilities. Using Timisoara, Romania, as a case study, a three-stage study analysis was conducted to evaluate accessibility to public amenities. Each stage considered the needs of both people with visual and mobility impairments and non-disabled users. First, GIS-based isochrone mapping revealed major disparities between the two groups, persons with and without impairments. The proximity to the analysed amenities was nearly halved for people with impairments, once walking distances were adjusted accordingly and inaccessible spaces were excluded. In the second stage, a survey was conducted with 605 respondents to identify distinct accessibility priorities based on 15 minutes city core dimensions. In the third stage, real pedestrian routes in three areas of Timișoara were examined using the top-ranked criteria of each group, enabling a deeper assessment of proximity and usability. The findings confirmed widespread functional inaccessibility, especially for vulnerable groups. These results expose the concept of false proximity, where apparent nearness masks physical or sensory barriers. A shift toward experience-based accessibility planning is needed to ensure that proximity is not that spatial, but usable by all and inclusive.
Keywords:
15 minute city
; inclusive proximity
; visually impaired
; mobility impairment
; sustainability
; inclusive urban design
; accessibility
; scoring method
1. Introduction
Urban life is increasingly shaped by the pursuit of proximity, sustainability, and human-centered mobility. Yet, despite these intentions, spatial proximity does not always result in equitable or functional access for all citizens. In response to rapid urbanization, environmental concerns, and social inequalities, contemporary planning paradigms have moved away from car-centric models toward neighborhood-scale frameworks that prioritize accessibility to essential services.
While this model promotes more livable, resilient, and inclusive cities, its implementation must go beyond mere spatial proximity and take into account the diversity of capacities and barriers faced by all residents, especially people with disabilities. Ensuring equity in urban proximity requires a critical examination of how environments are experienced differently by people with physical or sensory impairments and how design methodologies can be adapted to accommodate these variations.
The “15-Minute City” model promotes the idea that essential services such as healthcare, education, commerce, and recreation should be accessible within a short walk from one’s residence [1,2]. First proposed by Carlos Moreno in 2016 and popularized during the Covid-19 pandemic by cities like Paris. [3], the concept draws on historical frameworks such as the "Garden City" and "Transit Oriented Development" to promote sustainability, proximity, mixed land use, and inclusive public spaces. [4,5].
Communist-era urban planning in Romania also attempted a proximity-based organizational model, through the large-scale development of micro-neighborhoods and the “systematization” program initiated by Nicolae Ceaușescu. These interventions generated standardized residential areas, integrated with public services within walking distance, following the Soviet principles of autonomous neighborhoods, which included local shops, schools, and green spaces [6,7]. Although explicitly designed to provide a walkable and service-rich environment, these developments have often resulted in monotonous architecture and insufficient attention to the needs of vulnerable residents [6].
Proximity, in itself, does not guarantee functional accessibility for people with disabilities [8]. Some studies show that, even when services appear to be close, these populations face structural barriers, such as uneven sidewalks, the absence of ramps or tactile mats and the lack of auditory cues, which significantly limit actual access [8,9]. Thus, contemporary institutional frameworks place increasing emphasis on inclusion. The Institute for Transport and Development Policy (ITDP) promotes universal design in public transport-oriented environments.
Although the concept of the “15-minute city” has gained global popularity as an urban planning ideal, its practical implementation requires rigorous methodologies to assess whether services are truly accessible within the proposed time limits. A growing scientific literature has developed to quantify and operationalize this concept, particularly through spatial and temporal analyses. One commonly used method involves the use of isochrones based on traffic networks, which calculate how far a person can walk or cycle in fixed time intervals (e.g., 5, 10, or 15 minutes). Metwally et al. applied this method in El Rehab, Egypt, using GIS to map accessibility according to different service categories and pedestrian thresholds [10]. Caselli et al. extended this approach by integrating population density and facility distribution within a GIS framework to identify gaps in service provision within 15-minute radiuses in the city of Parma, Italy [11]. Similarly, Mozaffaree Pour and Partanen proposed a two-level spatial analysis for Tallinn, Estonia, combining city-scale assessments with targeted strategies for peripheral neighborhoods [12]. Beyond proximity, Szymańska et al. argued for the need for a composite index of proximity, which also takes into account the quality of infrastructure, as well as social accessibility barriers [13]. Other researchers have focused on the equity and functionality of "15-minute" averages, such as Bruno et al., who developed a universal framework that combines travel time analysis with indicators of social vulnerability [14]. On a larger scale, Abbiasov et al. used mobility data from over 40 million users in the United States, finding that only 12% of daily trips fell within a 15-minute walk, highlighting the discrepancy between theoretical and actual accessibility [15]. Finally, Boncinelli et al. proposed a walkability clustering method based on isochrones to identify functional communities at the neighborhood level in Florence and to guide targeted urban interventions [16]. These approaches emphasize that measuring proximity is not just a spatial exercise, but a multidimensional task, requiring the integration of time constraints, user diversity, and infrastructure quality. In this paper, such insights are adapted to develop a spatial scoring model to assess inclusive proximity for people with mobility and vision impairments. This growing gap between proximity and experienced accessibility is what we define in this study as false proximity.
Despite its human-centered ambition, the 15-Minute City model often overlooks the heterogeneous experiences of residents with disabilities. People with disabilities represent a diverse group, including people with physical, sensory, cognitive, or psychosocial impairments. However, spatial planning rarely addresses their specific mobility needs. This study focuses on two key subgroups – people with locomotor impairments and those with vision impairments – whose experiences clearly illustrate the limitations of a proximity-only approach. For people with mobility impairments, accessible infrastructure means unobstructed sidewalks, curb ramps, flat and continuous surfaces, frequent rest areas, and accessible public transportation stops. Without these elements, the same 500–800 meter route can become inaccessible or dangerous [17]. In contrast, people with visual impairments rely on non-visual cues, such as tactile pavement, high-contrast signage, and auditory signals at intersections, to move around autonomously [18]. However, inconsistencies in the implementation or maintenance of these elements often lead to reduced autonomy and difficulties in orientation. In both cases, spatial proximity must be complemented by inclusive design standards to ensure real accessibility. Therefore, this paper proposes a scoring method that takes into account the specific needs of each group, assigning different weights to accessibility characteristics and penalizing the absence of essential infrastructure, in order to provide a more realistic assessment of urban inclusion.
These specific accessibility needs are consistent with the results of a previous questionnaire conducted among 605 residents of the municipality of Timișoara, Romania [19]. The questionnaire aimed to identify the most frequently visited public spaces, assess user satisfaction, and determine the spatial features prioritized by different groups. Respondents without disabilities indicated cleanliness, lighting, and availability of services as the main factors influencing the use of public spaces. In contrast, participants with mobility or vision impairments placed greater emphasis on physical accessibility, safe crossings, sidewalk quality, and clear signage. For example, while both groups valued proximity to green spaces, people with disabilities reported more limited use of them due to infrastructural barriers, such as inaccessible alleys, high curbs, or lack of rest areas. Similarly, commercial and medical facilities were frequented by all respondents, but people with disabilities highlighted problems related to difficult ramp access or confusing visual signs.
These differences highlight the importance of contextualizing urban design not only through universal proximity models, but also through differentiated, user-informed criteria that reflect functional accessibility. By translating these locally reported priorities into a weighted scoring system, this study bridges the gap between global accessibility frameworks and the real experiences of Timișoara residents, ensuring that spatial planning aligns with needs on the ground.
This paper contributes by proposing a spatial scoring method based on both the international accessibility literature and the specific preferences revealed through the questionnaire applied in Timișoara. The model integrates differentiated weights and penalties for key accessibility features and is applied in a GIS framework to evaluate three typologies of public spaces (commercial, medical, recreational) in three residential areas of Timișoara. Although the analysis is localized, the methodological approach and conclusions are applicable more broadly, particularly to post-socialist European cities navigating between legacy infrastructures and changing equity priorities.
2. Mapping Inclusive Proximity: Materials and Methods
This study uses a mixed approach, combining survey data, geospatial analysis and field observations to assess how proximity and accessibility are perceived and experienced by different user groups in Timișoara. The objective is to verify to what extent the promise of the 15-minute City – equal access to public services within a short distance – is truly fulfilled when analyzed from the perspective of people with and without disabilities.
The methodology is carried out in three sequential stages. In the first stage, a large-scale questionnaire was applied among residents to understand their mobility habits, the types of public spaces frequented and the spatial features considered important. The questionnaire also highlighted key differences in the priorities expressed by people with mobility or vision impairments compared to those without disabilities. This information was the basis for the development of a personalized scoring framework for assessing accessibility.
In the second stage, radial access GIS maps were created to illustrate the theoretical coverage areas of public facilities, starting from two mobility scenarios: walking at normal speed (for users without disabilities) and walking at reduced speed (for people with mobility or vision impairments). A filtering layer was applied over these maps using data from the Wheelmap.org platform [20] to exclude facilities considered inaccessible to wheelchair users, thus generating a more realistic accessibility footprint. In the third stage, based on the results obtained from the questionnaire and the spatial analysis, three high-priority public spaces were selected in each of the analyzed neighborhoods. These were subjected to detailed mapping using the temporal delimitation of accessibility areas tool provided by TravelTime [21] and were subsequently assessed through field research. Pedestrian routes to these spaces were analyzed based on accessibility criteria specific to each user group, criteria derived both from international literature and from local preferences expressed through the questionnaire.
2.1. Survey-Based Assessment: Identifying User Priorities
To ground the spatial analysis in the real needs of users, a quantitative questionnaire was conducted among 605 residents of the city of Timișoara, Romania. The questionnaire aimed to identify the types of public spaces most frequently visited, assess the perception of their accessibility and comfort, and prioritize design criteria relevant to different user groups. Respondents were divided into two main categories: people without disabilities and people with disabilities. Within the article, two subgroups were distinguished: individuals with mobility impairments and those with visual impairments.
Three urban neighborhoods — Elisabetin, Circumvalațiunii / Iulius Town, and Zona Centrală — were selected due to their different urban character, as illustrated in Figure 1. The results of the questionnaire highlighted distinct priorities between user groups. Participants without disabilities emphasized the importance of general cleanliness, public lighting, and the density of services, while people with disabilities emphasized the need for continuous sidewalks, safe crossings, clear visual signage, and adapted access routes. Respondents with mobility impairments frequently mentioned infrastructural obstacles such as high curbs, degraded sidewalks, or inaccessible entrances, while people with visual impairments reported difficulties caused by the lack of tactile indicators or consistent audible signals.
These divergent preferences were subsequently translated into an accessibility scoring system with differentiated weights, customized for each group, and applied in subsequent cartographic assessments.
2.2. General Accessibility Mapping Using Radial Distance Analysis
Building on the user-reported priorities identified through the survey, the second stage involved spatial mapping of general accessibility using radial distance analysis. To assess the overall spatial accessibility of public services across different user groups, an initial set of radial maps was produced using QGIS and OpenStreetMap (OSM) data. The method used corresponds to a distance buffer analysis, in which each point of interest—classified as a commercial unit, medical center, or green space—serves as a central node for circular catchment areas. These areas are intended to illustrate the theoretical area that can be walked within a 15-minute interval, thus providing a comparative visualization of access gaps between different neighborhoods.
For the general population (users without disabilities), the buffer radius was set to 900 meters, reflecting an average urban walking speed of 1.0–1.2 m/s, as reported in the literature on urban transport and mobility [22]. In contrast, differentiated walking distances were applied for people with disabilities. For visually impaired users, a reduced radius of 432 meters was selected, based on empirical results obtained by Liu et al. (2019), which showed that blind people walk, on average, approximately 432 meters in 10 minutes — corresponding to an average walking speed of 0.72 m/s. [23]. For people with mobility impairments, an estimated walking speed of 0.60 m/s was used, based on a synthesis of studies on assisted mobility and wheelchair travel [24], leading to an estimated radius of 360 meters.
To increase the accuracy of the maps, all datasets were further filtered to reflect only accessible destinations. Using data from Wheelmap.org [20], a specialized OSM-based platform, public spaces marked as “inaccessible” were excluded from the maps dedicated to slow walking. This adjustment allowed for a realistic spatial representation of areas that can actually be reached, instead of a theoretical coverage based only on proximity.
2.3. Detailed Accessibility Maps and Route Scoring
To assess the overall spatial accessibility of public services across different user groups, an initial set of radial maps, based on distance buffer, was produced using QGIS and OpenStreetMap (OSM) data. The applied method corresponds to a distance buffer analysis, in which each point of interest — classified as a commercial unit, medical center, or green space — serves as a central node for circular catchment areas. These areas were intended to illustrate the theoretical area that can be reached within a 15-minute walk, thus providing a comparative visualization of access gaps between neighborhoods. However, these maps often overestimate real access, as they ignore the physical or sensory barriers encountered by special users, a discrepancy referred to in this study as false proximity.
Following the overall radial analysis, a second spatial assessment layer was developed to explore the functional accessibility of pedestrian routes leading to the most frequented public destinations in Timișoara. While the first layer illustrates theoretical spatial reachability, the second captures functional usability of public amenities, bridging the gap between proximity and actual accessibility. While radial buffers indicate the potential coverage of services based on distance, they do not reflect the presence or absence of accessible infrastructure along the route. This second stage addresses this limitation through cartographic modeling and direct field assessment based on scoring criteria.
The analysis focused on three representative urban areas—Central Area, Elisabetin, and Circumvalațiunii—selected based on their inclusion in the previous survey and their distinct urban profiles. All three neighborhoods are predominantly residential, but each has a specific dominant characteristic: Central Area contains administrative and cultural institutions; Elisabetin is a historic neighborhood with low-rise housing and mixed services; Circumvalațiunii reflects a post-war model, with dense collective housing and peripheral location. The choice of these areas allows for the observation of accessibility in different spatial contexts.
In each neighborhood, one commercial space, one medical center, and one green/recreational space were selected, based on the questionnaire responses, which indicated these types of destinations as the most frequented or consistently mentioned by all demographic categories. Thus, a total of nine destinations were analyzed in depth, allowing for both vertical (within the same neighborhood) and horizontal (between user groups) comparisons.
For each location, accessibility zones were mapped using the TravelTime platform, which generates isochrones based on real street networks, as opposed to geometric radii. For people without disabilities, a 15-minute walking time threshold was used, corresponding to an average speed of 1.2m/s, which is equivalent to approximately 1,080 meters traveled [22]. For people with disabilities, the TravelTime platform does not allow for the setting of personalized walking speeds; therefore, to maintain methodological consistency while also adapting the analysis range, a 10-minute walking threshold was used to approximate the distance that could realistically be covered in 15 minutes by people with reduced mobility or visual impairments. This adjustment reflects the documented average walking speeds of 0.66 m/s for people with visual impairments [24] and 0.6 m/s for wheelchair users [25], resulting in a common effective range of approximately 600–660 meters.
The resulting isochrones were visualized in GIS to compare residential coverage areas between different user groups. These visual comparisons highlighted significant discrepancies between apparent accessibility and actual access. To better understand these differences, a field study was also conducted, which assessed the actual conditions of pedestrian travel from residential clusters to selected destinations.
As represented in Figure 2, each route was analysed by using the most important criteria considered by the groups asked in the survey presented above:
Users without disabilities: public lighting, pleasant atmosphere, cleanliness of the route ;
Users with visual impairments: public lighting, surface quality of the route, low interaction with traffic;
Users with mobility impairments (e.g. wheelchair users): public lighting, presence of urban furniture, surface quality of the route
Each of the criteria was scored on a standardized 3-point scale, regardless of user group:
0 points - the criterion is absent;
0,5 points - the criterion is present but poorly implemented, inconsistent or makeshift;
1 point - the criterion is fully implemented and functional along the route.
This results in a maximum score of 3 points per user group per route. This scoring system allows for a comparative interpretation of the actual accessibility conditions, in relation to the different needs of users.

Table 1.
Score distribution for each group.
| Accesibility Criterion | Caracteristics | Points | |
| Non-Disabled Users | public lighting | No lighting / broken | 0 / 1 (Absent) |
| Sparse / dim / inconsistent | 0,5 / 1 (Partial) | ||
| Uniform, bright, functional | 1 / 1 (Existent) | ||
| pleasant atmosphere | No vegetation / noise / unwelcoming | 0 / 1 (Absent) | |
| Minimal greenery / noise / dirty | 0,5 / 1 (Partial) | ||
| Green, quiet, aesthetically pleasant | 1/ 1 (Present) | ||
| cleanliness of the route | Littered, neglected | 0 / 1 (Absent) | |
| Intermittent cleaning | 0,5 / 1 (Partial) | ||
| Clean, well-maintained route | 1/ 1 (Present) | ||
| MAXIMUM POINTS FOR NON-DISABLED USERS’ CRITERIONS | 3 | ||
| Visual Impaired Users | public lighting, | No lighting / broken | 0 / 1 (Absent) |
| Sparse / dim / inconsistent | 0,5 / 1 (Partial) | ||
| Uniform, bright, functional | 1 / 1 (Existent) | ||
| surface quality of the route, | Rough / damaged / uneven | 0 / 1 (Absent) | |
| Mixed paving or partial obstacles | 0,5 / 1 (Partial) | ||
| Smooth, continuous, tactile-safe | 1 / 1 (Existent) | ||
| low interaction with traffic | Constant vehicular interference | 0 / 1 (Absent) | |
| Occasional crossing danger | 0,5 / 1 (Partial) | ||
| Protected, separated walk | 1 / 1 (Existent) | ||
| MAXIMUM POINTS / VISUAL IMPAIRED USERS’ CRITERIONS | 3 | ||
| Mobility Impaired Users | public lighting | No lighting / broken | 0 / 1 (Absent) |
| Sparse / dim / inconsistent | 0,5 / 1 (Partial) | ||
| Uniform, bright, functional | 1 / 1 (Existent) | ||
| presence of urban furniture | No benches or rest zones | 0 / 1 (Absent) | |
| Few benches, hard to reach | 0,5 / 1 (Partial) | ||
| Frequent benches, accessible | 1 / 1 (Existent) | ||
| surface quality of the route | Cracked / uneven / inaccessible | 0 / 1 (Absent) | |
| Some smooth, some inaccessible | 0,5 / 1 (Partial) | ||
| Flat, continuous, step-free | 1 / 1 (Existent) | ||
| MAXIMUM POINTS / MOBILITY IMPAIRED USERS’ CRITERIONS | 3 | ||
Each pedestrian route was therefore given a total accessibility score out of 3 points for each user group, allowing for a comparative understanding of the actual degree of pedestrian accessibility and inclusion. The assessment was accompanied by photographic documentation and detailed field observations, which supported and visualized the identified barriers and facilities. It is important to note that certain features not relevant in the local context, such as the slope of the terrain, were not included in the final analysis, as Timișoara has a relatively flat topography and respondents did not perceive the slope as an obstacle.
This multi-scalar approach connects subjective perception with objective infrastructure, contributing to a nuanced assessment of inclusive proximity in the urban environment.
All spatial data layers used in this study were taken from public sources, such as OpenStreetMap and Wheelmap.org. The resulting maps, questionnaire responses (in anonymized form) and customized accessibility scoring templates will be available in an open-access repository upon publication of the paper. The questionnaire, which collected responses from 605 residents of Timișoara, was completed anonymously and voluntarily, without the collection of sensitive personal data. Therefore, it was exempted from formal ethical review, in accordance with national regulations on non-interventional and anonymized research.
This study partially used generative artificial intelligence tools (ChatGPT, OpenAI) for drafting, summarizing methodological details and assisting in formulating the text in English; however, the authors take full responsibility for the scientific content and interpretation. Although the scoring model was based on both international literature and preferences expressed by local users, it inevitably reflects context-specific criteria and weights. Consequently, application of the method in other urban environments or demographic contexts may require recalibration.
3. Results
Urban accessibility and spatial equity were assessed using a multi-layered approach that combines subjective perspectives (through a public survey) with objective geospatial analysis (through radial and detailed GIS-based mapping). The assessment focuses on three neighborhoods in Timișoara — Centru, Elisabetin (Bălcescu), and Circumvalațiunii / Iulius Town — chosen for their mixed residential character and varying levels of centrality, infrastructure quality, and socio-economic composition. The results are structured in three stages: (1) residents’ perceived priorities, (2) spatial accessibility through general radial maps, and (3) detailed accessibility scores of specific public spaces, based on field assessments.
3.1. Residents' Prioritization of Urban Accessibility Feature
The first level of analysis is based on the public survey conducted among 605 residents of Timisoara, aiming to understand the characteristics they prioritize when evaluating the accessibility and quality of urban spaces. The survey, results and a detailed description along with descriptive graphs had been presented on a previous article [19]. The graph below (Figure 3) illustrates the most frequently mentioned criteria, ordered by the number of selections made by the participants. Respondents had the opportunity to choose multiple options.
The data reveals that public lighting (236 responses), pleasant atmosphere (206) and cleanliness of the route (196) were the three most important aspects mentioned by residents. These were closely followed by low interaction with traffic (190) and the quality of the route surface (183). It is worth noting that aspects such as the lack of architectural barriers (62) and gentle slope (57) — essential for people with reduced mobility — were ranked last, suggesting that these needs are poorly recognized by the general population. This discrepancy highlights the importance of differentiated assessment strategies that take into account the diversity of users and highlights a gap between dominant perceptions and the specific barriers encountered by people with disabilities.
3.2. Spatial Disparities in Proximal Based Accessibility
To assess the extent to which spatial proximity corresponds to inclusive accessibility, radial coverage maps were generated using GIS software (QGIS) and OpenStreetMap data. Each public facility (e.g. supermarket or medical center) was used as the center point of a circular catchment area, calculated based on walking speed and travel time.
Two walking scenarios were analyzed:
- Normal speed walking (NSW): calculated for a 15-minute walking radius, using an average speed of 1.2 m/s [22],representing the general population;
Figure 4, Figure 5, Figure 6 and Figure 7 illustrate the comparative accessibility to markets and medical centers in both walking speed scenarios.
From a spatial analysis perspective, significant differences emerge between the two walking scenarios, as seen in Table 2. Under normal walking speed conditions, the uncovered residential area near supermarkets was only 23,809 m² out of 116,257 m², while under reduced walking speed conditions increased to 54,378 m², representing a 26,2% increase in inaccessible area. Expressed as a percentage, this change reflects a decrease in the covered area from 79,5% to 53,2% of the total urban area analyzed.
For medical centers, the discrepancy was also notable, although more nuanced. The uncovered area in the normal walking speed scenario was 66,237 m², which increased to 88,850 m² in the reduced walking speed scenario — a 34% increase in uncovered territory. In this case, spatial coverage decreased from 62% to 44% of the total area analyzed, of 116,257 m².
This discrepancy between the covered area of the two amenities analysed, is not surprising. According to the survey results, most responders reported visiting more frequent shopping centers than medical centers. In this context, the survey results are aligned with the differences of the covered areas of the two amenities analysed..
These differences will be further explored in the Discussion section, where spatial inequalities and patterns of service distribution are analyzed in relation to user needs and urban functionality.
3.3. Local Micro-Mapping of Accessibility Zones
To complement the broader spatial analysis of service distribution, this subchapter focuses on a localized assessment of accessibility conditions in three areas of Timișoara, where the survey was conducted, each associated with distinct urban characteristics: Iosefin/Bălcescu - historical residential area, Iulius Town - commercial area, and the Historic Center - touristic and institutional district. Two of these areas were selected based on their relevance in the previous survey of 605 residents, which identified them as frequented urban spaces with high social significance [19]: commercial center and parks. Medical centers were taken into consideration due to their essential role for people with disabilities, for whom access to healthcare is fundamental for their independent living.
Figure 8.
Frequency use of different public spaces , data source: [19].
Figure 8.
Frequency use of different public spaces , data source: [19].
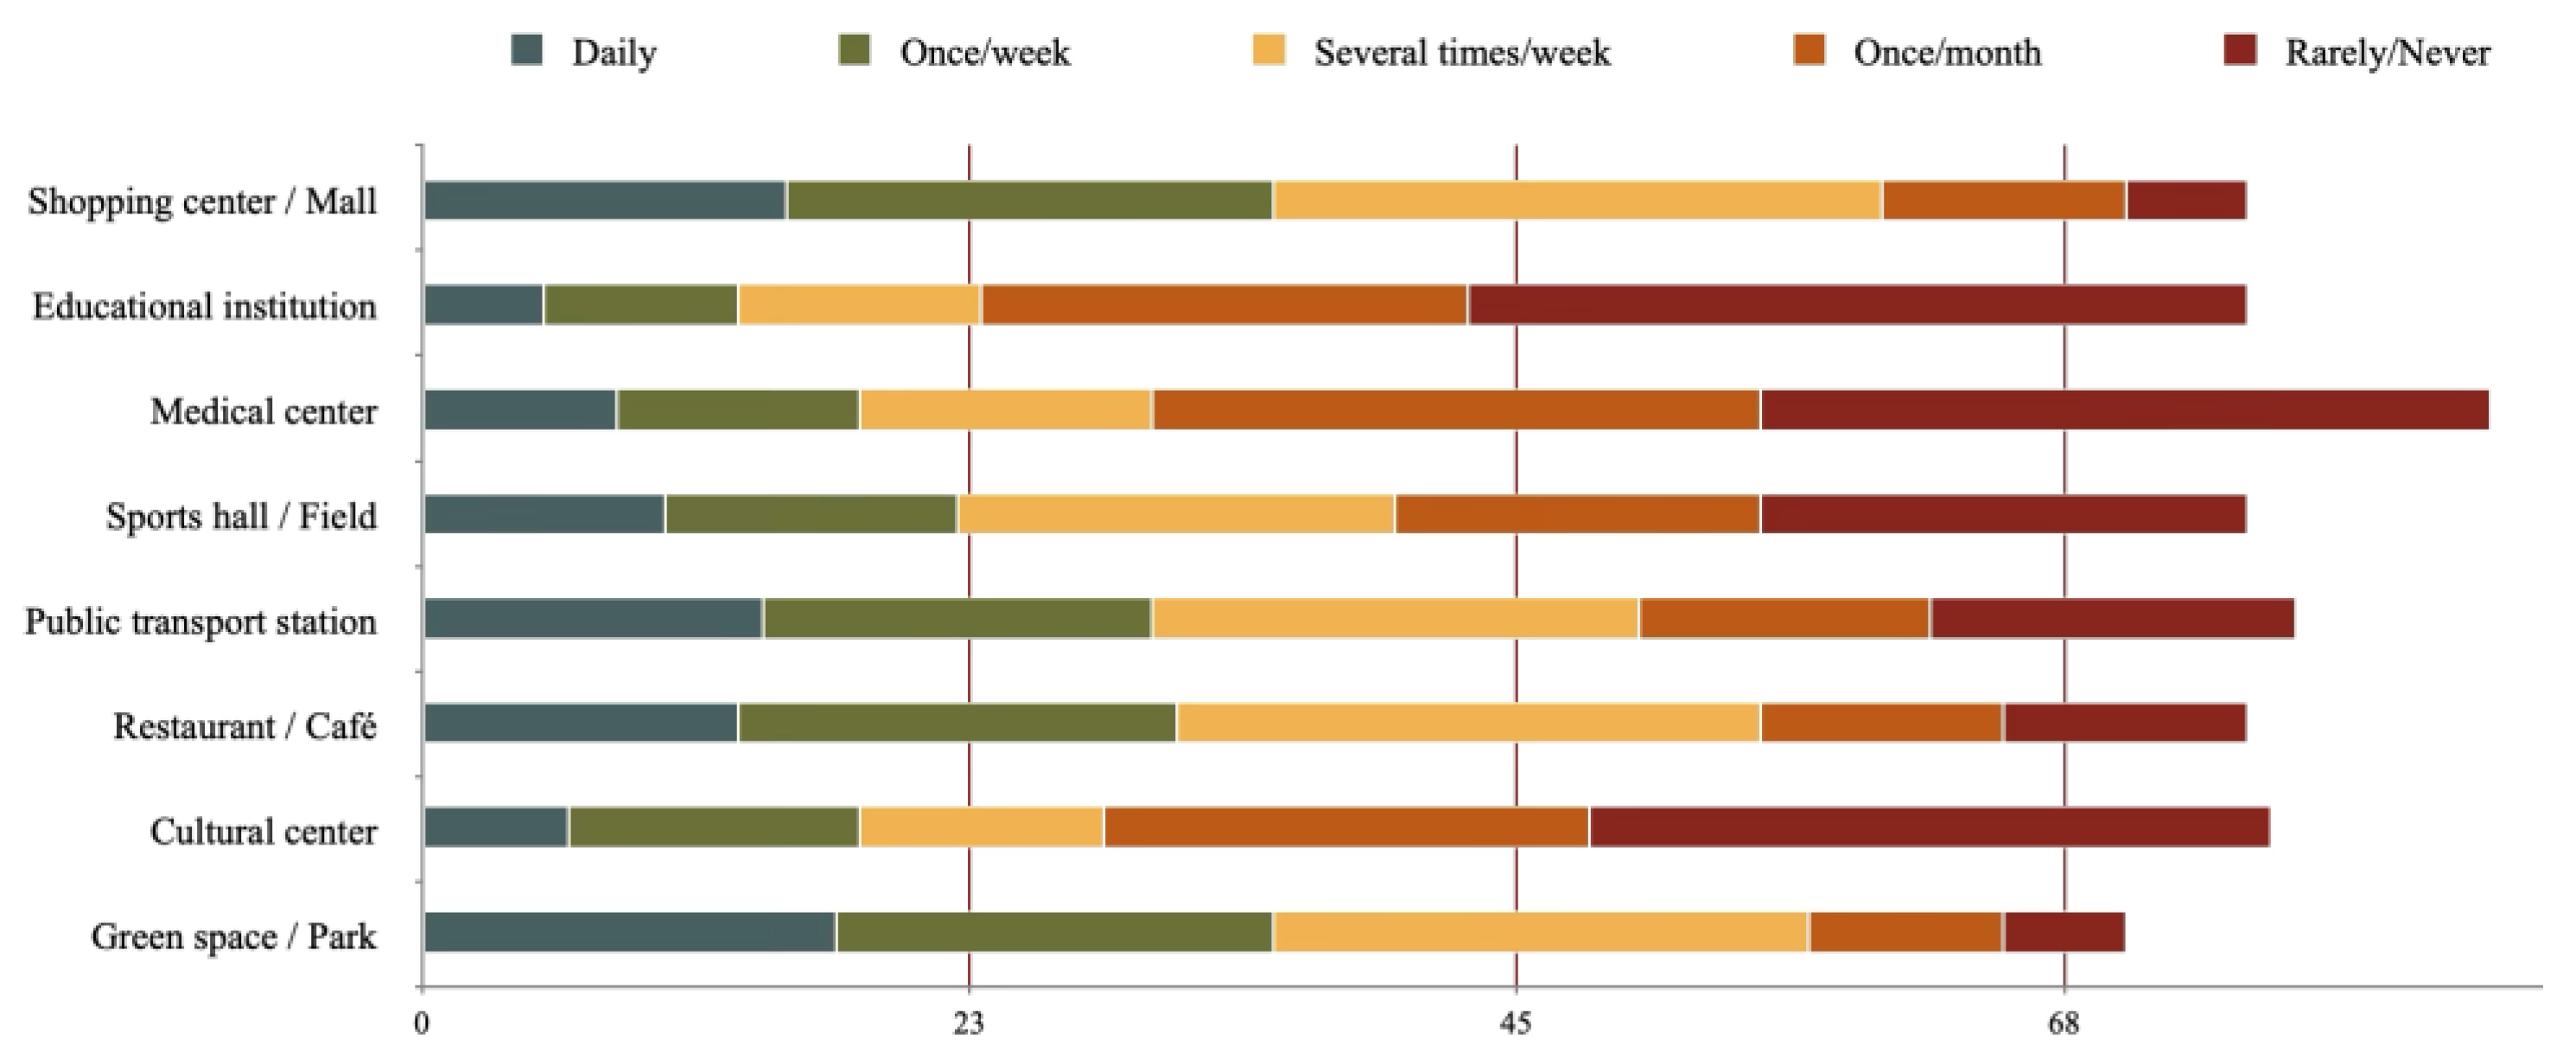
In each of these areas, three specific destinations were analyzed: one commercial (supermarket) marked with color yellow on Figure 9 and Figure 10, one medical (clinic) marked with color red on Figure 9 and Figure 10, and one recreational (park) marked with color green on Figure 9 and Figure 10. Figure 11 has them all located in the same area due to the urban concept of functional proximity: co-located in the same compact urban space, named Iulius Town. The hatched zone represents the area that can be covered in approximately 15 minutes by each category of individuals: non-disabled and disabled having in consideration their proximal walk speed as explained in subchapter 3.2. By merging the surfaces resealting from each analyzed amenity, the area used for micro-mapping was defined, marked in soft yellow (Figure 9, Figure 10 and Figure 11).
The purpose of this micro-scale assessment is to analyze the functional accessibility of the routes leading to and surrounding these destinations, with a particular focus on how different groups of users — people without disabilities, people with visual impairments, and people with mobility impairments — experience the urban environment. Through field observations and photographic documentation, each location was assessed according to a weighted scoring system, developed in line with survey data and inclusive design criteria from the literature. The resulting scores reflect the presence, partial implementation or absence of essential 15 minutes city’ features, providing a more realistic picture of usability beyond spatial proximity.
3.3.1. Iosefin / Bălcescu
In the Elisabetin neighborhood, pedestrian accessibility was assessed for three user groups based on field observations and photographic documentation (Figure 9). The analysis used three essential criteria for each group and a standardized scoring system (0 = absent, 0,5 = present but improvised/incomplete, 1 = fully functional). The destinations analyzed were: Profi supermarket (commercial), Mișa Clinic (medical) and Carmen Sylva Park (recreational).
Non-disabled Users: final score - 2 points out of 3 points:
- public lighting: some areas are poorly lit or have unevenly distributed light (photo C), especially around building corners or on side streets: 0,5 points out of 1 point;
- pleasant atmosphere: although the nearby park offers a relaxing atmosphere, the presence of groups standing in front of shops and the noise from traffic, especially near the Profi supermarket, affect comfort.: 0,5 points out of 1 point;
- cleanliness of the route: sidewalks are generally clean, without piles of garbage or construction debris – photo B (speed limiter) and photo F (tactile pavement) indicate decent maintenance: 1 point out of 1 point.
- Visually impaired users: final score - 1,5 out of 3 points:
- public lighting: inconsistent, especially near pedestrian crossings and corners – reduced visibility (photo C). 0,5 points out of 1 point;
- quality of walking surface: sidewalks have variable textures and obstacles such as scaffolding Photo A), but poorly marked bicycle lanes (Photo D): 0,5 points out of 1 point;
- Low interaction with traffic: There are tactile mats at pedestrian crossings (Photo F), but there are no acoustic signals (Photo H), making crossing unsafe: 0,5 points out of 1 point.
- Users with reduced mobility - final score: 1 out of 3 points:
- public lighting: same issues as for the other groups – photo C shows poor lighting in key areas - 0,5 points out of 1 point;
- presence of street furniture: there are no observable benches or rest areas on the analyzed segment – none of the images show such facilities - 0 points out of 1 point;
- surface quality: Photo E and Photo G confirm the existence of ramps that facilitate access, but Photo A also indicates occasional obstacles (construction scaffolding). The surface is uneven in some areas - 0,5 points out of 1 point.
These results highlight the need for targeted infrastructure interventions that go beyond basic compliance and ensure inclusive and dignified access in all three locations assessed: the Profi supermarket, the Micsa clinic, and the Carmen Sylva park.
3.3.2. City Center
In the central area of Timisoara (Figure 10), the analysis targeted three frequented public destinations, identified in the initial questionnaire: the Mega Image supermarket (commercial), the Medicover Clinic (medical) and the Civic Park (recreational). These are located around Libertății Square, an area with a high density of urban services and constant pedestrian flow. Although the spatial proximity seems excellent, the functional assessment of accessibility highlighted important differences between user groups.
Non-disabled users - final score: 2,5 out of 3 points
- Public lighting: In central areas, lighting is adequate, but on side streets, rich vegetation and irregular positioning of poles reduce visibility (Photo C). - 0,5 points out of 1 point;
- Pleasant atmosphere: Lively public spaces, the presence of cultural events and intense commercial activity contribute to a positive experience (Photo D) - 1 point out of 1 point;
- Cleanliness: Sidewalks and pedestrian areas are well maintained, without visible litter, contributing to a perception of urban quality - 1 point out of 1 point.
Visually impaired users - final score: 1,5 out of 3 points
- public lighting: although the main streets are well lit, the uneven lighting on secondary routes creates difficulties in spatial orientation (Photo C) - 0,5 points out of 1 point;
- quality of walking surface: Sidewalks are often obstructed by obstacles such as low signal poles (Photo B), trees or disorganized street furniture (Photo A). Tactile paving is sporadically present (Photo G) - 0,5 points out of 1 point;
- low interaction with traffic: The pedestrian crossing at the Cathedral has no acoustic signal (Photo H), and this is repeated at other major intersections - 0,5 points out of 1 point.
Users with reduced mobility - final score: 1,5 out of 3 points:
- public lighting: visibility is reasonable, but lighting problems on adjacent streets can affect the safety of people in wheelchairs or with walking difficulties (Photo C) - 0,5 points out of 1 point;
- presence of street furniture: benches and rest areas are present, but not always accessible or comfortable for users with disabilities (Photo F) - 0,5 points out of 1 point;
- surface quality: ramps are present in many places (not directly illustrated in the images), but stairs at some entrances (Photo E) with limited access for wheelchairs. Sidewalks are generally free of significant obstacles - 0,5 point out of 1 point.
3.3.3. Iulius Town / Circumvalatiunii
The Circumvalațiunii–Iulius Town area (Figure 11), located in the north-eastern sector of Timișoara, is a relatively new and rapidly developing neighbourhood, characterised by wide boulevards, mixed-use developments and newly built infrastructure. This modern urban configuration contributes positively to both the overall usability and inclusiveness of the environment.
Non-disabled users - final score: 3 points out of 3 points:
- public lighting: combines cool and warm light sources, from street and commercial lighting (photo C). Excellent visibility even at night - 1 point;
- pleasant atmosphere: the area is lively, safe and well-maintained. Green spaces, terraces and commercial activity create a positive urban setting (photo A) - 1 point;
- cleanliness: the entire area has been recently modernized and cleanliness is evident on the sidewalks and public spaces (photo A) - 1 point.
Visually impaired users - final score: 2,5 out of 3 points
- public lighting: Ensures adequate visibility for orientation and personal safety - 1 point out of 1 point;
- quality of walking surface: The sidewalks are wide, flat, without obstacles, facilitating movement (Photo D). Tactile pavement is present, but implemented unevenly (Photo C & E) or intersected by poorly demarcated bike lanes (Photo F) - 0,5 points out of 1 point;
- low interaction with traffic: all traffic lights in the area have functional acoustic signals (Photo B) - 1 point out of 1 point.
Users with reduced mobility - final score: 2,5 out of 3 points:
- public lighting: Good visibility along the entire route - 1 point out of 1 point;
- presence of urban furniture: Formal benches are missing in some areas, but there are improvised options (planter edges, low platforms) - 0,5 points out of 1 point;
- surface quality: ramps are functional, without high curbs or narrow alleys, which allows easy access to all functions - 1 point out of 1 point.
The following Table 3 presents the detailed results of the accessibility scores for each public destination assessed in the three areas, based on on-site assessments conducted using a standardized analysis grid.
The spatial scoring method applied in this study highlights a significant discrepancy between theoretical proximity and actual functional accessibility for people with disabilities in Timișoara. Although radial maps suggest extensive coverage of public services for non-disabled users, analysis based on low travel speeds and direct observations indicates numerous physical and sensory barriers that limit effective access.
Central areas, such as Piața Libertății and adjacent streets, score high in terms of proximity and density of services. However, orientation facilities for people with visual impairments are almost non-existent: tactile pavements are missing, tactile landmarks are inconsistent, and traffic lights are not equipped with acoustic signals. In addition, street obstacles (low fountains, non-compliant signs, fragmented sidewalks) affect the autonomy of these people, despite the active urban atmosphere. In contrast, recent urban developments such as Iulius Town offer modern infrastructure, efficient lighting and wide sidewalks, which are conducive to people with reduced mobility. However, the absence of formal street furniture and standardized tactile markings shows that physical modernity is not equivalent to universal inclusion. Accessibility for blind people remains a neglected priority, even in architecturally performing areas. Older residential areas, such as Piața Bălcescu, have a mixed profile. Although there are ramps, they are often blocked by parked cars, and essential elements for navigation by people with disabilities (tactile paving, ergonomic benches, clear signage) are completely missing. In addition, negative perceptions of safety and cleanliness affect even non-disabled users, highlighting that inclusivity is not only a matter of infrastructure, but also of the perceived quality of public space.
4. Limits
In writing this article, the author acknowledges that the work reflects an ongoing personal and professional evolution. The study was developed over a long period of time, and the questionnaire initially used contained ambiguous wording, which betrayed a lack of clear direction at the time of its conception. Subsequently, the interaction with Simona (fictitious name, female), a blind user, brought about a fundamental change in perspective. The discussions revealed that the needs of people with visual impairments do not align with the generic principles of the 15-minute city model, as defined by Carlos Moreno [1] and presented in Figure 2.
For example, characteristics such as density of services, diversity of functions and urban mix are relevant for the general population, but less useful for a person with visual impairments. Instead, the following elements would have been much more relevant and should have been included in the questionnaire:
- presence of continuous tactile or audible landmarks;
- clarity of chromatic contrast for signs;
- uniform and coherent tactile paving;
- functional audible signaling at pedestrian crossings;
Elimination of unpredictable obstacles in the walking area (e.g. extended terraces, potholes, unstable furniture).
These conceptual and methodological limitations must be acknowledged. Also, the micro-local score table does not follow a validated scientific standard, but is rather an exercise in critical observation, useful to identify and illustrate concretely the phenomenon of "false proximity" — that is, situations in which the physical proximity of services does not necessarily mean functional accessibility.
By combining perceptual data (from the questionnaire) and spatial data (GIS maps and score grids), the research suggests that urban planning must go beyond approaches based solely on distance. Accessibility must be rethought through the lens of autonomy, comfort and usability. Although the proposed scoring model is partly subjective and limited to three neighborhoods, it represents a useful starting point for broader and more precise assessments of urban inclusion.
5. Conclusions
This research analyzed the application of the “15-minute city” model in Timișoara, from the perspective of inclusive accessibility. Although this urban model proposes functional proximity between housing and essential services, the results obtained show that geographical proximity does not guarantee real access, especially for people with locomotor or sensory disabilities.
By combining spatial analyses (GIS), perception data collected through a questionnaire applied to 605 respondents, and field observations, the study revealed major discrepancies between the analyzed groups. Theoretical access — illustrated by radial maps — is significantly diminished when low walking speeds and physical barriers are taken into account. In many cases, apparently “close” services become inaccessible in the absence of ramps, tactile paths, or audible signals.
The proposed methodology — based on the priorities expressed by users and adapted to different types of disabilities — provides a replicable framework for assessing real accessibility in an urban context. At the same time, this research highlighted the fact that, in Central and Eastern Europe, the legacy of communist infrastructure poses specific challenges: although oriented towards proximity, it has consistently neglected the principles of inclusive design.
An essential element of this research was the recognition of its limitations. The initial questionnaire, drafted at an early stage of the doctoral process, was ambiguously formulated, without a clear understanding of the specific needs of different types of users. Subsequently, direct interaction with a blind person (Simona, a female participant in the informal validation process) brought about an important change in perspective. It became apparent that many of the features promoted in the 15mC model — such as proximity to commercial services, green spaces or schools — are not, in themselves, relevant for people with visual impairments. For these, spatial orientation, lack of tactile obstacles, continuity of pavement and safety of crossing become much more important than distances themselves.
Also, the scoring system applied for the evaluation of the urban micro-scale does not respect all scientific rigors, being designed more as an exercise in critical observation. However, it was useful in highlighting the concept of “false proximity” — situations in which geographical proximity does not translate into functional accessibility.
In the future, it is necessary to:
- revise the research instruments (especially the questionnaire),
- extend the analysis to other urban functions and interior spaces,
- integrate direct participatory components, through the active involvement of people with disabilities in validating the results,
- use digital tools (applications, sensors, interactive maps) to obtain additional objective data on real mobility experiences.
In conclusion, urban life “in 15 minutes” remains, for many vulnerable users, more an aspiration than a reality. Urban proximity needs to be rethought as a multidimensional construct, encompassing equity, usability and perception. Only by aligning spatial planning with the principles of inclusive design and participatory assessment can the 15mC concept become truly democratic and accessible to all city dwellers.
Abbreviations
The following abbreviations are used in this manuscript:
| MDPI | Multidisciplinary Digital Publishing Institute |
| DOAJ | Directory of open access journals |
| TLA | Three letter acronym |
| LD | Linear dichroism |
| 15mC | 15-Minute City |
| GIS | Geographic Information System |
| NSW | Normal-Speed Walk |
| SSW | Slow-Speed Walk |
| OSM | OpenStreetMap |
| ToD | Transit-oriented Development |
| UD | Universal Design |
| ITDP | Institute for Transportation and Development Policy |
| PI | Proximity Index (dacă ai folosit un indice compozit de proximitate) |
| VI | Visually Impaired |
| MI | Mobility Impaired |
| ND | Non-Disabled |
References
- S. Brain, “The 15 minutes-city: for a new chrono-urbanism! - Pr Carlos Moreno,” Carlos Moreno. Accessed: , 2025. [Online]. Available: https://www.moreno-web. 17 June.
- Papas, T.; Basbas, S.; Campisi, T. Urban mobility evolution and the 15-minute city model: from holistic to bottom-up approach. Transp. Res. Procedia 2023, 69, 544–551. [Google Scholar] [CrossRef]
- C40 Cities Climate Leadership Guide. How to Build Back Better with a 15-Minute City: Implementation Guide. C40 Cities. 2020. Available online: https://www.c40knowledgehub.org/s/article/How-to-build-back-better-with-a-15-minute-city?language=en_US (accessed on day month year).
- Garden Cities of To-Morrow, by Ebenezer Howard--The Project Gutenberg eBook.” Accessed: , 2025. [Online]. Available: https://www.gutenberg.org/files/46134/46134-h/46134-h. 17 June.
- P. Calthorpe, The next American metropolis : ecology, community, and the American dream. New York : Princeton Architectural Press, 1993. Accessed: , 2025. [Online]. Available: http://archive. 17 June 0000.
- Vais, D. Type Projects as Tools: Housing Type Design in Communist Romania. Arch. Hist. 2020, 8. [Google Scholar] [CrossRef]
- The In-between Space: Romanian Mass Housing Public Space as a Playground in the Collective Memory | Docomomo Journal.” Accessed: , 2025. [Online]. Available: https://docomomojournal.com/index. 17 June.
- L. Artieda, M. L. Artieda, M. Allan, R. Cruz, S. Shah, and V. S. Pineda, “Access and Persons with Disabilities in Urban Areas”.
- Barriers to disabled travel eased in 15-minute cities.” Accessed: , 2025. [Online]. Available: https://www.movinonconnect. 17 June.
- The role of GIS in promoting the 15-minute city concept for Sustainabl’ by Eman Metwally, Yara Menshway et al.” Accessed: , 2025. [Online]. Available: https://mej.researchcommons. 22 June.
- Caselli, B. From urban planning techniques to 15-minute neighbourhoods. A theoretical framework and GIS-based analysis of pedestrian accessibility to public services. Eur. Transp. Eur. 2021; 15. [Google Scholar] [CrossRef]
- Pour, N.M.; Partanen, J. Planning for the urban future: two-level spatial analysis to discover 15-Minute City potential in urban area and expansion in Tallinn, Estonia. J. Comput. Soc. Sci. 2024, 7, 777–807. [Google Scholar] [CrossRef]
- PDF) The 15-minute city: assumptions, opportunities and limitations.” Accessed: , 2025. [Online]. Available: https://www.researchgate. 22 June 3873.
- A universal framework for inclusive 15-minute cities | Nature Cities.” Accessed: , 2025. [Online]. Available: https://www.nature. 22 June 4428.
- Abbiasov, T.; Heine, C.; Sabouri, S.; Salazar-Miranda, A.; Santi, P.; Glaeser, E.; Ratti, C. The 15-minute city quantified using human mobility data. Nat. Hum. Behav. 2024, 8, 445–455. [Google Scholar] [CrossRef] [PubMed]
- PDF) Quantifying walkable accessibility to urban services: An application to Florence, Italy.” Accessed: , 2025. [Online]. Available: https://www.researchgate. 22 June 3908.
- Barriers and facilitators of public transport use among people with disabilities: a scoping review - PubMed.” Accessed: , 2025. [Online]. Available: https://pubmed.ncbi.nlm.nih. 22 June 3828.
- Chidiac, S.E.; Reda, M.A.; Marjaba, G.E. Accessibility of the Built Environment for People with Sensory Disabilities—Review Quality and Representation of Evidence. Buildings 2024, 14, 707. [Google Scholar] [CrossRef]
- Tanase and C., M. Povian, “Proximity to Priority_ the 15-Minute City Reframed for Timișoara – Survey-Based Study,” World Summit Civ. Eng.-Archit.-Urban Plan. Congr., p. 9, 2025.
- Wheelmap,” Wheelmap. Accessed: , 2025. [Online]. Available: https://wheelmap. 22 June.
- TravelTime Location API | Build Without Limits.” Accessed: , 2025. [Online]. Available: https://traveltime. 22 June.
- J. J. Fruin, Pedestrian planning and design. New York: Metropolitan Association of Urban Designers and Environmental Planners, 1971.
- Swenor, B.K.; Bandeen-Roche, K.; Muñoz, B.; West, S.K. Does Walking Speed Mediate the Association Between Visual Impairment and Self-Report of Mobility Disability? The Salisbury Eye Evaluation Study. J. Am. Geriatr. Soc. 2014, 62, 1540–1545. [Google Scholar] [CrossRef] [PubMed]
- Jahromi, M.N.; Samany, N.N.; Argany, M.; Mostafavi, M.A. Enhancing sidewalk accessibility assessment for wheelchair users: An adaptive weighting fuzzy-based approach. Heliyon 2024, 11, e41101. [Google Scholar] [CrossRef] [PubMed]
Figure 1.
Distribution of places in Timișoara where the questionnaire was conducted, source: QGIS data, author’s edit.
Figure 1.
Distribution of places in Timișoara where the questionnaire was conducted, source: QGIS data, author’s edit.
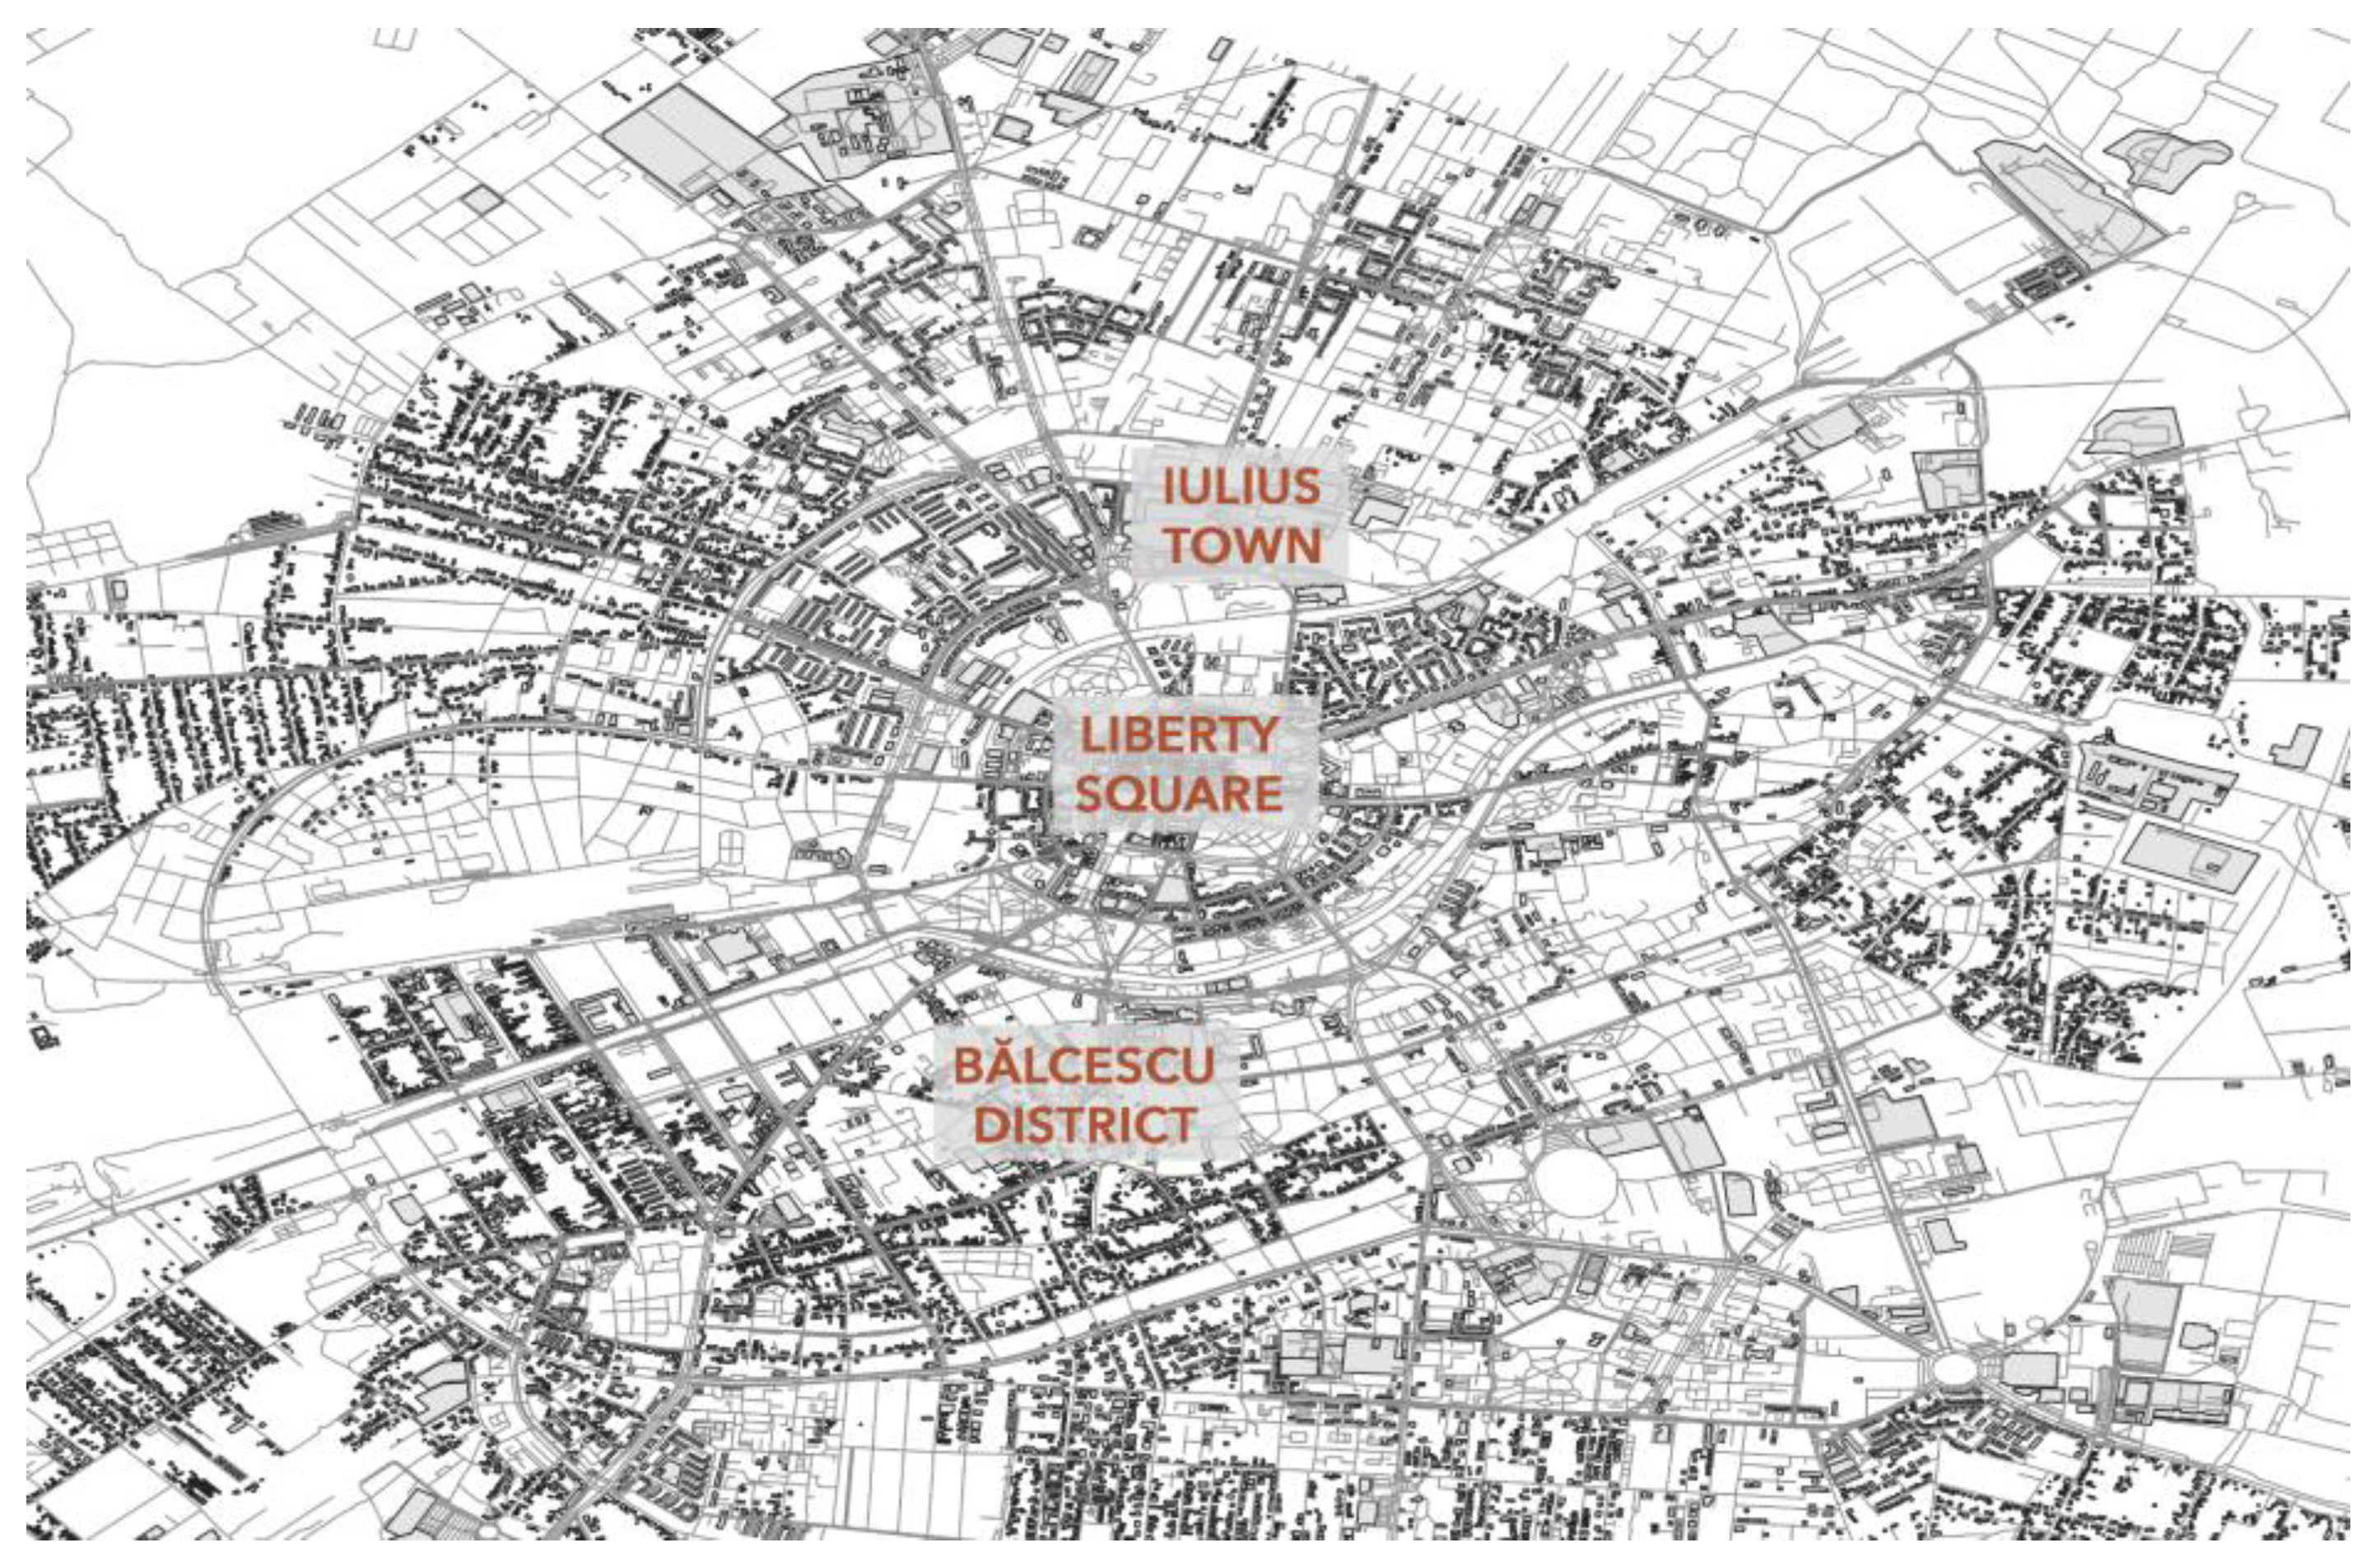
Figure 2.
Comparative Accessibility Criteria by User Groups with impairments (red-visual, n=44 or/and blue-mobility, n=36 and without impairments n=528), source: author representation, results from a conducted survey [19],.
Figure 2.
Comparative Accessibility Criteria by User Groups with impairments (red-visual, n=44 or/and blue-mobility, n=36 and without impairments n=528), source: author representation, results from a conducted survey [19],.
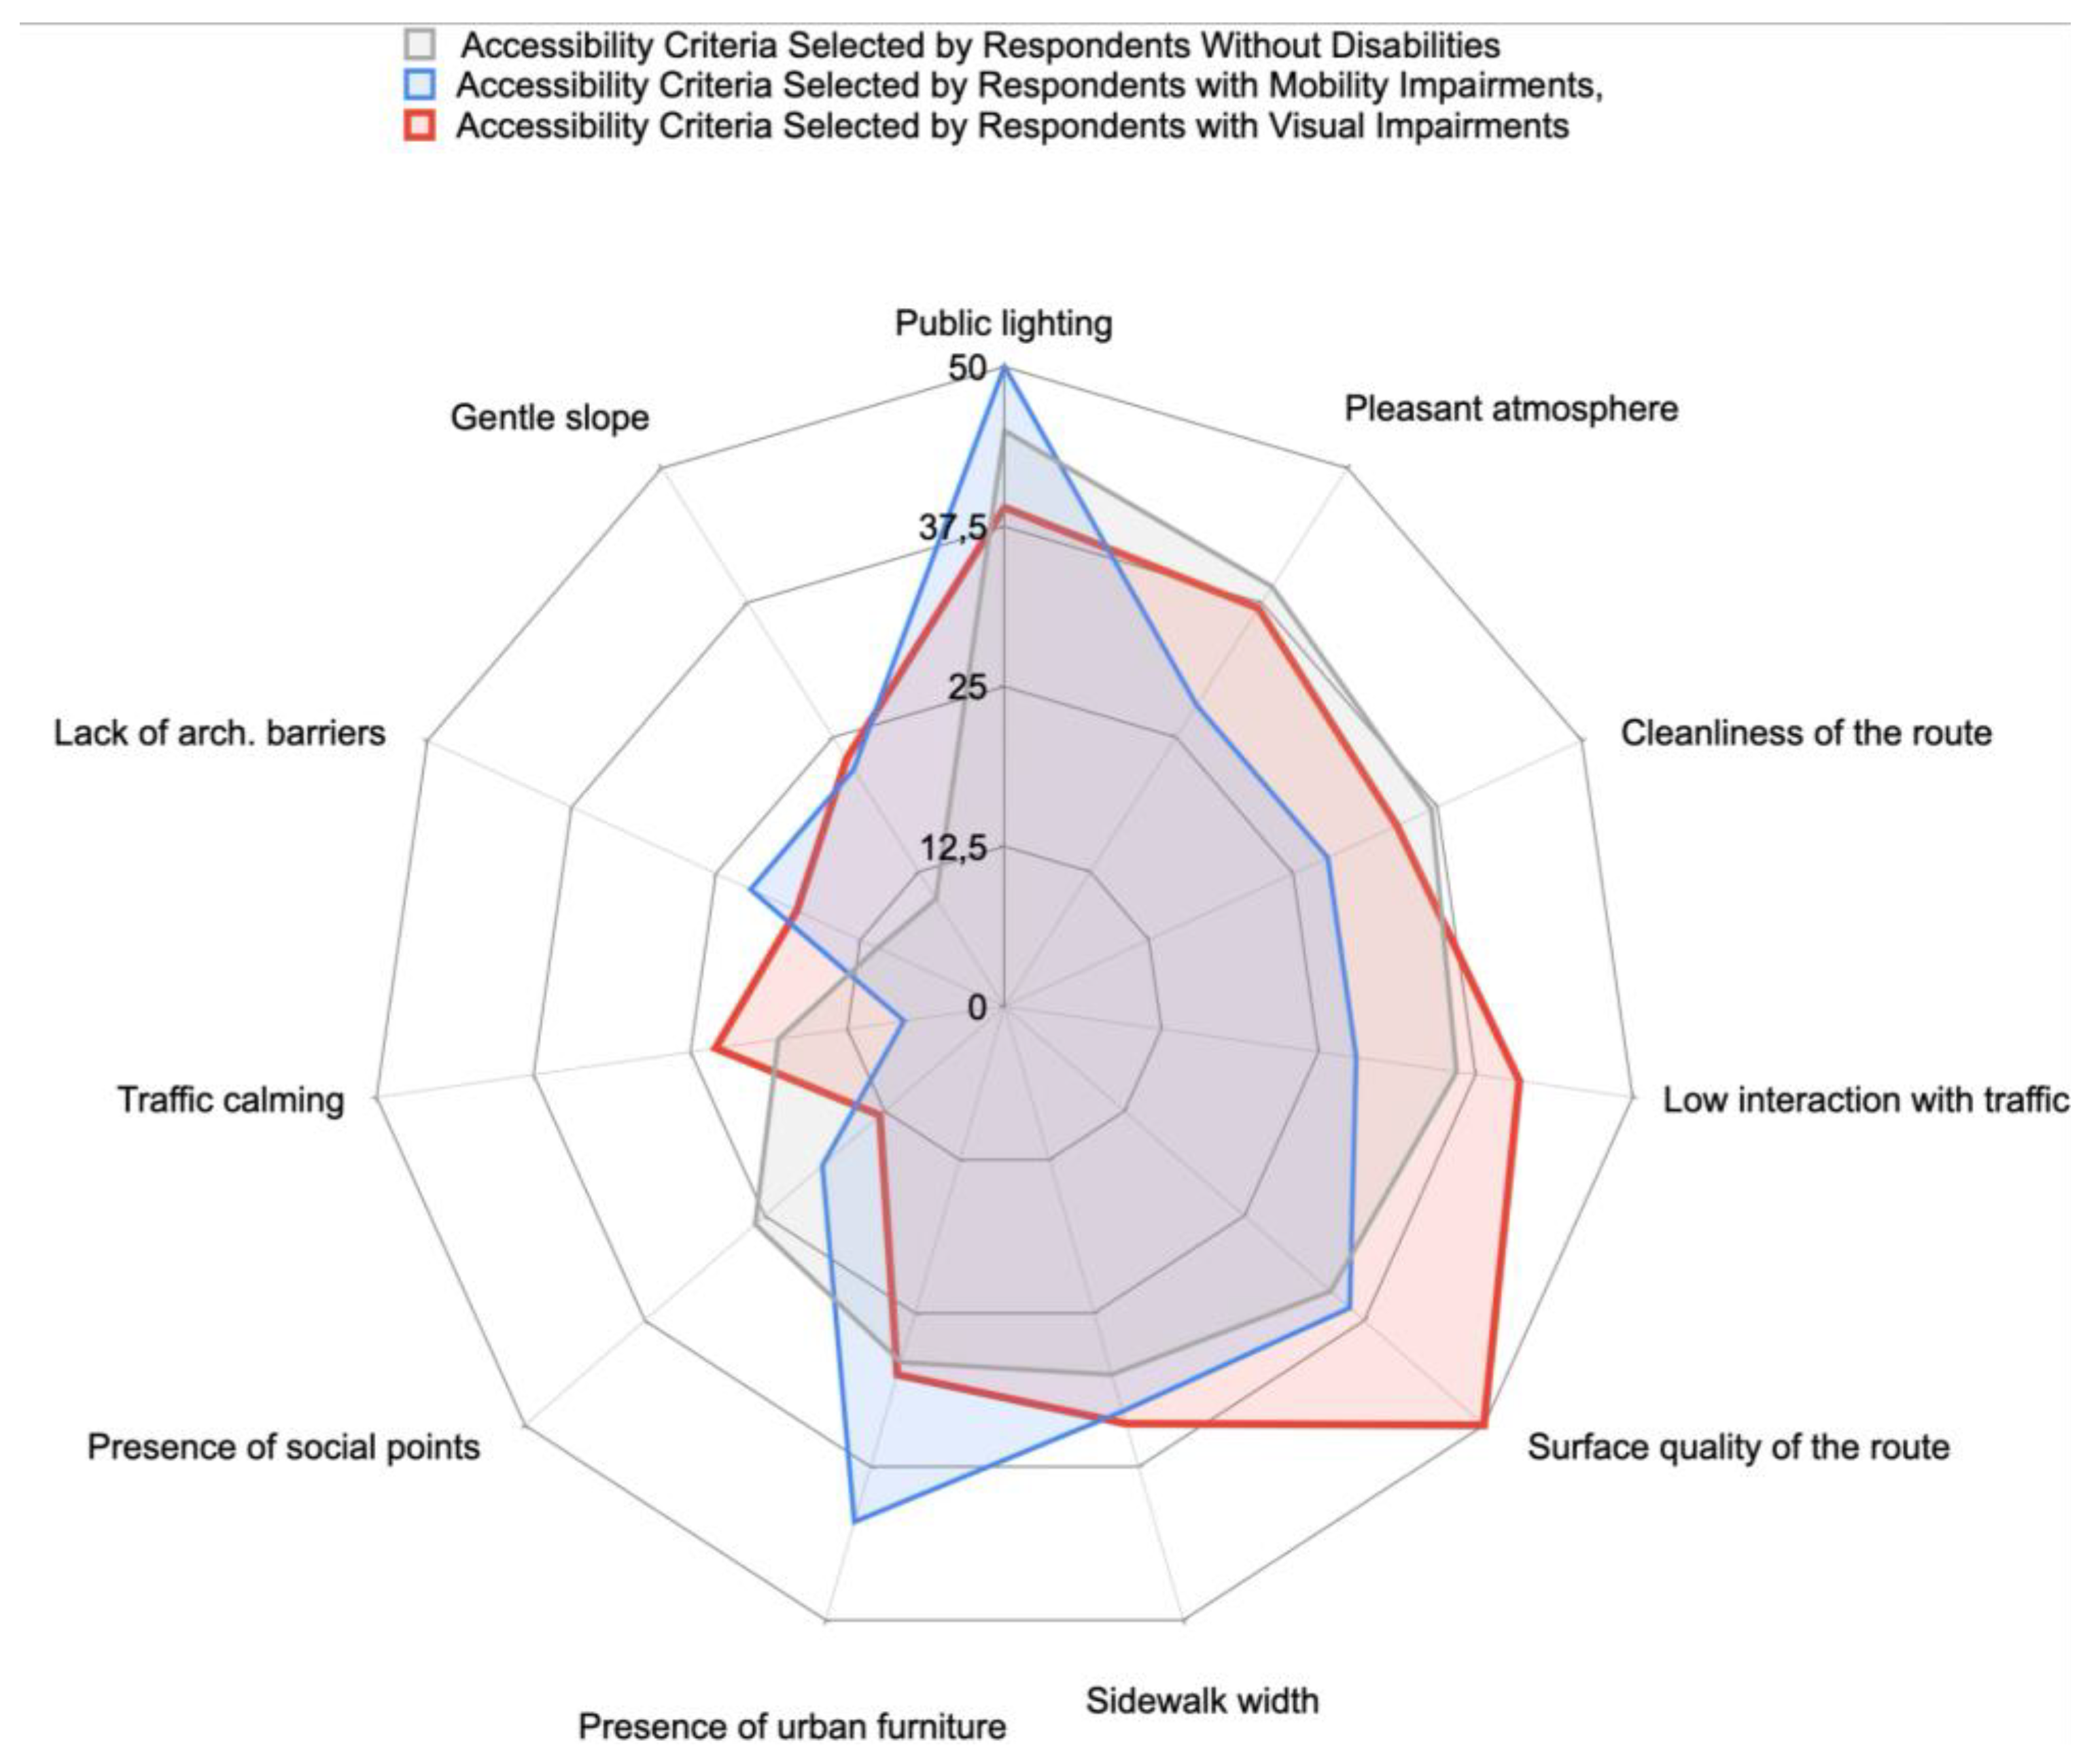
Figure 3.
Urban space preferences according to the public survey (N=605), data source: [19].
Figure 3.
Urban space preferences according to the public survey (N=605), data source: [19].
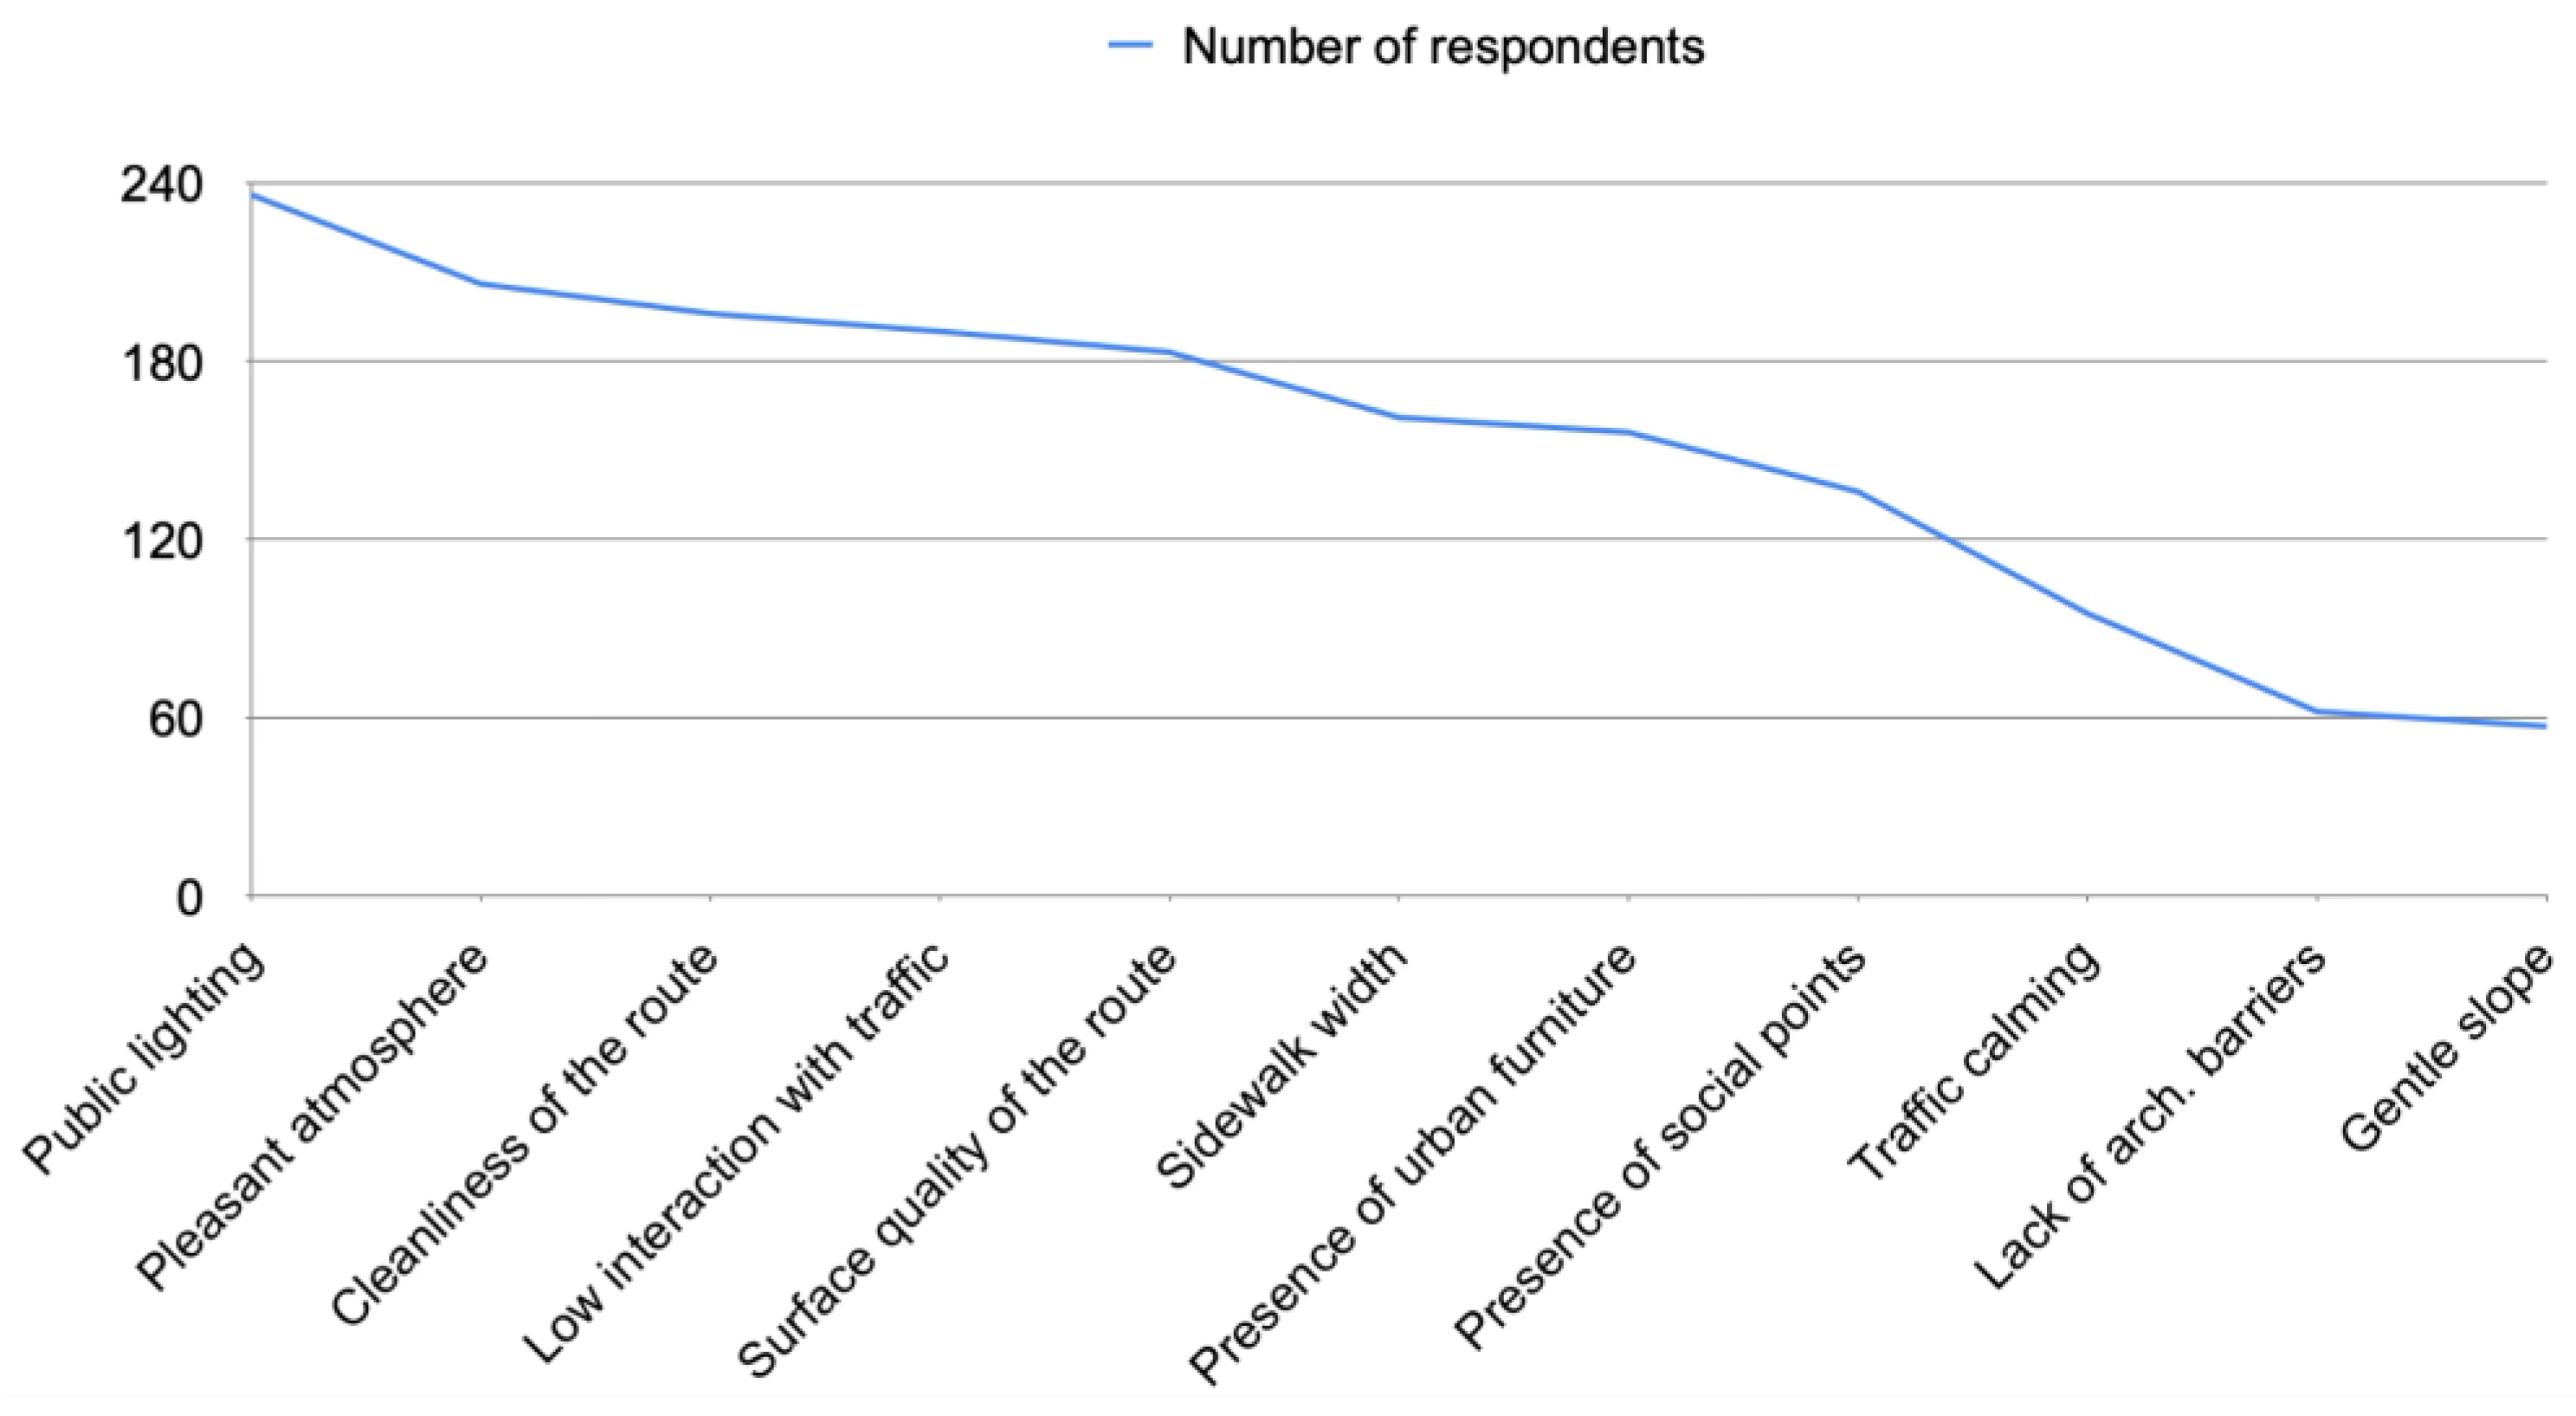
Figure 4.
Spatial coverage of supermarkets (Normal-speed walk – 15 minutes).
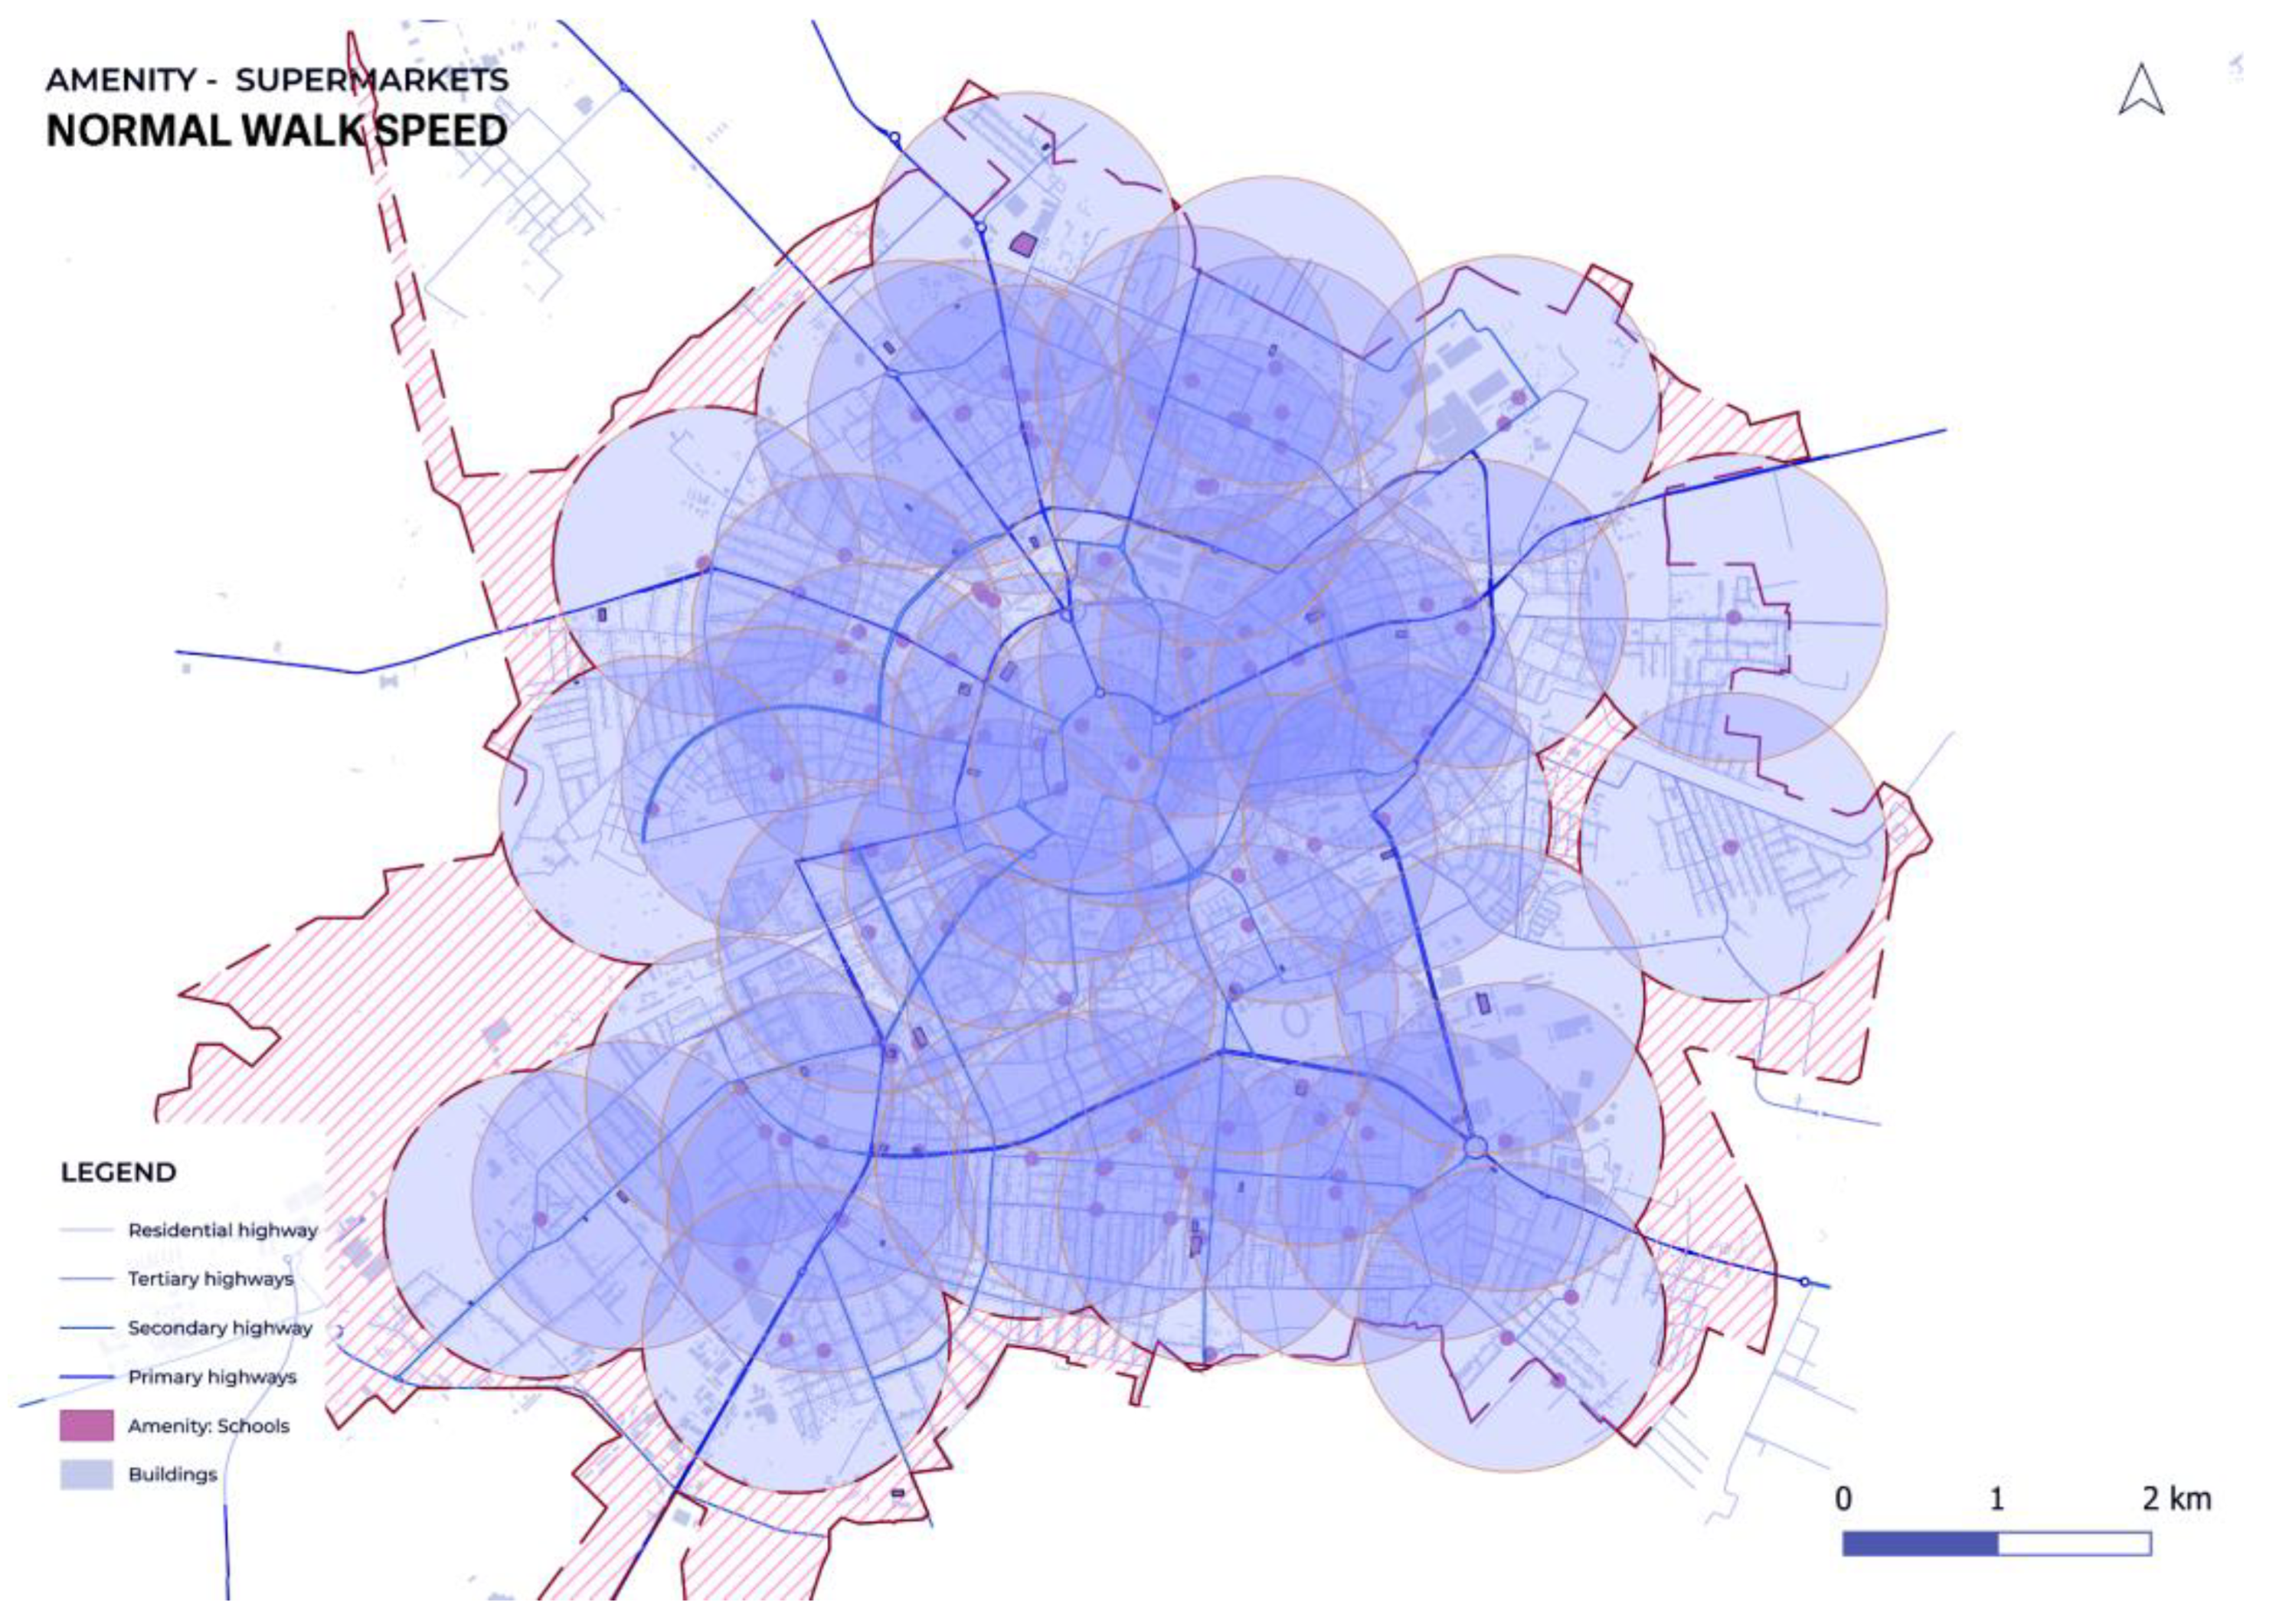
Figure 5.
Spatial coverage of supermarkets (Low-speed walk – 15 minutes).
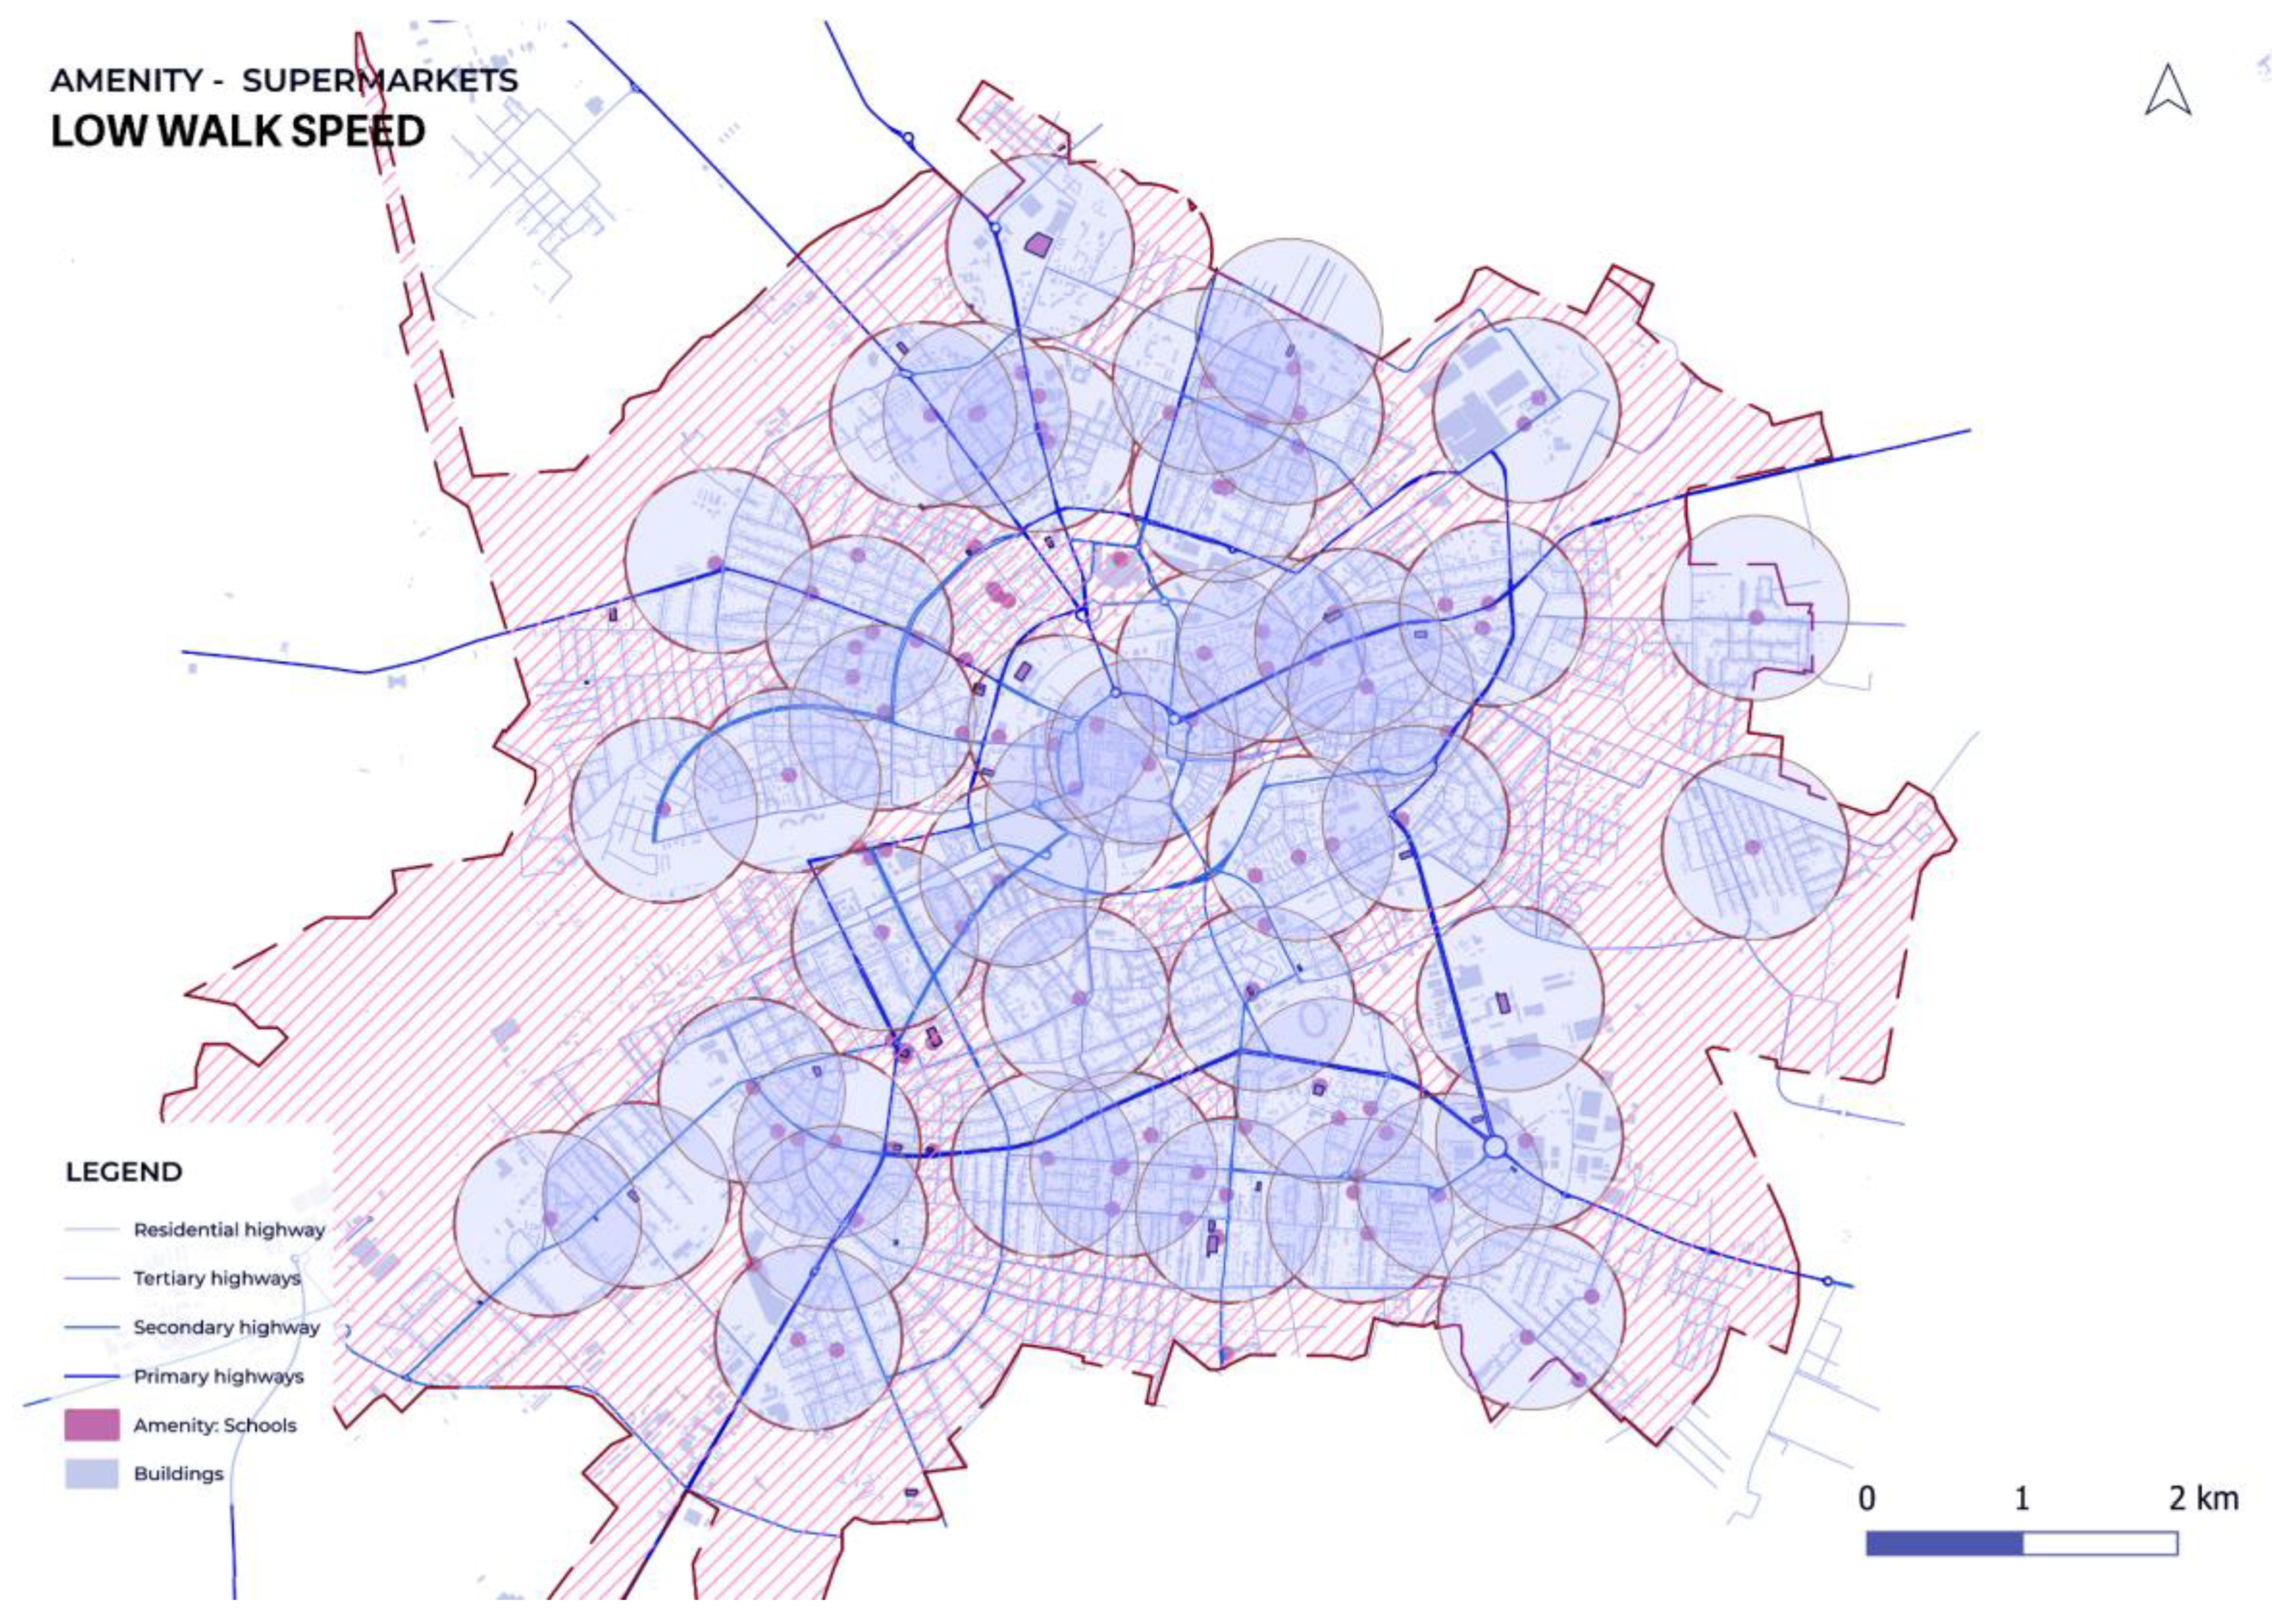
Figure 6.
Spatial coverage of medical centers (Normal-speed walk – 15 minutes).
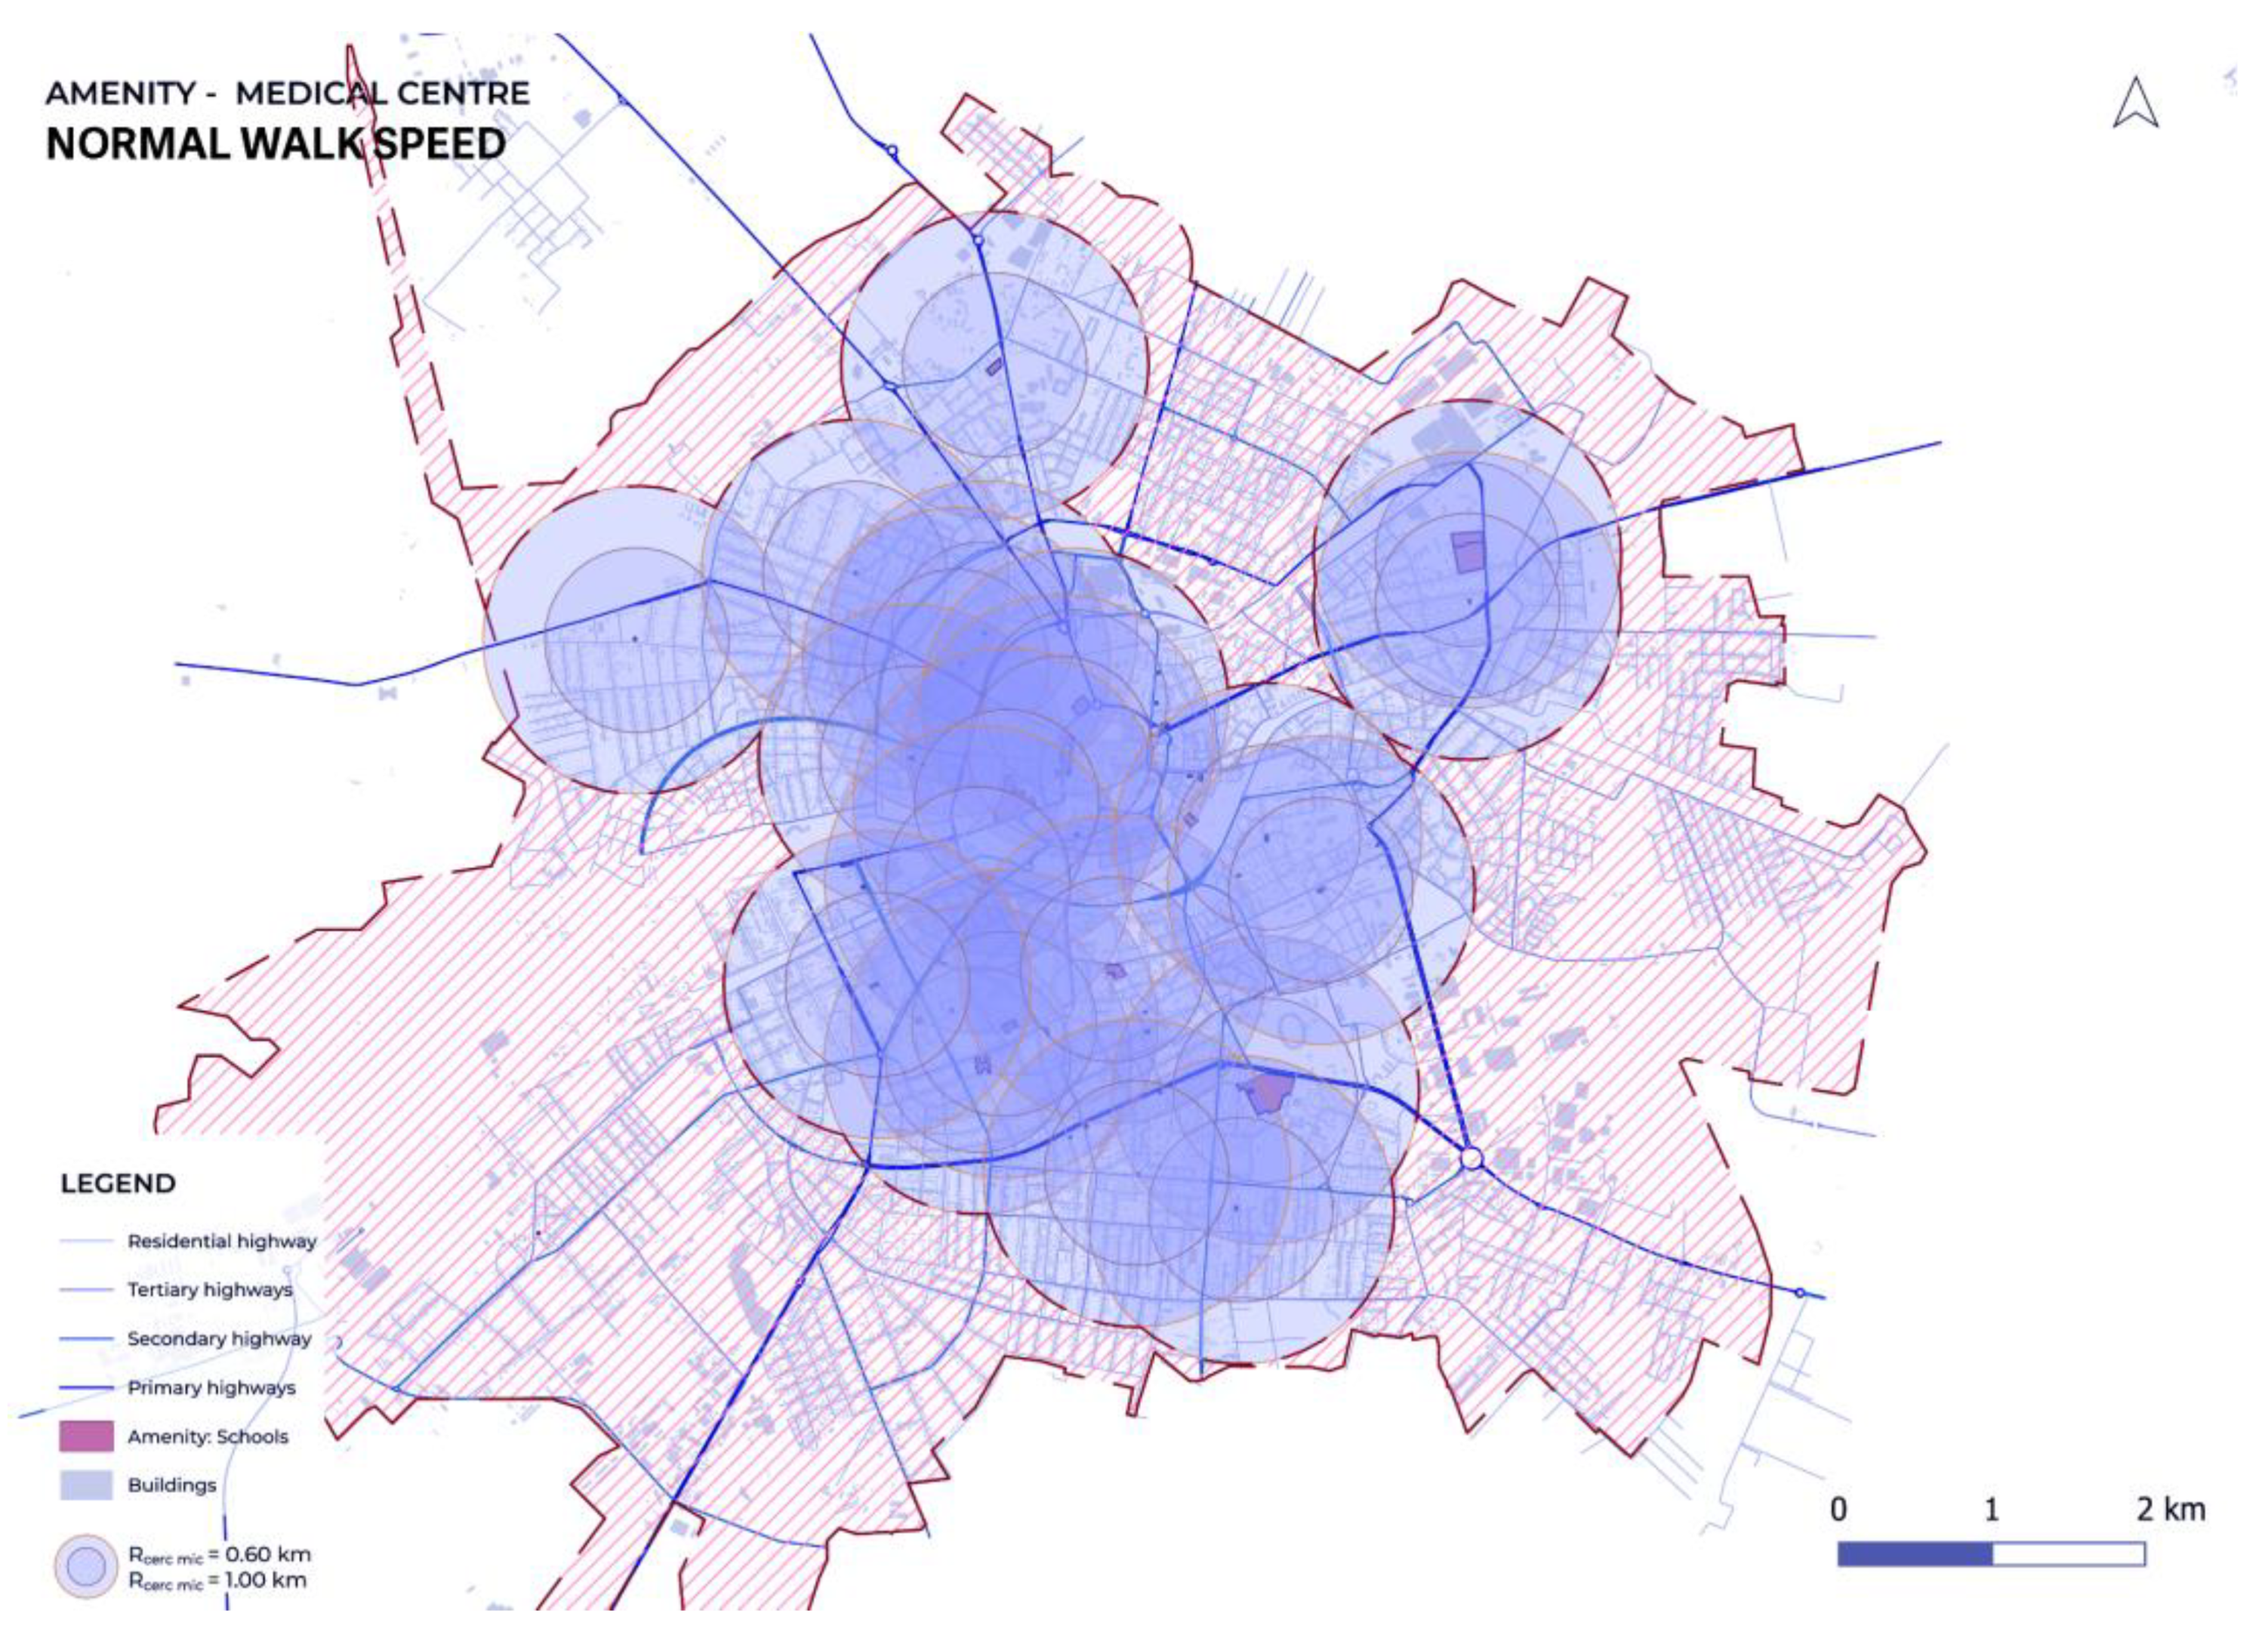
Figure 7.
Spatial coverage of medical centers (Slow-speed walk – 15 minutes, adjusted distance).
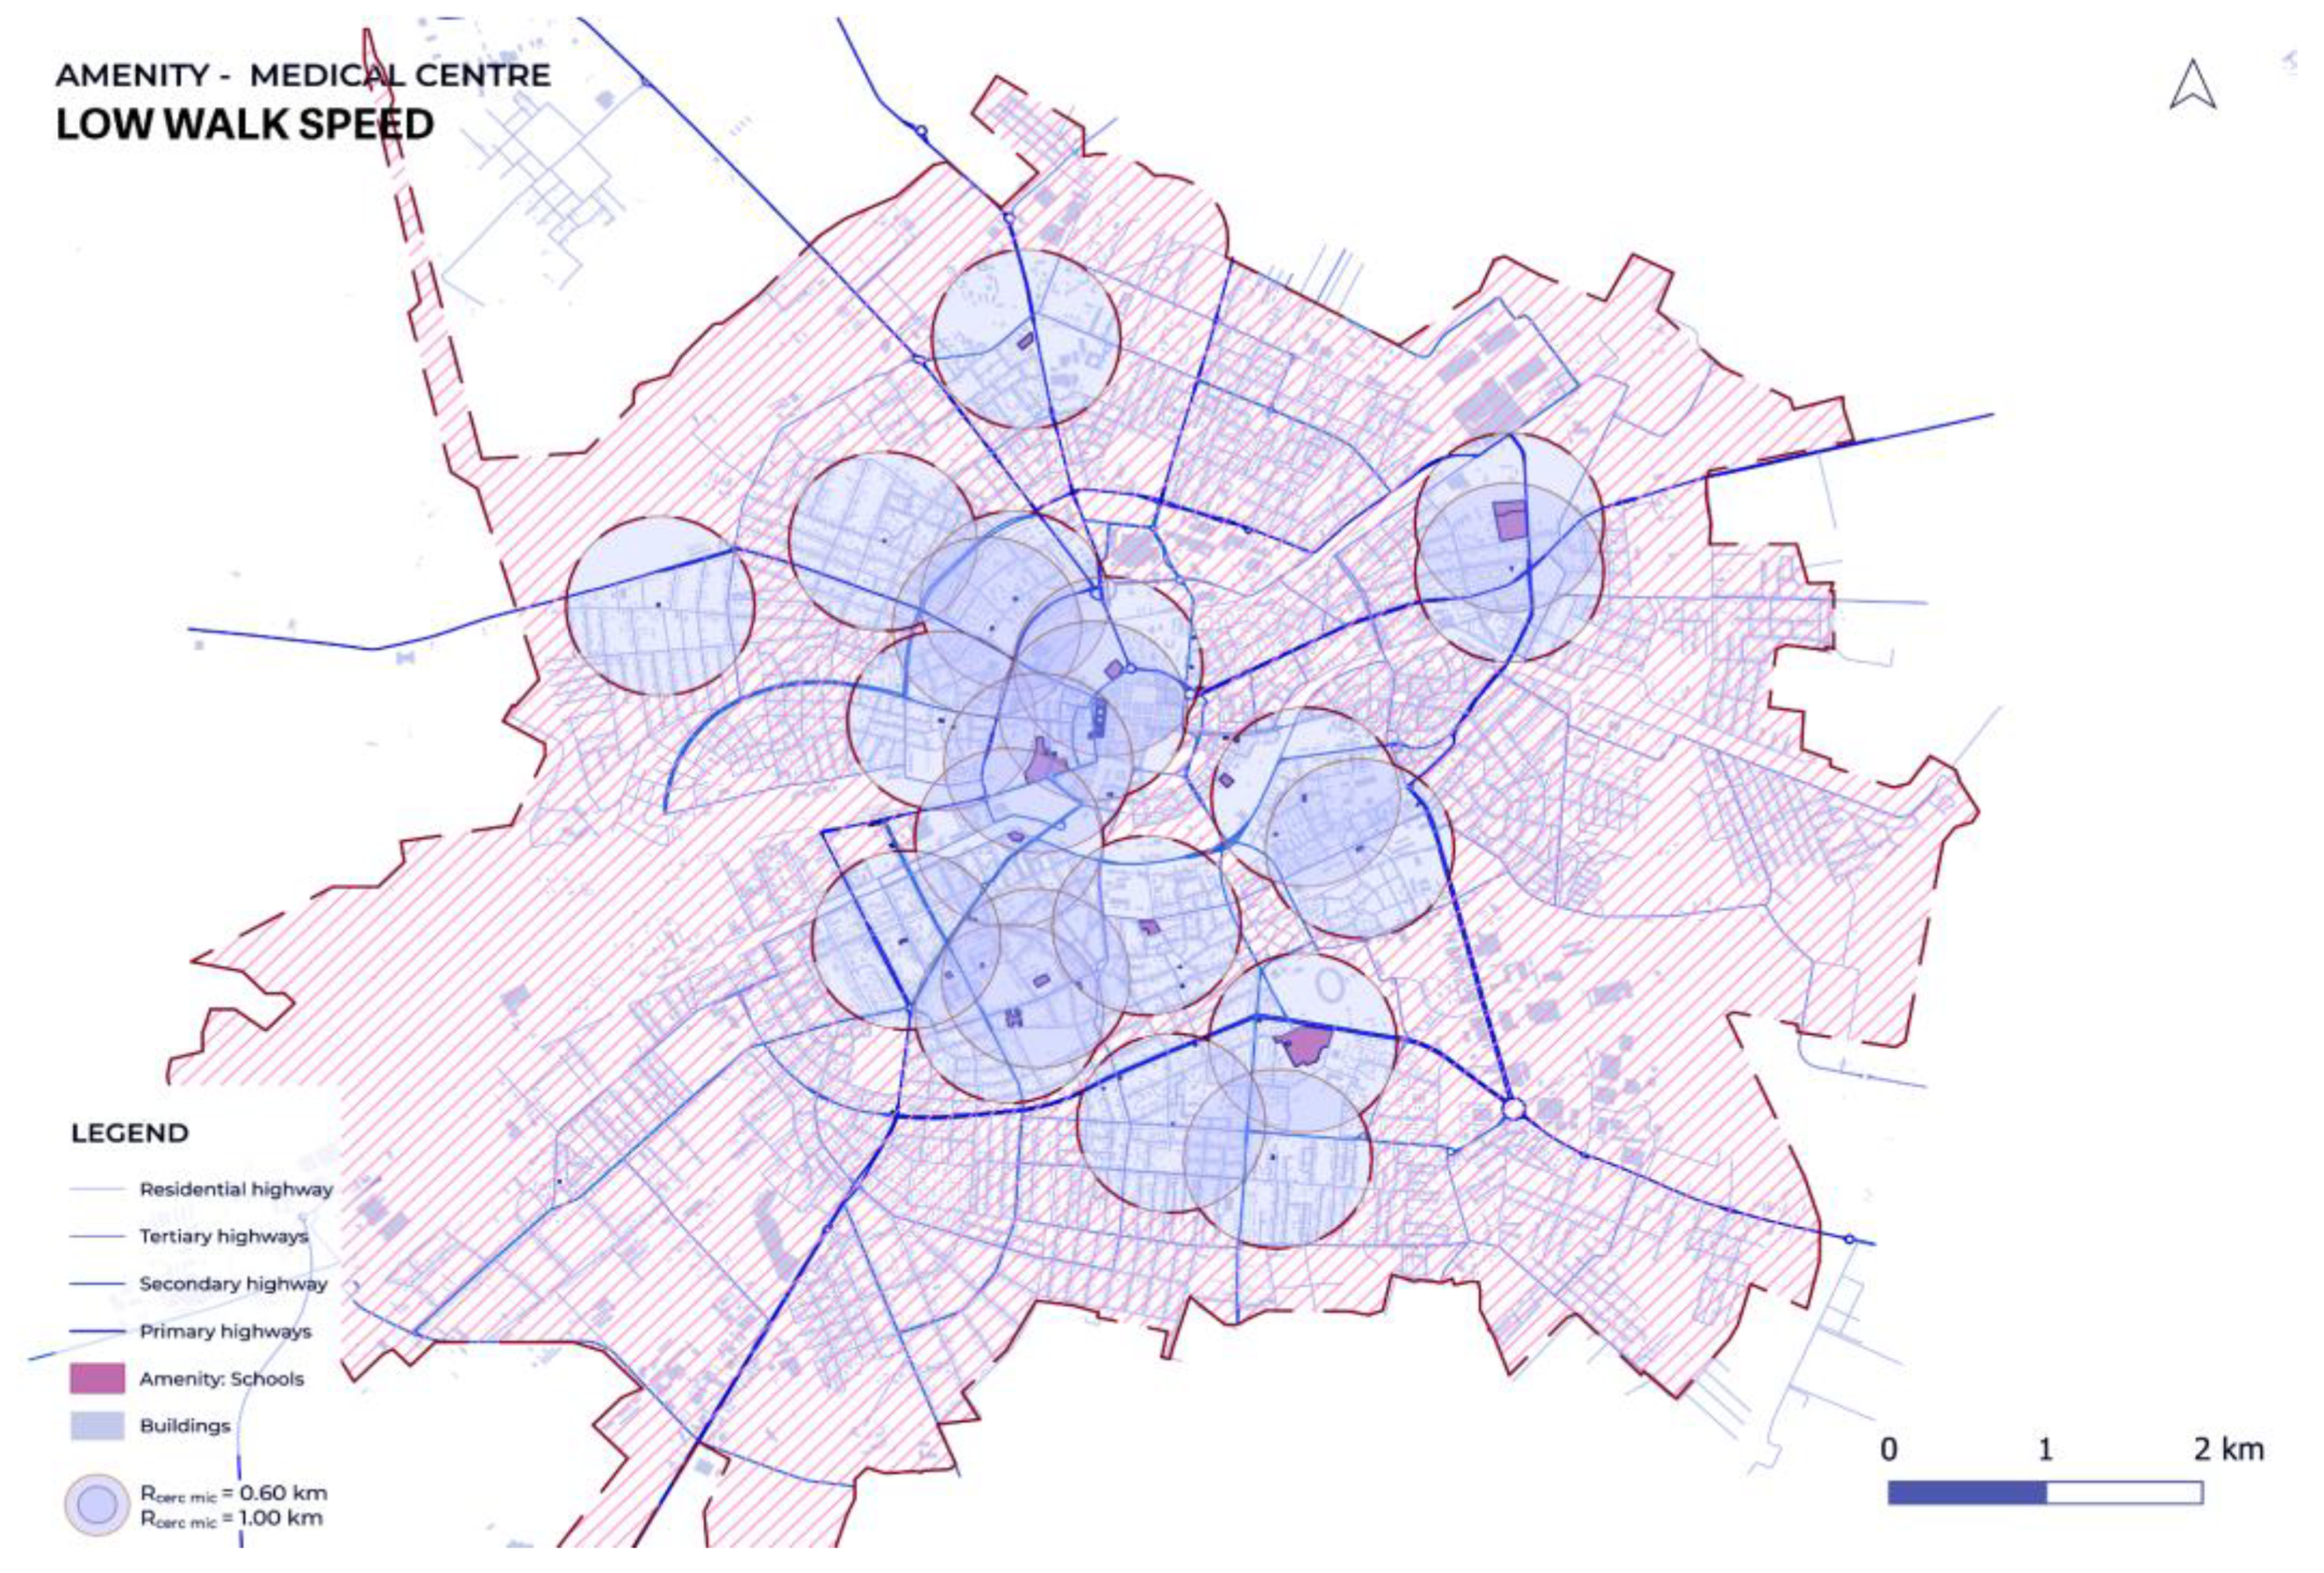
Figure 9.
Accessibility Evaluation in the Elisabetin District Based on Proximity and On-Site Observations for Normal and Slow Walking Speeds; A: road obstacle, B: presence of speed bump, C: poor lighting, D: unclear tactile demarcated bike line, E & G: presence of ramps, F: presence of tactile rug at the traffic light, H: lack of audible traffic signals at crossings.
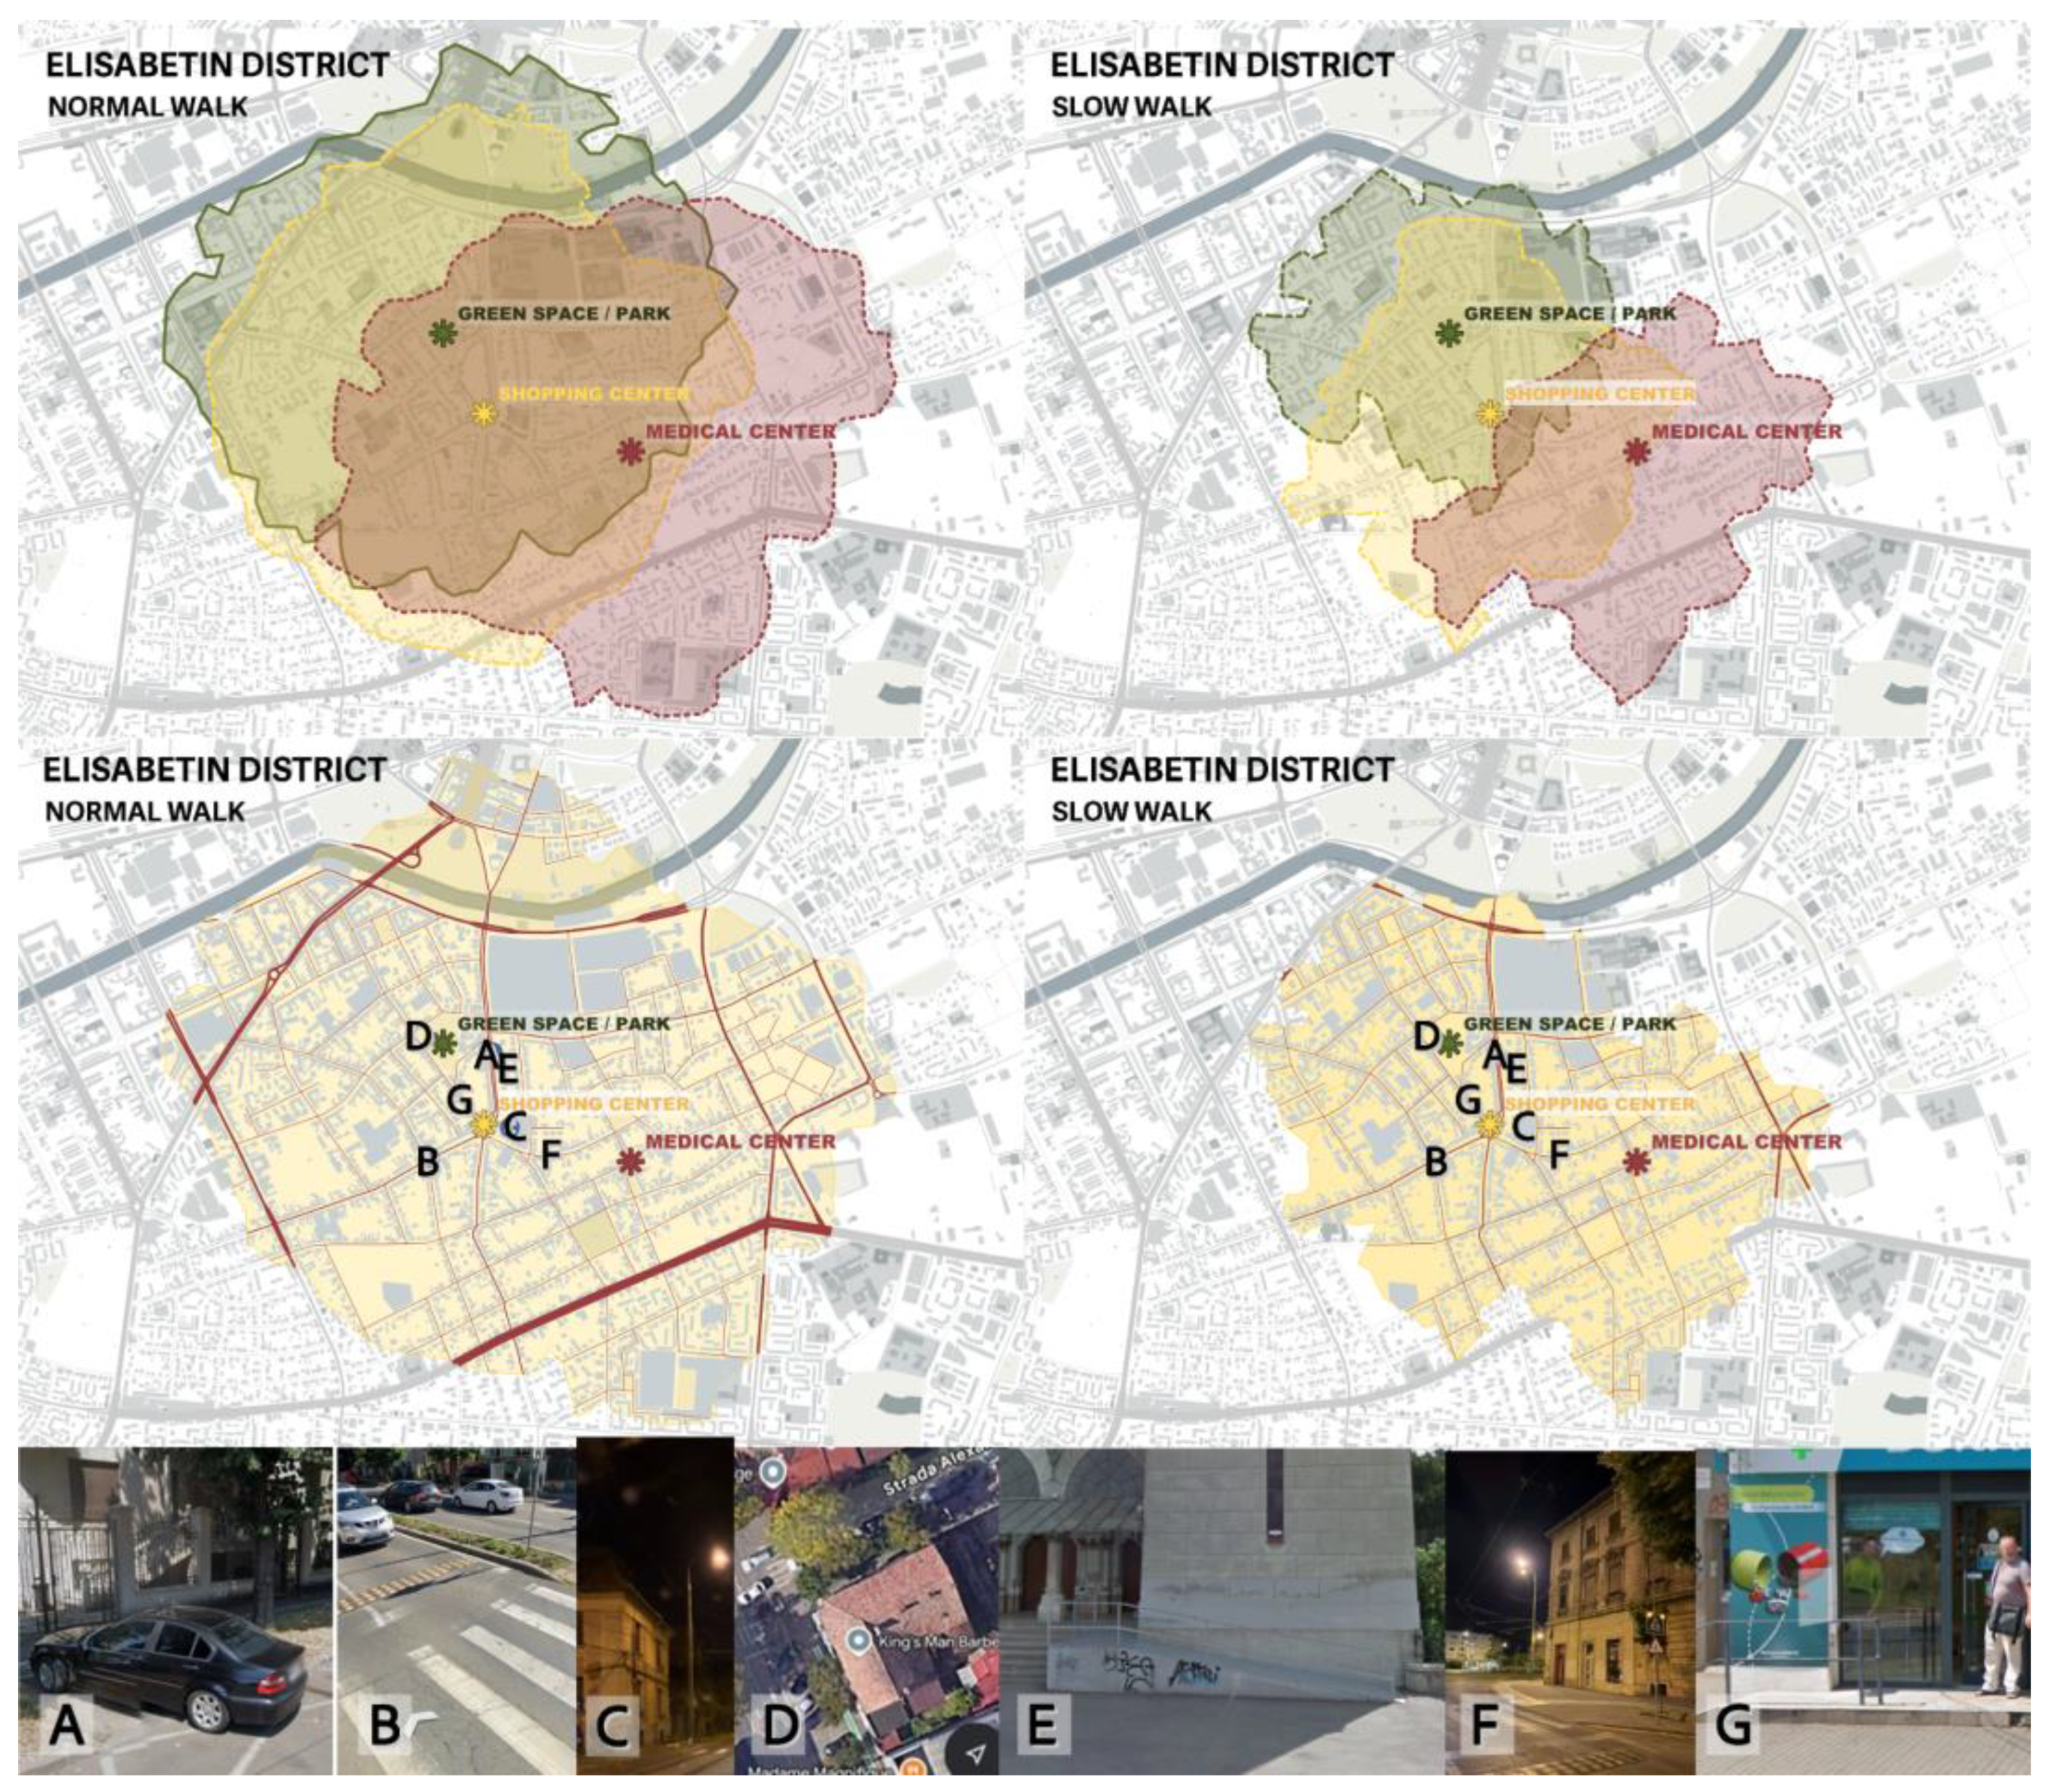
Figure 10.
Accessibility Evaluation in the Central District Based on Proximity and On-Site Observations for Normal and Slow Walking Speeds; A: obstacle sidewalks, B: low-heighed traffic signs, C: poor lighting, D: pleasant atmosphere, E: lack of ramp, F: presence of resting places, G: tactile paving, H: non-audible traffic signals at crossing.
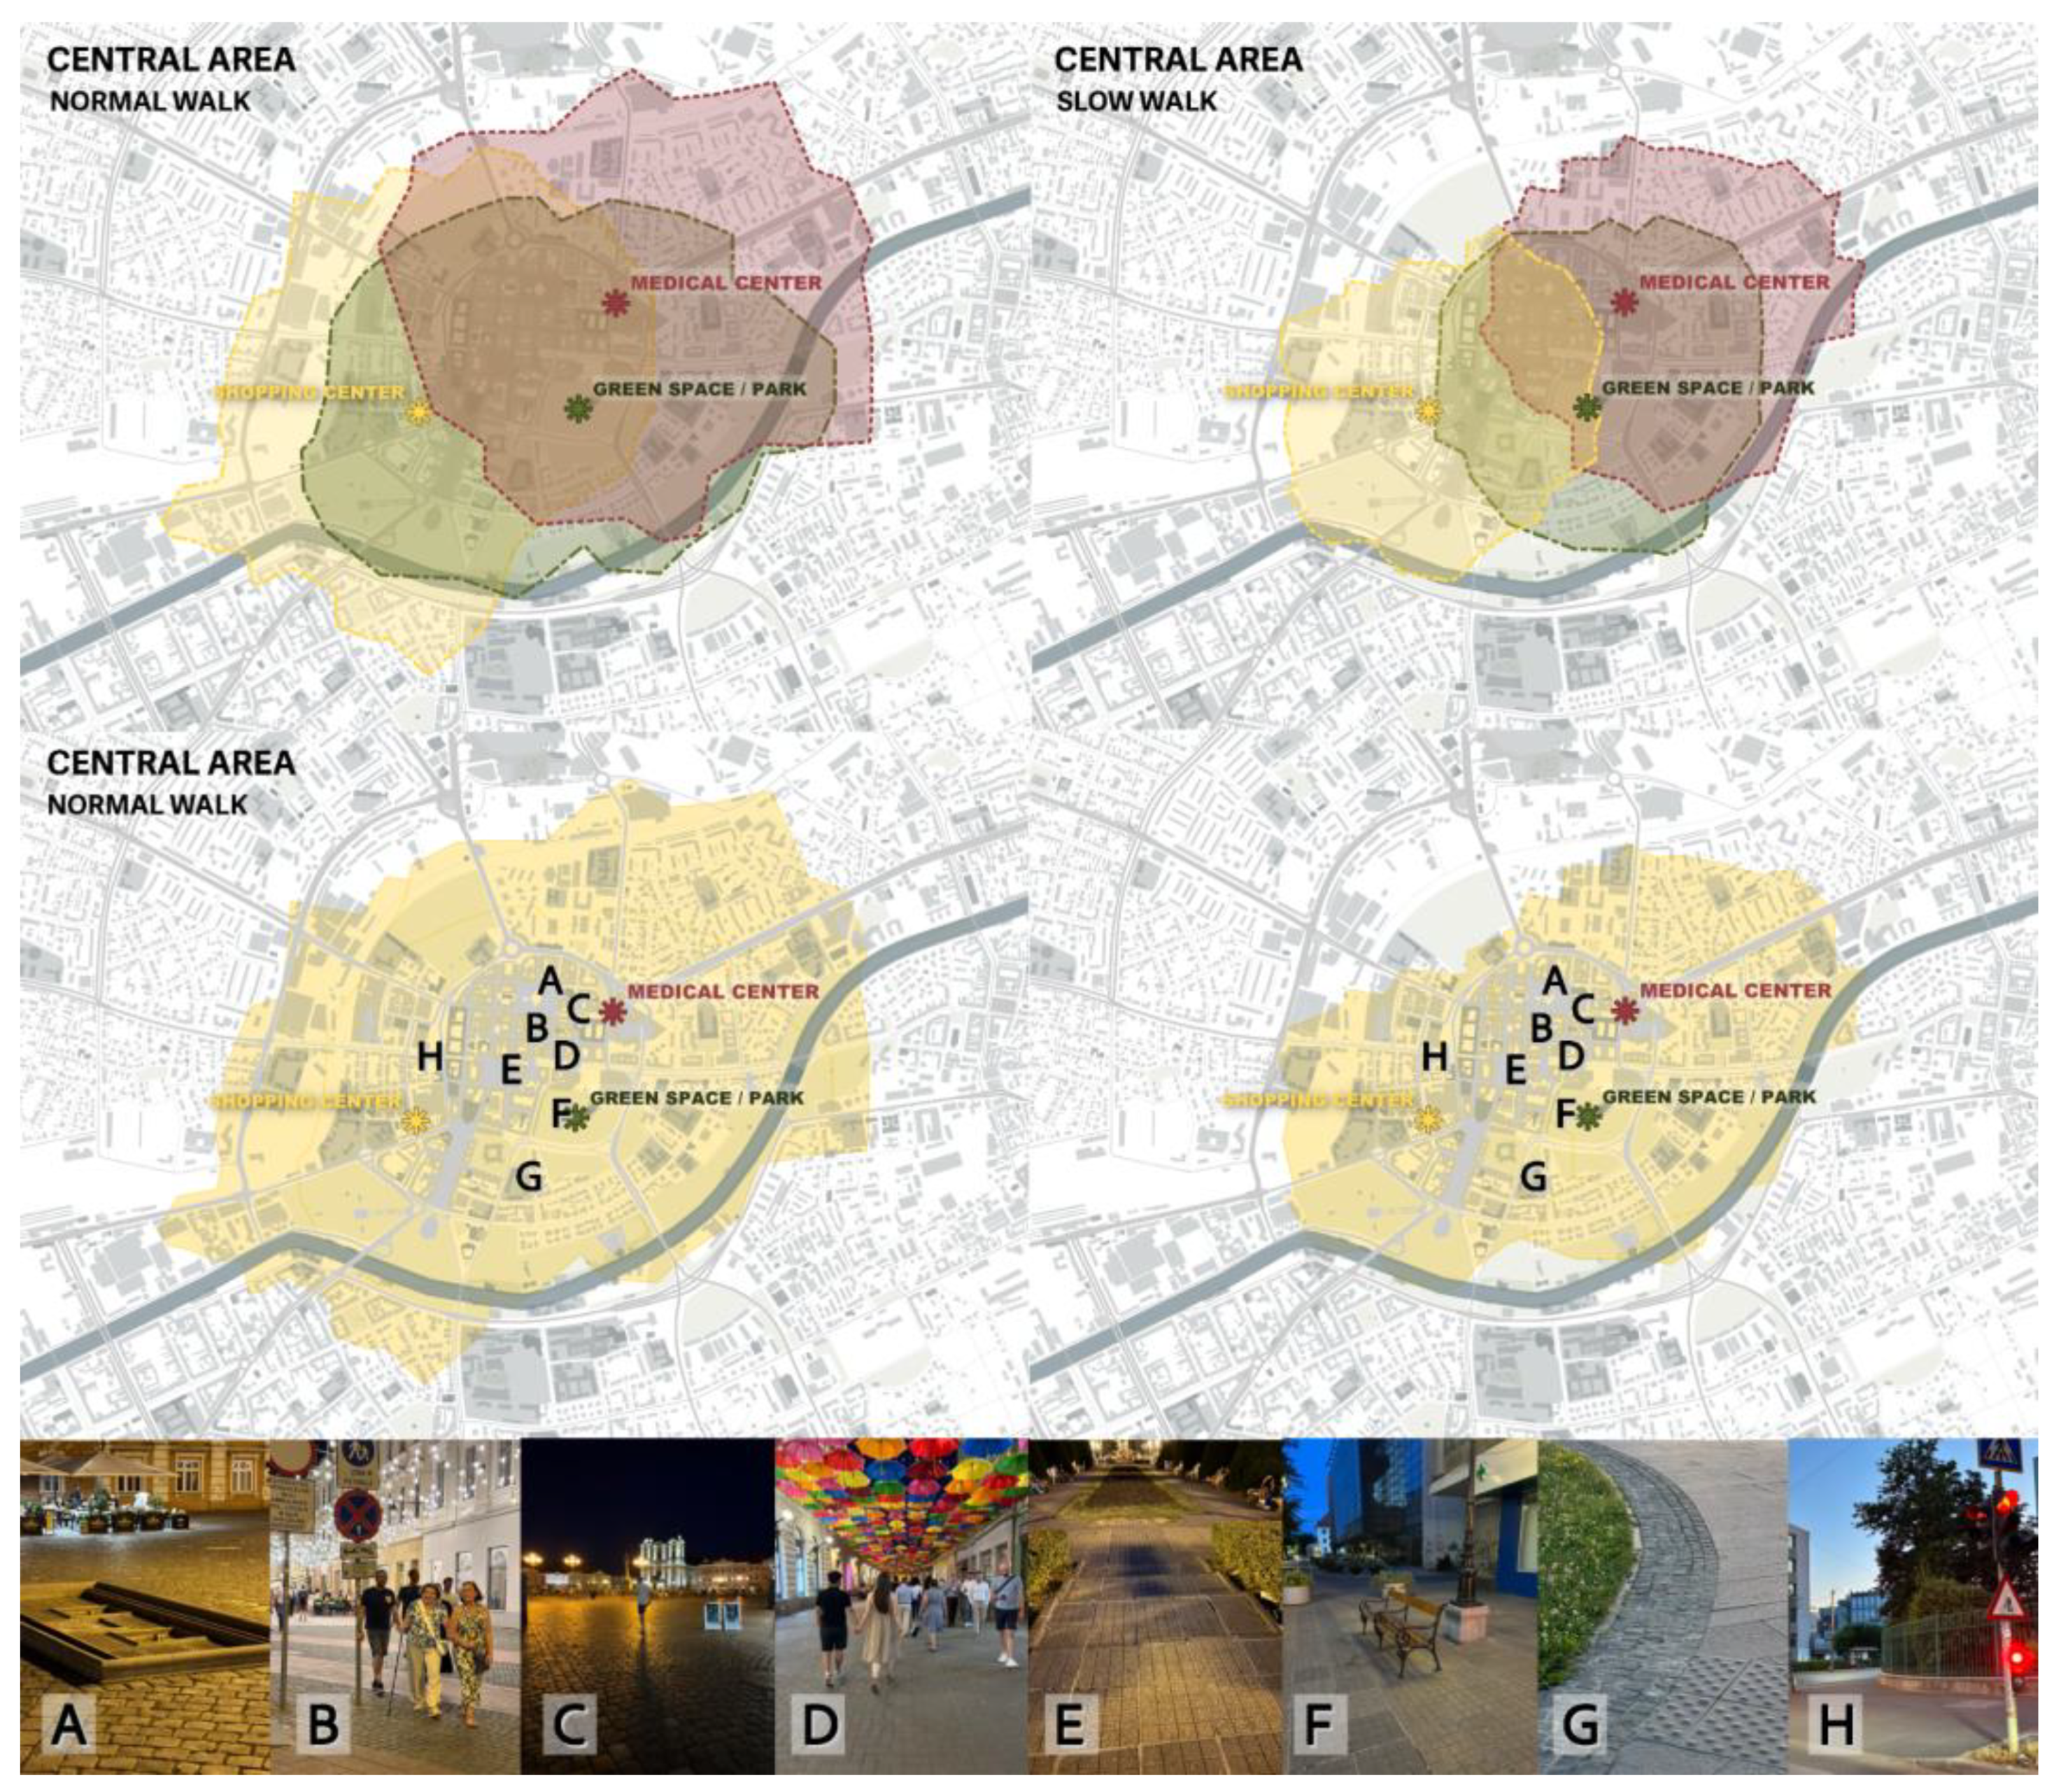
Figure 11.
Accessibility Evaluation in the Iulius Town Based on Proximity and On-Site Observations for Normal and Slow Walking Speeds; A: cleanliness, B: audible traffic signals at crossing, C & E: tactile paving, D: obstacle sidewalks, F: unclear tactile demarcated bike line.
Figure 11.
Accessibility Evaluation in the Iulius Town Based on Proximity and On-Site Observations for Normal and Slow Walking Speeds; A: cleanliness, B: audible traffic signals at crossing, C & E: tactile paving, D: obstacle sidewalks, F: unclear tactile demarcated bike line.
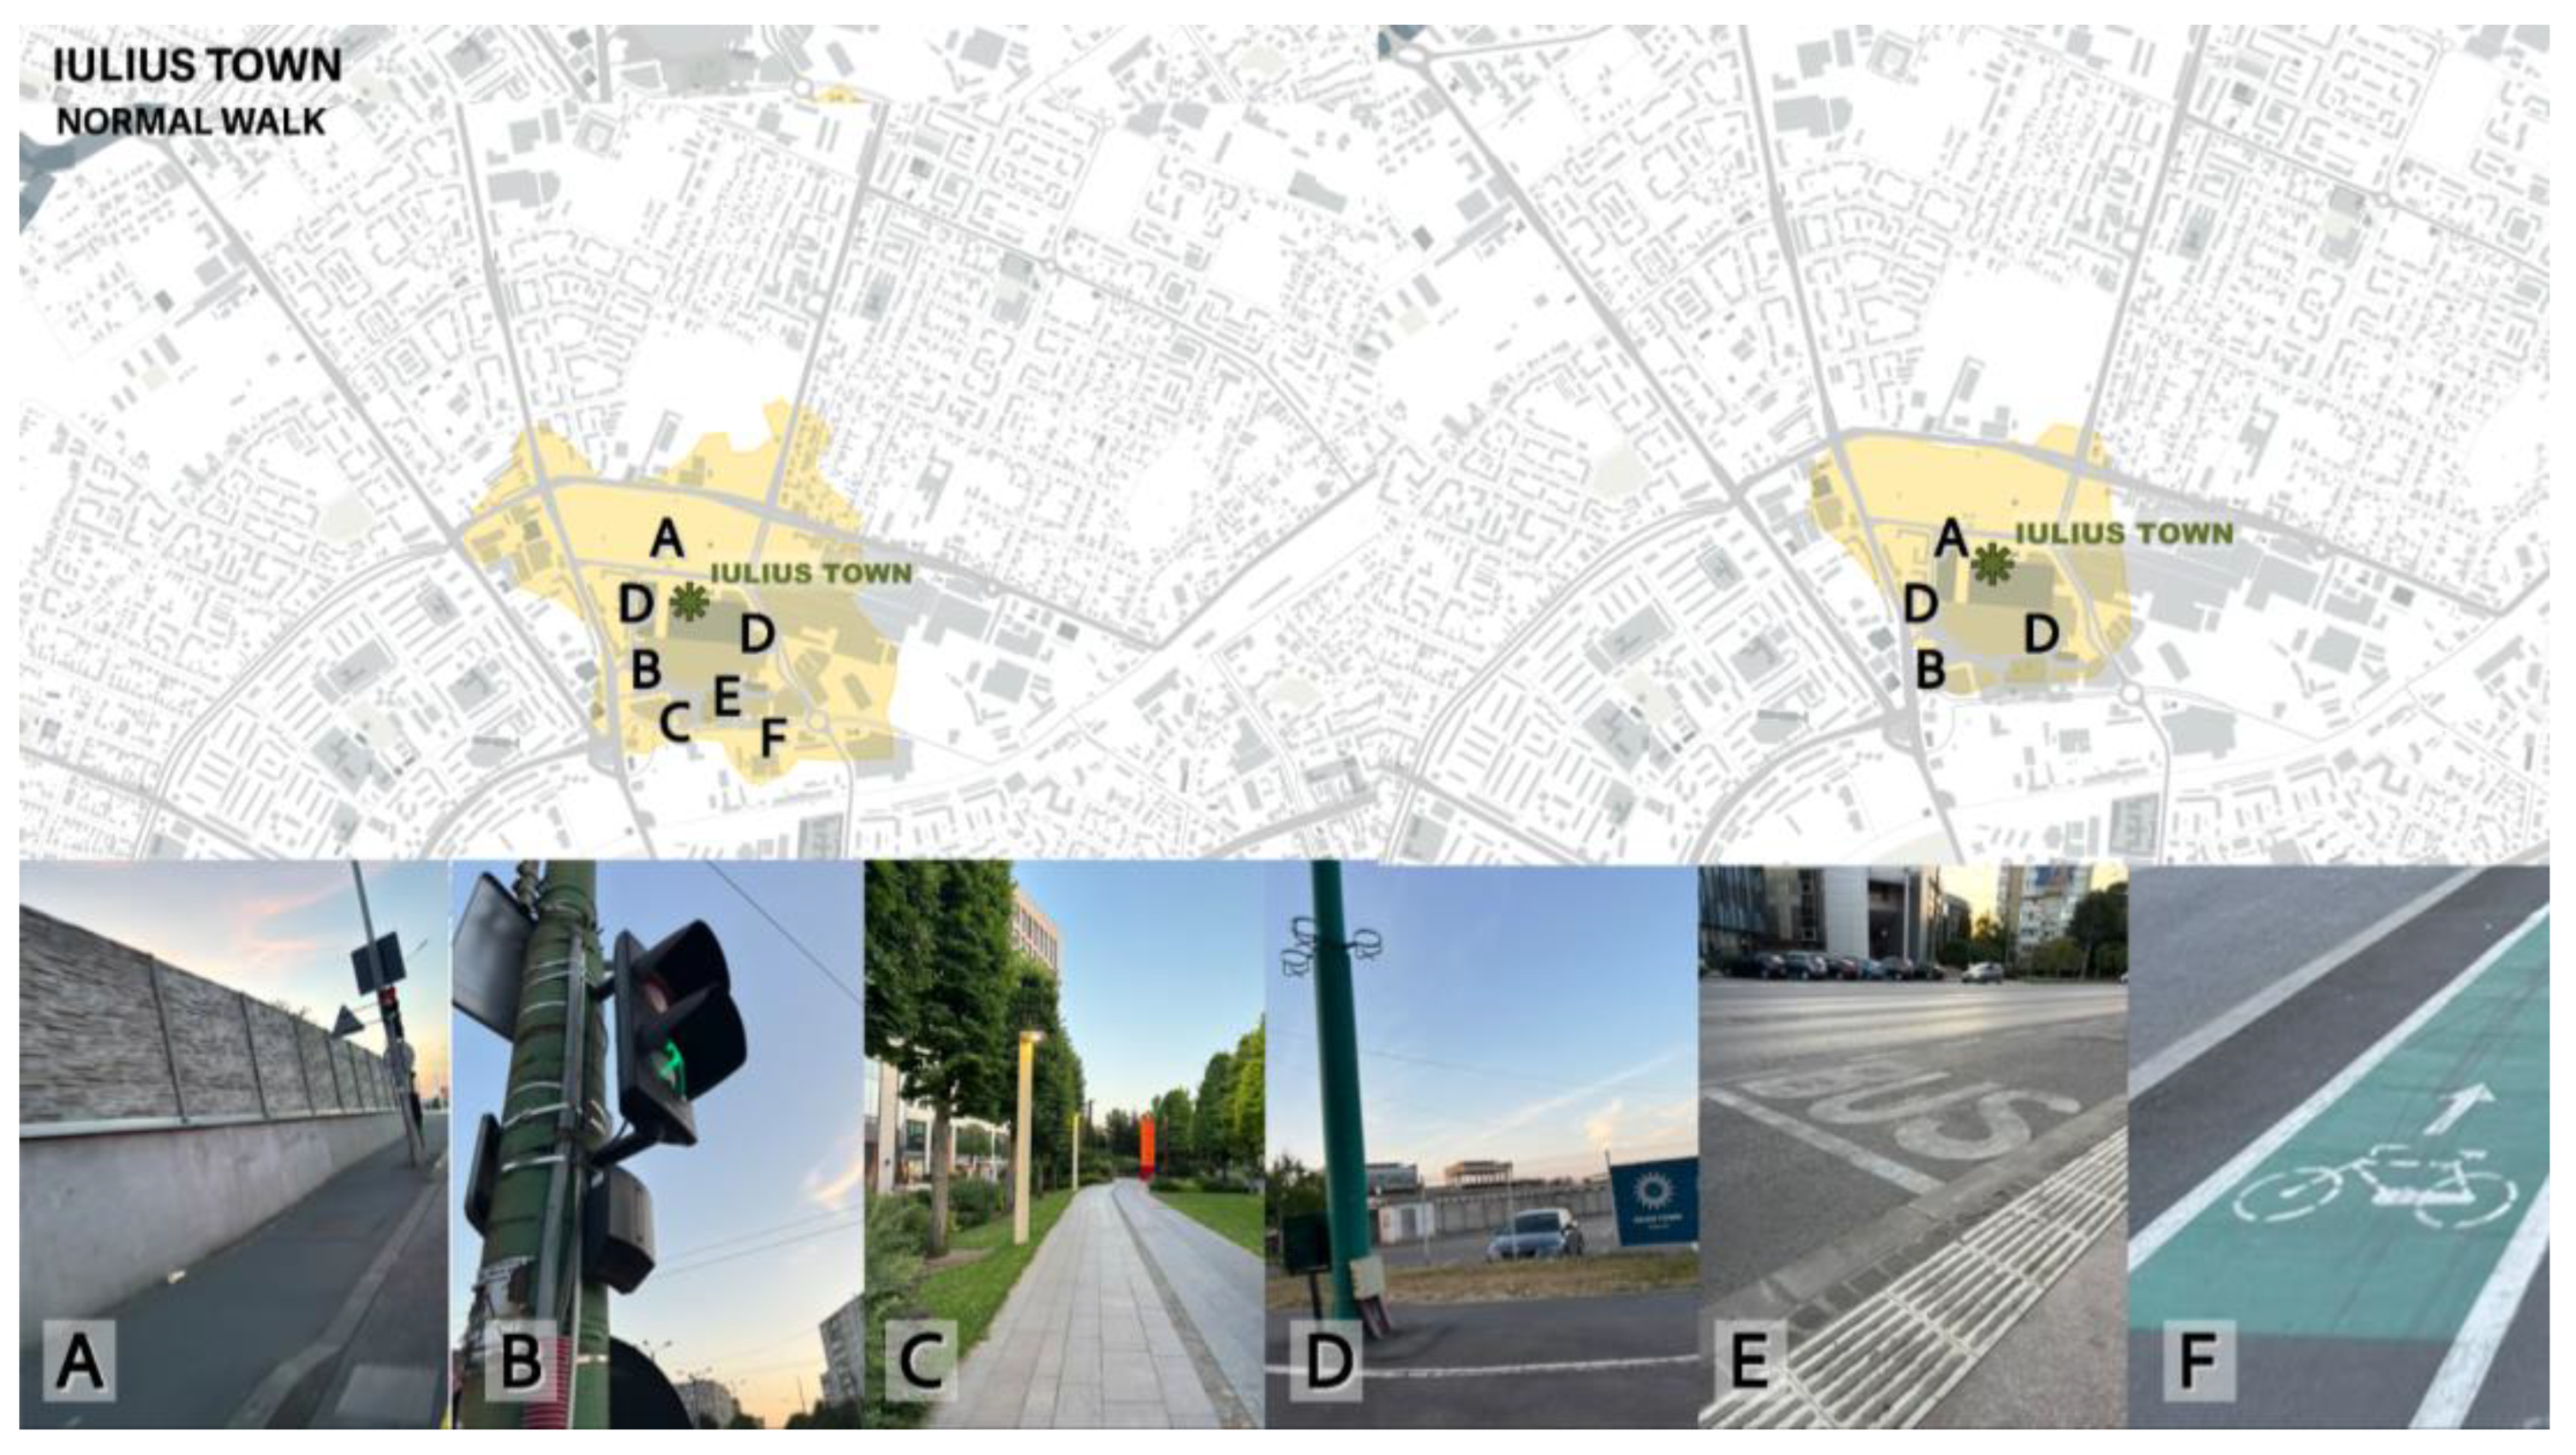
Table 2.
Spatial coverage differences by walking speed scenario.
| Amenity Type | Scenario | Uncovered Area (m²) | % of Total Area Not Covered |
| Supermarket | Normal Speed | 23,809 | 20,5% |
| Slow Speed | 54,378 | 46,8% | |
| Medical Center | Normal Speed | 66,237 | 38,0 % |
| Slow Speed | 88,850 | 56,0 % |
Total analyzed surface: 116,257 m².
Table 3.
Spatial coverage differences by walking speed scenario.
| Users | Accessibility Criterion | Maximum Points | Area 1: Iosefin |
Area 2: City Center |
Area 3: Iulius Town |
| Non-Disabled Users | public lighting | 1 | 0,5 / 1 | 0,5 / 1 | 1 / 1 |
| pleasant atmosphere | 1 | 0,5 / 1 | 1 / 1 | 1 / 1 | |
| cleanliness of the route | 1 | 1 / 1 | 1 / 1 | 1 / 1 | |
| TOTAL POINTS / NON-DISABLED USERS | 3 | 2 / 3 | 2,5 / 3 | 3 / 3 | |
| Visual Impaired Users | public lighting, | 1 | 0,5 / 1 | 0,5 / 1 | 1 / 1 |
| surface quality of the route, | 1 | 0,5 / 1 | 0,5 / 1 | 0,5 / 1 | |
| low interaction with traffic | 1 | 0,5 / 1 | 0,5 / 1 | 1 / 1 | |
| TOTAL POINTS / VISUAL IMPAIRED USERS | 3 | 1,5 / 3 | 1,5 / 3 | 2,5 / 3 | |
| Mobility Impaired Users | public lighting | 1 | 0,5 / 1 | 0,5 / 1 | 1 / 1 |
| presence of urban furniture | 1 | 0 / 1 | 0,5 / 1 | 0,5 / 1 | |
| surface quality of the route | 1 | 0,5 / 1 | 0,5 / 1 | 1 / 1 | |
| TOTAL POINTS / MOBILITY IMPAIRED USERS | 3 | 1 / 3 | 1,5 / 3 | 2,5 / 3 | |
Disclaimer/Publisher’s Note: The statements, opinions and data contained in all publications are solely those of the individual author(s) and contributor(s) and not of MDPI and/or the editor(s). MDPI and/or the editor(s) disclaim responsibility for any injury to people or property resulting from any ideas, methods, instructions or products referred to in the content. |
© 2025 by the authors. Licensee MDPI, Basel, Switzerland. This article is an open access article distributed under the terms and conditions of the Creative Commons Attribution (CC BY) license (https://creativecommons.org/licenses/by/4.0/).
Copyright: This open access article is published under a Creative Commons CC BY 4.0 license, which permit the free download, distribution, and reuse, provided that the author and preprint are cited in any reuse.


