
Submitted:
19 August 2025
Posted:
20 August 2025
You are already at the latest version
Abstract
In the event of a heart attack, many cardiac myocytes are irreversibly lost and cannot be replaced, which can lead to heart failure. Several investigations have proved that the Hippo pathway can be manipulated to benefit cardiac myocyte recovery. The Hippo pathway is a cell-signaling pathway involved in cellular proliferation, stem cell differentiation, control of organ size and apoptosis. The pathway’s main effector is a transcriptional co-factor YAP (Yes-associated protein) whose activation is controlled by different regulators like SAV1 (Salvador Homolog 1), NF2 (Neurofibromin 2) and MOB1 (Mps one binder kinase activator). We investigated using DsiRNAs to manipulate the expression of these regulators in cultured cardiac myocytes for their potential in heart tissue healing and protection.Highly potent Dicer substrate siRNAs (DsiRNAs) were used to silence upstream core regulators of the pathway: MOB1, NF2 and SAV1. The DsiRNAs successfully lowered the level of the corresponding genes and proteins. A combination of NF2 and SAV1 knockdowns is more potent than individual knockdowns. However, MOB1 silencing alone, is a very promising target for heart regeneration, was more efficacious than silencing by either NF2 and or SAV1 individually.
Keywords:
MOB1
; NF2
; SAV1
; cardiac myocyte proliferation
; DsiRNA
1. Introduction
The Hippo pathway is a cell-signaling pathway involved in cell proliferation and differentiation, organ size control, homeostasis, and apoptosis. This pathway is an important target in cancer research, tissue regeneration and many other cell-related studies. Inhibiting the Hippo signaling was proven beneficial for heart regeneration. The core proteins of the signaling pathway are the YAP/TAZ co-transcriptional factors. Inactivation of YAP/TAZ is regulated by sequential phosphorylation by kinases MST1/2 and LATS1/2 and adaptor proteins SAV1 and MOB1A/B. The upstream regulator of the Hippo signaling include NF2, Kibra, Amot, and GPCR receptors [1].
NF2 knockdown in mouse hearts greatly protected the myocardium from ischemia/reperfusion injury and improved its function in a YAP-dependent manner [2]. Mice with a deletion of SAV1 in their hearts exhibited hyperplasia, leading to death. The SAV1-null hearts also have the ability to regenerate following a resection [3, 4]. MOB1a/n are essential genes for the embryonic development since their complete knockout in mice leads to embryonic lethality at (E) 6.5 [5]. Nishio et al., induced MOB1a/b silencing in mice and observed an impressive development of tumors in multiple tissues like the liver and the skin [6]. MOB1a/b loss in mouse livers resulted in the development of multiple tumors in a YAP-dependent way [7]. This indicates that MOB1 plays a crucial role in cell proliferation in different tissues. However, to our knowledge, MOB1 role in the myocardium has not been investigated.
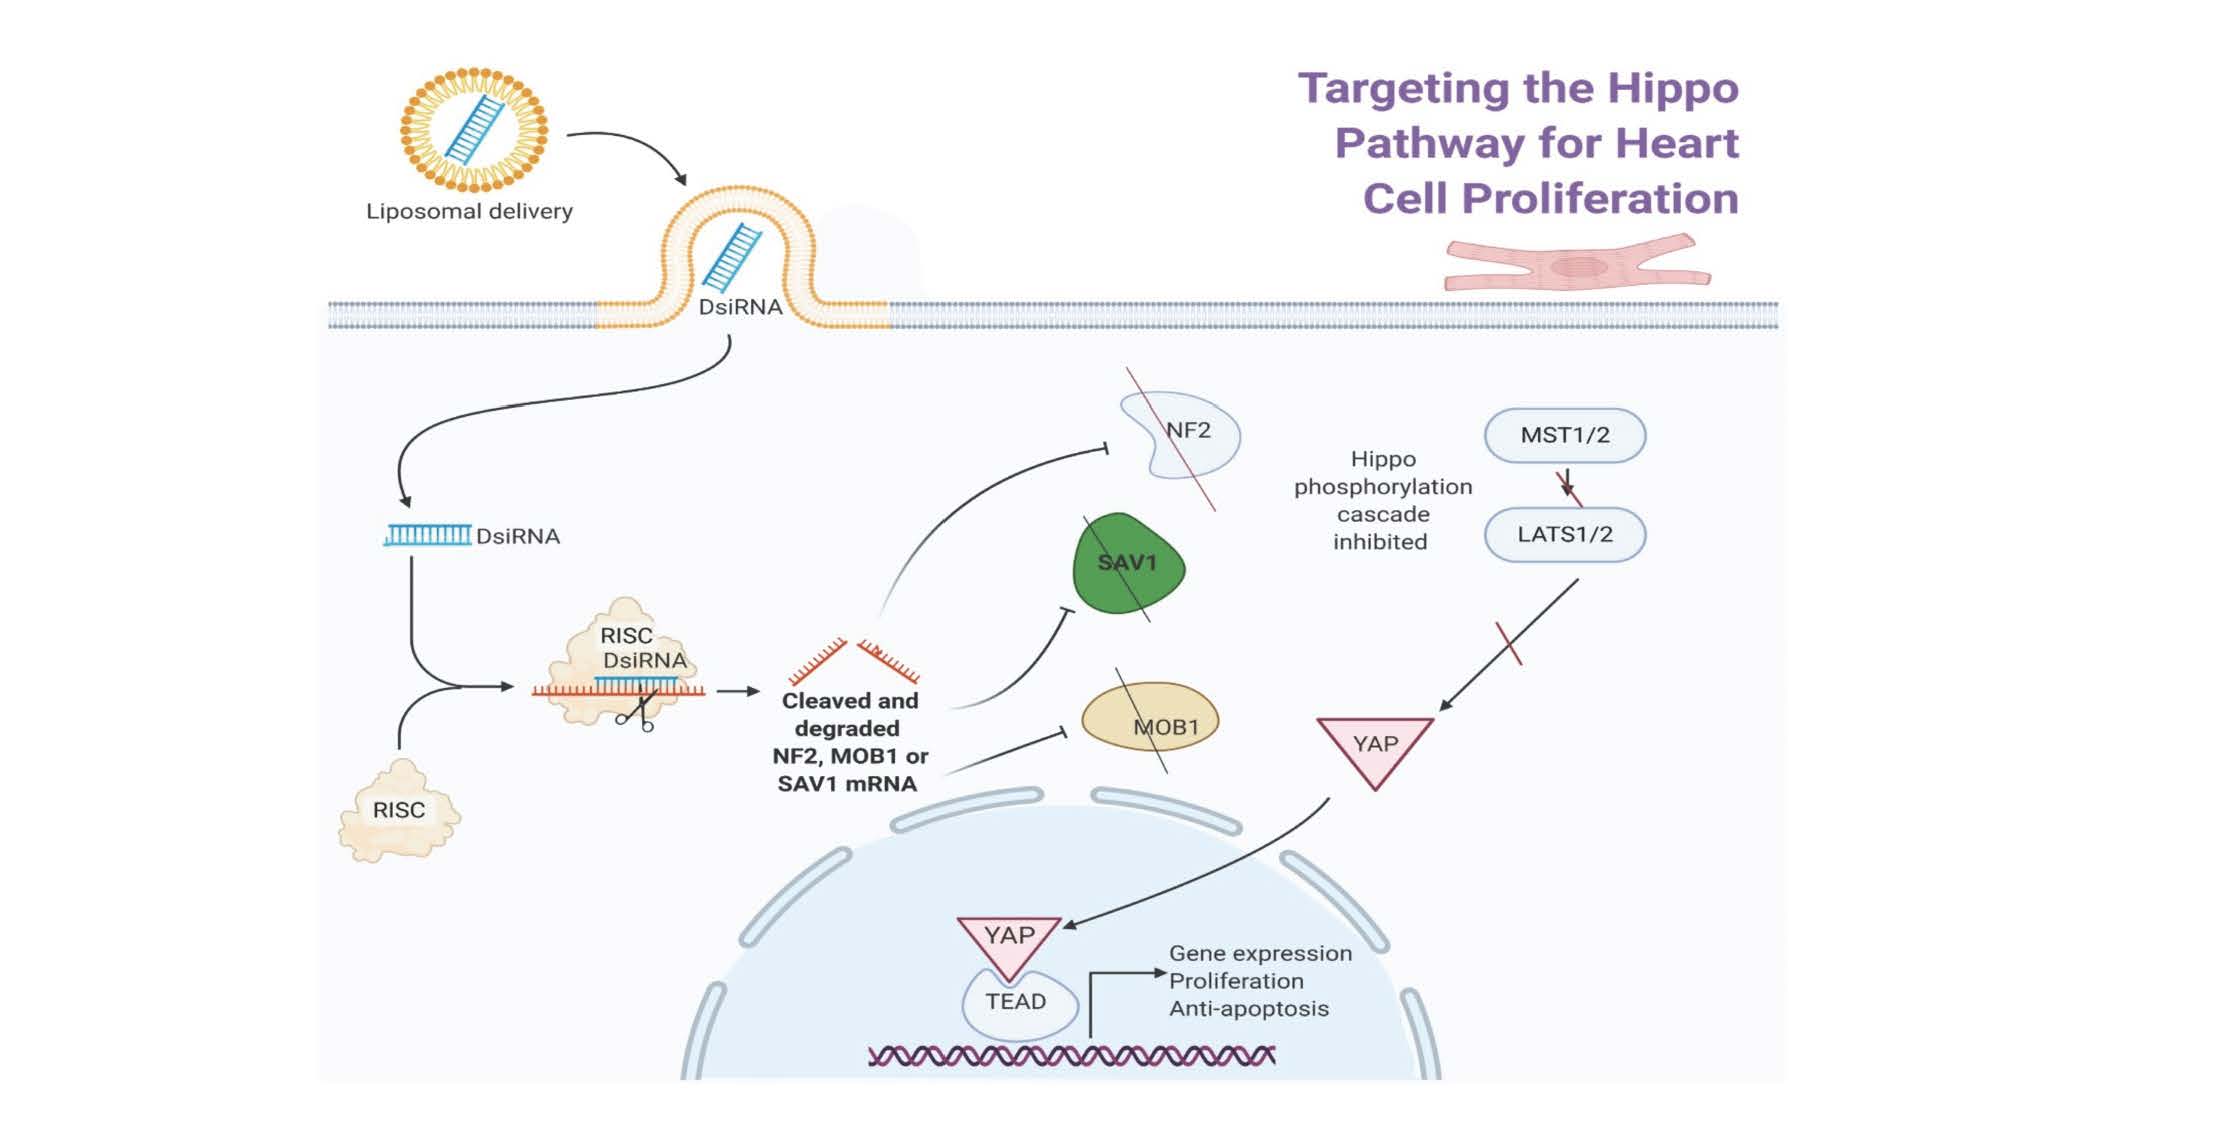
Small interfering RNAs (siRNAs) and microRNAs (miRNAs) are being actively pursued as important gene expression regulators, because of their roles in inhibiting gene expression. A recent review [8] compared their likely target specificities in which SiRNA is tightly focused to usually a single RNA target rather than miRNA, which have many likely RNA targets. Also, SiRNAs have a great advantage in comparison to drug discovery, since SiRNA may act on difficult and non-enzyme targets as they can be designed to aim for any transcribed gene of interest. RNA interference (RNAi) sequence-specific gene silencing triggered by double-stranded RNAs can be performed in mammalian cells using short RNAs, 21mers. Dicer is also required to introduce the siRNA into RISC and is involved in RISC assembly (See Graphic Abstract). DsiRNAs are chemically synthesized 27mer RNA duplexes that are optimized for Dicer processing and show increased potency, upwards of 100 fold, when compared with 21mer siRNAs (9,10, IDT Technology). Dicer-substrate RNAi methods take advantage of the link between Dicer and RISC loading that occurs when RNAs are processed by Dicer.
We investigated the efficacy of three Hippo regulators, MOB1, SAV1 and NF2 knockdowns and their effects in inducing cardiac myocyte proliferation. We used Dicer-substrate SiRNAs to silence the three genes and studied their effect in rat differentiated cardiac-like myoblast H9C2s and in rat neonatal cardiac myocytes. DsiRNAs efficiently down-regulated MOB1, SAV1 and NF2 at both the transcript and the protein levels. The combination of NF2 and SAV1 gene silencing enhanced Hippo inhibition and cardiac cell proliferation. Uniquely, MOB1 silencing was identified as the most potent target for cardiac regeneration.
2. Materials and Methods
2.1. Cell Culture
The H9C2 rat cardiomyocyte cell line was purchased from ATCC. To test for proliferation, cells were maintained in DMEM/high glucose with 2 mM Glutamax, 1 mM sodium Pyruvate, and 100 U/ml penicillin-streptomycin (ThermoFisher Scientific) supplemented with 10% Fetal Bovine Serum (Gendepot). Only cells at low passage number were used and cells were passaged before reaching 70% confluency. For differentiation, media supplemented with 1% Fetal Bovine Serum was changed every other day and 1 µM retinoic acid (Sigma-Aldrich) was added every day for a week.
Rat neonatal cardiomyocytes were purchased from Cell Applications and maintained in the basal media supplemented with growth supplements provided by the same manufacturer according to their recommended guidelines.
2.2. DsiRNA Transfection
DsiRNA (Dicer Substrate siRNAs) RNA duplexes were purchased from IDT Technology. When H9C2 cells were used, they were plated and allowed to differentiate for 1 week. On the day one of transfection, medium was changed, and cells were transfected with Lipofectamine RNAiMax following the manufacturer’s guidelines (ThermoFisher Scientific). Twenty-five pmoles of DsiRNA for a 6-well format, 10 pmol for a 12-well format and, or 5 pmol on a 24-well format was used for all experiments. Control transfection was performed using non-targeting DsiRNA (NC-1) and transfection efficiency was checked using DsiRNA conjugated with a fluorophore Tye593 (IDT). Cells were harvested or treated as indicated for 24, 48, or 72 h post transfection. For H9C2 cells and rat neonatal cardiomyocytes, an equal mix of DsiRNAs (1 and 2) was used for all experiments.
2.3. RNA Isolation, cDNA Synthesis, QPCR and Analysis
QPCR experiments were performed in a 12-well format and samples were harvested at the indicated times. RNA was isolated using RNAeasy kit (Qiagen) following the manufacturers guidelines. RNA concentration was determined using a Nanodrop (ThermoFisher Scientific), and then cDNA was synthesized using one microgram of total RNA and the qscript cDNA superMix reagent following the manufacturer’s guidelines (Quanta Biosciences). Next, cDNA samples were diluted in water and QPCR was performed using the Power SYBER Green PCR MasterMix reagent and an Applied Biosystems 7900HT real time PCR system. All PCR primer sequences are provided in the supplemental methods.
Relative gene expression was estimated using the comparative Ct method. The relative Ct value of an mRNA transcript was calculated first by subtracting the Ct value of the housekeeping gene GAPDH from the mRNA Ct value of the gene of interest. The relative Ct values were normalized to non-transfected cells to determine the fold-change in gene expression. Statistical significance was determined by performing unpaired t-tests between untreated and treated samples.
2.4. Protein Antibody Blots
Cell samples were collected from a 6-well format 72 h after transfection. Cells were rinsed with PBS and scraped in RIPA buffer (Genedepot) with anti-protease and anti-phosphatase cocktail (ThermoFisher Scientific). Protein concentration was determined using a BCA protein assay (ThermoFisher Scientific) according to the manufacturer’s guidelines. The same protein amount for each sample was loaded on a Nupage 10% bis-tris electrophoresis gel and transferred to a PVDF membrane. Membrane was washed with TBS buffer with 0.1% Tween 20 (TBST) then blocked in 5% bovine serum albumin 1 h. at room temperature. Primary antibodies (Anti-MOB1 (1:1000) (Cell Signaling 13730S); Anti-SAV1 (1:1000) (Cell Signaling 3507) and anti-NF2 (1:1000) (Abcam Ab88957) were added and incubated overnight at 4°C. Membranes were then washed with TBST and secondary HRP antibody was added (anti-rabbit Cell Signaling #7074; anti-mouse Cell Signaling #7076) at 1:10000 for 1 h. at room temperature. After washing with TBST, the membrane was developed using Pierce ECL western blotting substrate (ThermoFisher Scientific). Membranes were stripped using western blot restore PLUS western blot stripping buffer (ThermoFisher Scientific). Membranes were then incubated with rabbit anti-GAPDH conjugated with HRP (Santa Cruz Biotechnology) overnight in 5% milk followed by washing and detection with the same western blotting substrate.
2.5. EdU Flow Cytometry
Cells were plated in 6-well format and transfected as described above. Cells were lifted using trypsin and the trypsin action was stopped by the addition of medium with serum. The samples were centrifuged, washed with PBS with 1% BSA to prevent cells from clumping. Cells were then fixed and permeabilized with ice-cold 100% methanol while being gently vortexed then incubated on ice for 30 min. Excess PBS was then added, and samples were centrifuged and washed with PBS twice. Edu reaction was performed according to the manufacturer’s instructions using the Click-it EdU Alexa Fluor flow cytometry assay kit (ThermoFisher Scientific).
After Edu reaction, cells were washed in PBS, then DNase-free RNAse A (Thermo Scientific) was added at a final concentration of 0.2 mg/ml, then propidium iodide (Invitrogen) was added at a concentration of 3 µM. Samples were analyzed using a BD LSR II flow cytometer (BD Biosciences).
2.6. EdU and Immunostaining Assay
Cells were plated on 0.1% gelatin coated coverslips in 24-well format. Cells were transfected like described previously. Medium was changed after 24 h and 10 µM of Edu was added. 48 h after transfection, 10 µM Edu were added and 6 h later cells were fixed. Cells were washed in PBS then fixed in 4% Paraformaldehyde in PBS for 10min. Edu reaction was performed according the manufacturer’s instructions using the Click-it EdU Alexa Fluor™ Imaging Kit (ThermoFisher Scientific). Additional staining for cardiac markers was performed with the primary antibodies (Anti-heavy chain cardiac myosin antibody [BA-G5] (Abcam: ab50967); anti cardiac-Troponin T [1C11] (Abcam ab8295) 1:200 ) diluted in 1% bovine serum albumin overnight at 4°C. Cells were washed with PBS, then incubated with secondary Fluorescent Antibodies Alexa goat anti-rabbit or anti-mouse (ThermoFisher Scientific) for 1 h at room temperature in dark conditions (1:250). Finally, the coverslips were washed with PBS with Hoechst 33342 and mounted with slow-fade mounting medium (ThermoFisher Scientific). Images were captured with Nikon Eclipse Ti microscope.
2.7. Mitosis Detection in Rat Neonatal Cardiomyocytes
Cells were fixed using 4% formaldehyde in PBS for 10 min, then washed with PBS. Fixed cells were permeabilized with 0.25% tritonX-100 in PBS for 15 min, then washed with PBS. Samples were incubated with image-it FX signal Enhancer for 30 min before washing with PBS. Samples were blocked with 5% BSA in PBS for 1 h at room temperature. Mitosis was detected using the Rabbit phospho-histone 3 H3 (Ser10) Antibody mitosis marker (Sigma-Aldrich 06-570) (1:200). Cardiac marker troponin Tnni3 was detected using the mouse anti-troponin T (ab8295 Abcam) (1:250). Both primary antibodies were diluted in 1% BSA in PBS and samples were incubated overnight at 4°C. After washes, secondary antibodies (Alexa Fluor goat anti-rabbit 488, Alexa Fluor goat anti-mouse 647 (ThermoFisher Scientific) both at 1:250 in PBS + 1%BSA) were added for 1 h at room temperature under dark conditions. Samples were then washed and incubated with Hoechst 33342 to stain the nucleus. Nikon Ti eclipse epi-fluorescence microscope was used for capturing the images.
2.8. Live Cell Imaging
H9C2 Cells were plated in a 24-well plate and differentiated for 10 days. Cells were transfected with DsiRNAs. The samples were incubated in the Incucyte S3 Live-Cell Analysis System using the 20X objective. The instrument was set to take a picture every hour of each well at 16 different locations for a period of 48 h. Cell confluence was measured and plotted using the Incucyte Zoom (Sartorius) software.
Rat primary neonatal cardiomyocytes were purchased in a 12 well plate from Cell Applications. Cells were co-transfected with 400 ng of ES FUCCI which was a gift from Pierre Neveu (Addgene plasmid # 62451) [10] and DsiRNAs like described above, using Jetprime transfection reagent according to the manufacturer’s guidelines. Cells were then incubated in the Incucyte S3 Live-Cell Analysis System (Sartorius) under regular cell culture conditions. The instrument was set to take a picture every hour of each well at 16 different locations using a 10x objective for 48 h. Image analysis was performed using the Incucyte software analysis tool.
2.9. RNA-Sequencing Assay
Rat neonatal cardiomyocytes plated on a 12-well plate were treated with 10 pmols of DsiRNAs using Lipofectamine RNAimax. Forty-eight h post transfection, cell lysates were harvested. RNA was extracted using RNeasy Mini Kit (Qiagen) with on-column RNase-Free DNase (Qiagen) digestion following manufacturer's instructions. Extracted RNA samples underwent quality control assessment using the RNA tape on Tapestation 4200 (Agilent) and were quantified with Qubit fluorometer (Thermo Fisher). The RNA libraries were prepared and sequenced at the University of Houston Seq-N-Edit Core per standard protocols. RNA libraries were prepared with QIAseq Stranded Total RNA library Kit (Qiagen) using 100 ng input RNA. Ribosomal RNA was depleted with QIAseq FastSelect HMR kit (Qiagen). RNA was fragmented, reverse-transcribed into cDNA, and ligated with Illumina sequencing adaptors at the 5’ and 3’ ends. The size selection for libraries was performed using SPRIselect beads (Beckman Coulter) and purity of the libraries was analyzed using the high sensitivity DNA 1000 tape on the Tapestation 4200 (Agilent) with a size of 300 bps. The prepared libraries were pooled and sequenced using NextSeq 500 (Illumina); generating ~15 million 2×76 bp paired-end reads per samples.
For data analysis, we used trimGalore! to control the quality of the data, followed by alignment to the rat genome (Rn6 from ENSEMBL) using the STAR aligner. We then used the limma/voom R-package to perform the differential gene analysis. Batch correction was performed using the SVA R-package followed by differential gene analysis using the limma/voom R-package. Pathway analysis was performed against a collection of rat-specific GO/KEGG pathways from the Ge lab using GSEA v3.0.
3. Results
Validate DsiRNA Hippo Pathway knockdowns. DsiRNAs are 27mer duplex RNAs (IDT technologies), are more powerful than 21mer siRNAs in RNA interference, because they are recruited by Dicer directly into the RNA-induced silencing complexes. The graphical abstract shows a schematic diagram illustrating how blocking expression of three Hippo pathway regulators with their corresponding DsiRNA may impact upon YAP gene targeting is further supported by supplemental figures. In Figure S1-4S, we tested cultured NIH3t3 mouse fibroblast cells transfected with three distinct DsiRNAs for SAV1, NF2, and MOB1 (See Table 1) and observed gene silencing verified by quantitative RT-PCR. Each DsiRNAs against SAV1, NF2 and or MOB1 was effective in reducing its cognate RNA target transcript levels (Figure S1) We also observed MOB1 DsiRNA cancelled MOB1 expression, but partially knockdown NF2 expression (Figure S2). Similarly, NF2 DsiRNA knockdown inhibited itself completely but also crossed over to partially knockdown MOB1 expression. In contradistinction, SAV DsiRNA knockdown blocked SAV expression with little carry over to MOB1 and or NF2 RNA levels. Thus, knockdowns of MOB1 and NF2 may influence each other’s gene activity. The DsiRNA knockdowns of Mob1, NF2 and SAV did not feedback on YAP1 expression (Figure S3). Indeed, we also observed the up regulation of C-Myc, Oct4 and Klf4 only with MOB1 DsiRNA (Figure S3). SOX2 was induced only with SAV DsiRNA and Nanog was not induced with any of the DsiRNAs. In addition, Figure S4 showed Increased accumulation of nuclear GFP-YAP followed DsiRNA knockdowns of hippo pathway regulators especially for MOB1. Knockdowns of hippo regulatory factors allowed for increased accumulation of YAP in targeted cell nuclei. Finally, Human Mob1a shares 98% identity with rat Mob1a, at the protein level. Transfection of Rat SiRNA into human AC16 cardiac myocytes showed reduction of human Moba1a RNA levels by approximately 80% shown in Figure S5. Cross homology between Rat Si RNA and human MOB1a nucleic sequences are sufficient to form inhibitory sequences which cause MOB1 RNA turnover.
Knockdowns of Hippo pathway regulators in rat cardiac-like H9C2 cell line. Next, we tested the H9C2 rat myoblast cell line, with cardiac-like properties. H9C2 cells were differentiated for a week and cultured in low serum medium supplemented with retinoic acid. Cells were transfected with NF2, MOB1 and SAV1 rat DsiRNAs. Reduced protein levels were examined by antibody blotting analysis. All three protein levels decreased as compared to the control (Figure 1A). The transcript levels of each of the three proteins decreased as demonstrated by q-PCR (Figure 1B) and the level of YAP target gene CTGF increased, as a result of such gene silencing (Figure 1C). Although MOB1 KD did not efficiently increase the CTGF level, it was more potent than NF2 and SAV1 in increasing the transcript levels of cell cycle genes Aurora kinase B and CDC2 (Figure 1C). Therefore, MOB1 silencing has the potential to be more efficient than silencing of SAV1 and NF2 in inducing cardiac myocyte replication. DsiRNAs knock downs of the Hippo regulators NF2, SAV1 and MOB1 was observed to reduce their cognate transcript target and protein levels, leading to the reactivation of the cell cycle.
We then tested knocking down MOB1 in differentiated H9C2 for proliferation using EdU incorporation assays. In both flow cytometric and immunostaining assays, MOB1 knockdown significantly induced de novo DNA synthesis, which indicates DNA synthesis during S phase (Figure 2). We compared the efficiency of NF2, SAV1 and MOB1 knockdown in inducing cell H9C2 proliferation over 48 h using live cell imaging. Cell confluency increased over time, although more notably in MOB1 KD cells than in the control, NF2 KD or SAV1 KD cells (Figure 3). This data reveals that MOB1 silencing may be more potent that NF2 and SAV1 in inducing cell proliferation.
Knockdowns of Hippo pathway regulators in rat neonatal cardiomyocytes Rat neonatal cardiomyocytes were treated with DsiRNAs for 72 h and pulsed twice with EdU to capture de novo DNA synthesis, which indicates cell proliferation. Both NF2 and SAV1 single knockdowns significantly increased cardiac cells proliferation (Figure 4). This effect disappears when YAP is silenced and demonstrated that the observed cardiomyocyte proliferation effect was driven in a YAP-dependent way (Hippo signaling inactivation). Interestingly, neonatal cardiomyocyte proliferation was significantly more pronounced when combining SAV1 and NF2 gene silencing compared to silencing each gene individually.
Next, we investigated the effect of MOB1 knockdown on rat neonatal cardiomyocytes using live cell imaging (Figure 5) to follow the cell cycle status of the cells, we co-transfected the cells with DsiRNA and a plasmid DNA containing a cell sensor system (ES-FUCCI) (a gift from Pierre Neveu (Addgene plasmid # 62451) [11]. The FUCCI (Fluorescence Ubiquitination-based cell cycle indicator) system allows the visualization of the cell cycle using a fusion of fluorescent proteins conjugated with a portion of Geminin and Cdt1. Ubiquitination of Geminin and Cdt1 by E3 ligases leads to their degradation by the proteasome. E3 ligases activity is modulated by the cell cycle phase. In short, the system makes the nucleus appear red fluorescent during G1 and beginning of S phase (Geminin degraded), and green fluorescent during S, G2 and M phases (Cdt1 degraded) [12, 13]. We tested silencing MOB1 with this system and showed in a span of 48 h an increase of G1/S phase in MOB1 KD cells, as compared to the control (Figure 5) We confirmed the effect observed by immunostaining with a mitosis marker (phospho-Histone 3 (ser10); Figure S5Error! Reference source not found.).
We used high throughput RNA sequencing and compared the genes and the pathways affected by MOB1, Sav1 and NF2 silencing in rat neo-natal cardiomyocytes over 48 hours(Figure 6). We found that MOB1 KD affected significantly more genes (1885) than NF2 KD (861) or SAV1 KD (454). It is intriguing to consider how manipulating components of the same pathway are giving very different phenotypes. Out of these genes, only 124 were affected similarly by all the knockdowns. All three gene transcript targets levels decreased significantly. MOB1 knockdown showed the clearest and highest levels of enrichments for pathways linked to cell division (Figure 7). NF2 and SAV1 knockdowns show enrichments mainly for protein synthesis and organelle developments, and less enrichment for cell cycle related genes (Figure 7). MOB1 silencing resulted in the increase of the level of genes covering DNA replication, chromosome segregation, and all cell cycle phases and transitions (Figure 7B). These upregulated cell cycle genes include cdk1[13], cdc6[14] ccna2[15], ccne2[16] (Figure \7B).
4. Discussion
The YAP signaling pathway has recently emerged as a viable objective for cardiac repair. We have studied SAV1, NF2, and MOB1 silencing using DsiRNAs. It’s generally thought that, by silencing the expression of these genes, the Hippo pathway is turned off. Subsequently, mechanisms promoting cell proliferation and dedifferentiation are no longer impeded. We report herein MOB1 silencing as a potent method to induce cardiac cell proliferation. Xiao et al (14) showed the mutant YAP1, YAP5SA, induced Yamanaka stem cell markers Myc and Klf4. Indeed, we also observed the up regulation of C-Myc, Oct4 and Klf4 only with MOB1 DsiRNA (Figure S2) SOX2 was induced only with SAV DsiRNA. Nanog was not induced with any of the DsiRNAs made against MOB1, NF2 and SAV, as previously observed for the SRF mads box mutant, STEMIN (15).
We analyzed knockdown of these genes using the reactome platform [16]. Some of these upregulated genes include cell cycle genes ccnd1 and kif2a. However, multiple genes related to cell cycle were uniquely upregulated by MOB1 knockdowns. Notably, only MOB1 silencing upregulated multiple centromere and kinetecore related genes like Cenpe [17] and Ndc80 [18]; Brca1[19] and Brca2 [20] which play a role in G2/M checkpoint and centrosome amplification; and known cell cycle transition genes like Cdc25c [21,22] and Cdc6[23]. Nichio et al., reported, that MOB1 silencing promotes proliferation in a CTGF-independent fashion in liver cells [7]. This observation could explain the difference we observed for MOB1, a core component of the Hippo pathway, yet regulated differently than NF2 or SAV1.
In addition, we observed a few signaling pathways that were down-regulated, notably genes directing cardiomyocyte differentiation and contraction (Figure 7C). This process was described previously as part of the process for cardiac proliferation in different organisms, where terminally differentiated cells dedifferentiate first before undergoing cell division [23-25]. Another observation, MOB1 DsiRNAs silencing made cell division occur earlier than NF2 and Sav1 knockdowns. Other down-regulated pathways in MOB1 knockdowns include cell junction, cell migration and the cytoskeleton (Figure 7A).
Furthermore, the effect of MOB1 deletion has been reported to exhibit the “most severe phenotype among strains lacking Hippo signaling component” in studies of cancer susceptibility in mice and in various tissues [5, 6, 26]. This connection to cancer growth, supports our data that targeting MOB1 in the myocardium might be more efficacious than silencing other Hippo components and could benefit cardiac cell renewal. We also report that combining multiple YAP-signaling knockdowns (in our case combining NF2 and SAV1 KDs) can be beneficial for enhancement of cardiac cell proliferation in heart repair. Other combinations can also be tested, notably, using MOB1 KD or other regulators and effectors of the pathway.
With the idea of developing DsiRNA knockdowns into a therapy for preventing age related heart failure, we recently developed an aptamer-conjugated modRNA lipid-nanoparticle to target specifically heart cells [27]. In our lipid nanoparticle studies, the size of the particles is the most important since having a smaller particle size is easier to enter through the cells. The size of the synthesized particles used in our studies compares well to that of the literature, supporting smaller particle sizes results in optimal transfection. We reported that the aptamer-conjugated mCherry-mRNA lipid nanoparticle can effectively transfect AC16 cells [27]. In future experiments, we are planning to use that lipid nanoparticle with DsiRNA knockdowns to induce regenerative proliferation in failing cardiomyocytes. In conclusion, MOB1 DsiRNA carried in cardiac specific aptamer-conjugated lipid nanoparticles may serve as a promising new RNA drug therapy.
Supplementary Materials
The following supporting information can be downloaded at the website of this paper posted on Preprints.org.
Author Contributions
N.B. and M.J.R. designed and carried the experiments. M.J.R. analyzed the RNA sequencing data. A.M. contributed to the H9C2 live cell imaging experiment and western blot analyses. I.T. Altintop contributed to apatamer conjugated nanoparticles, D.I. contributed by providing critical feedback. N.B. wrote the manuscript with input from all authors. R.J.S. conceived the original idea and supervised the project and contributed to assembling the manuscript.
Conflicts of Interest
RJ. Schwartz is a cofounder of Animatus Biosciences. RJS and Dinakar Iyer received research funds. Other authors, Nada Bejar, Matthew J. Robertson, Muili AB, and Ilkin Altintop declared that there are no conflicts of interest. This research was underwritten in part by a grant from Animatus Biosciences LLC, in which there is a financial interest. A management plan, reviewed and recommended by the University of Houston Conflict of Interest Committee as acceptable to address the conflict.
References
- F. X. Yu, K. L. Guan, The Hippo pathway: Regulators and regulations. Genes Dev. 27, 355–371 (2013).
- T. Matsuda, et al., NF2 Activates Hippo signaling and promotes ischemia/reperfusion injury in the heart. Circ. Res. 119, 596–606 (2016). [CrossRef]
- T. Heallen, et al., Hippo Pathway Inhibits Wnt Signaling to Restrain Cardiomyocyte Proliferation and Heart Size. Science (80-. ). 332, 458–461 (2011). [CrossRef]
- T. Heallen, et al., Hippo signaling impedes adult heart regeneration. Development 140, 4683–4690 (2013). [CrossRef] [PubMed]
- H. Goto, et al., Loss of Mob1a/b in mice results in chondrodysplasia due to YAP1/TAZ-TEAD-dependent repression of SOX9. Development 145, dev159244 (2018). [CrossRef]
- M. Nishio, et al., Cancer susceptibility and embryonic lethality in Mob1a/1b double-mutant mice. J. Clin. Invest. 122, 4505–4518 (2012). [CrossRef]
- M. Nishio, et al., Dysregulated YAP1/TAZ and TGF-β signaling mediate hepatocarcinogenesis in Mob1a/1b -deficient mice. Proc. Natl. Acad. Sci. 113, E71–E80 (2016). [CrossRef] [PubMed]
- Lam J., Chow M., Zhang Y., Leung, S. siRNA versus miRNA as Therapeutics for Gene Silencing Molecular Therapy—Nucleic Acids (2015) 4, e252.
- Kim DH, Behlke MA, et al. (2005) Synthetic dsRNA Dicer-substrates enhance RNAi potency and efficacy. Nat Biotechnol, 23(2):222–226. [CrossRef]
- Rose SD, Kim DH, et al. (2005) Functional polarity is introduced by Dicer processing of short substrate RNAs. Nucleic Acids Res, 33(13):4140–415. [CrossRef] [PubMed]
- H. L. Sladitschek, P. A. Neveu, MXS-chaining: A highly efficient cloning platform for imaging and flow cytometry approaches in mammalian systems. PLoS One 10, e0124958 (2015). [CrossRef]
- H. Hashimoto, et al., Time-lapse imaging of cell cycle dynamics during development in living cardiomyocyte. J. Mol. Cell. Cardiol. 72, 241–249 (2014). [CrossRef]
- W. Y. Choi, et al., In vivo monitoring of cardiomyocyte proliferation to identify chemical modifiers of heart regeneration. Dev. 140, 660–666 (2013). [CrossRef] [PubMed]
- Xiao et al (2022) Xiao S, Liang R, Lucero E, McConnell BK, Chen Z, Chang J, Navran S, Schwartz RJ, Iyer D. STEMIN and YAP5SA synthetic modified mRNAs regenerate and repair infarcted mouse hearts. J Cardiovasc Aging 2022; 2:31.
- Xiao S, Liang R, Muili AB, Cao X, Navran S, Schwartz RJ, Iyer D. Mutant SRF and YAP synthetic modified mRNAs drive cardiomyocyte nuclear replication. J Cardiovasc Aging 2022;2:29. [CrossRef]
- R. Haw, H. Hermjakob, P. D’Eustachio, L. Stein, Reactome pathway analysis to enrich biological discovery in proteomics data sets. Proteomics 11, 3598–3613 (2011). [CrossRef]
- K. W. Yu, N. Zhong, Y. Xiao, Z. Y. She, Mechanisms of kinesin-7 CENP-E in kinetochore–microtubule capture and chromosome alignment during cell division. Biol. Cell 111, 143–160 (2019).
- J. Tooley, P. T. Stukenberg, The Ndc80 complex: integrating the kinetochore’s many movements. Chromosom. Res. 19, 377–391 (2011). [CrossRef]
- R. I. Yarden, S. Pardo-Reoyo, M. Sgagias, K. H. Cowan, L. C. Brody, BRCA1 regulates the G2/M checkpoint by activating Chk1 kinase upon DNA damage. Nat. Genet. 30, 285–289 (2002). [CrossRef] [PubMed]
- H. F. Wang, K. Takenaka, A. Nakanishi, Y. Miki, BRCA2 and nucleophosmin coregulate centrosome amplification and form a complex with the Rho effector kinase ROCK2. Cancer Res. 71, 68–77 (2011). [CrossRef]
- K. Liu, et al., The role of CDC25C in cell cycle regulation and clinical cancer therapy: A systematic review. Cancer Cell Int. 20, 1–16 (2020). [CrossRef]
- C. Busch, et al., The G2/M checkpoint phosphatase cdc25C is located within centrosomes. Int. J. Biochem. Cell Biol. 39, 1707–1713 (2007). [CrossRef] [PubMed]
- W. E. Wang, et al., Dedifferentiation, proliferation, and redifferentiation of adult mammalian cardiomyocytes after ischemic injury. Circulation 136, 834–848 (2017). [CrossRef]
- C. Jopling, et al., Zebrafish heart regeneration occurs by cardiomyocyte dedifferentiation and proliferation. Nature 464, 606–609 (2010). [CrossRef] [PubMed]
- Y. Zhang, et al., Dedifferentiation and proliferation of mammalian cardiomyocytes. PLoS One 5, 1–13 (2010). [CrossRef] [PubMed]
- M. Nishio, et al., Hippo vs. Crab: tissue-specific functions of the mammalian Hippo pathway. Genes to Cells 22, 6–31 (2017).
- I.T. Altintop, X. Liu, B.K. McConnell, S. Navran, R.J. Schwartz. Mutant mRNA encapsulated aptamer conjugated lipid nanoparticles for targetting heart cells.. AAPS Pharm Sci 360.Abstract M1330-03-16 (2023).
Figure 1.
MOB1 silencing efficiently induced cardiac myocyte replication. NF2, SAV1 and MOB1 knockdown effects in 72 h post transfected H9C2 differentiated rat heart myocytes. (A) Western blot showing levels of proteins of SAV1, MOB1 and NF2 Knockdowns; (B) Transcript levels SAV1, MOB1 and NF2 Knockdowns (C) Transcript level of CTGF, AuroraKB and CDC2 following SAV1, NF2 or MOB1 silencing. Data is a representation of experiments done 3 times. “*” indicated a statistically significant difference between the control and the treatment, P<0.01.
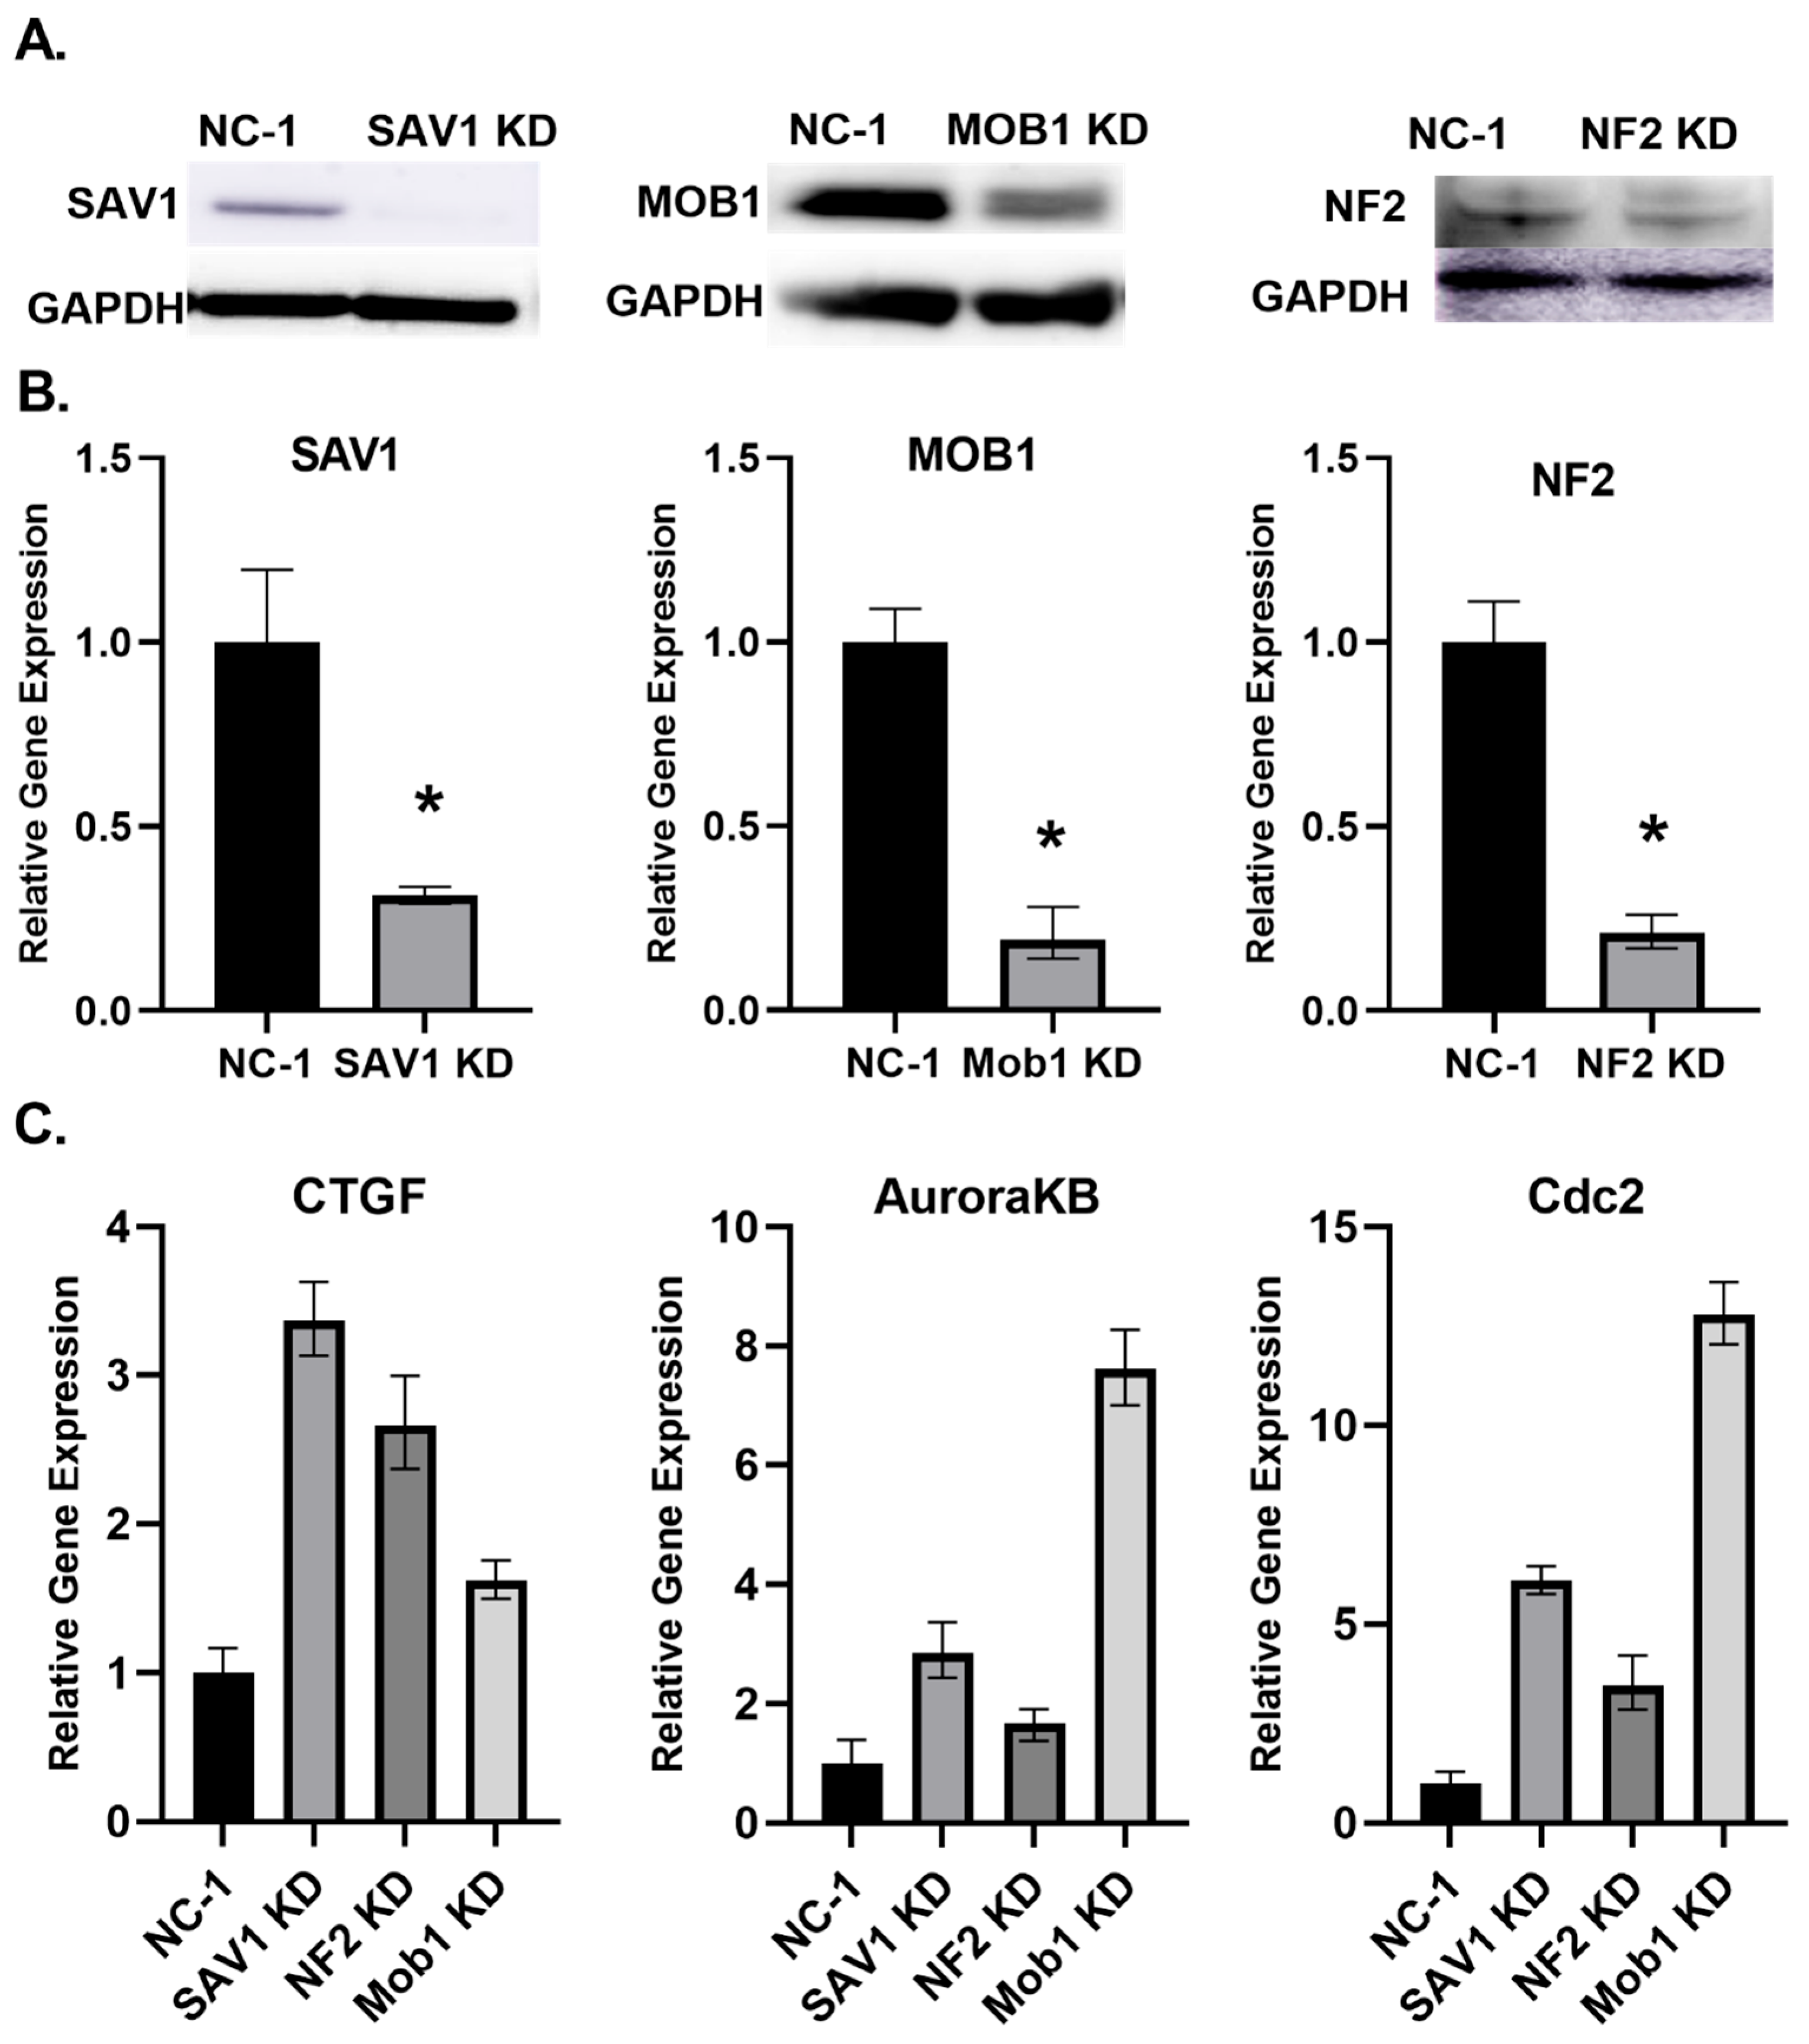
Figure 2.
MOB1 knockdown induced DNA synthesis in differentiated rat cardiac-like cells H9C2. (A) Flow cytometry analysis showing percentage of EdU-positive cells at 24 h MOB1 DsiRNA transfection. Data is a representation of three independent experiments. Error bars represent the standard error of the mean. “**” indicates a statistically significant difference between the treatment and the control (P<0.01) (B) EdU immunofluorescence representation at 48 h post MOB1 DsiRNA transfection. Scale bar represents 100 microns.
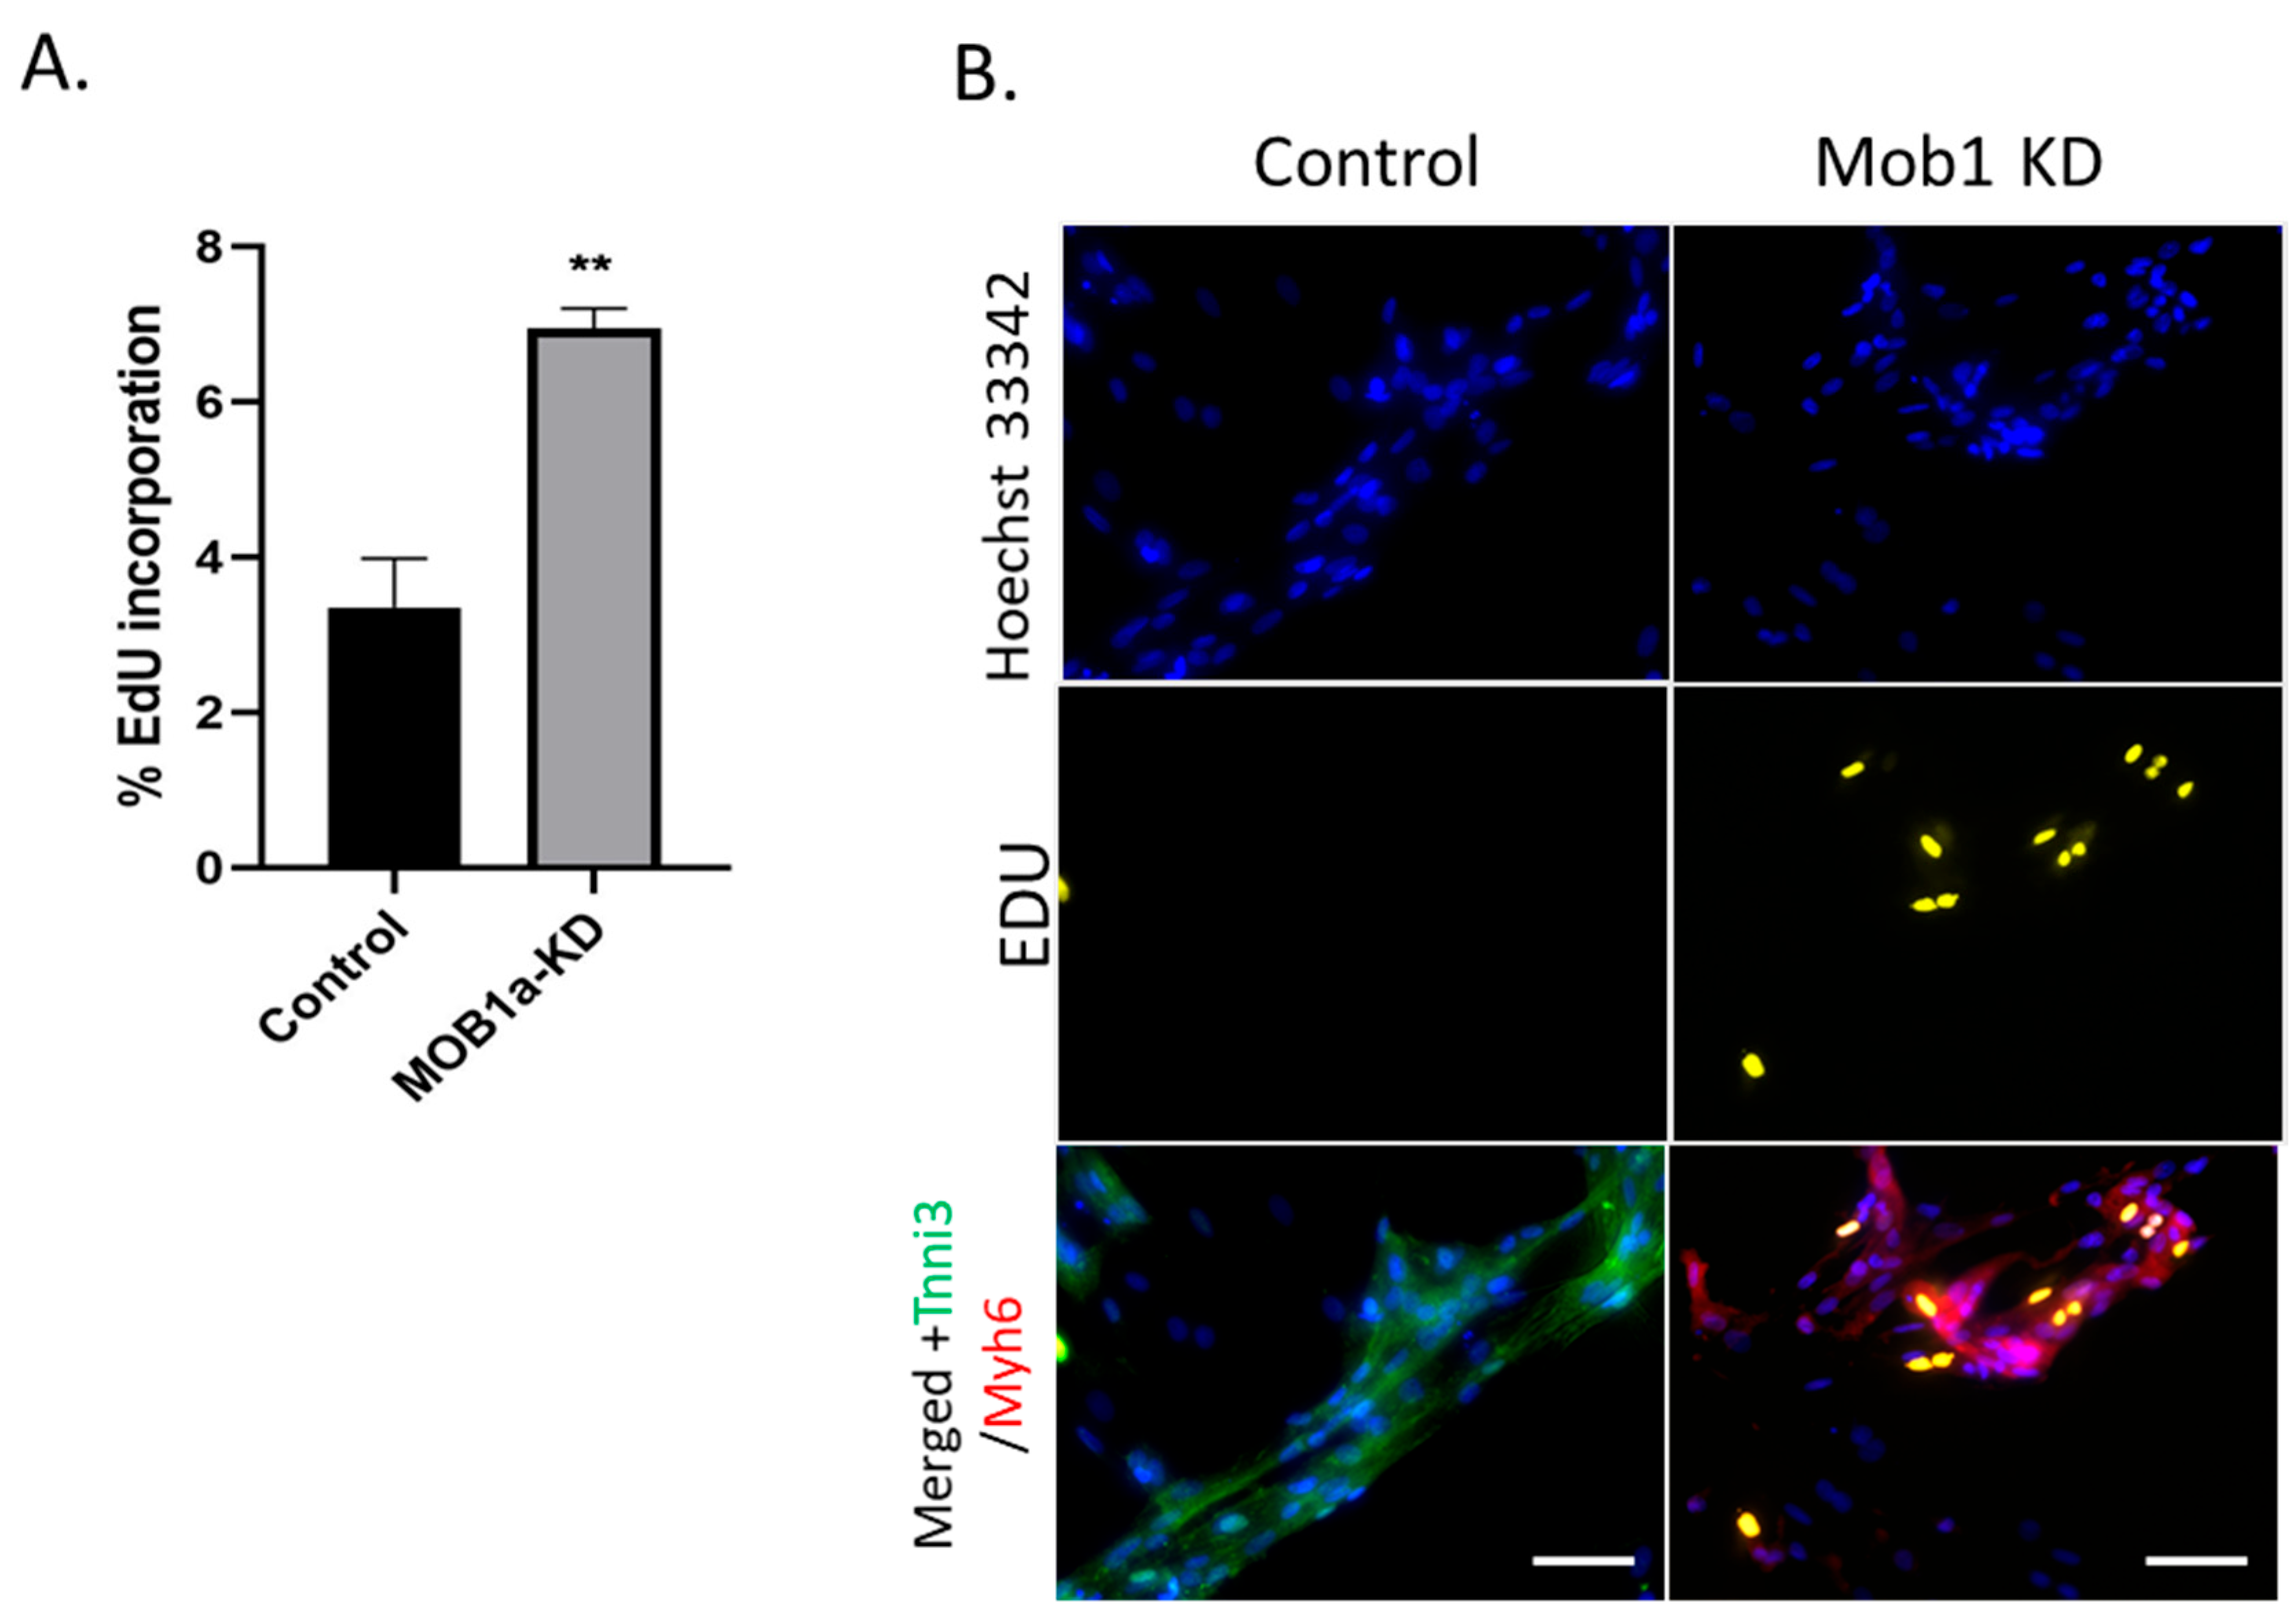
Figure 3.
MOB1 knockdown significantly increased cardiac myocyte confluency. Live cell imaging analysis of differentiated H9C2 treated with NC-1, MOB1, NF2 or SAV1 DsiRNA for 48h (Top) Image selection of the treatment groups at the time of the transfection (0 h) or 48h after transfection (48h) with an applied confluence mask. Scale represents 200 microns. (Bottom) Percentage of the confluency of the cells over time shows an increase in MOB1 KD cell confluency. Data is the mean of 2 independent experiments. Error bars represent the standard error.
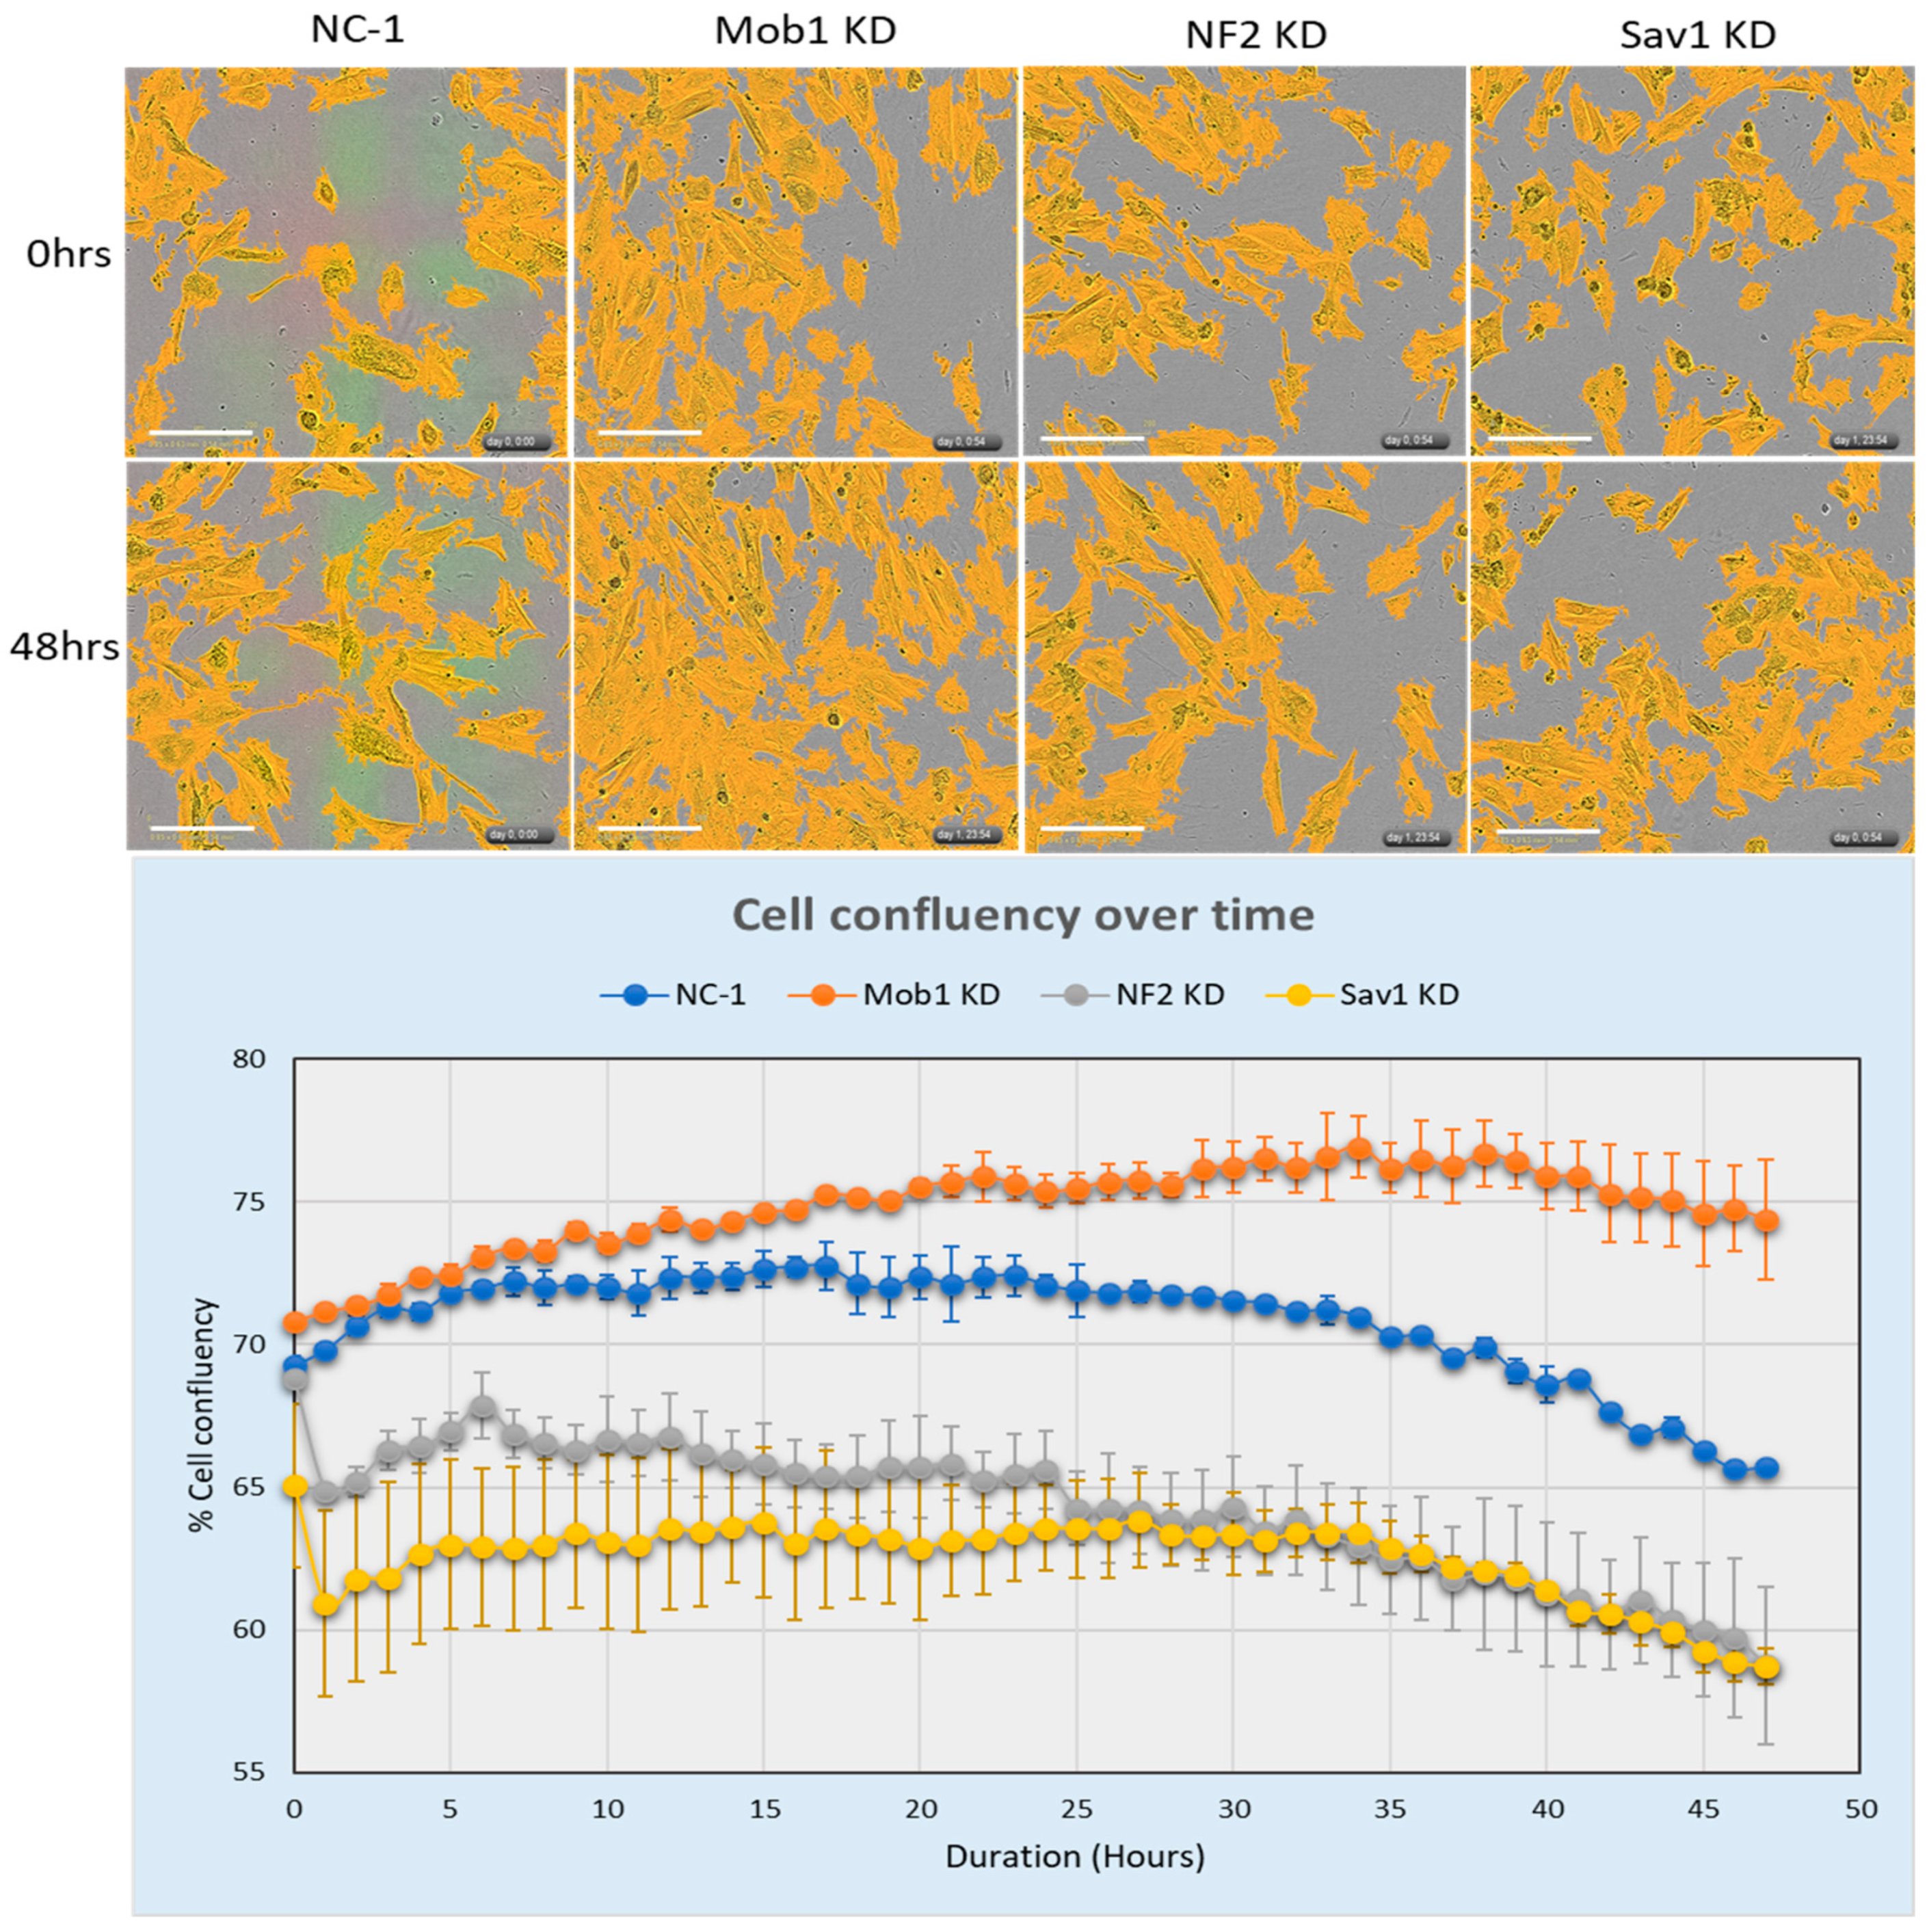
Figure 4.
Combination of NF2 and SAV1 knockdowns increased rat cardiomyocyte proliferation. Effect of DsiRNAs on rat neonatal cardiomyocyte proliferation were examined after 72 h post transfection. (A) EdU incorporation into synthesized DNA imaging. Imaging analysis representing the mean of 4 independent experiments, “*” indicates a significant difference between the indicated treatment (“*” indicates P<0.05; “**” indicates P<0.01; “***” indicates P<0.001). Error bars represent the SEM; (B) Western blot showing a decrease of both NF2 and SAV1 levels in double-knockdown (NF2 and SAV1) DsiRNA treated cells. Scale bars represent 100 microns.
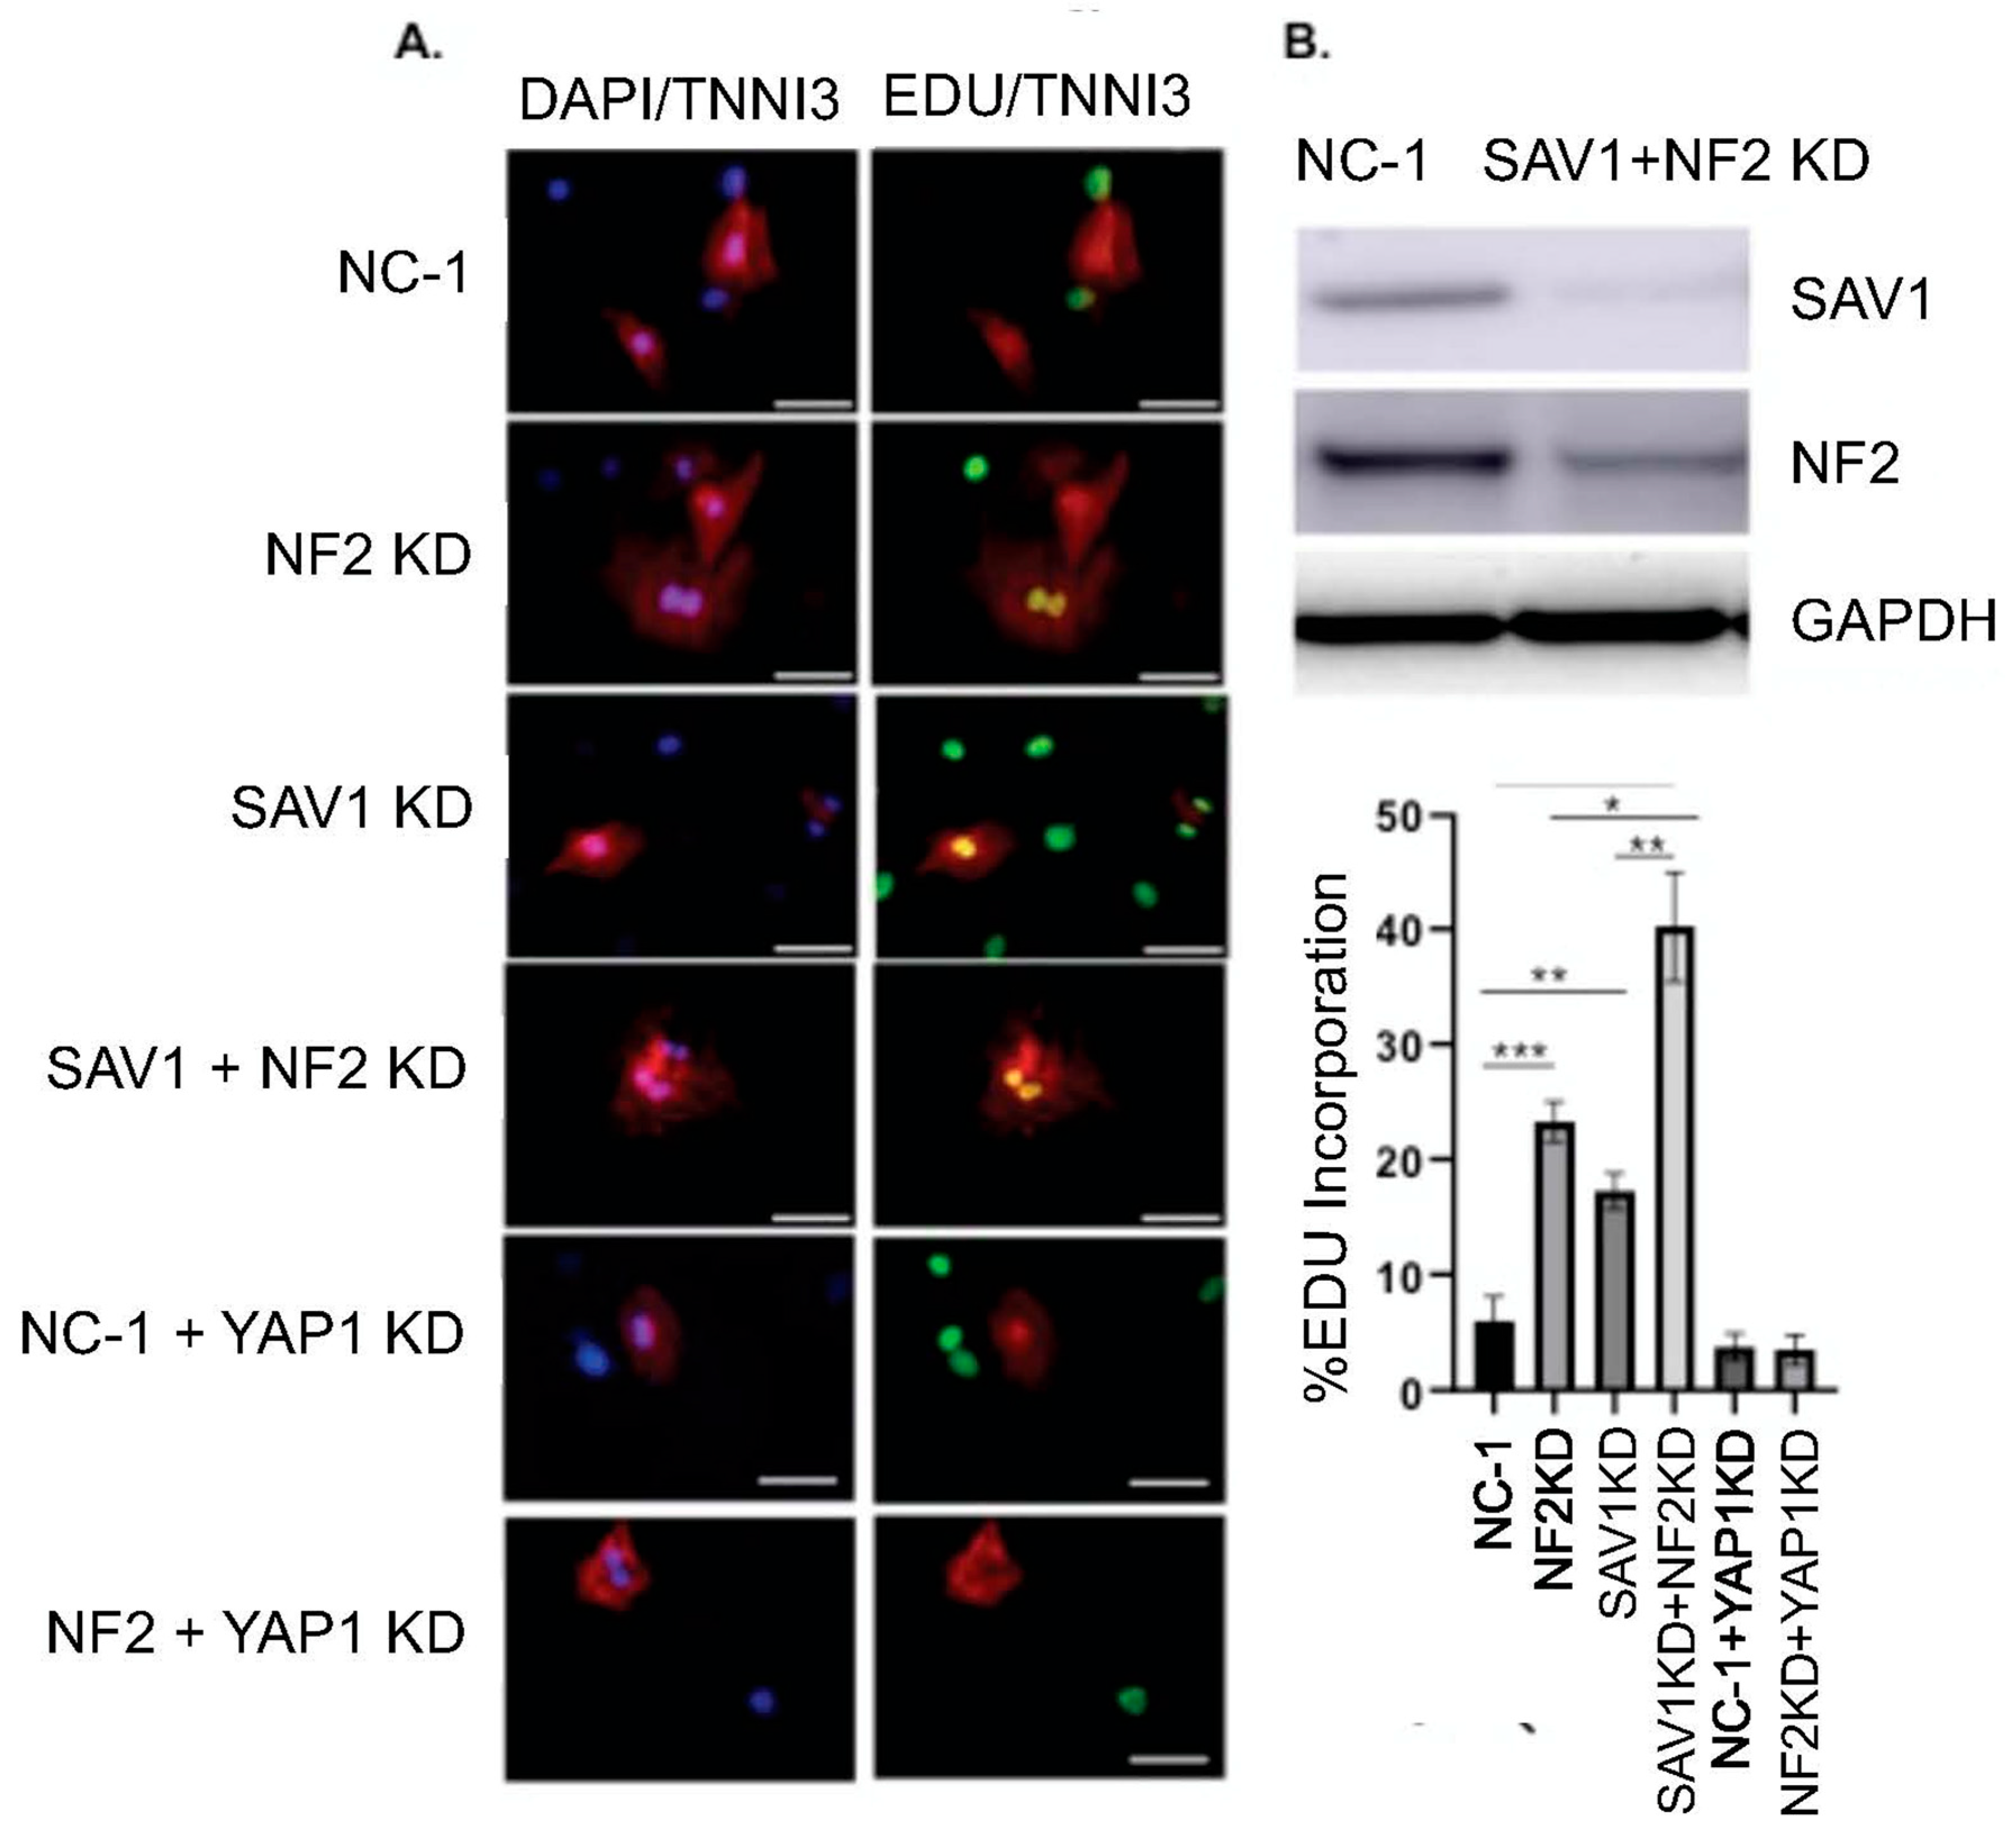
Figure 5.
Silencing MOB1 showed an increase of G1/S phase in a span of 48 h. Live cell imaging of neonatal cardiomyocytes transfected with the cell cycle ES-FUCCI system combined with MOB1 KD or control over 48 h (A) (right) MOB1 KD increases the number of cells reentering the cell cycle as detected by the number of red nuclei (objects) (Left) Select images of the three treatments 48 h post transfection showing cells in G1/S phase (red) and their detection by the live cell imaging system (Incucyte). Yellow arrows indicate cells in G1/S phase. Scale bars represent 300 microns.
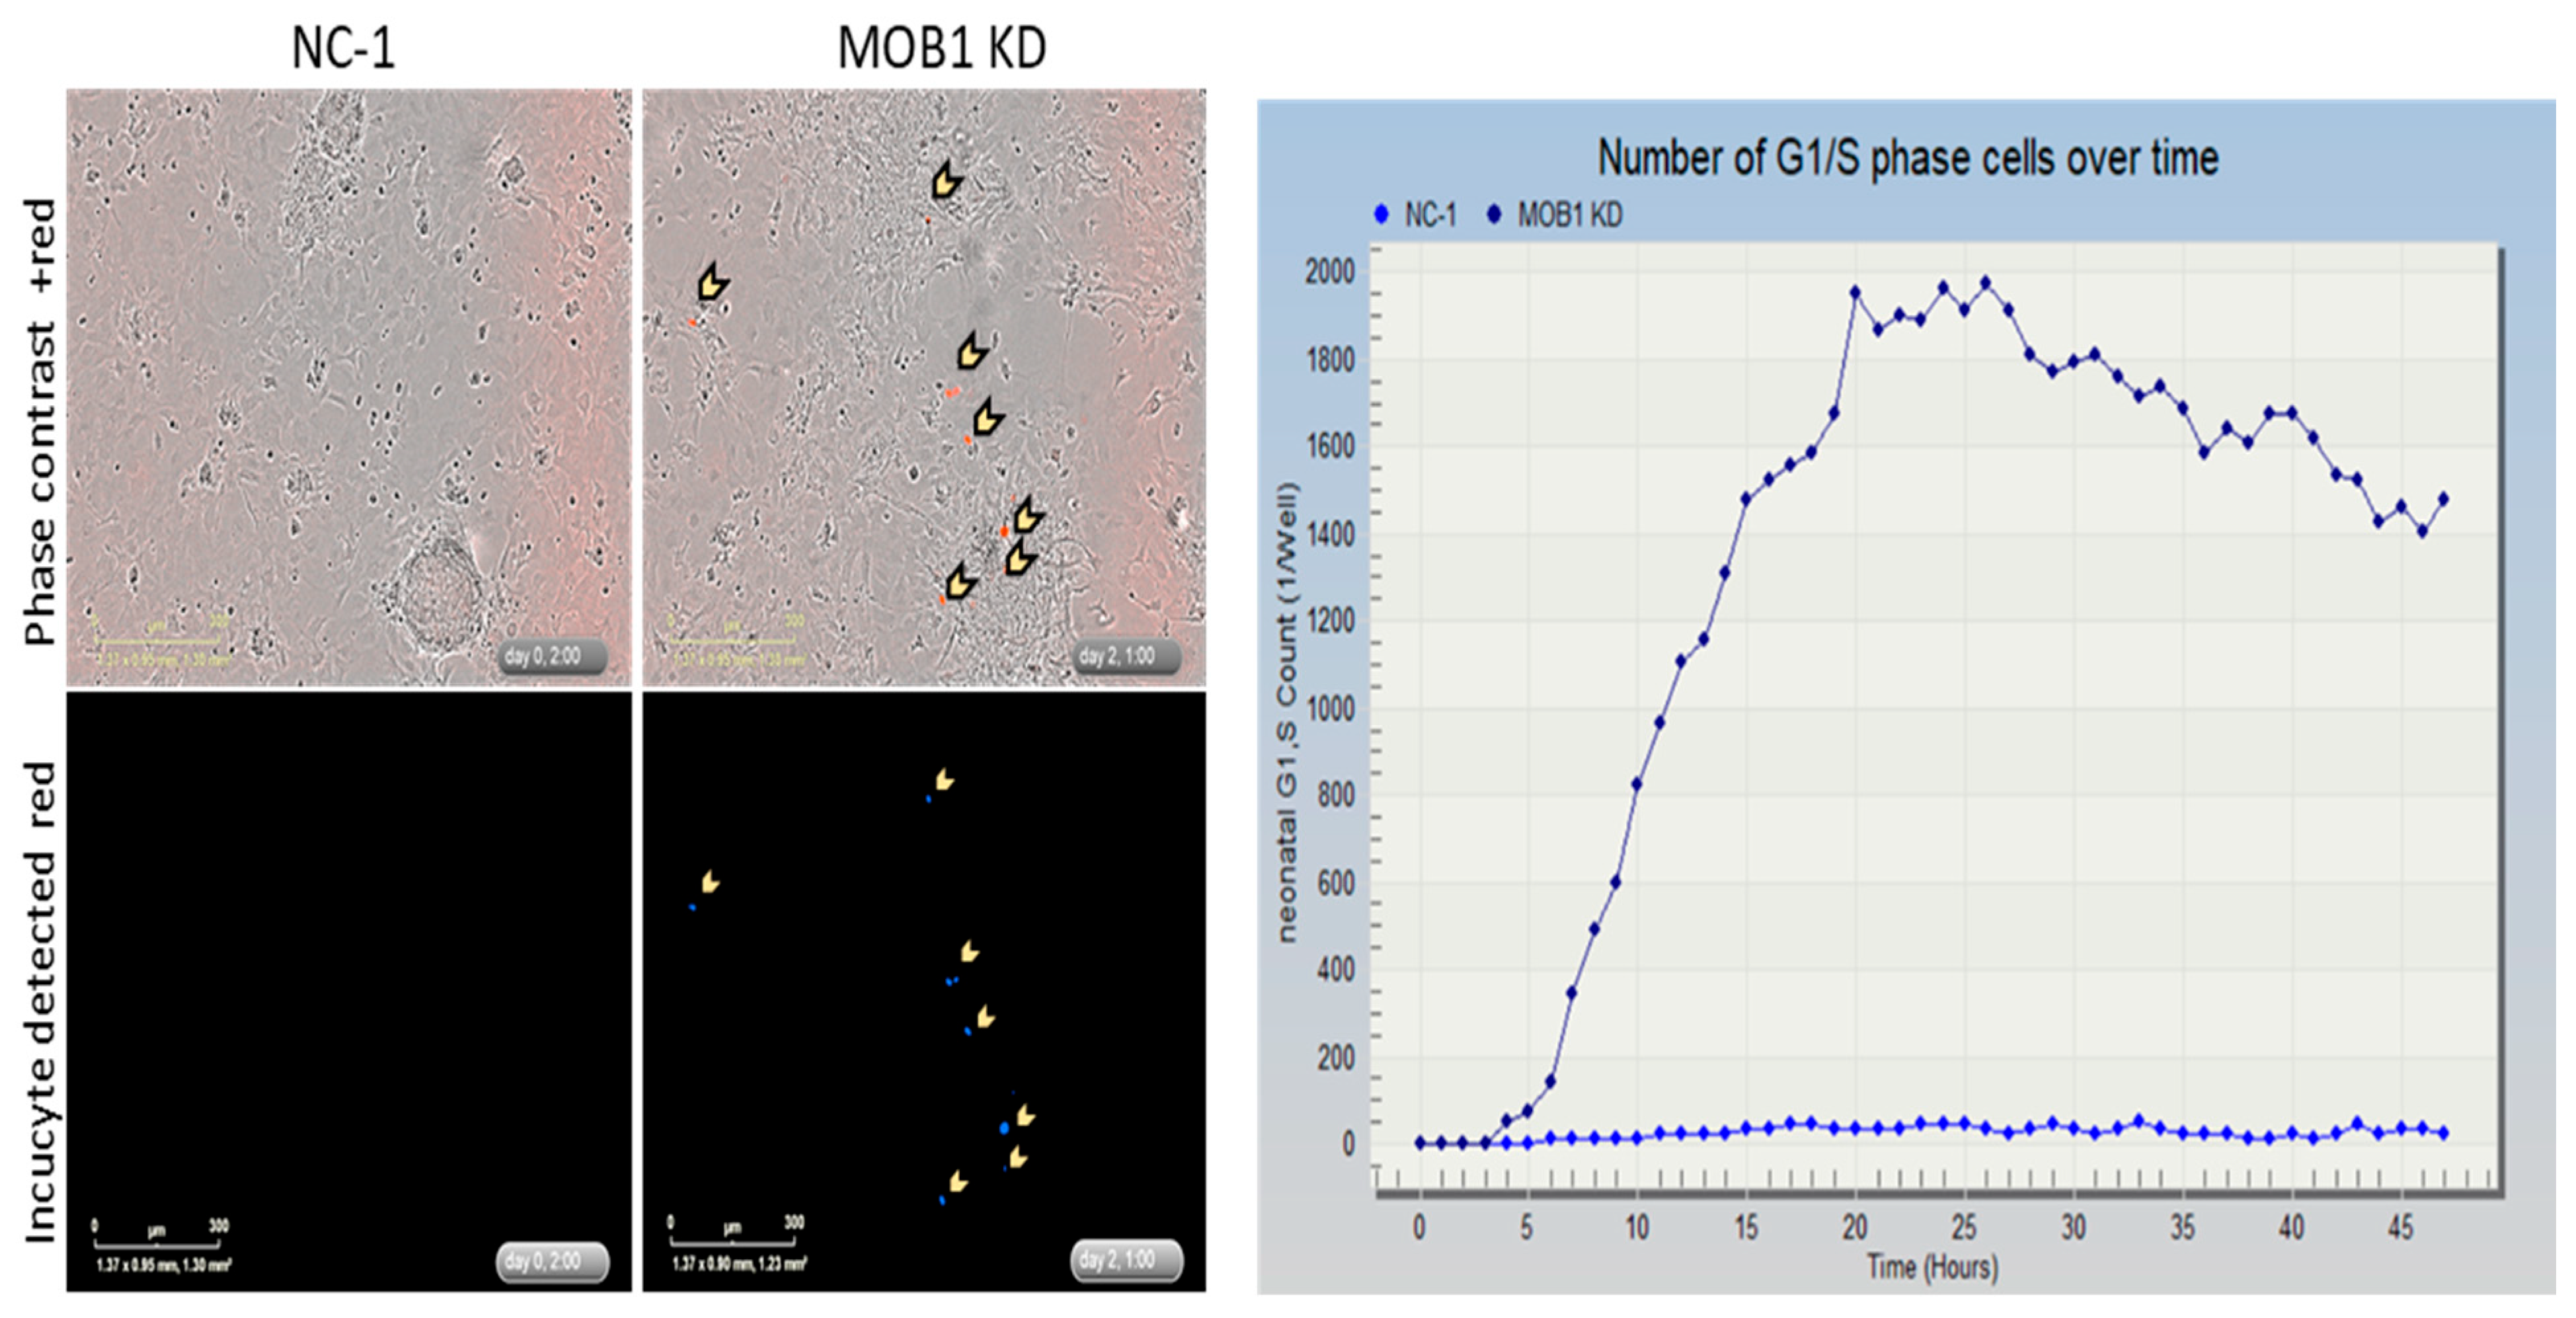
Figure 6.
Venns diagrams showed overlapping and unique pathways for NF2, SAV1 and MOB1 knockdown on rat neo-natal cardiomyocytes following 48h post DsiRNA transfections. (A) Upregulated pathways Venn diagram (B) Downregulated pathways Venn diagram.
Figure 6.
Venns diagrams showed overlapping and unique pathways for NF2, SAV1 and MOB1 knockdown on rat neo-natal cardiomyocytes following 48h post DsiRNA transfections. (A) Upregulated pathways Venn diagram (B) Downregulated pathways Venn diagram.
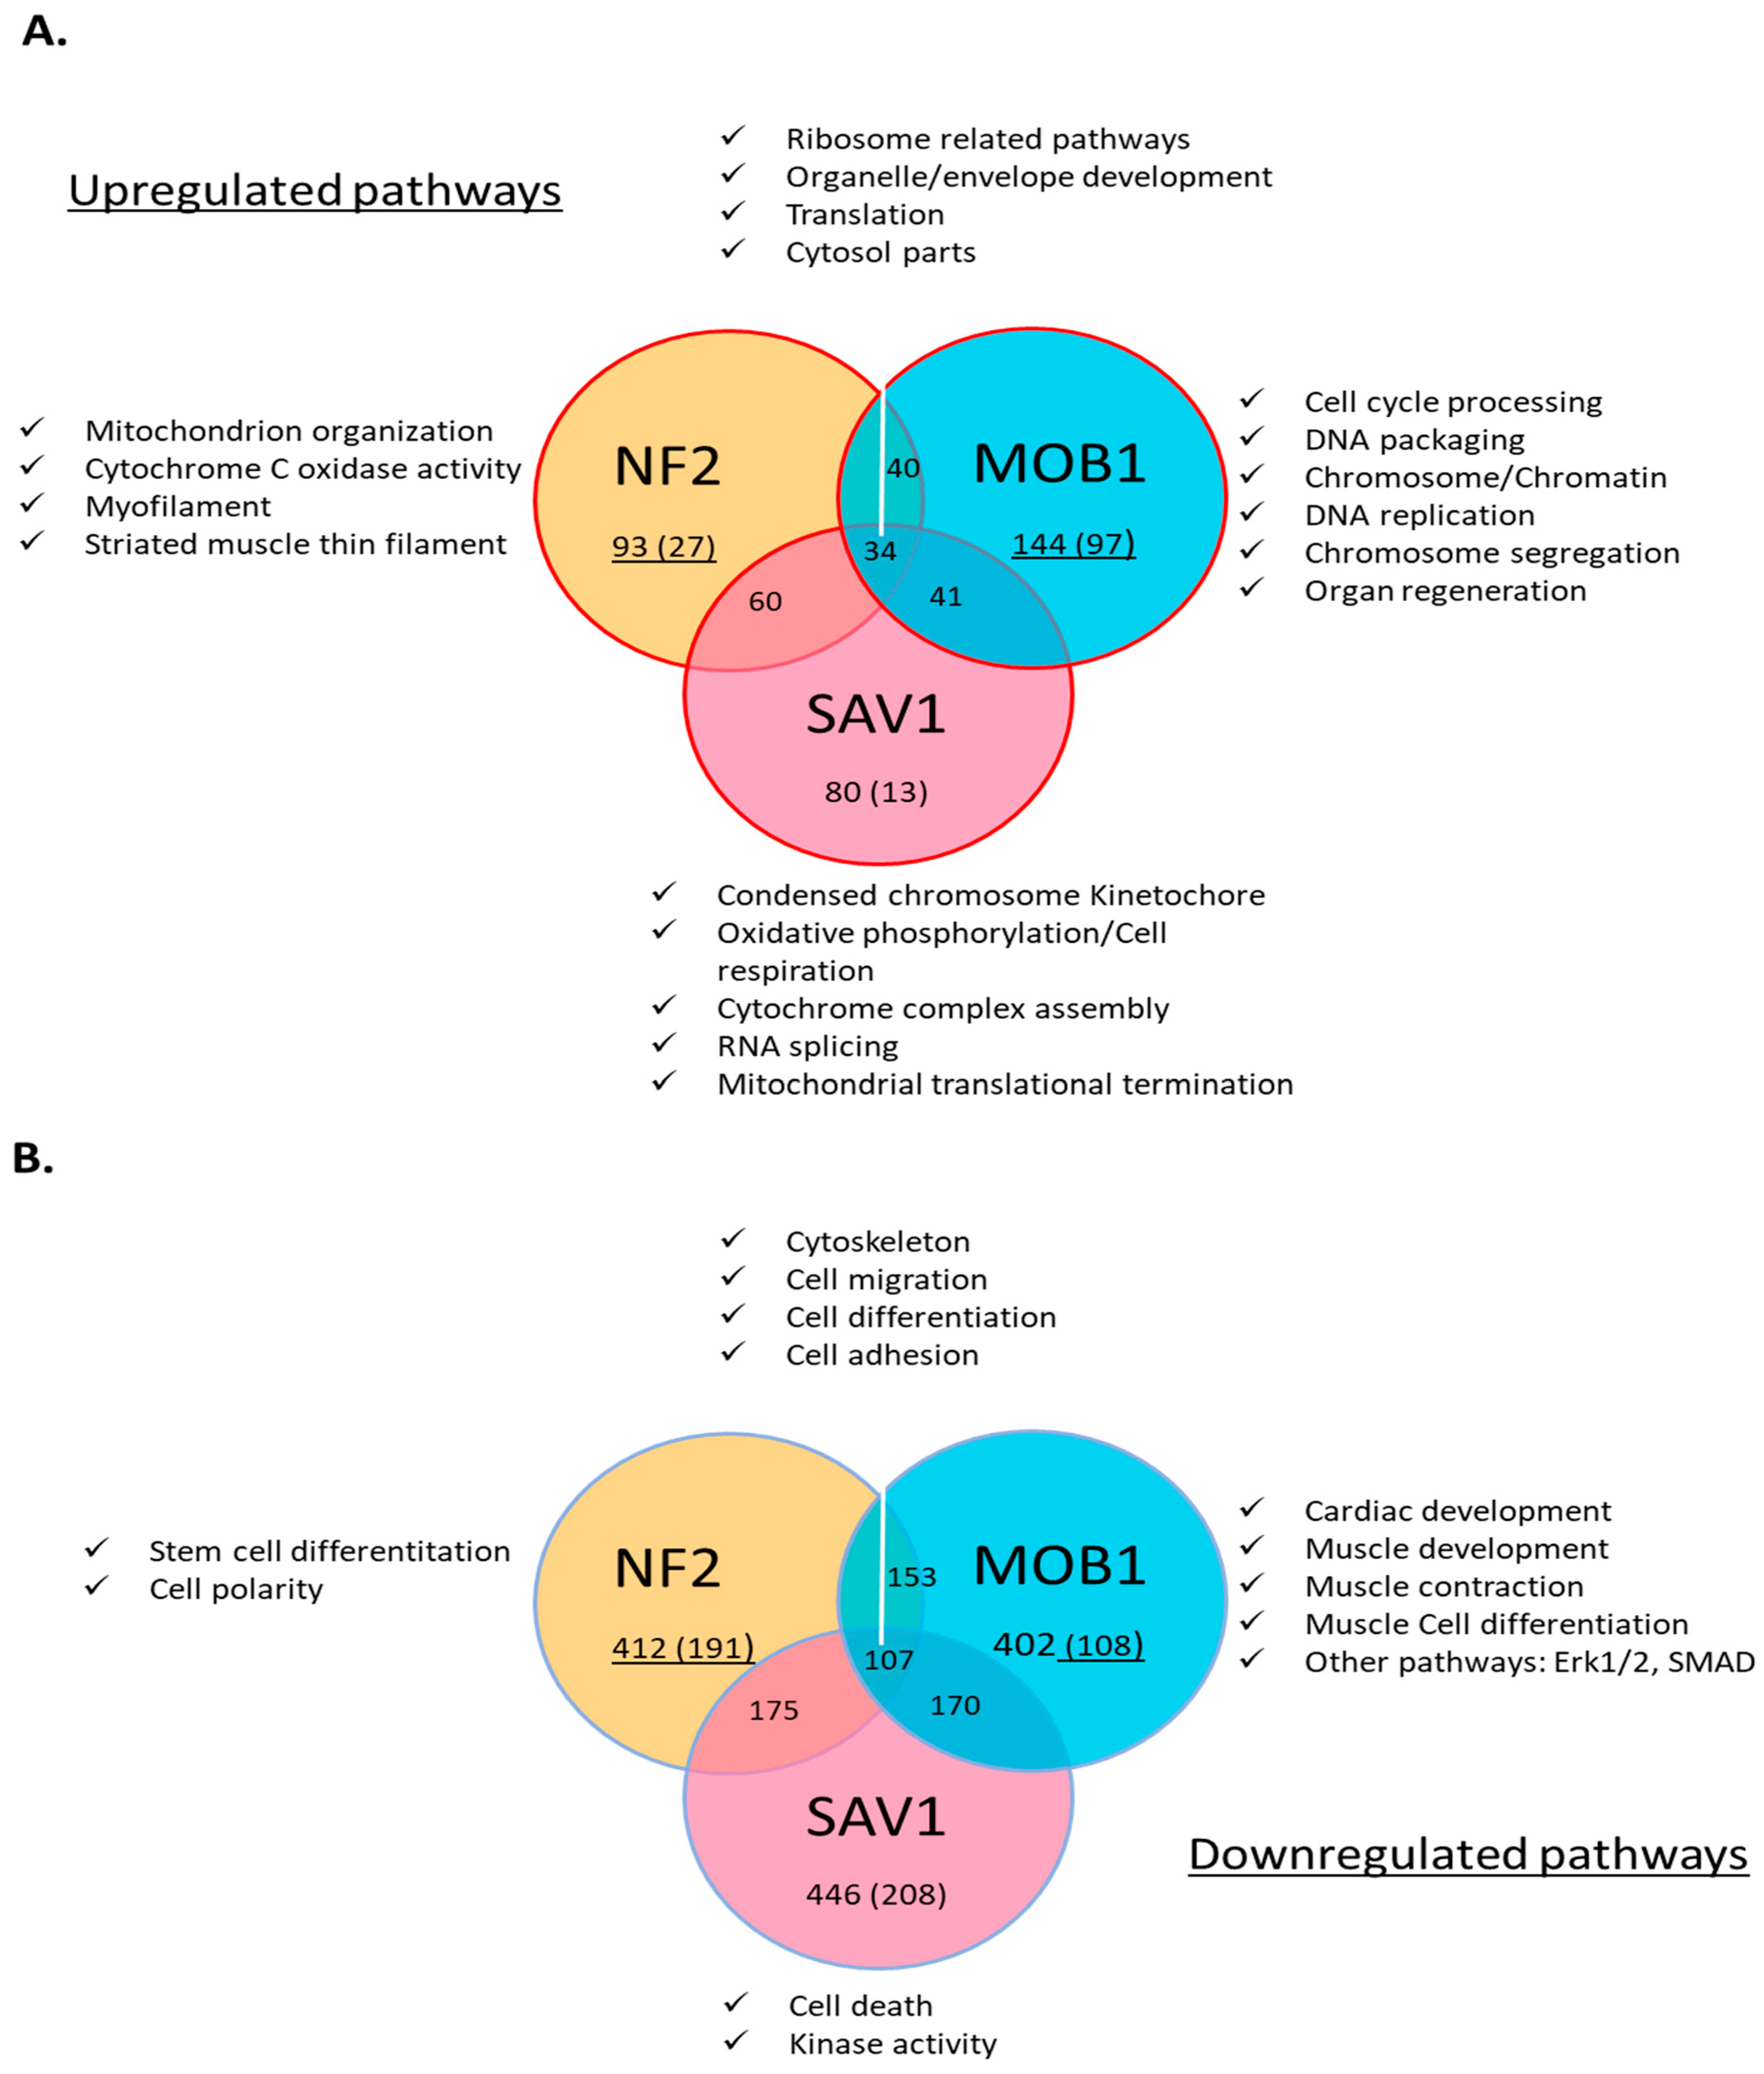
Figure 7.
Regulatory and gene expression pathways analysis following Mob1 knockdown on rat neo-natal cardiomyocytes. Analysis of post DsiRNA transfection after 48 hr and representation of relevant pathways for cell proliferation and cardiac dedifferentiation. (A) (left) top 15 downregulated pathways (right) top 15 upregulated pathway. Normalized enrichment score (NES) is represented. (B) Cell cycle pathways upregulated after MOB1 knockdown and heat map representation of relevant genes (C) Heat map of relevant gene expression related to muscle and heart differentiation and contraction and downregulated pathways.
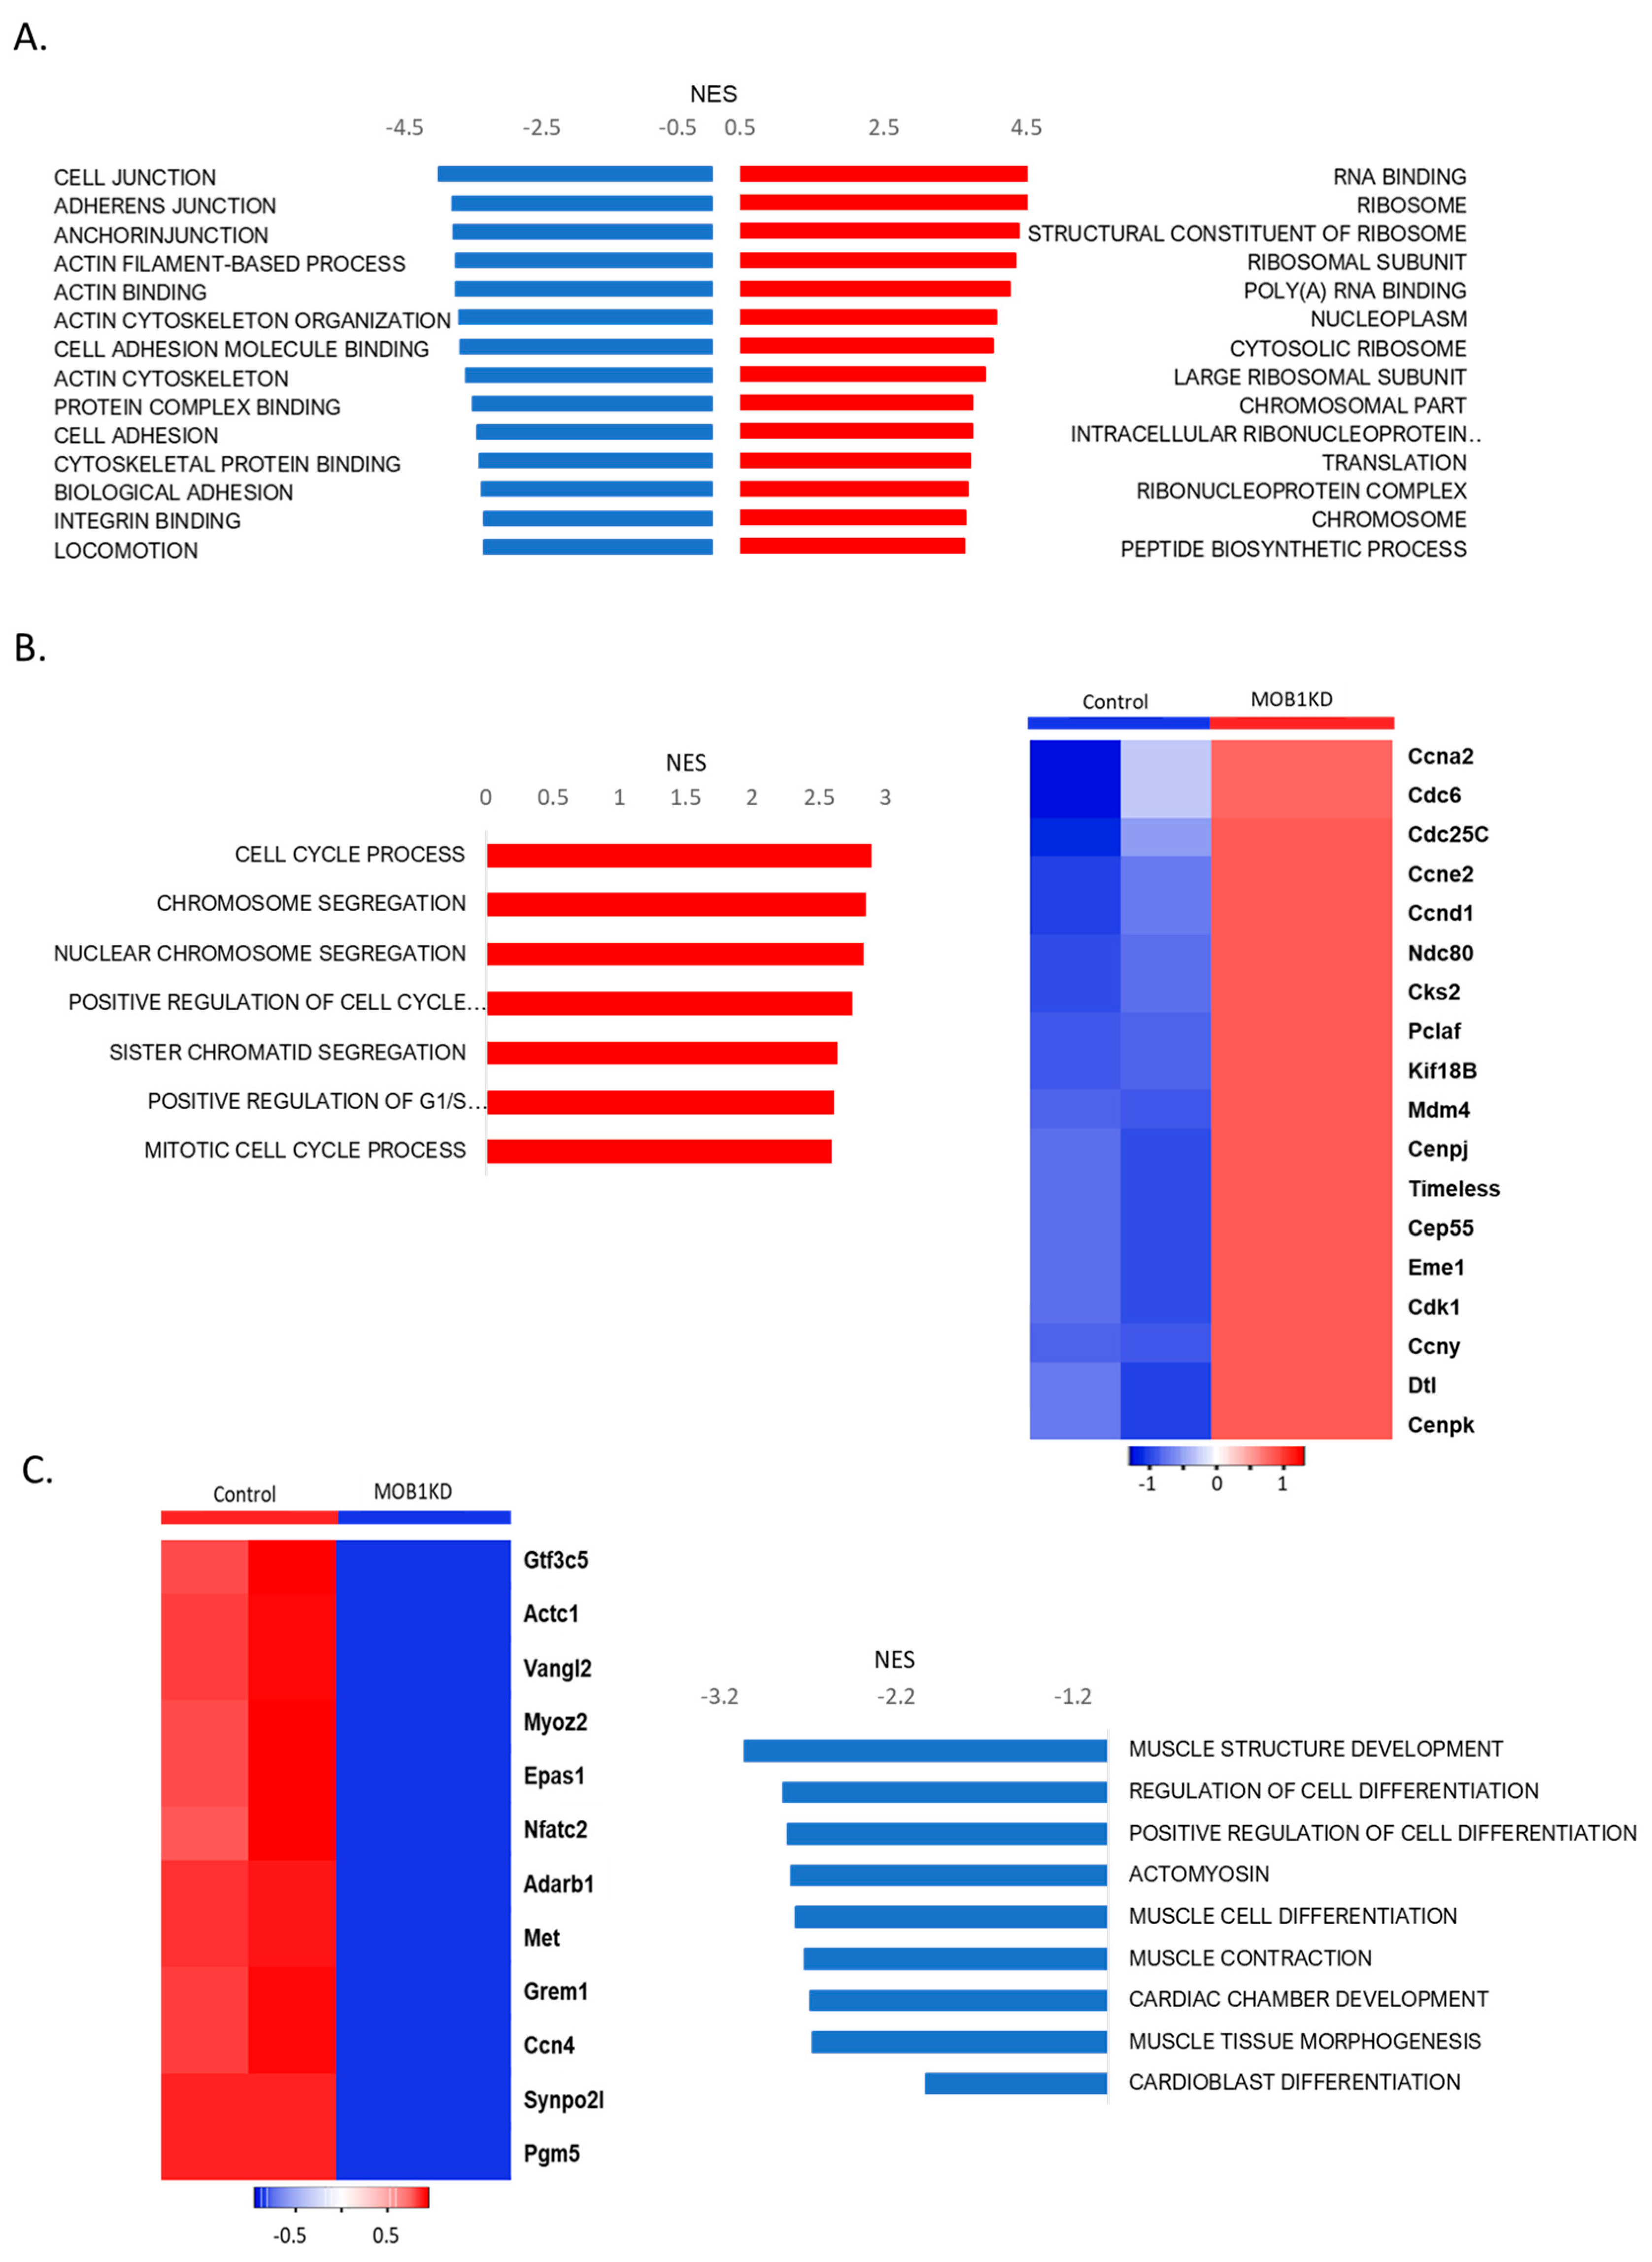

Table 1.
List of DsiRNAs used (IDT Technology).
| Gene | Rat DsiRNA IDT ID | Mouse DsiRNA IDT ID |
| NF2 | rn.Ri.NF2.13.1 rn.Ri.NF2.13.2 |
mm.Ri.NF2.13.1 mm.Ri.NF2.13.2 mm.Ri.NF2.13.3 |
| MOB1a |
rn.Ri.MOB1a.13.1 rn.Ri.MOB1a.13.2 |
mm.Ri.MOB1a.13.1 mm.Ri.MOB1a.13.2 mm.Ri.MOB1a.13.3 |
| SAV1 |
rn.Ri.SAV1.13.1 rn.Ri.SAV1.13.2 |
mm.Ri.SAV1.13.1 mm.Ri.SAV1.13.2 mm.Ri.SAV1.13.3 |
| YAP1 | rn.Ri.YAP1.13.1 rn.Ri.YAP1.13.2 rn.Ri.YAP1.13.3 |
NA |
| NA | ||
| NA | ||
| NC-1 (Control DsiRNA) | Negative Control (DS NC1) | Negative Control (DS NC1) |
Disclaimer/Publisher’s Note: The statements, opinions and data contained in all publications are solely those of the individual author(s) and contributor(s) and not of MDPI and/or the editor(s). MDPI and/or the editor(s) disclaim responsibility for any injury to people or property resulting from any ideas, methods, instructions or products referred to in the content. |
© 2025 by the authors. Licensee MDPI, Basel, Switzerland. This article is an open access article distributed under the terms and conditions of the Creative Commons Attribution (CC BY) license (http://creativecommons.org/licenses/by/4.0/).
Copyright: This open access article is published under a Creative Commons CC BY 4.0 license, which permit the free download, distribution, and reuse, provided that the author and preprint are cited in any reuse.


