Submitted:
03 July 2023
Posted:
04 July 2023
You are already at the latest version
Abstract
Hypertrophic Cardiomyopathy (HCM) is a common inherited disorder that can lead to heart failure and sudden cardiac death, characterized at the histological level by focal areas of myocyte disarray, hypertrophy and fibrosis, and few disease-targeted therapies exist. To identify, focal, spatially restricted alterations in transcriptional pathways and reveal novel therapeutic targets, we performed a spatial transcriptomic analysis of areas of focal myocyte disarray compared to areas of normal tissue, using a commercially available platform (GeoMx, nanoString). We analyzed surgical myectomy tissue from four patients with HCM and control interventricular septum tissue from two unused organ donor hearts that were free of cardiovascular disease. Histological sections were reviewed by an expert pathologist and 72 focal areas with varying degrees of myocyte disarray (normal, mild, moderate, severe) were chosen for analysis. Areas of interest were interrogated with the Human Cancer Transcriptome Atlas designed to profile 1800 transcripts. Differential expression analysis revealed significant changes in gene expression between HCM and Control tissue, and functional enrichment analysis indicated these genes were primarily involved in interferon production and mitochondrial energetics. Within HCM tissue, differentially expressed genes between areas of mild and moderate disarray were enriched for genes related to mitochondrial energetics (moderate disarray) and response to oxygen/cytokine levels (mild disarray). The comparison between areas of moderate and severe disarray were enriched for genes related to the c-Jun N-terminal kinase (JNK) cascade in severe disarray. Analysis of ligand-receptor pair gene expression revealed that HCM tissue exhibited downregulation of platelet-derived growth factor (PDGF), NOTCH, junctional adhesion molecule, and CD46 signaling, while showing upregulation of fibronectin, CD99, cadherin, and amyloid precursor protein signaling. A deconvolution analysis utilizing the matched single nuclei RNA-sequencing (snRNA-seq) data to determine cell type composition in areas of interest revealed significant differences in fibroblast and vascular cell composition in areas of severe disarray when compared to normal areas in HCM samples. Cell composition in normal areas from control tissue was also divergent from normal areas in HCM samples, which was consistent with the differential expression results. Overall, our data identify novel and potential disease-modifying targets for therapy in HCM.
Keywords:
Hypertrophic Cardiomyopathy
; spatial transcriptomics
; single nucleus RNA-sequencing
; gene expression
; bioinformatics
; cardiovascular disorder
; genetic disorder
1. Introduction
Hypertrophic Cardiomyopathy (HCM) is an inherited disorder affecting between 1 in 500 and 1 in 200 people. The disease is characterized by unexplained left ventricular hypertrophy that is often asymmetric, involves the interventricular septum, and is associated with left ventricular outflow tract (LVOT) obstruction, fibrosis, microvascular occlusion, and sudden cardiac death. Histologically it is characterized by focal areas of myocyte hypertrophy, myocyte disarray, fibrosis, and medial hyperplasia. Anatomically it is characterized by mitral valve abnormalities and left ventricular outflow tract obstruction. Physiologically it is characterized by enhanced contractile function, reduced diastolic function and increased risk of sudden cardiac death [1]. Traditionally HCM is considered a disease that ensues from sarcomere gene dysfunction, but in most patients, pathogenic sarcomere gene mutations cannot be identified. Activation of signaling pathways that promote cardiac myocyte hypertrophy and fibrosis of the heart have been implicated in many studies [2], but additional mechanisms are likely contributing. Comprehensive studies to understand how sarcomere gene mutations can lead to phenotypes not related to sarcomere function or that are seen in cells that do not express sarcomere genes are lacking in the field. Since sarcomere gene mutation-negative patients have similar phenotypes to sarcomere gene mutation- positive patients, it is likely that there are final common pathological pathways independent of sarcomere gene mutations that are involved, but these final common pathways are incompletely understood. Recent reports using single nucleus RNA-sequencing of human HCM tissue have identified potential alterations in cell-to-cell communication involving extracellular matrix proteins, integrin receptors and activation of immune cells as potential contributors to the HCM phenotype [3-5]. These studies, however, did not determine how these alterations in single cell transcription and intercellular communication are spatially organized in the context of known histopathological features of HCM. To identify changes in gene expression associated with focal areas of myocyte disarray, we performed a spatial transcriptomic analysis of genes expressed in these areas that included identification of differentially expressed genes (DEGs), a gene ontology (GO) analysis to assign DEGs to molecular function, a Ligand-Receptor (L-R) gene expression analysis to infer cell-cell communication, and a deconvolution analysis to determine the cell type composition in these areas. Here we report that areas of focal myocyte disarray show altered expression of genes involved in interferon production, mitochondrial energetics, the response to oxygen/cytokine levels, and the JNK cascade that may also reflect changes in cellular composition. Furthermore, these areas also show dysregulation of PDGF and cadherin signaling that may be relevant to the pathogenesis of HCM.
2. Results
2.1. Identification of Focal Areas of Myocyte Disarray and Designation of Regions of Interest
HCM and control patient sections were stained with morphology markers desmin, fibroblast activator protein, CD45 and nuclear DNA using Syto83 as described in methods. Representative images from HCM sample 2799 and control sample 2879 are shown in Figure 1. Representative Regions of Interest (ROIs), also called Areas of Interest (AOIs) are indicated and shown at higher magnification.
2.2. Identification of Differentially Expressed Genes and Associated Pathways in Areas of Disarray
The bioinformatic analysis pipeline for identification of differentially expressed genes (DEGs) between sets of ROIs and associated functional enrichment is shown schematically in Figure 2A. DEGs were determined in pairwise comparisons between sets of ROIs classified by degree of myocyte disarray and patient HCM status (Figure 3A, Supplemental Table 1). Given the low number of ROIs that passed quality control, areas of mild disarray from control patients were excluded from further analysis. We chose to focus on three comparisons to assess the progression of HCM: normal disarray ROIs between HCM and control patients, moderate to mild disarray ROIs within HCM patients, and severe to moderate disarray ROIs within HCM patients. The largest number of DEGs was obtained in comparison of normal disarray ROIs between HCM and control patients, suggesting that the phenotype itself is associated with large changes in gene expression, while the fewest DEGs were found in the comparison between moderate and severe disarray levels in HCM patients (Figure 2A, Supplemental Figure 1A). Gene Ontology enrichment analysis revealed an upregulation in genes related to mitochondrial energetics and a downregulation of genes involved in interferon production in HCM ROIs of varying levels of disarray compared to normal control ROIs (Figure 3B, Supplemental Figure 1B). Within HCM patients, moderate disarray ROIs showed a weaker upregulation in genes associated with mitochondrial energetics and a downregulation in genes that mediate the response to oxygen levels and cytokines when compared with mild disarray ROIs and severe disarray ROIs show an upregulation of genes related to the JNK cascade compared to moderate disarray ROI (Figure 3B). Interestingly, there was a large overlap between DEGs obtained in the comparison of control normal and HCM normal ROIs and other comparisons between control normal and HCM with more disarray (Supplemental 1A). This overlap was even more pronounced in the GO categories obtained by performing GO enrichment of the DEGs obtained from these comparisons (Supplemental 1B). This suggests that the HCM genotype itself is associated with strong gene expression changes.
2.3. Identification of Potentially Altered Cell-Cell Interactions in Areas of Myocyte Disarray
The bioinformatic analysis pipeline for identification of Ligand-Receptor (L-R) pairs that are differentially expressed in areas of myocyte disarray is shown schematically in Figure 2A and further explained in Figure 4A. Differentially expressed genes were determined in pairwise comparisons between ROIs classified by degree of myocyte disarray and overall patient HCM status, as described above. The gene sets from each comparison were separated by whether they were down or upregulated. The gene sets were then compared to the CellChat Interaction Database [6] to identify Ligand-Receptor pairs that were both present in either the up or downregulated gene sets, and which pathway the Ligand-Receptor pair was associated (Supplemental Table 2). Here we note that, like the differential expression results, significant Ligand-Receptor pairs are observed when comparing ROIs obtained from HCM patients with varying levels of disarray to ROIs obtained from control patients. Although the GO enrichment analysis of the DEGs between control normal ROIs and HCM ROIs with varying levels of disarray did not uncover differences in GO terms, there were differences in the CellChat pathways associated with significant ligand-receptor DEG pairs. In HCM patients compared to control patients, normal disarray areas show a downregulation of CD46, junctional adhesion molecule, neurotrophin, and NOTCH signaling, while cadherin, CD99, and fibronectin signaling are upregulated. Areas of mild disarray in HCM patients are downregulated for junctional adhesion molecule and neurotrophin signaling, and upregulated for cadherin, CD99, fibronectin, and amyloid precursor protein signaling compared to normal disarray areas in control patients. Moderate disarray areas in HCM patients are downregulated for CD46, neurotrophin, and platelet-derived growth factor signaling, and upregulated for cadherin signaling compared to normal disarray areas in control patients. Severe disarray areas in HCM patients are downregulated for CD46, junctional adhesion molecule, neurotrophin, NOTCH, and platelet-derived growth factor signaling, and upregulated for cadherin signaling compared to normal disarray areas in control patients. Interestingly, CD99 signaling is upregulated in HCM normal/mild ROIs compared to control normal ROIs but downregulated in HCM moderate/severe ROIs compared to HCM normal ROIs. Also, JUN kinase signaling is upregulated in areas of severe disarray compared to areas of moderate disarray. The greatest number of Ligand-Receptor pairs driving these pathways is observed in platelet-derived growth factor signaling, followed by NOTCH signaling. All other pathways have one Ligand-Receptor pair per disarray level comparison.
2.4. Determination of Cell Type Composition in Areas of Myocyte Disarray
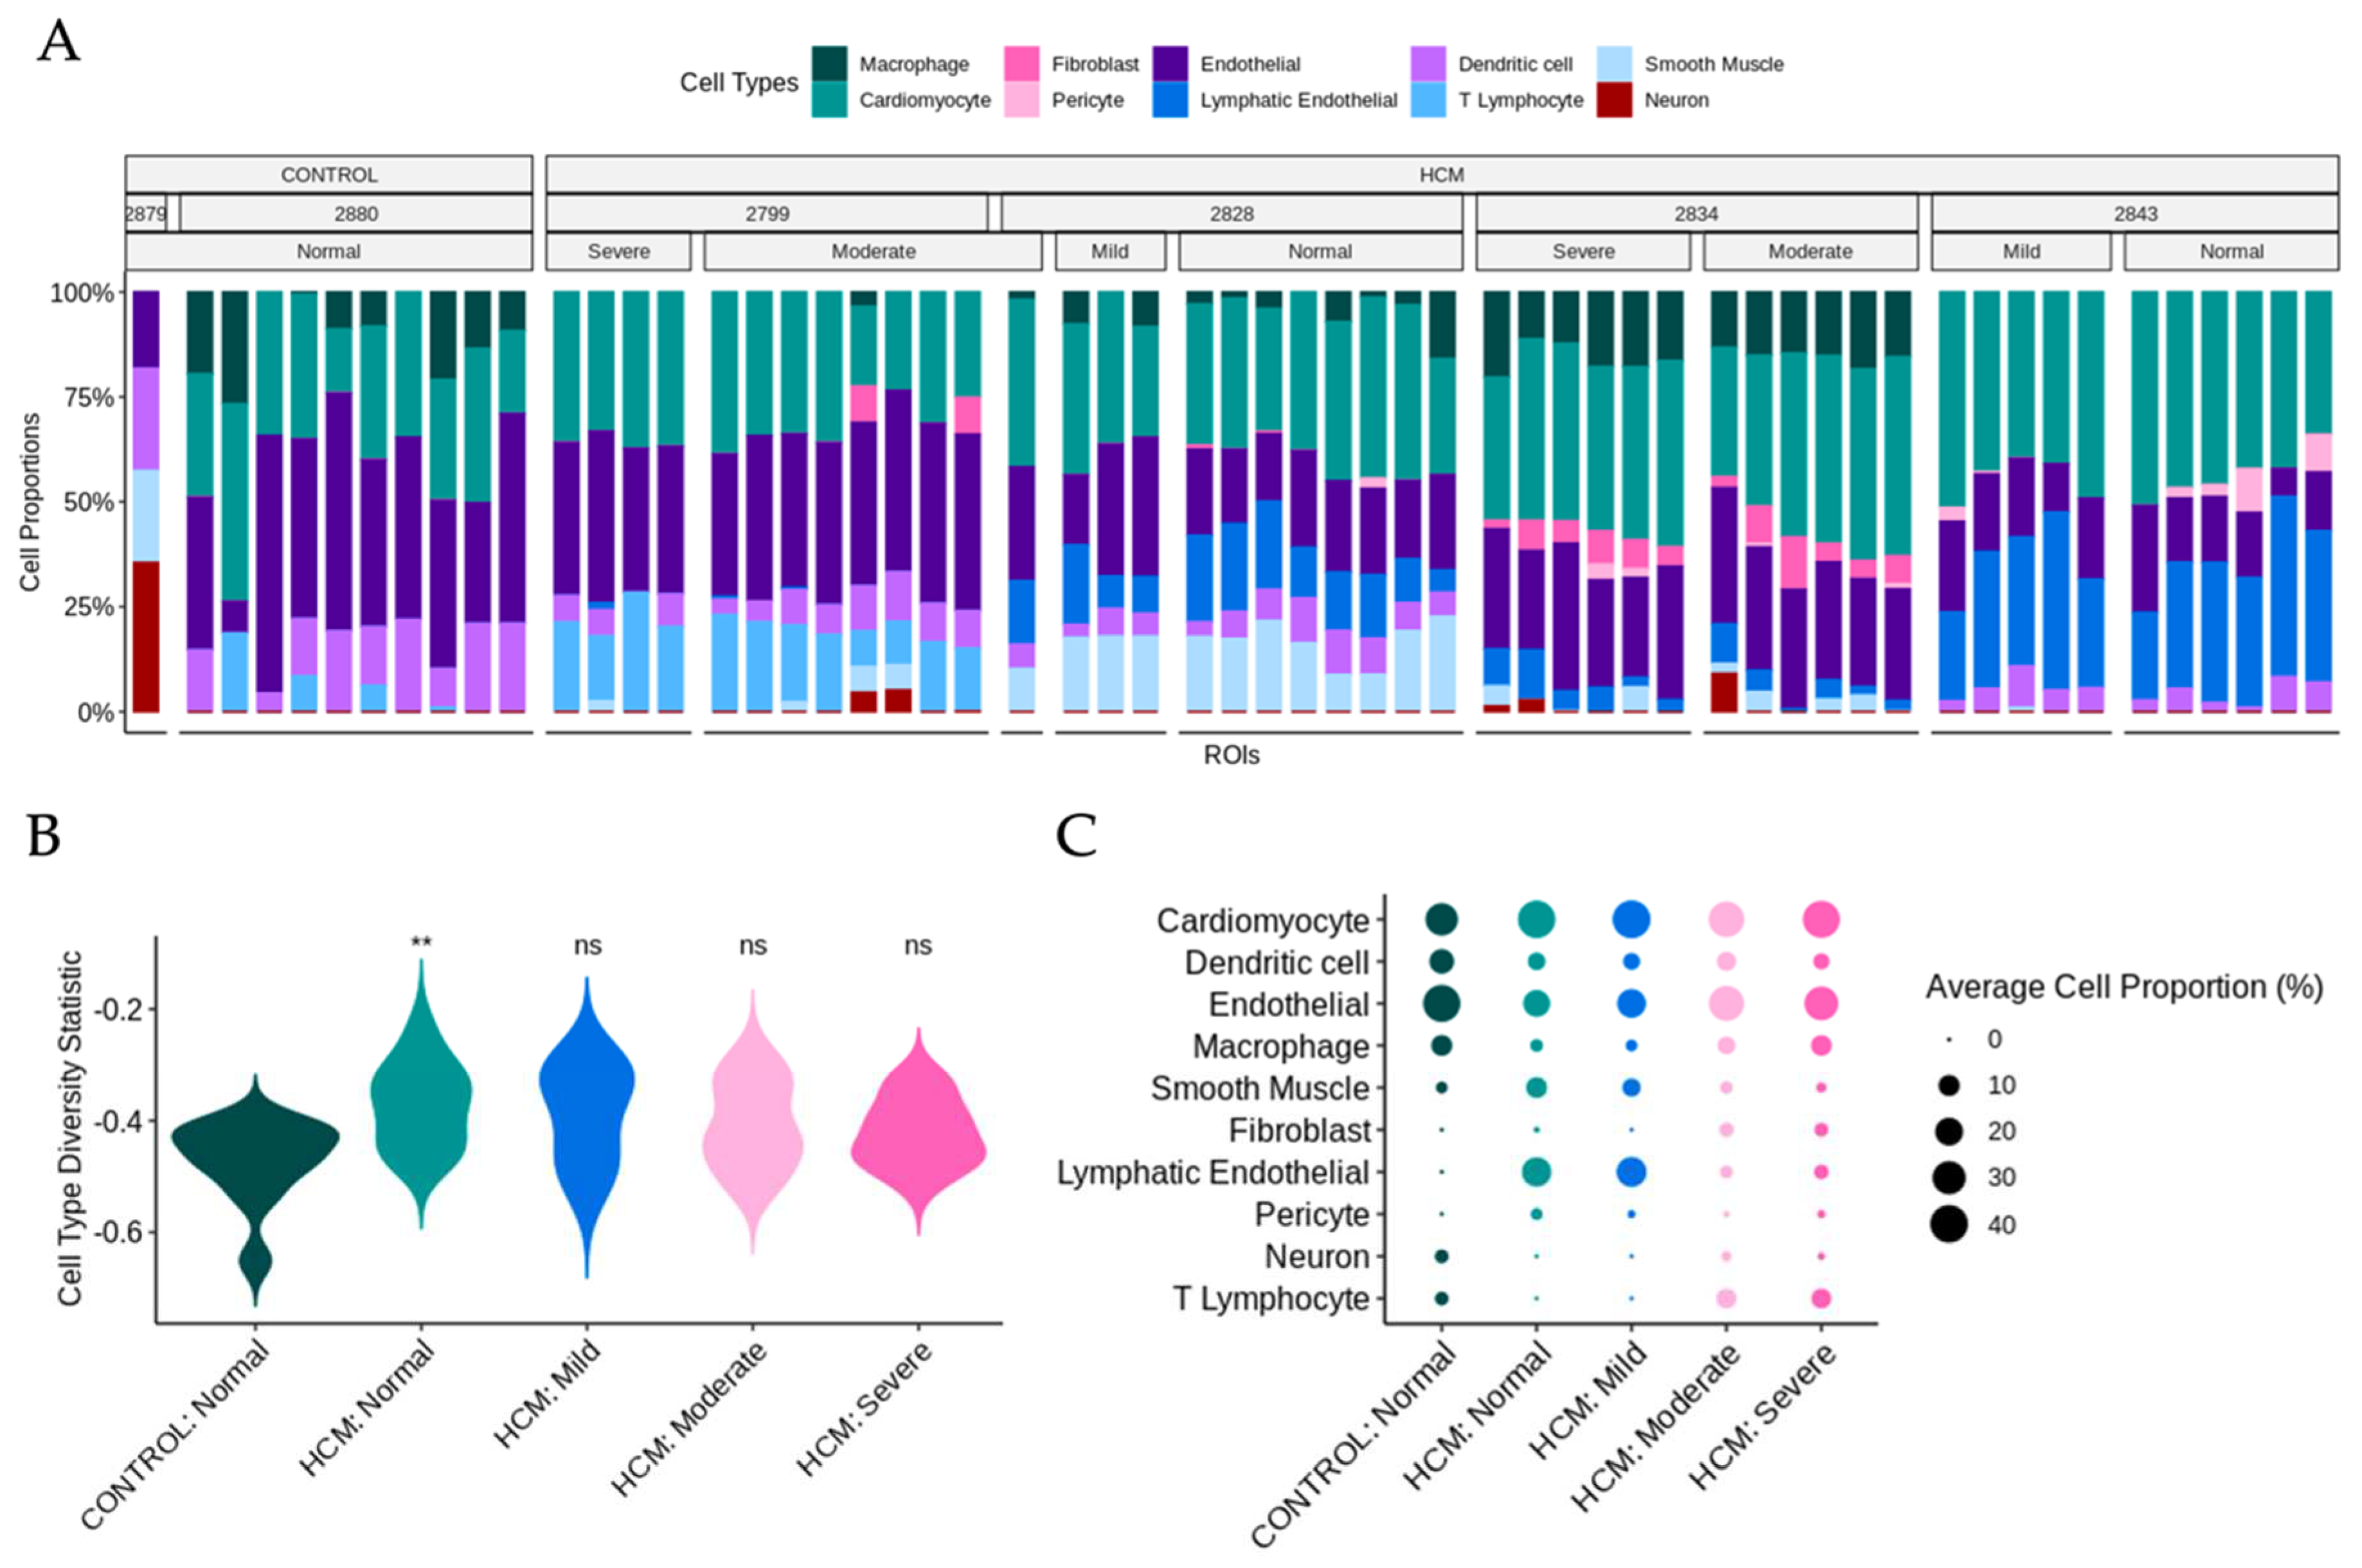
Previously published snRNA-seq datasets from the patients in this study were reanalyzed to determine cell-type composition [3-5, 7] . UMAP plots and a dot plot showing cell clusters and cell identity assignments separated by disease label are shown in Supplemental Figure 2. To determine whether the cell type composition differs in areas of myocyte disarray compared to normal and in HCM vs control, we performed a deconvolution analysis (Methods) [8] using genes present in both the snRNA-seq data and the spatial data (Supplemental Table 3, Figure 5A). Note that areas of moderate and severe disarray were only present in ROIs obtained from HCM patients. Using the cell type diversity statistic described by Karagiannis et al. [9] we assessed the cell type diversity of ROIs of varying levels of disarray and HCM status (Figure 5B). Values closer to -1 indicate the sample is of one cell type and values closer to 0 indicate the sample is more varied in composition. The Wilcoxon ranked sum test was used to determine differences in the mean cell type diversity statistic value of control normal ROIs and HCM ROIs of varying levels of disarray. Interestingly, we note that control patient ROIs appear to have less cell type diversity than HCM patient ROIs, with a significant difference observed between control normal ROIs and HCM normal ROIs (FDR = 0.017) (Figure 5B). To get a more granular picture of cell type composition, the average cell proportion for each observed cell type was broken down by HCM status and disarray level (Figure 5C). We note that the proportion of cardiomyocytes, dendritic cells, endothelial cells, macrophages, and smooth muscle cells were relatively constant across HCM status and disarray levels (Figure 5C). On the other hand, fibroblast proportions increased, as the severity of disarray increased (Figure 5C). ROIs from HCM patients with normal and mild levels of disarray contained more lymphatic endothelial cells and pericytes and had fewer neuronal cells and T-lymphocytes (Figure 5C).
3. Discussion
Spatial transcriptomics can be used to map transcriptional patterns to specific anatomic locations [10-12] and can complement high-resolution, non-spatially resolved single cell transcriptomic datasets by facilitating the mapping of diseased cell types to areas of pathological change through bioinformatic deconvolution methods [13, 14]. Such approaches have been used to map areas of SARS-CoV2 infection and lung injury [15, 16] but to the best of our knowledge have not been used to study HCM tissue. Here we report the spatial transcriptomic profiling of areas of focal myocyte disarray, lesions pathognomonic for HCM and thought to reflect the intrinsic pathophysiological processes inherent to diseased cells, using a set of probes specific for the cancer cell transcriptome (nanoString, Seattle, WA). We have found that focal areas of myocyte disarray specifically show changes in gene expression associated with interferon production, oxygen sensing, and mitochondrial function. These findings suggest alterations in proinflammatory and metabolic processes in areas of myocyte disarray, which may ensue from sarcomere dysfunction, often the primary disease driving process in HCM. These findings are also consistent with previous studies noting altered interferon levels and inflammatory markers in HCM patients [17, 18] and altered mitochondrial function in HCM patients [19, 20]. Our study is unique, however, in that it specifically implicates these processes in areas of focal myocyte disarray, thus linking these processes to discrete histopathological defects.
Analysis of ligand-receptor alterations provides a window into how intercellular communication may be altered in areas of focal myocyte disarray. Downregulation of CD46, junctional adhesion molecule, neurotrophin, NOTCH and PDGF signaling in areas of severe myocyte disarray, as shown in Fig. 4, may reflect reduced complement inactivation (CD46)[21], reduced integrin-mediated leukocyte and platelet adhesion (junctional adhesion molecule)[22], reduced neuronal innervation (neurotrophin)[23], loss of cardioprotection (NOTCH)[24] and reduced smooth muscle and fibroblast proliferation (PDGF)[25] in these areas. Increased cadherin signaling implies increased cell adhesion [26] which may represent a response to increased mechanical force associated with HCM. Reduced inactivation of complement and reduced leukocyte and platelet adhesion imply alterations in the inflammatory response. Changes in neuronal homeostasis may imply altered autonomic innervation and potentiation of arrhythmogenesis. Alterations in smooth muscle proliferation may also reflect altered vascularity in these areas, while alterations in fibroblast proliferation may reflect alterations in fibrosis. CD99 plays an important role in T cell activation [27] and suppression of extracellular matrix-integrinβ1 interactions relevant to cell adhesion [28], and its upregulation in areas of mild disarray but down regulation in areas of moderate or severe disarray may reflect a role for T cell immune function in early, mild lesions that is then dispensable in advanced lesions. JUN kinases are activated broadly under conditions of cellular stress and play important roles in tumorigenesis, neuron development, apoptosis and insulin resistance [29], and thus upregulation in areas of severe disarray likely reflect increased cellular stress. Future studies targeting these specific pathways may lead to improved experimental and therapeutic outcomes.
Deconvolution analysis of snRNA-seq data in conjunction with spatial transcriptomic data facilitates determination of specific cell type composition within focal areas of myocyte disarray. As expected, the cell composition in areas of moderate or severe disarray and normal areas in HCM samples diverged, with areas of disarray showing a higher proportion of fibroblasts, consistent with altered fibrotic mechanisms in these areas. Normal areas in HCM tissue showed a higher proportion of lymphatic endothelial cells and pericytes and a lower proportion of neuronal cells and T-lymphocytes, suggesting that these areas are in a different physiological stage compared to areas of moderate or severe disarray. These findings raise an interesting question of whether the areas of focal myocyte disarray are anatomically distinct by virtue of differences in innervation, capillary density, and lymphatics, which may facilitate the differential and distinctive recruitment of immune cell populations present in the different areas. In this model, the detection of focal myocyte disarray would thus likely be a local consequence of a more global disease process rather than an area of focal pathophysiology. Additional higher resolution spatial transcriptomic studies with targeted deletion of specific cell populations such as fibroblasts or T-lymphocytes would likely provide further insight.
Limitations of our study include the small number of patient samples, the use of the Human Whole Cancer Transcriptome Atlas reagent set and the limited spatial resolution of the GeoMX technology. Spatial transcriptomic analysis, while powerful, is currently limited by expense and low throughput. The Cancer Transcriptome Atlas assesses approximately 1800 mRNA targets and is designed for profiling of cancerous tumors and the tumor microenvironment, and thus does not address the entire transcriptome and may not detect critical transcriptional pathways not included in the probe set. At the time this study was done, the Human Whole Transcriptome Atlas was not yet available. Future studies using this newer whole transcriptome atlas will likely be informative. Finally, the GeoMX technology spatial resolution is limited to ~100-200 cells, and thus cannot truly provide single cell resolution. The latest CosMX technology from nanoString now can provide single cell resolution. Future studies using these newer technologies may provide even greater insights into the single cell and spatial transcriptomic analysis of human HCM.
4. Materials and Methods
4.1. Patient Characteristics and SnRNA-Seq Datasets
The patients with HCM and control patients without cardiovascular disease and their snRNA-seq datasets from the cardiac interventricular septum have been described previously [3-5, 7]. Deidentified samples from HCM patients 2799, 2834, 2828 and 2843 and control patients 2879 and 2880 were used in this study. The snRNA-seq datasets are available in the Gene Expression Omnibus database under accession numbers GSE161921, GSE174691 and GSE181764.
4.2. Tissue Processing for Spatial Transcriptomics
Paraffin embedded tissue was generated for each tissue sample and sectioned for spatial transcriptomic analysis by standard methods. Tissue sections were generated within 2 weeks of spatial analysis. Tissue sections were processed for spatial transcriptomics analysis according to the GeoMx Digital Spatial Profiling protocol [11] as provided by the manufacturer (nanoString, Seattle, WA). Briefly, samples were stained for morphology using commercially available antibodies to desmin (abcam cat. # ab185033) at 1:200 dilution, fibroblast activating protein (abcam cat. # ab238148) at 1:50 dilution and CD45 (Cell Science Technologies cat. # 13917BF) at 1:100 dilution. Nuclei were counterstained with Syto83 (ThermoFisher). Tissue morphology was visualized for each tissue slide using the GeoMx Digital Spatial Profiler and areas of focal myocyte disarray were designated as regions of interest (ROIs) by an expert pathologist. ROIs were graded for degree of myocyte disarray on a scale of severe, moderate, mild and normal. 12 ROIs were selected from each tissue slide. RNA within the ROIs was captured and profiled using the GeoMx Cancer Transcriptome Atlas (nanoString) to detect approximately 1,800 RNA targets. Samples were processed in 2 batches of 4 slides, each batch consisting of 2 HCM and 2 normal samples. Serially sectioned slides stained with hematoxylin and eosin or trichrome were also done to aid in morphological assessment.
4.3. Identification and Analysis of Differentially Expressed Genes Associated with HCM Areas of Myocyte Disarray
Raw expression data from ROIs underwent quality control and Q3 normalization per recommendations from the manufacturer (nanoString). Segment, probe, and gene quality control were performed using the R package, GeoMXTools. Expressed genes were filtered for inclusion in at least 1% of segments. Samples that passed quality control underwent unsupervised analysis to identify potential confounding factors. Linear mixed-effects models were used to test for differential expression genes between groups of ROIs with different levels of disarray and HCM status, using a composite variable indicating HCM status and disarray level as a fixed effect and setting the patient identifier as the random effect. Genes with Benjamini-Hochberg adjusted p-values less than 0.05 were considered significantly differently expressed between groups of ROIs. Gene Ontology analysis was performed using the R package, ClusterProfiler [30, 31].
4.4. Ligand-Receptor Analysis to Delineate Potential Intercellular Communication Pathways that Promote Focal Myocyte Disarray
Differentially expressed genes were further analyzed for the presence of Ligand-Receptor pairs that were differentially expressed in the same way (e.g. either both upregulated or both downregulated, called differential combination analysis) using known human ligand-receptor pairs present in the CellChat Interaction Database [6].
4.5. Deconvolution of Single Nucleus RNA-Sequencing Data to Determine Cell Composition in Areas of Focal Myocyte Disarray
SnRNA-seq datasets from the eight samples were integrated into a single Seurat object [33] using Harmony [34]. Optimal clustering resolution was determined using ChooseR [35]. Cell assignments were generated using expression of canonical markers and methods described previously [3-5, 7]. The snRNA-seq datasets were filtered to only include marker genes present in the GeoMx ROI data and log2 transformed. GeoMx ROI data were Q3 normalized and log2 transformed before undergoing deconvolution. Spatial Deconvolution Analysis was used to determine the cellular composition of areas of focal myocyte disarray using SpatialDecon [8]. Deconvolution was performed on a per patient basis, where each patient’s GeoMx ROI data was deconvoluted using the patient’s matching snRNA-seq data as a reference. The cell type diversity statistic described by Karagiannis et al. [9] was used to assess the cell type diversity of ROIs of varying levels of disarray and HCM status. The Wilcoxon ranked sum test was used to determine differences in the mean cell type diversity statistic value between control normal ROIs and HCM ROIs of varying levels of disarray.
5. Conclusions
Here we report the first spatial transcriptomic analysis of human HCM samples, focusing on areas of focal myocyte disarray. These areas of focal myocyte disarray show distinctive changes in gene expression related to interferon production and mitochondrial metabolism. Analysis of intercellular communication in these areas reveals significant changes in cell adhesion, PDGF, NOTCH and cadherin signaling. Analysis of cell content in these areas reveals characteristic differences in vascular and lymphatic cells, neurons, fibroblasts, and immune cells. Characterization of the complex interplay between cells within HCM lesions will likely lead to the development of novel, targeted therapeutics, perhaps those that target interferon signaling or mitochondrial metabolism, to improve outcomes in HCM patients.
Supplementary Materials
The following supporting information can be downloaded at the website of this paper posted on Preprints.org.
Author Contributions
Conceptualization, M.T.C.; methodology, M.T.C., J.L., R.B., G.P.; software, J.L., R.B., G.P., H.W.; validation, M.T.C. and G.P.; formal analysis, J.L., G.P., R.B., H.W., K.A., M.T.C.; investigation, M.T.C.; resources, M.T.C.; data curation, G.P.; writing—original draft preparation, M.T.C.; writing—review and editing, M.T.C.; visualization, J.L., G.P.; supervision, M.T.C.; project administration, M.T.C., G.P.; funding acquisition, M.T.C. All authors have read and agreed to the published version of the manuscript.
Funding
This research was partially funded through a grant from nanoString (Seattle, WA).
Acknowledgments
We thank the Tufts Medical Center Biorepository staff for tissue processing support. We thank the Tufts Cummings School of Veterinary Medicine GeoMX Core Facility for technical support. We thank the Tufts Data Intensive Studies Center (DISC) as this work was partially supported by a DISC Study Group grant.
Conflicts of Interest
The authors declare no conflict of interest. The funders had no role in the design of the study; in the collection, analyses, or interpretation of data; in the writing of the manuscript, or in the decision to publish the results.
Abbreviations
| 1. HCM | 2. Hypertrophic Cardiomyopathy |
| 3. LVOT | 4. Left Ventricular Outflow Tract Obstruction |
| 5. DEG | 6. Differentially Expressed Gene |
| 7. GO 8. L-R 9. ROI 10. AOI 11. FDR 12. snRNA-seq 13. UMAP 14. DCA |
15. Gene Ontology 16. Ligand-Receptor 17. Region of Interest 18. Area of Interest 19. False Discovery Rate 20. Single Nucleus RNA-sequencing 21. 22. Uniform Manifold Approximation and Projection 23. Differential Combination Analysis 24. |
References
- Maron, B. J.; Longo, D. L. Clinical Course and Management of Hypertrophic Cardiomyopathy. New England Journal of Medicine 2018, 379, 655–668. [Google Scholar] [CrossRef] [PubMed]
- Chou, C.; Chin, M. T. Pathogenic Mechanisms of Hypertrophic Cardiomyopathy beyond Sarcomere Dysfunction. Int J Mol Sci 2021, 22, 8933. [Google Scholar] [CrossRef] [PubMed]
- Codden, C. J.; Chin, M. T. Common and Distinctive Intercellular Communication Patterns in Human Obstructive and Nonobstructive Hypertrophic Cardiomyopathy. International Journal of Molecular Sciences 2022, 23, 946. [Google Scholar] [CrossRef] [PubMed]
- Codden, C. J.; Larson, A.; Awata, J.; Perera, G.; Chin, M. T. Single Nucleus RNA-sequencing Reveals Altered Intercellular Communication and Dendritic Cell Activation in Nonobstructive Hypertrophic Cardiomyopathy. Cardiol Cardiovasc Med 2022, 6, 398–415. [Google Scholar] [CrossRef]
- Larson, A.; Codden, C. J.; Huggins, G. S.; Rastegar, H.; Chen, F. Y.; Maron, B. J.; Rowin, E. J.; Maron, M. S.; Chin, M. T. Altered intercellular communication and extracellular matrix signaling as a potential disease mechanism in human hypertrophic cardiomyopathy. Sci Rep 2022, 12, 5211. [Google Scholar] [CrossRef]
- Jin, S.; Guerrero-Juarez, C. F.; Zhang, L.; Chang, I.; Ramos, R.; Kuan, C. H.; Myung, P.; Plikus, M. V.; Nie, Q. Inference and analysis of cell-cell communication using CellChat. Nat Commun 2021, 12, 1088. [Google Scholar] [CrossRef] [PubMed]
- Larson, A.; Chin, M. T. A method for cryopreservation and single nucleus RNA-sequencing of normal adult human interventricular septum heart tissue reveals cellular diversity and function. BMC Med Genomics 2021, 14, 161. [Google Scholar] [CrossRef]
- Griswold, M.; Danaher, P. SpatialDecon: Deconvolution of mixed cells from spatial and/or bulk gene expressioin data, R Package version 1.6.0; 2022.
- Karagiannis, T. T.; Monti, S.; Sebastiani, P. Cell Type Diversity Statistic: An Entropy-Based Metric to Compare Overall Cell Type Composition Across Samples. Front Genet 2022, 13, 855076. [Google Scholar] [CrossRef]
- Beechem, J. M. High-Plex Spatially Resolved RNA and Protein Detection Using Digital Spatial Profiling: A Technology Designed for Immuno-oncology Biomarker Discovery and Translational Research. Methods Mol Biol 2020, 2055, 563–583. [Google Scholar] [CrossRef]
- Merritt, C. R.; Ong, G. T.; Church, S. E.; Barker, K.; Danaher, P.; Geiss, G.; Hoang, M.; Jung, J.; Liang, Y.; McKay-Fleisch, J.; Nguyen, K.; Norgaard, Z.; Sorg, K.; Sprague, I.; Warren, C.; Warren, S.; Webster, P. J.; Zhou, Z.; Zollinger, D. R.; Dunaway, D. L.; Mills, G. B.; Beechem, J. M. Multiplex digital spatial profiling of proteins and RNA in fixed tissue. Nat Biotechnol 2020, 38, 586–599. [Google Scholar] [CrossRef]
- Zollinger, D. R.; Lingle, S. E.; Sorg, K.; Beechem, J. M.; Merritt, C. R. GeoMx RNA Assay: High Multiplex, Digital, Spatial Analysis of RNA in FFPE Tissue. Methods Mol Biol 2020, 2148, 331–345. [Google Scholar] [CrossRef]
- Longo, S. K.; Guo, M. G.; Ji, A. L.; Khavari, P. A. Integrating single-cell and spatial transcriptomics to elucidate intercellular tissue dynamics. Nature reviews 2021, 22, 627–644. [Google Scholar] [CrossRef] [PubMed]
- Li, B.; Zhang, W.; Guo, C.; Xu, H.; Li, L.; Fang, M.; Hu, Y.; Zhang, X.; Yao, X.; Tang, M.; Liu, K.; Zhao, X.; Lin, J.; Cheng, L.; Chen, F.; Xue, T.; Qu, K. Benchmarking spatial and single-cell transcriptomics integration methods for transcript distribution prediction and cell type deconvolution. Nat Methods 2022, 19, 662–670. [Google Scholar] [CrossRef] [PubMed]
- Margaroli, C.; Benson, P.; Sharma, N. S.; Madison, M. C.; Robison, S. W.; Arora, N.; Ton, K.; Liang, Y.; Zhang, L.; Patel, R. P.; Gaggar, A. Spatial mapping of SARS-CoV-2 and H1N1 Lung Injury Identifies Differential Transcriptional Signatures. Cell Rep Med 2021, 100242. [Google Scholar] [CrossRef]
- Rendeiro, A. F.; Ravichandran, H.; Bram, Y.; Chandar, V.; Kim, J.; Meydan, C.; Park, J.; Foox, J.; Hether, T.; Warren, S.; Kim, Y.; Reeves, J.; Salvatore, S.; Mason, C. E.; Swanson, E. C.; Borczuk, A. C.; Elemento, O.; Schwartz, R. E. The spatial landscape of lung pathology during COVID-19 progression. Nature 2021. [CrossRef] [PubMed]
- Yu, T.; Huang, Z.; Pu, Z. Identification of Potential Diagnostic Biomarkers and Biological Pathways in Hypertrophic Cardiomyopathy Based on Bioinformatics Analysis. Genes 2022, 13, 530. [Google Scholar] [CrossRef] [PubMed]
- Larson, A.; Libermann, T. A.; Bowditch, H.; Das, G.; Diakos, N.; Huggins, G. S.; Rastegar, H.; Chen, F. Y.; Rowin, E. J.; Maron, M. S.; Chin, M. T. Plasma Proteomic Profiling in Hypertrophic Cardiomyopathy Patients before and after Surgical Myectomy Reveals Post-Procedural Reduction in Systemic Inflammation. Int J Mol Sci 2021, 22, 2474. [Google Scholar] [CrossRef]
- Vakrou, S.; Abraham, M. R. Hypertrophic cardiomyopathy: a heart in need of an energy bar? Frontiers in physiology 2014, 5, 309. [Google Scholar] [CrossRef]
- Viola, H. M.; Hool, L. C. Impaired calcium handling and mitochondrial metabolic dysfunction as early markers of hypertrophic cardiomyopathy. Arch Biochem Biophys 2019, 665, 166–174. [Google Scholar] [CrossRef]
- Liszewski, M. K.; Atkinson, J. P. Membrane cofactor protein (MCP; CD46): deficiency states and pathogen connections. Curr Opin Immunol 2021, 72, 126–134. [Google Scholar] [CrossRef]
- Ebnet, K. Junctional Adhesion Molecules (JAMs): Cell Adhesion Receptors With Pleiotropic Functions in Cell Physiology and Development. Physiol Rev 2017, 97, 1529–1554. [Google Scholar] [CrossRef]
- Nordvall, G.; Forsell, P.; Sandin, J. Neurotrophin-targeted therapeutics: A gateway to cognition and more? Drug Discov Today 2022, 27, 103318. [Google Scholar] [CrossRef] [PubMed]
- Kachanova, O.; Lobov, A.; Malashicheva, A. The Role of the Notch Signaling Pathway in Recovery of Cardiac Function after Myocardial Infarction. Int J Mol Sci 2022, 23, (20). [Google Scholar] [CrossRef]
- Papadopoulos, N.; Lennartsson, J. The PDGF/PDGFR pathway as a drug target. Mol Aspects Med 2018, 62, 75–88. [Google Scholar] [CrossRef] [PubMed]
- Arslan, F. N.; Eckert, J.; Schmidt, T.; Heisenberg, C. P. Holding it together: when cadherin meets cadherin. Biophys J 2021, 120, 4182–4192. [Google Scholar] [CrossRef] [PubMed]
- Oh, K. I.; Kim, B. K.; Ban, Y. L.; Choi, E. Y.; Jung, K. C.; Lee, I. S.; Park, S. H. CD99 activates T cells via a costimulatory function that promotes raft association of TCR complex and tyrosine phosphorylation of TCR zeta. Exp Mol Med 2007, 39, 176–84. [Google Scholar] [CrossRef]
- Lee, K. J.; Lee, S. H.; Yadav, B. K.; Ju, H. M.; Kim, M. S.; Park, J. H.; Jeoung, D.; Lee, H.; Hahn, J. H. The activation of CD99 inhibits cell-extracellular matrix adhesion by suppressing beta(1) integrin affinity. BMB Rep 2012, 45, 159–64. [Google Scholar] [CrossRef]
- Guo, X. X.; An, S.; Yang, Y.; Liu, Y.; Hao, Q.; Tang, T.; Xu, T. R. Emerging role of the Jun N-terminal kinase interactome in human health. Cell Biol Int 2018, 42, 756–768. [Google Scholar] [CrossRef]
- Wu, T.; Hu, E.; Xu, S.; Chen, M.; Guo, P.; Dai, Z.; Feng, T.; Zhou, L.; Tang, W.; Zhan, L.; Fu, X.; Liu, S.; Bo, X.; Yu, G. clusterProfiler 4.0: A universal enrichment tool for interpreting omics data. Innovation (Camb) 2021, 2, 100141. [Google Scholar] [CrossRef]
- Yu, G.; Wang, L. G.; Han, Y.; He, Q. Y. clusterProfiler: an R package for comparing biological themes among gene clusters. OMICS 2012, 16, 284–7. [Google Scholar] [CrossRef]
- Armingol, E.; Officer, A.; Harismendy, O.; Lewis, N. E. Deciphering cell-cell interactions and communication from gene expression. Nature reviews 2021, 22, 71–88. [Google Scholar] [CrossRef] [PubMed]
- Butler, A.; Hoffman, P.; Smibert, P.; Papalexi, E.; Satija, R. Integrating single-cell transcriptomic data across different conditions, technologies, and species. Nat Biotechnol 2018, 36, 411–420. [Google Scholar] [CrossRef] [PubMed]
- Korsunsky, I.; Millard, N.; Fan, J.; Slowikowski, K.; Zhang, F.; Wei, K.; Baglaenko, Y.; Brenner, M.; Loh, P. R.; Raychaudhuri, S. Fast, sensitive and accurate integration of single-cell data with Harmony. Nat Methods 2019, 16, 1289–1296. [Google Scholar] [CrossRef] [PubMed]
- Patterson-Cross, R. B.; Levine, A. J.; Menon, V. Selecting single cell clustering parameter values using subsampling-based robustness metrics. BMC Bioinformatics 2021, 22, 39. [Google Scholar] [CrossRef]
Figure 1.
Human Heart Tissue Sections Used for Spatial Transcriptomic Analysis. Normal and HCM histological sections from the interventricular septum were immunostained for FAP, CD45, Desmin and nuclear DNA as described in methods. Representative samples 2799 (Normal) and 2879 (HCM) are shown at lower magnfication, along with designated Areas of Interest (AOIs) that were chosen based on degree of myocyte disarray. The first 6 AOIs for each sample are shown at higher magnification. Myocyte disarray is apparent at higher magnfication in the HCM samples.
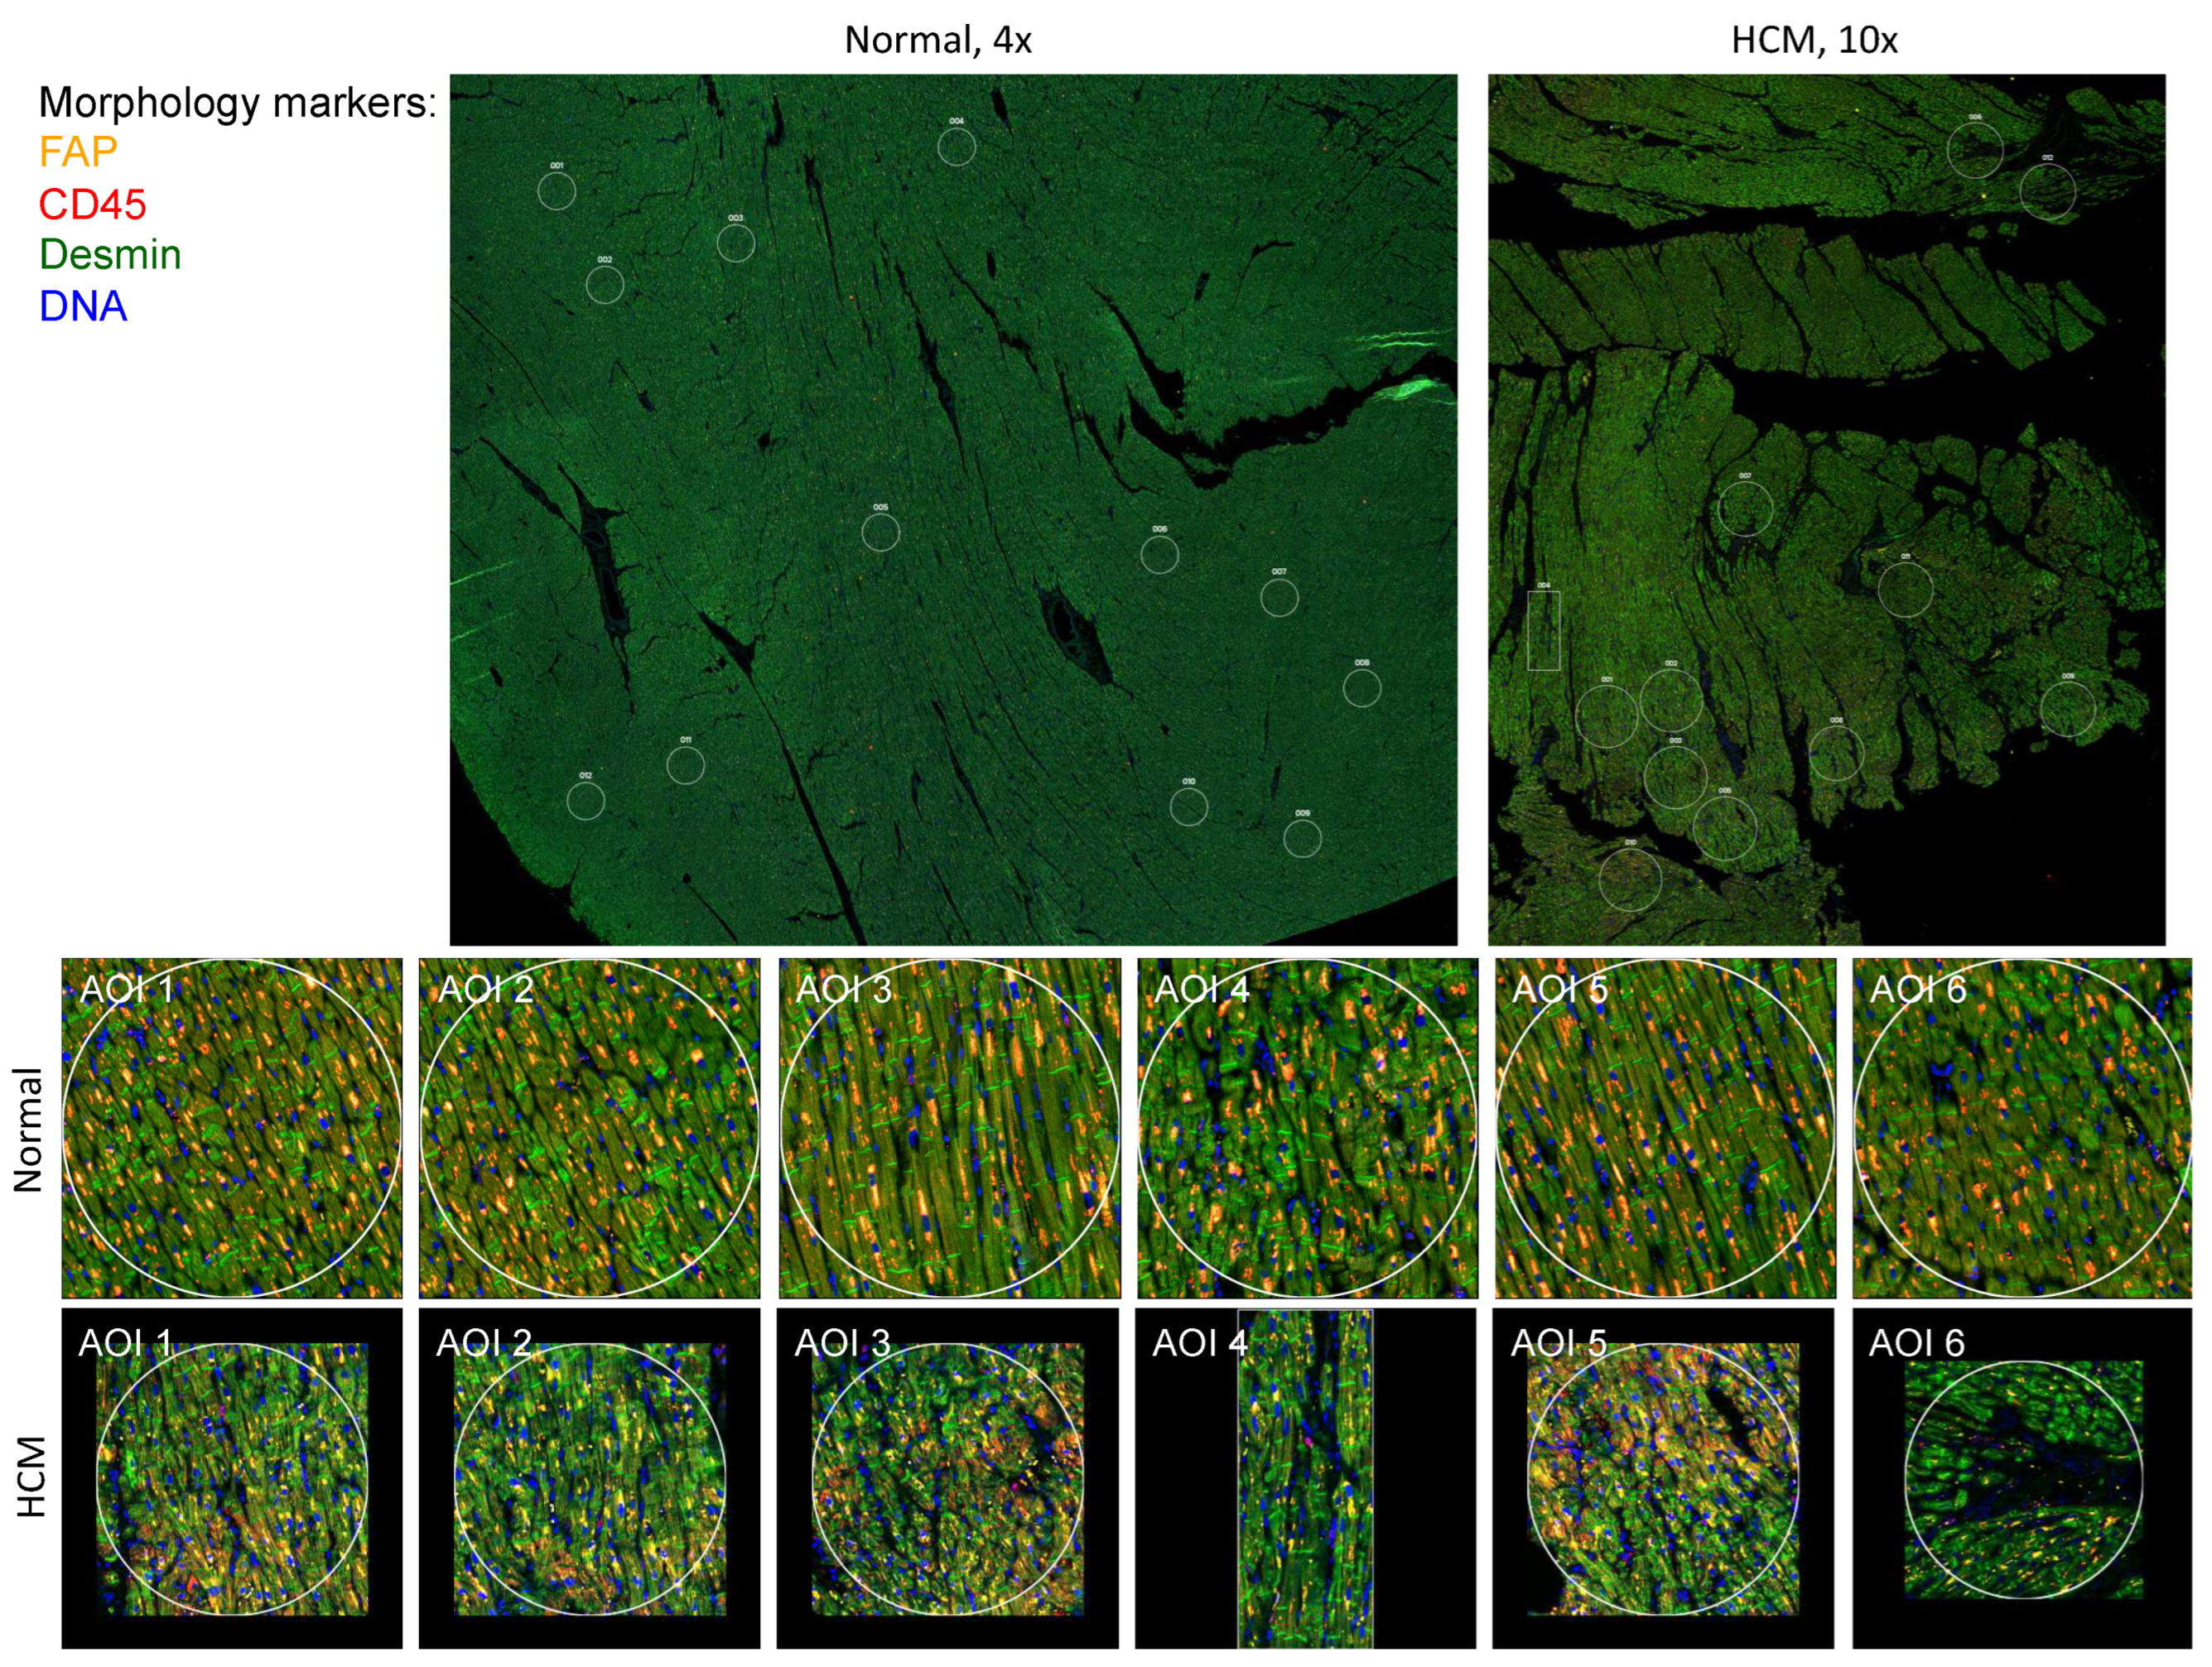
Figure 2.
Study Design and Overall Analysis Pipeline for Spatial Transcriptomic Data from HCM Patient Tissue. A. Overall Analysis Pipeline for Spatial Transcriptomic Data. B. Overview of the hierarchy between patients, samples, and ROIs. C. Distribution of ROIs that passed quality control between patients and colored by disarray level.
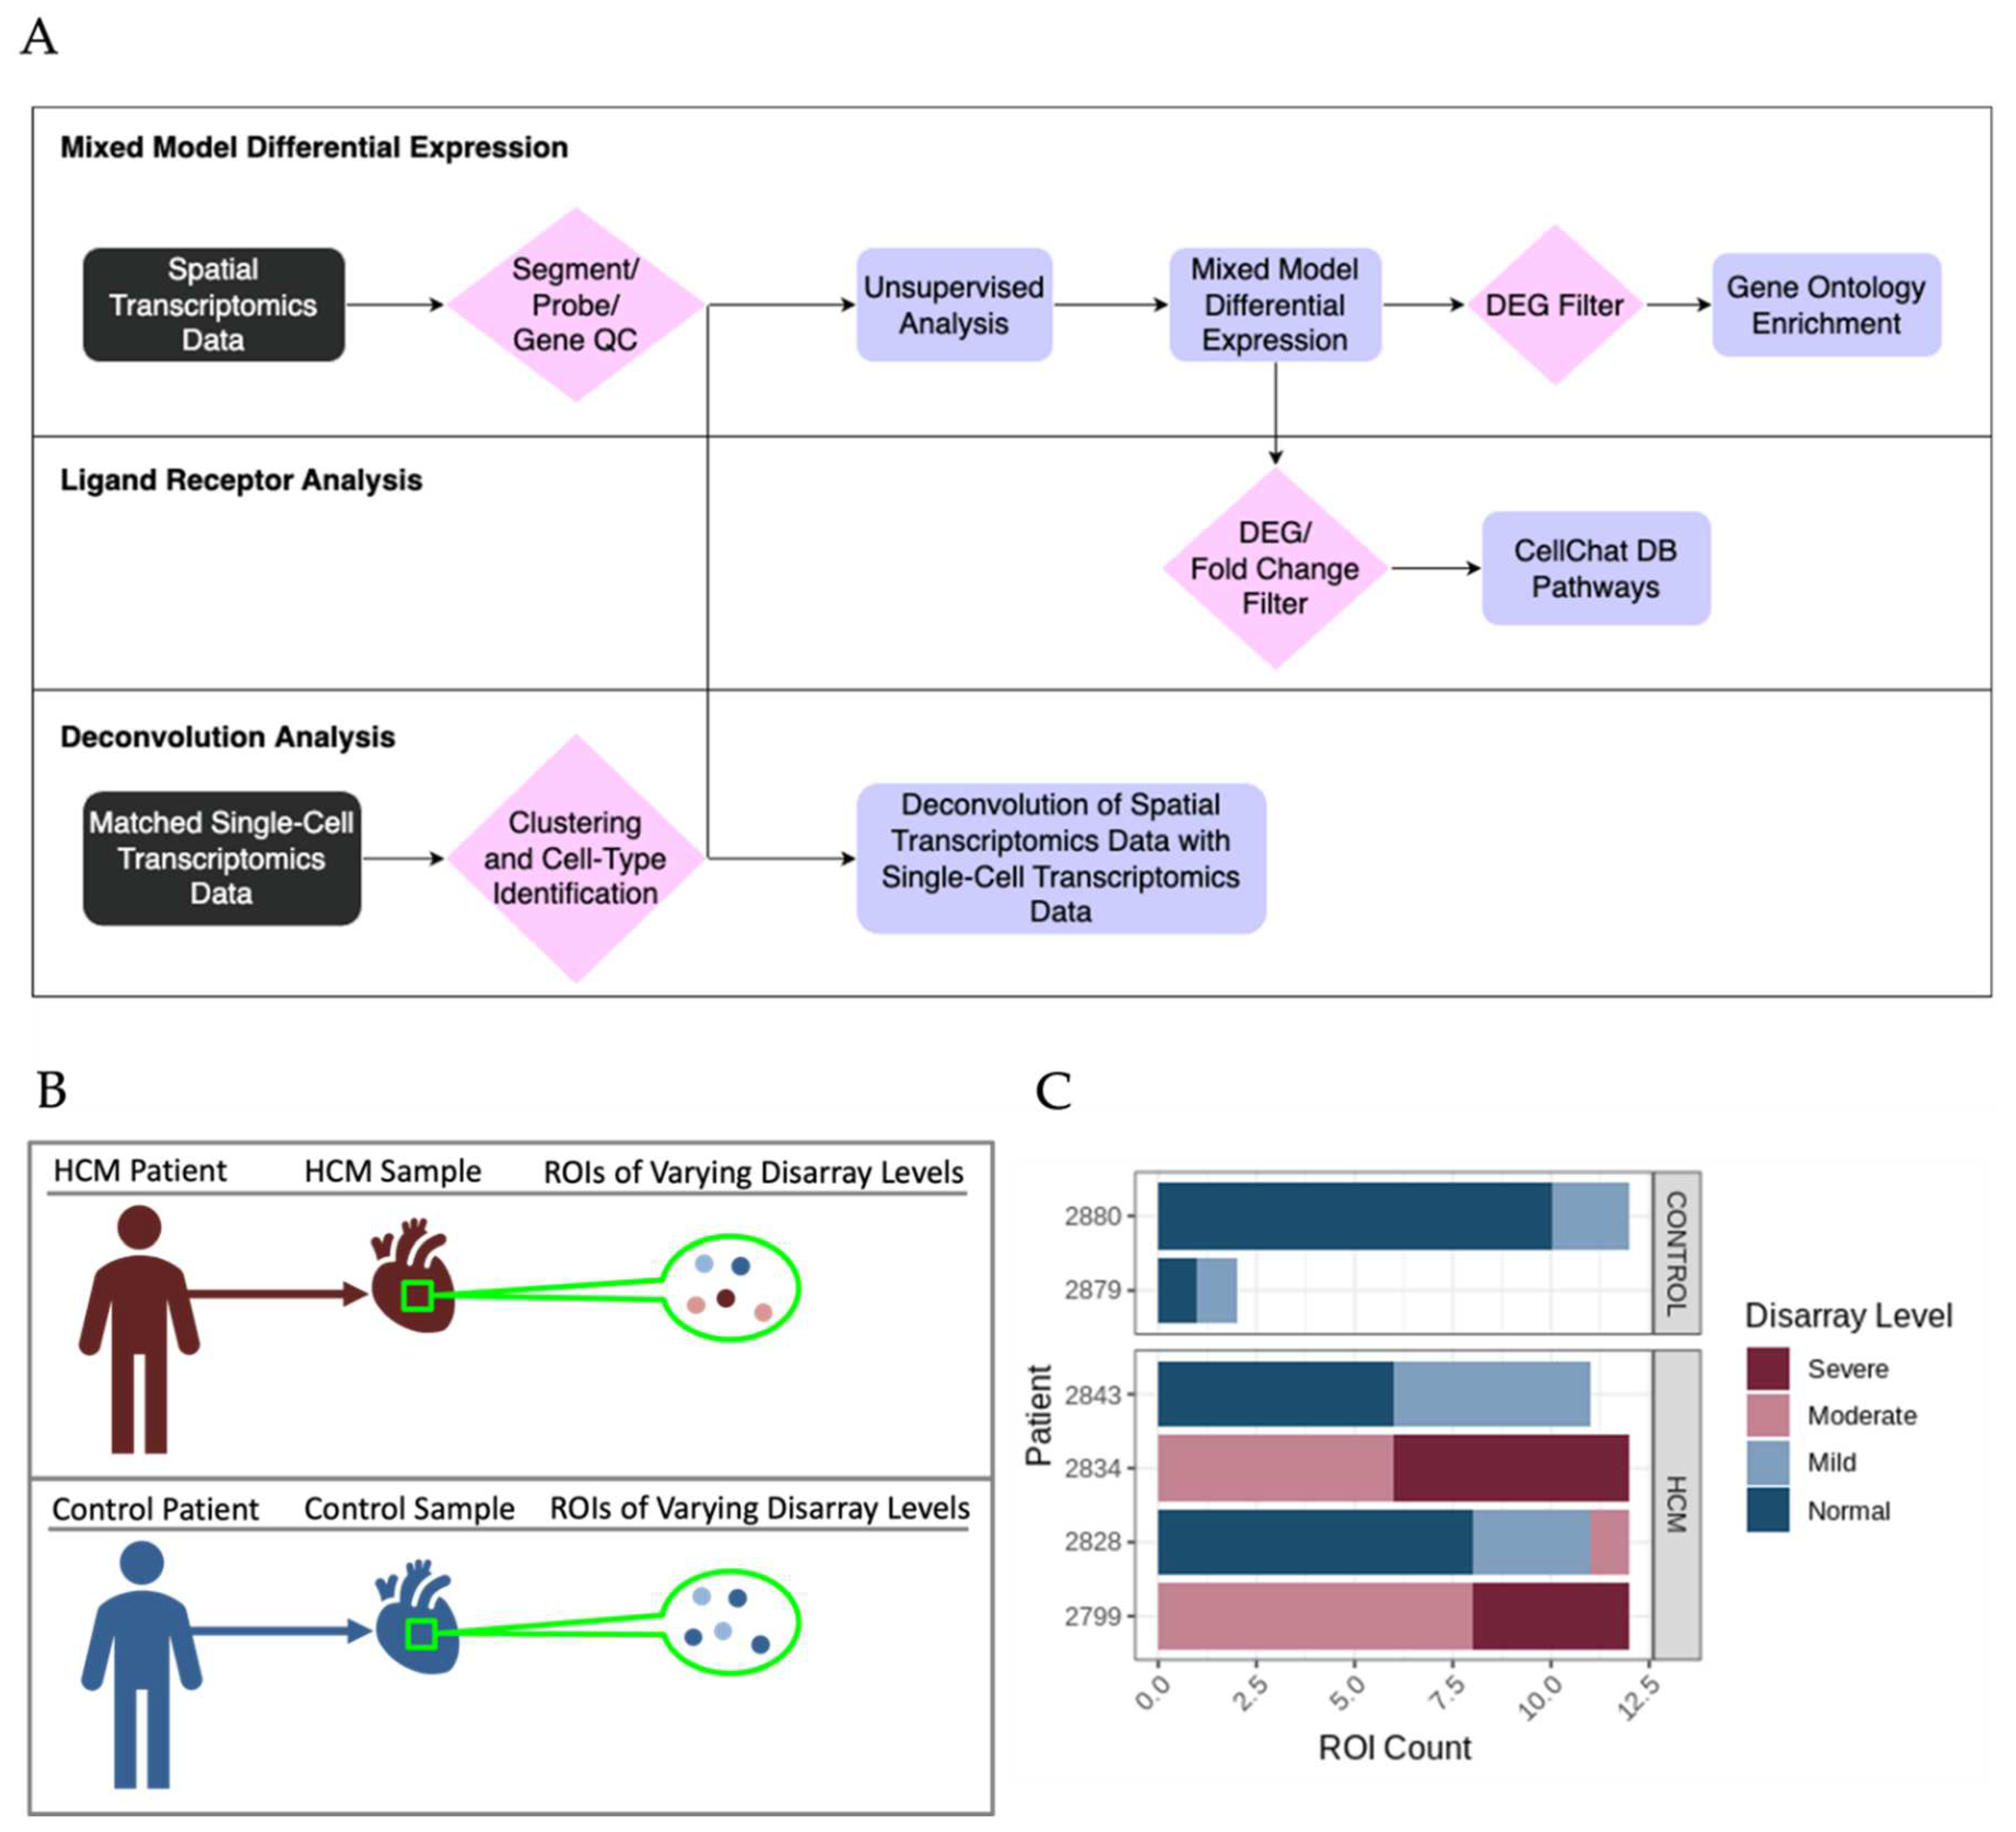
Figure 3.
Identification of Differentially Expressed Genes and Associated Biological Processes in Areas of Myocyte Disarray. A. Volcano plots comparing areas of normal myocyte disarray between control and HCM patients, and the progression of increasing myocyte disarray from within the HCM phenotype. In each panel, upregulated genes correspond to the condition listed second in the plot title. Only differentially expressed genes that had an FDR adjusted p-value below 0.05 were considered differentially expressed. B. Gene ontology enrichment dot plot of significant annotations per comparison. C. Module expression of significant annotations broken down by HCM status and myocyte disarray.
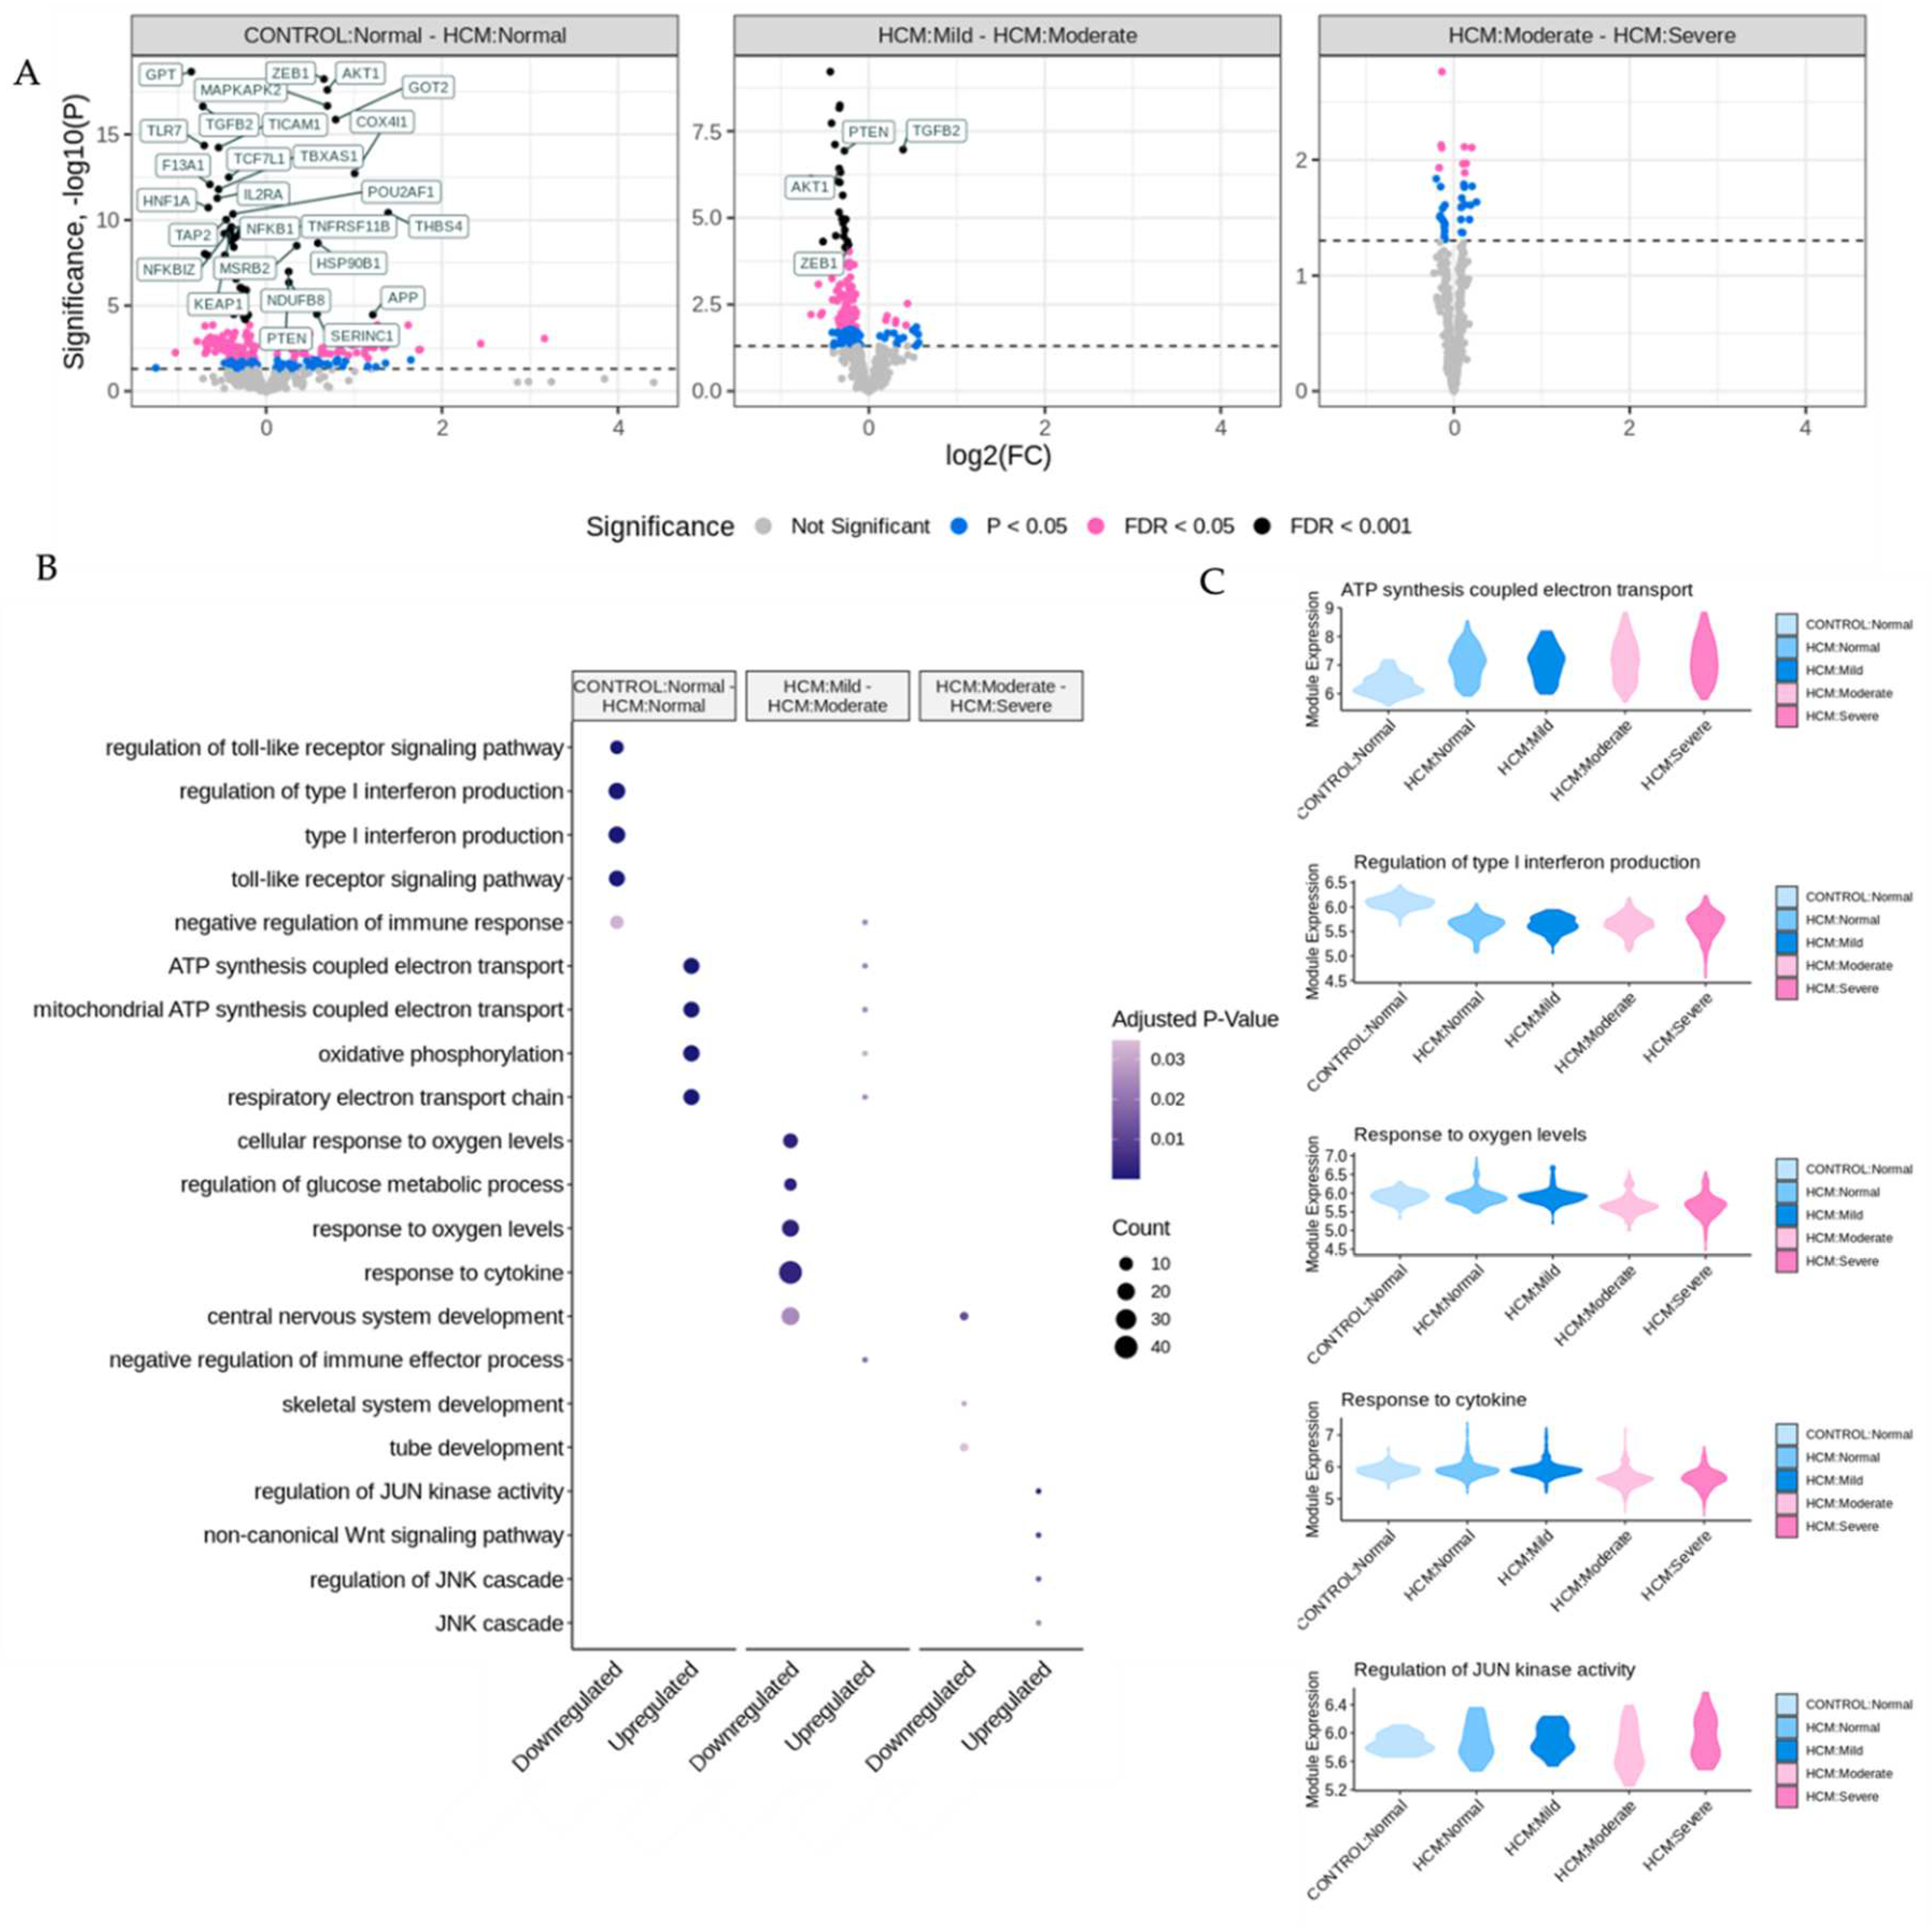
Figure 4.
Identification of Differentially Expressed Ligand-Receptors in Areas of Myocyte Disarray. A. Differentially expressed genes between myocyte disarray levels were filtered by an FDR-adjusted p-value of 0.05 and split into upregulated and downregulated groups. These gene sets were then compared to the CellChat database to identify Ligand-Receptor pairs and their associated pathway. B. Heatmap indicating which pathways were affected in different disarray level comparisons and colored by the number of Ligand-Receptors present in the pathway.
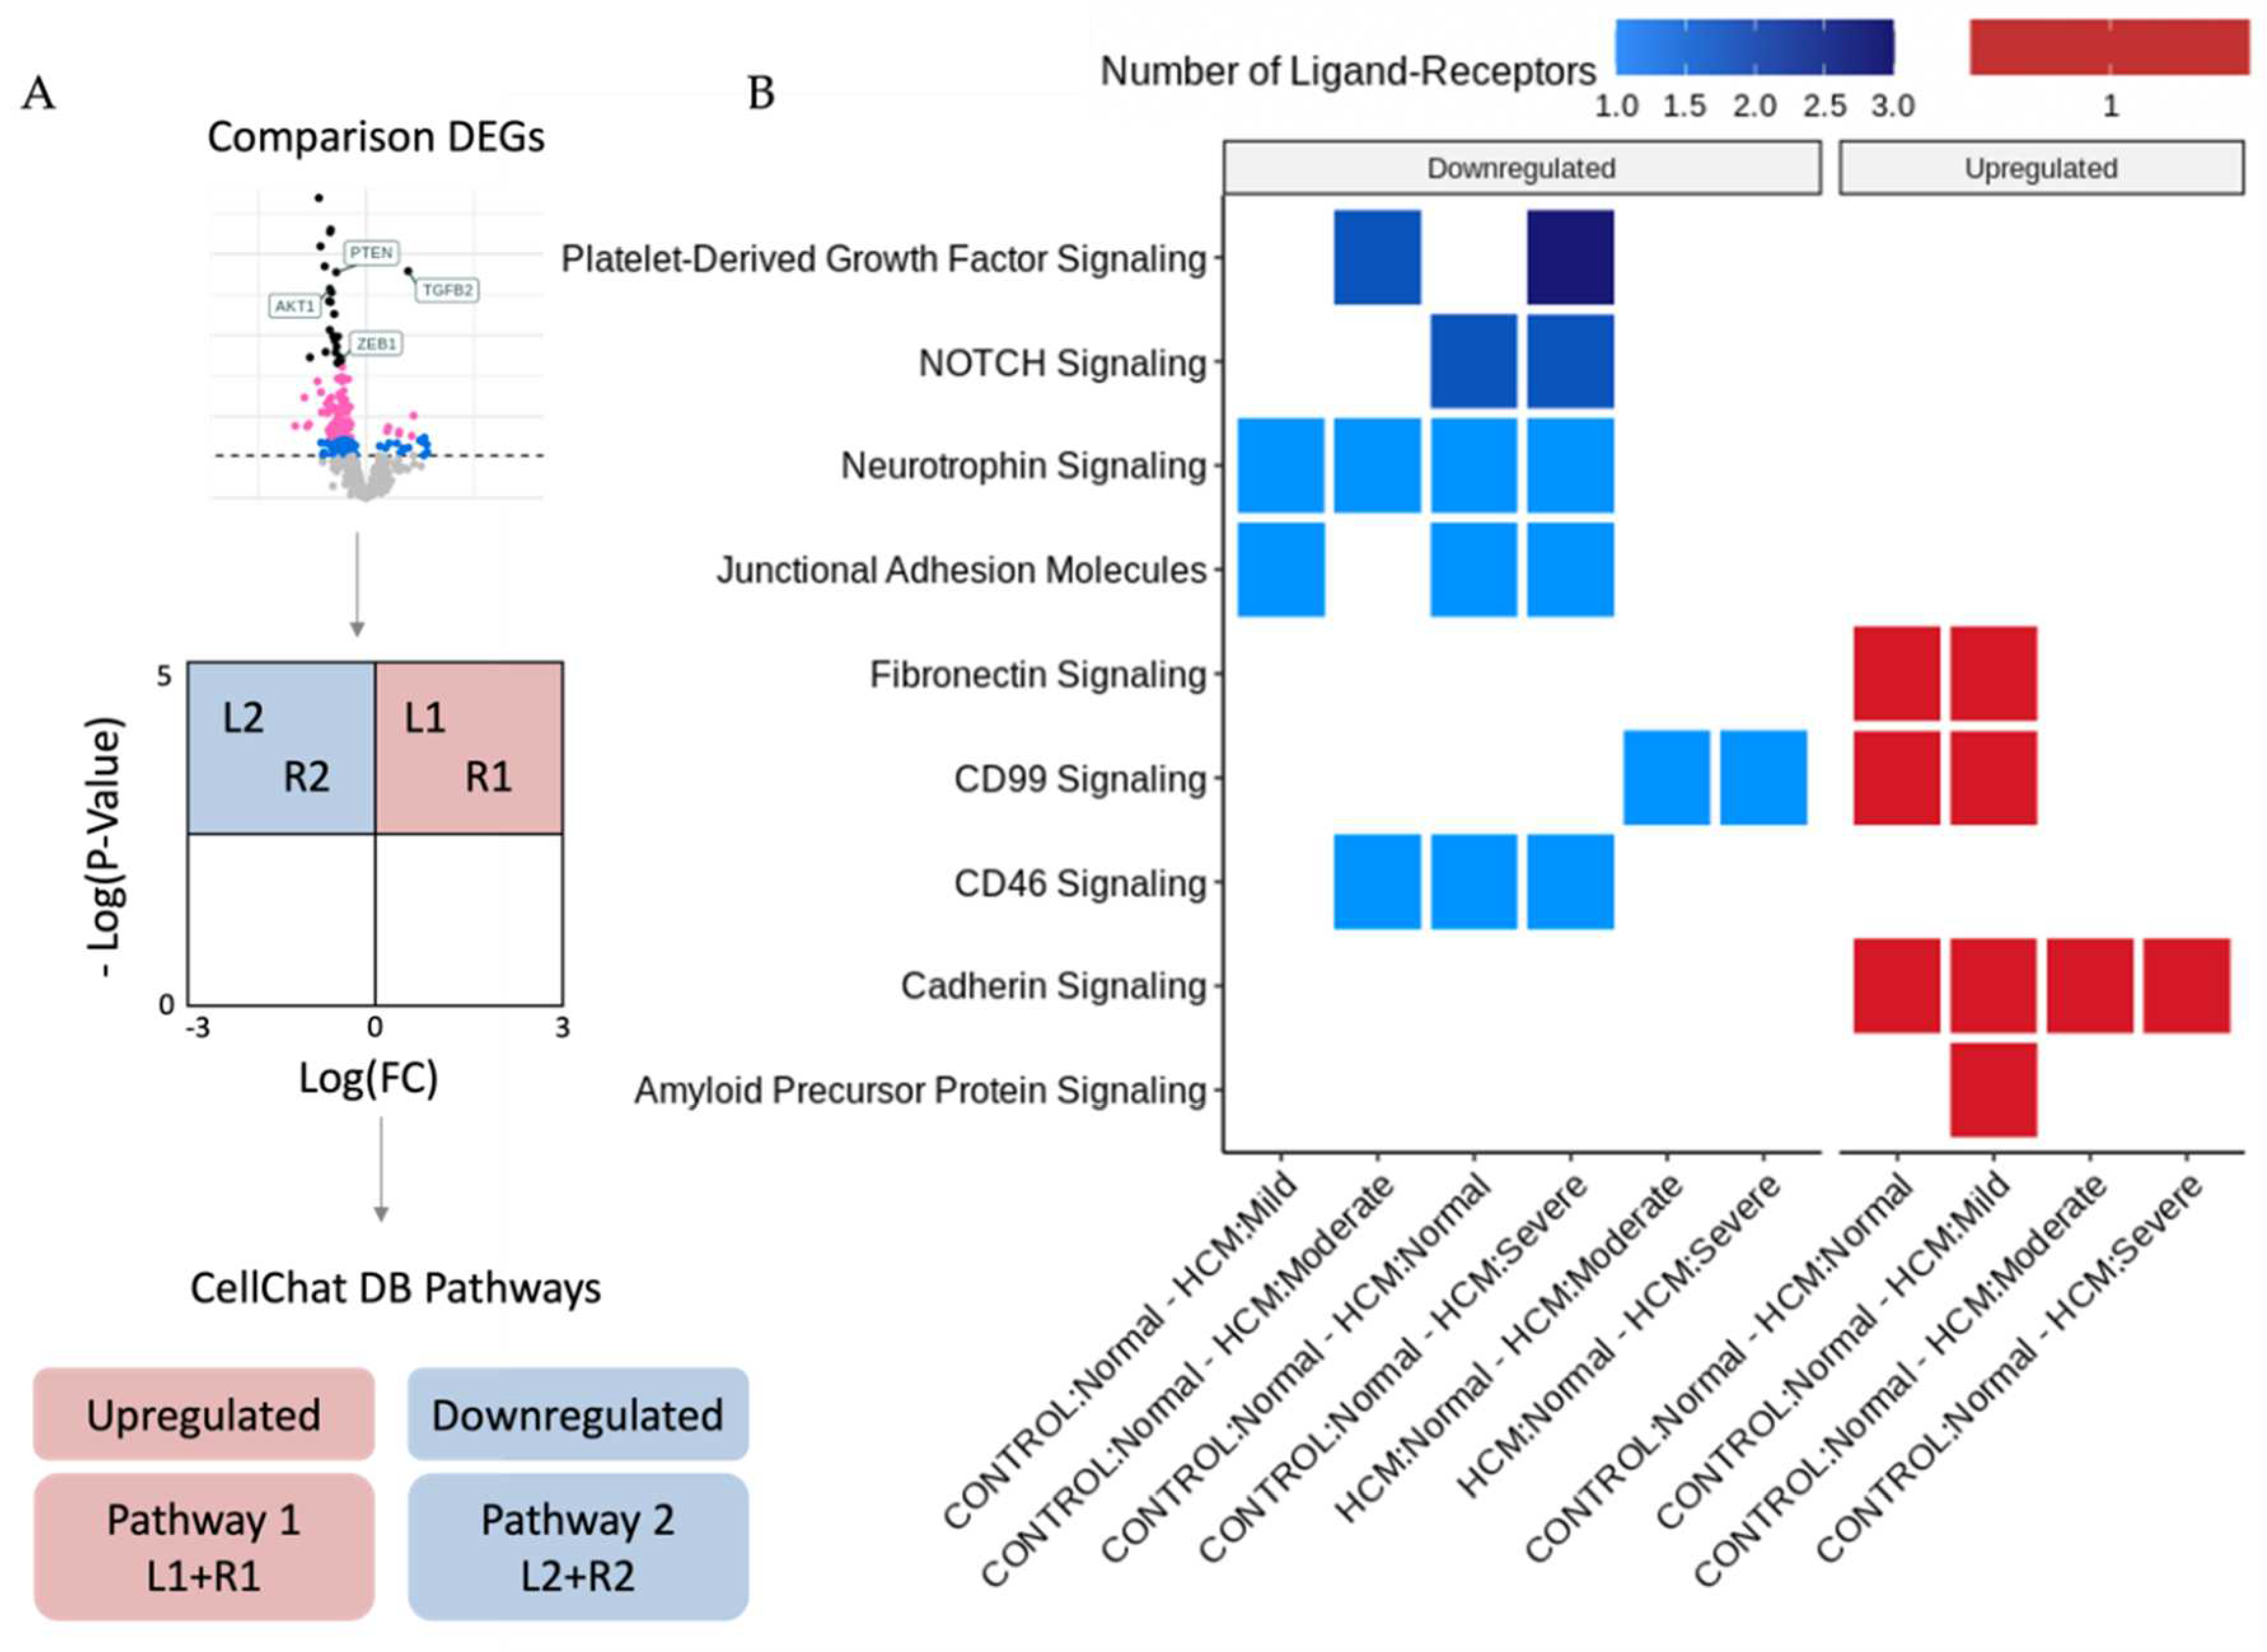
Figure 5.
Cell type Composition of Areas of Focal Myocyte Disarray Determined by Deconvolution of SnRNA-seq Data. A. Deconvolution of ROIs using per-patient averaged matched SnRNA-seq data and broken down by HCM status, patient, and disarray level. B. Cell diversity statistic summarizing the diversity of ROIs in different HCM status/disarray levels. The Wilcoxon ranked sum test values are shown above the HCM status disarray levels to highlight significant differences when compared to the distribution of cell type diversity statistics for control normal ROIs (ns = not significant, * = p-value < 0.05, ** = p-value < 0.01). C. Average cell proportions of ROIs in different HCM status/disarray levels.
Disclaimer/Publisher’s Note: The statements, opinions and data contained in all publications are solely those of the individual author(s) and contributor(s) and not of MDPI and/or the editor(s). MDPI and/or the editor(s) disclaim responsibility for any injury to people or property resulting from any ideas, methods, instructions or products referred to in the content. |
© 2023 by the authors. Licensee MDPI, Basel, Switzerland. This article is an open access article distributed under the terms and conditions of the Creative Commons Attribution (CC BY) license (http://creativecommons.org/licenses/by/4.0/).
Copyright: This open access article is published under a Creative Commons CC BY 4.0 license, which permit the free download, distribution, and reuse, provided that the author and preprint are cited in any reuse.


