Submitted:
19 August 2025
Posted:
20 August 2025
You are already at the latest version
Abstract
Coastal areas are increasingly affected by erosion due to climate change and human in-terventions, threatening the stability of many shorelines. Understanding coastal dynamics is therefore crucial for developing effective conservation and management strategies. This study analyses the evolution of the coastline between the Port of Valencia and the Port of Sagunto from 1957 to the present. Using Geographic Information Systems (GIS), including QGIS and the DSAS extension, five shoreline change indicators (EPR, LRR, NSM, SCE, and WLR) were calculated based on coastlines extracted from orthophotos and satellite imag-es. The analysis was conducted across five distinct zones and three temporal scales (long, medium, and short term) to capture spatial and temporal variations. The results reveal significant heterogeneity: the Arenas–Malvarrosa–Patacona area shows long-term accre-tion but recent erosion, Port Saplaya shows moderate erosion, Pobla de Farnals is under-going strong regression, Puzol appears recently stabilized, and Marjal dels Moros, histor-ically stable, now exhibits increasing retreat. Overall, coastal evolution in the study area is influenced by both natural processes and human actions. The data provide valuable in-sights for medium- and long-term coastal planning and sustainable territorial management.
Keywords:
Shoreline
; Geographic Information Systems (GIS)
; Coastal evolution
; Coastal management
; Erosion
; Accretion
; Western Mediterranean
1. Introduction
The coastline represents a dynamic space of great ecological, economic, and social value [1]. However, it is also one of the most fragile environments on the planet [2], subject to constant interaction between terrestrial, atmospheric and marine processes that shape its morphology [3].
The coastal zone, due to its transitional nature between the terrestrial and marine environments, hosts a wide variety of ecosystems and natural resources. This environmental richness, combined with its accessibility and scenic value, has historically encouraged the concentration of population and economic activities nearby. It is estimated that around 60% of the population is concentrated along the coastline [4]. Over time, this phenomenon has intensified, especially since the late 19th century, when the growth of tourism in Europe solidified the recreational use of beaches [5]. Since then, the coastline has experienced increasing occupation, linked to the expansion of urban infrastructure and the rising demand for tourism services [6,7]. This trend has been particularly pronounced in regions such as the Mediterranean, where the number of residents and visitors has grown significantly in recent decades [8,9,10]. The growing influx of users has influenced the way beaches are managed. Today, many decisions focus on meeting public needs, prioritizing recreational use over ecological or conservation criteria [11]. Furthermore, to address the risks associated with erosion and to protect urbanized areas near the sea, regenerative measures such as beach nourishment are undertaken, along with the construction of various defense structures like groynes or breakwaters. However, these interventions, far from solving the problem, have disrupted the natural balance of the coastal system by interrupting sediment transport and promoting erosion processes in other areas of the coastline [12].
On the other hand, the shoreline is one of the most complex elements to delineate within the coastal system due to its dynamic and changing nature [13]. Although it can be basically defined as the meeting point between land, sea, and atmosphere [14], this description is insufficient when attempting to accurately quantify the processes of retreat or advance of the coastal strip. Its exact location is influenced by multiple factors, such as the slope of the beach profile, sea level fluctuations, and wave intensity, which can create ambiguities when interpreting the shoreline at different times [15,16]. In this context, the coastline undergoes changes at different temporal scales. In the short term—ranging from hours to days—the effects of storms, tides, and storms dominate, which can cause significant variations in the profile without indicating a real trend [17]. In the medium and long term—spanning decades to centuries—factors such as changes in sediment balance, sea level rise, and human intervention come into play [18,19,20,21]. However, the high short-term variability can obscure underlying trends, so numerous studies recommend using long time series, with records distributed over more than ten years, to more reliably detect the evolutionary behavior of the coastline [17,22].
Finally, among the agents influencing coastal evolution, those induced by human activity can be distinguished from those of natural origin. The main natural factors are sea level fluctuations, wave patterns, currents, and storms. The role of anthropic activity is increasingly decisive, both due to the reduction of sediment supply—through reservoirs, urbanization, or dune destruction—and the installation of infrastructures that modify longitudinal sediment transport, such as ports, groynes, or breakwaters. These types of alterations cause sediment accumulation on the updrift side of the structures and erosive processes downstream [21,23,24]. Furthermore, climate change is intensifying these natural and anthropogenic dynamics. The alteration of hydrodynamics and the sea level rise increase the rate and extent of erosion, as well as a greater risk of coastal erosion [25]. In this regard, the IPCC projections (2007), cited by Maio et al. [26], estimate a possible sea level rise of up to one meter by the end of the century. Although recent predictions are less dramatic, an increase in sea level could worsen coastal retreat, as is currently observed in one-quarter of the coastline of the Valencian Community [1].
In this context, to study these changes, the comparison of shorelines based on historical data has become one of the most widely used methodologies [21]. This approach allows for determining rates of erosion or accretion depending on the mechanisms influencing the coast, thereby projecting possible future changes, which is key for spatial planning [27,28]. However, shoreline analysis can present limitations when based on isolated observations or very short periods. Seasonal variations, run-up, or sea level fluctuations can induce errors if there are not enough records distributed in a representative manner [20]. In recent years, the use of technologies such as satellite imagery, aerial photography, LiDAR sensors, video surveillance, and RTK-GPS has increased the capacity for observation and precision in detecting the shoreline. Despite this, satellite images have spatial resolution limitations that affect erosion rate calculations, though they enable digital processing to enhance shoreline extraction [6,14]. To facilitate analysis, tools such as Geographic Information Systems (GIS) have become essential, as they allow for the comparison of spatial data from different periods and the analysis of the morphological evolution of the coastal strip [6,29]. Finally, the Digital Shoreline Analysis System (DSAS) complement enables quantification of shoreline changes both in the short [30,31] and long term [32].
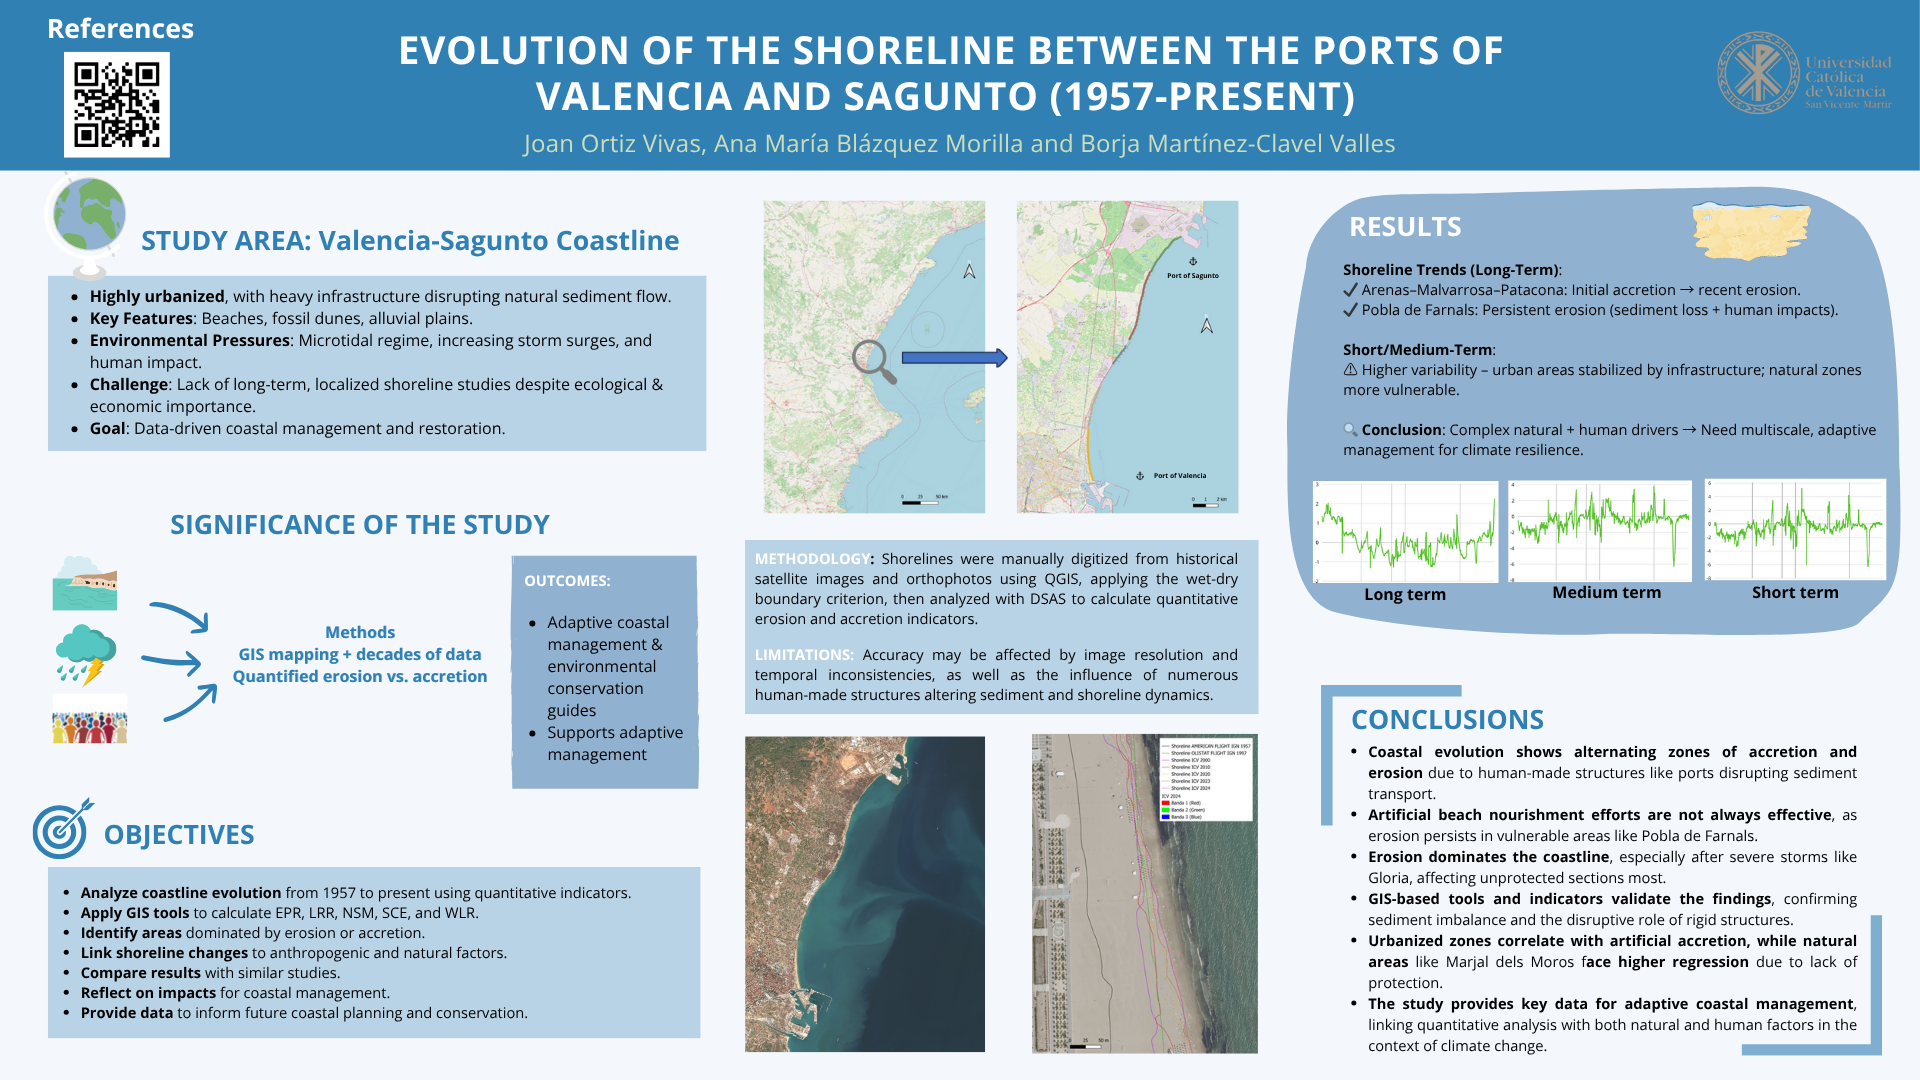
This study focuses on analyzing the evolution of the coastline between the Port of Valencia and the Port of Sagunto from 1957 to the present day. The aim is to quantify changes in the shoreline over time through the application of Geographic Information System (GIS) tools and the calculation of key quantitative indicators, including the End Point Rate (EPR), Linear Regression Rate (LRR), Net Shoreline Movement (NSM), Shoreline Change Envelope (SCE), and Weighted Linear Regression (WLR). The objective of the research is to identify areas affected by predominant erosion or accretion processes, the interpretation of which will be related to both anthropogenic and natural factors. The results obtained will be an important contribution to coastal management, environmental conservation, and land-use planning in vulnerable coastal regions. This research constitutes an important contribution to our understanding of the coast, as until now, no comprehensive analyses of coastal evolution have been conducted for the coastal section in this area, except for regional studies or isolated geomorphological observations.
2. Study Area
The study area covers approximately 20 km of coastline and is located in the province of Valencia (Valencian Community, Spain), specifically in the coastal section between the Port of Valencia and the Port of Sagunto (Figure 1). This area is characterized geomorphologically by the presence of beaches, fossil dunes, and alluvial plains [33].
From an oceanographic perspective, a microtidal regime is observed, with a range of less than 30 cm and an astronomical component of about 8–10 cm, typical of the western Mediterranean [4]. However, meteorological storm surges constitute the main factor causing sea level variations, which can reach up to 45 cm during extreme events, such as Storm Gloria in 2020. These surges are associated with sudden drops in atmospheric pressure, with an average response estimated between 2 and 3 cm per hectopascal (hPa) in the Mediterranean, whose sensitivity is greater than that recorded in the Atlantic (around 1.5 cm/hPa) due to the semi-enclosed nature of the Mediterranean Sea [34].
From a climatic perspective, the Valencian coastline experiences average temperatures of approximately 24.6 °C in July and 10.3 °C in January, with average annual precipitation ranging between 500 and 750 mm. Additionally, the prevailing winds in the area have a direct influence on the direction of incoming waves, which affects the formation of coastal currents and the transport of sediments along the shore [4]. The coastal currents in the area have a net southward direction, mainly driven by the prevailing east and northeast winds [34,35].
To characterize the marine dynamics and wave conditions in the stretch between the Port of Valencia and the Port of Sagunto, as shown in Figure 2, data from satellite SIMAR 2081115, managed by Puertos del Estado [35], have been used. This buoy was selected for its proximity to the studied coast, allowing for representative recordings of the oceanographic conditions along the coastline under study. Although no significant trend has been detected in the increase of storm surges (1993–2022), the frequency of extreme events appears to be rising; this is the case in Valencia, where the annual hours with storm surges (SS) greater than 20 cm have increased by +1.5 mm/year [34]. Global studies such as those by Griggs and Reguero [36] warn that rising sea levels and increased storm intensity will heighten flood risks in coastal wetlands, affecting vulnerable areas like Marjal dels Moros, due to its lower topography.
The area as a whole is considerably anthropized and features a wide variety of coastal infrastructures that modify the coastal dynamics and shoreline. This stretch is bounded to the south by the Port of Valencia and to the north by the Port of Sagunto, two port infrastructures that act as barriers to the north-south longitudinal sediment transport. Additionally, throughout the studied sector, a large number of groynes, breakwaters, dikes, and promenades are distributed, which interfere with the coastline and alter accumulation and erosion patterns, limiting the natural processes of beach regeneration. The distribution of these structures is greater in urbanized areas compared to more natural zones.
Finally, in some sectors of the study area, regenerative measures were carried out to restore ecosystems and protect the coastline against erosive processes. On one hand, a volunteer action coordinated by Acció Ecologista-Agró Horta Nord, in collaboration with the Sagunto City Council, restored the flora of the dunes at Puzol Beach [37]. This measure, in addition to contributing to the conservation of native flora, also increased the area’s resistance to erosion by protecting the dune system. On the other hand, in Marjal dels Moros, the coastline was replenished with external sandy material as a soft measure to preserve it against storms [38]. These types of regenerative actions help restore environments and mitigate erosion.
3. Materials and Methods
To carry out the study of the coastline evolution in the stretch between the Port of Valencia and the Port of Sagunto from 1956 to 2024, a series of satellite images and orthophotos of the area within that time frame were obtained. These images were downloaded from the data sources of the official websites of the National Geographic Institute (IGN) and the Valencian Cartographic Institute (ICV) (Table 1) and were projected to the UTM Zone 30N coordinate system (EPSG: 25830) in order to work with more precise and reliable data. Once the images were obtained, they were added to the QGIS software (version 3.40). Then, each shoreline was manually digitized using a polyline composed of multiple points, following a consistent criterion for each one of them (Figure 3).
To delineate the shoreline, the visual criterion of the transition between the dry zone and the wet part of the beach was used, that is, the wet-dry boundary, which marks the usual reach of the water [39]. Since this is a microtidal area, this criterion aligns with the study’s objective [17]. Moreover, this widely used and recognized criterion allows for clear distinction of the shoreline in aerial photographs and shows relative stability against momentary variations in waves or tides, making it a good indicator of the coastal position [16]. Once the shorelines from each of the obtained images were digitized, the DSAS extension [40] was used to calculate the distances between them, enabling a more precise analysis. This tool generates perpendicular profiles, called transects, from a baseline and calculates various metrics that quantify the changes in the shoreline over time.
To perform the calculations in DSAS, a baseline parallel to the most stable shoreline was created to serve as a reference for generating the transects. The transects were generated perpendicular to this baseline, with a length of 150 meters, a spacing of 20 meters, and a smoothing distance of 200 meters. Using the transects and shorelines from different years, and applying the statistics tool included in DSAS, a series of parameters were obtained:
- (a)
- End Point Rate (EPR): Calculates the total change in the shoreline by dividing the net shoreline movement (NSM) by the number of years between the first and last dates of the analysis, expressed in meters per year. Its main strength lies in its simplicity of calculation. However, since it is based only on two time points, it does not consider the available intermediate data, which can limit its ability to adequately reflect changes or trends over time. For this reason, it is common to compare its results with more robust methods, such as linear regression or weighted regression, which take multiple observations into account [41].
- (b)
- Linear Regression Rate (LRR): Estimates the overall trend of coastal change by fitting a linear regression line to all available shoreline positions. In this calculation, the linear regression is derived from the intersection points of each transect, and the slope represents the rate of change expressed in meters per year. It is a useful tool for predicting how the coastline may evolve in the future and allows for assessing whether there is a clear relationship between the passage of time and shoreline movement. However, it can be affected by outliers that skew the results and, in some cases, tends to produce a lower rate of change compared to other methods [17].
- (c)
- Net Shoreline Movement (NSM): Represents the distance (m) between the oldest and most recent shoreline positions, without considering the time elapsed [32].
- (d)
- Shoreline Change Envelope (SCE): Indicates the maximum distance (m) between the most distant shoreline positions, regardless of their temporal order [40].
- (e)
- Weighted Linear Regression (WLR): Similar to LRR, but incorporates the uncertainty of each shoreline position as a weighting factor in the analysis, reducing the impact of less precise data and improving the reliability of the statistical fit [40]. It is used to represent how the shoreline has evolved over time. This method allows identification of areas that have changed more rapidly, helping to highlight zones that may be more vulnerable to erosion [17,42].
These indicators allow for a detailed analysis of erosion and accretion processes along the coast, as well as the detection of potential spatial or temporal behavior patterns. Positive values of the parameters indicate a seaward movement of the shoreline (accretion), while negative values indicate a landward movement (erosion). To conduct a more detailed analysis and more clearly identify the shoreline behavior patterns, the study area was divided into five distinct sections based on the geomorphological, sedimentary, and anthropogenic characteristics of the coast.: Arenas - Malvarrosa - Patacona, Port Saplaya, Pobla de Farnals, Puzol, and Marjal dels Moros (Table 2).
At the sedimentary level, beaches composed of sand and pebbles dominate all five zones [33], especially in zones 1, 3, and 4. From an anthropogenic perspective, all areas are characterized by a significant presence of coastal defense structures (groynes and breakwaters), which alter the coastal dynamics, in addition to existing port infrastructures. In zone 5, slag deposits resulting from the industrial activity of the Altos Hornos de Sagunto stand out, acting as a barrier against erosion [24].
It is important to consider the limitations of this study, as it is based on images with varying resolutions and temporal coverages, whose characteristics may influence the manual digitization of the shorelines. Additionally, the study area contains a large number of anthropogenic structures that alter the shoreline and sediment balance.
4. Results
The average values obtained for each parameter in the five delineated zones are shown in Figure 3, broken down into three different temporal scales: long term (1957-2024), medium term (1997-2024), and short term (2015-2024) (Table 3). Statistical values for each of the five analyzed parameters (EPR, LRR, NSM, SCE and WLR) were obtained. The results of this study include: mean, median, standard deviation, total sum, minimum, maximum, range, as well as the values of the first quartile (Q1), third quartile (Q3), and the interquartile range (IQR). These values are shown in the appendix.
With the aim of clearly and comparatively representing the results graphically, the LRR parameter was selected. Unlike other parameters such as NSM or SCE, which can be more influenced by extreme values or isolated changes, LRR offers a more consistent view of coastal behavior over time, allowing for the identification of a general and stable trend in shoreline evolution [17]. Figure 4 shows the evolution of the LRR indicator across the five study zones over three different time periods: 1957–2024 (long term), 1997–2024 (medium term), and 2015–2024 (short term).
In Figure 4.1 (1957–2024), gentle fluctuations are observed in most zones, with generally positive values standing out in Zone 1 (Arenas - Malvarrosa - Patacona) and negative values in Zones 2, 3, and 4 (Port Saplaya, Pobla de Farnals, and Puzol). In Zone 5 (Marjal dels Moros), there is a noticeable trend towards positive values in the final section.
The variations in the LRR progressively increase when the 1997-2024 time interval is considered (Figure 4.2). All zones exhibit more pronounced peaks, both positive and negative. Notably, there is a very pronounced minimum value in Zone 5, which did not appear in the longer-term timeframe. Additionally, more intense oscillations are identified in the central zones (Zones 2, 3, and 4).
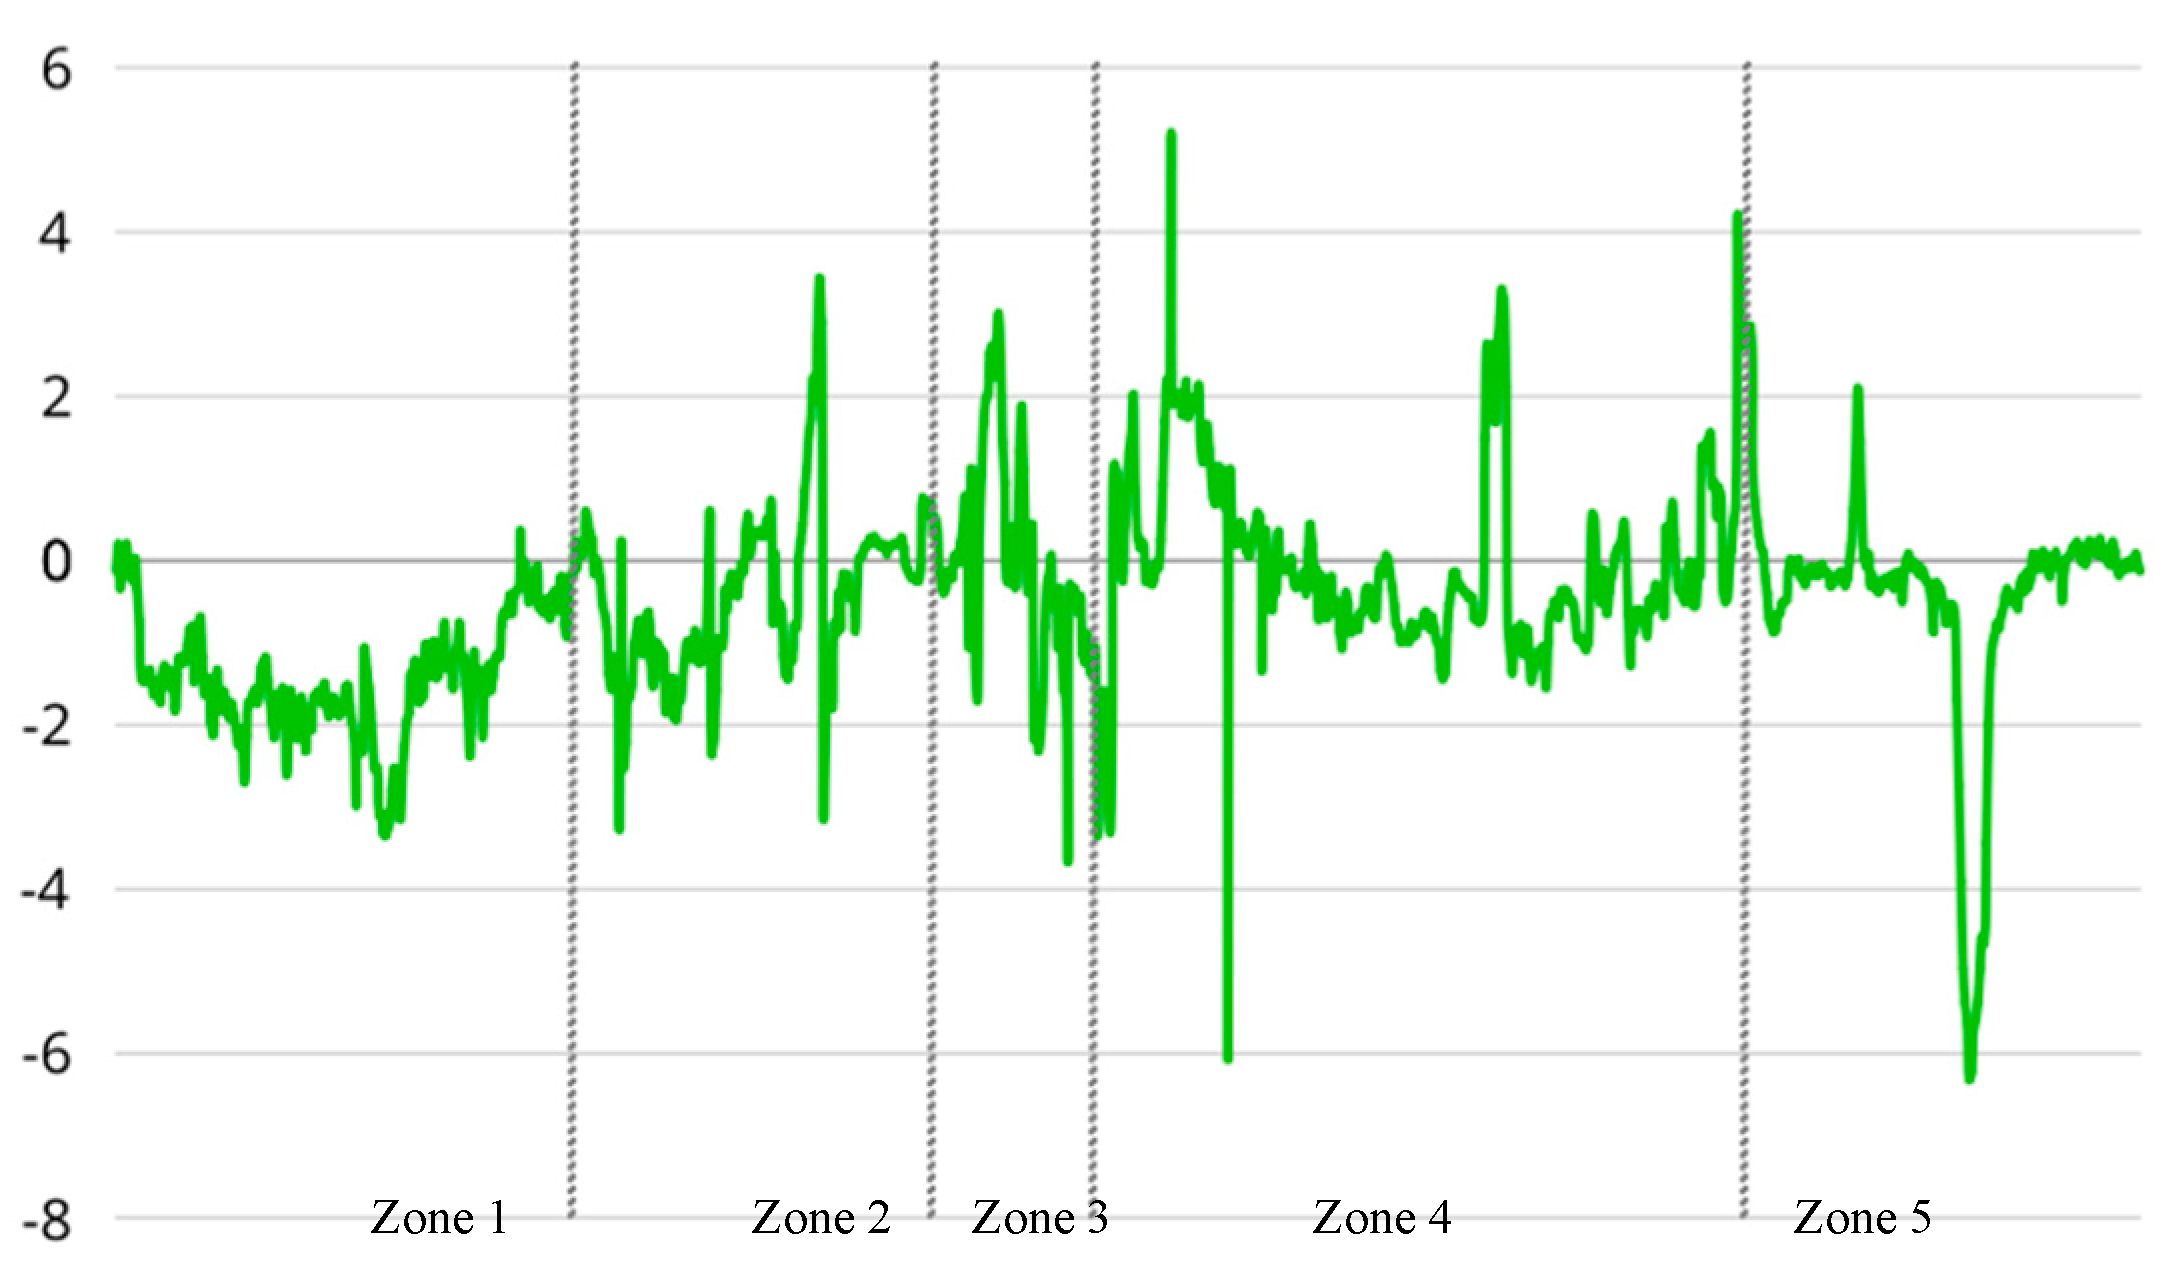
In the shortest time interval (2015-2024) a general trend toward negative values is observed in most of the sections (Figure 4.3). Zone 5 maintains a graph shape similar to that of the intermediate time interval, with relatively constant low values. Zones 2 and 3 show less variability compared to the longer time frames.
Figure 5.
1. Linear Change Rate (LRR) by study zones for the period 1957-2024. Zone 1: Arenas – Malvarrosa – Patacona, zone 2: Port Saplaya, zone 3: Pobla de Farnals, zone 4: Puzol, zone 5: Marjal dels Moros. Mean values of the indicators EPR, LRR, NSM, SCE, and WLR obtained for each of the five zones, divided into three different temporal scales.
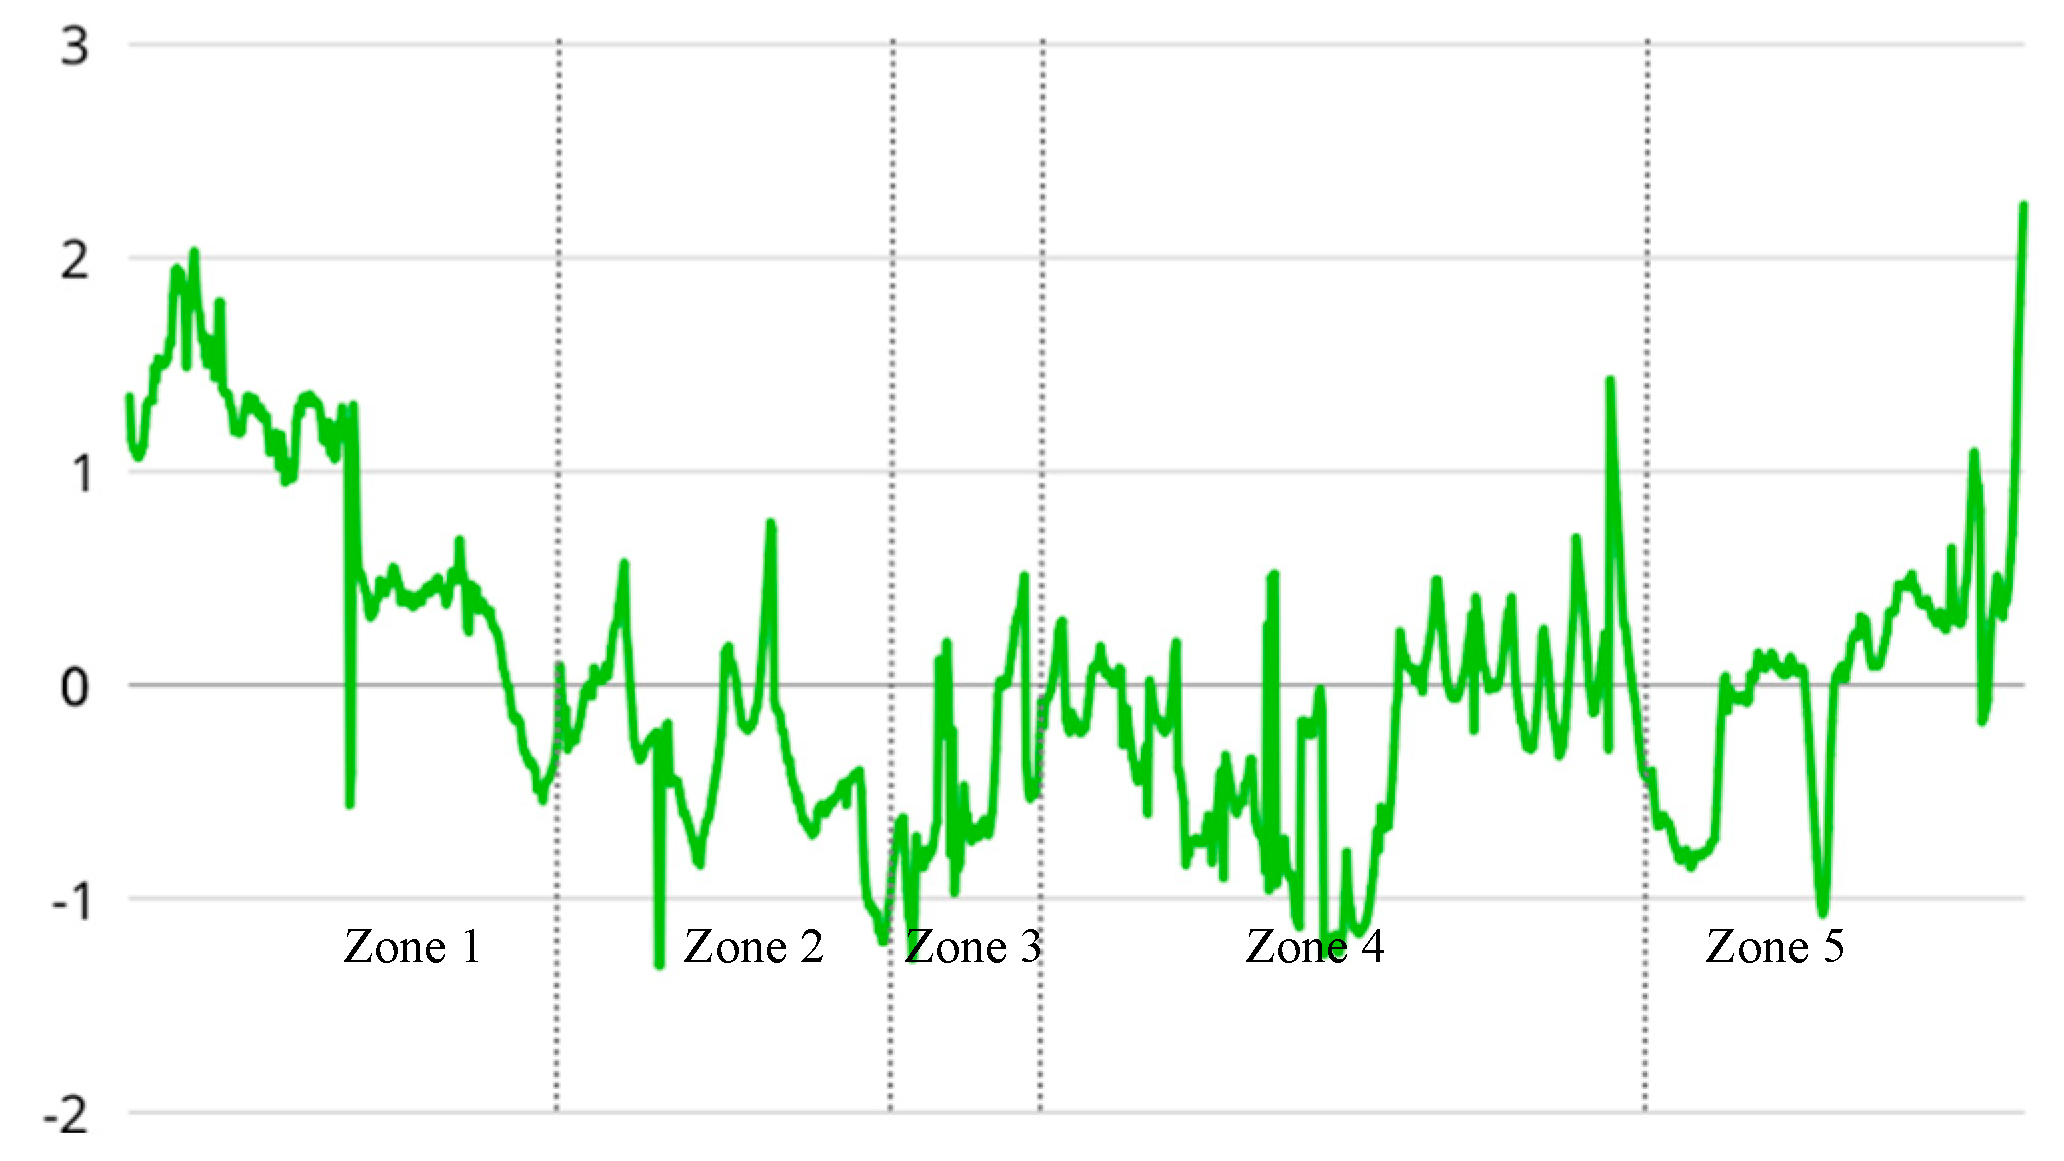
Figure 5.
2. Linear Change Rate (LRR) by study zones for the period 1997-2024. Zone 1: Arenas – Malvarrosa – Patacona, zone 2: Port Saplaya, zone 3: Pobla de Farnals, zone 4: Puzol, zone 5: Marjal dels Moros. Mean values of the indicators EPR, LRR, NSM, SCE, and WLR obtained for each of the five zones, divided into three different temporal scales.
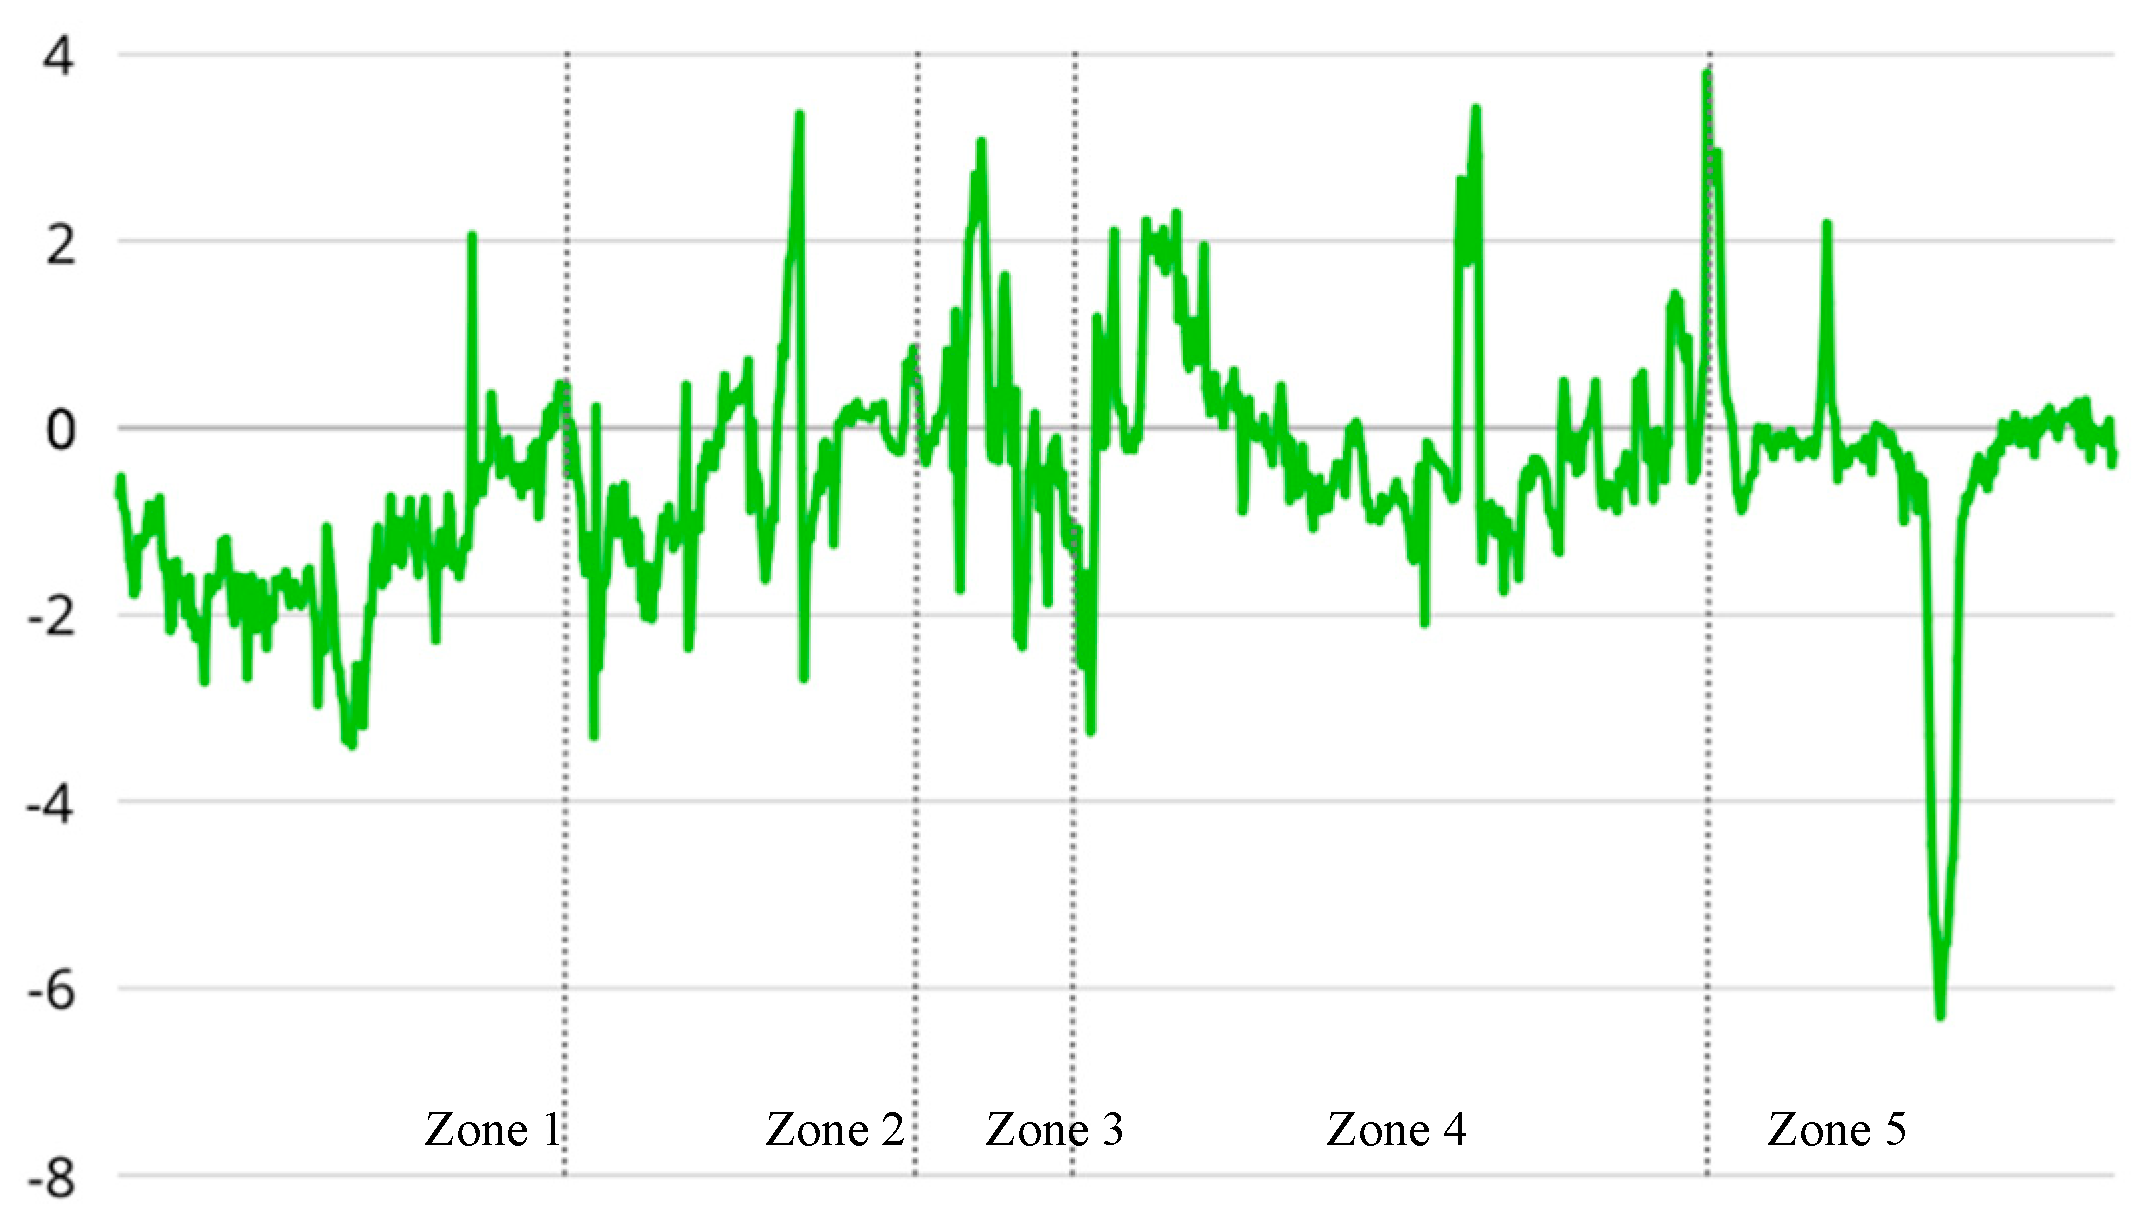
Figure 5.
3. Linear Change Rate (LRR) by study zones for the period 2015-2024. Zone 1: Arenas – Malvarrosa – Patacona, zone 2: Port Saplaya, zone 3: Pobla de Farnals, zone 4: Puzol, zone 5: Marjal dels Moros. Mean values of the indicators EPR, LRR, NSM, SCE, and WLR obtained for each of the five zones, divided into three different temporal scales.
5. Discussion
5.1. Comparative Analysis of Average Values by Areas and Time Scales
The analysis of the obtained results has made it possible to identify significant spatial and temporal patterns in the evolution of the coastline. To strengthen the analysis and validate the findings, this information was compared with a recent study conducted by the Geoenvironmental Cartography and Remote Sensing Group (CGAT) of the Polytechnic University of Valencia (UPV), in collaboration with the Valencian Cartographic Institute (ICV), which provides a detailed and up-to-date view of the coastal dynamics in the Valencian region.
Zone 1: Arenas - Malvarrosa – Patacona
In the long term (1957-2024), this zone shows a clear trend of shoreline accretion, as observed in the LRR graph, with an average of 0.88 m/year. Additionally, it presents positive average values for each of the other parameters: NSM of 58.42 m; SCE of 76.31 m; and WLR of 0.81 m/year. This accretion dynamic could be linked to the influence of the Port of Valencia, which since its construction acts as a barrier to the north-south sediment transport, favoring sediment accumulation on the updrift side of the breakwater [21,23,25].
Recent studies, such as the one of Conesa et al. [28], confirm this accretion trend in the area. Specifically, the Malvarrosa Beach width has increased from 48 m to 240 m between 1957 and the present day, in response to the port’s effect as a sedimentary barrier.
Despite this trend, the positive evolution has shifted in recent decades. In the medium term (1997–2024), an inversion in the trend is observed, with negative values for EPR (-0.40 m/year) and LRR (-1.47 m/year), suggesting the onset of an erosive phase, which is also confirmed in the 2015–2024 period (mean LRR: -1.43 m/year). This transition has been highlighted in studies such as those by CGAT-UPV, which emphasize the increasing vulnerability of sections not protected by anthropic structures.
The intensification of erosion could be related to the increase in the intensity and frequency of storms, due to the consequences of climate change observed throughout the 19th century, which adds to the sediment scarcity associated with anthropogenic activities (dams, destruction of dune systems, etc.).
Zone 2: Port Saplaya
In the long term (1957–2024), Port Saplaya shows a moderate but steady erosive trend, with average negative values of EPR (-0.25 m/year) and LRR (-0.27 m/year), accompanied by a net coastline loss of -16.15 m (NSM) and a similar rate of shoreline retreat in WLR (-0.23 m/year). This erosive dynamic persists in the medium and short term, with LRR values around -0.44 m/year, suggesting a continuous presence of regressive coastline processes across all time scales.
Despite this, the relatively low NSM and SCE values reflect an apparent stability. According to CGAT-UPV, this may be due to the strong anthropogenic control exerted over this area and the presence of defensive structures, such as groynes, which slow down erosive processes—albeit at the cost of interrupting coastal sediment transport and hindering the natural regeneration of the system.
Zone 3: Pobla de Farnals
In the long term (1957–2024), Pobla de Farnals is characterized by a strong erosive trend, with notably negative values across all analyzed indicators: EPR (-0.71 m/year), LRR (-0.57 m/year), NSM (-43.99 m), and WLR (-0.39 m/year). These data reflect a significant accumulated loss of shoreline in recent decades, making this area one of the most vulnerable stretches of the Valencian coast.
In the medium term (1997–2024), a temporary change in trend is observed, with a positive LRR value (0.13 m/year), suggesting some stabilization or partial recovery of the system during this period. This improvement could be attributed to various factors, such as milder hydrodynamic conditions, targeted interventions, or variations in sediment transport [5]. However, this recovery is not sustained in the short term (2015–2024), as a pronounced negative EPR (-1.05 m/year) is recorded again, indicating that the vulnerability persists and that positive fluctuations may not be sustainable without structural measures or regeneration efforts.
According to Sánchez-Arcilla et al. [42], erosion in the Mediterranean has intensified as a result of the sharp reduction in riverine sediment supply, caused by basin regulation, reforestation, and the construction of dams. This sediment scarcity, worsened by retention in rivers, is one of the key factors identified by CGAT-UPV in their assessment of Pobla de Farnals, classifying it as one of the areas most affected by erosive processes. Additional factors are the intensive urbanization of the coastline and the lack of effective interventions, such as coastal defense structures or regeneration projects, which have left the coast especially exposed to storms, facilitating a progressive retreat of the shoreline.
In this context, Pobla de Farnals represents a clear case of sedimentary imbalance and anthropogenic pressure, where the natural dynamics have been profoundly altered without an effective adaptive response. Erosion not only affects the coastal profile but also threatens infrastructures, urban areas, and nearby ecosystems, highlighting the urgent need for integrated planning and specific protective measures.
Zone 4: Puzol
In the overall analysis (1957–2024), this area shows moderate negative values, with an EPR of -0.27 m/year, an LRR of -0.23 m/year, and an NSM of -18.36 m. However, at the medium scale (1997–2024), the EPR becomes positive (0.58 m/year) and the LRR remains stable at 0.04 m/year, suggesting a possible recovery or phase of stability. In the short term (2015–2024), this period of stability persists, with an EPR of 0.65 m/year and an LRR of 0.06 m/year.
These negative values could be attributed to the influence of the Port of Sagunto and the associated urban developments, which disrupt the coastal drift and cause erosive processes in adjacent sectors such as the stretch between Puzol and Massalfassar [4]. However, stabilization is observed in the medium and short term, which may be related to the strong anthropization of the area, due to the construction of numerous defensive structures and the implementation of regenerative measures that help mitigate erosion, such as the one carried out in 2023 by the Ajuntament de Puçol.
The CGAT-UPV study also recognizes this recent stabilization, although it warns that the defensive works have induced erosion in other stretches, especially towards the south, which highlights the need to plan coastal interventions in an integral manner and not in a sectorial way.
Zone 5: Marjal dels Moros
In the long term (1957-2024), it presents very stable values of EPR (-0.004 m/yr) and LRR (0.03 m/yr), suggesting a relatively balanced coastline, although the values of NSM (-2.37 m) and SCE (33.95 m) indicate some mobility in the coastline. As the period shortens, the dynamics become more regressive, with negative LRR values, both in the medium (-0.52 m/yr) and in the short term (-0.53 m/yr), and similar WLR values, suggesting an increase in coastline regression.
This regression is mainly influenced by the interruption of the coastal drift generated by the Port of Sagunto. This situation is aggravated by the reduction of fluvial sedimentary contributions, due to the construction of the Regajo reservoir in 1959, which has contributed to the sedimentary imbalance and increased regression on the southern coast of the port [43].
In addition, the absence of defensive structures directly on the coastline leaves the marsh particularly exposed to natural erosion processes. However, the presence of slag from the historical dumping of the Altos Hornos de Sagunto, which encrusts the sediment, and the anthropic regeneration interventions carried out by the Ajuntament de Sagunto in 2023, mitigated the effects of erosion in this coastal stretch in the medium and short term. Also noteworthy is the action carried out in 2017 to reinforce the protection of the marsh, with the repair of about 50 meters of the defense mote and the restitution of the protective platform by pouring 850 m³ of boulders from accumulations in nearby breakwaters. Although this intervention did not directly modify the position of the coastline, it did increase the resilience of the system against extreme events [44].
The CGAT-UPV study coincides in pointing out this area as particularly vulnerable, constituting a representative case to evaluate the natural response of the coastline in the absence of intensive and permanent interventions.
5.2. Development of the Coastline Between the Ports of Sagunto and Valencia
Overall, the results show a heterogeneous evolution throughout the five analyzed areas, conditioned by both natural and anthropogenic factors. The urbanized areas have a greater presence of infrastructures (breakwaters, dikes or artificial regeneration) that protect and stabilize the coast, while the natural areas are more vulnerable to erosive processes. The comparison of the results obtained with those of the CGAT-UPV study confirms and reinforces the validity of the data obtained, highlighting the importance of carrying out multiscale analyses that allow observing trends in the coastline over several time scales. These observed trends warn about the need to act against this type of processes, carrying out a more effective coastal planning in the context of climate change and sea level rise.
Considering the scarcity of sediments due to anthropogenic causes (reservoirs, destruction of dune systems, port works, breakwaters, jetties), it is found that the greatest positive displacements are usually related to recent regeneration or areas with active sediment supply. On the contrary, the most negative values, especially in Pobla de Farnals and Puzol, seem to be related to erosive episodes, possibly linked to intense storms or to the lack of sediments.
In addition, the results obtained in the present study coincide with other studies that have analyzed the evolution of the coastline in the Mediterranean. In particular, it reinforces the idea that sediment imbalance has been one of the key factors explaining the intensification of erosional processes, especially as a result of the reduction of fluvial inputs. This decrease is mainly due to the construction of reservoirs, reforestation of watersheds and channelization of rivers [4,42].
This must be added to the role played by the port works, which interrupt the coastal drift and directly influence the morphodynamic behavior of the nearby sections [24]. For all these reasons, the changes observed in this stretch should not be understood as a one-off event, but as the result of a set of natural processes and human transformations that have been accumulating for decades. In this context, the use of multiscale analysis tools and Geographic Information Systems, such as those used in this study, is key to be able to detect trends, anticipate possible risks and propose management measures adapted to the current situation, especially considering the impact of climate change and the rise in sea level in recent years [25].
6. Conclusions
The multi-temporal analysis of the evolution of the coastline between the Port of Valencia and the Port of Sagunto has shown a coastal dynamic strongly conditioned by human action and natural processes. In the long term (1957-2024), the results show an alternation of areas with clear accumulation, such as zone 1 (Arenas – Malvarrosa - Patacona), and others markedly erosive, such as zone 3 (Pobla de Farnals), reflecting the impact of infrastructures such as ports, which interrupt the longitudinal transport of sediments. At this scale, accretionary processes dominate to the north of these structures, while regressive processes affect the southern sections.
At the medium scale (1997-2024), erosion is more influenced by artificial regeneration and other punctual works. Even so, the fact that some areas, such as zone 3 (Pobla de Farnals), remain vulnerable indicates that these interventions do not always work in the medium term. In the short term (2015-2024), erosion is the main process in almost the entire stretch, especially after strong storms such as Gloria, which caused significant setbacks in unprotected areas.
The analyzed indicators (EPR, LRR, NSM, SCE and WLR), obtained using GIS tools such as QGIS and DSAS, have made it possible to quantitatively characterize the evolution of the coastline. The comparison with the CGAT-UPV study reinforces the reliability of the results and demonstrates the validity of the applied methodology. It is confirmed that the sedimentary imbalance combined with the proliferation of rigid structures has profoundly altered the coastal morphodynamics since 1957.
In addition, the analysis confirms that areas with greater urban pressure tend to coincide with sections where artificial accretion is observed. However, this pattern may be more closely related to the presence of infrastructures such as ports, which alter the longshore sediment transport and promote accumulation in certain areas. In contrast, more exposed zones with less direct intervention, such as Marjal dels Moros (zone 5), show higher rates of regression despite having structures like the breakwater from the Altos Hornos, indicating limited protection against erosive processes. These patterns highlight the need to integrate land use and sediment dynamics into coastal planning.
Supplementary Materials
The following supporting information can be downloaded at the website of this paper posted on Preprints.org.
Funding
This research received no external funding
Data Availability Statement
All geospatial datasets used in this study are publicly available from the official websites of IGN and ICV. The results obtained from this study are all presented in this article for public use.
Acknowledgements
This paper has been partially supported by Ingenio Program UCV/2024-153-902 (Catholic University of Valencia).
Conflicts of Interest
The authors declare no conflicts of interest
Abbreviations
| CGAT-UPV | Geoenvironmental Cartography and Remote Sensing Group (Universitat Politècnica de València) |
| DSAS | Digital Shoreline Analysis System |
| EPR | End Point Rate |
| EPSG | European Petroleum Survey Group |
| GIS | Geographic Information Systems |
| ICV | Valencian Cartographic Institute (Instituto Cartográfico Valenciano) |
| IGME | Spanish Geological and Mining Institute (Instituto Geológico y Minero de España) |
| IGN | National Geographic Institute (Instituto Geográfico Nacional, Spain) |
| IPCC | Intergovernmental Panel on Climate Change |
| LiDAR | Light Detection and Ranging |
| LRR | Linear Regression Rate |
| MTTECO | Ministry for Ecological Transition (Ministerio para la Transición Ecológica, Spain) |
| NSM | Net Shoreline Movement |
| QGIS | Quantum Geographic Information System |
| RTK-GPS | Real-Time Kinematic Global Positioning System |
| SCE | Shoreline Change Envelope |
| SS | Storm Surge |
| UTM | Universal Transverse Mercator |
| WLR | Weighted Linear Regression |
References
- Pardo-Pascual, J. E.; Palomar-Vázquez, J.; Cabezas-Rabadán, C. Estudio de los cambios de posición de la línea de costa en las playas del segmento València-Cullera (1984-2020) a partir de imágenes de satélite de resolución media de libre acceso. Cuadernos de Geografía de la Universitat de València 2022, 108, 79–104. [Google Scholar] [CrossRef]
- Alonso Villalobos, C.; Gracia Prieto, F.J.; Benavente González, J. Evolución histórica de la línea de costa en el sector meridional de la Bahía de Cádiz. Revista Atlántica-Mediterránea de Prehistoria y Arqueología Social 2009, 11, 13–37. [Google Scholar] [CrossRef]
- Ibarra Marinas, D.; Belmonte Serrato, F.; Gomariz Castillo, F.; Pérez Cutillas, P. Evolución de la línea de costa en la Región de Murcia (1956-2013). Geo-Temas 2015, 15, 33–36. [Google Scholar]
- Cendrero Uceda, A.; Sánchez-Arcilla Conejo, A.; Zazo Cardeña, C. Impactos sobre las zonas costeras. Evaluación preliminar de los impactos en España por efecto del cambio climático 2005, 11, 469–524. [Google Scholar]
- Rodríguez-Santalla, I.; Roca, M.; Martínez-Clavel, B.; Pablo, M.; Moreno-Blasco, L.; Blázquez, A.M. Coastal changes between the harbours of Castellón and Sagunto (Spain) from the mid-twentieth century to present. Regional Studies in Marine Science 2021, 46. [Google Scholar] [CrossRef]
- Rodríguez, I.; Montoya, I.; Sánchez, M.J.; Carreño, F. Geographic Information Systems applied to Integrated Coastal Zone Management. Geomorphology 2009, 107, 100–105. [Google Scholar] [CrossRef]
- Rodríguez-Rojo, C.N.; Pérez-Cayeiro, M.L.; Chica-Ruiz, J.A. Adaptation to climate change in coastal areas of the European Union. An evaluation of plans and strategies. Preprints 2025. [CrossRef]
- Sardá, R.; Mora, J.; Avila, C. Tourism development in the Costa Brava (Girona, Spain) - how integrated coastal zone management may rejuvenate its lifecycle. Managing European Coasts 2005, 291–314. [Google Scholar]
- Ariza, E.; Sardá, R.; Jiménez, J.A.; Mora, J.; Ávila, C. Beyond performance assessment measurements for beach management: Application to Spanish Mediterranean beaches. Coast. Manag. Int. J. Mar. Environ. Resour. Law Soc. 2007, 36, 47–66. [Google Scholar] [CrossRef]
- Olcina Cantos, J. Cambio y riesgos climáticos en España. Investigaciones Geográficas 2009, 49, 179–220. [Google Scholar] [CrossRef]
- Ariza, E.; Jiménez, J.A.; Sardá, R. A critical assessment of beach management on the Catalan coast. Ocean & coastal management 2008, 51, 141–160. [Google Scholar] [CrossRef]
- Bernatchez, P.; Fraser, C. Evolution of coastal defence structures and consequences for beach width trends, Québec, Canada. J. Coast. Res. 2012, 285, 1550–1566. [Google Scholar] [CrossRef]
- Rajaiah, K.; Ramana Murty, M.V.; R. , Kanungo, A.; Ramana, K.V. Shoreline evolution along Uppada coast in andhra pradesh using multi temporal satellite images and model based approach. Ramana Indian Journal of Geosynthetics and Ground Improvement 2019, 8, 14–19. [Google Scholar]
- Espinosa Montero, V.; Rodríguez Santalla, I. Evolución costera del tramo comprendido entre San Juan de los Terreros y Playas de Vera (Almería). Revista de la Sociedad Geológica de España 2009, 22, 3–12. [Google Scholar]
- Smith, G.L.; Gary, A. Calculating Long-Term Shoreline Recession Rates Using Aerial Photographic and Beach Profiling Techniques. Journal of Coastal Research 1990, 6, 111–120. [Google Scholar]
- Boak, E.H.; Turner, I.L. Shoreline definition and detection: A review. Journal of Coastal Research 2005, 21, 688–703. [Google Scholar] [CrossRef]
- Martín Prieto, J.A.; Roig Munar, F.X.; Rodríguez Perea, A.; Pons Buades, G.X.; Mir Gual, M.; Gelabert Ferrer, B. Análisis de la evolución histórica de la línea de costa de la playa de Es Trenc (Mallorca): causas y consecuencias. GeoFocus: Revista Internacional de Ciencia y Tecnología de la Información Geográfica 2018, 21, 187–214. [Google Scholar] [CrossRef]
- Pardo-Pascual, J. E.; Sanjaume Saumell, E. Análisis multiescalar de la evolución costera. Cuadernos de Geografía de la Universitat de València, /70. [CrossRef]
- Pardo-Pascual, J.E.; Almonacid-Caballer, J.; Ruiz, L.A.; Palomar-Vázquez, J. Automatic extraction of shorelines from Landsat TM and ETM+ multi-temporal images with subpixel precision. Remote Sensing of Environment 2012, 123, 1–11. [Google Scholar] [CrossRef]
- Almonacid-Caballer, J.; Sánchez-García, E.; Pardo-Pascual, J.E.; Balaguer-Beser, A.A.; Palomar-Vázquez, J. Evaluation of annual mean shoreline position deduced from Landsat imagery as a mid-term coastal evolution indicator. Marine Geology 2016, 372, 79–88. [Google Scholar] [CrossRef]
- Pardo-Pascual, J.E.; Roca Moya, R.; Segura-Beltran, F. Análisis de la evolución de la línea de costa entre Alcossebre y Orpesa a partir de fotografía aérea (1956-2015). Cuad. De Geogr. De La Univ. De València 2019, 102, 39–72. [Google Scholar] [CrossRef]
- Leatherman, S.P.; Pajak, M.J. The High Water Line as Shoreline Indicator. Journal of Coastal Research 2002, 18, 329–337. [Google Scholar]
- Pardo-Pascual, J.E.; Carmona, P.; Segura, F.; López García, M.J. Recent coast changes in the Gulf of Valencia. Z. Geomorph. N. F 1996, 102, 95–118. [Google Scholar]
- Sanjaume, E.; Pardo-Pascual, J.E. Erosion by human impact on the Valencian coastline (E of Spain). Coastal Erosion (Proceedings). Spain Journal of Coastal Research 2005, 49, 76–82. [Google Scholar]
- Cabezas-Rabadán, C.; Pardo-Pascual, J.E.; Palomar-Vázquez, J. A remote monitoring approach for coastal engineering projects. Scientific reports 2025, 15, 2955. [Google Scholar] [CrossRef]
- Maio, C.V.; Gontz, A.M.; Tenenbaum, D.E.; Berkland, E.P. Coastal hazard vulnerability assessment of sensitive historical sites on Rainsford Island, Boston Harbor, Massachusetts. Journal of Coastal Research 2012, 28, 20–33. [Google Scholar] [CrossRef]
- Arias Moran, C.A. , (2003). Spatio-temporal analysis of Texas shoreline changes using GIS technique. Tesis Doctoral, Master of Science, Texas A&M University.
- Conesa, P.; Ignacio, J.; Pomares, A. ; Luis, Úbeda, L.; Isabel, Peris, S.; Cristobal, J. La evolución de la línea de costa en las playas de arena del Levante mediterráneo. XIV Jornadas Españolas de Ingeniería de Costas y Puertos.
- Laitinen, S.; Neuvonen, A. BALTICSEAWEB: an information system about the Baltic Sea environment. Advances in environmental research 2001, 5, 377–383. [Google Scholar] [CrossRef]
- Brooks, S.M.; Spencer, T. Temporal and spatial variations in recession rates and sediment release from soft rock cliffs, Suffolk coast, UK. Geomorphology 2010, 124, 26–41. [Google Scholar] [CrossRef]
- González-Villanueva, R.; Costas, S.; Pérez-Arlucea, M.; Jerez, S.; Trigo, R.M. Impact of atmospheric circulation patterns on coastal dune dynamics, NW Spain. Geomorphology 2013, 185, 96–109. [Google Scholar] [CrossRef]
- Oyedotun, T.D.T. Shoreline Geometry DSAS as a Tool for Historical Trend Analysis. Geomorphological Techniques 2014, 3, 2.2. [Google Scholar]
- Instituto geológico y minero de España. Available online: https://info.igme.es/cartografiadigital/datos/Geo50/mapas/d7_PS50/Editado722_PSGeologico50.
- Toledo, I.; Pagán, J.I. ; López; I.; Olcina, J.; Aragonés L. Storm surge in Spain: Factors and effects on the coast. Marine Geology. [CrossRef]
- Puertos del Estado. Available online: https://portus.puertos.
- Griggs, G.; Reguero, B.G. Coastal Adaptation to Climate Change and Sea-Level Rise. Water 2021, 13, 2151. [Google Scholar] [CrossRef]
- Ajuntament de Puçol: AE-Agró amplía el proyecto de restauración de la flora dunar de la playa de Puçol con la ayuda de 50 voluntarios. Available online: https://archivo.xn--puol-1oa.es/index.php/es/component/content/article? 1407.
- Ajuntament de Sagunt: Se terminan los trabajos de aportación de áridos al litoral de la Marjal dels Moros. Available at: https://aytosagunto.
- Ojeda Zújar, J. Métodos para el cálculo de la erosión costera. Revisión, tendencias y Propuesta. Boletín de la Asociación de Geógrafos Españoles. 30, 103-118.
- Himmelstoss, E.A. , Henderson, R.E., Farris, A.S., Kratzmann, M.G., Bartlett, M.K., Ergul, A., McAndrews, J., Cibaj, R., Zichichi, J.L. y Thieler, E.R. (2024). Digital Shoreline Analysis System version 6.0: U.S. Geological Survey 2024. [CrossRef]
- Dolan, R. , Fenster, M.S. y Holmes, S.J. Temporal Analysis of Shoreline Recession and Accretion. Journal of Coastal Research 1991, 7, 723–744. [Google Scholar]
- Sánchez-Arcilla, A.; Jiménez, J.A.; Valdemoro, H. The Ebro Delta: morphodynamics and vulnerability. Journal of Coastal Research 1998, 14, 754–772. [Google Scholar]
- Aranegui Gascó, C.; Ruiz Pérez, J.M.; Carmona González, P. El humedal del puerto de Arse-Saguntum. Estudio geomorfológico y sedimentológico. SAGVNTVM (P.L.A.V.).
- Reparación de la mota de protección del Marjal dels Moros. Ministerio para la Transición Ecológica y el Reto Demográfico. Available online: https://www.miteco.gob.es/es/costas/temas/proteccion-costa/actuaciones-proteccion-costa/valencia/460334-mota-marjal-mors.
Figure 1.
Study area between the Port of Sagunto and the Port of Valencia. Source: OpenStreetMap (2024). Software used: QGIS.
Figure 1.
Study area between the Port of Sagunto and the Port of Valencia. Source: OpenStreetMap (2024). Software used: QGIS.
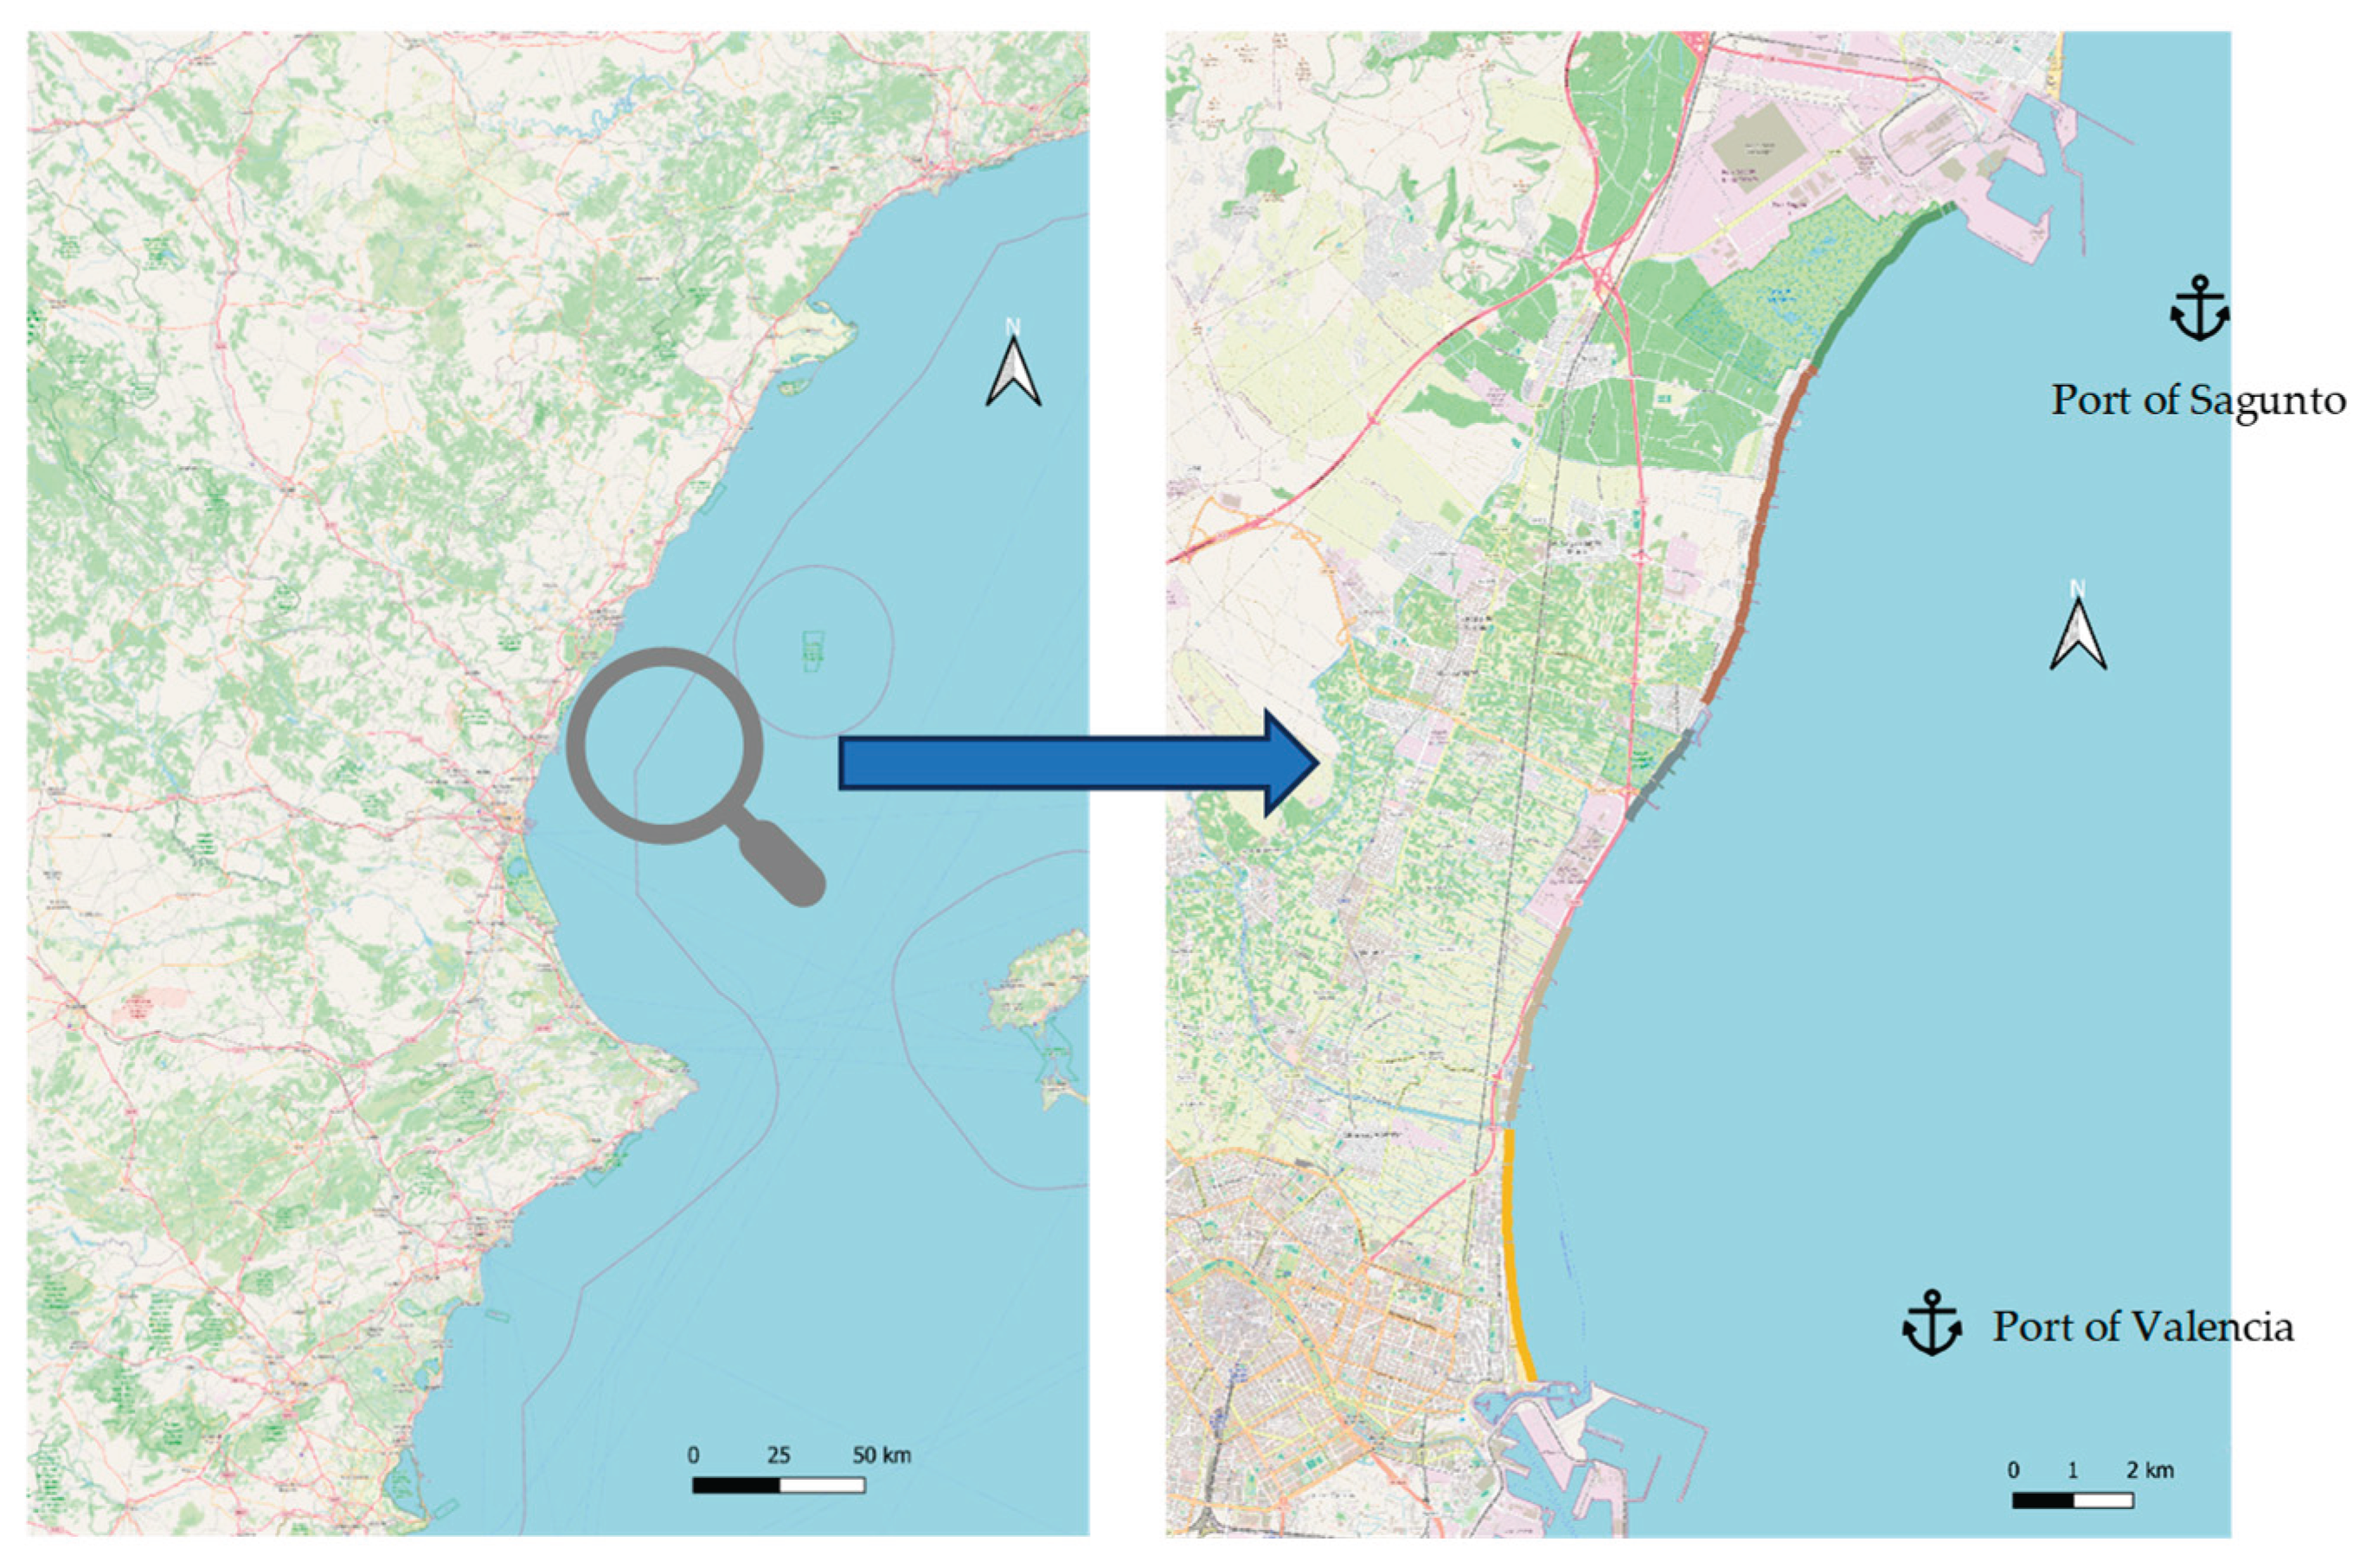
Figure 2.
Significant Wave Height Rose (m) from 1958 to 2025 for the study area. Source: Puertos del Estado (2024).
Figure 2.
Significant Wave Height Rose (m) from 1958 to 2025 for the study area. Source: Puertos del Estado (2024).
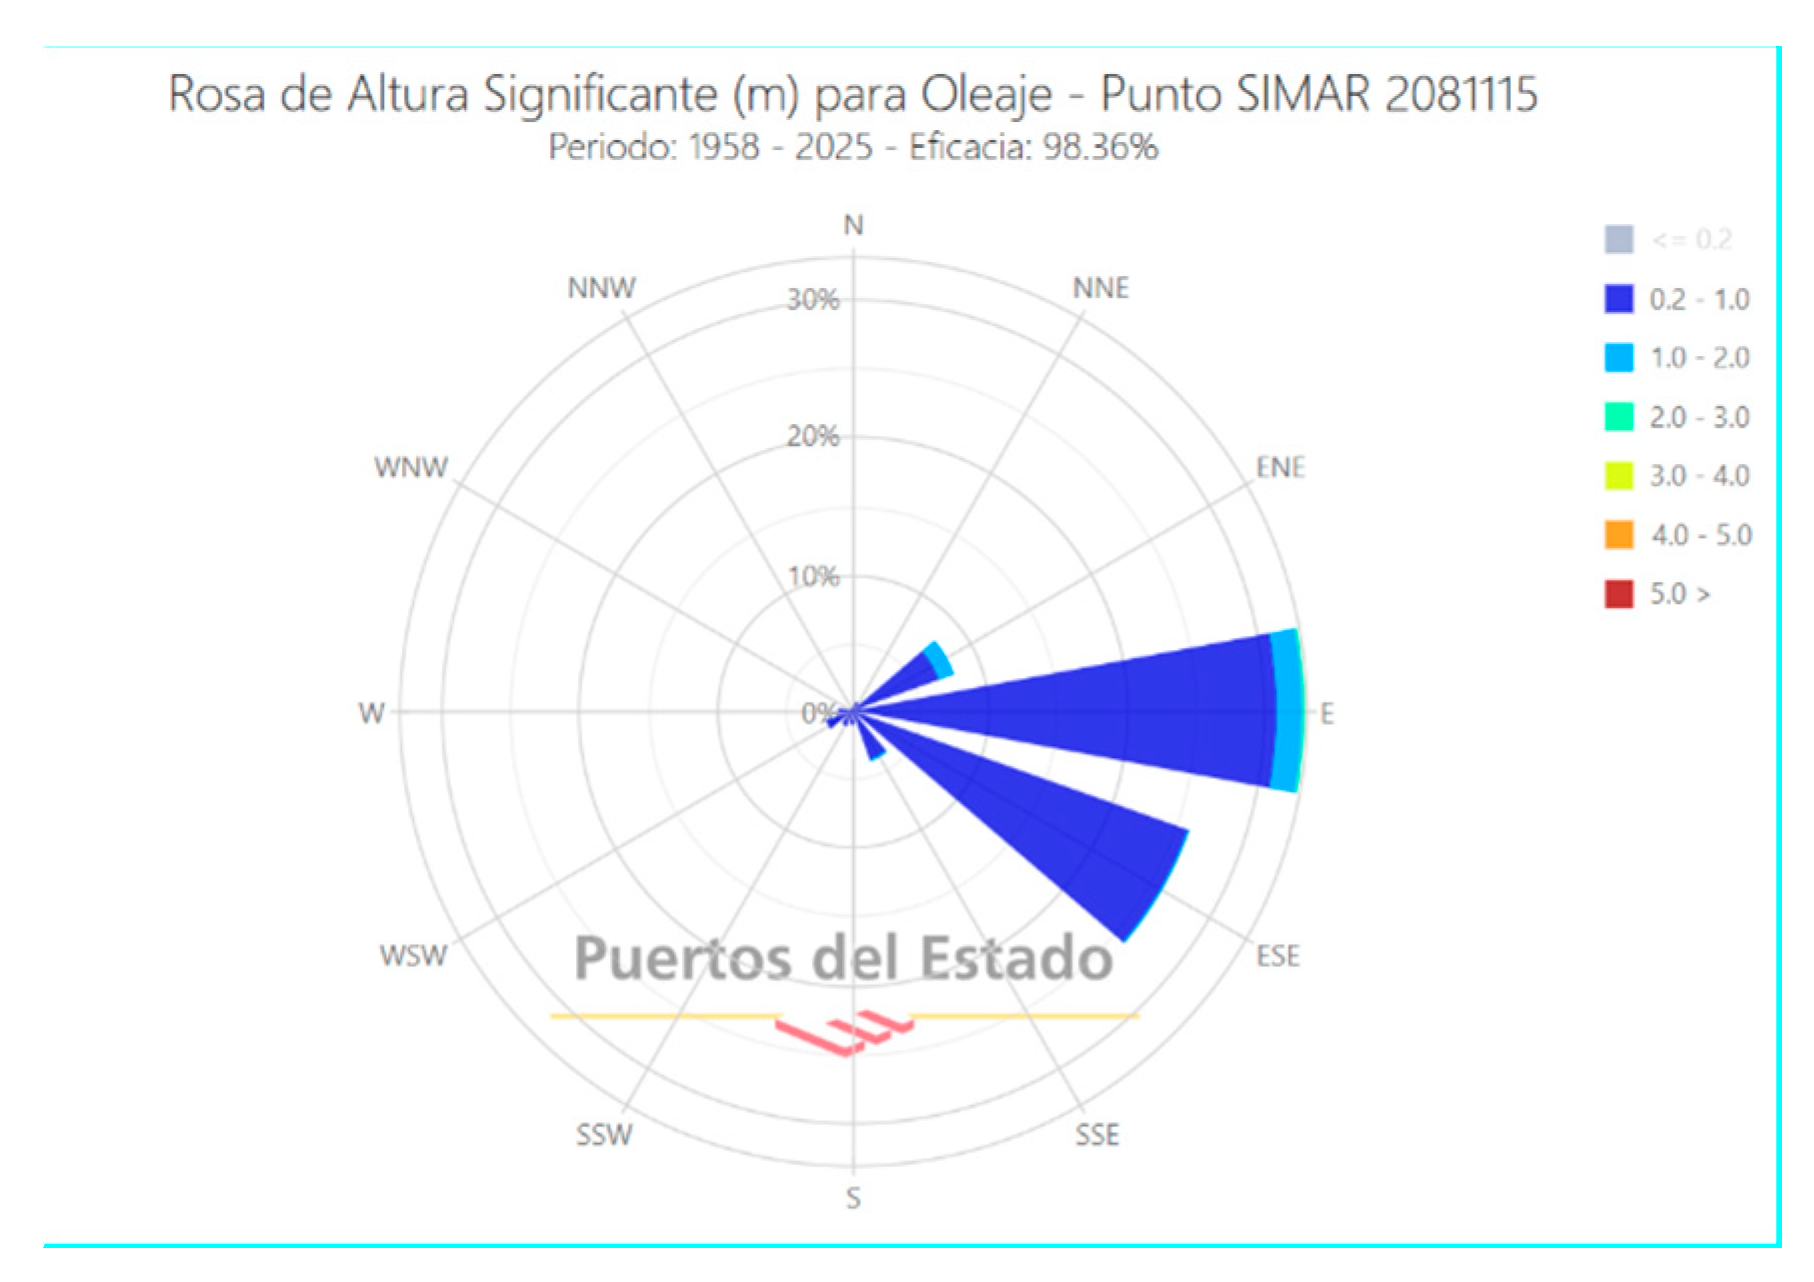
Figure 3.
Digitalization of the shoreline of the coastline located in the study zone by QGIS, applying the wet-dry boundary (Shoreline 1957, 2000, 2010, 2020, 2023 and 2024).
Figure 3.
Digitalization of the shoreline of the coastline located in the study zone by QGIS, applying the wet-dry boundary (Shoreline 1957, 2000, 2010, 2020, 2023 and 2024).
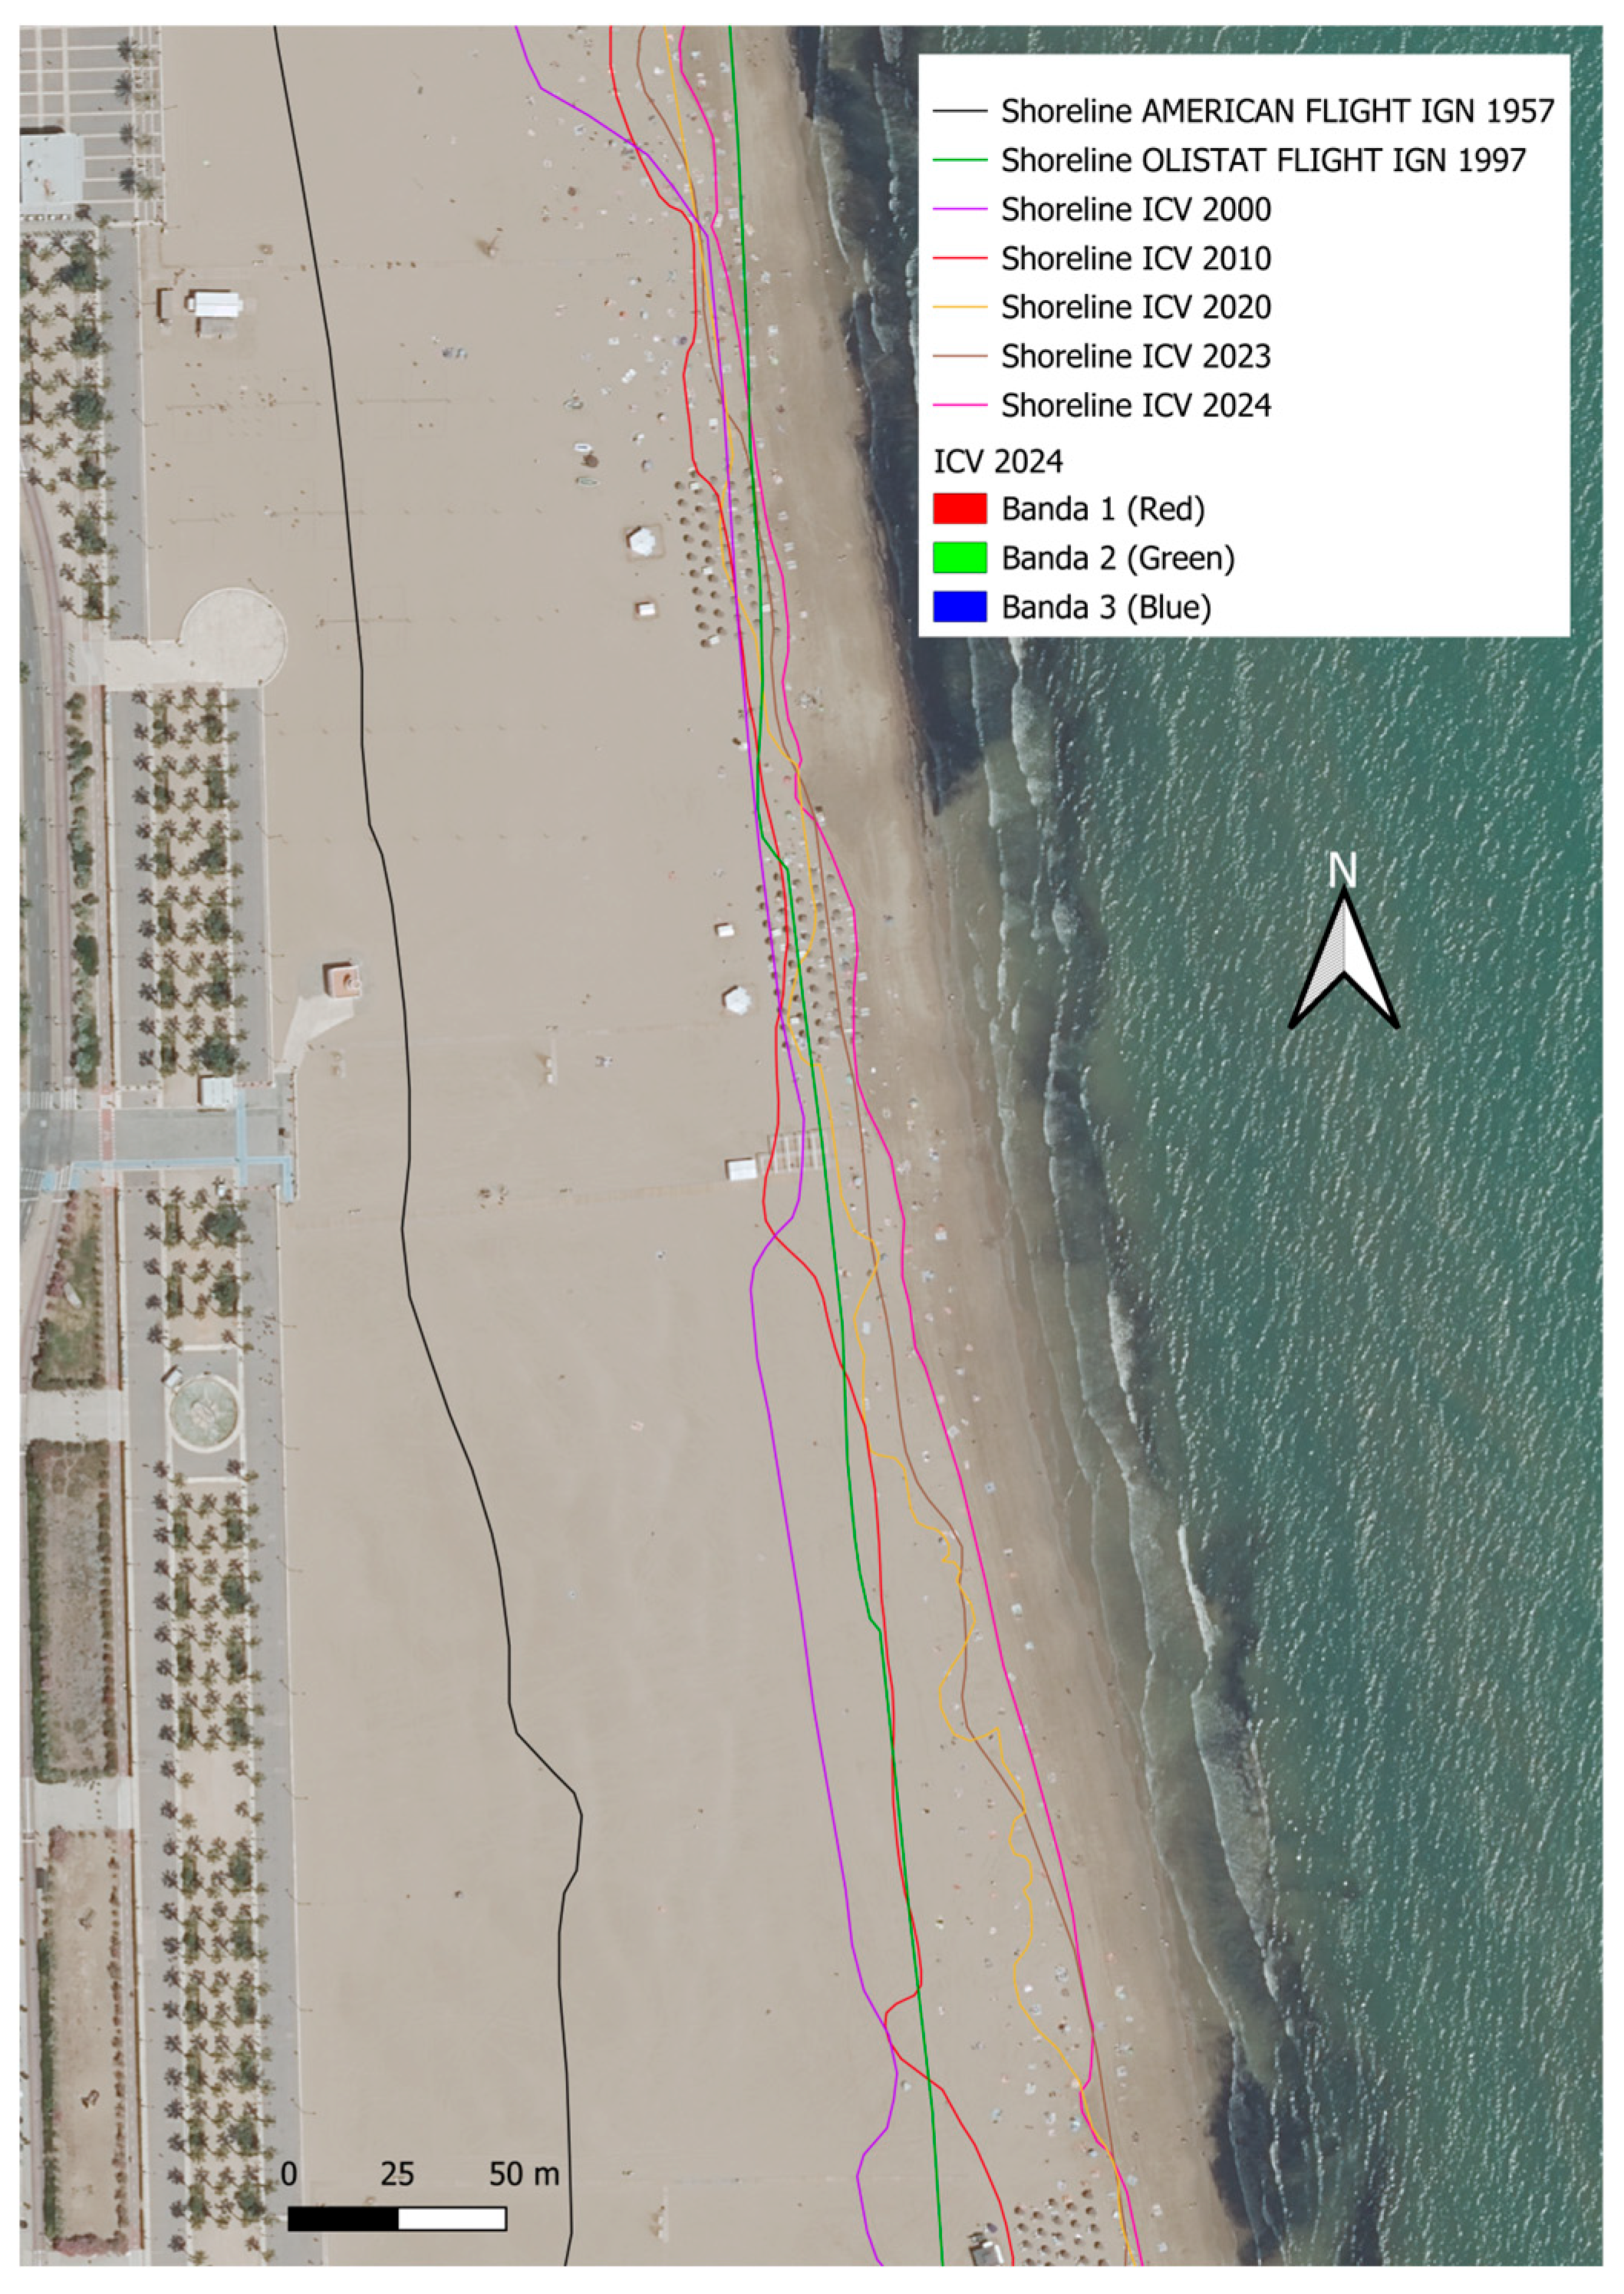
Figure 4.
Spatial division of the study area into five subzones: Arenas – Malvarrosa – Patacona (Zone 1), Port Saplaya (Zone 2), Pobla de Farnals (Zone 3), Puzol (Zone 4), and Marjal dels Moros (Zone 5).
Figure 4.
Spatial division of the study area into five subzones: Arenas – Malvarrosa – Patacona (Zone 1), Port Saplaya (Zone 2), Pobla de Farnals (Zone 3), Puzol (Zone 4), and Marjal dels Moros (Zone 5).
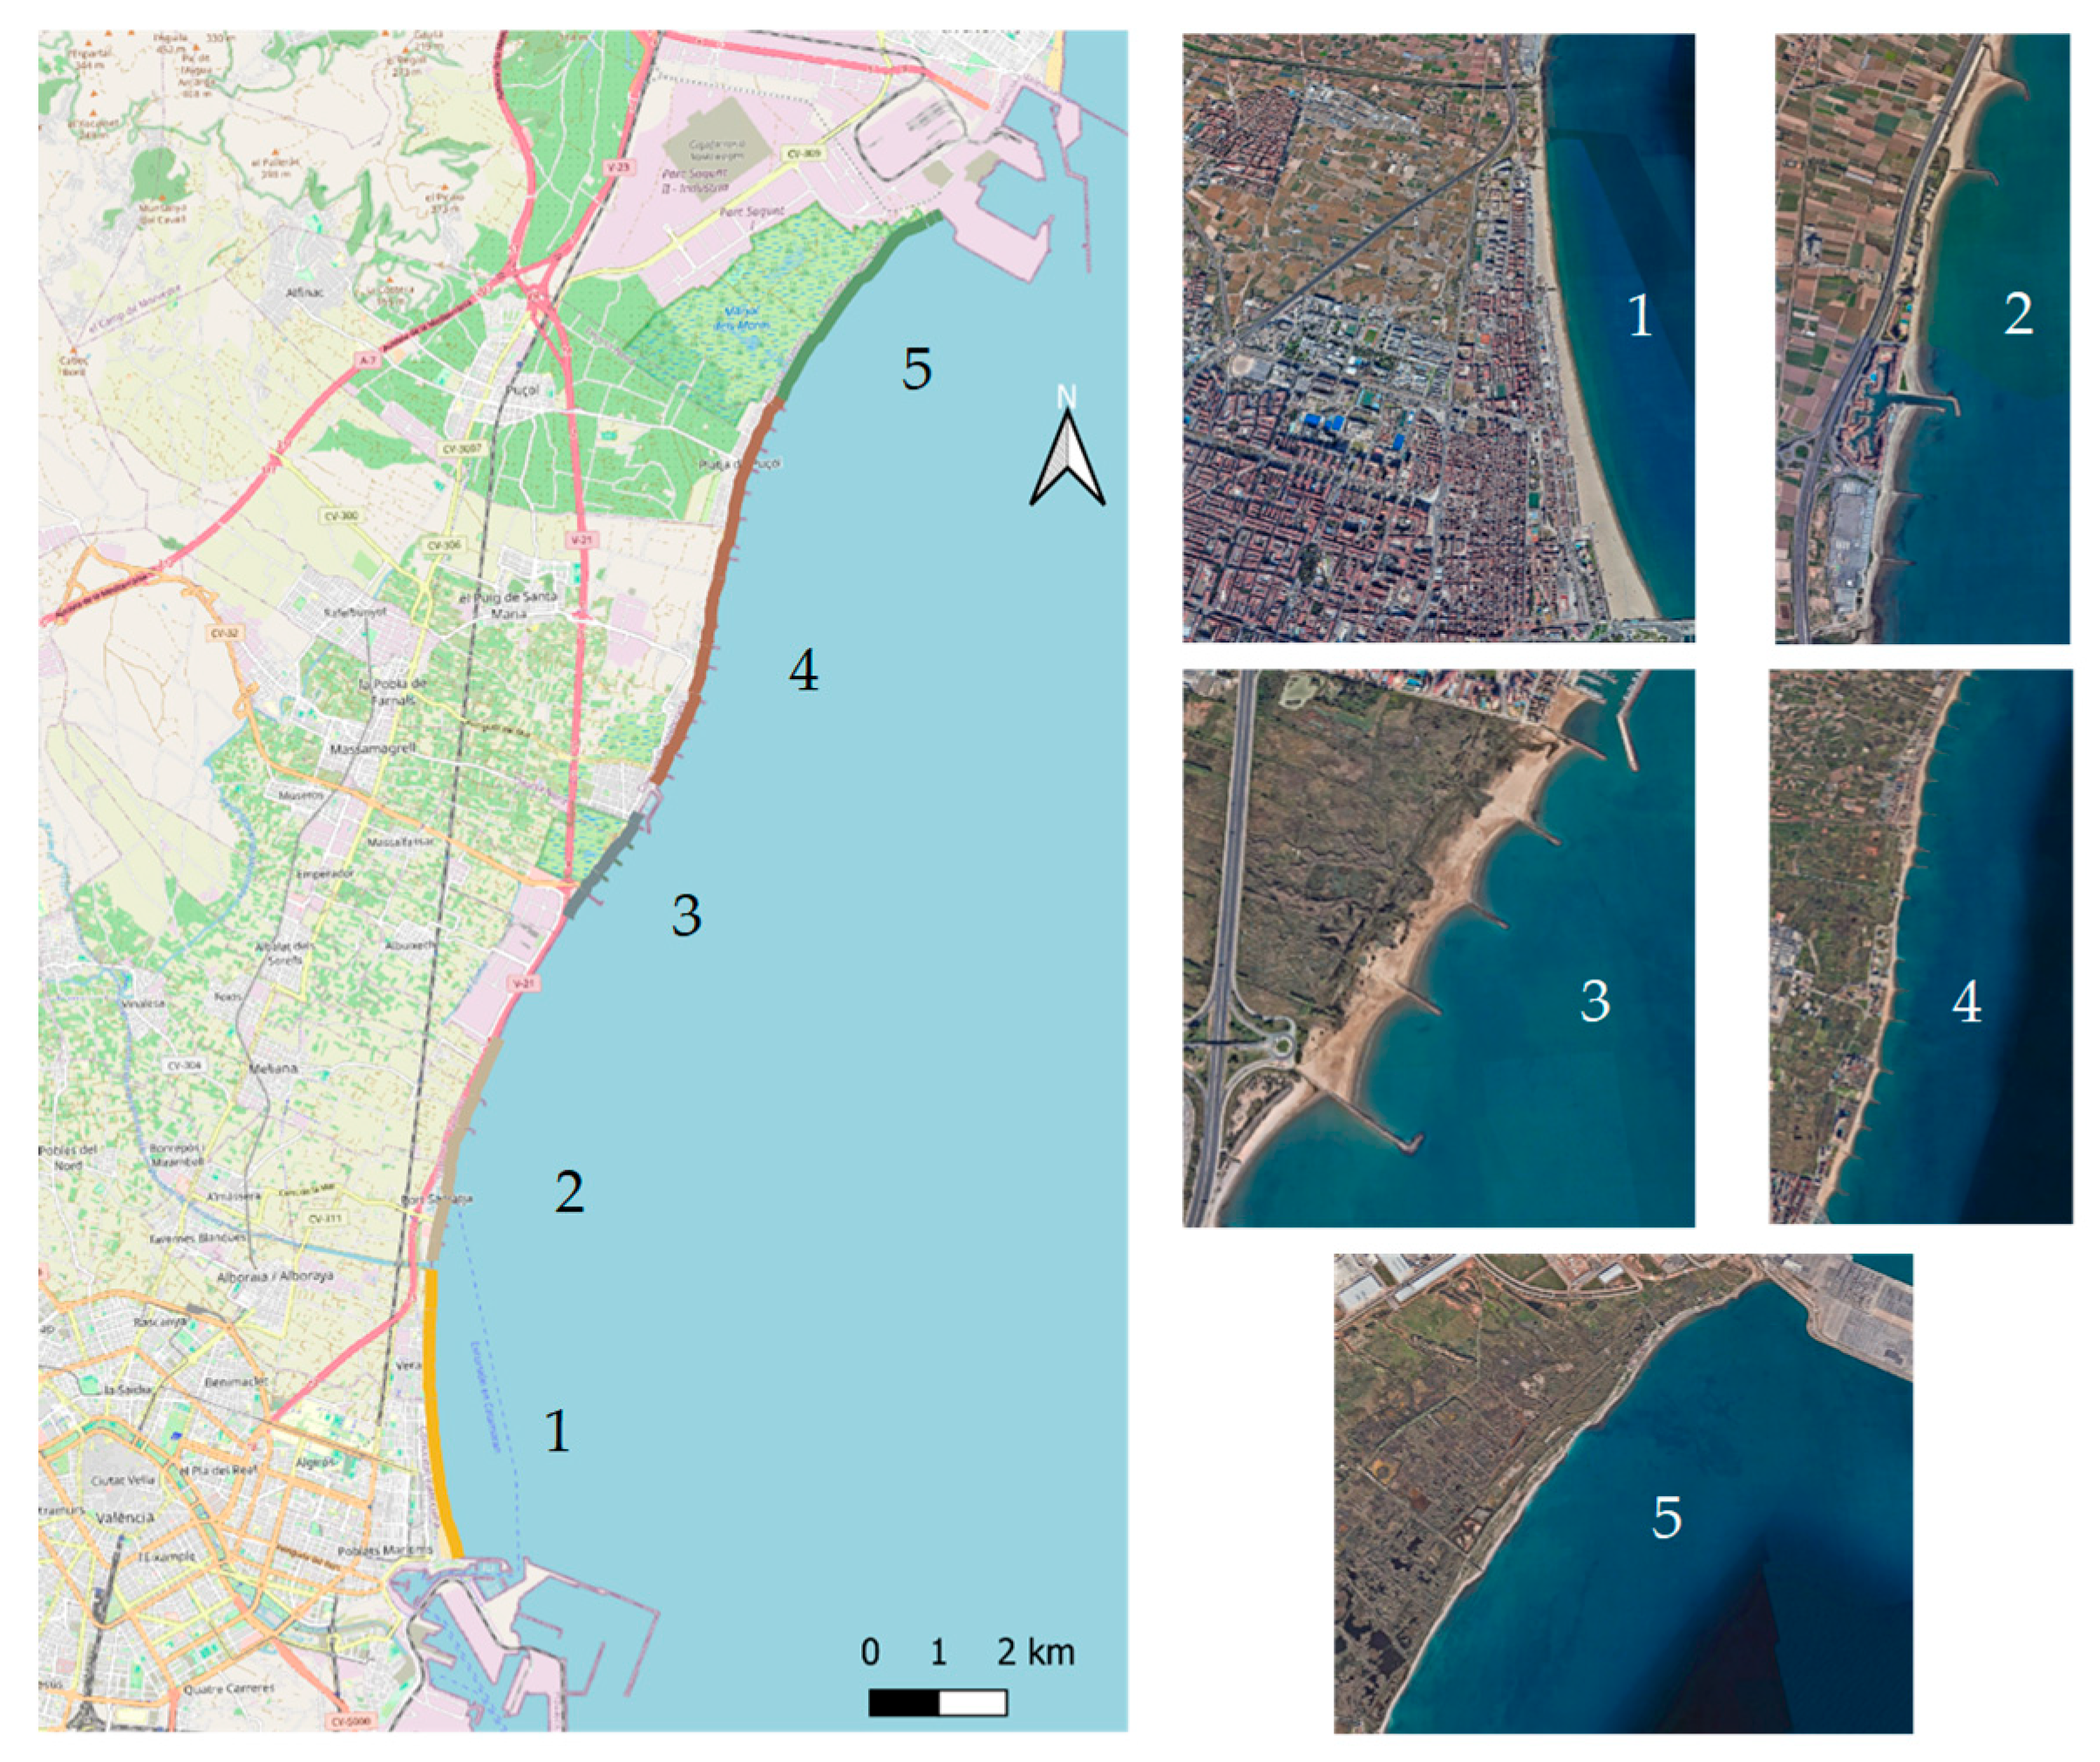

Table 1.
Satellite images and orthophotos used for the study, along with their respective dates, spatial resolution, and source of origin.
Table 1.
Satellite images and orthophotos used for the study, along with their respective dates, spatial resolution, and source of origin.
| Name | Date | Spatial resolution | Origin |
|---|---|---|---|
| American flight | 01/01/1957 | 0.5 m | IGN |
| OLISTAT flight | 15/10/1997 | 1 m | IGN |
| 2000 | 15/08/2000 | 0.5 m | ICV |
| 2004 | 22/06/2004 | 0.5 m | ICV |
| 2006 | 25/07/2006 | 0.5 m | ICV |
| 2008 | 03/09/2008 | 0.5 m | ICV |
| 2010 | 29/11/2010 | 0.25 m | ICV |
| 2012 | 07/07/2012 | 0.5 m | ICV |
| 2015 | 19/06/2015 | 0.25 m | ICV |
| 2017 | 16/07/2017 | 0.25 m | ICV |
| 2018 | 19/07/2018 | 0.25 m | ICV |
| 2019 | 06/06/2019 | 0.25 m | ICV |
| 2020 | 16/05/2020 | 0.25 m | ICV |
| 2021 | 15/06/2021 | 0.25 m | IGN |
| 2022 | 25/05/2022 | 0.25 m | ICV |
| 2023 | 11/06/2023 | 0.25 m | ICV |
| 2024 | 11/07/2024 | 0.25 m | ICV |
Table 2.
Study areas, distributed from South to North, with their respective number of transects, names, extent, and main characteristics of the beaches.
Table 2.
Study areas, distributed from South to North, with their respective number of transects, names, extent, and main characteristics of the beaches.
| Nº | Transects | Name of the zone | Extension (m) | Limits | Sediment | Main anthropic structures |
|---|---|---|---|---|---|---|
| 1 | 1-215 | Arenas - Malvarrosa - Patacona | 4.280 | 39° 27ʹ 47.16″ N 0° 19ʹ 11.76″ W 39° 30ʹ 4.43″ N 0° 19ʹ 22.70″ W |
Fine sands and pebbles |
Port of Valencia 1 breakwater Seafront promenade |
| 2 | 216-386 | Port Saplaya | 3.400 | 39° 30ʹ 8.67″ N 0° 19ʹ 22.27″ W 39° 31ʹ 33.48″ N 0° 18ʹ 50.16″ W |
Fine sands and gravels |
4 transversal groynes 2 breakwaters Seafront promenade |
| 3 | 387-481 | Pobla de Farnals | 1.920 | 39° 32ʹ 52.76″ N 0° 17ʹ 52.55″ W 39° 33ʹ 37.87″ N 0° 17ʹ 5.84″ W |
Fine sands and pebbles |
Marina 4 groynes 3 breakwaters Seafront promenade |
| 4 | 482-787 | Puzol | 6.220 | 39° 33ʹ 51.84″ N 0° 16ʹ 55.12″ W 39° 36ʹ 55.03″ N 0° 15ʹ 31.08″ W |
Fine sands and pebbles |
18 groynes 1 breakwater Seafront promenade |
| 5 | 788-1000 | Marjal dels Moros | 3.580 | 39° 36ʹ 55.03″ N 0° 15ʹ 31.08″ W 39° 38ʹ 18.85″ N 0° 13ʹ 54.07″ W |
Fine sands |
Port of Sagunto 1 embankment |
Table 3.
Mean values of the indicators EPR, LRR, NSM, SCE, and WLR obtained for each of the five zones, divided into three different temporal scales.
Table 3.
Mean values of the indicators EPR, LRR, NSM, SCE, and WLR obtained for each of the five zones, divided into three different temporal scales.
| 1957-2024 | ||||||
| Nº | Zona | x̄ EPR | x̄ LRR | x̄ NSM | x̄ SCE | x̄ WLR |
| 1 | Arenas - Malvarrosa - Patacona | 0.963 | 0.877 | 58.422 | 76.313 | 0.812 |
| 2 | Port Saplaya | -0.250 | -0.274 | -16.155 | 47.633 | -0.238 |
| 3 | Pobla de Farnals | -0.709 | -0.570 | -43.989 | 68.882 | -0.388 |
| 4 | Puzol | -0.271 | -0.230 | -18.361 | 51.295 | -0.194 |
| 5 | Marjal dels Moros | -0.004 | 0.031 | -2.367 | 33.948 | -0.007 |
| 1997-2024 | ||||||
| Nº | Zona | x̄ EPR | x̄ LRR | x̄ NSM | x̄ SCE | x̄ WLR |
| 1 | Arenas - Malvarrosa - Patacona | -0.396 | -1.468 | -3.670 | 28.398 | -1.468 |
| 2 | Port Saplaya | -0.084 | -0.448 | -0.084 | -0.084 | -0.084 |
| 3 | Pobla de Farnals | -0.939 | -0.134 | -8.509 | 35.490 | -0.134 |
| 4 | Puzol | 0.577 | 0.049 | 5.206 | 23.888 | 0.049 |
| 5 | Marjal dels Moros | -0.506 | -0.522 | -4.549 | 9.211 | -0.522 |
| 2015-2024 | ||||||
| Nº | Zona | x̄ EPR | x̄ LRR | x̄ NSM | x̄ SCE | x̄ WLR |
| 1 | Arenas - Malvarrosa - Patacona | -0.267 | -1.433 | -2.416 | 28.811 | -1.433 |
| 2 | Port Saplaya | -0.087 | -0.450 | -0.783 | 21.781 | -0.450 |
| 3 | Pobla de Farnals | -1.047 | -0.227 | -9.288 | 36.011 | -0.227 |
| 4 | Puzol | 0.605 | 0.060 | 5.550 | 24.496 | 0.060 |
| 5 | Marjal dels Moros | -0.510 | -0.529 | -4.623 | 9.226 | -0.529 |
Disclaimer/Publisher’s Note: The statements, opinions and data contained in all publications are solely those of the individual author(s) and contributor(s) and not of MDPI and/or the editor(s). MDPI and/or the editor(s) disclaim responsibility for any injury to people or property resulting from any ideas, methods, instructions or products referred to in the content. |
© 2025 by the authors. Licensee MDPI, Basel, Switzerland. This article is an open access article distributed under the terms and conditions of the Creative Commons Attribution (CC BY) license (http://creativecommons.org/licenses/by/4.0/).
Copyright: This open access article is published under a Creative Commons CC BY 4.0 license, which permit the free download, distribution, and reuse, provided that the author and preprint are cited in any reuse.


