
Submitted:
18 August 2025
Posted:
19 August 2025
You are already at the latest version
Abstract
This study investigates the comparative performance of foundational models versus traditional deep learning architectures for hyperpolarized gas MRI segmentation under both full data and limited data conditions. Chronic obstructive pulmonary disease (COPD) remains a leading global health concern, and advanced imaging techniques are crucial for its diagnosis and management. Hyperpolarized gas MRI, utilizing helium-3 (³He) and xenon-129 (¹²⁹Xe), offers a non-invasive way to assess lung function. Foundational models, pre-trained on diverse and expansive datasets, theoretically offer advantages in scenarios with limited task-specific data compared to traditional architectures that rely heavily on large training datasets. This study evaluates this hypothesis by comparing foundational models, Segment Anything Model (SAM) and Segment Anything in Medical Images (MedSAM) against traditional deep learning architectures (UNet with VGG19 backbone, Feature Pyramid Network with MIT-B5 backbone, and DeepLabV3 with ResNet152 back-bone) using both full dataset (1640 2D MRI slices from 205 participants) and limited data scenarios (25% of the full dataset). Our experimental design included fine-tuning all models on the complete dataset and subsequently on the reduced dataset to assess performance degradation and resilience to data scarcity. Results demonstrate that while traditional models achieve competitive performance with full data availability, foundational models exhibit superior robustness and maintain performance in limited data scenarios. The fine-tuned MedSAM model showed the least performance degradation when transitioning from full to limited data conditions, achieving superior Dice Similarity Coefficient (DSC) and Hausdorff Distance (HD95) metrics compared to traditional architectures. This work highlights the critical advantage of foundational models in medical imaging applications where data collection is challenging, expensive, or ethically constrained, demonstrating their potential to democratize advanced medical imaging analysis in resource-limited settings.
Keywords:
foundational models
; hyperpolarized gas MRI
; limited data
; medical imaging
; segmentation
1. Introduction
The global burden of chronic respiratory diseases continues to rise. Chronic obstructive pulmonary disease (COPD) is the third leading cause of death worldwide, accounting for 3.23 million deaths in 20191.
Imaging modalities such as chest X-rays, CT scans, MRI, and Nuclear Medicine enable accurate diagnosis of the severity and type of COPD, ensuring appropriate treatment to alleviate symptoms and enhance daily functioning. Advanced imaging techniques can track the progression of COPD and identify complications, allowing healthcare providers to forecast potential outcomes and adjust treatment plans to improve prognosis and quality of life.
Chest CT is considered the current diagnostic tool for assessing structural abnormalities in the lungs, particularly in COPD patients2. It is regarded as the clinical gold standard for pulmonary imaging due to its outstanding spatial and temporal resolution. Chest CT findings correlate strongly with pathological results from post-mortem studies, confirming the presence and extent of emphysema3. However, despite its diagnostic advantages, CT significantly contributes to medical radiation exposure, raising concerns about the risk of radiation-induced cancer4. This is especially worrisome given the increasing frequency of CT scans for longitudinal studies. Therefore, cautious use of CT imaging and consideration of alternative imaging methods are important to mitigate these risks.
Magnetic Resonance Imaging (MRI) is highly valued for its ability to perform repeated studies without exposing patients to ionizing radiation. MRI provides both structural and functional information, enabling comprehensive lung assessments, including airway structures, lung parenchyma, and blood flow5. Although traditionally underutilized for lung imaging due to challenges like low proton density and motion artifacts, recent advancements in MRI technology, such as faster imaging techniques and lung-specific contrast agents, have greatly enhanced its effectiveness and reliability.
Hyperpolarized gas MRI, using helium-3 (³He) and xenon-129 (¹²⁹Xe), has revolutionized pulmonary imaging over the past three decades6. This technique offers detailed structural and functional insights into the lungs. Pioneered by Albert and colleagues in 1994, the polarization of ¹²⁹Xe (³He) gas can be significantly increased through spin-exchange with optically pumped rubidium vapor, amplifying the MRI signal by approximately 100,000 times7. Hyperpolarized ³He and ¹²⁹Xe MRI provide unparalleled advantages, including detailed visualization of airway structures, lung ventilation, and gas exchange processes8. Extensive research has confirmed the safety and tolerability of these gases, supporting their use in diverse research and clinical settings to provide critical information on lung function and disease.
Hyperpolarized gas MRI enables the quantification of specific biomarkers, offering detailed insights into lung health. One key biomarker, the Ventilation Defect Percent (VDP), measures the percentage of lung volume that is not effectively ventilated. This is visualized by areas lacking inhaled hyperpolarized gas on MRI, indicating poor ventilation. VDP is essential for assessing functional impairment in diseases like COPD9.
Earlier studies for hyperpolarized gas MRI ventilation segmentation employed classical image processing and machine learning approaches10, such as hierarchical K-means 11 and spatial fuzzy c-means (SFCM) clustering12, however these algorithms are time consuming and observer dependent. For example, segmentation of a 16 slice MRI would take around 45 minutes which may not be applicable in a clinical setting.
Deep learning (DL) has shown significant promise in image segmentation13. The application of DL in medical imaging has advanced, providing accurate and efficient analysis of medical images. DL-based segmentation offers precise quantitative analysis and standardized indicators for clinical trials. For instance, the U-Net architecture14, combined with the pre-trained DenseNet121, has been used for segmenting lung CT scans to detect COVID-19 abnormalities15. Additionally, Sulaiman et al. detailed a CNN architecture for segmenting lung diseases using chest X-ray images in Diagnostics16.
DL applications in hyperpolarized gas MRI segmentation have also been explored. Studies include a large-scale investigation of ventilated lung segmentation using multi-nuclear hyperpolarized gas MRI17, a dual-channel DL approach for lung cavity estimation from hyperpolarized gas and proton MRI18, a 3D CNN-based method for ventilated lung segmentation19, and a U-Net++ based Quantification of Ventilation Defects for ventilated lung segmentation20. These studies primarily used CNN methods for segmentation tasks.
Despite the previous research on DL-based segmentation of hyperpolarized gas MRI, a recent review identified a notable gap in the use of vision transformers and foundational models for this task21. A recent study22 compared CNN- and Vision Transformer based models for lung segmentation in proton and hyperpolarized gas MRI under varying noise levels, finding that transformer-based architectures such as SegFormer outperform CNNs in high-noise settings, underscoring their potential for robust clinical deployment. Building on this, the limited adoption of foundation models for hyperpolarized gas MRI presents a clear opportunity to explore how such approaches could enhance the accuracy and efficiency of hyperpolarized gas MRI segmentation, particularly when working with a limited dataset.
Considering this gap, our research aims to utilize Vision Transformers (ViTs) based foundational models named Segment Anything Model (SAM) 23and Segment Anything in Medical Images (MedSAM)24, for the task of hyperpolarized gas MRI segmentation. Foundational models are pre-trained on large and diverse dataset and they provide a robust starting point. These models can be fine-tuned for specific tasks, enhancing performance and reducing the need for extensive, task-specific datasets. By leveraging these models and fine-tuning them on a limited dataset, we aim to showcase the adaptability of foundational models for task-specific applications, which could be highly beneficial for various medical use cases, particularly in improving the accuracy and efficiency of lung segmentation. Additionally, ViT based models offer several benefits over traditional CNNs, including superior handling of long-range dependencies and spatial relationships within images25, which are crucial for accurately segmenting complex lung structures.
A critical challenge in medical imaging, particularly in specialized modalities like hyperpolarized gas MRI, is the scarcity of annotated data. Medical image acquisition is expensive, time-consuming, and often requires specialized equipment and expertise. Patient recruitment can be challenging due to ethical considerations, rare disease prevalence, and geographical limitations. Expert annotation is labor-intensive and requires specialized knowledge, creating bottlenecks in dataset creation. These constraints are particularly pronounced in hyperpolarized gas MRI, where the technology is available in limited centers worldwide and requires specialized expertise for both acquisition and interpretation.
Traditional deep learning models typically require large datasets to achieve optimal performance, making them vulnerable to overfitting and poor generalization when trained on limited data. This limitation poses significant challenges for clinical translation and widespread adoption of automated segmentation tools in specialized imaging modalities.
Foundational models are trained on vast, diverse datasets and learn generalizable representations that can be fine-tuned for specific applications. This approach theoretically offers several advantages in medical imaging scenarios: reduced data requirements for achieving good performance, improved generalization across different imaging conditions and populations, faster convergence during fine-tuning, and potential for zero-shot or few-shot learning capabilities.
This study addresses the critical question of whether foundational models truly offer advantages over traditional deep learning architectures when working with limited medical imaging data. Our research aims to provide a comprehensive comparative analysis between foundational models (SAM and MedSAM) and established traditional architectures (UNet with VGG19, FPN with MIT-B5, and DeepLabV3 with ResNet152) for both proton MRI and hyperpolarized gas MRI segmentation.
Our specific contributions include: (1) A systematic comparison of foundational versus traditional models using identical datasets and evaluation metrics, (2) Assessment of model performance degradation when transitioning from full data to limited data scenarios (25% of original dataset).
This research provides crucial insights for the medical imaging community regarding the practical benefits of foundational models in real-world clinical scenarios where data availability is inherently limited, ultimately informing decisions about model selection and resource allocation for medical AI development.
2. Materials and Methods
In the following sections, we first discuss the acquisition and dataset of Hyperpolarized Gas MRI. Next, we detail the architecture and fine-tuning of SAM and MedSAM. All the experiments were implemented in PyTorch and executed on two parallel NVIDIA GA102, GeForce RTX 3090 GPUs.
2.1. Hyperpolarized Gas MRI Acquisition and Dataset
The imaging dataset utilized in this study was retrospectively compiled from multiple research and clinical investigations involving patients referred for hyperpolarized gas MRI scans. This study was performed following institutional ethics approval, with informed written consent obtained from all participants. Each of the scans in the dataset was accompanied by a semi-automated expert segmentation, serving as the ground truth.
We collected data from 205 participants, which included 22 healthy individuals, 26 with COPD, 90 with asthma, and 67 with Long-COVID-19. This yielded 1640 2D slices, originally sized 128x128, segmented using MATLAB R2021b and the hierarchical K-means clustering method. Proton and hyperpolarized slices were registered using a landmark-based image affine registration approach. The dataset was balanced to ensure an even distribution across the participant groups, with an 80% training, 10% validation, and 10% testing split. To avoid data leakage, no specific patient data were included in both the training and testing sets. To ensure representativeness and fairness, we also maintained an even distribution of the different conditions across the training, validation, and test sets.
Preprocessing was conducted using the MONAI library26 to maintain consistency with the original SAM model.. The intensity values of the images were normalized to a range of 0 to 255, while label intensities were scaled between 0 and 1, aligning with the expected input ranges for subsequent processing steps. Spatial padding was applied to standardize dimensions across all images and labels. Further preprocessing involved converting grayscale images to RGB format by replicating grayscale values across three channels. Ground truth masks were adjusted to have positive values for labels and zero for the background. Finally, bounding boxes to the full size of the image for each mask were determined to serve as prompts for the SAM and MedSAM processor.
2.2. Fine Tunning
Foundation models are expansive AI systems trained on vast datasets using substantial computational resources, capable of generating diverse outputs from text to images. Prominent examples include Open AI’s GPT model27, DALLE-328, Segment Anything23, and BERT29.
The SAM, developed by Meta AI, is a foundational model for image segmentation. It features a revolutionary architecture consisting of three main components: the image encoder, prompt encoder, and mask decoder. The image encoder, using a Masked Autoencoder (MAE) with a Vision Transformer (ViT-H/16), creates an embedding by extracting essential features from the input image. This embedding is a 16x downscaled version of the original image, optimizing for efficient processing while retaining critical features.
Various types of prompts, including points, boxes, masks, and text, can be used with SAM. For our task, we employed box prompts. Each box is represented by an embedding pair, combining the positional encoding of its top-left and bottom-right corners with learned embeddings representing these positions. The lightweight mask decoder, a modified Transformer decoder block followed by a dynamic mask prediction head, predicts segmentation masks by integrating information from the image and prompt embeddings.
Despite their capabilities, foundational models like SAM have limited applicability in medical image segmentation due to the significant differences between natural and medical images. To address these challenges, MedSAM was developed as an extension of SAM, specifically tailored for the medical imaging domain. MedSAM is trained on a large-scale dataset comprising over one million medical image-mask pairs.
As for the traditional deep learning models, The U-Net [14] architecture with VGG19 30 encoder represents a well-established approach for medical image segmentation. VGG19 provides a robust feature extraction backbone with its deep convolutional layers, while the U-Net decoder enables precise spatial localization through skip connections. This combination has proven effective across numerous medical imaging applications.
FPN 31 architecture excels at multi-scale feature extraction, crucial for segmenting structures of varying sizes in medical images. The MIT-B5 32 backbone, part of the Mix Transformer family, incorporates attention mechanisms and hierarchical feature learning, providing strong representational capabilities for complex segmentation tasks.
DeepLabV3 33 employs atrous-convolution and pyramid pooling to capture multi-scale contextual information. The ResNet152 34 backbone provides deep feature extraction capabilities with residual connections, enabling training of very deep networks while maintaining gradient flow and avoiding degradation problems.
During fine-tuning, images and their corresponding bounding box prompts were processed and fed into the model. We employed the Adam optimizer 35 with learning rates carefully tuned for each model based on preliminary experiments. A combined Dice and Cross-Entropy loss function was used to optimize both overlap and boundary accuracy.
We incorporated early stopping based on validation loss to prevent overfitting, ensuring the model's robustness and generalization capabilities. Validation was performed on a separate dataset, and the best performing model weights were saved.
2.3. Full and Limited Data Experiments
All models were first trained on the complete training dataset (80% training) to establish baseline performance levels. Each model was trained until convergence, with early stopping based on validation loss to prevent overfitting.
Subsequently, all models were trained on the reduced dataset containing only 25% of the original training data (328 slices). This reduction simulates real-world scenarios where data collection is limited due to cost, time, ethical, or technical constraints. The same validation and testing sets were maintained to enable direct performance comparison with full data results.
A graph representing the experiments is depicted in Figure 1.
2.4. Data Evaluation Metrics and Statistical Analysis
Model performance was assessed using multiple complementary metrics to provide comprehensive evaluation of segmentation quality. Primary metrics included Dice Similarity Coefficient (DSC) for overlap assessment, Hausdorff Distance at 95th percentile (HD95) for boundary accuracy, Average Hausdorff Distance (Avg HD) for overall geometric agreement, and XOR Error for pixel-wise disagreement quantification.
Statistical analysis employed in IBM SPSS software with non-parametric tests due to the non-normal distribution of metrics as determined by Shapiro-Wilk tests. Friedman tests assessed differences between models, with post-hoc pairwise comparisons using Bonferroni correction for multiple comparison adjustment. Wilcoxon signed-rank tests evaluated performance differences between full and limited data conditions for each model.
3. Results
- A.
- Proton MRI
- 1)
- Full dataset experiment
Performance evaluation on the complete proton MRI dataset revealed the following quantitative results across all model architectures. MedSAM demonstrated a Dice Similarity Coefficient of 0.92 with a range from 0.73 to 0.96, while the Average Hausdorff Distance measured 1.18 with values ranging between 0.55 and 4.15. The 95th percentile Hausdorff Distance was recorded at 3.27, spanning from 1.41 to 10.0, and the XOR error reached 0.14 with a range of 0.05 to 0.55.
SAM exhibited a DSC of 0.92, ranging from 0.74 to 0.96, with an Average HD of 1.20 extending from 0.60 to 4.18. The HD95 measurement was 3.31, varying between 1.41 and 10.63, while the XOR error was 0.14, ranging from 0.06 to 0.53.
Among the traditional deep learning architectures, FPN-MIT-B5 achieved a DSC of 0.92, with values spanning from 0.77 to 0.96. The Average HD was measured at 1.24, ranging from 0.56 to 3.81, while HD95 reached 3.38 with a span of 1.41 to 9.62. The XOR error was recorded at 0.14, varying between 0.06 and 0.46.
UNet-VGG19 demonstrated a DSC of 0.92, ranging from 0.72 to 0.97, accompanied by an Average HD of 1.31 that extended from 0.47 to 4.3. The HD95 measurement was 3.59, spanning from 1.24 to 10.77, and the XOR error reached 0.16 with values between 0.05 and 0.57.
DeepLabV3-ResNet152 recorded a DSC of 0.92, ranging from 0.73 to 0.96, with an Average HD of 1.27 that varied from 0.64 to 4.31. The HD95 was measured at 3.64, extending from 2.0 to 10.15, while the XOR error was 0.16, ranging from 0.07 to 0.55.
A summary of the Metrics is provided at Table 1 for Proton MRI full dataset experiments.
Statistical analysis using Friedman tests with Bonferroni-corrected post-hoc comparisons yielded specific p-values for pairwise model comparisons. For the Dice Similarity Coefficient metric, the comparison between DeepLabV3-ResNet152 and UNet-VGG19 resulted in a p-value of 0.003, while DeepLabV3-ResNet152 compared to FPN-MIT-B5 produced a p-value less than 0.001. The comparison of DeepLabV3-ResNet152 with SAM yielded a p-value less than 0.001, as did the comparison with MedSAM. UNet-VGG19 versus FPN-MIT-B5 resulted in a p-value of 1.000, while UNet-VGG19 compared to SAM produced a p-value of 0.173 and to MedSAM yielded 0.124. The comparison between FPN-MIT-B5 and SAM resulted in a p-value of 1.000, as did the comparison between FPN-MIT-B5 and MedSAM. The SAM versus MedSAM comparison produced a p-value of 1.000.
For Average Hausdorff Distance comparisons, MedSAM versus SAM yielded a p-value of 1.000, while MedSAM compared to FPN-MIT-B5 resulted in 0.518. MedSAM versus UNet-VGG19 produced a p-value of 0.001, and MedSAM compared to DeepLabV3-ResNet152 yielded a p-value less than 0.001. SAM versus FPN-MIT-B5 resulted in a p-value of 1.000, while SAM compared to UNet-VGG19 produced 0.026 and to DeepLabV3-ResNet152 yielded a p-value less than 0.001. FPN-MIT-B5 versus UNet-VGG19 resulted in a p-value of 0.430, while FPN-MIT-B5 compared to DeepLabV3-ResNet152 produced 0.010. UNet-VGG19 versus DeepLabV3-ResNet152 yielded a p-value of 1.000.
The 95th percentile Hausdorff Distance comparisons showed that MedSAM versus SAM produced a p-value of 1.000, while MedSAM compared to FPN-MIT-B5 resulted in 0.808. MedSAM versus UNet-VGG19 yielded a p-value of 0.002, and MedSAM compared to DeepLabV3-ResNet152 produced a p-value less than 0.001. SAM versus FPN-MIT-B5 resulted in a p-value of 1.000, while SAM compared to UNet-VGG19 yielded 0.027 and to DeepLabV3-ResNet152 produced a p-value less than 0.001. FPN-MIT-B5 versus UNet-VGG19 resulted in a p-value of 0.543, while FPN-MIT-B5 compared to DeepLabV3-ResNet152 yielded 0.002. UNet-VGG19 versus DeepLabV3-ResNet152 produced a p-value of 0.650.
For XOR error comparisons, MedSAM versus SAM resulted in a p-value of 1.000, as did MedSAM compared to FPN-MIT-B5. MedSAM versus UNet-VGG19 yielded a p-value of 0.010, while MedSAM compared to DeepLabV3-ResNet152 produced a p-value less than 0.001. SAM versus FPN-MIT-B5 resulted in a p-value of 1.000, while SAM compared to UNet-VGG19 yielded 0.045 and to DeepLabV3-ResNet152 produced a p-value less than 0.001. FPN-MIT-B5 versus UNet-VGG19 resulted in a p-value of 0.843, while FPN-MIT-B5 compared to DeepLabV3-ResNet152 yielded a p-value less than 0.001. UNet-VGG19 versus DeepLabV3-ResNet152 produced a p-value of 0.027.
Figure 1s-4s in supplementary materials illustrates the distribution of segmentation performance across all models in a box plot.
- 2)
- Limited dataset experiment
When trained on the reduced dataset containing 25% of the original training data, all model architectures demonstrated altered performance patterns. MedSAM achieved a Dice Similarity Coefficient of 0.92, with values ranging from 0.81 to 0.97, while the Average Hausdorff Distance was measured at 1.33, extending from 0.54 to 3.50. The 95th percentile Hausdorff Distance reached 3.68, spanning from 1.41 to 10.04, and the XOR error was recorded at 0.15 with a range of 0.04 to 0.42.
SAM exhibited a DSC of 0.92, ranging from 0.80 to 0.97, accompanied by an Average HD of 1.40 that varied between 0.55 and 4.11. The HD95 measurement was 3.94, extending from 2.0 to 13.89, while the XOR error reached 0.16, spanning from 0.05 to 0.44.
Among the traditional architectures, UNet-VGG19 demonstrated a DSC of 0.79, with values ranging from 0.56 to 0.89. The Average HD was measured at 3.32, extending from 1.2 to 7.45, while HD95 reached 9.23 with a span of 3.60 to 20.44. The XOR error was recorded at 0.34, varying between 0.19 and 0.60.
DeepLabV3-ResNet152 achieved a DSC of 0.71, ranging from 0.16 to 0.83, with an Average HD of 6.68 that extended from 3.64 to 13.11. The HD95 measurement was 17.24, spanning from 8.54 to 45.75, and the XOR error reached 0.74 with values between 0.39 and 1.18.
FPN-MIT-B5 recorded a DSC of 0.53, ranging from 0.30 to 0.75, accompanied by an Average HD of 5.28 that varied from 2.26 to 9.06. The HD95 was measured at 18.55, extending from 8.67 to 33.34, while the XOR error was 0.62, ranging from 0.40 to 0.81.

Table 2.
Performance metrics for all model architectures on proton MRI limited dataset experiment (25% of training data). Values are presented as mean (range) for Dice Similarity Coefficient (DSC), Average Hausdorff Distance (Avg_HD), 95th percentile Hausdorff Distance (HD95), and XOR error.
Table 2.
Performance metrics for all model architectures on proton MRI limited dataset experiment (25% of training data). Values are presented as mean (range) for Dice Similarity Coefficient (DSC), Average Hausdorff Distance (Avg_HD), 95th percentile Hausdorff Distance (HD95), and XOR error.
| Model | DSC | Avg_HD | HD95 | XOR |
|---|---|---|---|---|
| DeepLabV3_resnet152 | 0.71 (0.16–0.83) | 6.68 (3.64–13.11) | 17.24 (8.54–45.75) | 0.74(0.39–1.18) |
| FPN_mit_b5 | 0.53 (0.30–0.75) | 5.28 (2.26–9.06) | 18.55 (8.67–33.34) | 0.62(0.40–0.81) |
| MEDSAM | 0.92 (0.81–0.97) | 1.33 (0.54–3.50) | 3.68 (1.41–10.04) | 0.15 (0.04–0.42) |
| SAM | 0.92 (0.80–0.97) | 1.40 (0.55–4.11) | 3.94 (2.0–13.89) | 0.16 (0.05–0.44) |
| Unet_vgg19 | 0.79 (0.56–0.89) | 3.32 (1.2–7.45) | 9.23 (3.60–20.44) | 0.34(0.19–0.60) |
Statistical analysis using Friedman tests with Bonferroni correction revealed specific p-values for pairwise comparisons under limited data conditions. For Dice Similarity Coefficient comparisons, FPN-MIT-B5 versus DeepLabV3-ResNet152 resulted in a p-value of 0.008, while FPN-MIT-B5 compared to UNet-VGG19 produced a p-value less than 0.001. FPN-MIT-B5 versus SAM yielded a p-value less than 0.001, as did the comparison with MedSAM. DeepLabV3-ResNet152 compared to UNet-VGG19 resulted in a p-value of 0.168, while DeepLabV3-ResNet152 versus SAM and MedSAM both produced p-values less than 0.001. UNet-VGG19 compared to both SAM and MedSAM yielded p-values less than 0.001, while SAM versus MedSAM resulted in a p-value of 1.000.
Average Hausdorff Distance comparisons showed that SAM versus MedSAM produced a p-value of 1.000, while both foundational models compared to UNet-VGG19, FPN-MIT-B5, and DeepLabV3-ResNet152 all yielded p-values less than 0.001. Among traditional models, UNet-VGG19 versus FPN-MIT-B5 resulted in a p-value of 0.002, UNet-VGG19 compared to DeepLabV3-ResNet152 produced a p-value less than 0.001, while FPN-MIT-B5 versus DeepLabV3-ResNet152 yielded a p-value of 1.000.
For 95th percentile Hausdorff Distance measurements, MedSAM versus SAM resulted in a p-value of 1.000, while both foundational models compared to all traditional architectures produced p-values less than 0.001. Among traditional models, all pairwise comparisons yielded p-values less than 0.001, except for DeepLabV3-ResNet152 versus FPN-MIT-B5 which resulted in a p-value of 1.000.
XOR error comparisons revealed that MedSAM versus SAM produced a p-value of 1.000, while both foundational models compared to all traditional architectures yielded p-values less than 0.001. Among traditional models, UNet-VGG19 versus both FPN-MIT-B5 and DeepLabV3-ResNet152 produced p-values less than 0.001, while FPN-MIT-B5 versus DeepLabV3-ResNet152 resulted in a p-value of 1.000.
- B.
- Hyperpolarized Gas MRI
- 1)
- Full dataset experiment
Performance evaluation on the complete hyperpolarized gas MRI dataset yielded the following quantitative measurements. SAM demonstrated a Dice Similarity Coefficient of 0.92, with values ranging from 0.77 to 0.97, while the Average Hausdorff Distance measured 1.17, extending from 0.47 to 3.40. The 95th percentile Hausdorff Distance was recorded at 3.60, spanning from 1.0 to 8.0, and the XOR error reached 0.16 with a range of 0.05 to 0.56.
MedSAM exhibited a DSC of 0.92, ranging from 0.77 to 0.96, accompanied by an Average HD of 1.15 that varied between 0.52 and 3.57. The HD95 measurement was 3.75, extending from 1.0 to 10.0, while the XOR error was 0.16, ranging from 0.06 to 0.56.
Among the traditional deep learning architectures, FPN-MIT-B5 achieved a DSC of 0.91, with values spanning from 0.76 to 0.97. The Average HD was measured at 1.18, ranging from 0.45 to 3.21, while HD95 reached 3.63 with a span of 1.41 to 8.54. The XOR error was recorded at 0.17, varying between 0.05 and 0.61.
UNet-VGG19 demonstrated a DSC of 0.91, ranging from 0.74 to 0.97, with an Average HD of 1.24 that extended from 0.42 to 4.08. The HD95 measurement was 3.81, spanning from 1.0 to 11.40, and the XOR error reached 0.17 with values between 0.05 and 0.68.
DeepLabV3-ResNet152 recorded a DSC of 0.91, ranging from 0.74 to 0.97, accompanied by an Average HD of 1.29 that varied from 0.61 to 3.56. The HD95 was measured at 4.13, extending from 1.41 to 10.0, while the XOR error was 0.19, ranging from 0.06 to 0.70.
Table 3 summarizes the quantitative results demonstrating the specialized challenges posed by hyperpolarized gas MRI segmentation in full dataset experiments.
Statistical analysis using Friedman tests with Bonferroni correction yielded the following p-values for pairwise model comparisons. For Dice Similarity Coefficient measurements, DeepLabV3-ResNet152 compared to FPN-MIT-B5 resulted in a p-value of 0.001, while DeepLabV3-ResNet152 versus UNet-VGG19, MedSAM, and SAM all produced p-values less than 0.001. FPN-MIT-B5 compared to UNet-VGG19 yielded a p-value of 1.000, while FPN-MIT-B5 versus MedSAM resulted in 0.701 and versus SAM produced 0.252. UNet-VGG19 compared to both MedSAM and SAM yielded p-values of 1.000, while MedSAM versus SAM resulted in a p-value of 1.000.
Average Hausdorff Distance comparisons revealed that MedSAM and SAM each compared to DeepLabV3-ResNet152 produced p-values of 0.001. MedSAM versus FPN-MIT-B5 and SAM versus FPN-MIT-B5 both resulted in p-values of 1.000, while MedSAM versus SAM yielded a p-value of 1.000. MedSAM and SAM each compared to UNet-VGG19 produced p-values of 0.497, while FPN-MIT-B5 versus UNet-VGG19 resulted in a p-value of 1.000. FPN-MIT-B5 compared to DeepLabV3-ResNet152 yielded a p-value of 0.041, while UNet-VGG19 versus DeepLabV3-ResNet152 produced 0.442.
For 95th percentile Hausdorff Distance measurements, SAM compared to FPN-MIT-B5 and MedSAM both resulted in p-values of 1.000. SAM versus UNet-VGG19 yielded a p-value of 0.826, while SAM compared to DeepLabV3-ResNet152 produced 0.009. FPN-MIT-B5 versus MedSAM and UNet-VGG19 both resulted in p-values of 1.000, while FPN-MIT-B5 compared to DeepLabV3-ResNet152 yielded 0.052. MedSAM versus UNet-VGG19 produced a p-value of 1.000, while MedSAM compared to DeepLabV3-ResNet152 resulted in 0.180. UNet-VGG19 versus DeepLabV3-ResNet152 yielded a p-value of 1.000.
XOR error comparisons showed that SAM versus MedSAM resulted in a p-value of 1.000, while SAM compared to UNet-VGG19 yielded 0.968 and to FPN-MIT-B5 produced 0.119. SAM versus DeepLabV3-ResNet152 resulted in a p-value less than 0.001. MedSAM compared to UNet-VGG19 and FPN-MIT-B5 both yielded p-values of 1.000, while MedSAM versus DeepLabV3-ResNet152 produced a p-value less than 0.001. UNet-VGG19 compared to FPN-MIT-B5 resulted in a p-value of 1.000, while UNet-VGG19 versus DeepLabV3-ResNet152 yielded a p-value less than 0.001. FPN-MIT-B5 compared to DeepLabV3-ResNet152 produced a p-value of 0.001.
Figure 9s-12s in supplementary materials illustrates the dramatic difference in performance distributions in full training data experiments for hyperpolarized gas MRI.
- 2)
- Limited dataset experiment
When evaluated on the reduced hyperpolarized gas MRI dataset containing 25% of the original training data, the model architectures exhibited the following performance characteristics. MedSAM achieved a Dice Similarity Coefficient of 0.88, with values ranging from 0.71 to 0.95, while the Average Hausdorff Distance measured 1.62, extending from 0.68 to 4.00. The 95th percentile Hausdorff Distance was recorded at 5.48, spanning from 1.41 to 12.92, and the XOR error reached 0.23 with a range of 0.08 to 0.52.
SAM demonstrated a DSC of 0.88, ranging from 0.62 to 0.94, accompanied by an Average HD of 1.78 that varied between 0.80 and 4.15. The HD95 measurement was 6.42, extending from 2.23 to 17.72, while the XOR error was 0.24, spanning from 0.10 to 0.54.
Among the traditional architectures, UNet-VGG19 achieved a DSC of 0.76, with values ranging from 0.19 to 0.93. The Average HD was measured at 2.64, extending from 1.00 to 7.06, while HD95 reached 11.39 with a span of 2.23 to 57.72. The XOR error was recorded at 0.38, varying between 0.13 and 1.02.
DeepLabV3-ResNet152 demonstrated a DSC of 0.74, ranging from 0.07 to 0.87, with an Average HD of 2.97 that extended from 1.71 to 4.58. The HD95 measurement was 12.97, spanning from 7.0 to 68.80, and the XOR error reached 0.46 with values between 0.22 and 0.98.
FPN-MIT-B5 recorded a DSC of 0.65, ranging from 0.05 to 0.89, accompanied by an Average HD of 3.53 that varied from 1.62 to 8.14. The HD95 was measured at 15.35, extending from 4.0 to 76.41, while the XOR error was 0.51, ranging from 0.21 to 0.97.
Table 4 summarizes the quantitative results demonstrating the hyperpolarized gas MRI segmentation in limited dataset experiments.
Statistical analysis using Friedman tests with Bonferroni correction revealed the following p-values for pairwise model comparisons under limited data conditions. For Dice Similarity Coefficient measurements, FPN-MIT-B5 compared to DeepLabV3-ResNet152 resulted in a p-value of 0.649, while FPN-MIT-B5 versus UNet-VGG19 produced a p-value of 0.001. FPN-MIT-B5 compared to SAM and MedSAM both yielded p-values less than 0.001. DeepLabV3-ResNet152 versus UNet-VGG19 resulted in a p-value of 0.409, while DeepLabV3-ResNet152 compared to both SAM and MedSAM produced p-values less than 0.001. UNet-VGG19 versus both SAM and MedSAM yielded p-values less than 0.001, while SAM compared to MedSAM resulted in a p-value of 1.000.
Average Hausdorff Distance comparisons showed that MedSAM versus SAM produced a p-value of 1.000, while MedSAM compared to FPN-MIT-B5, UNet-VGG19, and DeepLabV3-ResNet152 all resulted in p-values less than 0.001. SAM versus FPN-MIT-B5 yielded a p-value of 0.016, while SAM compared to UNet-VGG19 and DeepLabV3-ResNet152 both produced p-values less than 0.001. Among traditional models, FPN-MIT-B5 versus UNet-VGG19 resulted in a p-value of 1.000, FPN-MIT-B5 compared to DeepLabV3-ResNet152 yielded 0.046, while UNet-VGG19 versus DeepLabV3-ResNet152 produced 0.993.
For 95th percentile Hausdorff Distance measurements, MedSAM versus SAM resulted in a p-value of 0.062, while MedSAM compared to UNet-VGG19, FPN-MIT-B5, and DeepLabV3-ResNet152 all produced p-values less than 0.001. SAM versus UNet-VGG19 yielded a p-value of 0.518, SAM compared to FPN-MIT-B5 resulted in 0.192, while SAM versus DeepLabV3-ResNet152 produced a p-value less than 0.001. Among traditional models, UNet-VGG19 versus FPN-MIT-B5 resulted in a p-value of 1.000, UNet-VGG19 compared to DeepLabV3-ResNet152 yielded 0.092, while FPN-MIT-B5 versus DeepLabV3-ResNet152 produced 0.272.
XOR error comparisons revealed that MedSAM versus SAM resulted in a p-value of 1.000, while MedSAM compared to UNet-VGG19, FPN-MIT-B5, and DeepLabV3-ResNet152 all yielded p-values less than 0.001. SAM versus UNet-VGG19 produced a p-value of 0.001, while SAM compared to FPN-MIT-B5 and DeepLabV3-ResNet152 both resulted in p-values less than 0.001. Among traditional models, UNet-VGG19 versus FPN-MIT-B5 yielded a p-value of 1.000, UNet-VGG19 compared to DeepLabV3-ResNet152 produced 0.122, while FPN-MIT-B5 versus DeepLabV3-ResNet152 resulted in 0.147.
Figure 13s-16s in supplementary materials illustrates the dramatic difference in performance distributions in full training data experiments for hyperpolarized gas MRI.
4. Discussion
This study provides comprehensive evidence that foundational models offer significant practical advantages over traditional deep learning architectures in medical imaging, particularly when data availability is constrained—a common scenario in clinical practice. Our findings reveal nuanced patterns that have important implications for the deployment of AI systems in medical imaging workflows. Representative qualitative comparisons illustrating these performance differences across model architectures are provided in the supplementary material (Figures 17s and 18s).
- A.
- Performance Analysis in Full Dataset Conditions
- 1)
- Proton MRI Full Dataset Performance
In proton MRI with full dataset availability, foundational models demonstrated clear superiority across multiple evaluation metrics. Both MedSAM and SAM achieved identical DSC values of 0.92, with MedSAM showing slightly superior boundary accuracy (HD95: 3.27 vs 3.31) and geometric precision (Average HD: 1.18 vs 1.20). Statistical analysis revealed that both foundational models significantly outperformed DeepLabV3-ResNet152 across all metrics (p<0.001 for DSC, Average HD, HD95, and XOR error), indicating consistent advantages in overlap accuracy, spatial precision, and pixel-wise agreement.
Among traditional architectures, FPN-MIT-B5 emerged as the most competitive, achieving performance levels comparable to foundational models (DSC: 0.92, no significant difference vs SAM and MedSAM, p=1.000). However, UNet-VGG19 and DeepLabV3-ResNet152 showed varying degrees of inferiority. The statistical analysis revealed that MedSAM significantly outperformed UNet-VGG19 in Average HD (p=0.001) and HD95 (p=0.002), while both foundational models demonstrated superior pixel-wise accuracy compared to DeepLabV3-ResNet152 and UNet-VGG19.
These results align with expectations based on the extensive pre-training of foundational models on diverse medical and natural imaging datasets, providing them with robust feature representations that transfer effectively to medical segmentation tasks.
- 2)
- Hyperpolarized Gas MRI Full Dataset Performance
The hyperpolarized gas MRI full dataset results revealed a markedly different pattern, with substantially smaller performance gaps between foundational and traditional models. All architectures achieved remarkably similar DSC values (0.91-0.92), suggesting that the specialized characteristics of hyperpolarized gas imaging initially neutralize the typical advantages of foundational models.
Statistical analysis confirmed this convergence, with no significant differences in DSC between most model pairs. Notably, SAM and MedSAM showed no significant differences compared to FPN-MIT-B5, UNet-VGG19, and each other across DSC metrics. Only DeepLabV3-ResNet152 showed consistently inferior performance, with significant differences compared to all other models in DSC (p≤0.001).
The convergent performance in hyperpolarized gas MRI likely results from the unique imaging characteristics inherent to this modality: low signal-to-noise ratios, specialized contrast mechanisms, and distinct anatomical representations that differ substantially from conventional imaging. These factors may require domain-specific adaptations that temporarily level the playing field between foundational and traditional approaches.
- B.
- Critical Performance Divergence Under Data Scarcity
- 1)
- Proton MRI Limited Dataset Analysis
The transition to limited data scenarios revealed the most clinically significant finding of this study. In proton MRI with only 25% of training data, foundational models demonstrated remarkable resilience while traditional architectures suffered catastrophic performance collapse.
MedSAM and SAM maintained near-optimal performance with minimal degradation (DSC remained at 0.92 for both models), showing no significant differences between themselves (p=1.000) and maintaining excellent boundary accuracy (HD95: 3.68 and 3.94 respectively). This resilience represents a critical clinical advantage, as these models retained their full-data performance levels even with severely limited training examples.
In stark contrast, traditional models experienced severe performance deterioration. FPN-MIT-B5 showed the most dramatic collapse, with DSC dropping from 0.92 to 0.53—a decrease of 0.39 points—accompanied by substantial increases in HD95 (from 3.38 to 18.55) and Average HD (from 1.24 to 5.28). DeepLabV3-ResNet152 also suffered significant decline (DSC: 0.92 to 0.71), while UNet-VGG19 demonstrated the best resilience among traditional models but still substantially inferior to foundational approaches (DSC: 0.92 to 0.79).
Statistical analysis confirmed that both foundational models significantly outperformed all traditional architectures across all metrics (p<0.001 for all comparisons), while showing no significant differences between themselves. This dramatic divergence illustrates the fundamental advantage of pre-trained representations when training data becomes scarce.
- 2)
- Hyperpolarized Gas MRI Limited Dataset Analysis
Despite the specialized nature of hyperpolarized gas MRI, the limited data scenario revealed similar patterns favoring foundational models, though with attenuated effect sizes compared to proton MRI. MedSAM and SAM maintained strong performance with DSC values of 0.88, representing moderate decreases of 0.04 from full dataset conditions, while preserving superior boundary accuracy (HD95: 5.48 and 6.42 respectively).
Traditional models again showed variable but substantial performance degradation. FPN-MIT-B5 experienced the most severe decline (DSC: 0.91 to 0.65), while UNet-VGG19 demonstrated better resilience among conventional approaches (DSC: 0.91 to 0.76). Statistical analysis confirmed foundational model superiority, with both SAM and MedSAM significantly outperforming all traditional architectures in DSC (p<0.001).
Importantly, while the absolute performance gaps were smaller in hyperpolarized gas MRI compared to proton MRI, the relative advantage of foundational models in limited data scenarios remained pronounced and statistically significant. This suggests that foundational model benefits in medical imaging extend beyond simple domain adaptation to encompass fundamental learning efficiency advantages that persist across imaging modalities.
- C.
- Data Efficiency and Accessibility
The superior data efficiency of foundational models has profound implications for clinical implementation. Traditional deep learning approaches often require extensive, institution-specific datasets and prolonged training periods, creating substantial barriers for smaller clinical centers or specialized applications with limited data availability. Our findings demonstrate that foundational models can maintain high performance with only 25% of the original training data, potentially reducing data collection requirements by 75%.
This efficiency advantage is particularly relevant for hyperpolarized gas MRI, which is currently available at only a limited number of specialized centers worldwide due to equipment complexity and expertise requirements. The ability of foundational models to maintain reliable performance with limited local datasets could significantly democratize access to automated segmentation tools, enabling smaller medical centers to benefit from advanced AI capabilities without extensive local data collection efforts.
- D.
- Reliability and Clinical Confidence
The consistency and reliability of foundational model performance under varying data conditions could enhance clinical confidence in AI-assisted diagnoses. Our results show that foundational models maintained tight, consistent performance distributions with minimal outliers even under data constraints, while traditional models exhibited increased variability and numerous outliers, indicating unstable performance across different cases.
This reliability is crucial for clinical acceptance, as healthcare providers require predictable and consistent AI tool performance across diverse patient populations and imaging conditions. The reduced variability observed with foundational models suggests they may provide more clinically acceptable outcomes with better worst-case performance guarantees.
Resource Allocation and Development Strategy
From a healthcare system perspective, our findings suggest that resources invested in foundational model development and deployment may yield greater returns than traditional approaches, particularly for specialized applications. The ability to achieve strong performance across multiple imaging modalities with limited training data could reduce overall development costs and accelerate clinical translation timelines.
- E.
- Impact of Imaging Characteristics
The differential performance patterns observed between proton MRI and hyperpolarized gas MRI provide valuable insights into the relationship between imaging modality characteristics and model architecture advantages. The convergent performance in hyperpolarized gas MRI full dataset conditions suggests that highly specialized imaging domains may initially require domain-specific adaptations that diminish general-purpose foundational model advantages.
However, the persistent advantage of foundational models under data constraints across both modalities indicates that their benefits transcend simple domain similarity considerations. The pre-learned representations appear to capture fundamental imaging features that facilitate more efficient learning even in specialized domains.
- F.
- Implications for Model Selection
These findings suggest that clinical centers should prioritize foundational model approaches, particularly for applications where data availability is inherently limited. However, the modality-specific performance patterns also highlight the continued importance of domain expertise and specialized model development for highly specialized imaging applications.
The optimal approach may involve combining the data efficiency advantages of foundational models with domain-specific fine-tuning strategies tailored to particular imaging modalities or clinical applications. This hybrid approach could maximize both the general learning efficiency of foundational models and the specialized performance requirements of specific clinical domains.
- G.
- Limitations and Future Directions
Several limitations warrant consideration in interpreting these results. First, our analysis focused on segmentation tasks within specific anatomical regions (lung segmentation). The generalizability of these findings to other anatomical structures, pathological conditions, or segmentation tasks requires further investigation.
Second, the 25% data reduction scenario, while clinically relevant, represents only one point along the data scarcity spectrum. Future studies should explore performance across various data availability levels to better characterize threshold effects and optimal data requirements for different model architectures.
Third, our study did not extensively explore computational efficiency and resource requirements. While foundational models demonstrated superior performance, their larger memory footprints and computational demands may present practical challenges in resource-constrained clinical environments.
The choice of bounding box prompts for foundational models, while clinically practical, may have influenced comparative results. Future research should explore alternative prompting strategies and their impact on relative model performance.
5. Conclusions
This study provides compelling evidence that foundational models offer significant practical advantages over traditional deep learning architectures for medical image segmentation, particularly in data-constrained scenarios that are common in clinical practice. Our comprehensive evaluation across two distinct imaging modalities—proton MRI and hyperpolarized gas MRI—reveals consistent patterns that have important implications for clinical AI deployment.
Our results demonstrate that foundational models (SAM and MedSAM) maintain robust performance when transitioning from full to limited data scenarios, with minimal degradation in segmentation accuracy across both imaging modalities. In contrast, traditional architectures (UNet-VGG19, FPN-MIT-B5, DeepLabV3-ResNet152) suffer substantial performance collapse under data constraints, with some models experiencing DSC decreases exceeding 30%.
Importantly, while specialized imaging characteristics (as observed in hyperpolarized gas MRI) may initially level performance differences between foundational and traditional approaches under full data conditions, foundational models retain their resilience advantages when data becomes scarce. This suggests that the benefits of foundational approaches extend beyond simple domain transfer to encompass fundamental learning efficiency advantages.
These findings have profound implications for the deployment of AI tools in medical imaging workflows. The superior data efficiency of foundational models could significantly lower barriers to implementing automated segmentation in specialized imaging applications, resource-limited settings, and emerging clinical domains where large datasets are difficult to obtain.
For hyperpolarized gas MRI specifically, our results suggest that foundational models could enable more widespread adoption of automated biomarker quantification tools, potentially improving the accessibility and standardization of this important but specialized imaging technique. The consistency and reliability of foundational model performance under varying data conditions could enhance clinical confidence in AI-assisted diagnoses and enable more robust quality assurance protocols.
Our findings suggest that the medical imaging community should consider prioritizing foundational model approaches, particularly for applications where data availability is inherently limited. This paradigm shift could accelerate the development and deployment of AI tools in specialized medical imaging domains and improve the accessibility of advanced image analysis capabilities across diverse clinical settings.
However, the modality-specific performance patterns observed in our study also highlight the continued importance of domain expertise and specialized model development for highly specialized imaging applications. The optimal approach may involve combining the data efficiency advantages of foundational models with domain-specific adaptations tailored to particular imaging modalities or clinical applications.
As medical imaging continues to evolve with new technologies and clinical applications, the need for robust, data-efficient AI tools becomes increasingly critical. Our results provide strong evidence that foundational models offer a promising path forward, particularly for addressing the data scarcity challenges that have historically limited the clinical translation of AI tools in specialized medical imaging domains.
The consistent performance advantages observed across different imaging modalities and data availability scenarios suggest that foundational approaches may become the preferred standard for medical image segmentation tasks. This transition could ultimately lead to more reliable, accessible, and clinically useful AI tools that better serve the diverse needs of modern medical imaging practice.
Building on these findings, our future research will focus on advancing multimodal approaches that integrate language and vision capabilities for enhanced medical image segmentation, leveraging natural language descriptions of anatomical structures and pathological findings to improve segmentation accuracy and clinical interpretability. Additionally, we plan to explore agentic segmentation revision frameworks that can iteratively refine segmentation results through autonomous quality assessment and correction mechanisms, potentially leading to more robust and clinically reliable automated segmentation systems that can adapt and improve their performance in real-time clinical workflows.
Supplementary Materials
The following supporting information can be downloaded at the website of this paper posted on Preprints.org.
Author Contributions
Conceptualization, R.B.; methodology, R.B.; validation, R.B., M.S.F., A.O., and G.P.; formal analysis, R.B.; investigation, R.B., A.O., and M.S.F.; resources, A.O. and G.P.; writing—original draft preparation, R.B.; writing—review and editing, R.B., A.O., M.S.F., and G.P.; supervision, A.O., M.S.F., and G.P. All authors have read and agreed to the published version of the manuscript.
Funding
The authors acknowledge support from the Natural Sciences and Engineering Research Council of Canada (NSERC) Discovery Grant R9245A04
Institutional Review Board Statement
All participants provided written informed consent to an ethics board-approved protocol (The University of Western Ontario Health Sciences Research Ethics Board, approval ID 18130 and 18131) that was compliant with the Health In-surance Portability and Accountability Act (HIPAA, USA); Ethic Committee Name: The University of Western Ontario Health Sciences Research Ethics Board; Study Type Approval Code REB Approval Issued Date COVID 116775 31/Oct/2022; COPD 100974 10/Jun/2022; Asthma 103516 27/Jan/2022; Healthy 100975 10/Jun/2022
Informed Consent Statement
Informed consent was obtained from all subjects involved in the study.
Data Availability Statement
The original contributions presented in the study are included in the article/supplementary material, further inquiries can be directed to the corresponding author.
Acknowledgments
I would like to express my heartfelt gratitude to my supervisor, Ouriadov, for their invaluable guidance, continuous support, and encouragement throughout the course of this work. Their mentorship has played a crucial role in shaping both the direction and quality of this research. I am also grateful to Western University for providing a stimulating academic environment and access to the resources and facilities that made this work possible. The support from the faculty and staff, as well as the collaborative spirit within the research community, greatly contributed to the success of this project.
Conflicts of Interest
The authors declare no conflicts of interest.
References
- Global health estimates: Leading causes of death.
- Davis, S. D. et al. Computed tomography reflects lower airway inflammation and tracks changes in early cystic fibrosis. Am J Respir Crit Care Med 175, 943-950 (2007). [CrossRef]
- Coddington, R., Mera, S. L., Goddard, P. R. & Bradfield, J. W. Pathological evaluation of computed tomography images of lungs. J Clin Pathol 35, 536-540 (1982).
- Brenner, D., Elliston, C., Hall, E. & Berdon, W. Estimated risks of radiation-induced fatal cancer from pediatric CT. AJR Am J Roentgenol 176, 289-296 (2001). [CrossRef]
- Bergin, C. J., Glover, G. M. & Pauly, J. Magnetic resonance imaging of lung parenchyma. J Thorac Imaging 8, 12-17 (1993).
- Kern, A. L. & Vogel-Claussen, J. Hyperpolarized gas MRI in pulmonology. Br J Radiol 91, 20170647 (2018). [CrossRef]
- Albert, M. S. et al. Biological magnetic resonance imaging using laser-polarized 129Xe. Nature 370, 199-201 (1994). [CrossRef]
- Venkatesh, A. K. et al. MRI of the lung gas-space at very low-field using hyperpolarized noble gases. Magnetic Resonance Imaging 21, 773-776 (2003). [CrossRef]
- Parraga, G., Mathew, L., Etemad-Rezai, R., McCormack, D. G. & Santyr, G. E. Hyperpolarized 3He magnetic resonance imaging of ventilation defects in healthy elderly volunteers: initial findings at 3.0 Tesla. Acad Radiol 15, 776-785 (2008). [CrossRef]
- Kirby, M. et al. Hyperpolarized 3He Magnetic Resonance Functional Imaging Semiautomated Segmentation. Acad Radiol 19, 141-152 (2012). [CrossRef]
- Dhanachandra, N., Manglem, K. & Chanu, Y. J. Image Segmentation Using <i>K</i> -means Clustering Algorithm and Subtractive Clustering Algorithm. Procedia Computer Science 54, 764-771 (2015). [CrossRef]
- Hughes, P. J. C. et al. Spatial fuzzy c-means thresholding for semiautomated calculation of percentage lung ventilated volume from hyperpolarized gas and 1H MRI. Journal of Magnetic Resonance Imaging 47, 640-646 (2017). [CrossRef]
- Khan, M. Z., Gajendran, M. K., Lee, Y. & Khan, M. A. Deep Neural Architectures for Medical Image Semantic Segmentation: Review. IEEE Access 9, 83002-83024 (2021). [CrossRef]
- U-Net: Convolutional Networks for Biomedical Image Segmentation. https://doi. [CrossRef]
- Moosavi, A. S. et al. Segmentation and classification of lungs CT-scan for detecting COVID-19 abnormalities by deep learning technique: U-Net model. J Family Med Prim Care 13, 691-698 (2024). [CrossRef]
- Sulaiman, A. et al. A Convolutional Neural Network Architecture for Segmentation of Lung Diseases Using Chest X-ray Images. Diagnostics 13, 1651 (2023). [CrossRef]
- Astley, J. R. et al. Large-scale investigation of deep learning approaches for ventilated lung segmentation using multi-nuclear hyperpolarized gas MRI. Sci Rep 12, 10566 (2022). [CrossRef]
- Astley, J. R. et al. A Dual-Channel Deep Learning Approach for Lung Cavity Estimation From Hyperpolarized Gas and Proton MRI. Journal of Magnetic Resonance Imaging 57, 1878-1890 (2022). [CrossRef]
- Astley, J. R. et al. in Thoracic Image Analysis. (eds Jens Petersen et al.) 24-35 (Springer International Publishing).
- Ranota, T. K., Guo, F., Babaeipour, R., Wu, T. & Fox, M. S. Deep-Learning-Based Automated Quantification of Ventilation Defects on 3D Isotropic Hyperpolarized 129Xe Lung MRI. 7.
- Babaeipour, R., Ouriadov, A. & Fox, M. S. Deep Learning Approaches for Quantifying Ventilation Defects in Hyperpolarized Gas Magnetic Resonance Imaging of the Lung: A Review. Bioengineering 10, 1349 (2023). [CrossRef]
- Babaeipour, R., Fox, M. S., Parraga, G. & Ouriadov, A. Robust Segmentation of Lung Proton and Hyperpolarized Gas MRI with Vision Transformers and CNNs: A Comparative Analysis of Performance Under Artificial Noise. Bioengineering 12 (2025).
- Kirillov, A. et al. in 2023 IEEE/CVF International Conference on Computer Vision (ICCV). 3992-4003.
- Ma, J. et al. Segment anything in medical images. Nature Communications 15, 654 (2024). [CrossRef]
- Han, K. et al. A Survey on Vision Transformer. IEEE Trans. Pattern Anal. Mach. Intell. 45, 87-110 (2023). [CrossRef]
- Cardoso, M. J. et al. (arXiv, 2022).
- OpenAi et al. (arXiv, 2024).
- Betker, J. et al. Improving Image Generation with Better Captions.
- Devlin, J., Chang, M.-W., Lee, K. & Toutanova, K. BERT: Pre-training of Deep Bidirectional Transformers for Language Understanding. arXiv.org (2018).
- Simonyan, K. & Zisserman, A. (arXiv, 2015).
- Tsung-Yi Lin, P. D., Ross Girshick, Kaiming He, Bharath Hariharan, Serge Belongie. Feature Pyramid Networks for Object Detection. (2016). [CrossRef]
- Xie, E. et al. SegFormer: Simple and efficient design for semantic segmentation with transformers. Advances in neural information processing systems 34, 12077-12090 (2021).
- Zheng, S. X. et al. Rethinking Semantic Segmentation from a Sequence-to-Sequence Perspective with Transformers. Proc Cvpr Ieee, 6877-6886 (2021). [CrossRef]
- He, K., Zhang, X., Ren, S. & Sun, J. (arXiv, 2015).
- Diederik P. Kingma, J. B. Adam: A Method for Stochastic Optimization. (2014). [CrossRef]
Figure 1.
Experimental design flowchart illustrating the comparative analysis framework. The complete dataset was divided into 80% training, 10% validation, and 10% testing sets. Experiment 1 utilized the full 80% training data, while Experiment 2 used only 25% of the original training data (equivalent to 20% of the total dataset) to simulate data-constrained scenarios. The same validation and testing sets were maintained across both experiments to enable direct performance comparison between full data and limited data conditions.
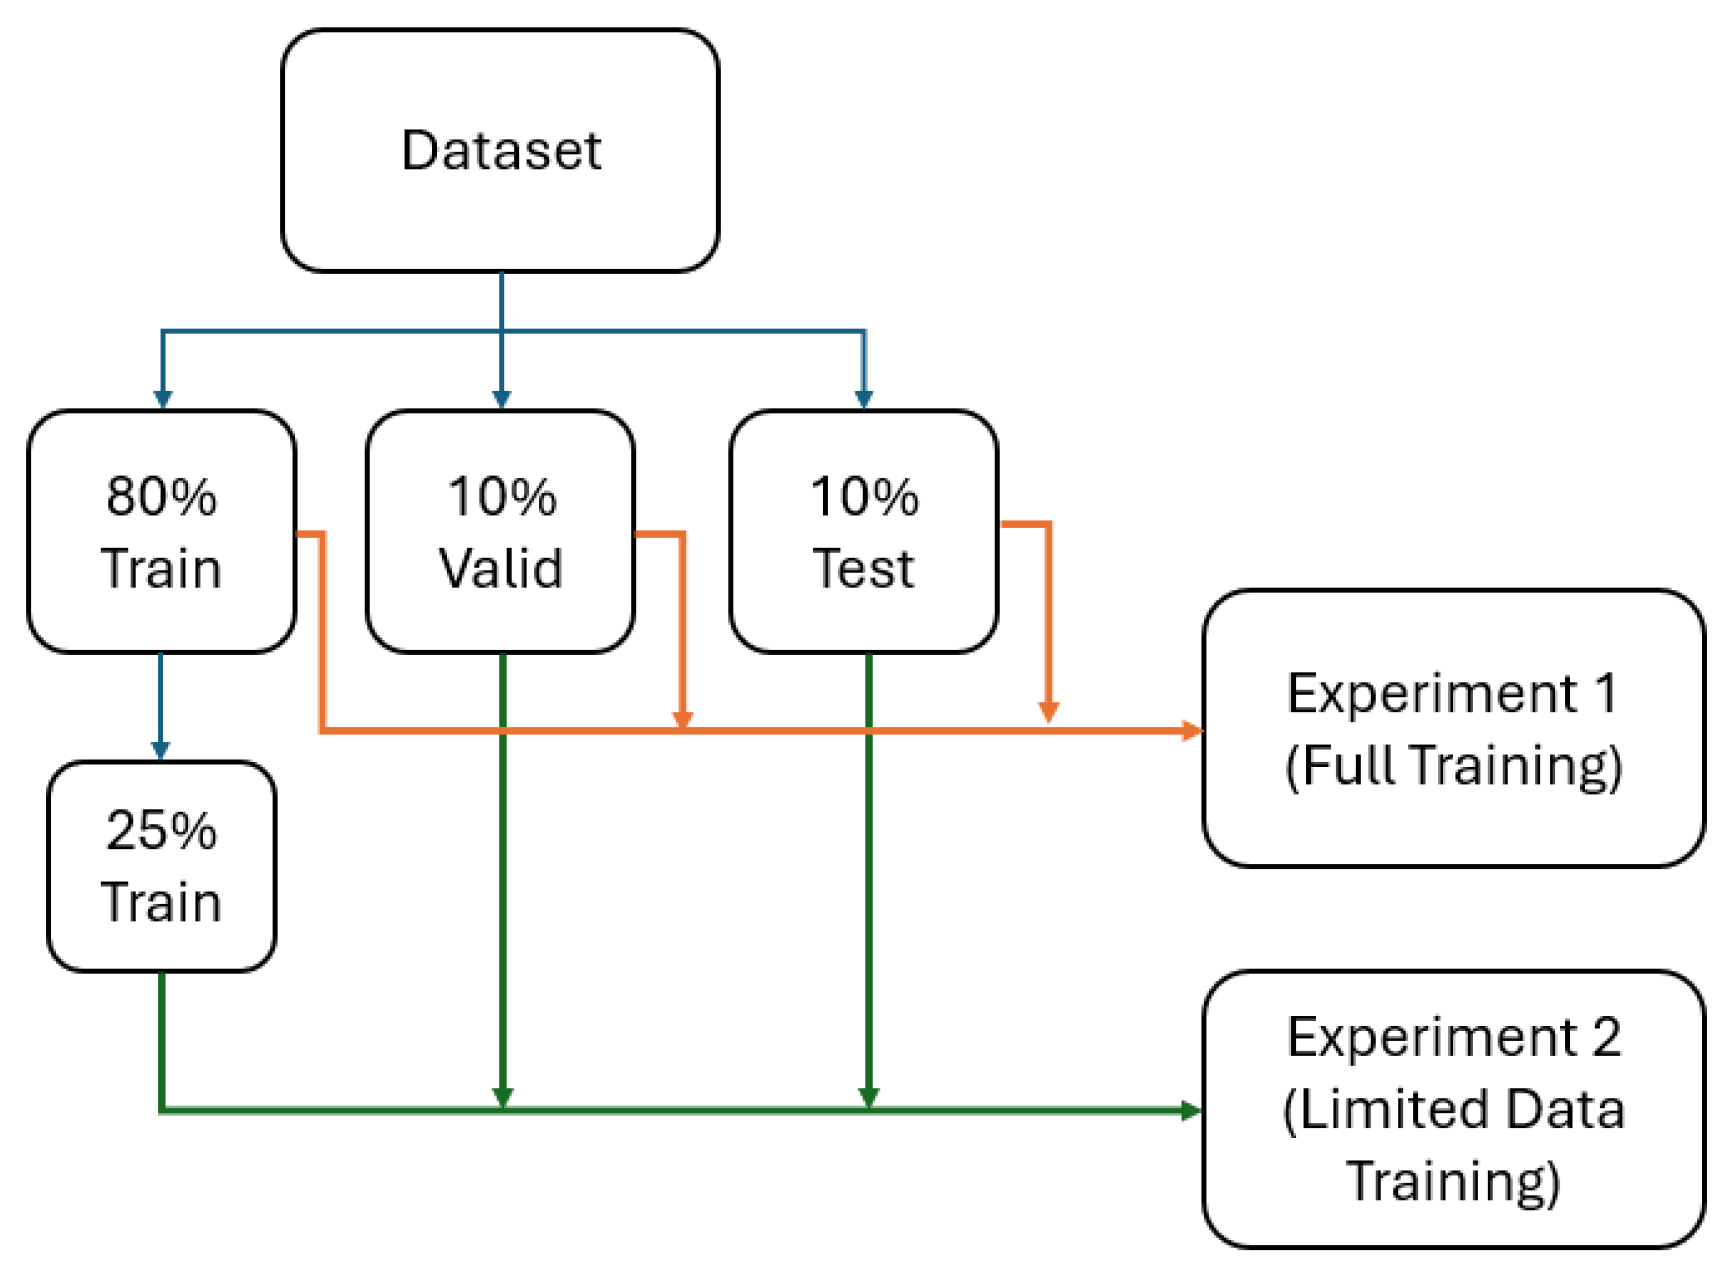
Table 1.
Performance metrics for all model architectures on proton MRI full dataset experiment. Values are presented as mean (range) for Dice Similarity Coefficient (DSC), Average Hausdorff Distance (Avg_HD), 95th percentile Hausdorff Distance (HD95), and XOR error.
Table 1.
Performance metrics for all model architectures on proton MRI full dataset experiment. Values are presented as mean (range) for Dice Similarity Coefficient (DSC), Average Hausdorff Distance (Avg_HD), 95th percentile Hausdorff Distance (HD95), and XOR error.
| Model | DSC | Avg_HD | HD95 | XOR |
|---|---|---|---|---|
| DeepLabV3_resnet152 | 0.92 (0.73–0.96) | 1.273 (0.64–4.31) | 3.64 (2.0–10.15) | 0.16 (0.07–0.55) |
| FPN_mit_b5 | 0.92 (0.77–0.96) | 1.24(0.56–3.81) | 3.38 (1.41–9.62) | 0.14 (0.06–0.46) |
| MEDSAM | 0.92 (0.73–0.96) | 1.18 (0.55–4.15) | 3.27 (1.41–10.0) | 0.14 (0.05–0.55) |
| SAM | 0.92 (0.74–0.96) | 1.20 (0.60–4.18) | 3.31 (1.41–10.63) | 0.14 (0.06–0.53) |
| Unet_vgg19 | 0.92 (0.72–0.97) | 1.31(0.47–4.3) | 3.59 (1.24–10.77) | 0.16(0.05–0.57) |
Table 3.
Performance metrics for all model architectures on hyperpolarized gas MRI full dataset experiment. Values are presented as mean (range) for Dice Similarity Coefficient (DSC), Average Hausdorff Distance (Avg_HD), 95th percentile Hausdorff Distance (HD95), and XOR error.
Table 3.
Performance metrics for all model architectures on hyperpolarized gas MRI full dataset experiment. Values are presented as mean (range) for Dice Similarity Coefficient (DSC), Average Hausdorff Distance (Avg_HD), 95th percentile Hausdorff Distance (HD95), and XOR error.
| Model | DSC | Avg_HD | HD95 | XOR |
|---|---|---|---|---|
| DeepLabV3_resnet152 | 0.91 (0.74–0.97) | 1.29 (0.61–3.56) | 4.13 (1.41–10.0) | 0.19 (0.06–0.70) |
| FPN_mit_b5 | 0.91 (0.76–0.97) | 1.177(0.45–3.21) | 3.63 (1.41–8.54) | 0.17 (0.05–0.61) |
| MEDSAM | 0.92 (0.77–0.96) | 1.15 (0.52–3.57) | 3.75(1.0–10.0) | 0.16 (0.06–0.56) |
| SAM | 0.92 (0.77–0.97) | 1.17(0.47–3.40) | 3.60 (1.0–8.0) | 0.16 (0.05–0.56) |
| Unet_vgg19 | 0.91 (0.74–0.97) | 1.24 (0.42–4.08) | 3.81 (1.0–11.40) | 0.17 (0.05–0.68) |
Table 4.
Performance metrics for all model architectures on hyperpolarized gas MRI limited dataset experiment (25% of training data). Values are presented as mean (range) for Dice Similarity Coefficient (DSC), Average Hausdorff Distance (Avg_HD), 95th percentile Hausdorff Distance (HD95), and XOR error.
| Model | DSC | Avg_HD | HD95 | XOR |
|---|---|---|---|---|
| DeepLabV3_resnet152 | 0.74 (0.07–0.87) | 2.97 (1.71–4.58) | 12.97 (7.0–68.80) | 0.46 (0.22–0.98) |
| FPN_mit_b5 | 0.65 (0.05–0.89) | 3.53 (1.62–8.14) | 15.35 (4.0–76.41) | 0.51 (0.21–0.97) |
| MEDSAM | 0.88 (0.71–0.95) | 1.62 (0.68–4.00) | 5.48 (1.41–12.92) | 0.23 (0.08–0.52) |
| SAM | 0.88(0.62–0.94) | 1.78 (0.80–4.15) | 6.42 (2.23–17.72) | 0.24 (0.10–0.54) |
| Unet_vgg19 | 0.76 (0.19–0.93) | 2.64 (1.00–7.06) | 11.39 (2.23–57.72) | 0.38 (0.13–1.02) |
Disclaimer/Publisher’s Note: The statements, opinions and data contained in all publications are solely those of the individual author(s) and contributor(s) and not of MDPI and/or the editor(s). MDPI and/or the editor(s) disclaim responsibility for any injury to people or property resulting from any ideas, methods, instructions or products referred to in the content. |
© 2025 by the authors. Licensee MDPI, Basel, Switzerland. This article is an open access article distributed under the terms and conditions of the Creative Commons Attribution (CC BY) license (http://creativecommons.org/licenses/by/4.0/).
Copyright: This open access article is published under a Creative Commons CC BY 4.0 license, which permit the free download, distribution, and reuse, provided that the author and preprint are cited in any reuse.


