
Submitted:
15 August 2025
Posted:
18 August 2025
You are already at the latest version
Abstract
Energy forecasting is critical for modern power systems, enabling proactive grid control and efficient resource optimization. However, energy forecasting projects require systematic approaches that span from project inception to model deployment while ensuring technical excellence, domain alignment, regulatory compliance, and reproducibility. Existing methodologies such as CRISP-DM provide a foundation but lack explicit mechanisms for iterative feedback, decision checkpoints, and continuous energy domain expert involvement. This paper proposes a modular end-to-end framework for energy forecasting that integrates formal decision gates in each phase, embeds domain expert validation, and produces fully traceable artefacts. The framework supports controlled iteration, rollback, and automation within an MLOps-compatible structure. A comparative analysis demonstrates its advantages in functional coverage, workflow logic, and governance over existing approaches. A case study on short-term electricity forecasting for a 2,560 m² Office building validates the framework, achieving 24-hour-ahead predictions with a RNN, reaching RMSE of 1.04 kWh and MAE of 0.78 kWh. The results confirm that the framework enhances forecast accuracy, reliability, and regulatory readiness in real-world energy applications.
Keywords:
energy forecasting framework
; end-to-end machine learning pipeline
; domain expert integration
; decision gate governance
; MLOps for energy systems
; data quality and provenance
; modular workflow design
; regulatory compliance in AI forecasting
1. Introduction
Forecasting has long been an essential function in the power and energy industry, with thousands of research papers dedicated to predicting electricity demand, prices, and renewable generation [1]. Accurate energy forecasts inform critical decisions for utilities and grid operators, enabling proactive planning, resource optimization, and integration of renewable energy sources [2]. The ability to anticipate future energy supply and demand underpins a wide range of applications, from balancing electricity grids and scheduling power plants to designing demand response programs and optimizing microgrid operations [2]. In recent years, the rise of smart grids and Internet of Things (IoT) sensor networks has further heightened the need for robust forecasting pipelines that can handle large-scale, real-time data and complex machine learning models [3].
Despite the abundance of forecasting models in literature, energy forecasting practitioners often face challenges in end-to-end implementation that are specific to the energy domain. Energy forecasting projects require not only choosing the right predictive algorithms but also ensuring data quality, incorporating energy system domain knowledge, and validating results against physical and operational constraints. Poor data quality or misaligned project goals can lead to the adage "garbage in, garbage out" [4], where even advanced models fail due to fundamental flaws in the input data or problem definition. Moreover, energy forecasting models must account for complex temporal patterns, weather dependencies, and regulatory requirements that generic data science approaches may overlook [5,6,7]. To address these challenges, a structured methodology is crucial. Indeed, successful energy forecasting initiatives often adhere to similar staged approaches that iterate between understanding the domain, preparing high-quality data, and refining models [2,8]. However, there is a need for a domain-specific framework tailored to the nuances of energy time-series data and the requirements of forecasting tasks.
Several recent works underscore the importance of end-to-end pipeline design in energy forecasting. Im et al. (2024) developed a Machine Learning Operations (MLOps) [9] centric data pipeline for real-time energy management, integrating streaming data platforms and databases to deploy forecasting models in production [3]. Their results highlighted the trade-off between model complexity and operational speed [3]. Other researchers have proposed structured workflows that similarly include data preprocessing, feature engineering, model training with hyperparameter tuning, and final model selection as distinct stages [10]. Our work builds on these concepts by providing a detailed, reproducible blueprint tailored to energy forecasting projects (such as day-ahead load prediction or renewable generation forecasting). We also align the pipeline with documentation practices and decision criteria at each phase, which helps in maintaining transparency and facilitating collaboration among different stakeholders.
Structured process models have long been used to guide data mining and data science projects. The Cross-Industry Standard Process for Data Mining (CRISP-DM), introduced in the late 1990s, remains one of the most widely adopted frameworks for analytics projects [11,12]. CRISP-DM breaks projects into six phases (Business Understanding, Data Understanding, Data Preparation, Modeling, Evaluation, Deployment) and allows iterative revisiting of earlier phases if needed [11]. This general workflow has proven valuable for ensuring a systematic approach to developing insights from data. However, as data science practice has evolved, particularly in the energy domain, new challenges have emerged that traditional process models do not fully address. In particular, organizations today face needs for:
- Continuous Iteration and Feedback Loops: Modern energy forecasting Machine Learning (ML) pipelines often run in a continuous development environment, such as development operations (DevOps) [13] or MLOps, where models are retrained and redeployed regularly in response to new data, seasonal changes, or performance triggers [14]. While CRISP-DM permits backtracking between phases, it does not explicitly formalize decision points or gating criteria at each phase beyond a general waterfall-style progression [15]. This can make it unclear when or how to iterate or rollback if issues arise.
- Domain Expert Involvement: Ensuring that analytical findings make sense in context is critical, especially in high-stakes or domain-specific applications [16]. CRISP-DM emphasizes business understanding at the start and evaluation before deployment, which implicitly calls for domain knowledge input. In practice, however, many ML pipelines implemented in pure technical terms neglect sustained involvement of energy domain experts after the initial requirements stage [11]. The separation of domain experts from data scientists can lead to models that technically optimize a metric but fail to align with real-world needs and constraints [17].
- Documentation, Traceability, and Compliance: With growing concerns about Artificial Intelligence (AI) accountability and regulations, such as the General Data Protection Regulation (GDPR) [18] and the forthcoming European Union Artificial Intelligence Act (EU AI Act) [19], there is a need for rigorous documentation of data sources, modeling decisions, and model outcomes at each step of the pipeline. Traceability, maintaining a complete provenance of data, processes, and artifacts, is now seen as a key requirement for trustworthy AI [20].
- Modularity and Reusability: The rise of pipeline orchestration tools (Kubeflow [21], Apache Airflow [22], TensorFlow Extended (TFX) [23], etc.) reflects a best practice of designing ML workflows as modular components arranged in a Directed Acyclic Graph (DAG) [24]. Each component is self-contained (for example, data ingestion, validation, training, evaluation, deployment as separate steps) and can be versioned or reused. Classical process models were conceptually modular but did not consider the technical implementation aspect. Integrating the conceptual framework with modern pipeline architecture can enhance clarity and maintainability of data science projects. The Proposed Framework addresses these gaps by combining the strengths of established methodologies with new enhancements for iterative control, expert validation, and traceability. In essence, we extend the CRISP-DM philosophy with formal decision gates at each phase, which involves multiple stakeholders’ validation step, all underpinned by thorough documentation practices. The framework is enhanced through selective automation and continuous improvement. Technical validation steps, such as quality checks, artifact versioning, and forecast anomaly detection—can be partially or fully automated, while manual governance gates ensure expert oversight and compliance. The framework remains modular and tool-agnostic, aligning with contemporary MLOps principles so it can be implemented using pipeline orchestration platforms in practice.
In summary, the key contributions of the proposed framework are:
- Formalized Feedback Loops: Introduction of explicit decision gates at each phase, enabling iteration, rollback, or re-processing when predefined success criteria are not met. This makes the iterative nature of data science explicit rather than implicit [25], and supports partial automation of loopback triggers and alerts.
- Systematic Energy Domain Expert Integration: Incorporation of energy domain expertise throughout the pipeline, not just at the beginning and end, to ensure results are plausible and actionable in the energy system context. This goes beyond typical consultation, embedding energy domain feedback formally into the pipeline, particularly for validating data patterns, feature engineering decisions, and model behavior against energy system knowledge.
- Enhanced Documentation & Traceability: Each phase produces traceable outputs (datasets, analysis reports, model artifacts, evaluation reports, etc.) that are versioned and documented. This provides end-to-end provenance for the project, responding to calls for AI traceability as a foundation of trust in critical energy infrastructure applications [26].
- Modularity and Phase Independence: The process is structured into self-contained phases with well-defined inputs and outputs, making it easier to integrate with pipeline orchestration tools and to swap or repeat components as needed. This modular design mirrors the implementation of workflows in platforms like Kubeflow Pipelines and Apache Airflow, which treat each step as a reusable component in a DAG [27]. It facilitates collaboration between data scientists, engineers, and domain experts, and supports consistent, repeatable runs of the pipeline.
The proposed framework is organized into seven main phases (numbered 0 through 6) that reflect the logical progression of an energy forecasting project. Each phase contains clearly defined objectives, tasks, documentation outputs, and decision gates to decide if the project is ready to advance. This design ensures a systematic workflow where each step's deliverables feed into the next, and any issues trigger iterative loops for remediation before resources are wasted on flawed inputs or models. Notably, the pipeline framework places strong emphasis on early-phase activities such as project scoping and data validation, which are sometimes under-emphasized in purely algorithm-focused studies. The framework also incorporates domain expert validation to bridge the gap between data-driven findings and real-world energy system understanding. By doing so, it aims to improve forecast accuracy and credibility, as energy domain knowledge can help identify spurious correlations or anomalies.
The remainder of this paper is organized as follows: Section 2 reviews related work and existing process models, highlighting their coverage and limitations. Section 3 introduces the proposed framework, detailing each phase and the decision gate mechanism. Section 4 provides a comparative discussion of how the framework improves upon the state of the art in terms of functional coverage, workflow logic, and technical features. Section 5 presents a case study that demonstrates the framework in a practical energy forecasting scenario. Finally, Section 6 concludes the paper and discusses future work.
2. Background and Related Work
2.1. Existing Data Science Process Models
The need for structured methodologies in data analytics has led to numerous process models over the years. CRISP-DM is often cited as the de facto standard, providing a generic six-phase approach that is industry- and application-neutral [28]. It gained popularity for its simplicity and generality, by defining stable, general tasks for each phase that can adapt to different projects. In CRISP-DM, after the completion of each phase, practitioners may revisit previous phases if necessary until the project meets its success criteria, essentially functioning as a "waterfall with backtracking" process [11]. This flexibility was one of CRISP-DM's strengths; however, the model itself leaves it to the practitioners to determine when to iterate back and how to document those iterations.
Several extensions and alternatives to CRISP-DM have been proposed to address its shortcomings in modern contexts, though few specifically address energy domain requirements:
- Framework for Machine Learning with Quality Assurance (QA): CRISP-ML(Q) extends CRISP-DM by adding an explicit Monitoring and Maintenance phase at the end of the lifecycle to handle model degradation in changing environments [11]. It also merges the Business Understanding and Data Understanding phases into one, recognizing their interdependence in practice [11]. Most notably, CRISP-ML(Q) introduces a comprehensive QA methodology across all phases: for every phase, specific requirements, constraints and risk metrics are defined, and if quality risks are identified, additional tasks (e.g., data augmentation, bias checks) are performed to mitigate them [29]. This ensures that errors or issues in each step are caught as early as possible, improving the overall reliability of the project [11]. This quality-driven approach is informed by established risk management standards such as International Organization for Standardization (ISO) 9001: Quality Management Systems — Requirements [30] and requires that each stage produces verifiable outputs to demonstrate compliance with quality criteria. Although CRISP ML(Q) improves overall model governance and reliability, it is designed to be application neutral and does not specifically address challenges unique to energy forecasting, such as handling temporal structures, integrating weather-related inputs, or capturing domain-specific operational constraints.
- Frameworks for Specific Domains: In regulated or specialized industries, variants of CRISP-DM have emerged. For instance, Financial Industry Business Data Model (FIN-DM) [31] augments CRISP-DM by adding a dedicated Compliance phase that focuses on regulatory requirements and risk mitigation (including privacy laws like GDPR), as well as a Requirements phase and a Post-Deployment review phase [32]. This reflects the necessity of embedding governance and legal compliance steps explicitly into the data science lifecycle in domains where oversight is critical.
- Industrial Data Analysis Improvement Cycle (IDAIC) [33] and Domain-Specific CRISP-DM Variants: Other researchers have modified CRISP-DM to better involve domain experts or address maintenance. For example, Ahern et al. (2022) propose a process to enable domain experts to become citizen data scientists in industrial settings, by renaming and adjusting CRISP-DM phases and adding new ones like “Domain Exploration” and “Operation Assessment” for equipment maintenance scenarios [32]. These changes underscore the importance of domain knowledge and continuous operation in certain contexts.
Beyond CRISP-DM and its direct descendants, the rise of MLOps has influenced how we conceptualize the ML lifecycle. MLOps is not a single defined process model, but rather a set of practices and tools to automate and streamline the end-to-end ML lifecycle, often drawing on DevOps principles [9,34]. In an MLOps paradigm, one often defines pipelines that encompass stages such as data ingestion, data validation, model training, model evaluation, deployment, and monitoring in production [35]. These pipelines are frequently implemented using workflow orchestrators, such as Kubeflow, Airflow, and TFX. Such tools allow practitioners to define each step of an ML workflow as a separate component (e.g., a Docker container [36] or script), with dependencies forming a directed acyclic graph. This enables scalable, repeatable, and traceable execution of the entire ML process [34,37]. Metadata tracking is a built-in feature in many of these platforms: for example, they record which dataset version and parameter configuration were used to train a given model, and when that model was deployed [35,37]. This addresses the traceability challenge by answering questions like “Which data and code produced this model and what were its evaluation results?” [35]. However, the focus of most MLOps tools is on automation and reproducibility; they do not inherently ensure that a domain expert has vetted the model’s behavior or that documentation is written in human-readable form, those aspects still rely on the development team’s process.
Hence, existing methodologies each contribute parts of the picture: CRISP-DM provides a high-level scaffold for analytic projects; CRISP-ML(Q) and others inject quality control, maintenance, and sometimes compliance; MLOps frameworks deliver technical capabilities for automation and tracking. Yet, there remains a gap in having a unified methodology that formally integrates iterative decision gating, domain validation, and comprehensive traceability in a modular, implementable way. This is the gap our work aims to fill.
2.2. Limitations of Current Approaches
From the brief survey above, a few limitations can be identified in current state-of-practice that motivate our framework:
- Implicit vs. Explicit Iteration: CRISP-DM and its variants generally allow iteration (e.g., CRISP-DM’s arrows looping back, CRISP-ML(Q)’s risk-based checks). However, the decision to loop back is often left implicit or to the judgment of the team, without a formal structure. For instance, CRISP-DM’s Evaluation phase suggests checking if the model meets business objectives; if not, one might return to an earlier stage [11]. But this is a single checkpoint near the end. The proposed framework introduces multiple gated checkpoints with clear criteria (e.g., data quality metrics, model performance thresholds, validation acceptance by domain experts) that must be met to proceed forward, which increases process automation opportunities while also making the workflow logic explicit and auditable.
- Domain Knowledge Integration: Many pipelines emphasize technical validation (metrics, statistical tests) but underemphasize semantic validation. As noted by Studer et al. in CRISP-ML(Q), separating domain experts from data scientists can risk producing solutions that miss the mark [11]. Some domain-specific processes have tried to bridge this, as in Ahern et al.’s work and other “CRISP-DM for X” proposals [33], but a general solution is not common. The proposed framework elevates domain expert involvement to the formal phases and suggests including domain experts not only in defining requirements but also in reviewing intermediate results and final models. This provides a structured feedback loop where expert insight can trigger model adjustments.
- Comprehensive Traceability: Reproducibility and traceability are increasingly seen as essential for both scientific rigor and regulatory compliance. Tools exist to version data and models, but few conceptual frameworks explicitly require that each step’s outputs be recorded and linked to inputs. The High-Level Expert Group on AI’s guidelines for Trustworthy AI [38] enumerate traceability as a requirement, meaning one should document the provenance of training data, the development process, and all model iterations [20]. The proposed framework bakes this in by design: every phase yields an artifact (or set of artifacts) that is stored with metadata. This could be implemented via existing MLOps, but methodologically we ensure no phase is “ephemeral”, even exploratory analysis or interim results should be captured in writing or code for future reference. This emphasis exceeds what CRISP-DM prescribed and aligns with emerging standards in AI governance [20].
- Modularity and Extensibility: Traditional methodologies were described in documents and weren’t directly operational. Modern pipelines are often executed in software. A good process framework today should be easily translated into pipeline implementations. CRISP-ML(Q) explicitly chose to remain tool-agnostic so it can be instantiated with various technologies [11]. The proposed framework shares that philosophy: the framework is conceptual, but each phase corresponds to tasks that could be implemented as modules in a pipeline. By designing with clear modular boundaries, we make it easier to integrate new techniques (for instance, if a new data validation library arises, it can replace the validation component without affecting other parts of the process). This modularity also aids reusability: components of the pipeline can be reused across projects, improving efficiency.
In light of these observed limitations, the proposed framework attempts to synthesize these considerations into a single, coherent methodology.
3. Proposed Energy Forecasting Pipeline Framework
The proposed framework is a phase-oriented process pipeline designed to extend the standard data science lifecycle with enhanced structural control, traceability, and decision governance. The framework consists of seven logically ordered phases, spanning from early scenario understanding to post-deployment monitoring and feedback. Phase 0 defines the forecasting scenario, establishes domain-specific constraints, and derives success criteria. Phases 1–5 execute data management, modeling, evaluation, and deployment activities. Phase 6 supports automated monitoring and ensures readiness for update cycles and retraining.
Each phase contains internal decision points that evaluate technical sufficiency, such as data validity, semantic alignment, or model performance, based on criteria derived during Phase 0. These decision points may initiate local iteration within the phase or trigger loopbacks to earlier phases, depending on whether technical, semantic, or operational requirements have been met. This built-in flexibility enables corrective action and refinement while maintaining control over pipeline progression.
At each phase, a formal decision gate serves a broader governance function. Unlike internal technical checks, these gates require cross-functional stakeholder review and sign-off to ensure that:
- All the internal decision points pass the predefined technical requirements and criteria
- Artifacts are documented, versioned, and traceable
- Outputs and processes comply with technical, operational, regulatory, and domain standards
- Risks are evaluated and either mitigated or accepted
- The project is ready to transition to the next phase without carrying forward unresolved issues
They function as structured project control mechanisms that prevent the propagation of incomplete or unverified deliverables, ensuring that transitions across phases are justified and risk-managed.
The framework also incorporates mechanisms for controlled loopbacks, allowing governed transitions back to earlier phases if a deliverable fails to meet either technical thresholds or gate-level governance criteria. These transitions are explicitly tracked and recorded, enabling transparent reprocessing, rollback, and root cause analysis. This ensures the system remains adaptable while preserving accountability.
Finally, the framework is enhanced through automation and continuous improvement. By structuring all outputs as versioned, traceable artifacts and aligning them to predefined criteria, the pipeline supports automated quality checks, artifact lineage tracking, and streamlined updates. This ensures that the forecasting process remains resilient to changing data, evolving system behavior, or updated operational constraints, while maintaining full reproducibility and governance integrity.
Figure 1 conceptually shows the pipeline. The framework explicitly incorporates energy domain considerations throughout, ensuring that technical decisions align with energy system requirements, physical constraints, and operational needs. Each phase produces versioned artifacts—including datasets, reports, and configuration files—which collectively form a fully traceable project history suitable for regulatory compliance and reliability assessments. A summary of key datasets and documentation artifacts generated in each phase is provided in Appendix A.
3.1. Phase 0 - Project Foundation
Phase 0 establishes the fundamental groundwork for energy forecasting projects through two structured and sequential workflows: Scenario Understanding & Alignment (0.1) and Compliance & Technical Checks (0.2), and a decision gate: Gate 0: Foundation Check (0.3). This phase ensures that projects are both strategically aligned and technically feasible before proceeding to subsequent implementation phases. The detailed workflow for Phase 0 is illustrated in Figure 2.
3.1.1. Scenario Understanding & Alignment
The scenario understanding workflow, detailed in Figure 2, begins with task entry (0.1.1) and proceeds through systematic requirement definition. The process first establishes comprehensive scenario understanding and physical system comprehension (0.1.2), which serves as the foundation for understanding the project and the physical information of the system. It includes use-case analysis, the physical installation assessment, and the impact factor understanding and the model scoping understanding, which will be used in the following phases. The requirements derivation and criteria definition process (0.1.3) establish measurable success criteria across project phases. The framework provides phase-specific guidance, from overall forecasting target and horizon requirements to detailed data quality metrics, feature generation criteria, and model performance benchmarks.
This systematic approach leads to the creation of two documents: Doc01_ProjectSpecification and Doc02_RequirementsCriteria (0.1.4) to ensure traceability and provide documentation for use in the following phases.
3.1.2. Compliance & Technical Checks
Following scenario understanding and requirement definition, the workflow continues by entering the overall task and the two output documents from the previous step (0.2.1), then conducting compliance verification and feasibility assessment. The process begins with a formal initial compliance check (0.2.2), ensuring that the project adheres to relevant regulatory, contractual, or organizational standards to ensure ethical and safe processing. The compliance check involves reviewing related regulations and standards to comply with both technical and process requirements. Reviewing relevant certifications is also part of this work.
Subsequently, the process proceeds to assess system constraints and technical feasibility (0.2.3). This includes evaluating the availability of computational resources, data transmission capabilities, infrastructure readiness, and any network or storage limitations.
These findings are synthesized and require an update to the previously defined specification and requirements and criteria report (0.2.4). The results are also documented in a comprehensive Doc03_ComplianceCheckReport and Doc04_SystemTechFeasibilityReport (0.2.5) for traceability.
3.1.3. Gate 0 - Foundation Check
The final milestone of Phase 0 is Gate 0: Foundation Check (0.3.1), which serves as a formal entry gate into the forecasting pipeline. It consolidates the outcomes of scenario alignment, requirement definition, compliance verification, and feasibility assessment. The gate ensures that:
- Specification and requirements and success criteria are clearly defined and documented. Compliance obligations are clearly identified and documented. System and infrastructure feasibility has been confirmed.
- All output artifacts are documented.
- Outputs and processes are compliant.
- Risks are identified and accepted.
- There are no unresolved issues.
Only when all foundational conditions are met does the project proceed to Phase 1: Data Foundation. A comprehensive Doc05_Phase0Report (0.3.2) is output to log the activities completed in this decision gate, and also includes all stakeholder sign-offs. If any issues occur or reviews do not pass, a Doc06_LogIssues (0.3.3) will be created and the process will loop back to the beginning of Phase 0. This structured approach ensures that projects are grounded in realistic assumptions and are compliant with constraints, thereby minimizing the risk of costly midstream redesigns.
3.2. Phase 1 - Data Foundation
Phase 1 establishes the data acquisition necessary for energy forecasting through two sequential workflows: Data Identification & Quality Check (1.1) and Data Ingestion and Validation (1.2), and a decision gate: Gate 1 Data Acquisition Ready (1.3). This phase ensures comprehensive data acquisition and validates data integrity before proceeding to analytical phases. The detailed workflow for Phase 1 is illustrated in Figure 3.
3.2.1. Data Identification & Quality Check
The data identification workflow initiates with the systematic identification of available and required input (1.1.1) relevant to the project. From the previous phase, we defined the factors needed for the forecasting project; this step involves cataloging or re-analyzing these factors into implementable data features and identifying the available data sources.
The process continues with the quality check of the raw energy data. Starting with raw energy data input (1.1.2), followed by energy data loading (1.1.3), a critical quality assessment (1.1.4) module evaluates feature completeness, data type and schema compatibility, and completeness and consistency across time intervals. Figure 4 illustrates a potential sequence of internal steps involved in the initial quality check process. The quality verification (1.1.5) is conducted through predefined metrics.
The workflow is designed to prioritize energy data first, as it is central to the forecasting task. This approach reduces unnecessary effort on supplementary data until the core dataset is validated. Once the energy data passes the quality check, it is saved and output datasets are generated (1.1.6), and formal documents Doc11_DataSourceInventory and Doc12_InitialDataQualityReport are generated.
After processing the energy data, the pipeline advances to a decision point (1.1.8) to evaluate whether all relevant influencing factors have been covered. If gaps are identified, the system enters a supplementary data sourcing process (1.1.9), including availability checks (1.1.10). If additional sources are available, they are subjected to the same quality validation process as the energy data (1.1.4), as well as saving the dataset and updating the documents in step 1.1.6 and 1.1.7. If not, the workflow loops back to identify and select alternatives.
Another branch occurs at 1.1.11 to check to determine whether the data represents target energy data or supplementary information, triggered when a dataset fails quality checks. The process distinguishes between energy data and other influencing data. If the failing dataset is energy data, the workflow enters a targeted search for alternative sources or data recollection efforts (1.1.12). If the issue involves supplementary data (e.g., temperature or calendar), it reverts to the broader data source identification process (1.1.9).
Once all datasets have passed validation and all required factors are covered, the pipeline transitions to Section 1.2 Data Ingestion and Validation, ensuring a high-quality foundation for downstream processing.
3.2.2. Data Ingestion and Validation
Upon entering the collected datasets (1.2.1), the process proceeds with data loading, transformation, and integration tasks which are executed (1.2.2). A review of quality metrics (1.2.3) for the integrated dataset is conducted to evaluate the completeness, consistency, and temporal alignment of the integrated dataset, while preserving lineage and supporting future audits.
A validation checkpoint (1.2.4) confirms whether ingestion was successful and the overall quality passes; if not, the process loops back to the data loading step. Upon passing, the integrated dataset is output (1.2.5), ready for downstream processing, and the results are formally documented through Doc13_DataQualityValidationReport and Doc14_IntegrationSummary (1.2.6).
3.2.3. Gate 1 - Data Acquisition Ready
Phase 1 culminates in Gate 1: Data Acquisition Ready (1.3.1), a formal evaluation checkpoint that consolidates outcomes from both workflows. The gate confirms that:
- All the necessary data have been identified and collected. Datasets have been successfully ingested and validated. Quality metrics meet established thresholds.
- All documents and datasets are correctly created.
- The process complies with data-related technical and process requirements.
- Risks are accepted
- There are no unresolved issues.
Only projects that demonstrably meet these conditions are permitted to log Doc15_Phase1Report (1.3.2) and advance to Phase 2. If the gate fails, issues should be logged in Doc16_LogIssues (1.3.3) and the process should loop back to the beginning of Phase 1. Gate 1 ensures that the data processing initiative is built upon a complete, reliable, and auditable data foundation—minimizing risks in subsequent analytical phases.
3.3. Phase 2 - Data Understanding & Preprocessing
Phase 2 focuses on developing a deep understanding of the integrated datasets and applying rigorous preprocessing techniques to ensure data readiness. This phase consists of two interconnected workflows: Exploratory Data Analysis (EDA) (2.1) and Data Cleaning & Preprocessing (2.2) and Gate 2: Data Preprocessing OK? (2.3). The detailed workflow for Phase 2 is illustrated in Figure 5.
3.3.1. EDA
The EDA workflow begins with the input of integrated datasets (2.1.1), followed by a sequence of statistical and structural analyses. These include distribution analysis (2.1.2), seasonal and cyclical pattern identification (2.1.3), and correlation analysis (2.1.4). These steps support the extraction of high-level data insights and behavioral patterns relevant to energy forecasting.
Subsequently, practitioners document visualized results and recurring patterns (2.1.5) and assess whether observed trends align with known domain knowledge (2.1.6). If misalignment is detected, the process loops back, allowing the team to revisit Phase 1 Data Foundation to re-collect data. Once alignment is confirmed, the system proceeds to generate a comprehensive EDA report Doc21_EDAReport (2.1.7) to fully record all the data features.
3.3.2. Data Cleaning & Preprocessing
The process begins with the detection of outliers (2.2.1) and missing values (2.2.2), triggering appropriate remediation strategies. A variety of techniques can be employed to handle outliers, such as setting them to NaN, applying value capping, or using domain-specific thresholds. Missing data patterns can then be addressed using methods like linear interpolation or context-informed and domain-guided imputations.
Following imputation, the workflow conducts consistency and critical pattern validation (2.2.6). This step confirms whether cleaned data retains structural coherence and preserves key temporal-energy patterns (e.g., seasonality, load cycles). If the dataset fails this validation (2.2.7), the process loops back to reapply outlier handling or refine imputation logic. Once the dataset passes validation, the cleaned dataset is output for downstream processing (2.2.8), and the workflow formalizes results through the creation of a final data cleaning report Doc22_DataCleaningReport (2.2.9).
3.3.3. Gate 2 – Data Preprocessing OK
Phase 2 concludes with Gate 2: Data Preprocessing OK? (2.3.1), which serves as a formal checkpoint to verify that:
- Exploratory insights align with domain knowledge, and all critical data anomalies have been addressed.
- Preprocessing procedures are transparently documented.
- Outputs and processes comply with technical, operational, regulatory, and domain standards
- Risks are evaluated and either mitigated or accepted
- The project is ready to transition to the next phase without carrying forward unresolved issues
Only when these conditions are met does the project move to the generation of Doc23_Phase2Report and advance to Phase 3: Feature Engineering. Otherwise, the process will create a log Doc24_LogIssues and loop back to Phase 2 for data reevaluation and further refinement.
3.4. Phase 3 - Feature Engineering
Phase 3 transforms preprocessed data into model-ready datasets through two sequential workflows: Feature Engineering & Creation (3.1) and Feature Analysis & Selection (3.2). It also consists of a decision gate at the end of the phase: Gate 3: Features OK. This phase ensures that the dataset contains informative, valid, and contextually relevant features structured for modeling tasks. The detailed workflow for Phase 3 is illustrated in Figure 6.
3.4.1. Feature Engineering & Creation
The workflow begins with the input of cleaned datasets (3.1.1). Practitioners generate new features (3.1.2) derived from domain knowledge, temporal structures, or cross-variable interactions. These are then integrated with raw or previously established variables (3.1.3) to form a unified dataset. The resulting output (3.1.4) is a comprehensive feature-enriched dataset passed to the next stage. A formal feature creation report Doc31_FeatureCreationReport (3.1.5) documents derivation logic, assumptions, and transformation methods.
3.4.2. Feature Analysis & Selection
This stage starts with the full-feature dataset (3.2.1). Feature analysis (3.2.2) evaluates statistical properties, correlation profiles, and relevance to the target variable. A scoring mechanism (3.2.3) can include different techniques to evaluate feature combinations, such as mutual information, permutation importance, or Shapley additive explanations (SHAP) [39]values to prioritizes features for selection (3.2.4).
A decision point (3.2.5) assesses whether the selected subset sufficiently captures the forecasting signal and checks if the data quality is satisfactory. If not, the workflow returns to feature generation (3.1.2), enabling the generation of new or adjusted features before repeating the selection loop. Once the validation passes, a refined dataset with only selected features is output (3.2.6), and a feature selection analysis report Doc32_FeatureSelectionReport is created (3.2.7).
3.4.3. Gate 3 - Features OK
Phase 3 concludes with Gate 3: Features OK (3.3.1), a formal quality checkpoint that synthesizes the outcomes of all three workflows. This gate confirms that:
- Feature engineering has been thoroughly conducted, and selected features are sufficient, relevant, and validated for the modeling objective.
- All artifacts are documented appropriately.
- The process complies with regulations and standards if applicable.
- Risks are evaluated and accepted.
- No unresolved issues remain.
Only projects that satisfy these conditions are allowed to record the log information for the decision gate review Doc33_Phase3Report (3.3.2) and proceed to Phase 4: Model Development & Evaluation. If any issues remain, Doc34_LogIssues (3.3.3) must be generated, and the process should loop back to the beginning of this phase. Gate 3 ensures that model inputs are comprehensive, representative, and structured according to rigorous standards, thereby minimizing the risk of performance degradation or bias during model training and validation.
3.5. Phase 4 - Model Development & Evaluation
Phase 4 develops and evaluates predictive models through five structured workflows and one decision gate: Model Scoping (4.1), Input Data Preparation (4.2), Model Training and Evaluation (4.3), Model Refinement (4.4), Result Consolidation (4.5), and Gate 4: Model Valid? (4.5). This phase enables systematic model selection, performance validation, and iterative improvement, forming the technical backbone of the forecasting pipeline. The detailed workflow for Phase 4 is illustrated in Figure 7.
3.5.1. Model Scoping
The process begins by identifying candidate models spanning statistical, ML, and deep learning (DL) categories (4.1.1) according to the project specification. A structured model instantiation is then constructed and organized, and candidate experiments are created in Doc41_CandidateExperiments (4.1.2), providing a foundation for transparent comparison and reproducible experimentation in downstream workflows.
3.5.2. Input Data Preparation
The data preparation workflow processes datasets with selected features (4.2.1) through the model-specific data loader (4.2.2), steps such as scaling, encoding, and dataset splitting are adopted to the input dataset. Validation checks (4.2.3) confirm integrity while also ensuring, for example, that no data leakage or shape inconsistencies exist. Failed checks initiate dataset adjustments (4.2.4), creating a feedback loop within this sub-phase back to final dataset creation. Successful validations lead to the generation of final transformed datasets (4.2.5), producing training, validation, and test datasets for model development, and data preparation summary documentation Doc42_DataPreparationSummary (4.2.6).
3.5.3. Model Training and Evaluation
The workflow begins with the initial model training (4.3.1), where a broad range of models are tested across available feature sets, following the predefined experimental design established in the previous step. Model performance is then evaluated through metrics and visual diagnostics (4.3.2), enabling consistent comparisons. Subsequently, the workflow assesses whether any model meets the acceptable performance threshold (4.3.3). If the assessment fails, the process examines whether limitations stem from the model itself or the underlying data (4.3.4).
In the case of data deficiencies, the workflow loops back to Phase 1: Data Foundation to revisit data sourcing or preprocessing. If the issue lies with the model configuration or selection, the process restarts from the beginning of Phase 4 to explore alternative model structures or categories. If acceptable performance is achieved, the workflow advances to the generation of a performance record (4.3.5), and a top feature sets report Doc43_ModelTrainingReport (4.3.6), providing critical input for subsequent model refinement.
3.5.4. Model Refinement
Refinement begins with the selection of top-performing model and feature set combinations based on prior results (4.4.1), followed by targeted hyperparameter tuning (4.4.2). This stage aims to optimize model accuracy while mitigating overfitting risks. The outcomes are then integrated into performance consolidation and documentation workflows.
3.5.5. Result Consolidation
This final workflow in this phase synthesizes modeling outputs and prepares them for handoff to deployment. It begins with a final statistical analysis and visual comparison (4.5.1), culminating in a comprehensive performance analysis to select the model that will be deployed in the next phase (4.5.2). The process concludes with outputting the selected model artifacts (4.5.3) and creating the final model documentation Doc44_PerformanceAnalysisReport and Doc45_FinalModelDocumentation (4.5.4) to support downstream integration.
3.5.6. Gate 4 - Model Valid
Phase 4 culminates in Gate 4: Model Valid (4.6.1), a formal review point confirming model quality and readiness for operationalization. This gate ensures that:
- Data preparation steps, including transformations and splits, have passed integrity checks. Model performance meets defined criteria across relevant metrics and datasets. Selected models are reproducible and aligned with forecasting objectives.
- All modeling procedures, configurations, and decisions are fully documented.
- The process meets compliance requirements.
- Risks are evaluated and accepted.
- There are no other unresolved issues.
Only projects satisfying these conditions proceed to create a log report Doc46_Phase4Report (4.6.2) and move forward to Phase 5: Deployment and Implementation. If issues occur, a log report Doc47_LogIssues will be generated (4.6.3) and the process will loop back to re-implement this phase. Gate 4 ensures that candidate models are demonstrably valid, thoroughly documented, and aligned with performance expectations. This provides a reliable foundation for subsequent deployment and operational integration.
3.6. Phase 5 - Model Deployment & Implementation
Phase 5 transitions validated forecasting models into operational environments through a structured series of deployment workflows. This phase ensures that the model is not only technically integrated within the production infrastructure but also accessible, functional, and reliable for end users. It includes rigorous validation steps that confirm successful setup, data connectivity, and system operability. The detailed workflow for Phase 5 is illustrated in Figure 8.
3.6.1. Deployment Preparation
The deployment process begins with final validation of model performance and implementation readiness (5.1.1). This involves confirming that accuracy benchmarks have been retained and that the model is reproducible under the target infrastructure. The implementation environment is then configured, including software stacks, deployment scripts, and scheduling tools (5.1.2). A critical decision point (5.1.3) assesses overall deployment readiness. If criteria are not met, the process loops back to Phase 4: Model Development & Evaluation for additional refinement and configuration alignment.
3.6.2. User Interface (UI) Setup
Once deployment readiness is established, the UI is developed or updated (5.2.1). This includes constructing access points such as dashboards, web applications, or application programming interfaces (APIs). Output display elements are configured (5.2.2) to ensure that forecasts, metrics, and system messages are clearly communicated to users. Key interactive features such as alerts, filters, and forecast exploration tools are implemented (5.2.3). Following configuration, the system undergoes interface functionality validation (5.2.4), which checks display correctness, response reliability, and user interaction behavior. If validation fails, the workflow loops back to the start of the interface setup process for corrective adjustments. Only interfaces that pass validation advance to the subsequent deployment stages, ensuring a robust and user-ready forecasting environment.
3.6.3. Data Connection
The system is connected to designated data sources such as sensors, databases, or third-party APIs (5.3.1). Following connection, the system performs both connection testing and input data quality checks (5.3.2). This step verifies that the incoming data stream is timely, structurally consistent, and within acceptable operational ranges. Specific checks include schema and type conformity, and value plausibility to ensure that data is suitable for model inference. A formal decision point (5.3.3) determines whether the connection and data quality meet predefined criteria. If either the connection is unstable or the input data is invalid, the process enters a remediation loop (5.3.4) to resolve issues. This may involve reinitializing the connection, applying basic data repair logic, or triggering alerts to responsible stakeholders. Only after both connection stability and data integrity are confirmed does the system proceed to output the production-ready datasets (5.3.5) and create the data connection report Doc51_DataConnectionReport (5.3.6), and advance to full deployment.
3.6.4. System Deployment
With model, interface, and data pipeline in place, the forecasting system is officially launched (5.4.1). The deployed system then performs initial forecasting and analytical routines (5.4.2), and its behavior is evaluated under production conditions (5.4.3). This includes checking for accurate predictions, proper output generation, and system responsiveness. Failures trigger issue resolution procedures (5.4.4), after which the system is re-evaluated. Once the system passes all operational checks, comprehensive deployment artifacts are generated (5.4.5) to ensure traceability, auditability, and effective knowledge transfer to downstream stakeholders. This includes technical documentation such as deployment reports (Doc52_DeploymentReport), APIs specifications, UI configurations, and integration logs.
3.6.5. Gate 5 - Deployment OK
Phase 5 culminates in Gate 5: Deployment OK (5.5.1), a formal checkpoint that verifies:
- The model is fully validated and operational in its target environment. Data connections are stable and accurate. UI are functional and deliver correct outputs
- Deployment documentation and system configuration have been properly captured and archived.
- No unfulfilled compliance related requirements.
- No unacceptable risks identified.
- No more other issues identified by all stakeholders.
Only systems meeting all operational, technical, and governance requirements are permitted to advance to Phase 6: Automated Monitoring and Update. Upon successful gate passage, Doc53_Phase5Report (5.5.2) is generated to document the deployment completion. If issues occur, Doc54_LogIssues (5.5.3) is created and the process loops back for remediation. Gate 5 ensures that the deployed forecasting solution is robust, accessible, and ready for long-term use.
3.7. Phase 6 - Automated Monitoring and Update
Phase 6 operationalizes end-to-end automation for monitoring and maintaining deployed forecasting systems. It ensures sustained model performance through real-time tracking, automatic quality evaluation, and structured feedback mechanisms. This phase minimizes manual intervention by automating operations, diagnostics, alerts, and update initiation, thereby supporting reliable model deployment in production environments. The detailed workflow for Phase 6 is illustrated in Figure 9.
3.7.1. Automated Monitoring
Automated monitoring systems initiate with the activation of scheduled or event-triggered automated operations (6.1.1), enabling the system to continuously ingest real-time data from live sources such as sensors, APIs, or streaming databases (6.1.2). The data is then loaded and transformed according to the model's requirements (6.1.3). After preprocessing, the deployed model is automatically executed to generate updated forecasts, which are then visualized through dynamic interface updates (6.1.4).
Automated validation mechanisms continuously evaluate output quality (6.1.5) against defined thresholds, historical baselines, and domain-specific expectations. If output quality is unacceptable, the system automatically generates logs, triggers alerts (6.1.6), and archives anomalous input-output pairs as hard samples for future retraining (6.1.7). This creates a feedback loop where challenging or error-prone cases are flagged and preserved for manual review and future model improvement. If the output passes quality checks, predictions and system logs are archived (6.1.8) to support auditability and post hoc analysis, with results documented in Doc61_AutomaticMonitoringReport (6.1.9). This ensures that even automated outcomes remain fully transparent and traceable.
3.7.2. Gate 6 - Monitoring Governance Check
A formal checkpoint Gate 6 (6.2.1) assesses whether the deployed forecasting system continues to meet operational, quality, and compliance requirements. This governance gate functions at a broader level than technical checks, confirming that:
- Output predictions remain within acceptable accuracy ranges.
- Documents are recorded according to the pipeline.
- Operational and monitoring workflows are compliant and auditable.
- Risks are identified and acceptable.
- No unresolved anomalies or system failures persist.
Successful evaluations generate Doc62_Phase6Report (6.2.2) and return the system to passive monitoring. Failures trigger escalation and issue resolution procedures, creating Doc63_LogIssues (6.2.3) and initiating corrective actions. This may involve stakeholders investing. The update process may include tracing back to Phase 0 for re-scoping or refinement of forecasting requirements, Phase 1 for root-cause analysis in data, or Phase 4 for full model retraining, depending on diagnostic outcomes. This systematic approach ensures continuous system improvement and maintains operational reliability throughout the forecasting system's lifecycle.
3.7.3. Wait for Next Update Cycle
When no anomalies are detected, the system enters a passive monitoring state and waits for the next scheduled evaluation or update cycle (6.3). These cycles may be defined by calendar intervals (e.g., weekly, monthly) or adaptive triggers (e.g., seasonal changes, usage shifts). This state is automated and requires no manual oversight.
3.8. Stakeholder Roles and Responsibilities
The proposed energy forecasting framework operates through the coordinated involvement of five core stakeholder groups: Data Scientists and Machine Learning Engineers, Energy Domain Experts, Project Managers, DevOps and MLOps Engineers, and Compliance Officers and QA professionals. Each group contributes specialized expertise across different phases, following a structured governance approach that balances technical rigor with operational efficiency.
While all stakeholders participate collectively in Phase 0 to establish project foundation, their subsequent involvement follows a structured specialization pattern. Technical development phases (Phases 1-4) are primarily led by data scientists with domain expert validation, while operational phases (Phases 5-6) shift leadership to DevOps teams with continued compliance oversight. Project managers maintain coordination responsibilities throughout, and compliance officers provide governance checkpoints at all decision gates.
3.8.1. Responsibility Distribution and Governance Structure
Table 1 presents the comprehensive responsibility distribution across all phases, indicating primary leadership (P), active collaboration (A), consultative input (C), and governance oversight (G) for each stakeholder group.
3.8.2. Core Stakeholder Functions
Data Scientists and ML Engineers serve as primary technical architects for development phases (Phases 1-4), implementing data quality criteria established in Phase 0, executing preprocessing and feature engineering workflows, and conducting the complete model development lifecycle. Their involvement continues into operational phases with reduced intensity, focusing on production behavior verification and anomaly investigation.
Energy Domain Experts provide critical semantic validation throughout the pipeline, establishing physical system boundaries and operational constraints in Phase 0, validating technical implementations against energy system realities in Phases 1-4 (particularly EDA alignment in step 2.1.6 and feature relevance in step 3.2.5), and verifying forecast realism under production conditions in Phases 5-6.
Project Managers maintain comprehensive coordination across all phases, facilitating cross-functional collaboration, managing timelines and resources, and governing documentation standards. Their critical function involves facilitating all decision gate reviews (Gates 0-6), coordinating signoffs, managing issue escalation, and maintaining transparent documentation of project iterations and loopback procedures.
DevOps and MLOps Engineers assume primary leadership during operational phases (Phases 5-6), leading deployment infrastructure configuration, UI implementation, data pipeline establishment, and automated monitoring system implementation. Their early-phase involvement focuses on infrastructure preparation and integration readiness assessment.
Compliance Officers and QA professionals ensure regulatory adherence throughout the pipeline, establishing compliance frameworks in Phase 0, providing oversight for data processing and model development activities in Phases 1-4, and validating that automated systems maintain governance and traceability standards in Phase 6.
This role-aware approach ensures that specialized expertise is applied where most critically needed while maintaining comprehensive oversight and governance throughout the forecasting pipeline development and deployment process.
4. Comparison of Existing Frameworks
To demonstrate the distinctive contributions of the proposed framework, this section presents a systematic comparison with established methodologies across six critical dimensions: structural coverage, iteration mechanisms, domain expert involvement, traceability systems, compliance management, modularity and reusability, and QA protocols. This analysis positions the proposed framework within the broader landscape of data science and MLOps methodologies while highlighting its specialized capabilities for energy forecasting applications.
Table 2 provides an overview of how the proposed framework addresses critical methodological gaps through systematic improvements across all comparative dimensions, establishing a comprehensive solution for energy forecasting applications.
The framework synthesizes strengths from existing approaches while addressing their limitations in energy forecasting contexts. It retains CRISP-DM's intuitive phase structure while incorporating MLOps' automation and technical rigor, extending both through embedded domain expertise and formal governance mechanisms that support regulatory compliance and organizational accountability.
The framework's scalability enables adaptive implementation based on project risk profiles. Exploratory forecasting initiatives may implement lightweight gate reviews, while critical infrastructure deployments can activate comprehensive validation protocols with full audit trails. This flexibility ensures governance benefits are accessible across diverse energy forecasting applications while maintaining methodological consistency and traceability standards.
Through this systematic integration of technical rigor, domain expertise, compliance management, and adaptive governance, our framework provides a comprehensive methodological foundation specifically designed for the complex requirements of energy forecasting applications in contemporary regulatory and operational environments.
5. Case Study
This case study demonstrates the practical application of the proposed framework through a real-world building electricity usage prediction project. The implementation focuses on short-term forecasting of hourly electricity consumption for University of Southern Denmark (SDU) OU33 building that predicts 24-hour ahead usage patterns simultaneously.
The case study serves as a comprehensive validation of the seven-phase framework, illustrating how structured methodology enhances reproducibility, performance, and governance in energy forecasting applications. By systematically implementing each phase and decision gate, this case study demonstrates the framework's effectiveness in managing complex forecasting projects while maintaining quality control and stakeholder alignment.
5.1. Phase 0 - Project Foundation
The forecasting scope was defined as daily building-level electricity load prediction using historical and contextual data. Stakeholders specified the need for usage trend forecasting to support building-level operational planning. The project specification was established following the framework's structured approach as shown in Table 3. The project success technical criteria were defined in Table 4.
As this project was conducted for internal scientific research purposes, formal compliance requirements were minimal. Data privacy considerations were addressed through prior approval for the use of internal building datasets, ensuring no regulatory restrictions applied. The system constraints were also modest, with standard computational resources deemed sufficient to support the forecasting workloads. In terms of technical feasibility, all necessary software libraries and frameworks required for data processing, modeling, and visualization were confirmed to be available and compatible with the project’s development environment.
The project successfully passed Gate 0, satisfying all technical and governance requirements established for the foundation phase. Key artifacts generated included Doc01_ProjectSpecification detailing project scope, use case definitions, and system constraints; Doc02_RequirementsCriteria establishing measurable technical and functional objectives; and Doc04_SystemTechFeasibilityReport summarizing resource availability and infrastructure readiness. As this constituted an internal research project with no external regulatory obligations, formal compliance documentation was not required. Doc05_Phase0Report documented the comprehensive review process and confirmed successful gate passage. Following risk assessment and issue evaluation, the project received approval to advance to Phase 1.
5.2. Phase 1 - Data Foundation
The data source included hourly electricity usage as the target variable, complemented by weather features (temperature, humidity, pressure, etc.). Raw electricity consumption data were sourced from the building management system, and external weather data were retrieved via trusted APIs. Initial quality checks revealed data completeness: 33,957 records, 96.80% for electricity data and 34,406 records, 98.00% for weather data over the 2021–2024 time range. Figure 10 presents a visualization of the electricity data. To enhance clarity, extreme outliers have been removed from this figure. Figure 11 shows key weather variables, including time series data for temperature, humidity, wind speed, and precipitation. A data quality assessment confirmed that missing values were randomly distributed, with no systematic gaps, allowing imputation strategies to be deferred to the preprocessing phase. All datasets were aligned to a common hourly time resolution separately, and no critical schema or structural issues were detected.
In the Data Ingestion & Validation workflow, the datasets were loaded, integrated, and consolidated into a unified time series. All sources were synchronized to a shared hourly timestamp index, and value ranges and data types were validated to confirm integrity. The data range is from: 2021-01-01 00:00:00 to 2024-12-31 23:00:00. In the integrated dataset, 94.90% of records are available from both sources. The resulting integrated dataset formed a coherent foundation for downstream exploratory analysis and feature generation. The data quality was further validated, with the same data coverage as they originally are.
The project successfully passed Gate 1 – Data Acquisition Ready, with all internal decision points validated against predetermined criteria. Phase deliverables comprised raw electricity and weather datasets, along with a fully integrated dataset structured as a unified hourly time series. Supporting documentation included Doc11_DataSourceInventory providing comprehensive dataset provenance tracking, Doc12_InitialDataQualityReport documenting initial quality assessments, Doc13_DataQualityValidationReport validating integrated data quality, and Doc14_IntegrationSummary detailing the complete integration methodology. Doc15_Phase1Report documented the comprehensive phase completion and stakeholder validations. With a complete, traceable, and auditable data foundation established, and no unacceptable risks or outstanding compliance requirements identified, the project received authorization to proceed to Phase 2.
5.3. Phase 2 - Data Understanding & Preprocessing
Phase 2 focuses on transforming the raw and integrated datasets into analysis-ready inputs through systematic exploratory analysis, domain knowledge validation, and structured preprocessing. In the EDA (2.1) workflow, initial investigations revealed recognizable consumption patterns partially consistent with university building operations. Daily cycles showed peak usage during working hours (at 2pm) and reduced load during nighttime periods (low at 5 am). Weekly patterns indicated a clear dip in usage over weekends, with 0.79 weekend usage ratio. However, seasonal patterns in the electricity data were not clearly observable, which may be due to a combination of factors, including the variable occupancy typical of a campus office, nearby construction activities, and data collection issues. Correlations with weather variables such as solar radiation and humidity can be observed but were weak and inconsistent, limiting their predictive value at this stage. Figure 12 shows the visualization of the EDA output.
In the Data Cleaning & Preprocessing (2.2) phase, systematic procedures were implemented to address data quality issues while preserving critical temporal and energy system patterns. A multi-method approach was employed for comprehensive outlier identification, incorporating range-based methods, Z-score analysis [40], and interquartile range (IQR) detection [41]. This systematic approach identified 24,416 anomalous data points across the electricity and weather-related datasets. These values were set to NaN to facilitate subsequent imputation.
Missing data were addressed through a hierarchical imputation framework designed to maintain temporal consistency. Short-term gaps of less than 3 consecutive hours were treated using extended linear interpolation to preserve local trends, while extended gaps utilized prior period pattern imputation leveraging historical seasonal patterns. Specialized edge case handling was applied for dataset temporal boundaries. Additionally, seasonal fallback procedures were employed to address other residual data gaps. The imputation process addressed a total of 41,232 missing data points across 15 features. Specifically, 58 values were filled using edge fill, 2,960 through expanded linear interpolation, 33,878 via the prior-period filling method, and 4,336 using a seasonal fallback approach. The resulting dataset achieved 100% completeness, with no range or consistency violations detected. Furthermore, it successfully passed pattern validation checks, confirming the preservation of key characteristics of the underlying energy system. Figure 13 illustrates representative examples of the gap-filling methodology and validation results.
The project successfully passed Gate 2 – Preprocessing OK, with all internal decision points validated against established criteria. The final cleaned dataset demonstrated complete alignment with domain understanding and quality requirements, confirming preservation of critical energy system patterns. Phase deliverables comprised cleaned datasets with verified temporal integrity, along with comprehensive supporting documentation including Doc21_EDAReport providing EDA findings, domain knowledge validation summaries confirming energy system alignment, detailed data cleaning procedure documentation, and Doc22_DataCleaningReport validating final data quality. Doc23_Phase2Report documented the complete preprocessing phase activities and domain expert validations. With all outputs validated, documented, and appropriately versioned for traceability, the project received authorization to advance to Phase 3.
5.4. Phase 3 - Feature Engineering
The Feature Engineering & Creation (3.1) workflow transformed 16 input variables into 140 comprehensive features. The process employed domain-aware design principles tailored for university office building energy patterns, incorporating Danish localization for holidays and cultural patterns, weather-energy physics relationships, and multi-scale temporal pattern recognition. Weather feature engineering utilized threshold-based categorization for hot/cold and humidity classifications, physics-based interactions for apparent temperature and comfort indices and change detection for day-to-day weather variations. Temporal features employed cyclical sin/cos transformations to preserve temporal continuity across hour, day, month, and seasonal cycles. Lag features exploited strong temporal autocorrelation through usage, moving averages, and trend comparisons. Interaction features captured context-dependent effects such as temperature impacts during different occupancy periods. The intelligent missing value handling strategy eliminated gaps in derived features through forward-fill techniques and same-hour substitutions, achieving 100% feature completeness without requiring imputation.
The Feature Analysis & Selection (3.2) process evaluated 133 features (after removing redundant features with >0.99 correlation) using a comprehensive multi-methodology approach. Features were categorized into five groups: interaction features, weather features, temporal features, calendar features, and lag features. To enable appropriate correlation analysis, they were further classified as either continuous (71 features) or categorical (62 features), based on predefined unique value thresholds. Continuous features were assessed using Pearson correlation [42] and mutual information [43], while categorical features were evaluated using effect size [44] measures and mutual information. All metrics were normalized to [0,1] range using min-max scaling to enable fair comparison, with composite scores calculated as 0.5×primary_metric + 0.5×mutual_information for both feature types. The analysis revealed that lag features demonstrated the highest predictive power, with usage_seasonal_deviation achieving the top composite score of 0.97, followed by usage_ma_3h (0.78) and usage_lag_1h (0.71). Overall features analysis shows in Figure 14.
Category-wise feature ranking shows in Figure 15 and Figure 16. The feature selection strategy adopted a balanced approach by selecting the top 10 features from each category, except for interaction features, which included only 9. This resulted in a total of 49 final features, ensuring comprehensive domain representation while enhancing predictive performance.
Gate 3 Decision: The project successfully passed Gate 3 – Features OK, with all internal decision points validated against established criteria. The feature engineering process achieved comprehensive domain coverage while maintaining statistical rigor. Phase deliverables comprised the complete feature-engineered dataset with verified temporal integrity, along with comprehensive supporting documentation including Doc31_FeatureCreationReport detailing the engineering methodology and feature derivation logic, Doc32_FeatureSelectionReport providing statistical analysis and selection rationale. Doc33_Phase3Report documented the complete feature engineering phase activities and validation confirmations. With all outputs validated, documented, and appropriately versioned for traceability, and strong feature importance patterns confirmed across all domain categories, the project received authorization to advance to Phase 4.
5.5. Phase 4 - Model Development & Evaluation
The model scoping (4.1) workflow identified candidate models spanning statistical, ML, and DL categories according to established project specifications. The structured model library encompassed four models: recurrent neural network (RNN) [45], long short-term memory (LSTM) [46], Transformer [47], and extreme gradient boosting (XGBoost) [48]. Doc41_CandidateExperiments documented the comprehensive experimental design including 124 feature exploration experiments across all combinations of 5 feature categories, and 312 hyperparameter tuning experiments focusing on the most promising model-feature combinations.
The final data preparation (4.2) workflow transformed the selected 49 features into model-ready formats through the EnergyDataset class, which provided automatic column detection for datetime and target variables, configurable time series windowing, and PyTorch [49] compatible tensor generation. Data transformation employed time-aware splitting with configurable ratios (70% training, 20% validation, 10% test) while maintaining strict temporal ordering to prevent data leakage. Scaling strategies were differentiated by model architecture: MinMaxScaler [50] fitted exclusively on training data for neural networks, unscaled data for tree-based models. Comprehensive validation checks confirmed no data leakage between splits, proper temporal ordering, feature consistency across datasets, and scaling parameter isolation to training data only. The process generated persistent, reproducible splits with JavaScript Object Notation (JSON)-based configuration storage, enabling consistent experiment tracking and model comparison. Doc42_DataPreparationSummary documented the complete transformation pipeline, scaling parameters, and model-specific adaptations for the 35,064 hourly observations spanning 2021-2024.
Model Training and Evaluation workflow (4.3) conducted exhaustive feature combination exploration, testing all 4 models against all combinations of five groups feature sets, including lag features, time features, weather features, calendar features and interaction features. This comprehensive exploration revealed that lag+time emerged as the most consistently successful combination (appearing in 4 models' top 3). The systematic testing identified model-specific feature preferences: RNN and LSTM excelled with simple lag+time combinations, tree-based models demonstrated superior weather feature integration, and attention-based models showed unique affinity for calendar features. The results of the trained model artifacts were stored, and the model training report Doc43_ModelTrainingReport was generated.
Model Refinement (4.4) focused exclusively on hyperparameter optimization using only the proven top 3 feature combinations identified for each model, executing 312 targeted experiments to maximize performance potential. The refinement process optimized model-specific architectural parameters: neural networks explored window sizes (72, 168 hours), hidden dimensions (128, 256), layer configurations (2, 3), learning rate (1e-4, 5e-5) and dropout rates (0.2, 0.3); tree-based models optimized estimator counts (100, 200), maximum depths (3,6), and learning rates (0.01, 0.1). Each model was optimized using its optimal feature sets from step 4.3. This targeted approach achieved meaningful gains: Transformer 10.45% (1.21 kWh → 1.08 kWh), LSTM 5.82% (1.22 kWh → 1.15 kWh), RNN 4.96% (1.10 kWh → 1.05 kWh) in terms of root mean square error (RMSE) [51]. The tree model XGBoost improved 0.16% (1.14 kWh → 1.13 kWh), indicating the feature choices in previous step were already near-optimal for trees.
The final consolidation workflow (4.5) conducted comprehensive statistical analysis and visual comparisons across all 436 experiments to identify the optimal deployment model. Performance analysis revealed RNN as the top-performing model, representing 6 of the top 10 experiments. The best RNN configuration achieved RMSE of 1.05 kWh and mean absolute error (MAE) [52] of 0.78 kWh (lag+time, window=168, hidden=256, layers=2, dropout=0.2, lr=0.1), outperforming the best non-RNN model (Transformer, RMSE 1.08 kWh) by approximately 3.0%. Stability analysis on the top-200 subset showed Transformer as most stable by RMSE dispersion, while RNN provided the best accuracy overall. Detailed statistical validation and comparisons are provided in Doc43_ModelTrainingReport, Doc44_PerformanceAnalysisReport, and Doc45_FinalModelDocumentation specifies the final production-ready RNN (lag+time, H=24). Visualization of representative multi-step forecasts is included in Figure 17.
Gate 4 Decision: The project successfully passed Gate 4 – Model Valid, with all internal decision points validated against established performance criteria. The document Doc41_CandidateExperiments was generated to define the experimental plan, and model training proceeded accordingly. Data was successfully loaded, with appropriate preprocessing techniques applied to different model types. No data leakage was detected during the process. The full data loading workflow is documented in Doc42_DataPreparationSummary. Model development met all predefined accuracy thresholds. Results from the training runs were recorded, and a summary report was compiled in Doc43_ModelTrainingReport. Deployment-ready configurations and analyses are captured in Doc44_PerformanceAnalysisReport and Doc45_FinalModelDocumentation. Doc46_Phase4Report documented the complete model development phase with stakeholder validations and performance confirmations. With demonstrated model validity, comprehensive documentation through transparent model selection process, identified and accepted risks, and no unresolved technical issues, the project received authorization to advance to Phase 5 deployment activities.
5.6. Phase 5 - Deployment & Implementation
The deployment preparation workflow (5.1) initiated with validation of the selected RNN model using lag+time features, confirming expected RMSE 1.05 kWh maintained consistency in production environments. Infrastructure configuration established cloud deployment with 8-core central processing unit (CPU), 16 gigabytes of random-access memory (RAM), and optional graphics processing unit (GPU) support achieving target processing times under 5 seconds for daily forecast generation. Basic authentication and APIs access were implemented for 7-day rolling forecast operations using past 168 hours to predict next 24 hours. Integration testing validated model compatibility with 21 input features and confirmed system readiness for operational deployment.
The interface development (5.2) implemented a web dashboard displaying daily 24-hour consumption forecasts with sample hourly values ranging from 8-13 kWh. The interface featured time-series visualizations showing individual forecast RMSE over time and key period comparisons between forecasts and actual values. Functionality validation confirmed correct rendering across browsers and daily data refresh capabilities for 7-day rolling forecast cycles.
The data integration established connections to sensor networks providing continuous 168-hour historical data windows for daily forecast generation in step Data Connection (5.3). Primary data sources are from the internal databases for historical energy consumption. Basic data quality checks ensured input consistency with the model's 21-feature specification including time-based features (hour, day, week, year cycles) and lag-based consumption history.
Deployment launched a containerized forecasting service generating 7 daily rolling forecasts, each producing 24-hour predictions at 00:00 in step System Deployment (5.4). Initial production runs generated sample forecasts with values like 9.68 kWh, and 9.77 kWh for Day 1, demonstrating operational capability across the energy usage range of 8-13 kWh. System validation confirmed zero runtime errors and successful generation of rolling forecast visualizations. Basic deployment documentation included APIs specifications and operational procedures for the 7-day forecast cycle.
Gate 5 Decision: The project successfully passed Gate 5 – Deployment OK, with all operational readiness criteria satisfied and comprehensive system validation completed. The forecasting system demonstrated functional UIs with confirmed usability testing, stable data pipeline connections, and validated prediction outputs meeting accuracy requirements within production constraints. Phase deliverables comprised production-ready RNN model deployment with verified performance metrics, comprehensive deployment documentation including Doc51_DataConnectionReport and Doc52_DeploymentReport. Doc53_Phase5Report was generated to fully record the evaluation of gate 5. With deployment phase completion validated through systematic testing and stakeholder acceptance, the project received authorization to advance to Phase 6 automated monitoring operations.
5.7. Phase 6 - Automated Monitoring & Update
Automated Monitoring (6.1): The monitoring system initiated daily operations collecting 168-hour data windows from sensor networks every morning at 00:00. Data preprocessing maintained consistency with the 21-feature model specification, generating 24-hour forecasts integrated into dashboard visualizations. Quality assessment evaluated each daily prediction against the rolling forecast RMSE of 1.28 kWh and MAE of 0.99 kWh. Predictions meeting quality criteria proceeded to archival, while outputs exceeding the RMSE degradation threshold of 25% from baseline triggered alert mechanisms and diagnostic logging for investigation. Figure 18 presents the forecast RMSE trend over time alongside key forecast periods compared with the corresponding actual values for the deployed model.
Gate 6 Decision (6.2): The project successfully passed Gate 6 – Monitoring Governance Check. System metrics confirmed sustained accuracy within the RMSE tolerance threshold. Phase deliverables comprised Store Results with performance analytics including individual forecast RMSE visualizations, and governance documentation Doc61_AutomaticMonitoringReport. Doc63_Phase6Report was generated to record the project successfully pass the decision gate 6. The automated monitoring system received approval to continue 7-day rolling forecast operations, with potential retraining in the future based on performance triggers ensuring sustained accuracy for energy management applications in step 6.3 Wait for Next Update Cycle.
6. Conclusions
This paper presents a comprehensive energy forecasting framework that addresses critical methodological gaps in existing data science and MLOps approaches. The framework systematically integrates energy domain expertise, formal governance mechanisms, and comprehensive traceability requirements to enhance the reliability and trustworthiness of energy forecasting deployments in critical infrastructure contexts.
Building upon CRISP-DM's structured methodology while incorporating MLOps automation principles, our framework introduces systematic decision gates, mandatory domain expert validation, and embedded compliance management. The seven-phase architecture (Phases 0-6) provides end-to-end coverage from project foundation through automated monitoring, with multi-stakeholder governance ensuring quality and regulatory alignment at each transition point.
The framework's formal validation mechanisms and standardized documentation requirements reduce project risks while ensuring audit readiness for regulatory compliance. Systematic energy domain expert involvement at critical checkpoints (EDA alignment, feature interpretability, model plausibility validation) ensures continuous alignment between technical implementations and energy system realities. The tool-agnostic, modular design enables consistent implementation across diverse technical environments while maintaining methodological rigor.
Future research directions include developing implementation support tools (standardized gate checklists, pipeline orchestration templates), conducting empirical validation studies comparing framework adoption outcomes across delivery metrics, and extending the methodology to broader energy informatics applications through systematic case study analysis.
As AI and data science become increasingly integrated into energy system operations and planning, robust process frameworks become as important as powerful algorithms. The proposed framework provides a balanced approach that ensures technical excellence while maintaining energy domain oversight and understanding throughout the development lifecycle.
Author Contributions
Conceptualization, bnj and zma; methodology, xuz and bnj; software, xuz; validation, xuz, bnj and zma; formal analysis, xuz; investigation, xuz; resources, bnj and zma; data curation, xuz; writing—original draft preparation, xuz; writing—review and editing, bnj and zma; visualization, xuz; supervision, bnj and zma; project administration, bnj; funding acquisition, zma. All authors have read and agreed to the published version of the manuscript.
Funding
This paper is part of the project titled “Automated Data and Machine Learning Pipeline for Cost-Effective Energy Demand Forecasting in Sector Coupling” (jr. Nr. RF-23-0039; Erhvervsfyrtårn Syd Fase 2), The European Regional Development Fund.
Conflicts of Interest
The authors declare no conflicts of interest.
Abbreviations
The following abbreviations are used in this manuscript:
| AI | Artificial Intelligence |
| APIs | Application Programming Interfaces |
| CI/CD | Continuous Integration / Continuous Delivery |
| CPU | Central Processing Unit |
| CRISP-DM | Cross-Industry Standard Process for Data Mining |
| CRISP-ML(Q) | CRISP for Machine Learning with Quality |
| DAG | Directed Acyclic Graph |
| DevOps | Development and Operations |
| DL | Deep Learning |
| EDA | Exploratory Data Analysis |
| EU | European Union |
| EU AI Act | European Union Artificial Intelligence Act |
| FIN-DM | Financial Industry Business Data Mode |
| GDPR | General Data Protection Regulation |
| GPU | Graphics Processing Unit |
| IDAIC | Industrial Data Analysis Improvement Cycle |
| ISO | International Organization for Standardization |
| IoT | Internet of Things |
| IQR | Interquartile Range |
| JSON | JavaScript Object Notation |
| LSTM | Long Short-Term Memory |
| MAE | Mean Absolute Error |
| MAPE | Mean Absolute Percentage Error |
| ML | Machine Learning |
| MLOps | Machine Learning Operations |
| NaN | Not a Number |
| QA | Quality Assurance |
| RAM | Random Access Memory |
| RMSE | Root Mean Squared Error |
| RNN | Recurrent Neural Network |
| SARIMA | Seasonal Autoregressive Integrated Moving Average |
| SDU | University of Southern Denmark |
| SHAP | Shapley additive explanations |
| TFX | TensorFlow Extended |
| UI | User Interface |
| XGBoost | Extreme Gradient Boosting |
Appendix A. Summary of Key Phase Artifacts in the Energy Forecasting Framework
The energy forecasting framework generates comprehensive documentation and datasets across seven phases. To ensure end-to-end traceability and transparency, Table A1 presents a structured summary of all phase-specific outputs, including the document ID and title, a concise description of each document’s main content, and any resulting datasets.

Table A1.
Comprehensive Phase Artifacts and Outputs
| Phase | Document ID & Title | Main Content | Output Datasets |
| Phase 0: Project Foundation | Doc01_ProjectSpecification | Defines the overall project scope, objectives, forecasting purpose, energy type, and domain. It outlines technical requirements, infrastructure readiness, and modeling preferences to guide downstream phases | / |
| Doc02_RequirementsCriteria | Details the functional, technical, and operational requirements across all project phases. It specifies accuracy targets, data quality standards, model validation criteria, and system performance thresholds | ||
| Doc03_ComplianceCheckReport | Assesses the completeness and compliance of foundational documents with institutional, technical, and regulatory standards. It evaluates workflow adherence, documentation quality, and privacy/security compliance prior to Phase 1 launch | ||
| Doc04_SystemTechFeasibilityReport | Evaluates the project's technical feasibility across system architecture, data pipelines, model infrastructure, UI requirements, and resource needs. | ||
| Doc05_Phase0Report | Summarizes all Phase 0 activities, confirms completion of key artifacts, and consolidates stakeholder approvals. It serves as the official checkpoint for Gate 0 and authorizes the transition to Phase 1. | ||
| Doc06_LogIssues | Records issues identified during Phase 0, categorized by severity and type (e.g., compliance, technical). It documents unresolved items, required actions before re-evaluation, and the feedback loop for rework. | ||
| Phase 1: Data Foundation | Doc11_DataSourceInventory | Catalogs all available internal and external data sources, assesses their availability, and verifies data loading success. | Raw energy datasets Supplementary datasets Integrated datasets |
| Doc12_InitialDataQualityReport | Conducts an initial assessment of raw data completeness, timestamp continuity, and overall timeline coverage for each source. Provides pass/fail evaluations against quality thresholds. | ||
| Doc13_DataQualityValidationReport | Validates the integrated datasets against predefined coverage and overlap thresholds. Confirms ingestion completeness, assesses quality across sources, and provides a go/no-go recommendation for proceeding to the next step. | ||
| Doc14_IntegrationSummary | Documents the data integration process, including merge strategy, record preservation logic, and overlaps between datasets. | ||
| Doc15_Phase1Report | Summarizes all Phase 1 activities including data acquisition, quality assessment, integration, and documentation. Confirms completion of Gate 1 requirements with stakeholder approvals and formally transitions the project to Phase 2. | ||
| Doc16_LogIssues | Records issues encountered during Phase 1, especially data quality-related problems and integration anomalies. Lists unresolved items, assigns responsibilities, and documents actions required before re-evaluation of Gate 1. | ||
| Phase 2: Data Understanding & Preprocessing | Doc21_EDAReport | Presents exploratory analysis of the cleaned and integrated datasets, highlighting temporal and seasonal trends, correlations with external variables, and deviations from domain expectations. Includes validation of findings against expert knowledge and system behavior. | Cleaned datasets |
| Doc22_DataCleaningReport | Documents all data cleaning procedures including outlier detection, gap filling, and context-aware imputation. Provides validation results for completeness, accuracy, and statistical consistency to confirm feature engineering readiness. | ||
| Doc23_Phase2Report | Summarizes all Phase 2 activities including exploratory analysis, cleaning, and preprocessing. Confirms all quality checks and domain alignments were met, with stakeholder sign-offs authorizing transition to Phase 3. | ||
| Doc24_LogIssues | Logs all unresolved issues identified, including those affecting data completeness and alignment with domain knowledge. Lists required corrective actions prior to re-evaluation of Gate 2. | ||
| Phase 3: Feature Engineering | Doc31_FeatureCreationReport | Details the engineering of a comprehensive feature set from raw and cleaned data using domain-informed strategies. Features were organized into interpretable categories with documented coverage, correlation structure, and quality validation. | Feature-engineered datasets Selected feature subsets Training/validation/test splits Transformed model-ready datasets |
| Doc32_FeatureSelectionReport | Summarizes feature selection process involving redundancy elimination, normalization, and scoring. Features were evaluated by category and ranked based on statistical performance and domain relevance, resulting in a final set optimized for model training. | ||
| Doc33_Phase3Report | Consolidates all Phase 3 activities including feature generation, selection, and data preparation. Confirms dataset readiness for modeling through rigorous validation checks and stakeholder sign-offs, supporting transition to Phase 4. | ||
| Doc34_LogIssues | Logs issues and challenges encountered during feature engineering, such as problems with derived variable consistency, transformation logic, or dataset leakage risks. It identifies required fixes before re-evaluation of Gate 3. | ||
| Phase 4: Model Development & Evaluation | Doc41_CandidateExperiments | Provides a comprehensive record of all candidate modeling experiments, including feature exploration and hyperparameter optimization. Summarizes tested models, feature combinations, and experimental design across forecasting horizons. | Trained model artifacts Deployment-ready model packages |
| Doc42_DataPreparationSummary | Describes the transformation of selected feature datasets into model-ready formats, including scaling, splitting, and structure adaptation for different model types. Validate reproducibility, leakage prevention, and data consistency across training and test sets. | ||
| Doc43_ModelTrainingReport | Details the end-to-end training process for all model-feature combinations, including experiment configurations, validation strategy, and training metrics. Confirms successful execution of all planned runs with results stored and traceable . | ||
| Doc44_PerformanceAnalysisReport | Presents evaluation of model performance, identifying the top-performing models based on RMSE, MAE, and efficiency metrics. Includes rankings, model category comparisons, stability assessments. | ||
| Doc45_FinalModelDocumentation | Documents the architecture, configuration, hyperparameters, and feature usage of the final selected model. Highlights performance, robustness, and production suitability based on comprehensive testing. | ||
| Doc46_Phase4Report | Summarizes all Phase 4 activities including model scoping, training, refinement, evaluation, and documentation. Confirms compliance, readiness for deployment, and fulfillment of Gate 4 acceptance criteria | ||
| Doc47_LogIssues | Records issues related to model configuration, performance discrepancies, and documentation gaps. Specifies actions required for Gate 4 re-evaluation and areas for improvement in modeling or validation. | ||
| Phase 5: Deployment & Implementation | Doc51_DataConnectionReport | Summarizes the successful establishment and validation of data connections between the system and external sources (e.g., sensors, databases, APIs). Confirms input quality, system access, and the generation of production-ready datasets for real-time or scheduled operations. | Production-ready datasets |
| Doc52_DeploymentReport | Documents the final deployment activities including system launch, interface rollout, initial prediction testing, and APIs/configuration packaging. Confirms operational readiness and system stability through validation of predictions, logs, and interface behavior. | ||
| Doc53_Phase5Report | Provides a consolidated summary of Phase 5 milestones, including deployment validation across system, data, and UI layers. Captures stakeholder approvals and confirms satisfaction of Gate 5 acceptance criteria for transition into live operation. | ||
| Doc54_LogIssues | Captures issues encountered during deployment such as interface errors, system downtime, or misconfigured outputs. Lists root causes, assigned actions, and resolution status for any system deployment failure points or rollback triggers. | ||
| Phase 6: Automated Monitoring & Update | Doc61_AutomaticMonitoringReport | Reports on the system’s automated monitoring activities including real-time data ingestion, prediction updates, and UI refreshes. Confirms performance metrics, logs operational status, and verifies ongoing model effectiveness in production. | Real-time monitoring Results e.g. Predictions, Logs Archive Hard Samples for Future Retraining |
| Doc62_UnqualifiedReport | Identifies and documents cases where prediction outputs fall below acceptable quality thresholds. Flags performance degradation, specifies unqualified data samples, and archives cases for potential future retraining or manual review. | ||
| Doc63_Phase6Report | Summarizes all monitoring results and update cycle performance, including model consistency, drift detection, and operational stability. Confirms Gate 6 completion through governance checks and outlines next steps for continuous improvement or retraining cycles. | ||
| Doc64_LogIssues | Tracks incidents such as data stream interruptions, interface failures, or prediction anomalies. Serves as the operational log for Phase 6, capturing diagnostics, recovery actions, and escalation records. |
References
- Hong, T.; Pinson, P.; Wang, Y.; Weron, R.; Yang, D.; Zareipour, H. Energy forecasting: A review and outlook. IEEE Open Access Journal of Power and Energy 2020, 7, 376–388. [Google Scholar] [CrossRef]
- Mystakidis, A.; Koukaras, P.; Tsalikidis, N.; Ioannidis, D.; Tjortjis, C. Energy forecasting: A comprehensive review of techniques and technologies. Energies 2024, 17, 1662. [Google Scholar] [CrossRef]
- Im, J.; Lee, J.; Lee, S.; Kwon, H.-Y. Data pipeline for real-time energy consumption data management and pre diction. FRONTIERS IN BIG DATA 2024, 7. [Google Scholar] [CrossRef]
- Kilkenny, M.F.; Robinson, K.M. Data quality: “Garbage in – garbage out”. Health Information Management Journal 2018, 47, 1833358318774357. [Google Scholar] [CrossRef]
- Amin, A.; Mourshed, M. Weather and climate data for energy applications. Renewable & Sustainable Energy Reviews 2024, 192, 114247. [Google Scholar] [CrossRef]
- Bansal, A.; Balaji, K.; Lalani, Z. Temporal Encoding Strategies for Energy Time Series Prediction. 2025. [CrossRef]
- Gonçalves, A.C.R.; Costoya, X.; Nieto, R.; Liberato, M.L.R. Extreme Weather Events on Energy Systems: A Comprehensive Review on Impacts, Mitigation, and Adaptation Measures. Sustainable Energy Research 2024, 11, 1–23. [Google Scholar] [CrossRef]
- Chen, G.; Lu, S.; Zhou, S.; Tian, Z.; Kim, M.K.; Liu, J.; Liu, X. A Systematic Review of Building Energy Consumption Prediction: From Perspectives of Load Classification, Data-Driven Frameworks, and Future Directions. Applied Sciences 2025, 15. [Google Scholar] [CrossRef]
- Kreuzberger, D.; Kühl, N.; Hirschl, S. Machine Learning Operations (MLOps): Overview, Definition, and Architecture. IEEE Access 2023, 11, 31866–31879. [Google Scholar] [CrossRef]
- Nguyen, K.; Koch, K.; Chandna, S.; Vu, B. Energy Performance Analysis and Output Prediction Pipeline for East-West Solar Microgrids. J 2024, 7, 421–438. [Google Scholar] [CrossRef]
- Studer, S.; Pieschel, L.; Nass, C. Towards CRISP-ML(Q): A Machine Learning Process Model with Quality Assurance Methodology. Informatics 2020, 3, 20. [Google Scholar] [CrossRef]
- Tripathi, S.; Muhr, D.; Brunner, M.; Jodlbauer, H.; Dehmer, M.; Emmert-Streib, F. Ensuring the Robustness and Reliability of Data-Driven Knowledge Discovery Models in Production and Manufacturing. Frontiers in Artificial Intelligence 2021, 4, 576892. [Google Scholar] [CrossRef]
- EverythingDevOps.dev. A Brief History of DevOps and Its Impact on Software Development. Available online: https://www.everythingdevops.dev/blog/a-brief-history-of-devops-and-its-impact-on-software-development (accessed on 13 August 2025).
- Steidl, M.; Zirpins, C.; Salomon, T. The Pipeline for the Continuous Development of AI Models – Current State of Research and Practice. In Proceedings of the Proceedings of the 2023 IEEE International Conference on Software Architecture Companion (ICSA-C), 2023; pp. 75-83.
- Saltz, J.S. CRISP-DM for Data Science: Strengths, Weaknesses and Potential Next Steps. In Proceedings of the 2021 IEEE International Conference on Big Data (Big Data), 2021, 15-18 December 2021; pp. 2337–2344. [Google Scholar]
- Pei, Z.; Liu, L.; Wang, C.; Wang, J. Requirements Engineering for Machine Learning: A Review and Reflection. In Proceedings of the 30th IEEE International Requirements Engineering Conference Workshops (RE 2022 Workshops), 2022, 2022; pp. 166-175.
- Andrei, A.-V.; Velev, G.; Toma, F.-M.; Pele, D.T.; Lessmann, S. Energy Price Modelling: A Comparative Evaluation of Four Generations of Forecasting Methods. 2024. [CrossRef]
- European, P.; Council of the European, U. Regulation (EU) 2016/679 – General Data Protection Regulation (GDPR). Available online: https://eur-lex.europa.eu/eli/reg/2016/679/oj/eng (accessed on 13 August 2025).
- European, P.; Council of the European, U. Regulation (EU) 2024/1689 – Artificial Intelligence Act (EU AI Act). Available online: https://eur-lex.europa.eu/eli/reg/2024/1689/oj/eng (accessed on 13 August 2025).
- Mora-Cantallops, M.; Pérez-Rodríguez, A.; Jiménez-Domingo, E. Traceability for Trustworthy AI: A Review of Models and Tools. Big Data and Cognitive Computing 2021, 5, 15. [Google Scholar] [CrossRef]
- Kubeflow Contributors, G. Introduction to Kubeflow. Available online: https://www.kubeflow.org/docs/started/introduction/ (accessed on 13 August 2025).
- Maxime Beauchemin, A. Apache Airflow – Workflow Management Platform. Available online: https://en.wikipedia.org/wiki/Apache_Airflow (accessed on 13 August 2025).
- Google. TensorFlow Extended (TFX): Real-World Machine Learning in Production. Available online: https://blog.tensorflow.org/2019/06/tensorflow-extended-tfx-real-world_26.html (accessed on 13 August 2025).
- Miller, T.; Durlik, I.; Łobodzińska, A.; Dorobczyński, L.; Jasionowski, R. AI in Context: Harnessing Domain Knowledge for Smarter Machine Learning. Applied Sciences 2024, 14. [Google Scholar] [CrossRef]
- Oakes, B.J.; Famelis, M.; Sahraoui, H. Building Domain-Specific Machine Learning Workflows: A Conceptual Framework for the State-of-the-Practice. ACM Transactions on Software Engineering and Methodology 2024, 33, 1–50. [Google Scholar] [CrossRef]
- Kale, A.; Nguyen, T.; Harris, F.C., Jr.; Li, C.; Zhang, J.; Ma, X. Provenance Documentation to Enable Explainable and Trustworthy AI: A Literature Review. Data Intelligence 2023, 5, 139–162. [Google Scholar] [CrossRef]
- Theusch, F.; Heisterkamp, P. Comparative Analysis of Open-Source ML Pipeline Orchestration Platforms. 2024.
- Schröer, C.; Kruse, F.; Gómez, J.M. A Systematic Literature Review on Applying CRISP-DM Process Model. Procedia Computer Science 2021, 181, 526–534. [Google Scholar] [CrossRef]
- Chatterjee, A.; Ahmed, B.; Hallin, E.; Engman, A. Quality Assurance in MLOps Setting: An Industrial Perspective; 2022.
- International Organization for, S. ISO 9001:2015 – Quality management systems — Requirements. Available online: https://www.iso.org/standard/62085.html (accessed on 13 August 2025).
- Jayzed Data Models, I. Financial Industry Business Data Model (FIB-DM). Available online: https://fib-dm.com/ (accessed on 13 August 2025).
- Shimaoka, A.M.; Ferreira, R.C.; Goldman, A. The evolution of CRISP-DM for Data Science: Methods, processes and frameworks. SBC Reviews on Computer Science 2024, 4, 28–43. [Google Scholar] [CrossRef]
- Ahern, M.; O’Sullivan, D.T.J.; Bruton, K. Development of a Framework to Aid the Transition from Reactive to Proactive Maintenance Approaches to Enable Energy Reduction. Applied Sciences 2022, 12, 6704–6721. [Google Scholar] [CrossRef]
- Oliveira, T. Implement MLOps with Kubeflow Pipelines. Available online: https://developers.redhat.com/articles/2024/01/25/implement-mlops-kubeflow-pipelines (accessed on 13 August 2025).
- Apache Software, F. Apache Beam — Orchestration. Available online: https://beam.apache.org/documentation/ml/orchestration/ (accessed on 13 August 2025).
- Boettiger, C. An Introduction to Docker for Reproducible Research, with Examples from the R Environment. 2014. [CrossRef]
- Amershi, S.; Begel, A.; Bird, C.; DeLine, R.; Gall, H.; Kamar, E.; Nagappan, N.; Nushi, B.; Zimmermann, T. Software Engineering for Machine Learning: A Case Study. In Proceedings of the 2019 IEEE/ACM 41st International Conference on Software Engineering: Software Engineering in Practice (ICSE-SEIP), 2019, 25-31 May 2019; pp. 291–300. [Google Scholar]
- High-Level Expert Group on Artificial, I. Ethics Guidelines for Trustworthy Artificial Intelligence; 2019.
- Lundberg, S.M.; Lee, S.-I. A Unified Approach to Interpreting Model Predictions. In Proceedings of the Advances in Neural Information Processing Systems (NeurIPS 2017), Long Beach, CA, USA, 4–9 December 2017; pp. 4768–4777. [Google Scholar]
- Stigler, S.M. Statistics on the Table: The History of Statistical Concepts and Methods; Harvard University Press: 2002.
- Tukey, J.W. Exploratory Data Analysis; Addison-Wesley: 1977.
- Encyclopaedia, B. Pearson’s correlation coefficient. Available online: https://www.britannica.com/topic/Pearsons-correlation-coefficient (accessed on 13 August 2025).
- Shannon, C.E. A Mathematical Theory of Communication. The Bell System Technical Journal 1948, 27, 379–423. [Google Scholar] [CrossRef]
- OpenStax. Cohen's Standards for Small, Medium, and Large Effect Sizes. Available online: https://stats.libretexts.org/Bookshelves/Introductory_Statistics/Introductory_Statistics_2e_(OpenStax)/10%3A_Hypothesis_Testing_with_Two_Samples/10.03%3A_Cohen%27s_Standards_for_Small_Medium_and_Large_Effect_Sizes (accessed on 13 August 2025).
- Elman, J.L. Finding Structure in Time. Cognitive Science 1990, 14, 179–211. [Google Scholar] [CrossRef]
- Hochreiter, S.; Schmidhuber, J. Long Short-Term Memory. Neural Computation 1997, 9, 1735–1780. [Google Scholar] [CrossRef] [PubMed]
- Vaswani, A.; Shazeer, N.; Parmar, N.; Uszkoreit, J.; Jones, L.; Gomez, A.N.; Kaiser, Ł.; Polosukhin, I. Attention Is All You Need. In Proceedings of the Advances in Neural Information Processing Systems (NeurIPS 2017), Long Beach, CA, USA, 4–9 December 2017; pp. 5998–6008. [Google Scholar]
- Chen, T.; Guestrin, C. XGBoost: A Scalable Tree Boosting System. In Proceedings of the Proceedings of the 22nd ACM SIGKDD International Conference on Knowledge Discovery and Data Mining (KDD 2016), San Francisco, CA, USA, 2016 August 13–17; pp. 785–794. [Google Scholar]
- Paszke, A.; Gross, S.; Massa, F.; Lerer, A.; Bradbury, J.; Chanan, G.; Killeen, T.; Lin, Z.; Gimelshein, N.; Antiga, L.; et al. PyTorch: An Imperative Style, High-Performance Deep Learning Library. In Proceedings of the Advances in Neural Information Processing Systems (NeurIPS 2019), 2019, (Location and dates can be added if known); pp. 8024–8035.
- scikit-learn, d. MinMaxScaler — scikit-learn preprocessing. Available online: https://scikit-learn.org/stable/modules/generated/sklearn.preprocessing.MinMaxScaler.html (accessed on 13 August 2025).
- DataCamp. RMSE Explained: A Guide to Regression Prediction Accuracy. Available online: https://www.datacamp.com/tutorial/rmse (accessed on 13 August 2025).
- Frost, J. Mean Absolute Error (MAE). Available online: https://statisticsbyjim.com/glossary/mean-absolute-error/ (accessed on 13 August 2025).
Figure 1.
High-Level Overview of the Energy Forecasting Pipeline Framework.
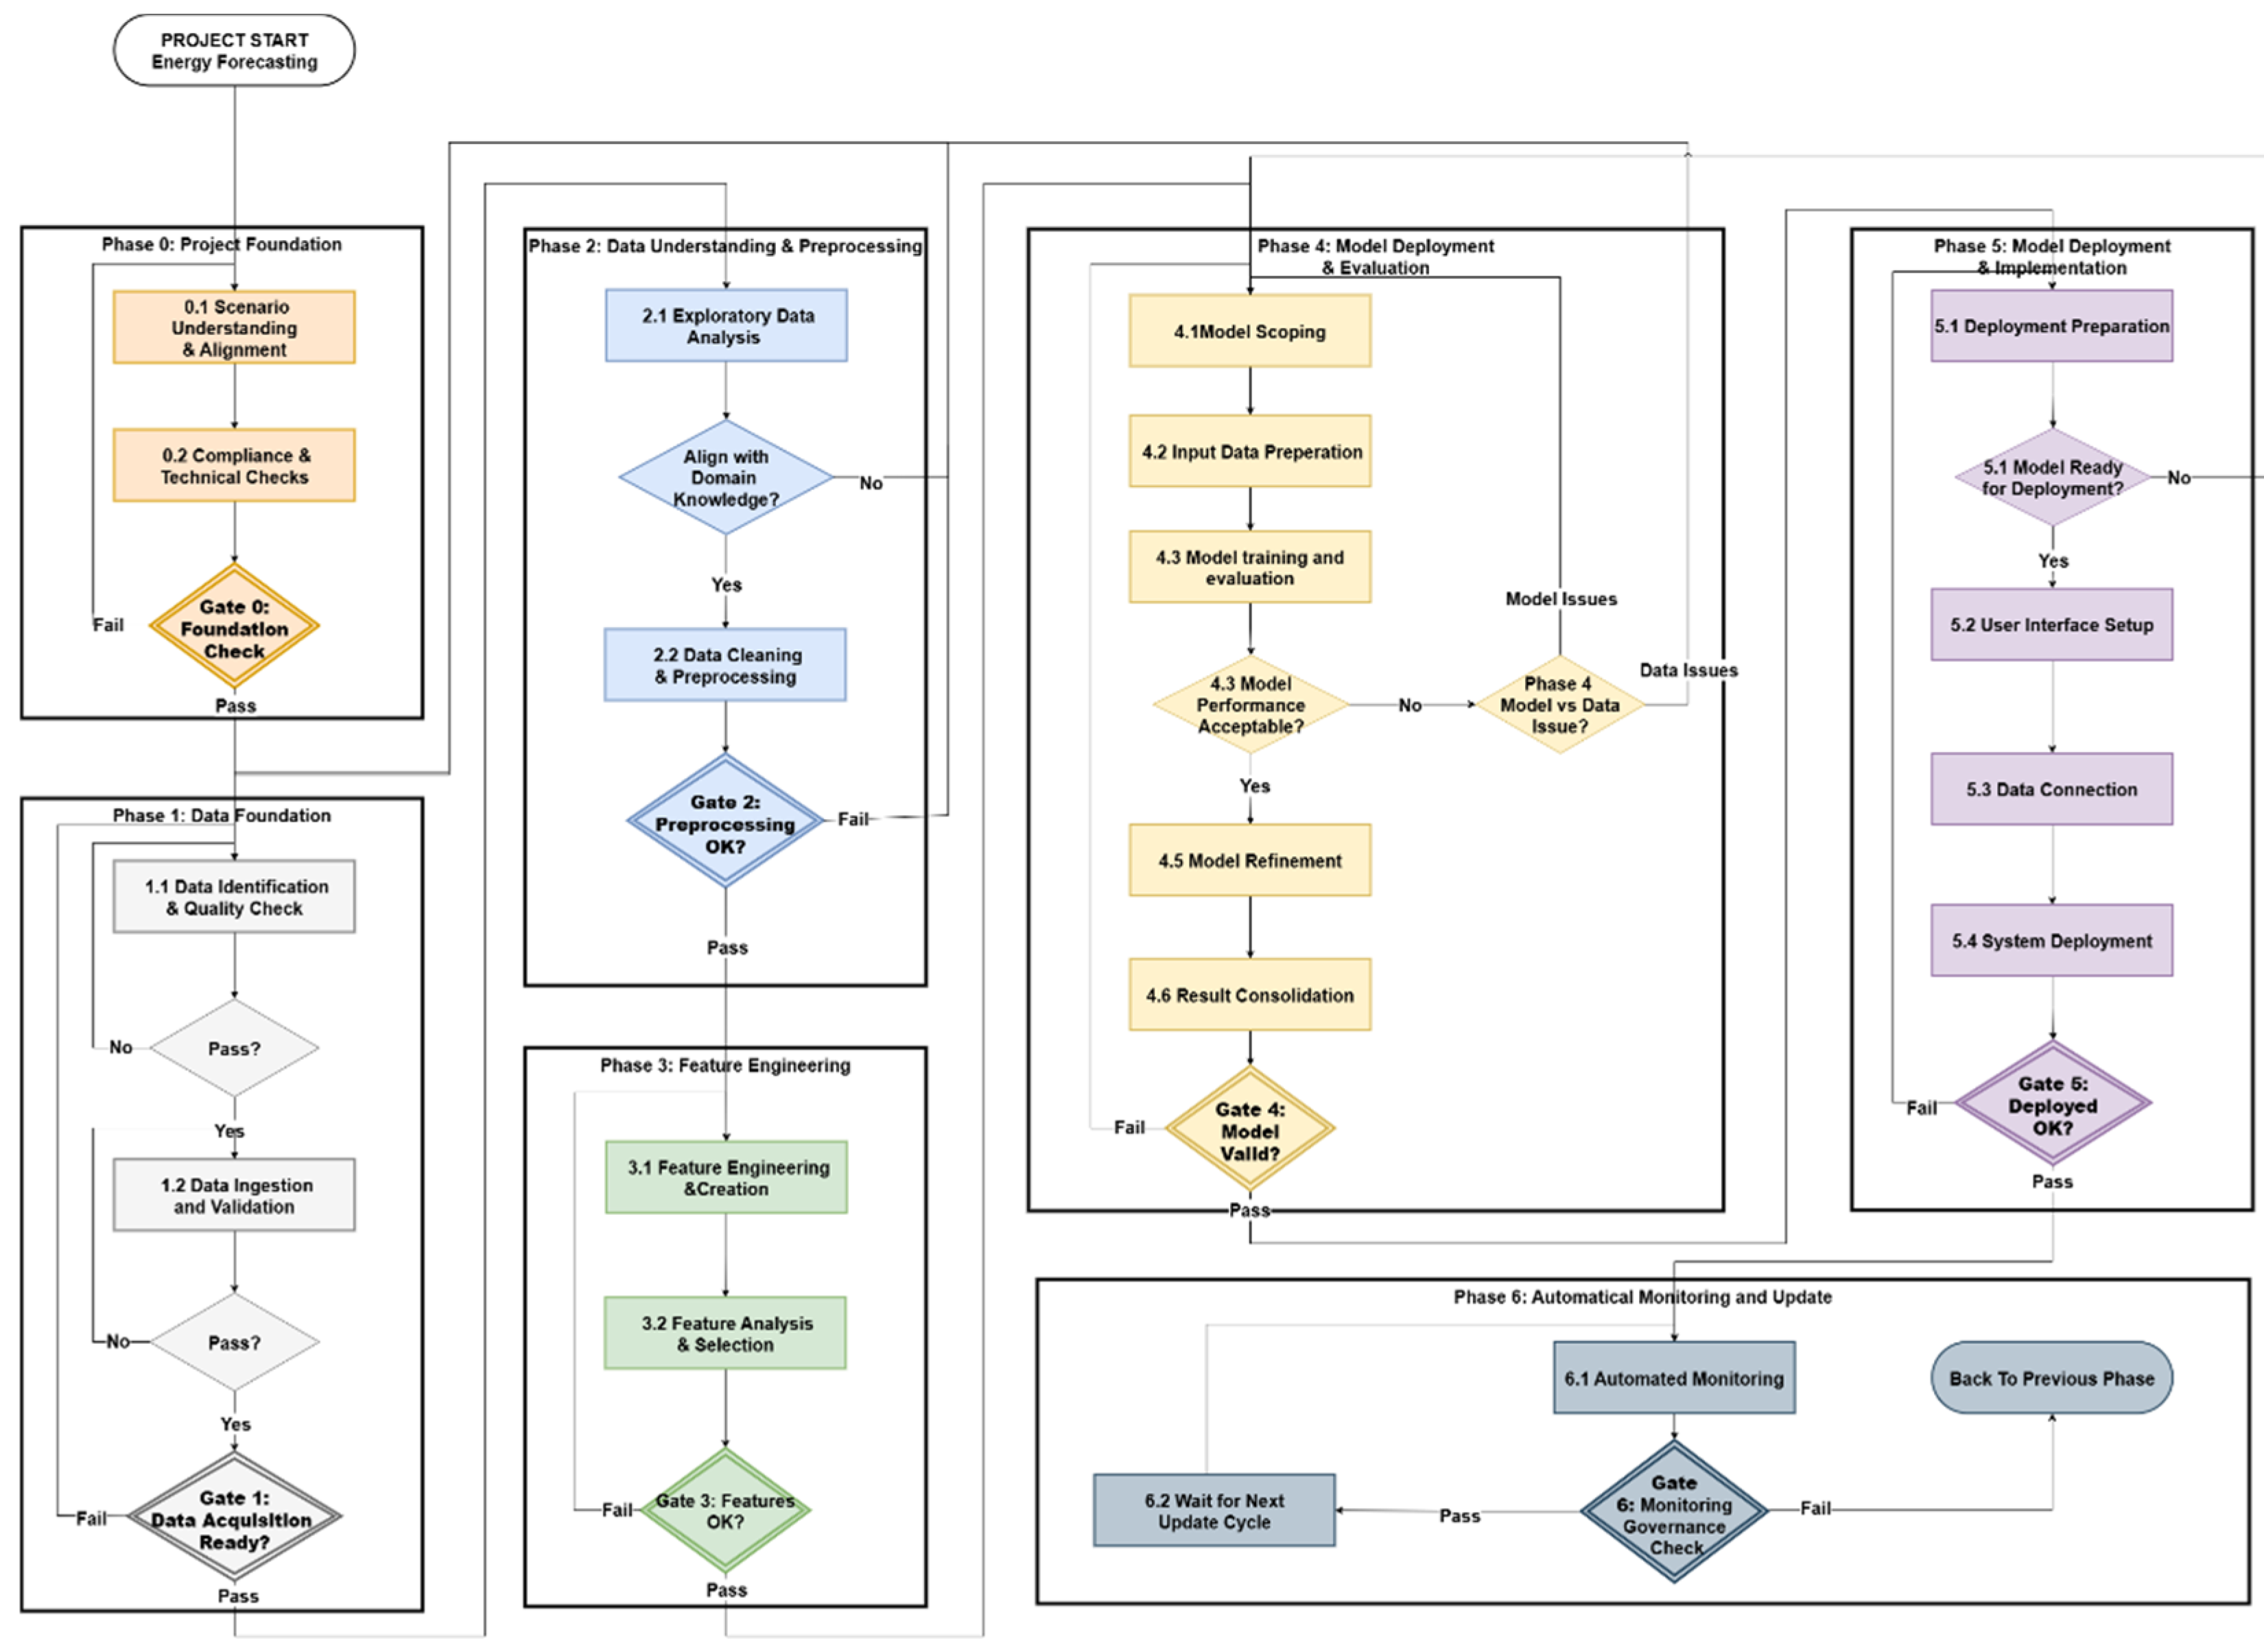
Figure 2.
Phase 0 – Project Foundation Workflow
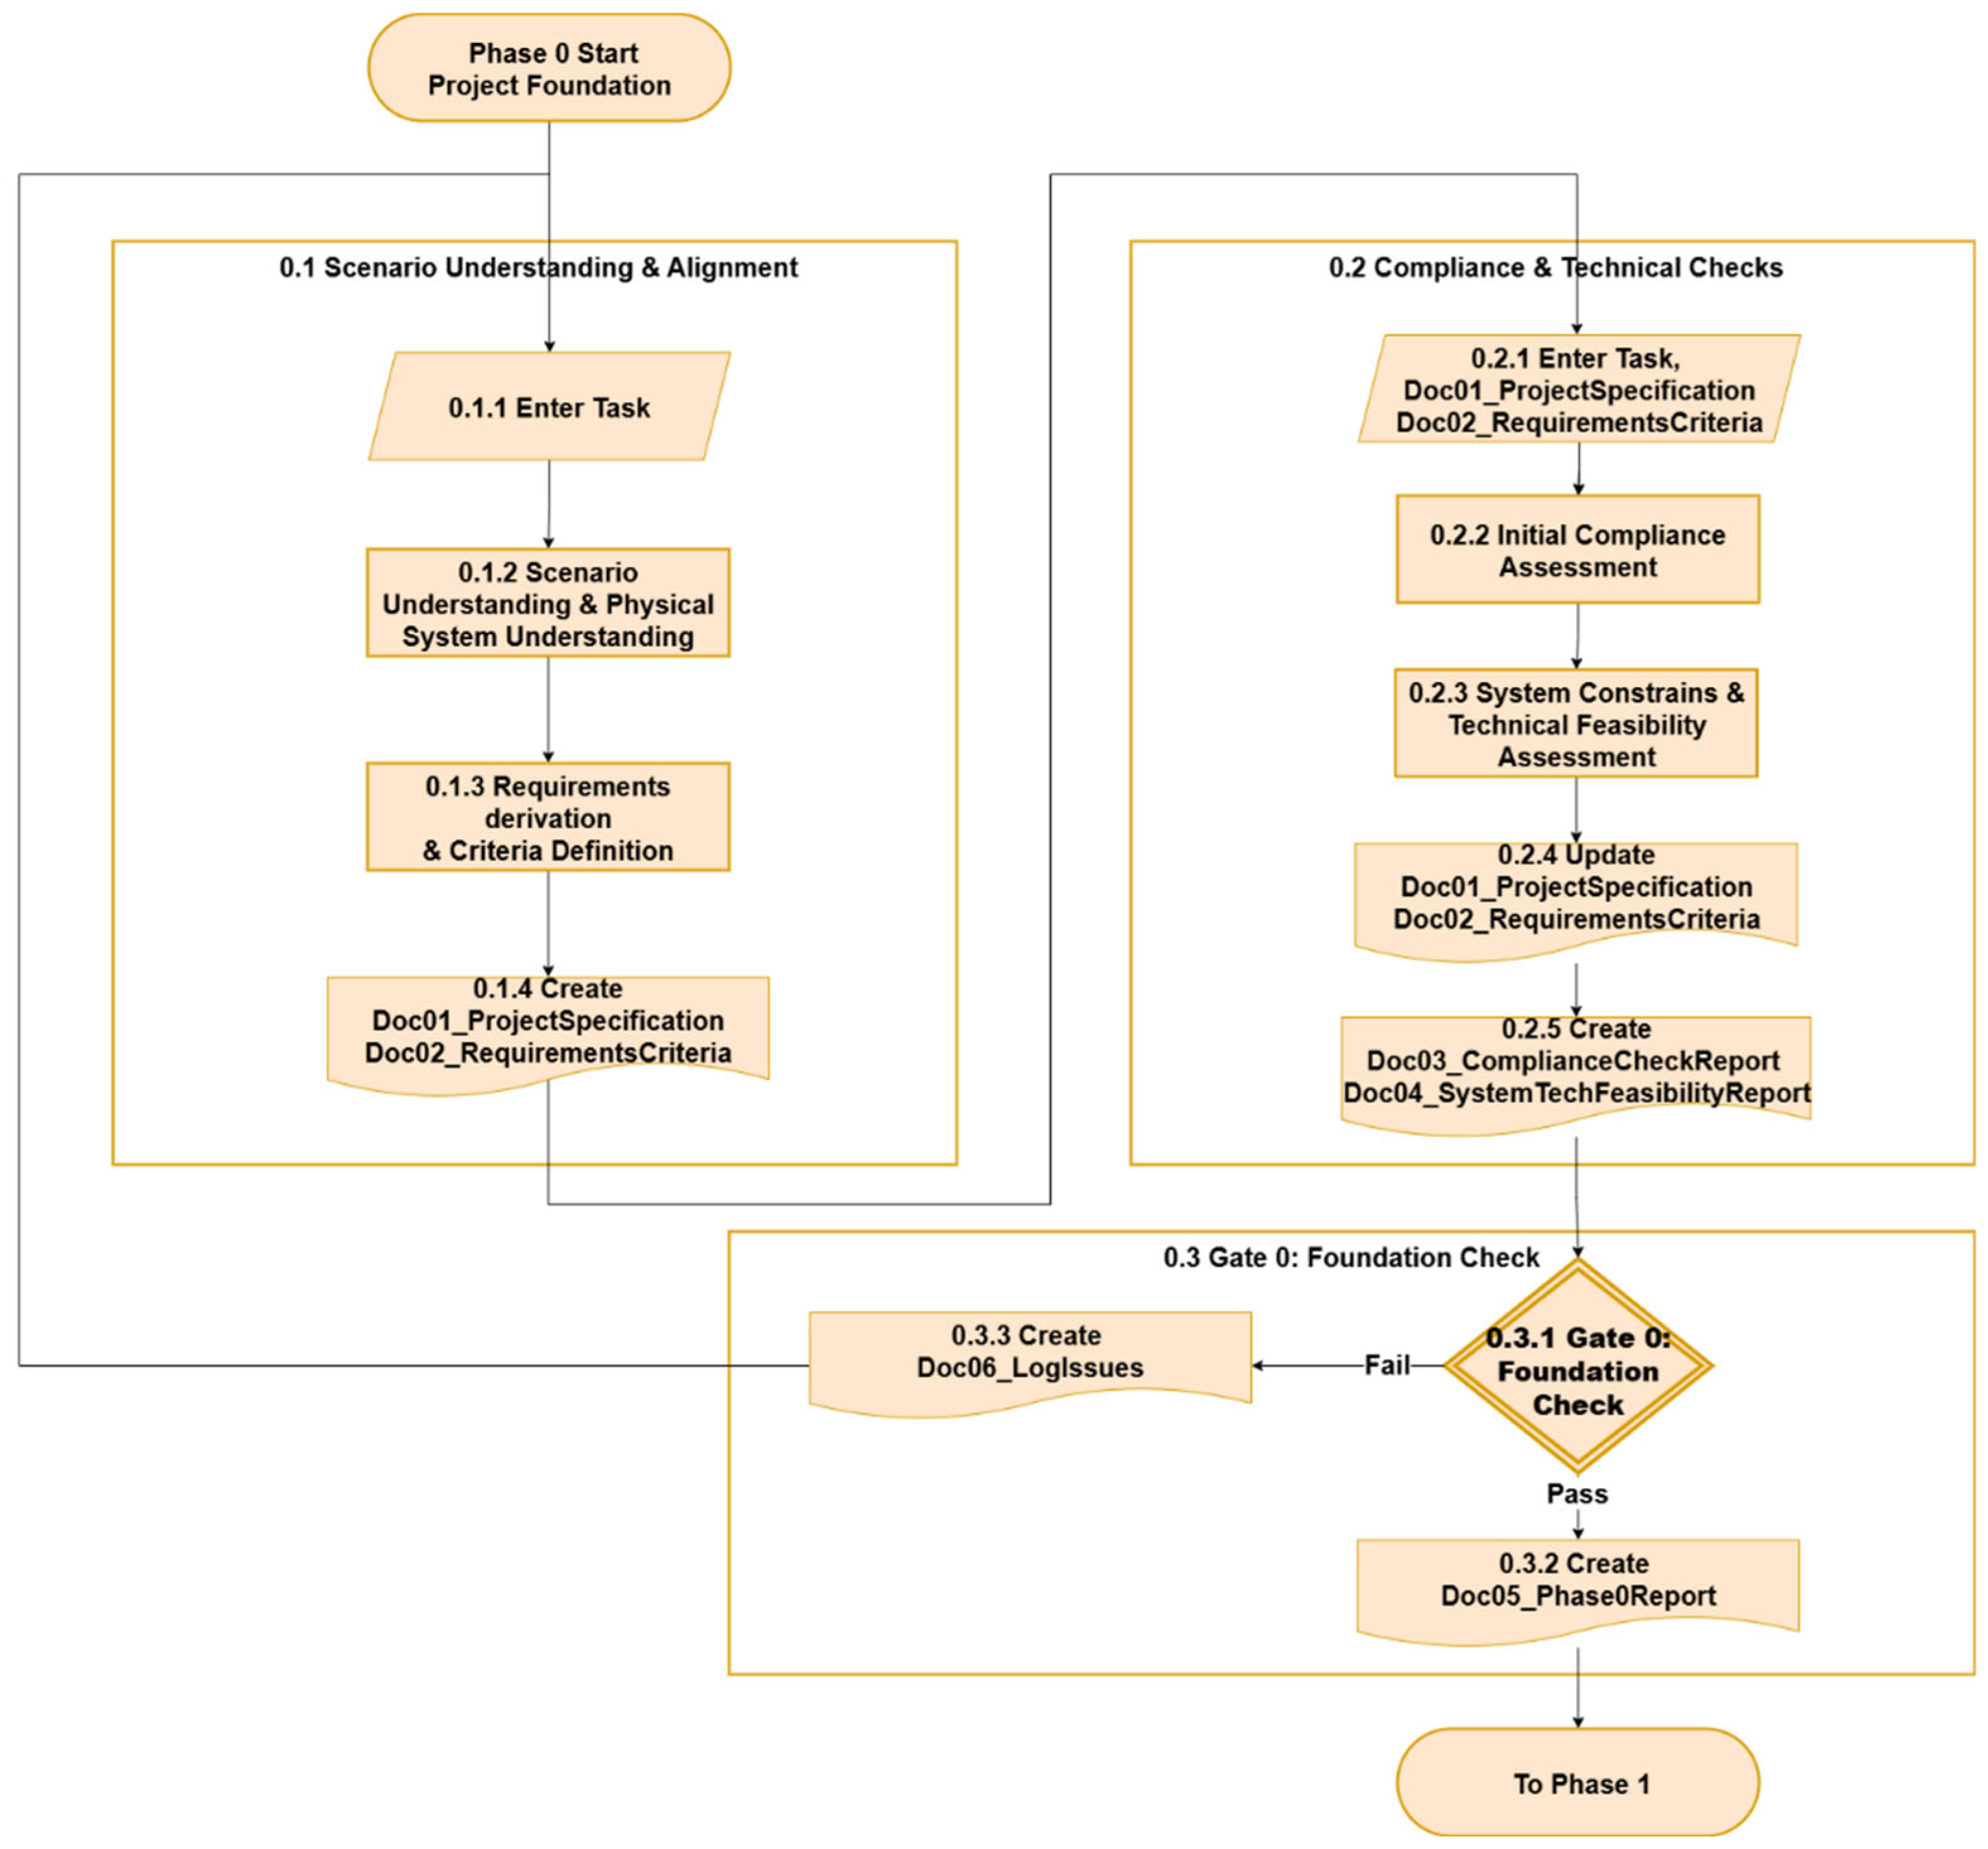
Figure 3.
Phase 1 – Data Foundation Workflow.
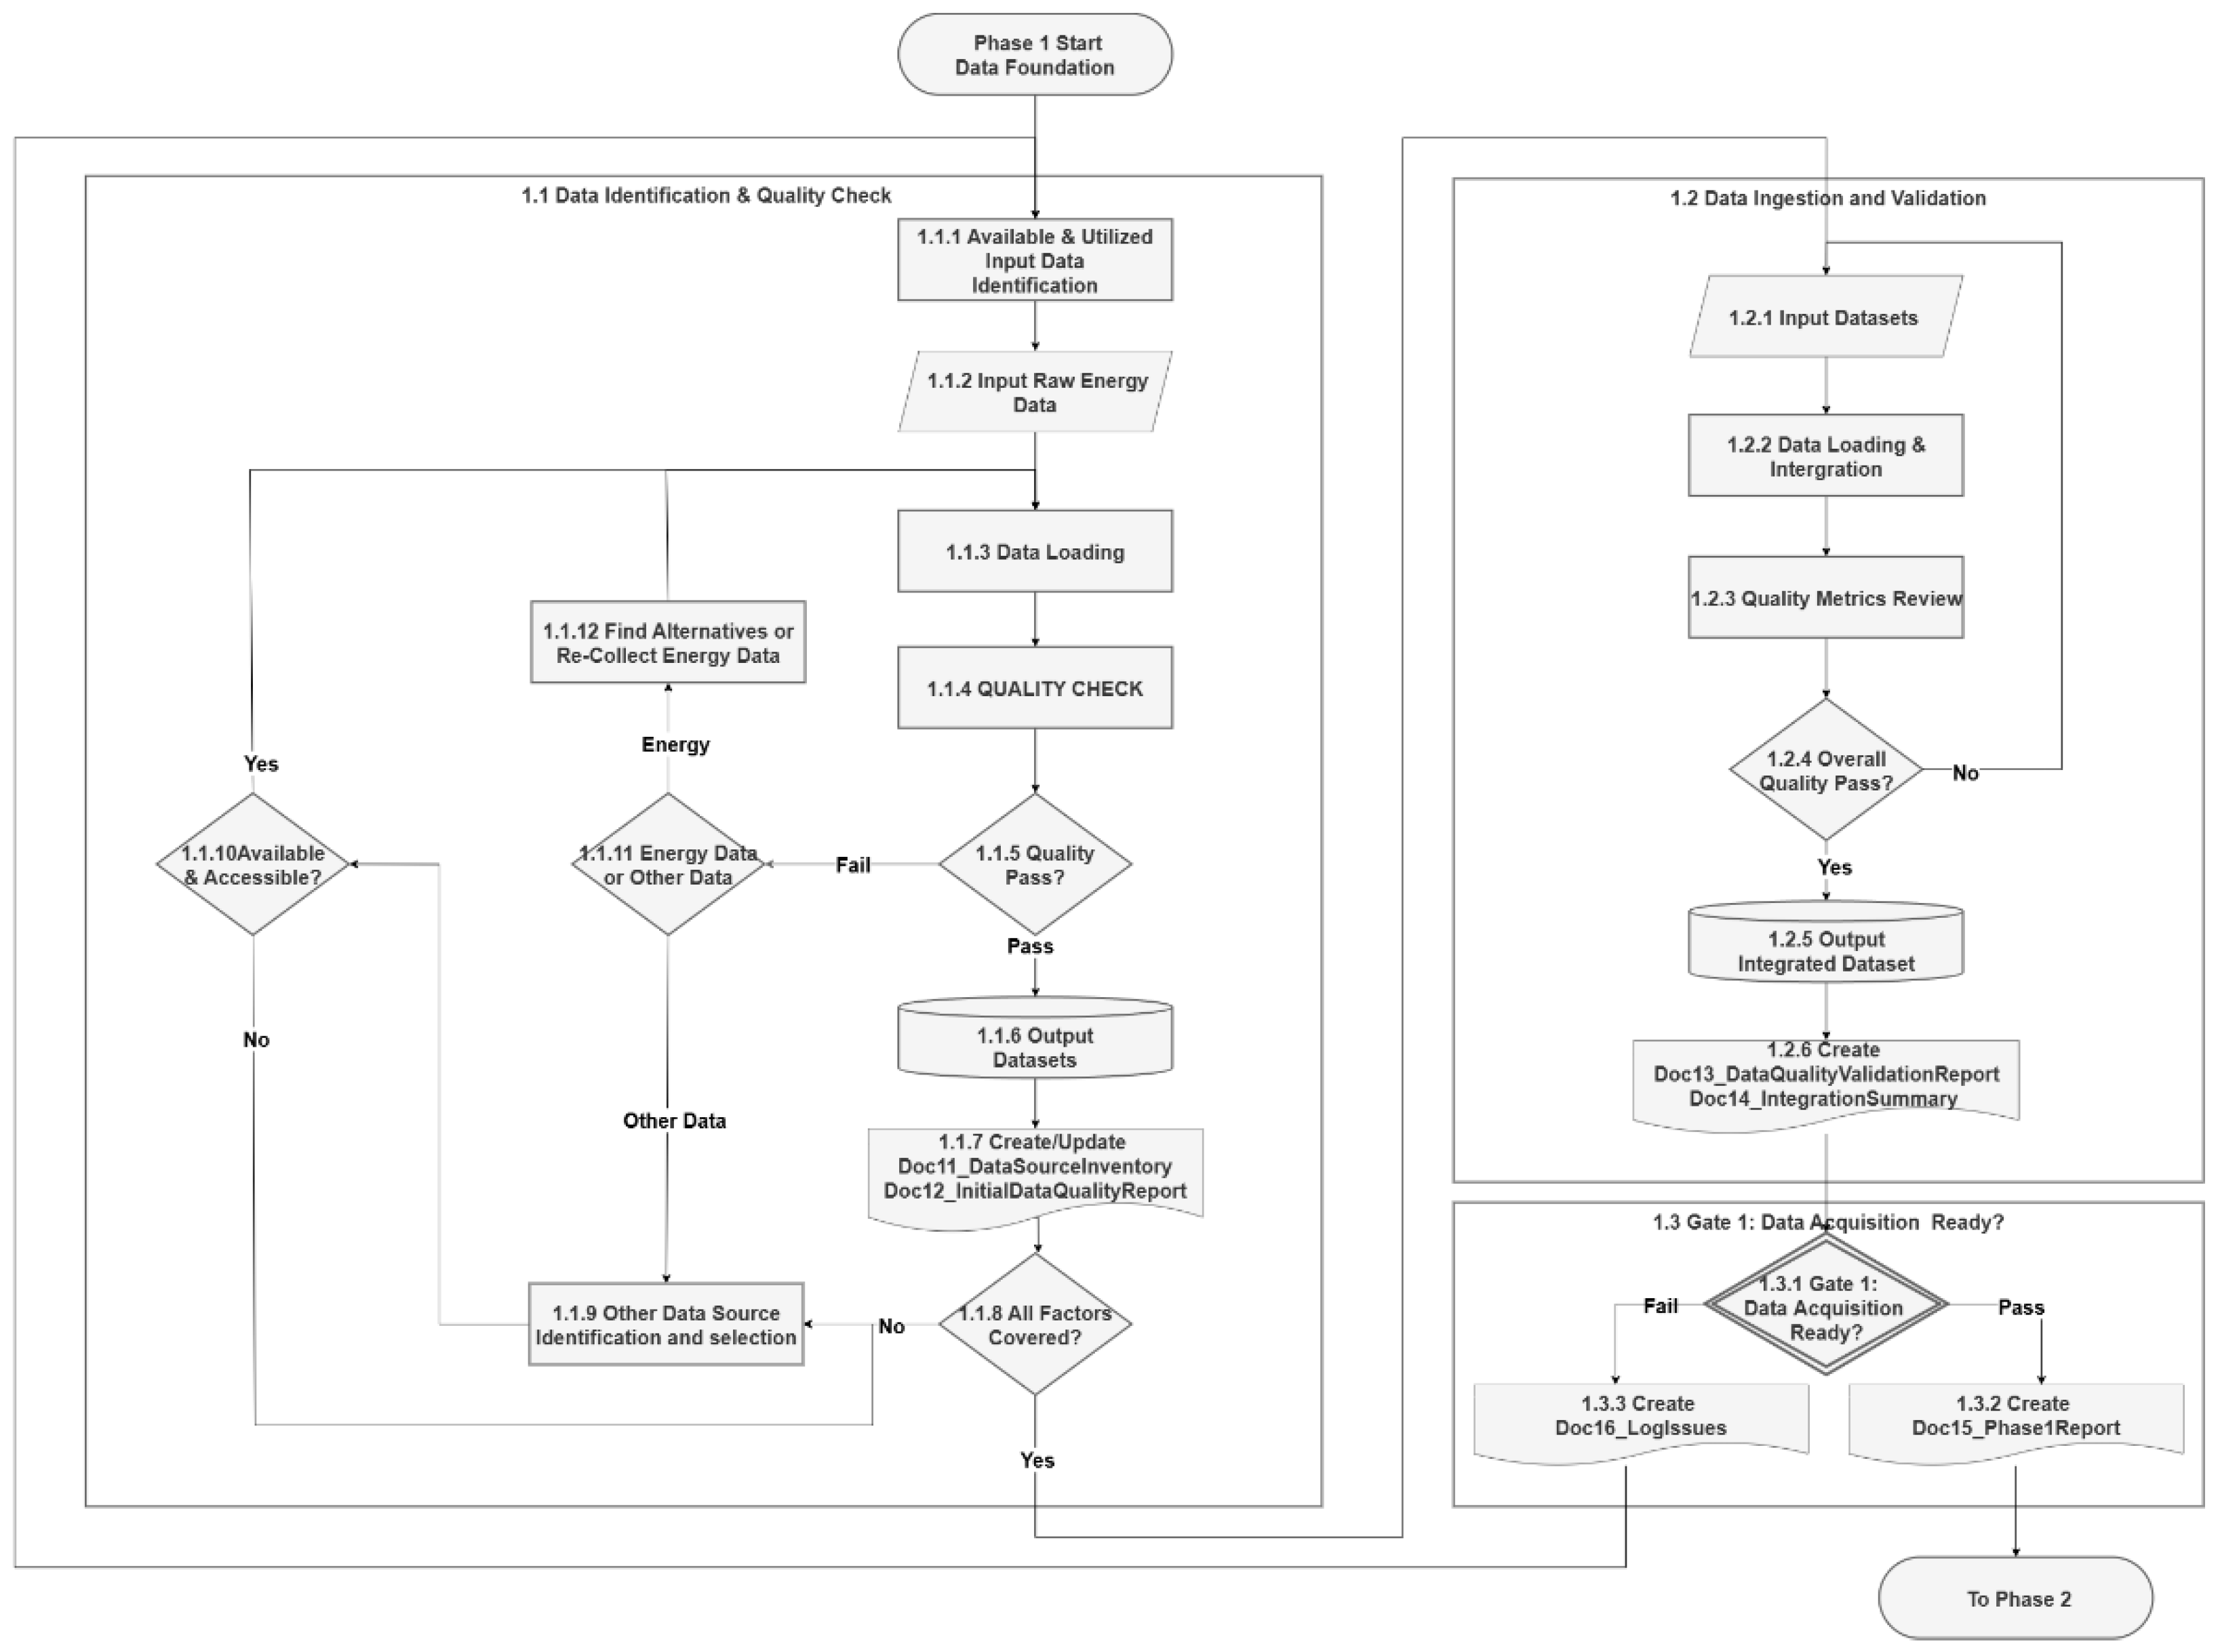
Figure 4.
Phase 1.1 – Data Quality Verification Logic.
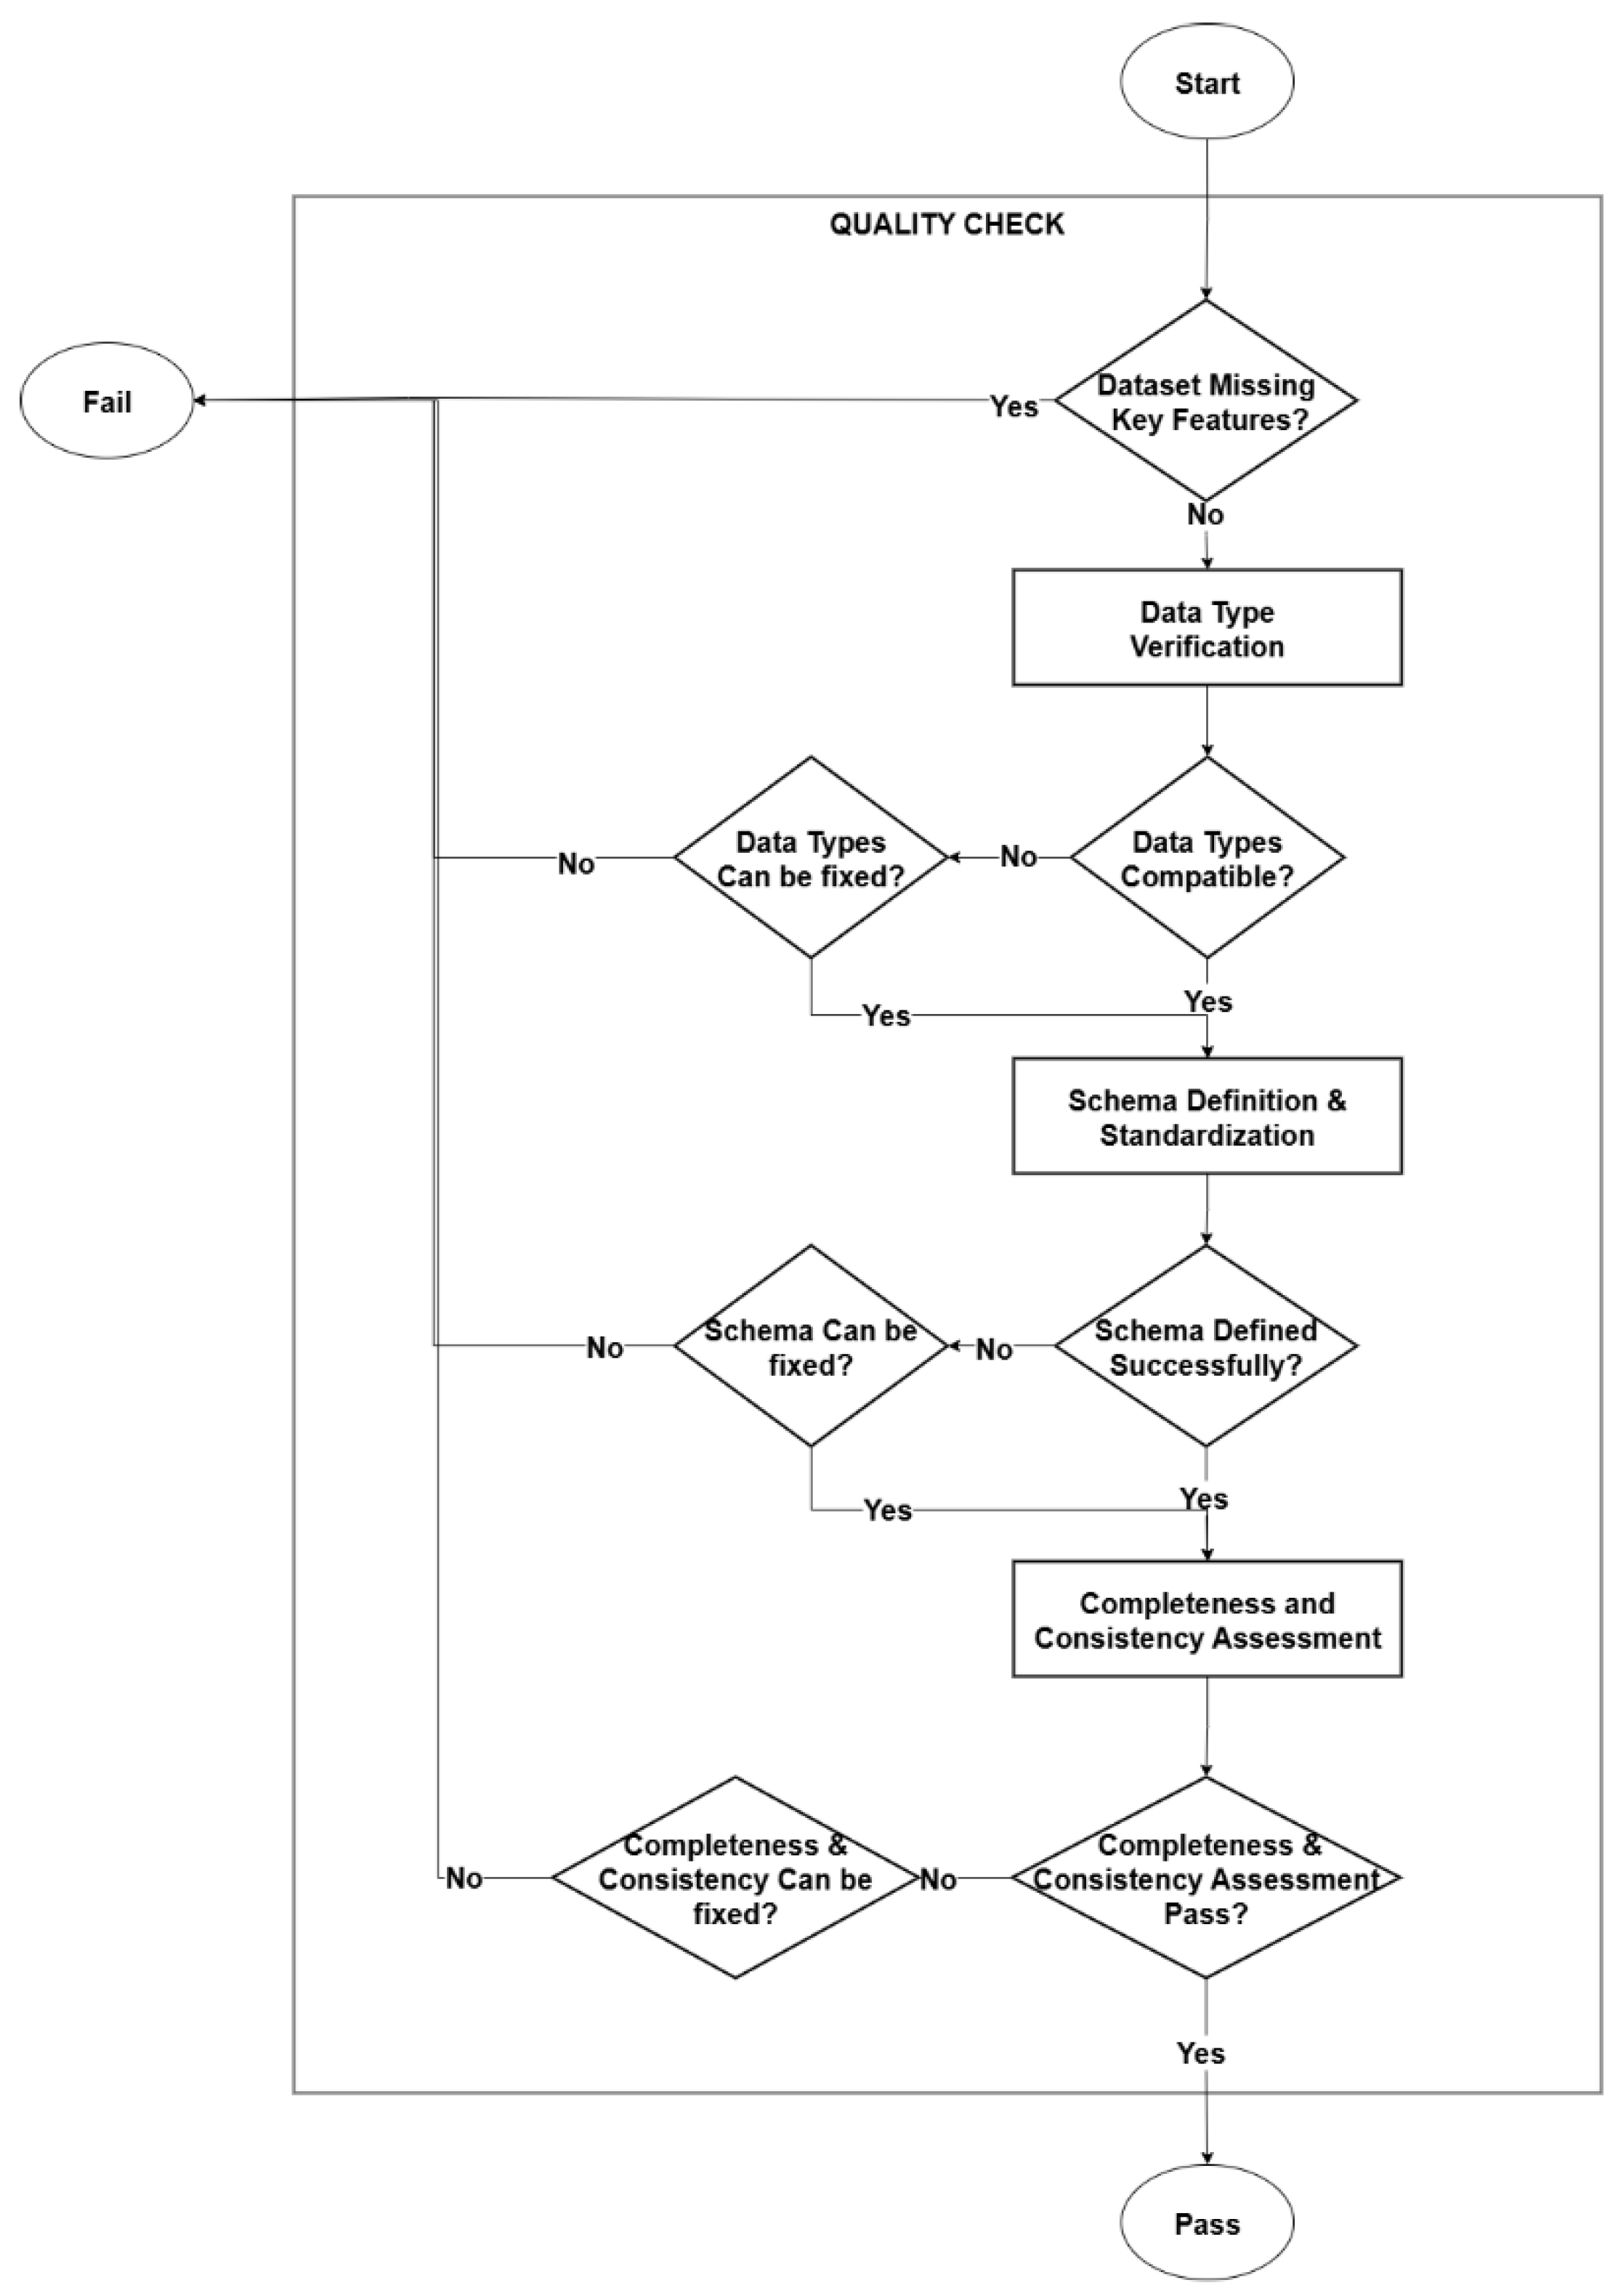
Figure 5.
Phase 2 – Data Understanding & Preprocessing Workflow.
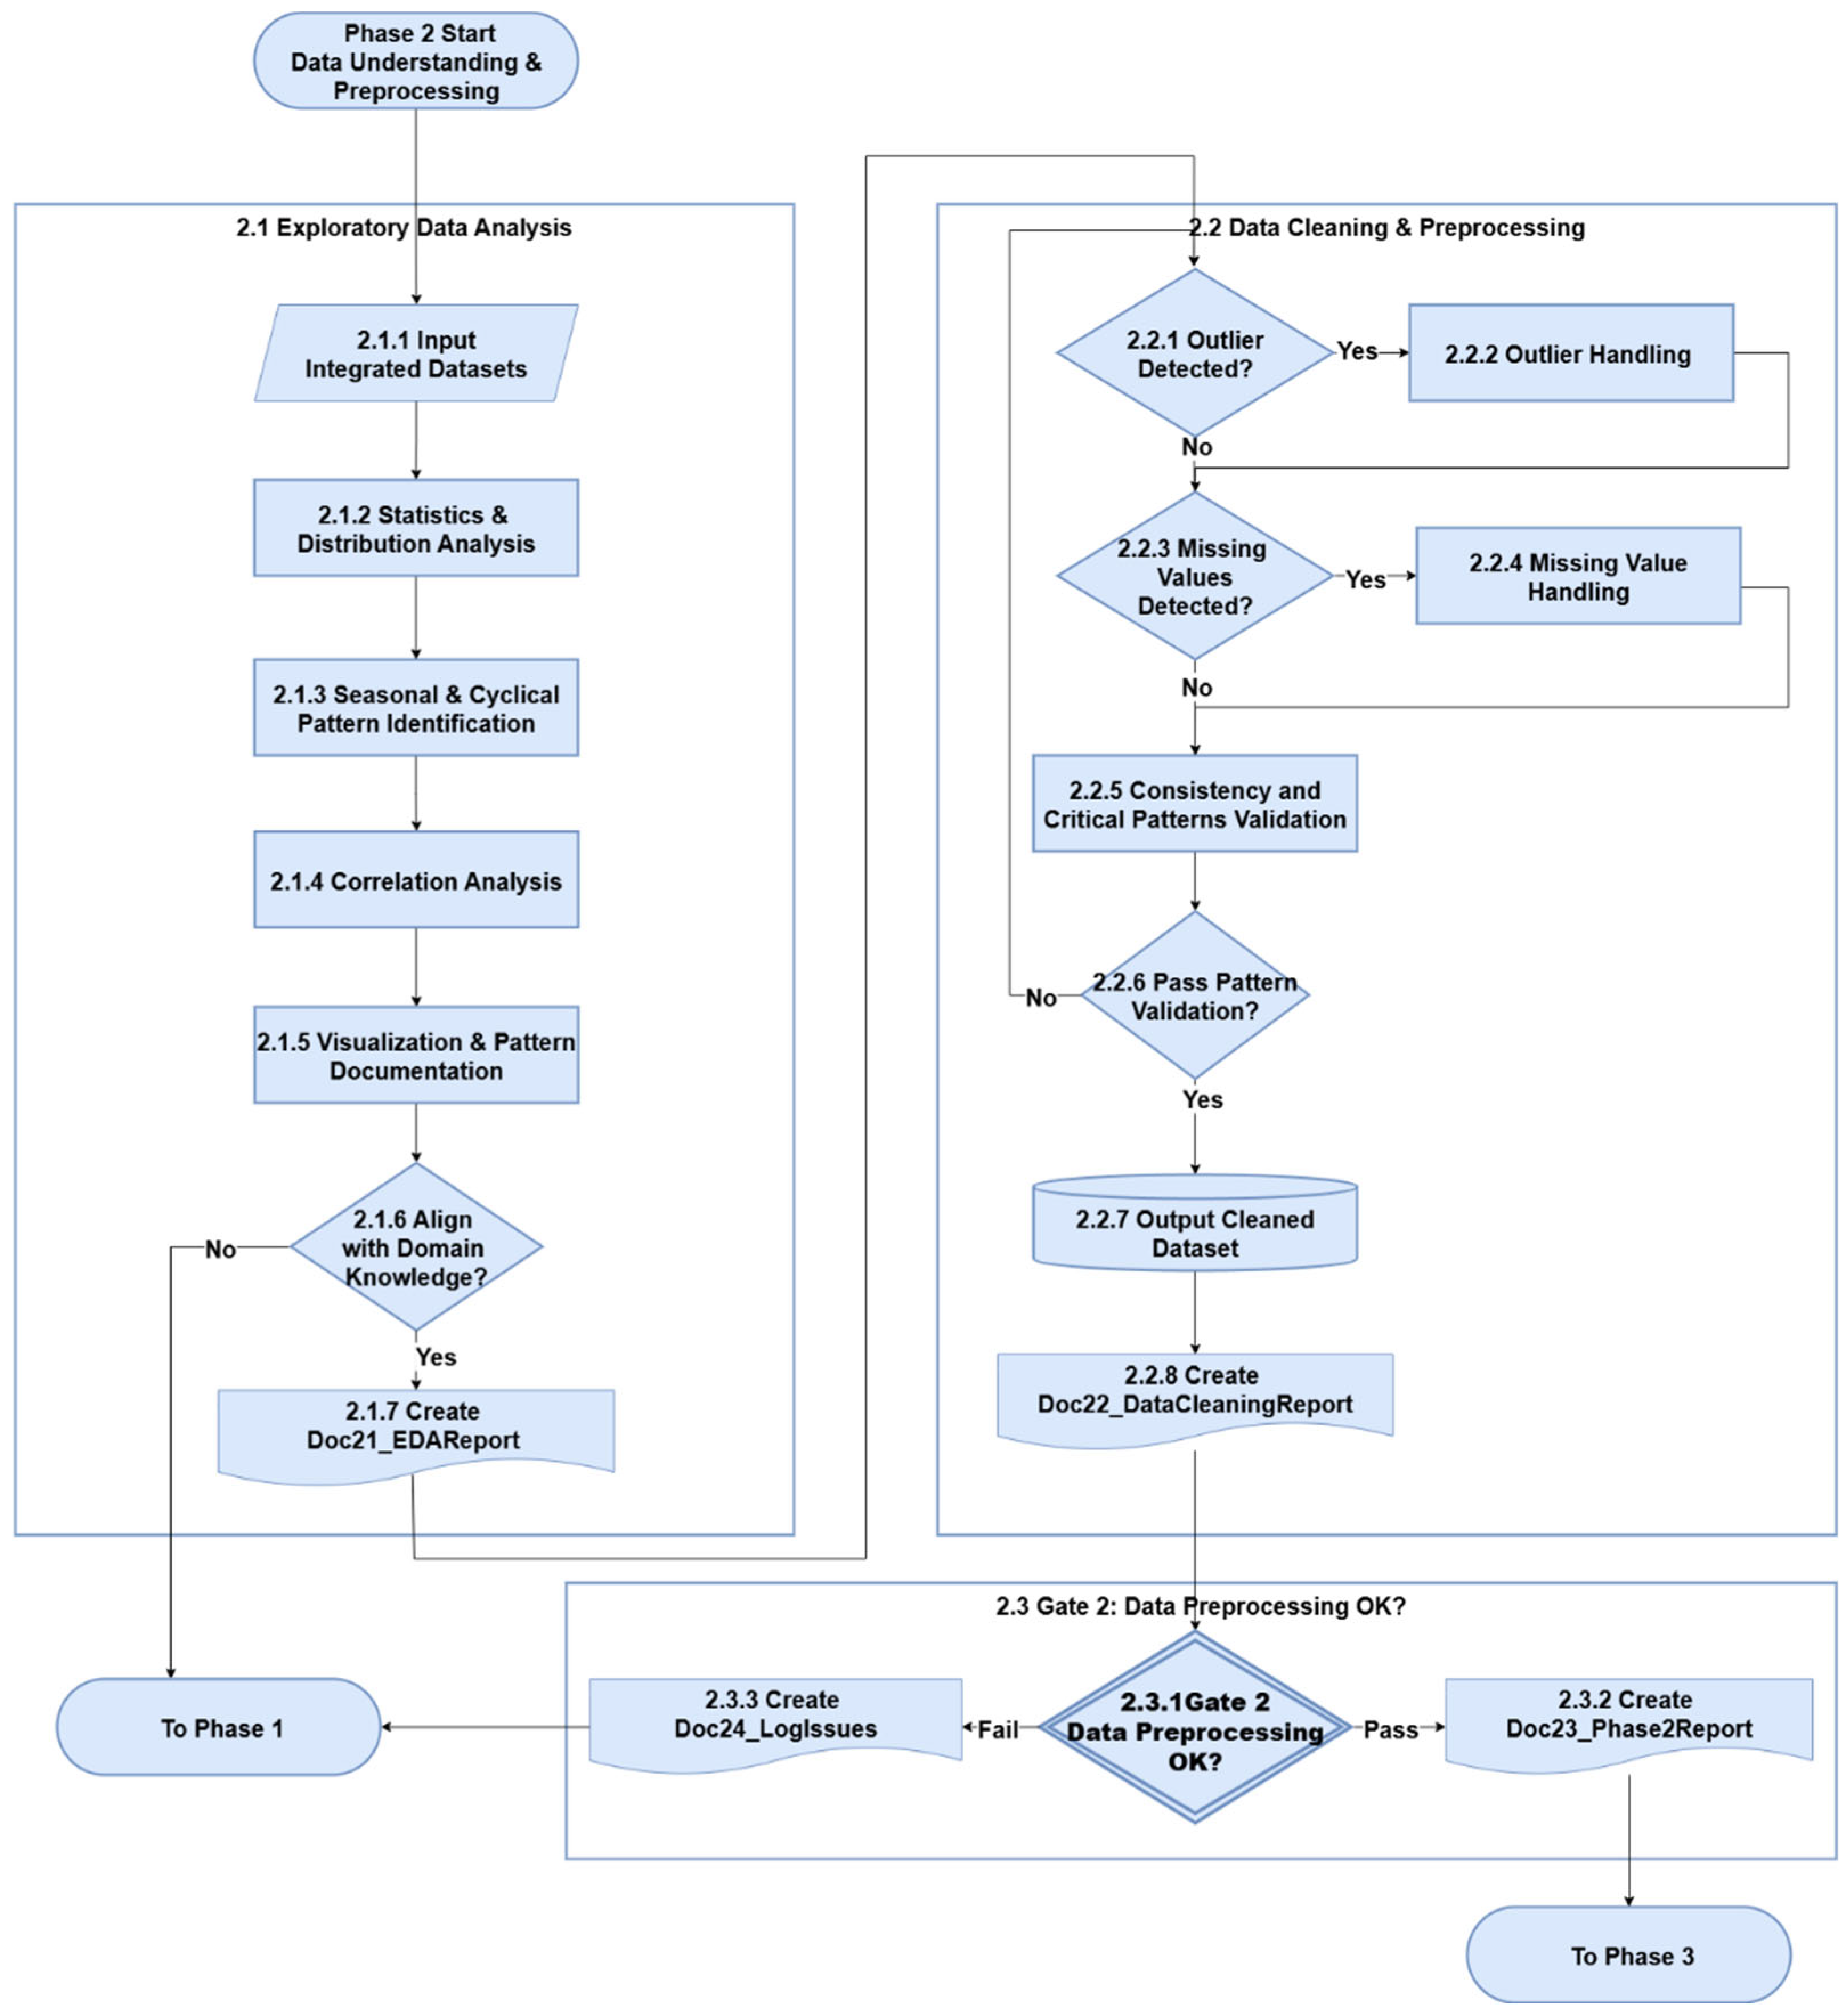
Figure 6.
Phase 3 – Feature Engineering Workflow.
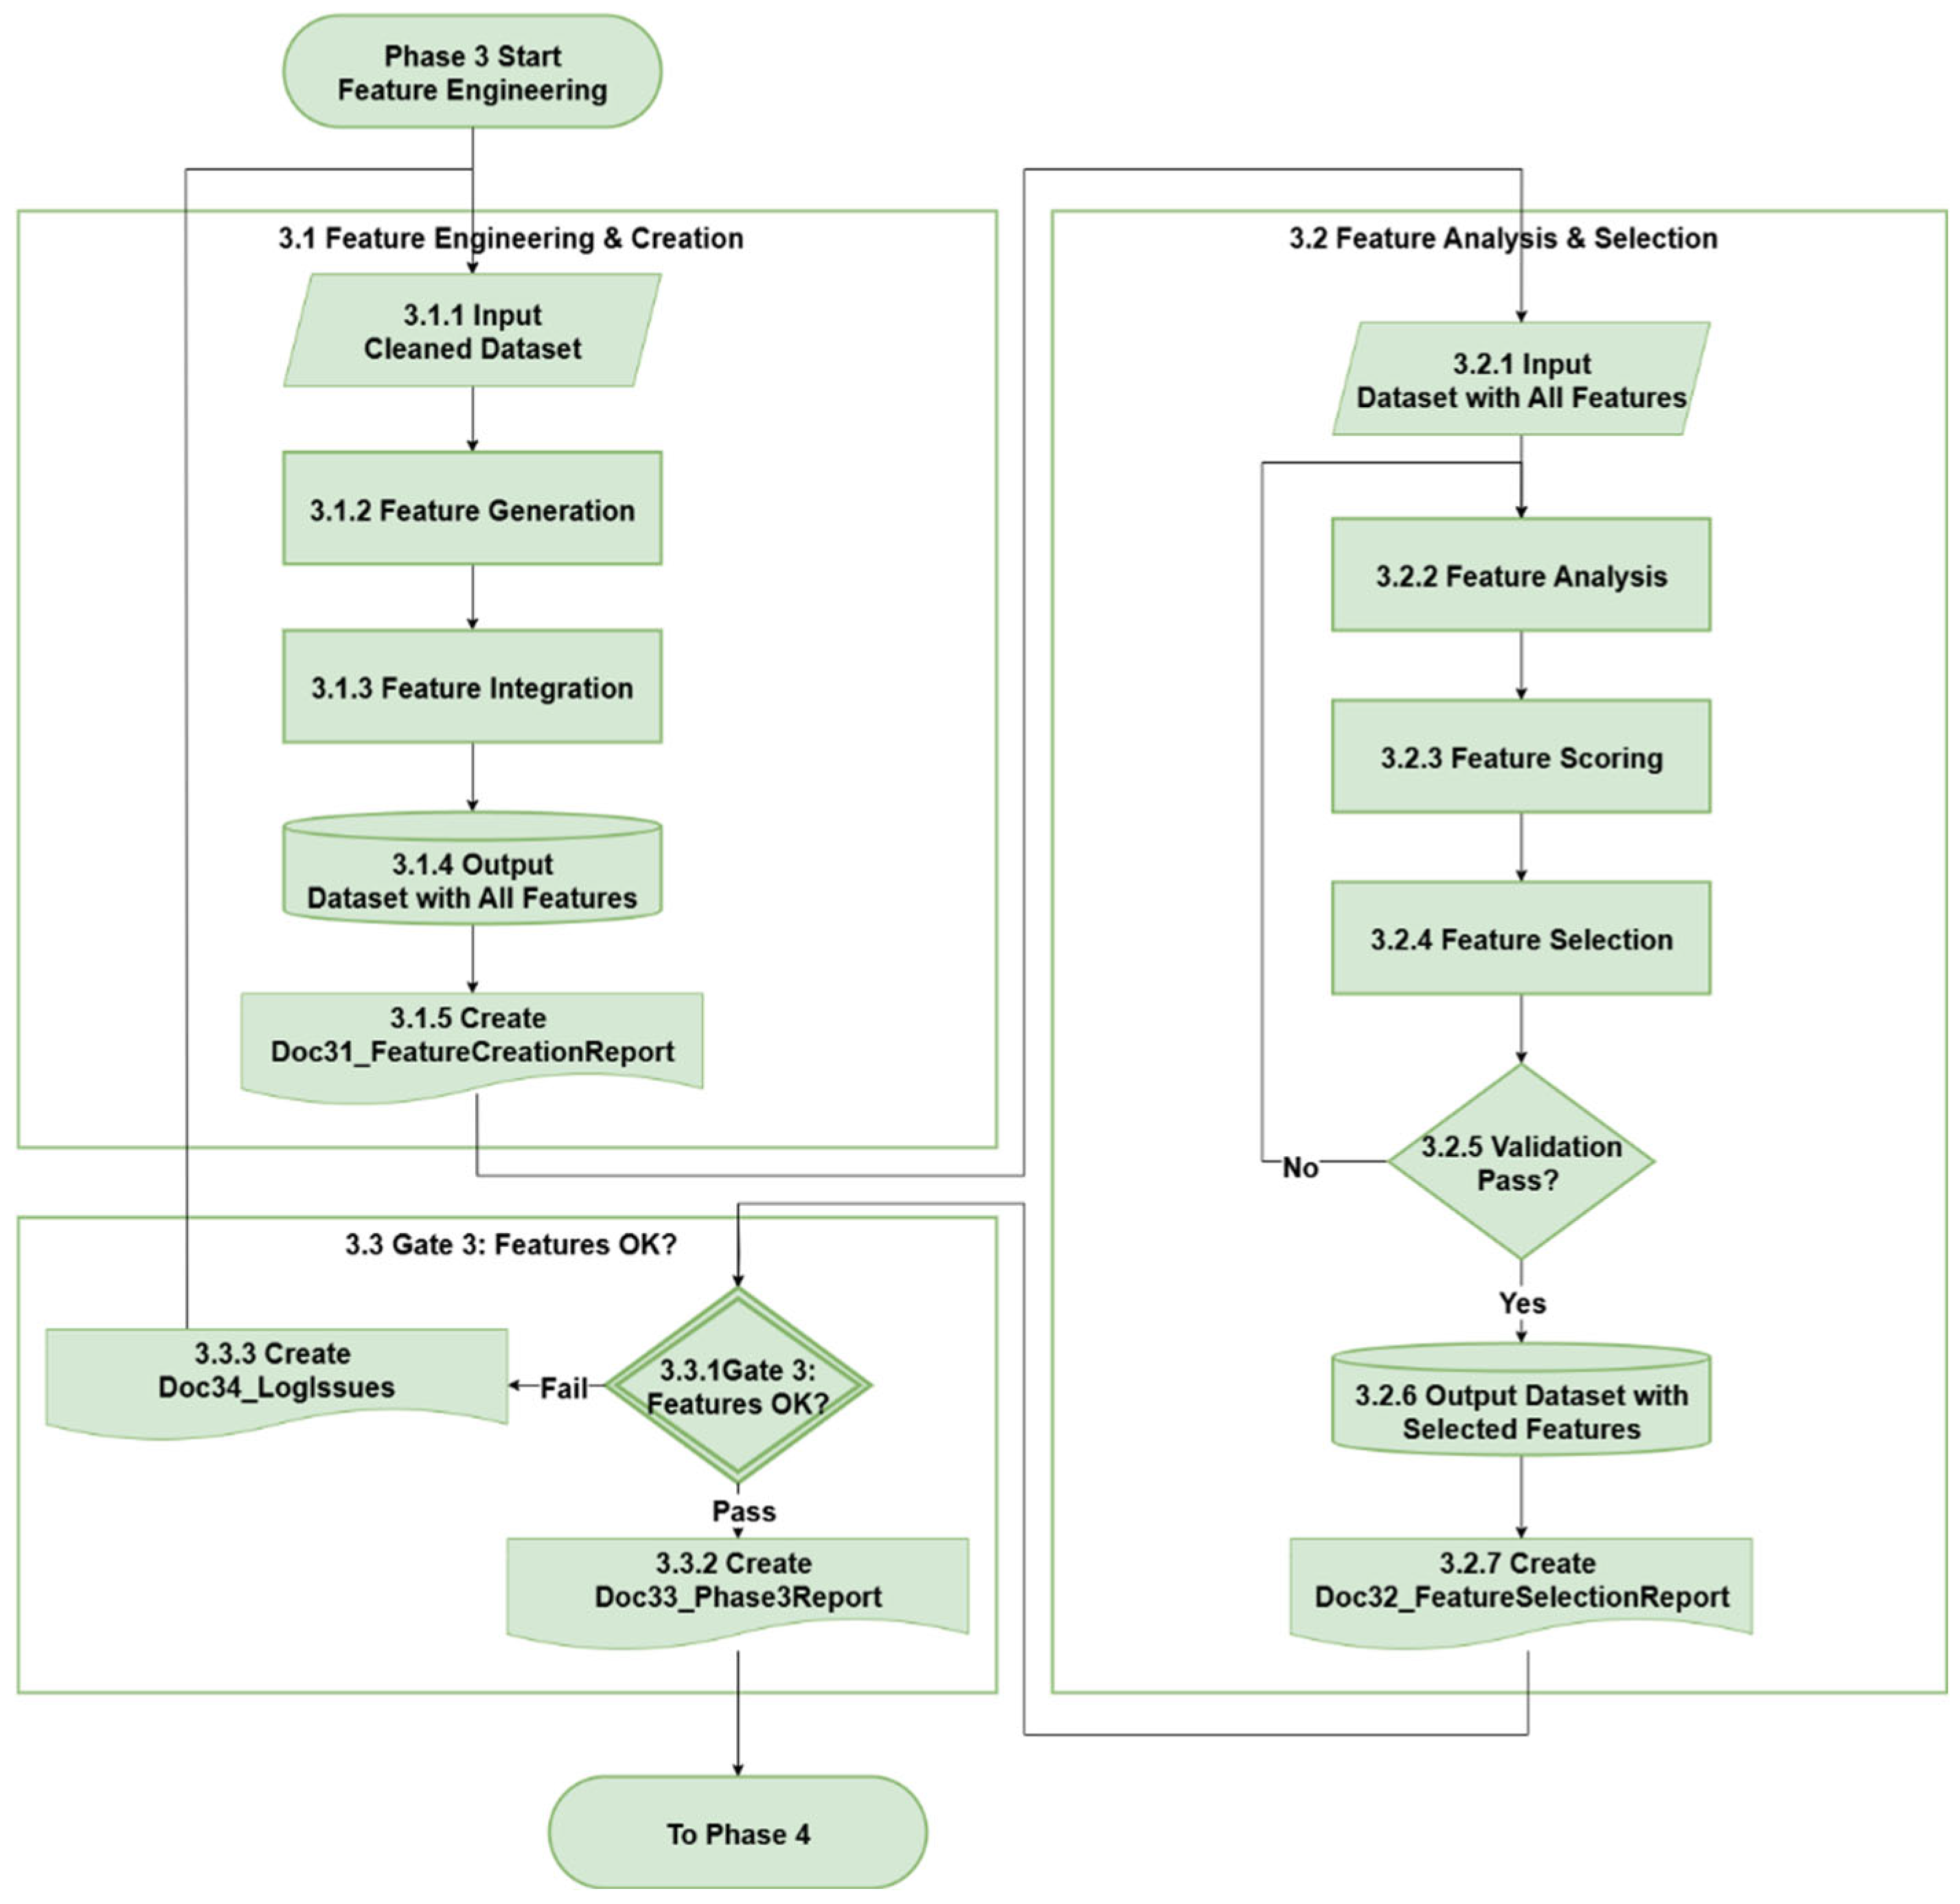
Figure 7.
Phase 4 – Model Development & Evaluation Workflow.
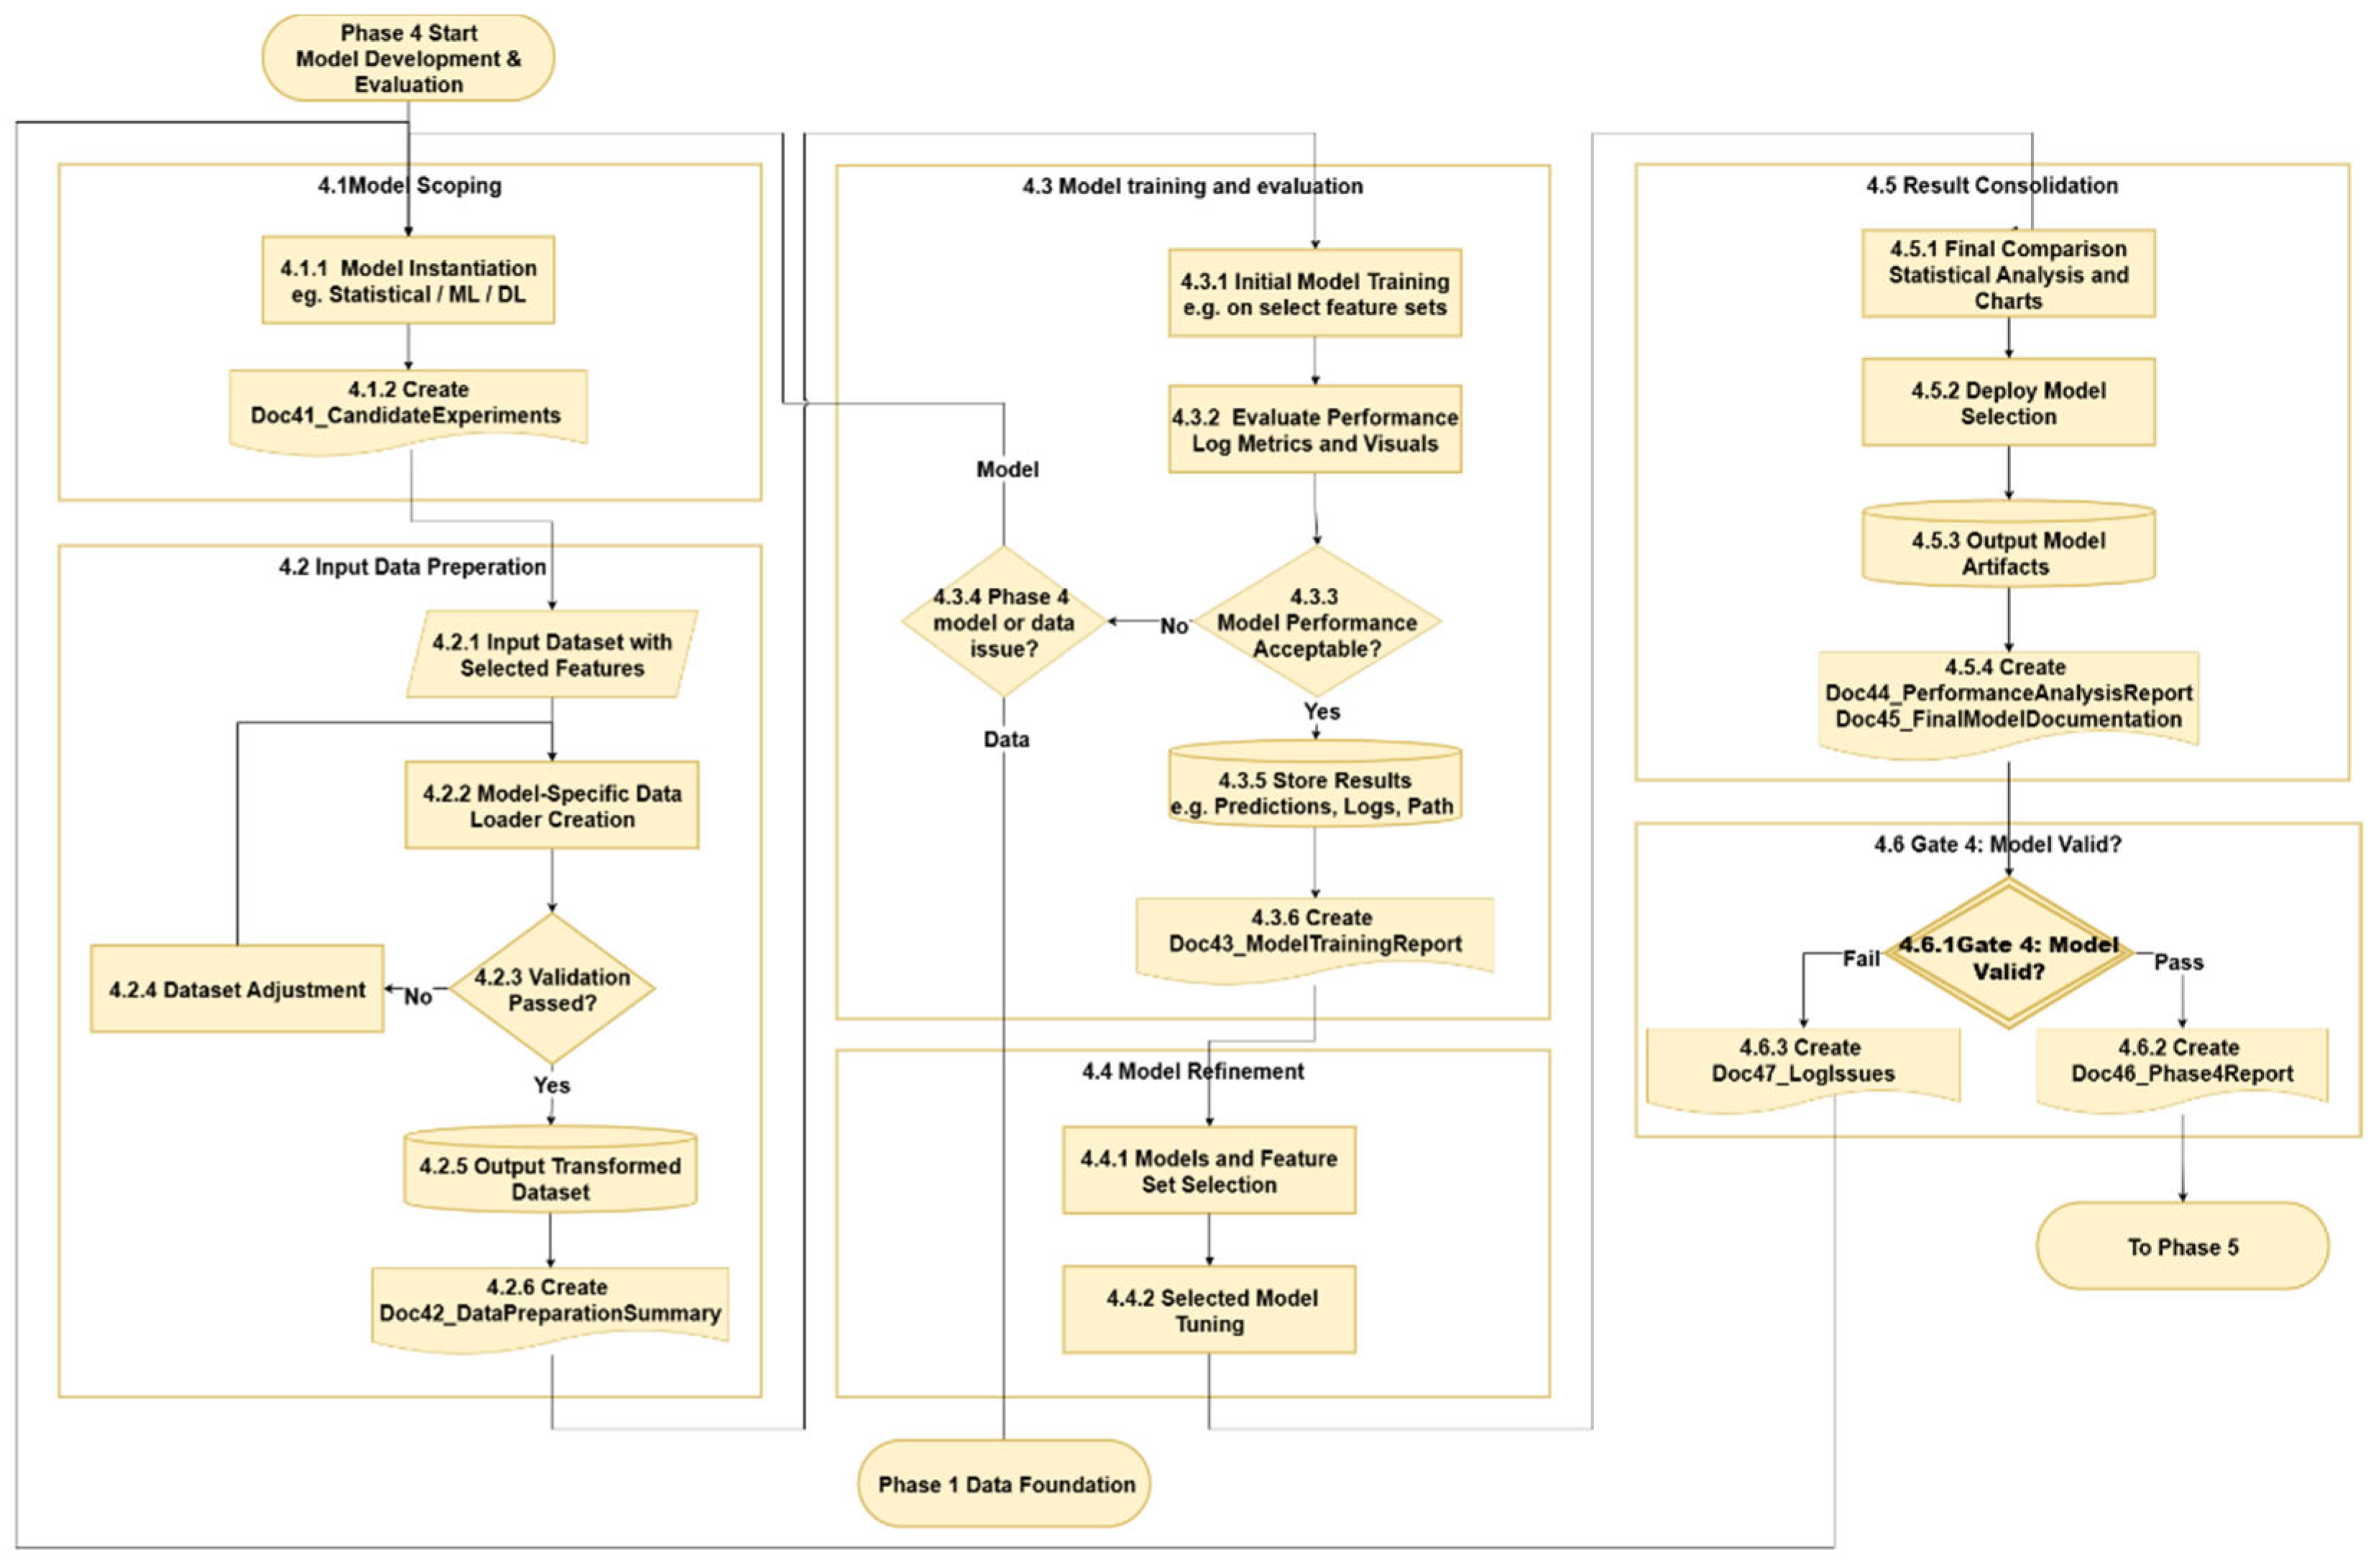
Figure 8.
Phase 5 – Deployment & Implementation Workflow.
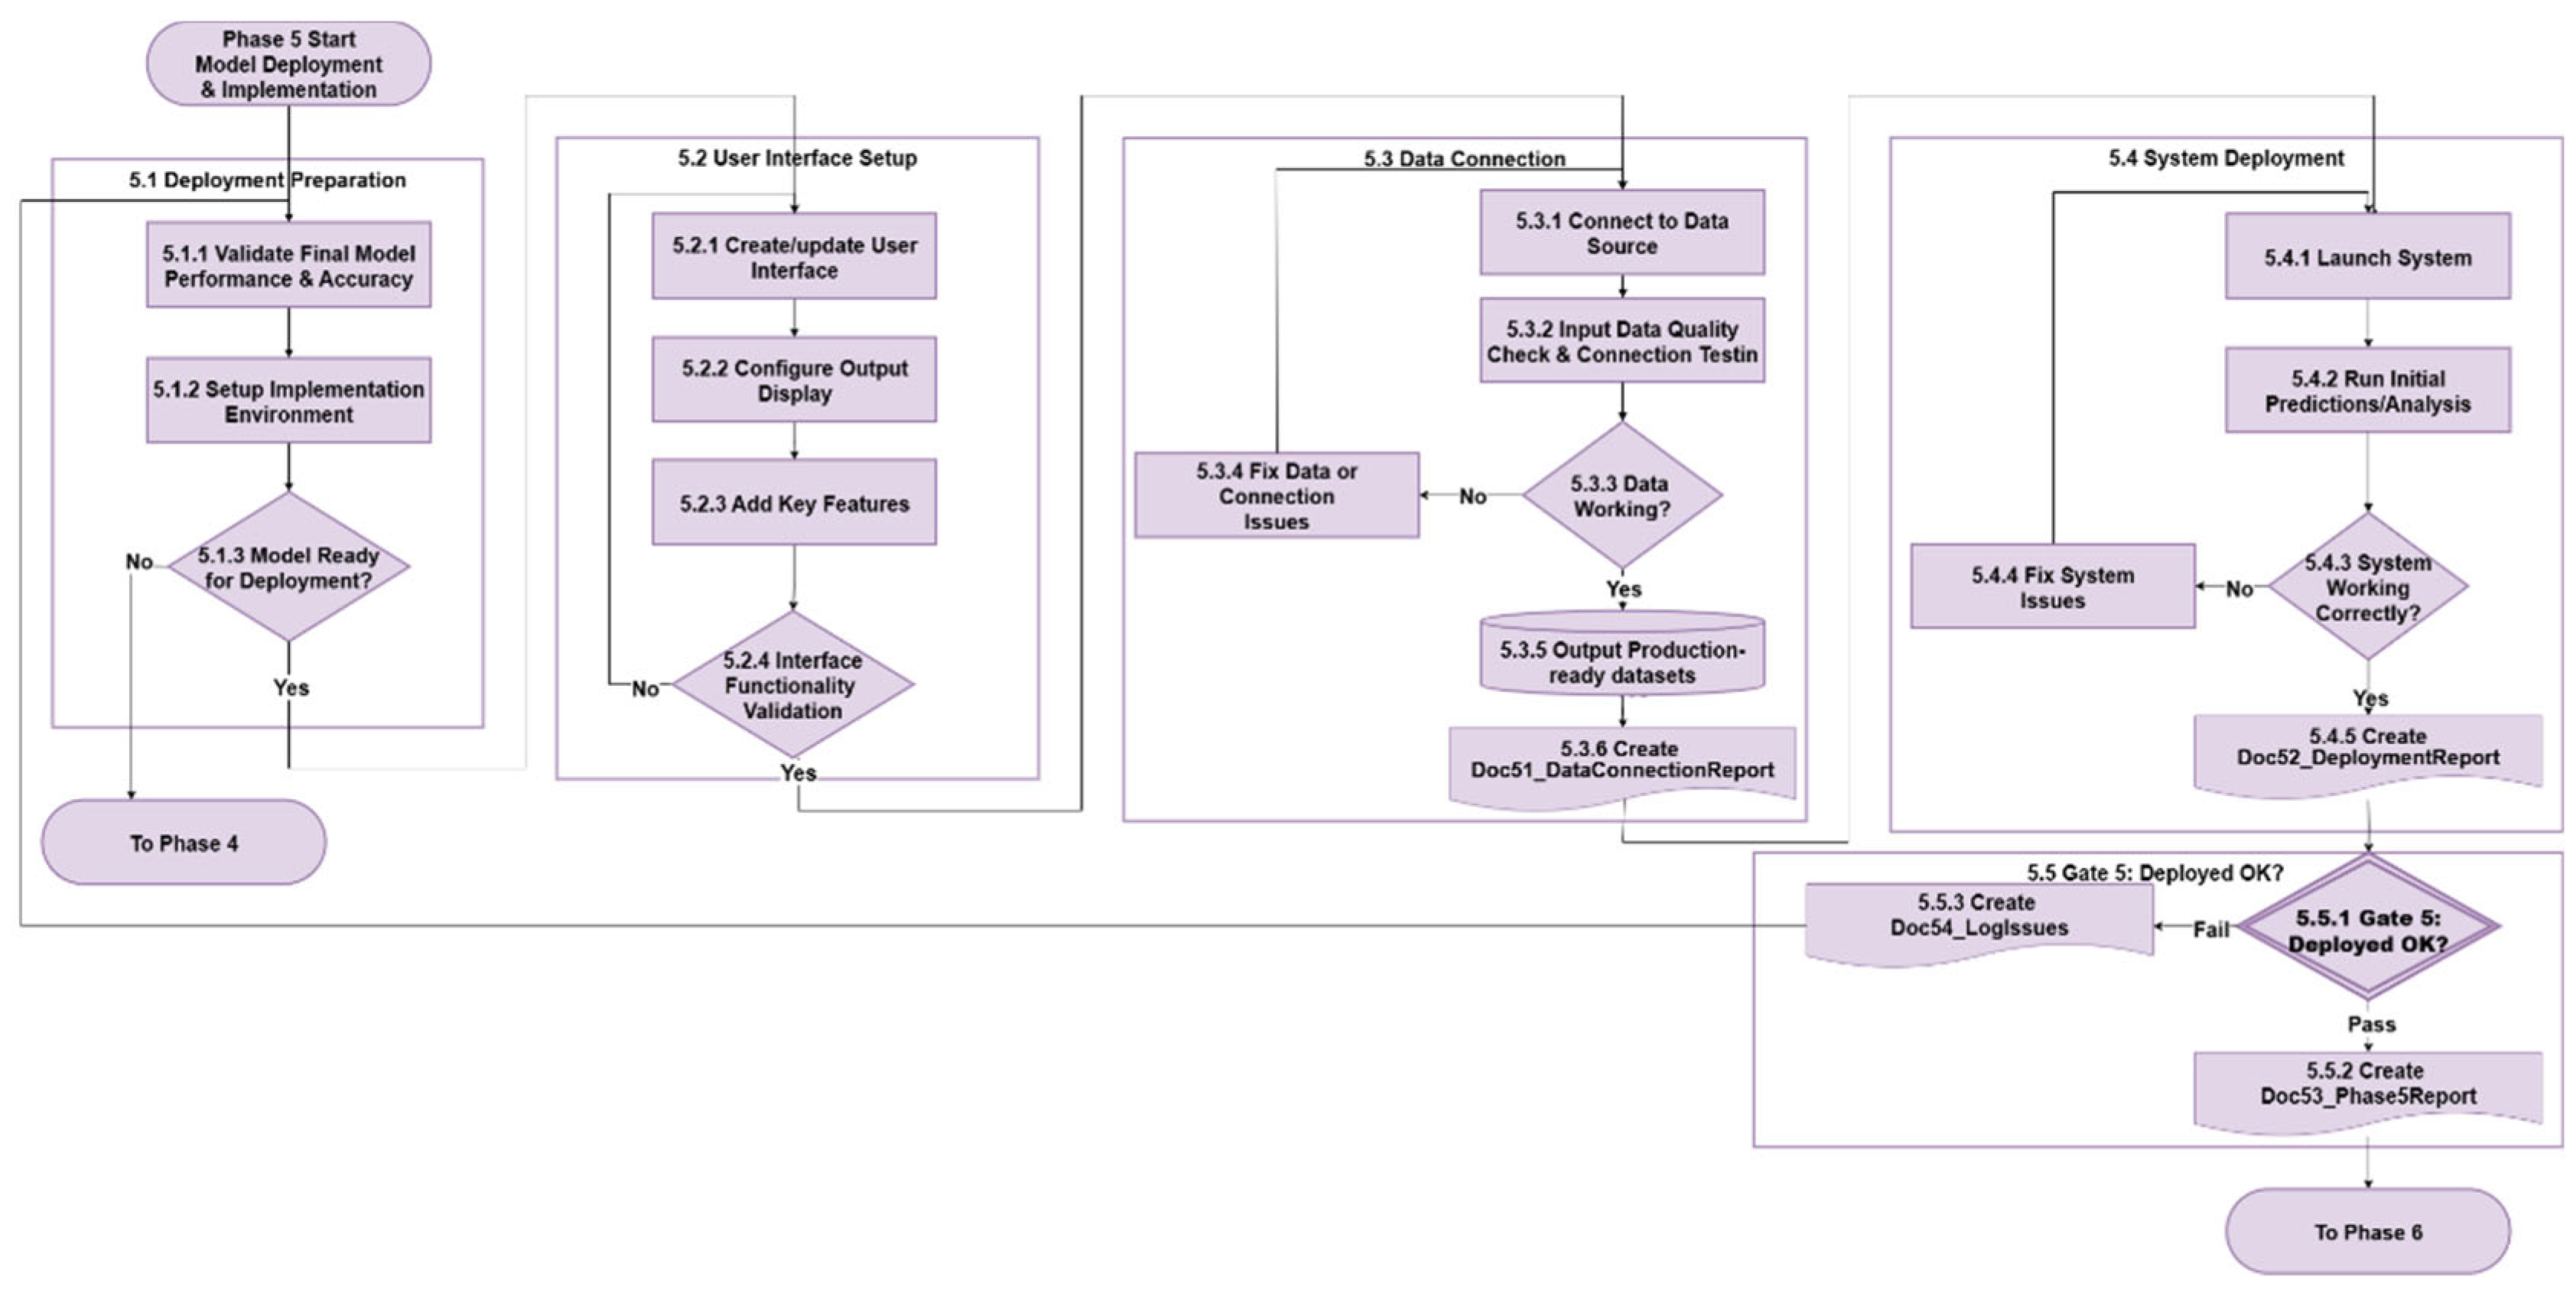
Figure 9.
Phase 6 – Automated Monitoring & Update Workflow.
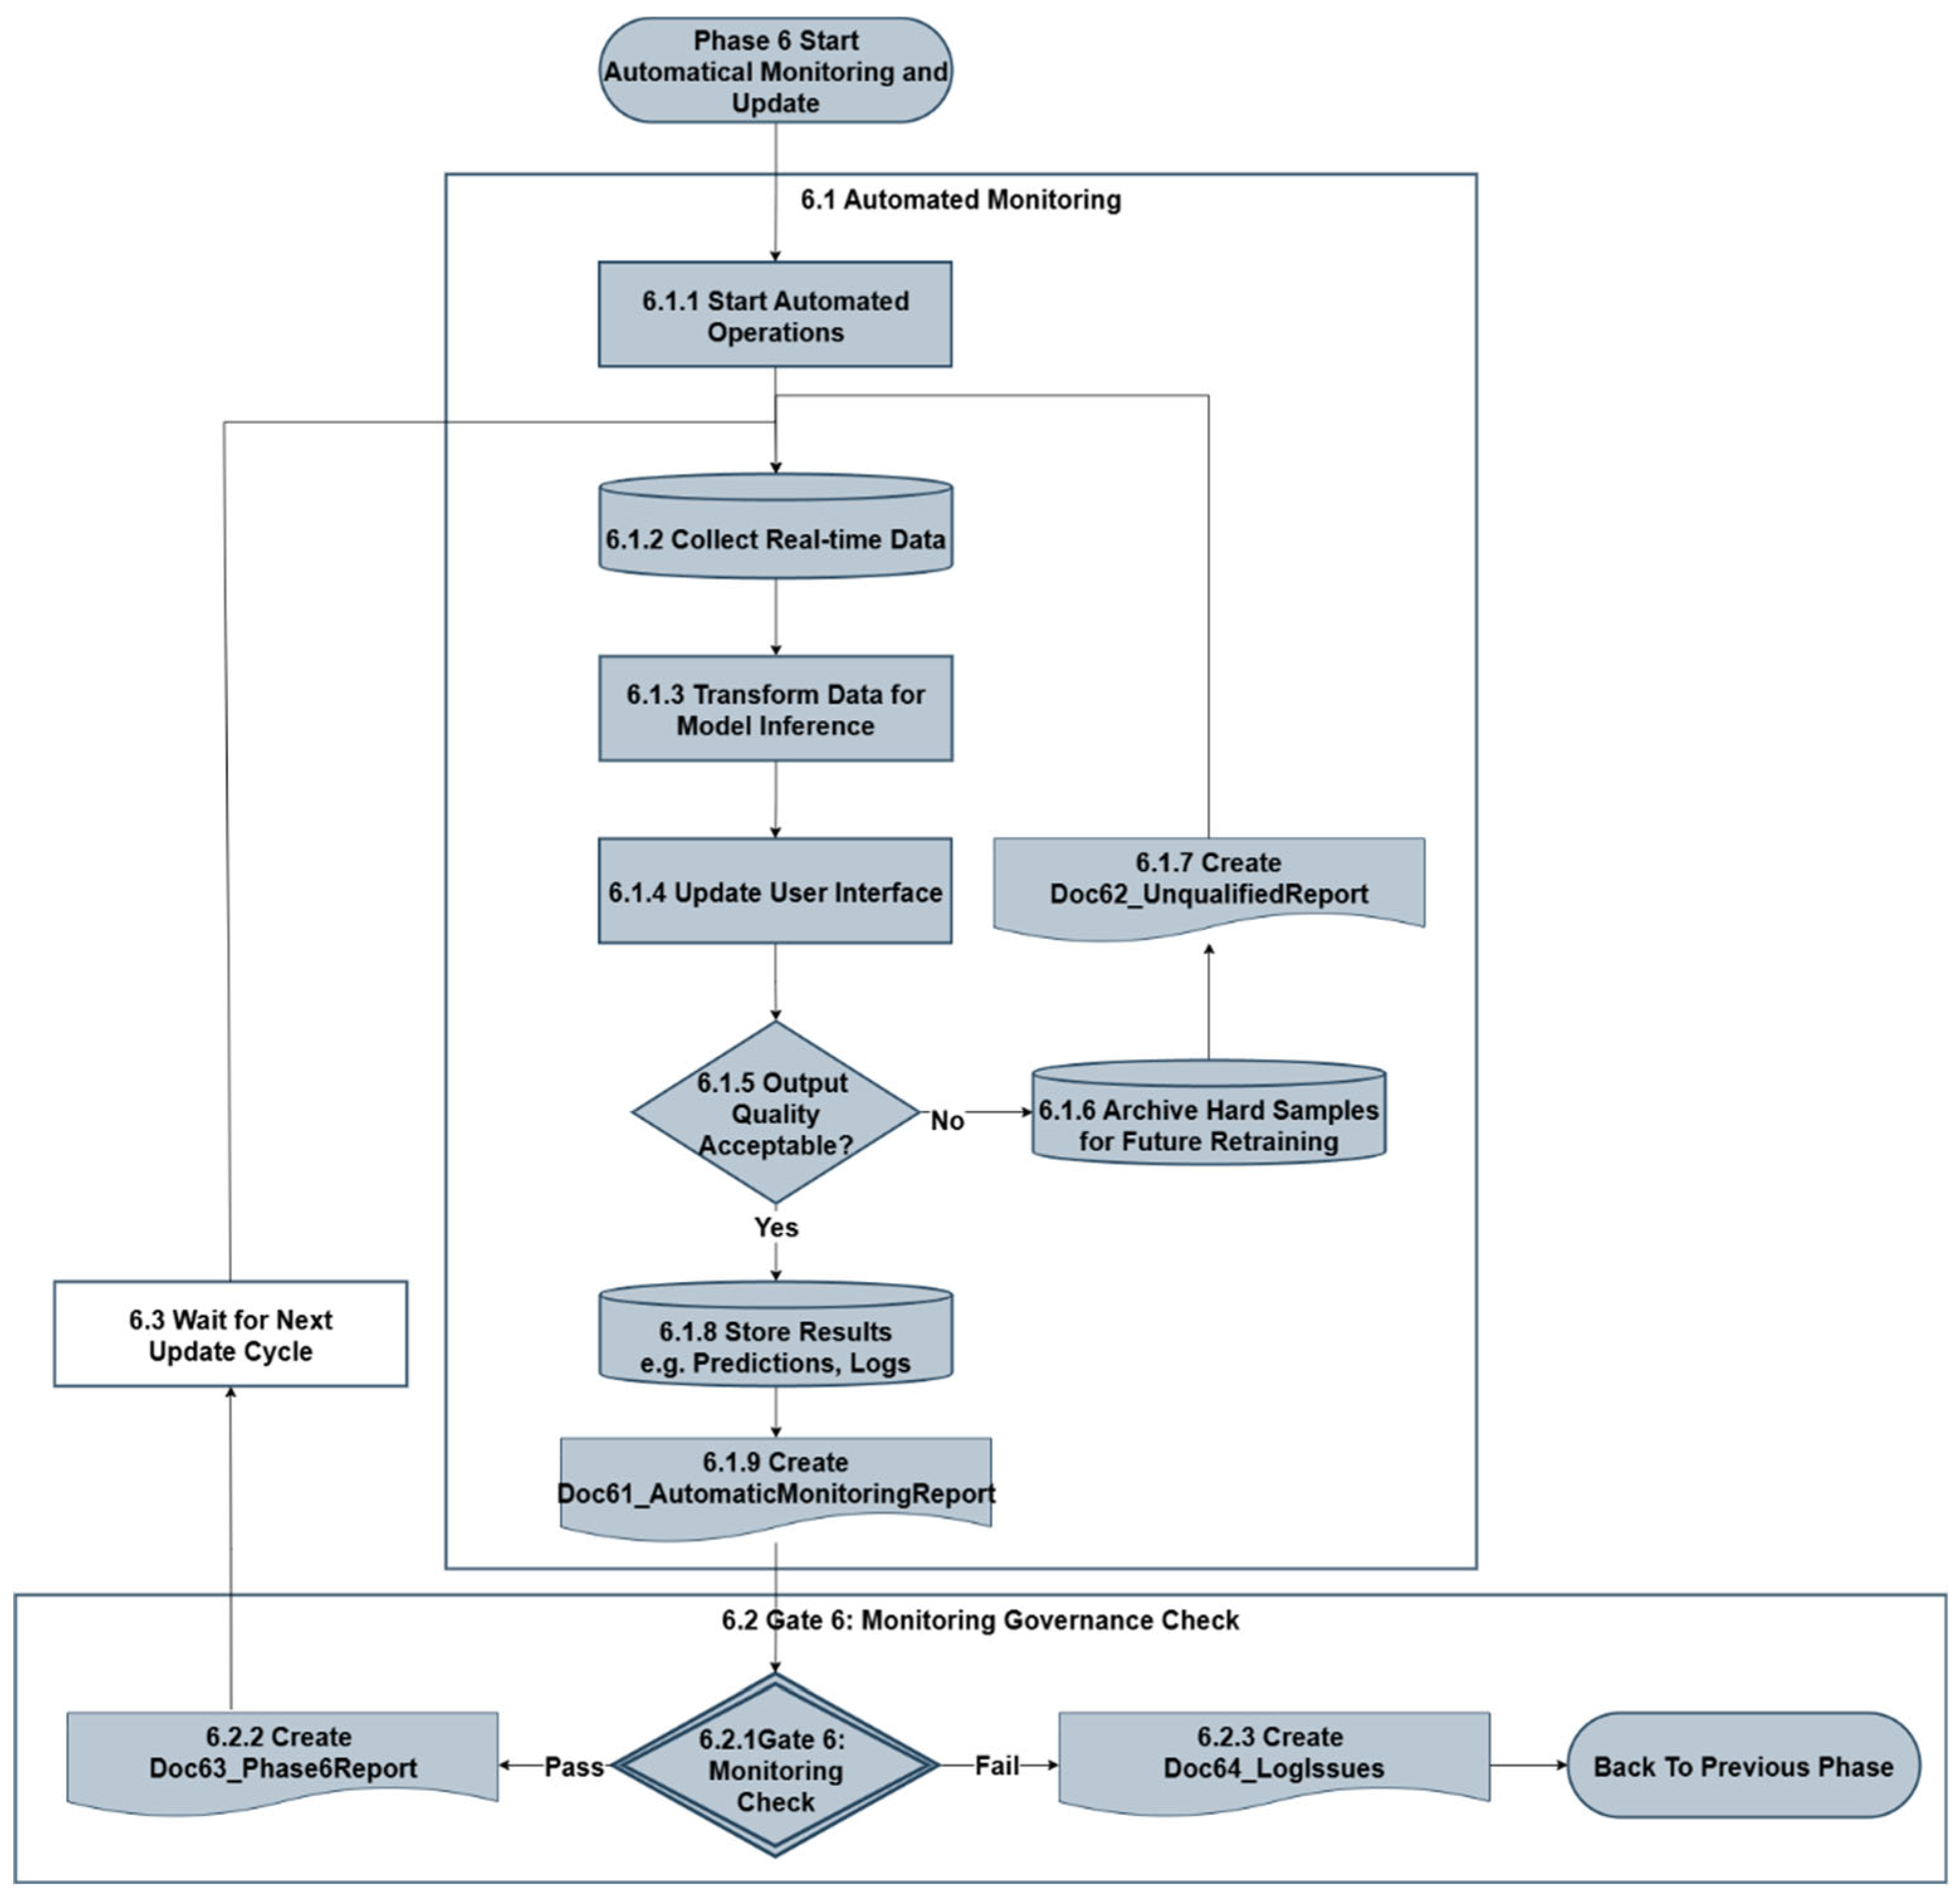
Figure 10.
Case Study – Electricity Data Visualization.
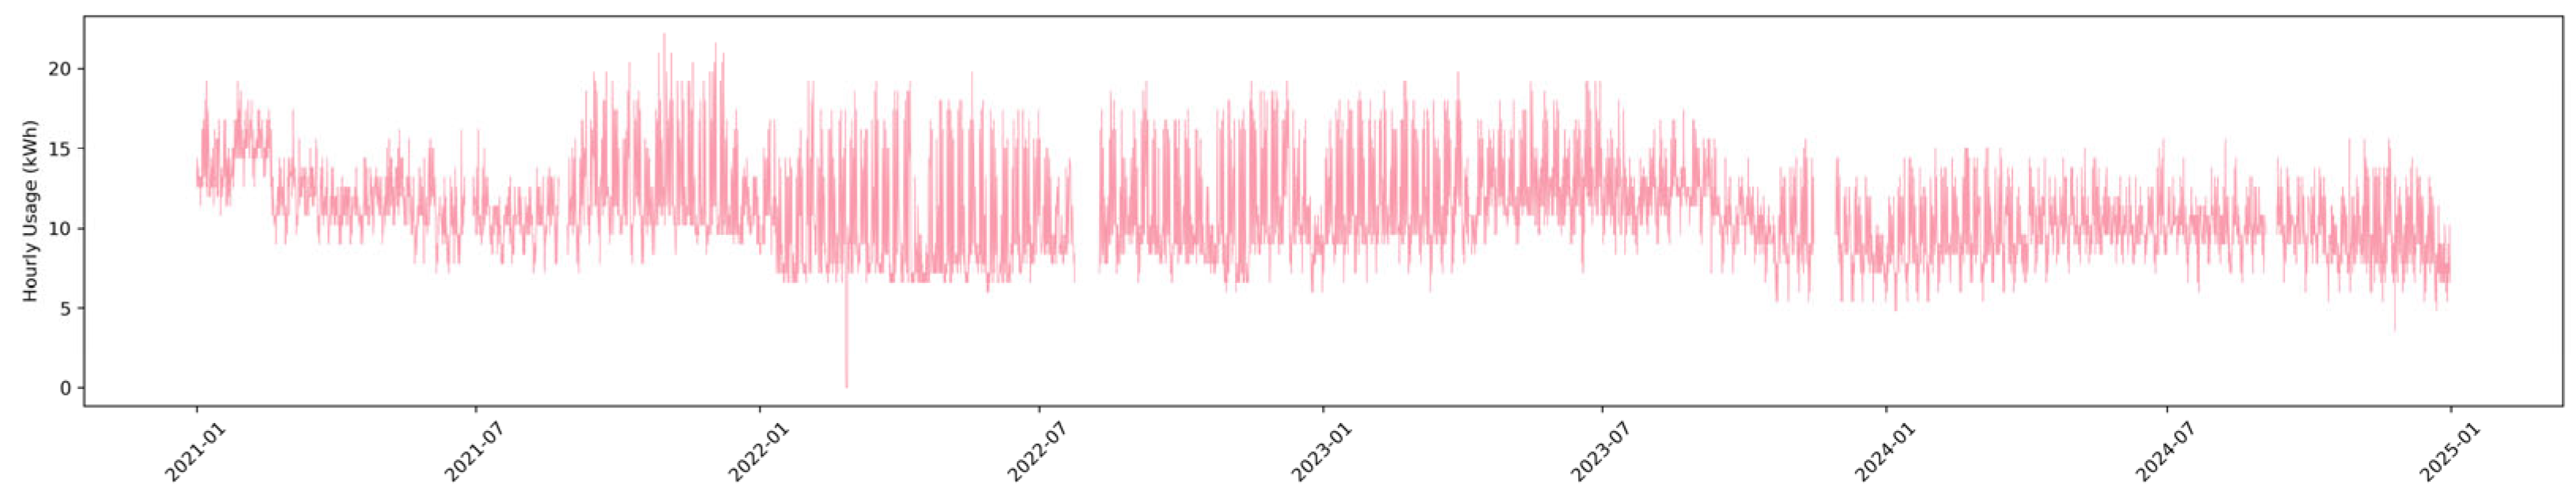
Figure 11.
Case Study – Key Weather Data Visualization.
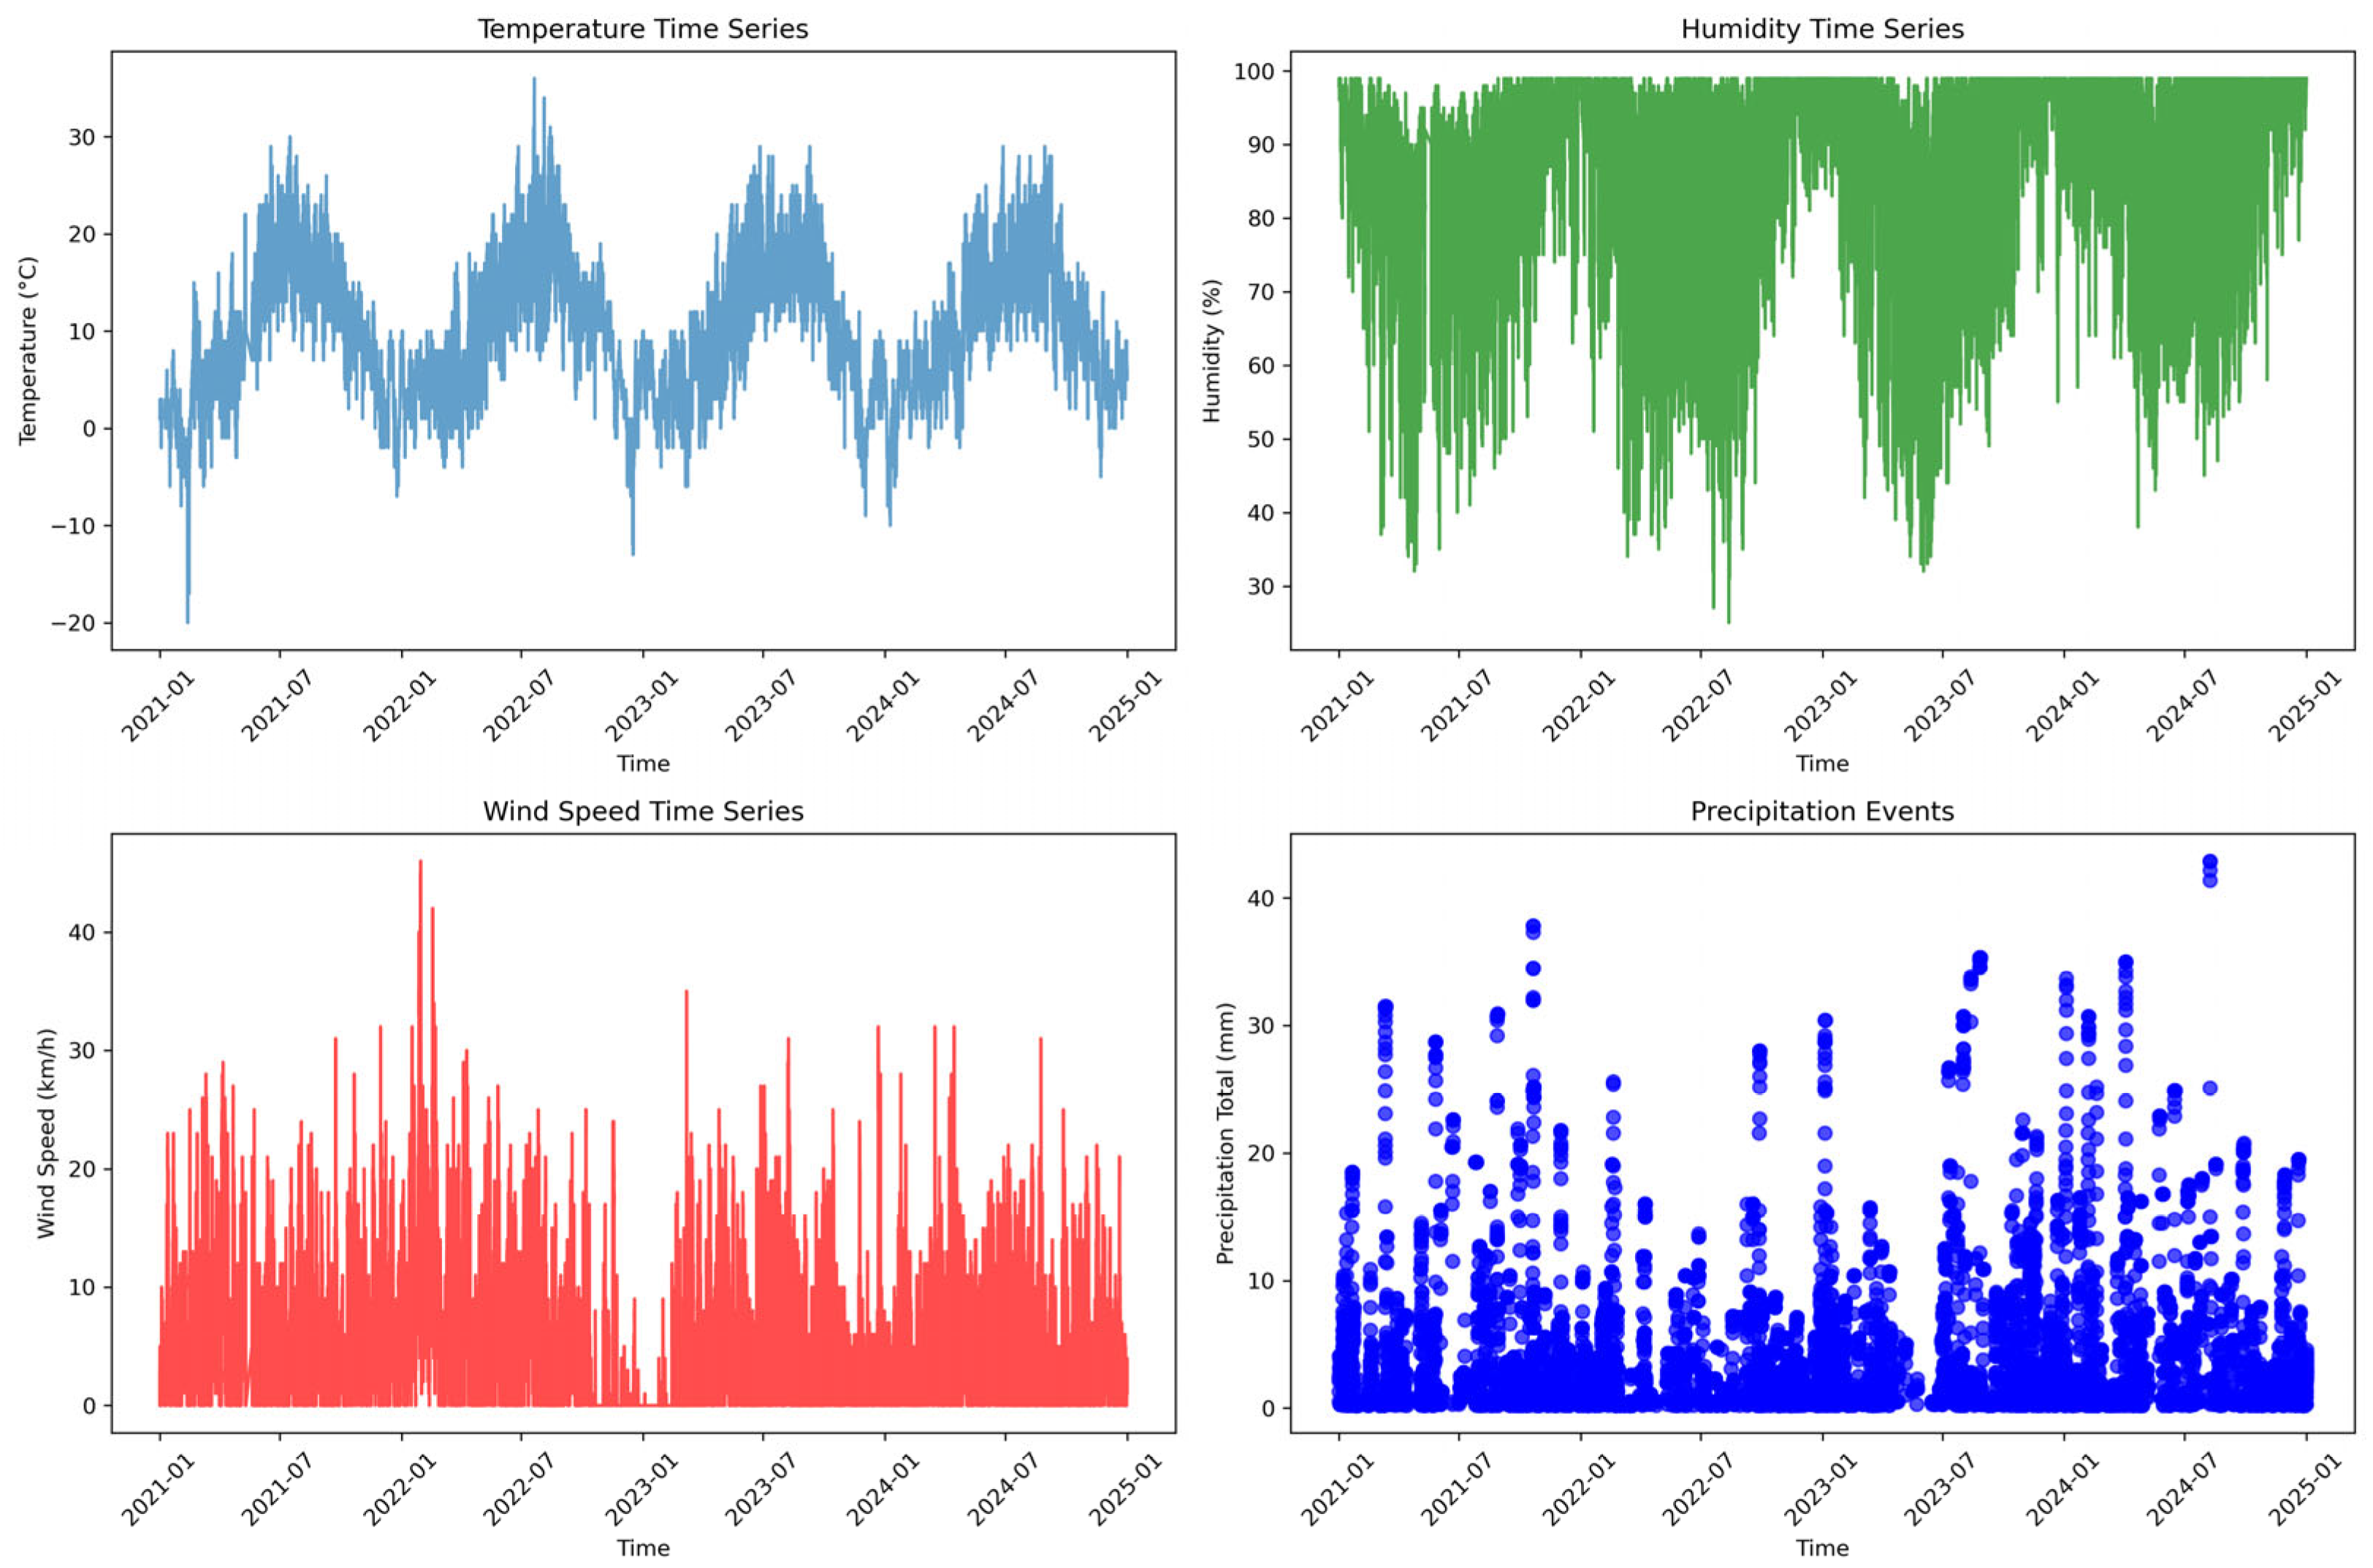
Figure 12.
Case Study – EDA Visualizations.
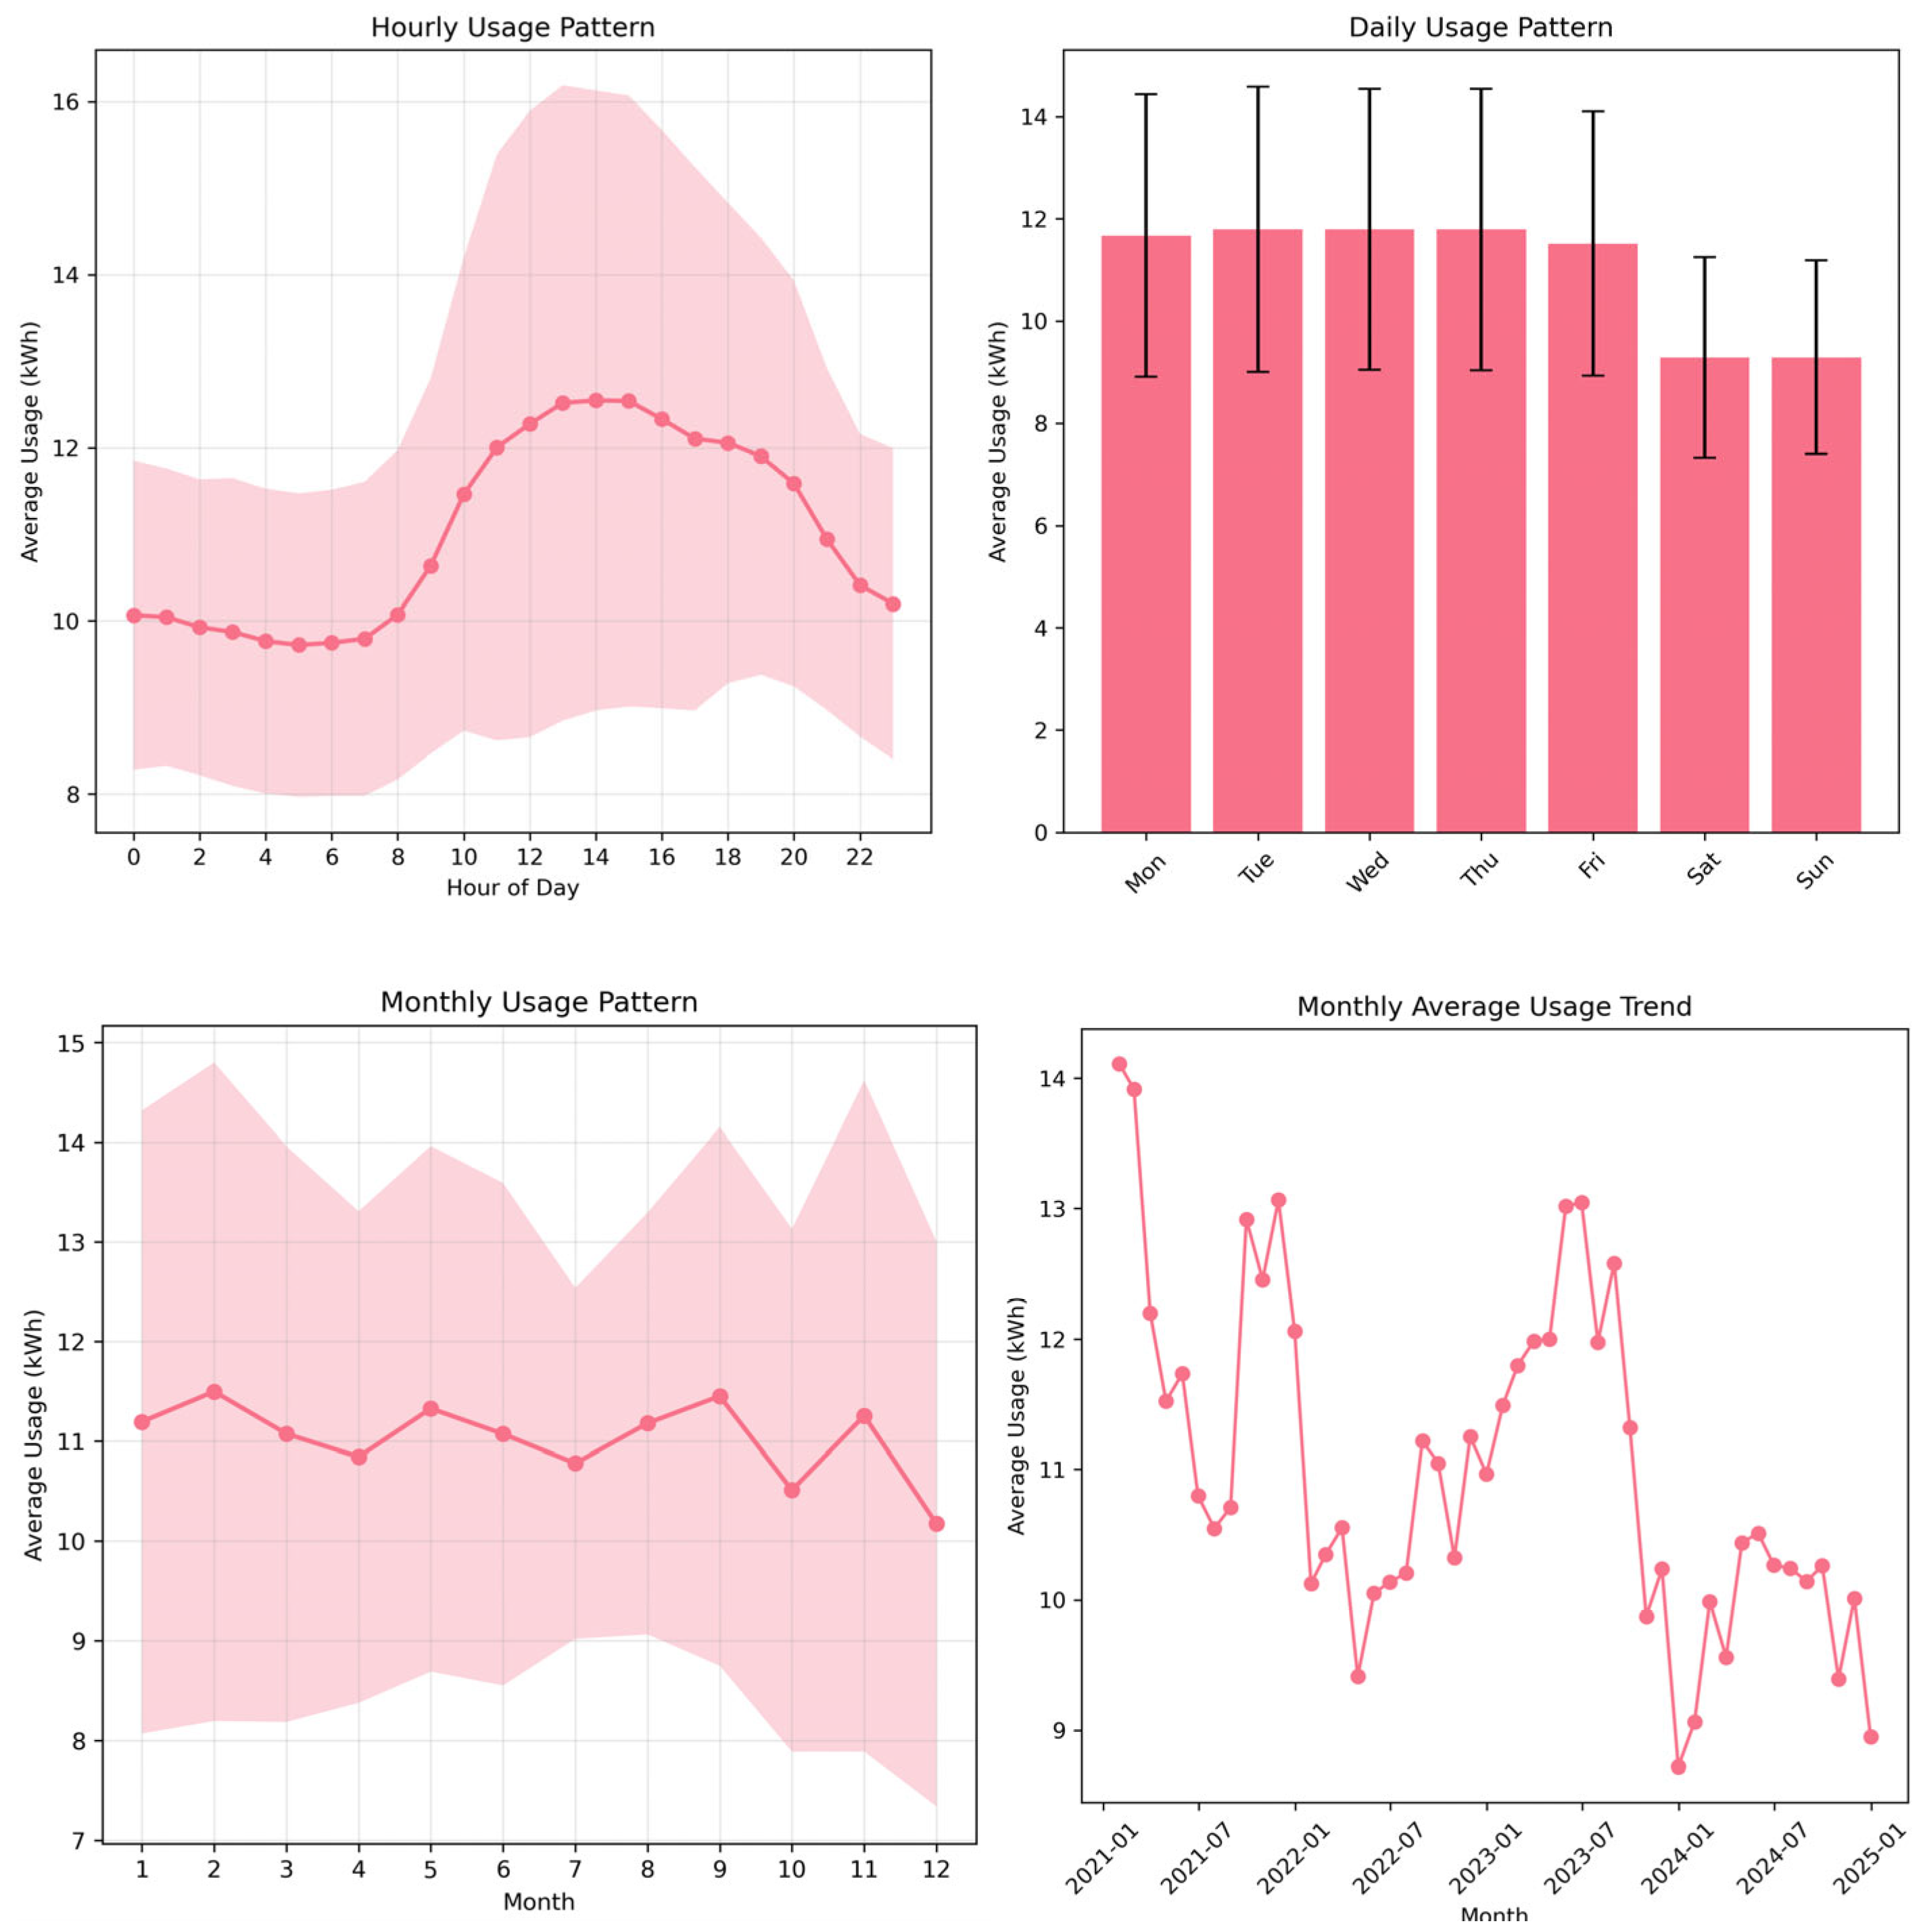
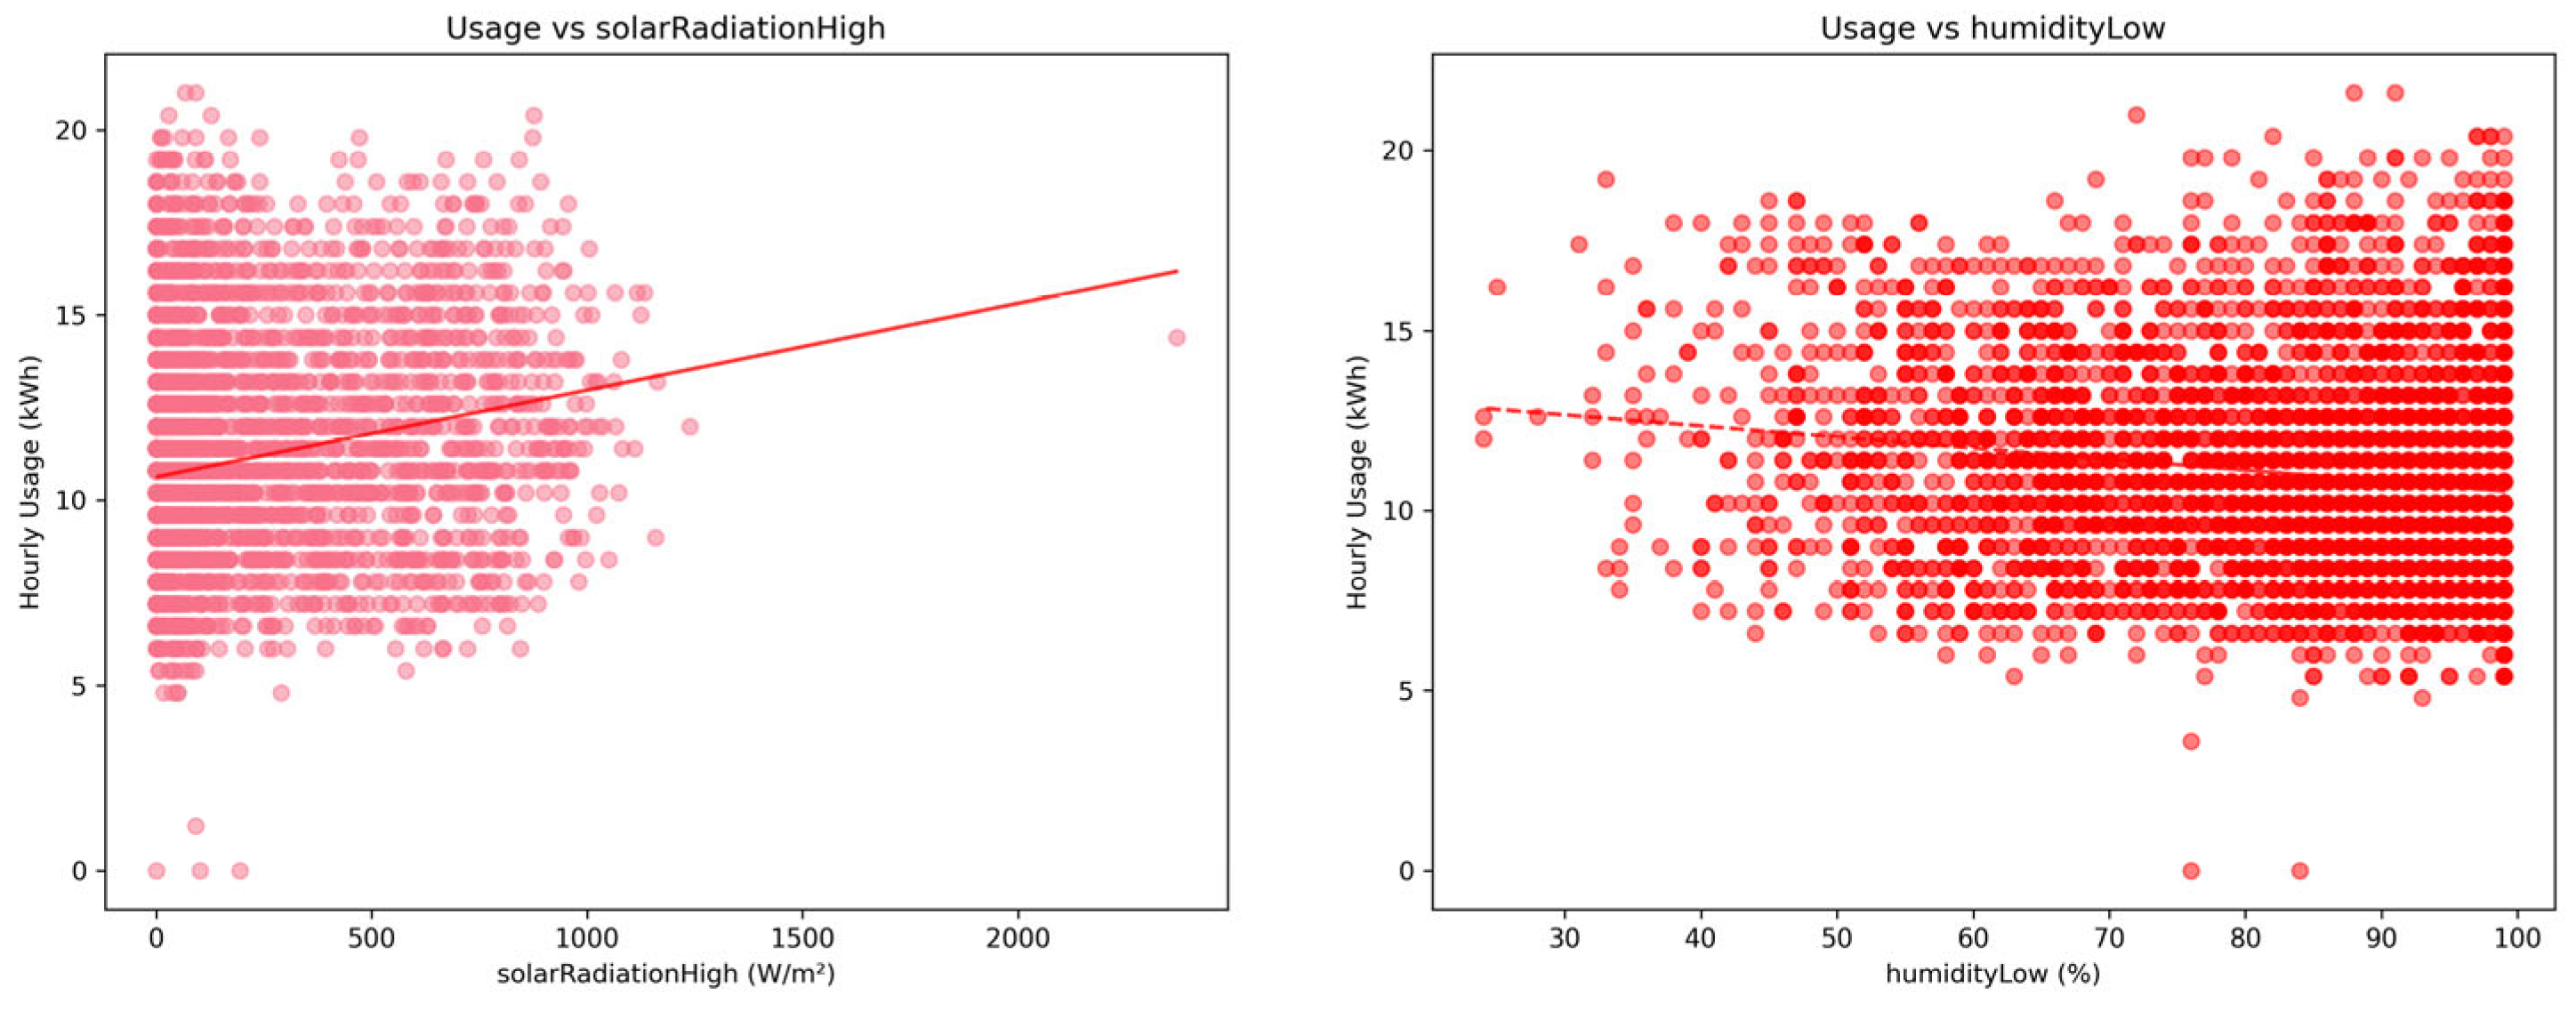
Figure 13.
Case Study – Gap filling examples.
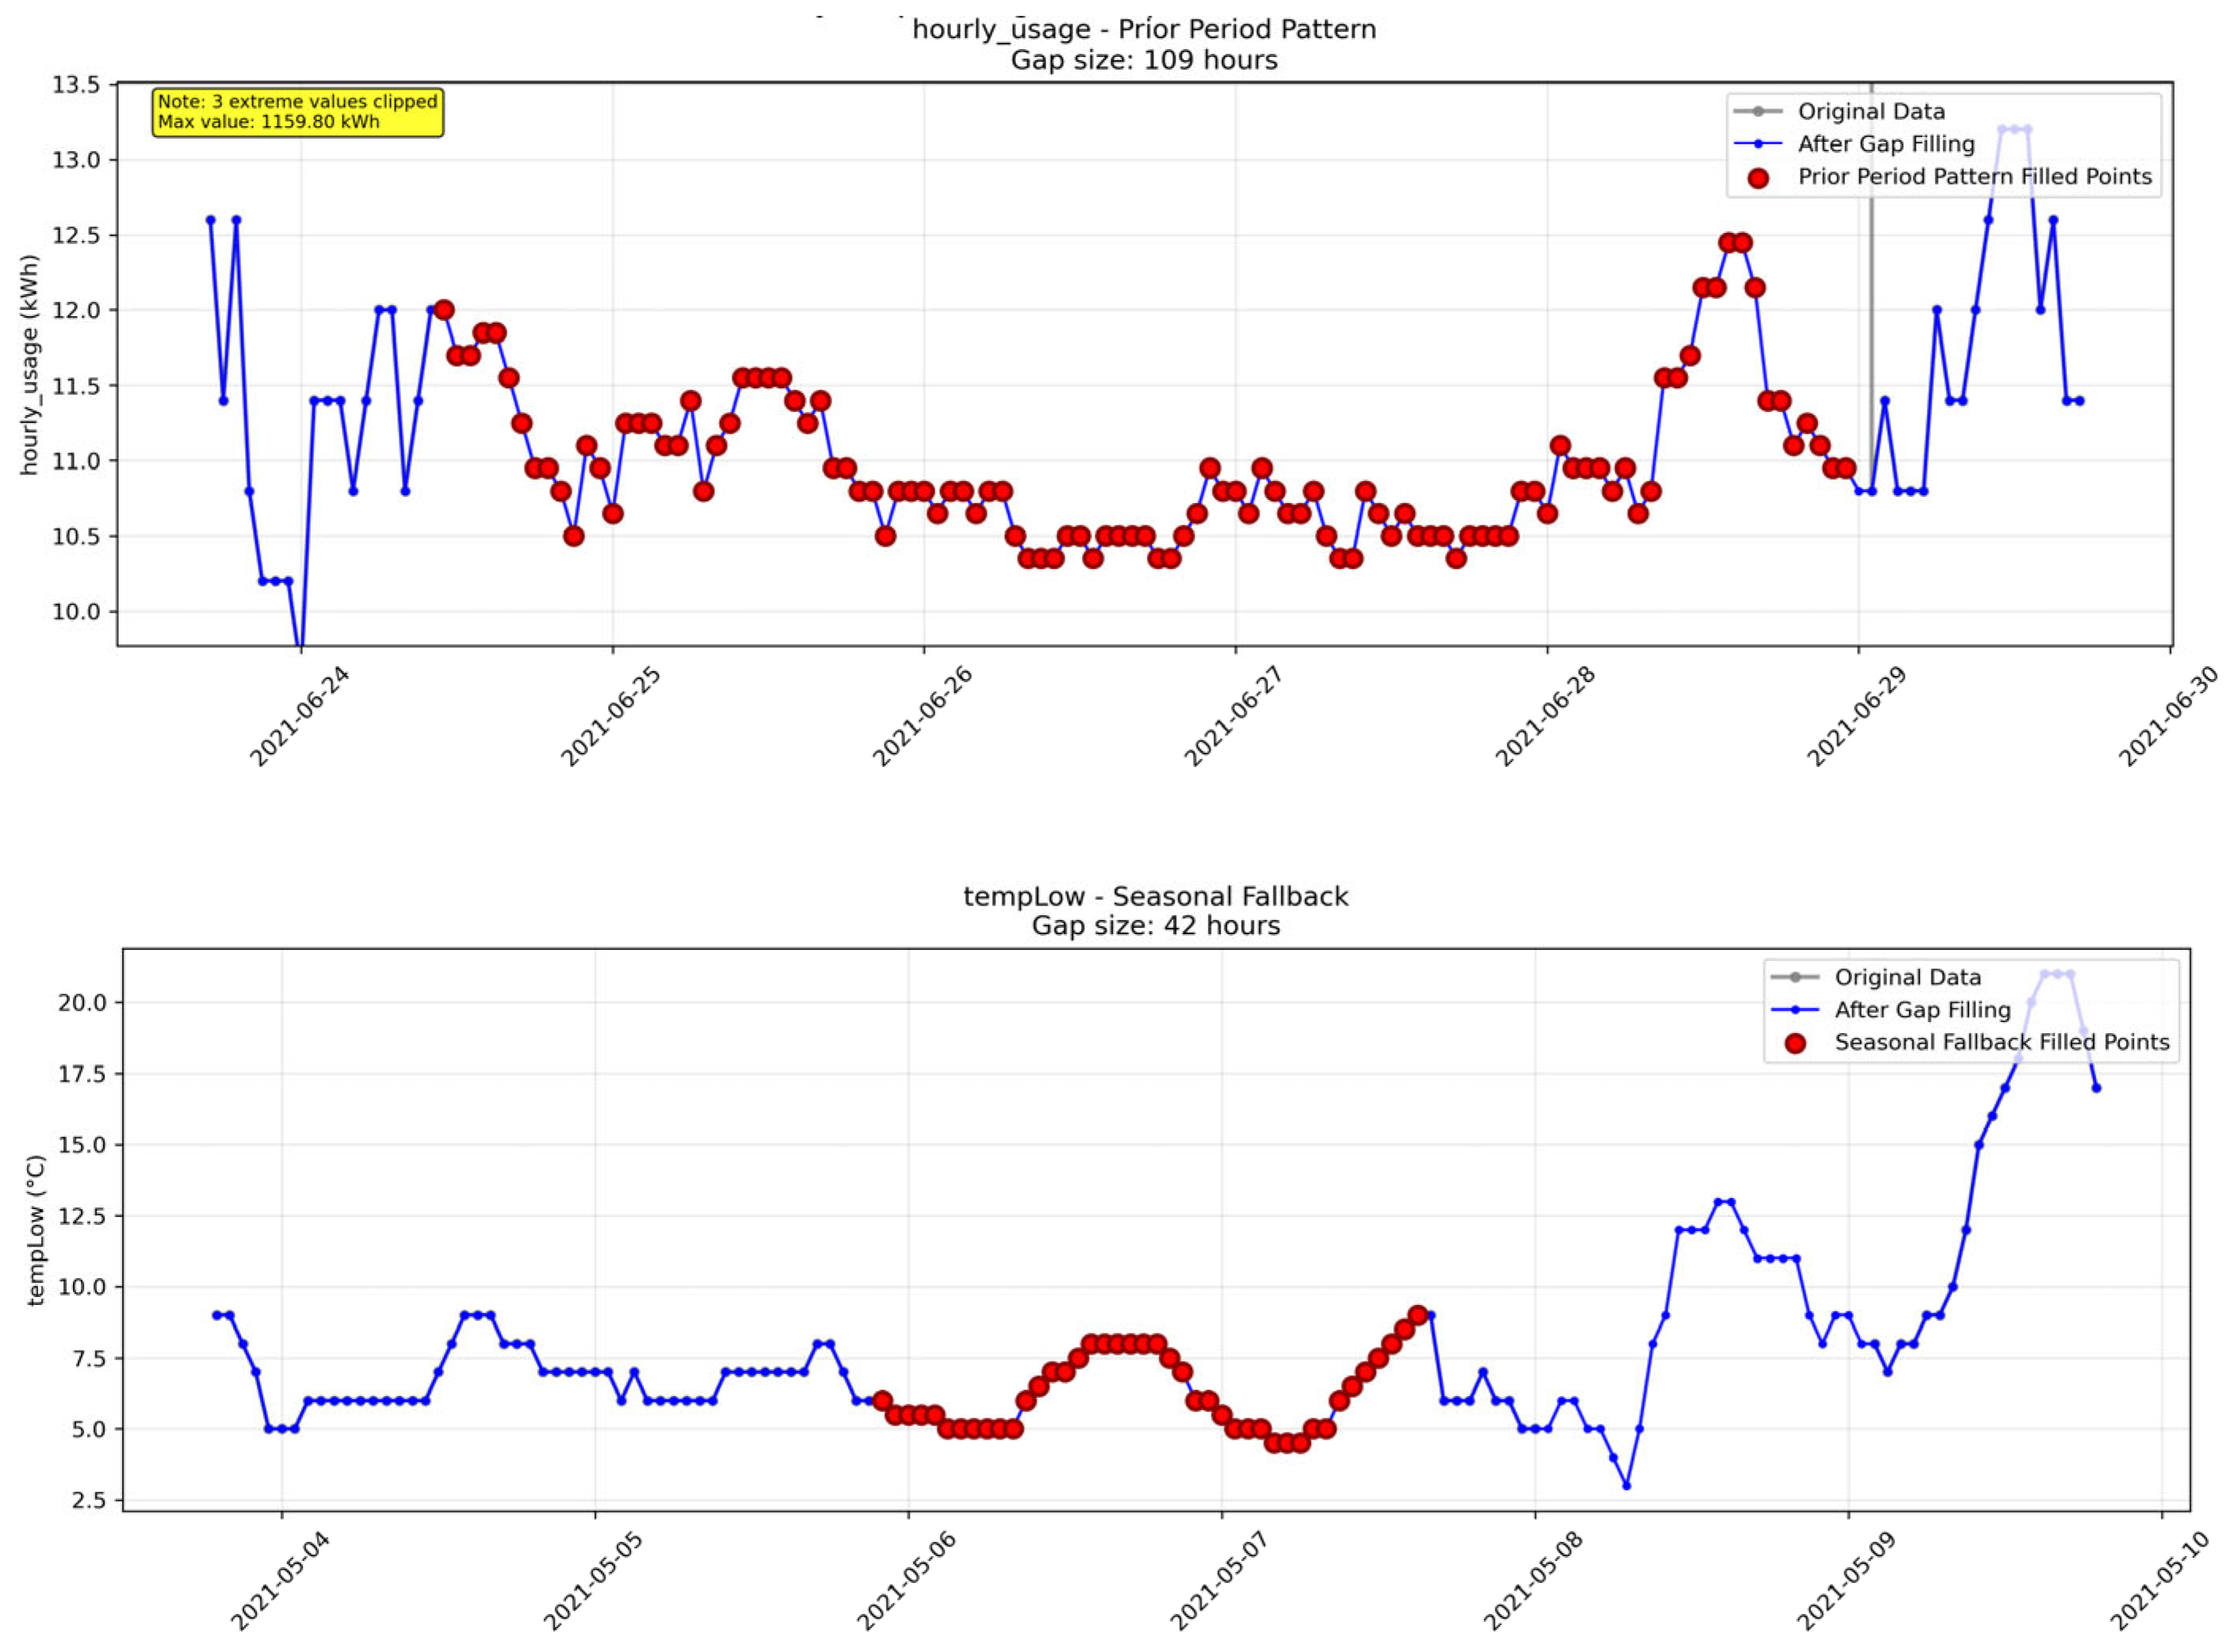
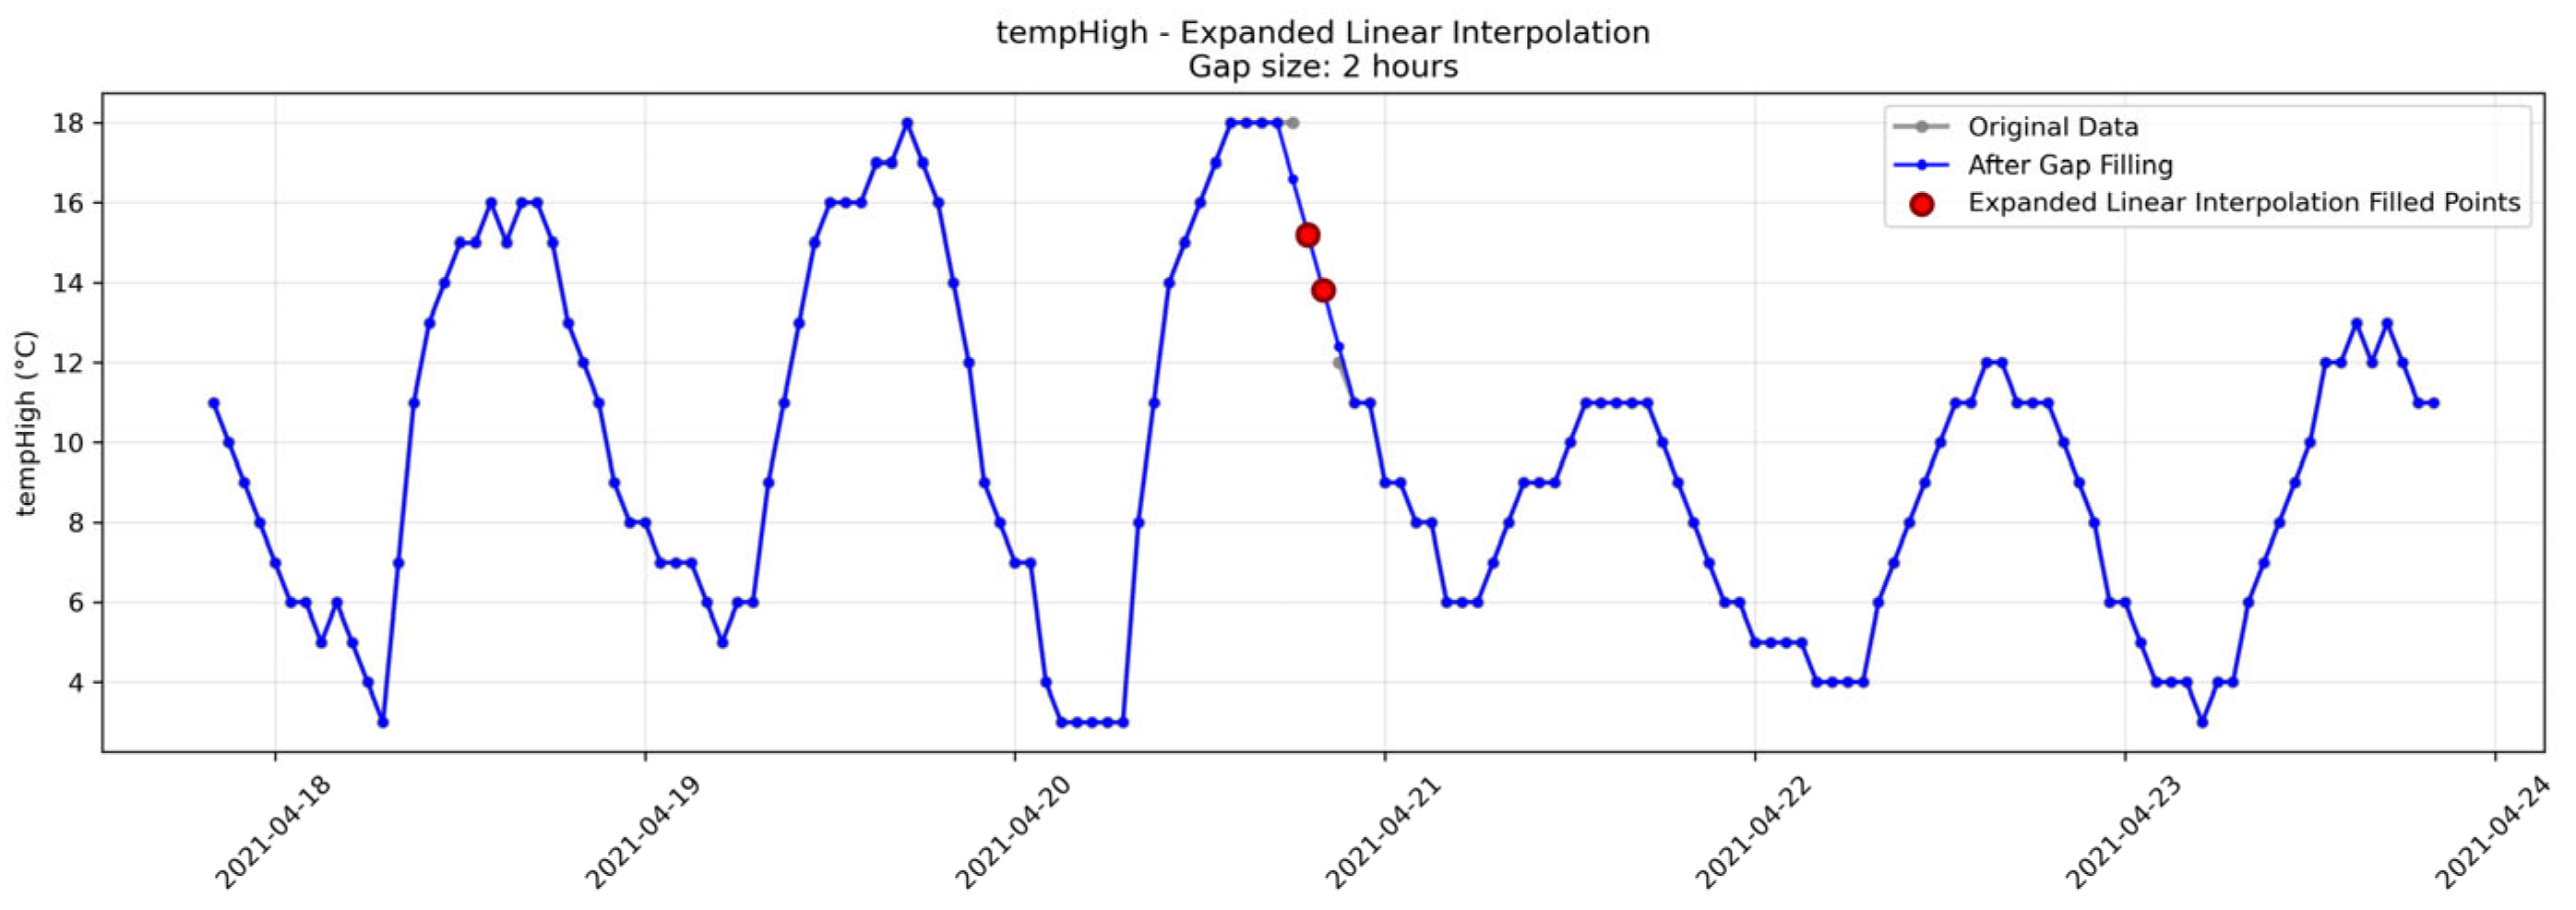
Figure 14.
Case Study – Top 30 Features.
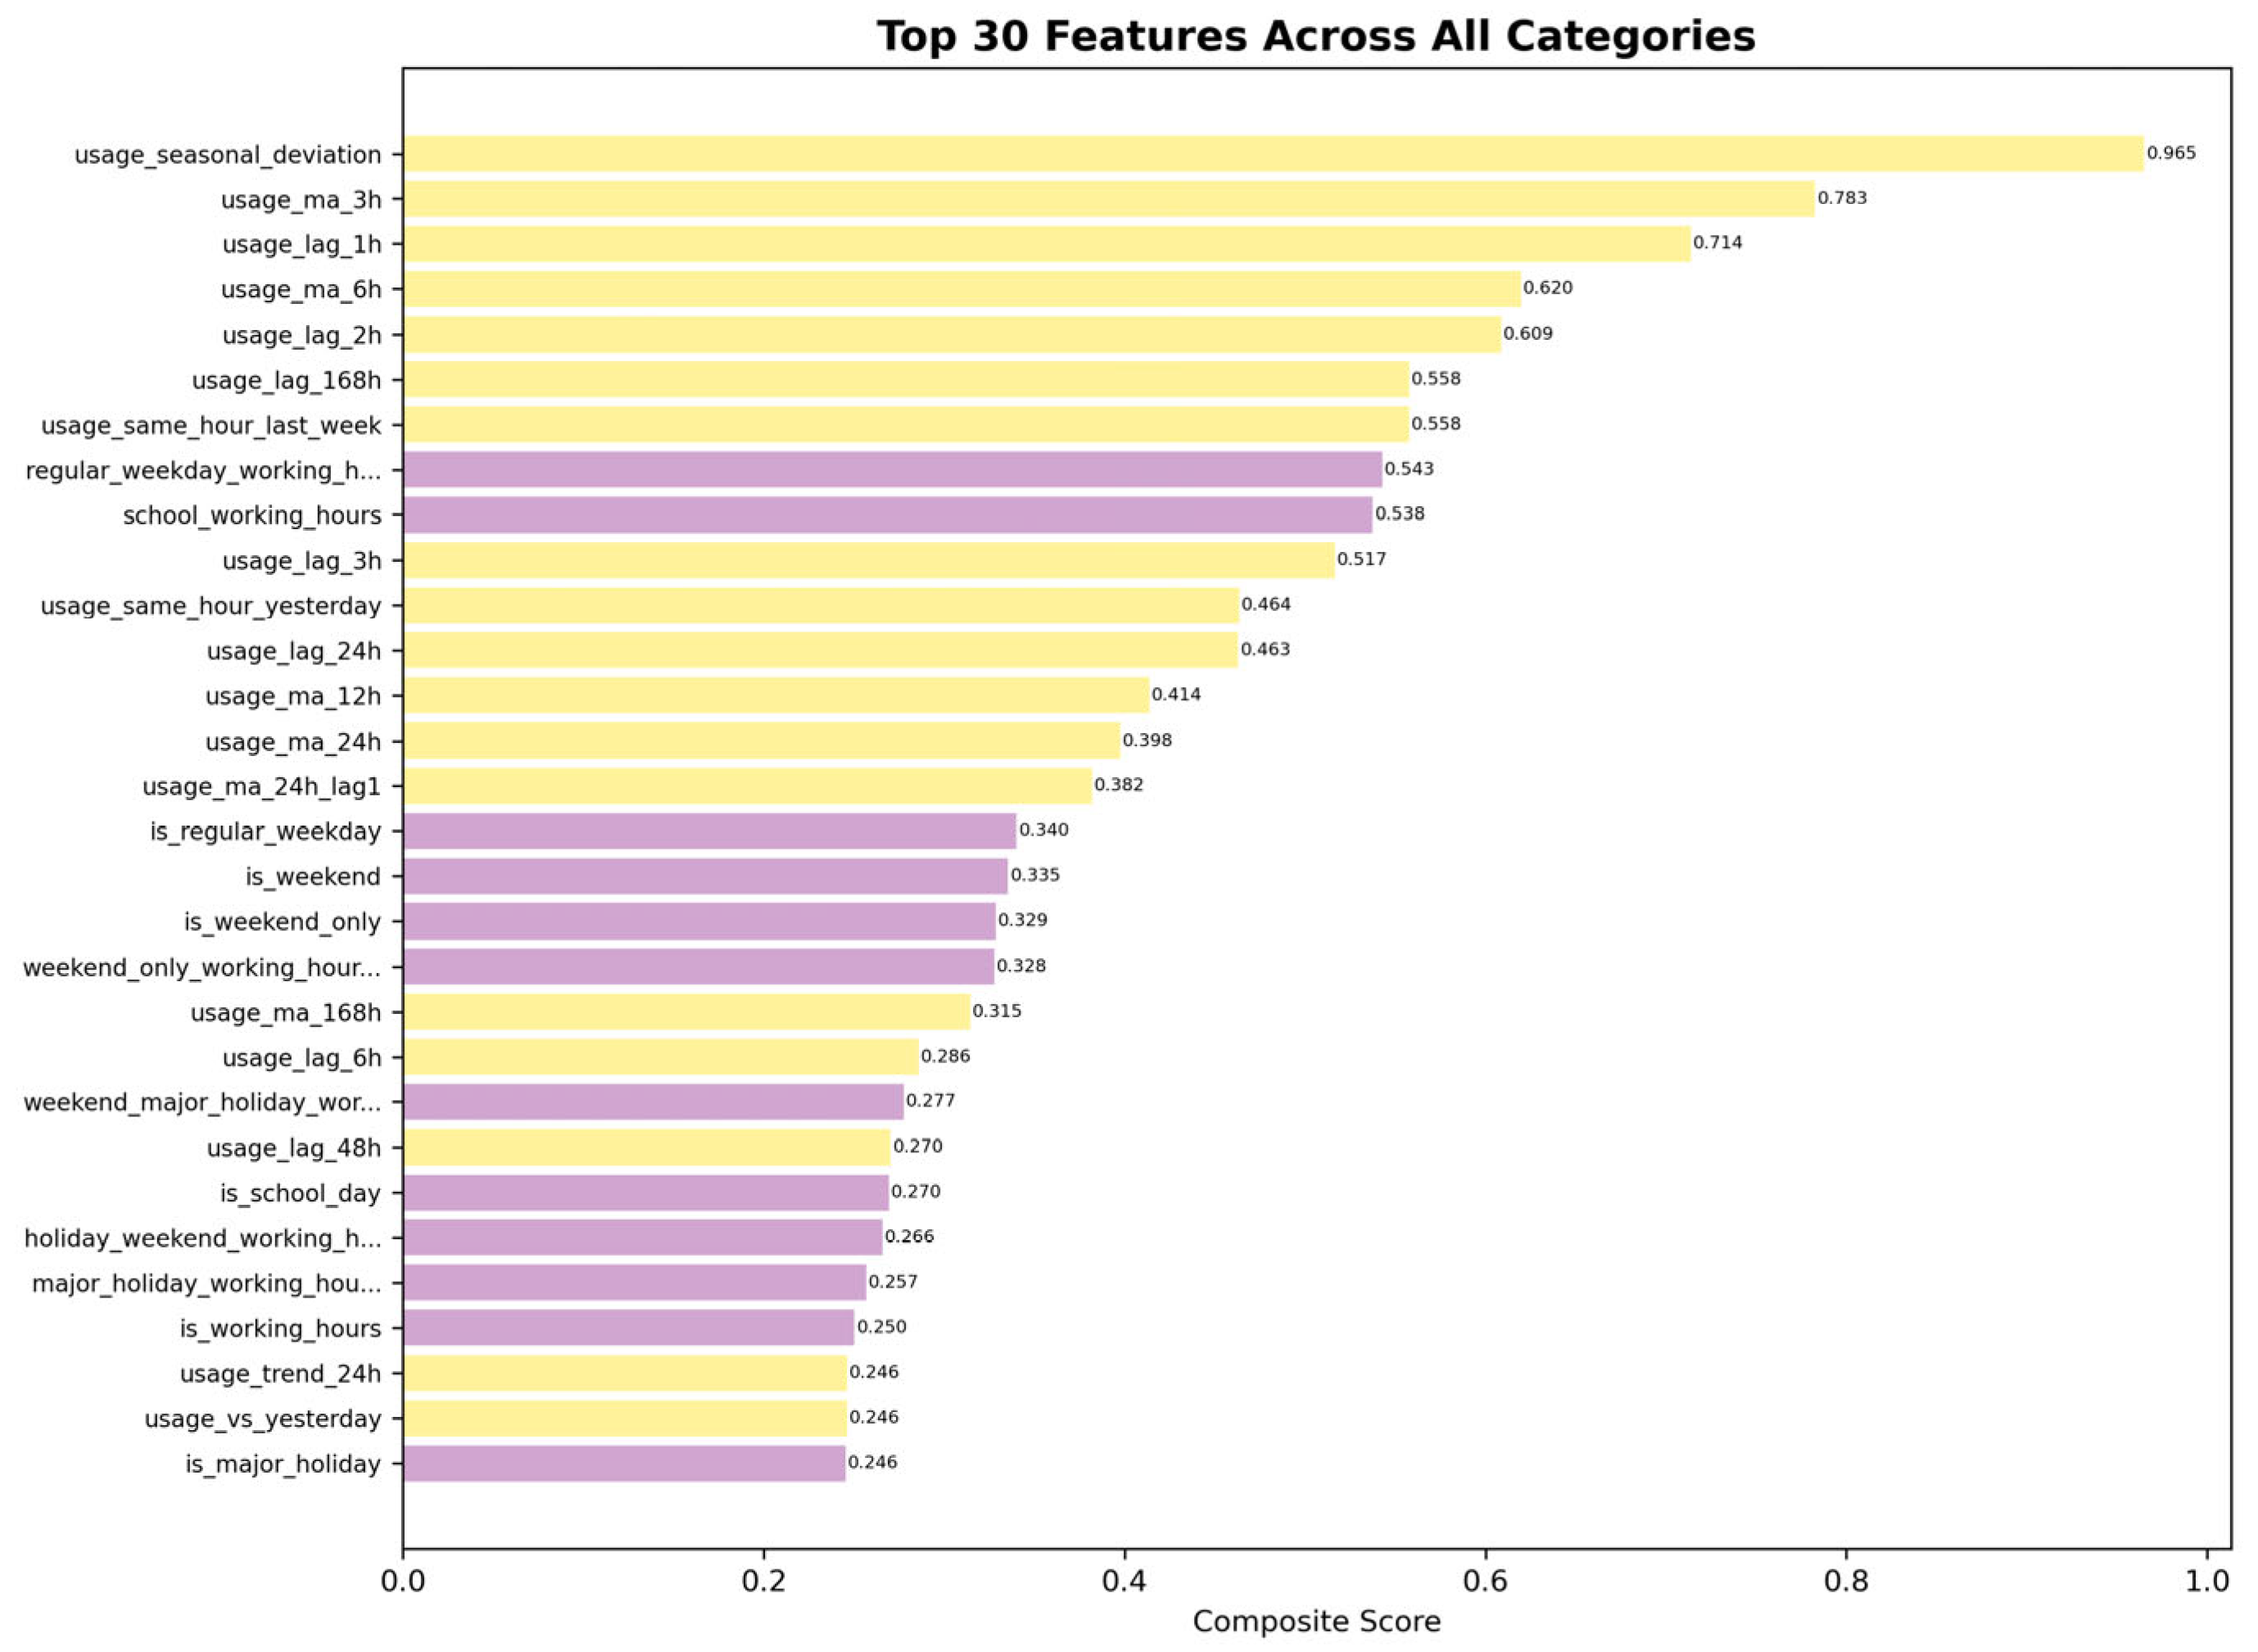
Figure 15.
Case Study – Category Wise Feature Ranking (Derivation Features).
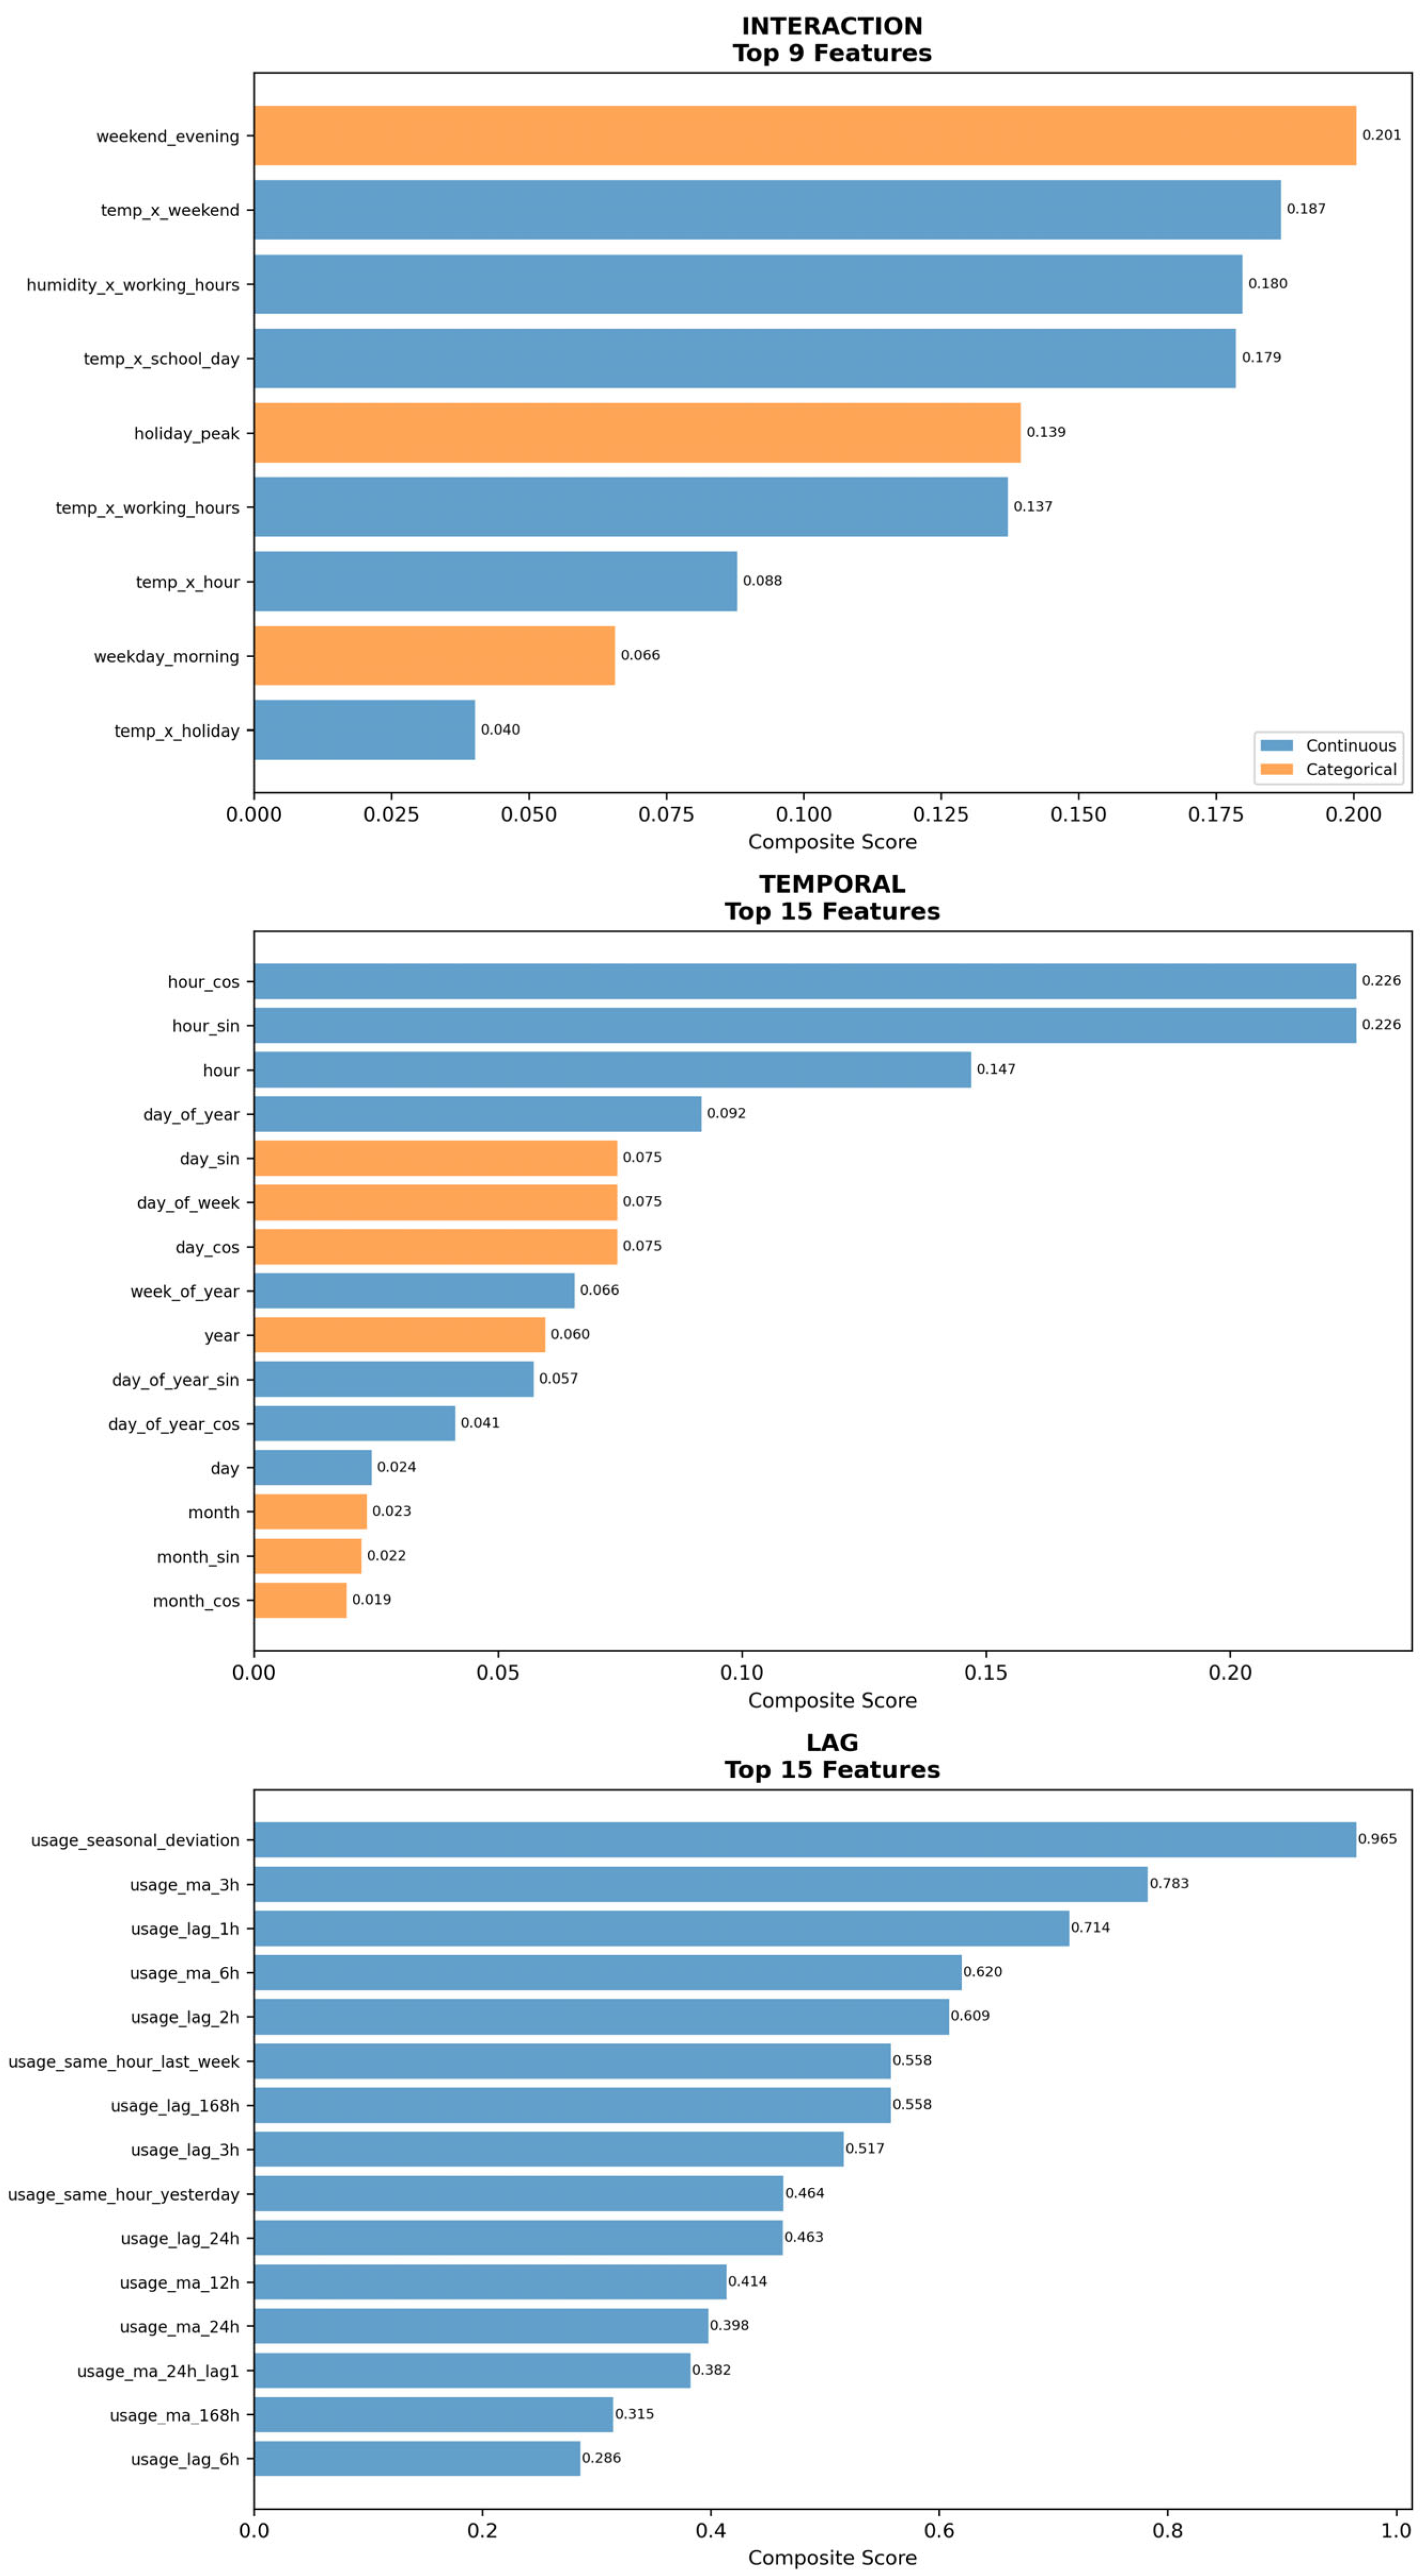
Figure 16.
Case Study – Category Wise Feature Ranking (External Features).
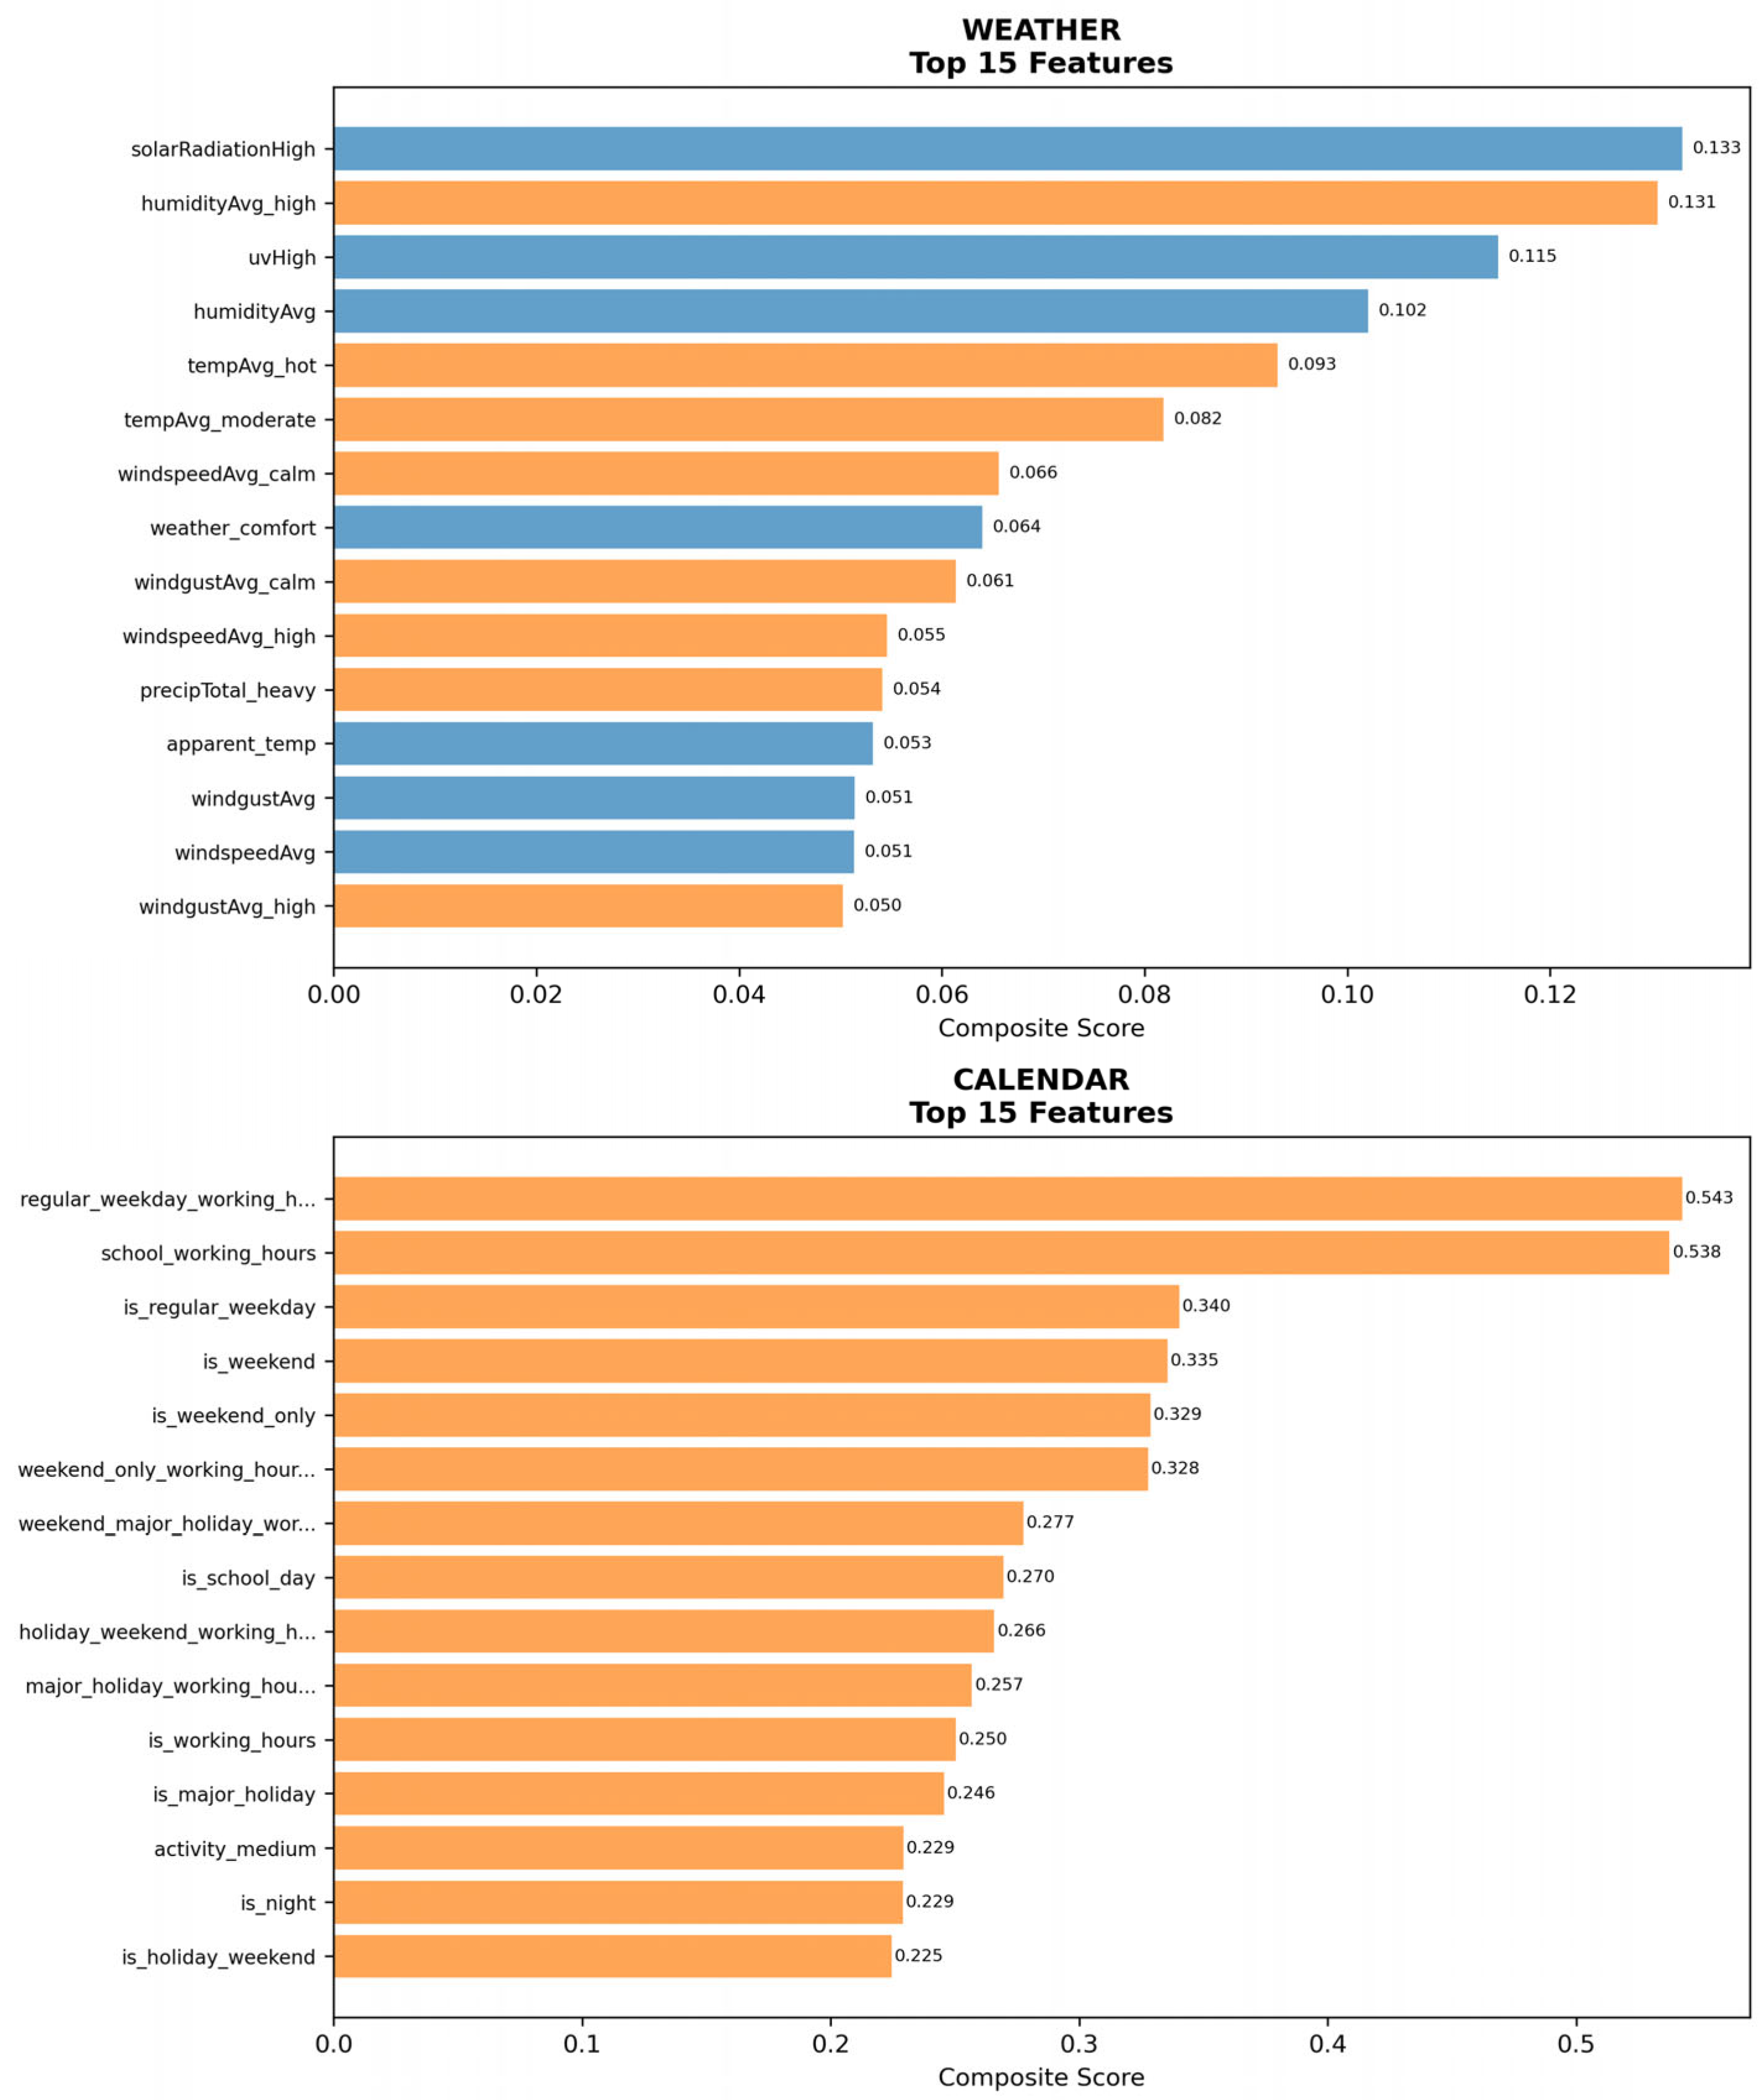
Figure 17.
Case Study – Top Model (RNN) Forecast Samples.
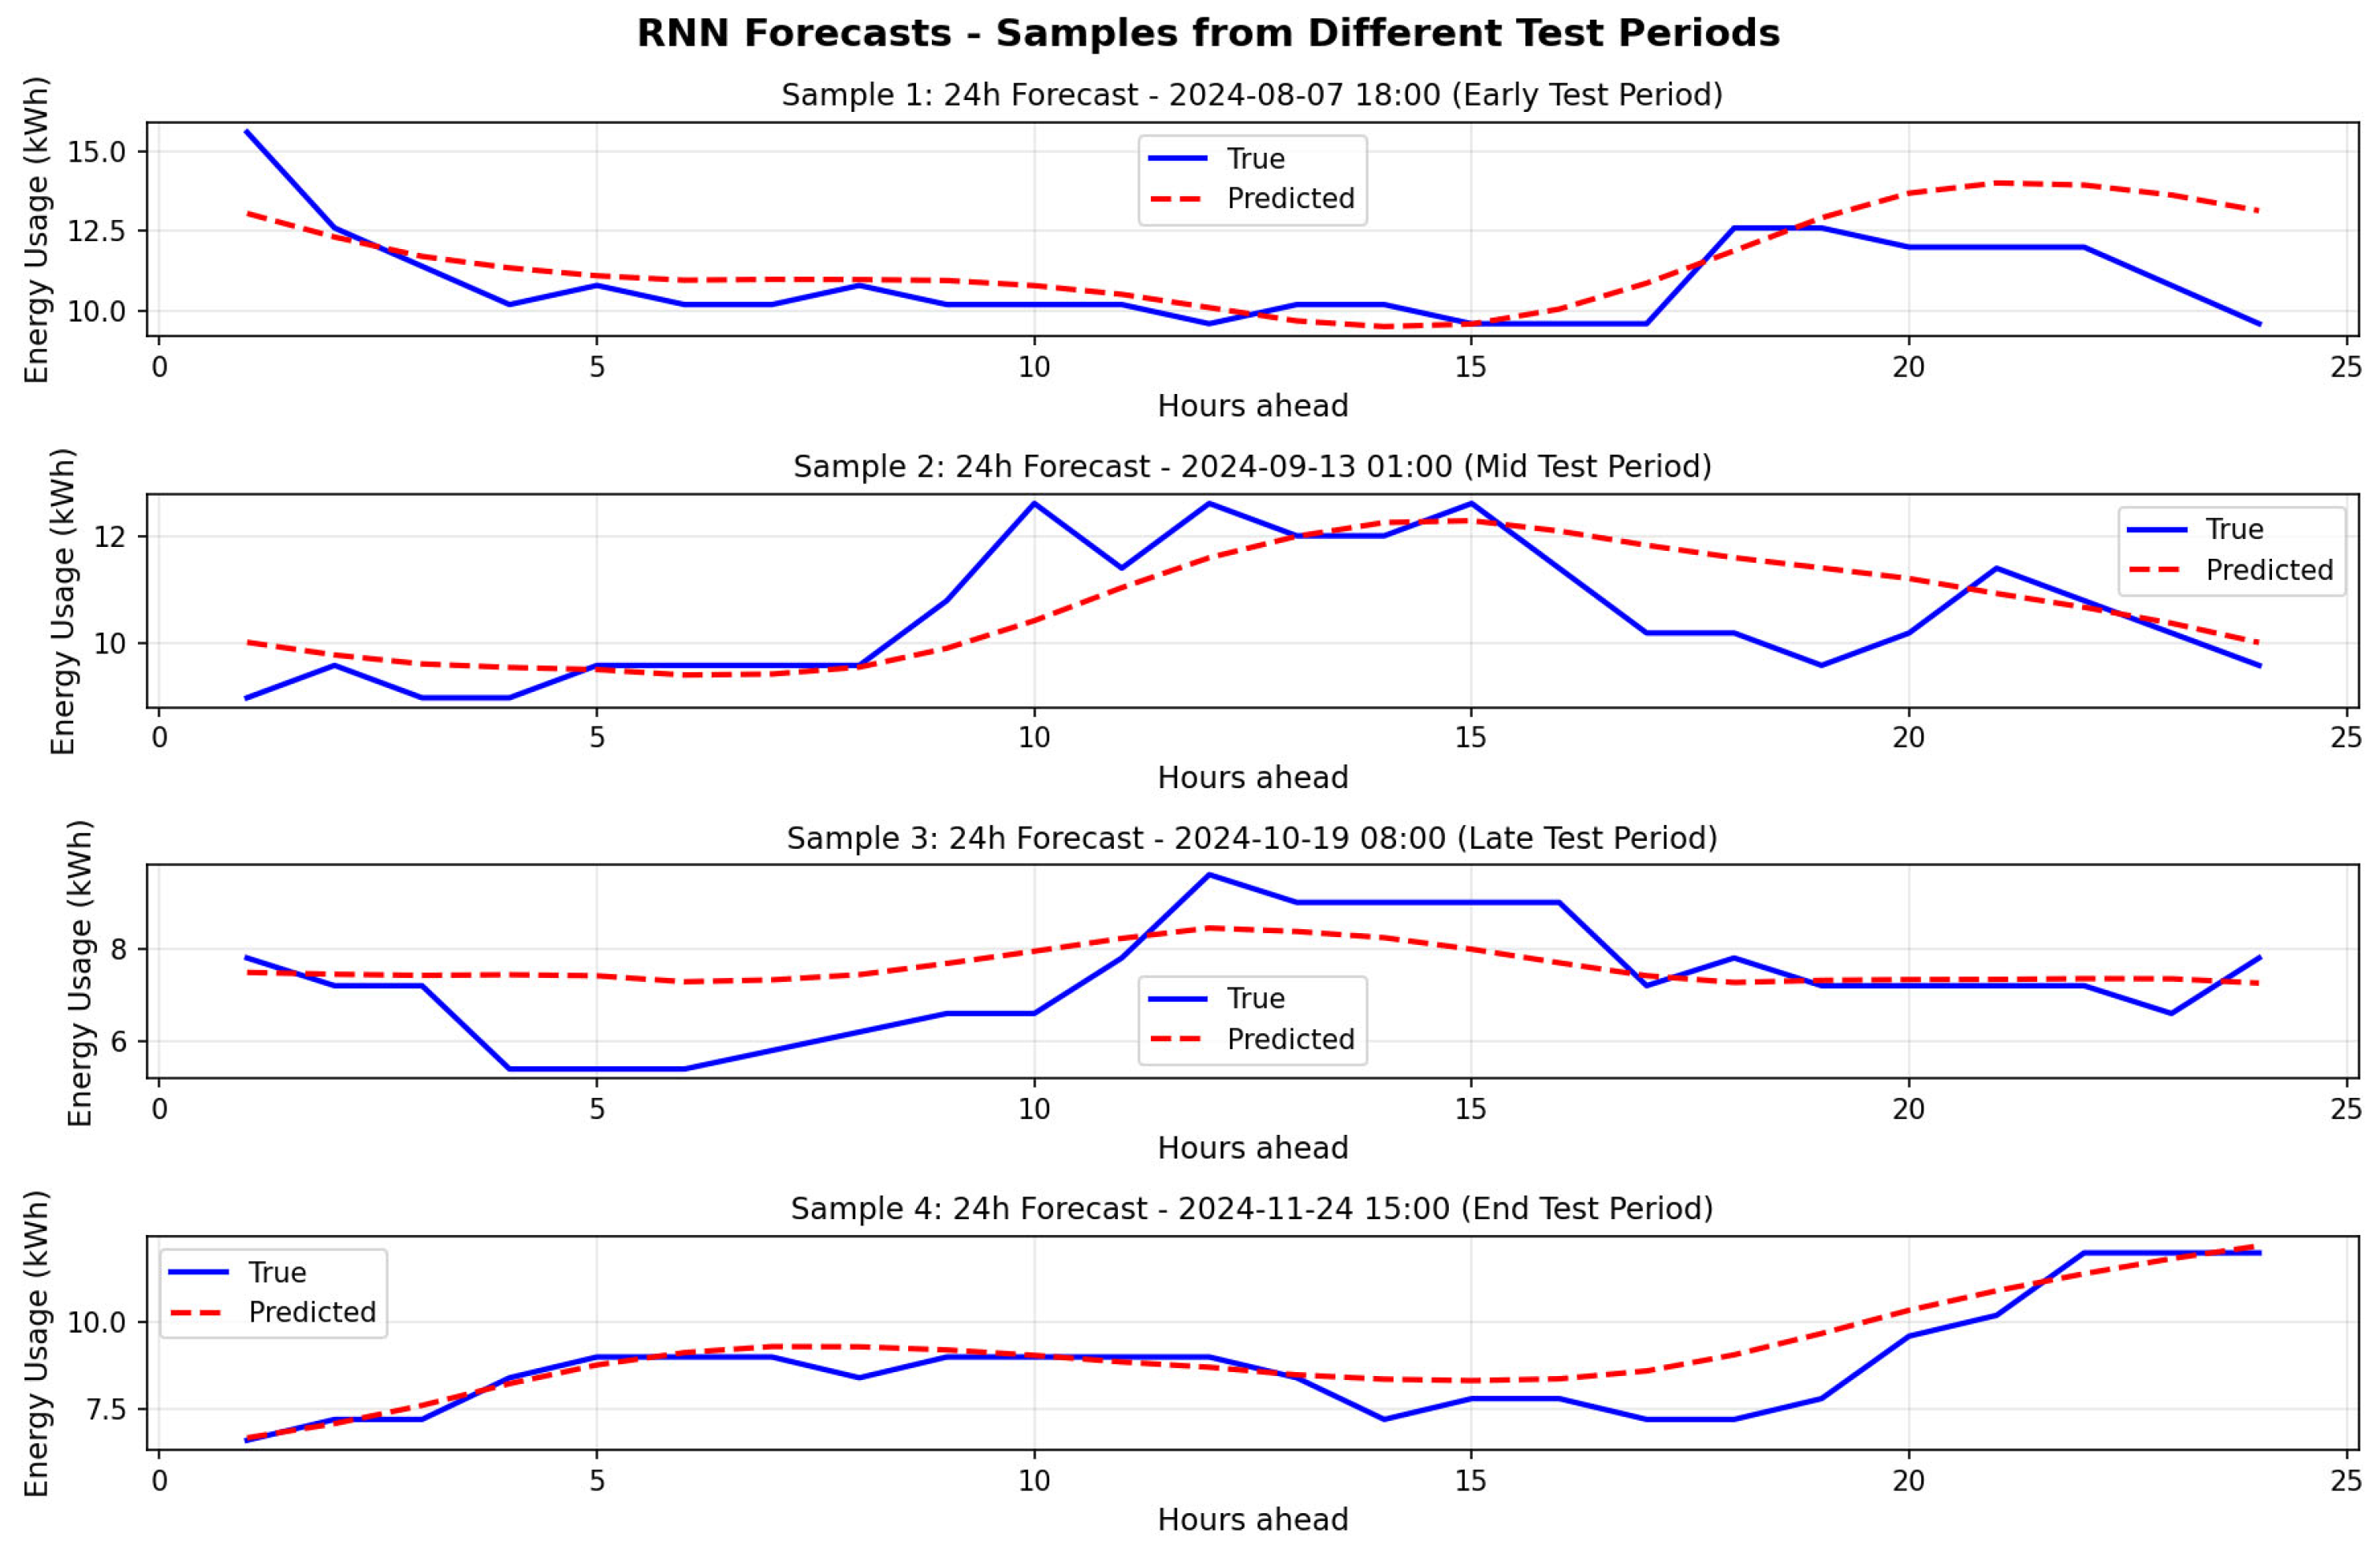
Figure 18.
Case Study – Deploy Model (RNN) Performance.
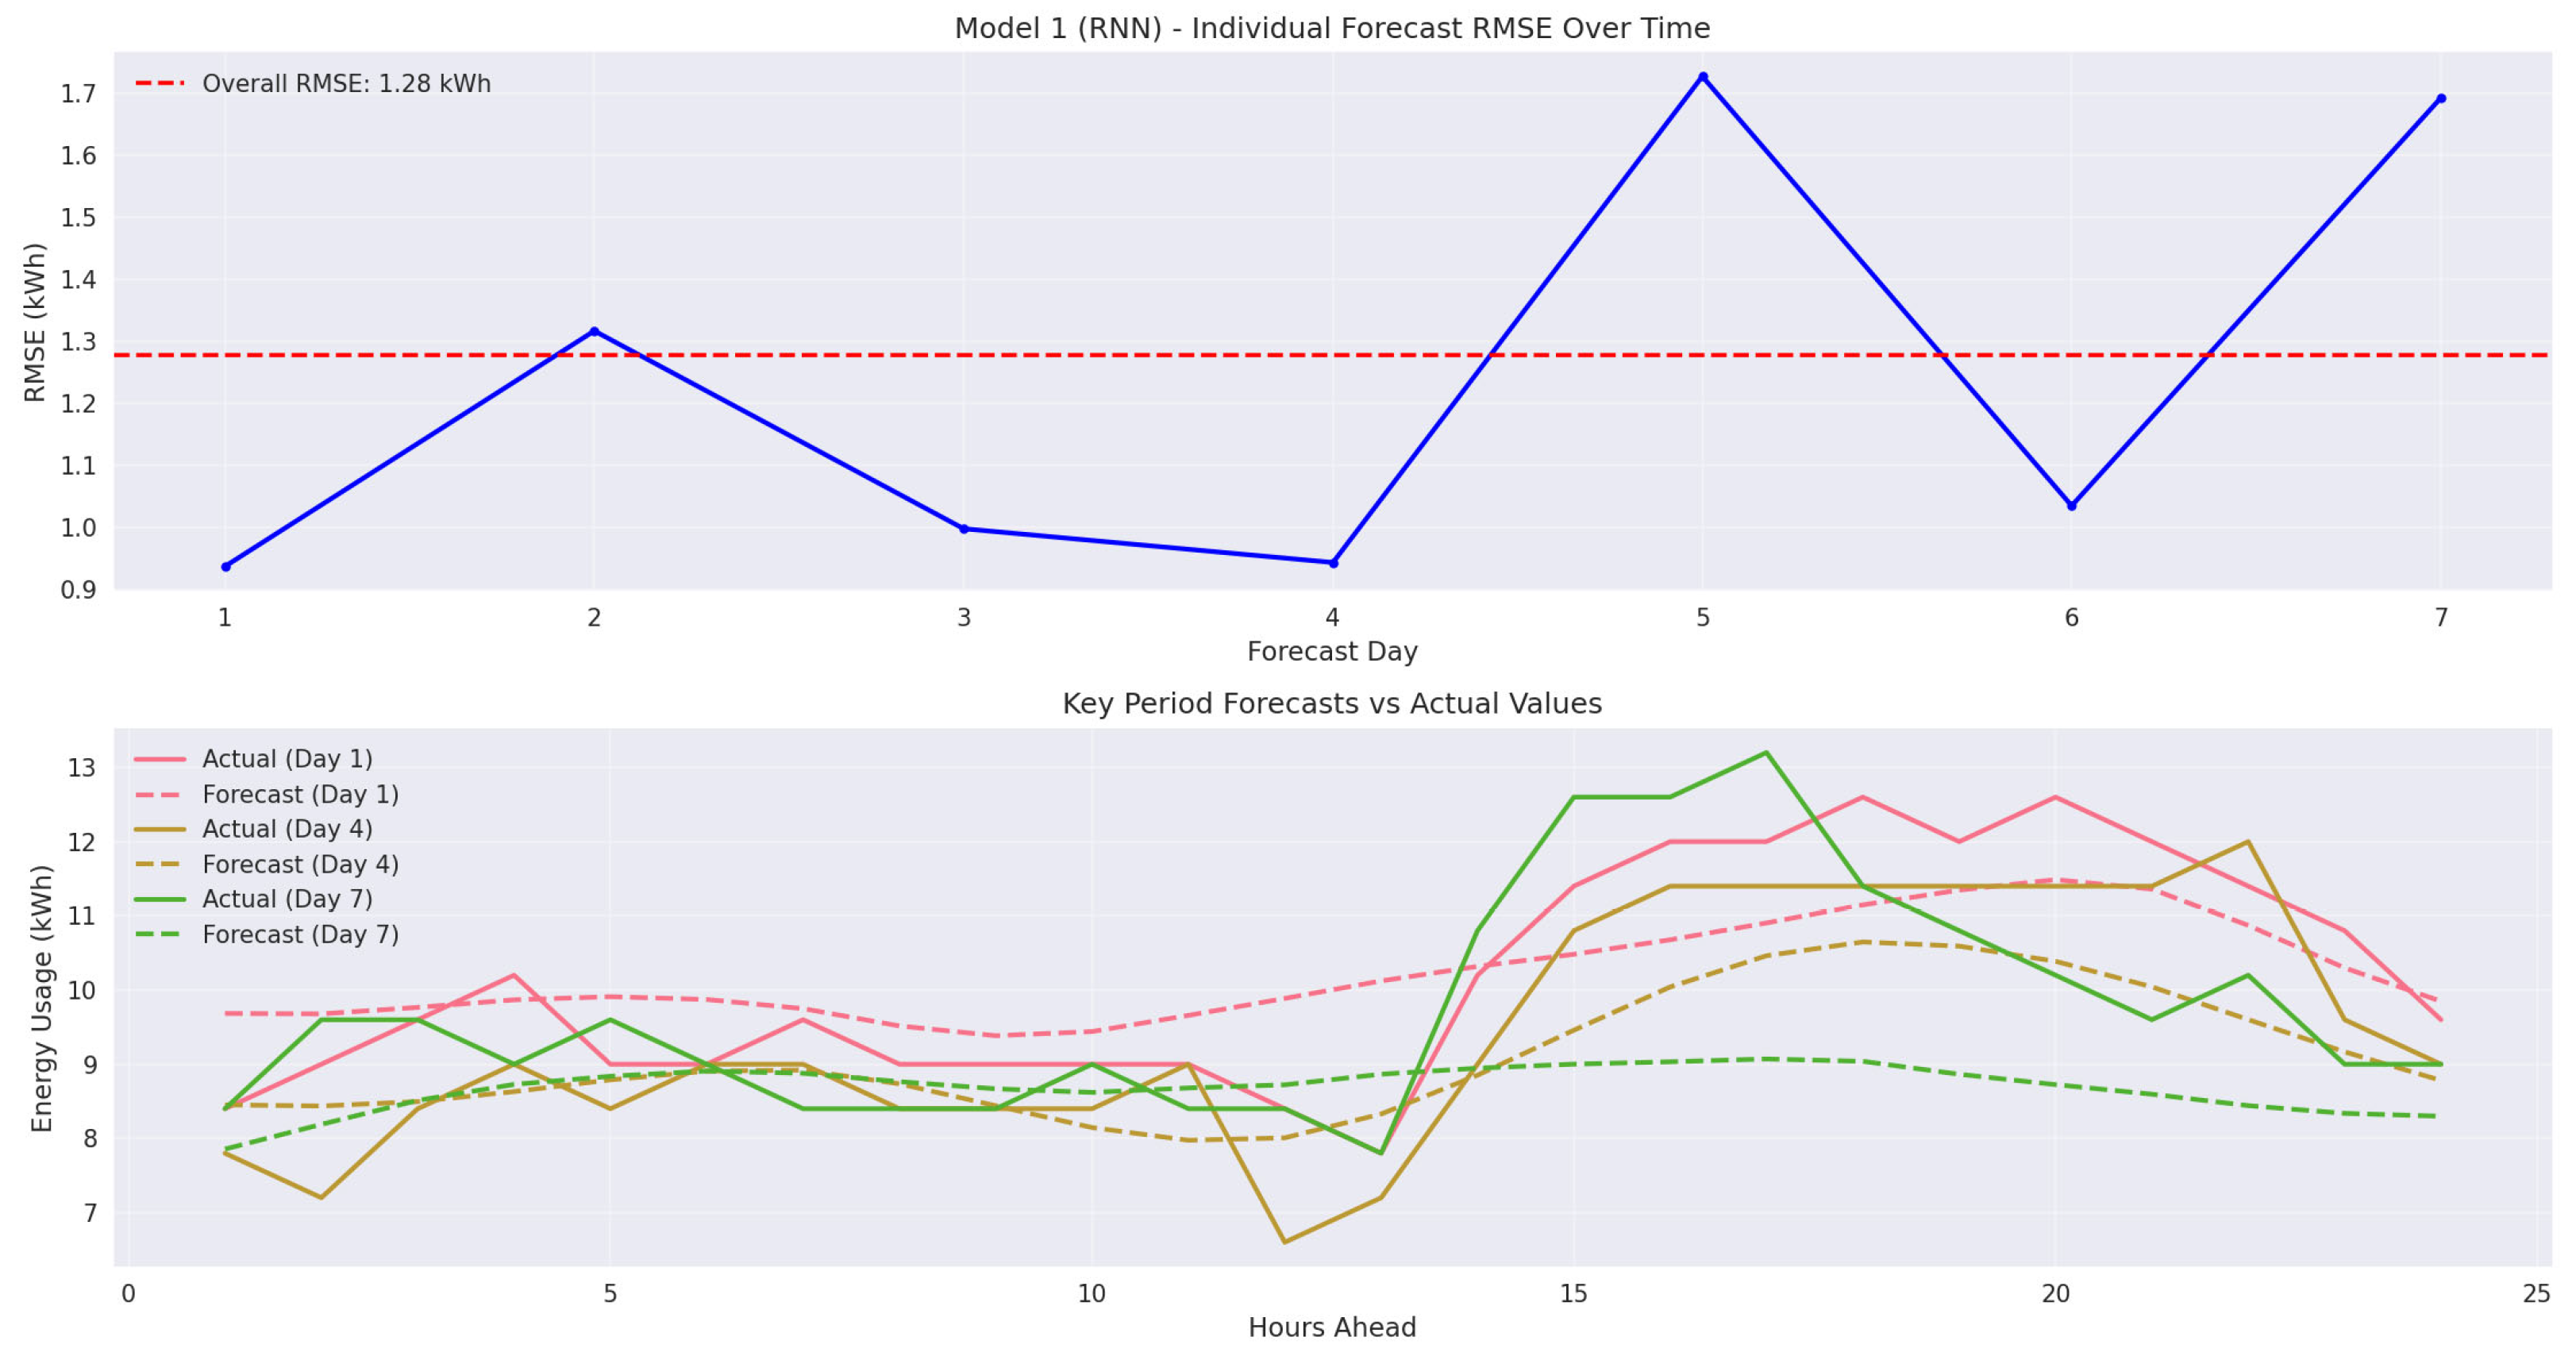
Table 1.
Stakeholder Responsibility Matrix by Phase.
| Phase | Activity | Data Scientists & ML Engineers | Energy Domain Experts | Project Managers | DevOps & MLOps Engineers | Compliance Officers & QA |
| Phase 0 | Scenario Understanding & Alignment | A | A | P | C | A |
| Compliance & Technical Checks | A | A | P | A | P | |
| Gate 0: Foundation Check | A | A | P | A | P | |
| Phase 1 | Data Identification & Quality Check | P | A | G | C | C |
| Data Ingestion & Validation | P | C | G | C | A | |
| Gate 1: Data Acquisition Ready | P | A | P | C | A | |
| Phase 2 | Exploratory Data Analysis | P | A | G | C | C |
| Data Cleaning & Preprocessing | P | A | G | C | C | |
| Gate 2: Preprocessing OK | P | A | P | C | A | |
| Phase 3 | Feature Engineering & Creation | P | A | G | C | C |
| Feature Analysis & Selection | P | A | G | C | C | |
| Gate 3: Features OK | P | A | P | C | A | |
| Phase 4 | Model Scoping | P | A | G | C | C |
| Input Data Preparation | P | C | G | C | C | |
| Model Training & Evaluation | P | A | G | C | C | |
| Model Refinement | P | A | G | C | C | |
| Result Consolidation | P | A | G | C | C | |
| Gate 4: Model Valid | P | A | P | C | A | |
| Phase 5 | Deployment Preparation | A | C | G | P | C |
| UI Setup | C | A | G | P | C | |
| Data Connection | A | C | G | P | C | |
| System Deployment | A | C | G | P | C | |
| Gate 5: Deployment OK | A | A | P | P | A | |
| Phase 6 | Automated Monitoring | C | A | G | P | C |
| Gate 6: Monitoring Governance | C | A | P | P | A | |
| Update Cycle Management | A | C | G | P | C |
Table 2.
Comparative Analysis of Process Frameworks for Energy Forecasting Applications
| Aspect | CRISP-DM | Modern MLOps Pipeline | Proposed Energy Framework |
| Phases / Coverage | 6 phases: Business Understanding, Data Understanding, Data Preparation, Modeling, Evaluation, Deployment. No explicit monitoring phase (left implicit in Deployment). | Varies, but generally covers data ingestion, preparation, model training, evaluation, deployment, and adds monitoring through continuous integration and continuous deployment (CI/CD) for ML [14]. Business understanding is often assumed but not formally part of pipeline; focus is on technical steps. | 7 phases: Project Foundation (Phase 0), Data Foundation (Phase 1), Data Understanding & Preprocessing (Phase 2), Feature Engineering (Phase 3), Model Development & Evaluation (Phase 4), Model Deployment & Implementation (Phase 5), Automated Monitoring & Update (Phase 6). Each phase contains 2-4 sequential workflows with explicit decision gates. |
| Iteration & Feedback Loops | Iterative in theory (waterfall with backtracking) – one can loop back if criteria not met [11], but no fixed decision points except perhaps after Evaluation. Iteration is ad-hoc, relies on team judgement. | Continuous triggers for iteration (e.g., retrain model if drift detected, or on schedule) are often implemented [14]. Pipelines can be re-run automatically. However, decision logic is usually encoded in monitoring scripts or not explicitly formalized as “gates” – it’s event-driven. | Systematic iteration through formal decision gates (Gates 0-6) with predetermined validation criteria. Each gate requires multi-stakeholder review and explicit sign-off. Controlled loopback mechanisms enable returns to earlier phases with documented rationale and tracked iterations. |
| Domain Expert Involvement | Present at start (Business Understanding) and end (Evaluation) implicitly. Domain knowledge guides initial goals and final evaluation, but no dedicated phase for domain feedback mid-process. Often, domain experts’ role in model development is informal. | Minimal integration within automated pipelines. Domain experts typically provide initial requirements and review final outputs, but lack formal validation checkpoints within technical workflows. Manual review stages often implemented separately from core pipeline. | Structured domain expert involvement across all phases with mandatory validation checkpoints. Energy domain expertise formally required for EDA alignment verification (Phase 2), feature interpretability assessment (Phase 3), and model plausibility validation (Phase 4). Five-stakeholder governance model ensures continuous domain-technical alignment. |
| Documentation & Traceability | Emphasized conceptually in CRISP-DM documentation, but not enforced. Artifacts like data or models are managed as part of project assets, but no standard format. Traceability largely depends on the team’s practices. No specific guidance on versioning or provenance. | Strong tool support for technical traceability: version control, experiment tracking, data lineage through pipeline metadata. Every run can be recorded. However, focuses on data and model artifacts; business context or rationale is often outside these tools. Documentation is usually separate from pipeline (confluence pages, etc.). | Comprehensive traceability built-in: Each phase produces artifacts with recorded metadata. Framework requires documentation at each gate transition. Combines the best of tool-based tracking (for data/model versions) with process documentation (decision logs, validation reports). Satisfies traceability requirements for trust and compliance by maintaining provenance from business goal to model deployment. |
| Regulatory Compliance | No explicit compliance framework. Regulatory considerations addressed ad-hoc by practitioners without systematic integration into methodology structure. | Compliance capabilities added as optional pipeline components (bias audits, model cards) when domain requirements dictate. No native compliance framework integrated into core methodology. | Embedded compliance management throughout pipeline lifecycle. Phase 0 establishes comprehensive compliance framework through jurisdictional assessment, privacy evaluation, and regulatory constraint identification. All subsequent phases incorporate compliance validation at decision gates with dedicated Compliance Officer oversight and audit-ready documentation. |
| Modularity & Reusability | High-level phases are conceptually modular, but CRISP-DM doesn't define technical modules. Reusability depends on how project is executed. Not tied to any tooling. | Highly modular in implementation – each pipeline step is a distinct component (e.g., container) that can be reused in other pipelines. Encourages code reuse and standardized components. However, each pipeline is specific to an organization's stack. | Explicitly modular at concept level with energy-specific phases that correspond to pipeline components. Tool-agnostic design allows implementation in any workflow orchestration environment. Clear phase inputs/outputs promote creation of reusable energy forecasting templates for each phase. |
| QA | Relies on final Evaluation; quality mostly measured in model performance and meeting business objective qualitatively. No explicit risk management steps in each phase. | Quality control is often automated via tests in CI/CD that fail pipeline if data schema changes or performance drops. However, these are set up by engineers, not defined in a high-level methodology. | Multi-layered QA with phase-specific success criteria and validation protocols. Energy-specific quality metrics defined for each phase outcome (data completeness thresholds, feature interpretability requirements, model performance benchmarks). Structured reviews and formal validation artifacts ensure comprehensive quality coverage from foundation through deployment. |
Table 3.
Case Study – Project Specification
| Category | Specification Details |
| Use Case Context | Electricity forecasting for office building optimization. |
| Installation & Infrastructure | Existing smart meter infrastructure with hourly data collection. Automated hourly readings from building management system. |
| Factor Impact Analysis | Weather conditions, academic calendar, occupancy patterns. |
| Model Scoping | Tree-Based Models and Neural Network-Based Models. |
Table 4.
Case Study - Phase-Based Requirements and Success Criteria for Energy Forecasting.
| Phase | Requirements | Success Criteria |
| Overall | Define forecasting value Establish appropriate forecasting horizon Define the automatically update interval |
Forecasting value: electricity usage Forecast horizon: 24 hours Automatically update interval: 24 hours |
| Phase 1 | Establish data quality metrics Ensure key factors (e.g. weather, school calendar) are covered Confirm data source availability Define data ingestion success Set overall data quality standards |
≥ 85% data completeness All primary factors represented accessible data sources ≥ 98% successful ingestions Missing values <15%, consistent time intervals, data type correct. |
| Phase 2 | Align data patterns with domain knowledge Establish data cleaning success benchmarks |
Temporal cycles visible in data Outliers < 5% post-cleaning |
| Phase 3 | Generate sufficient, relevant features (lag, calendar, temporal, weather, and interaction features) | Feature set covers key drivers |
| Phase 4 | Validate data preparation pipeline Model meet performance metrics |
No data leaks after transform MAPE < 15% on validation |
| Phase 5 | Validate model in production Confirm data quality and connectivity Verify system-level integration |
Live model predictions match dev-stage metrics within ±25% Quality good, Uptime > 99%, APIs response time < 2s Data pipeline integrated and producing outputs without error |
| Phase 6 | Define output quality acceptance | Forecast degradation < 25% from baseline |
Disclaimer/Publisher’s Note: The statements, opinions and data contained in all publications are solely those of the individual author(s) and contributor(s) and not of MDPI and/or the editor(s). MDPI and/or the editor(s) disclaim responsibility for any injury to people or property resulting from any ideas, methods, instructions or products referred to in the content. |
© 2025 by the authors. Licensee MDPI, Basel, Switzerland. This article is an open access article distributed under the terms and conditions of the Creative Commons Attribution (CC BY) license (http://creativecommons.org/licenses/by/4.0/).
Copyright: This open access article is published under a Creative Commons CC BY 4.0 license, which permit the free download, distribution, and reuse, provided that the author and preprint are cited in any reuse.


