
Submitted:
17 August 2025
Posted:
18 August 2025
You are already at the latest version
Abstract
Air quality monitoring in many cities of the Global South is constrained by sparse ground-based networks and persistent cloud cover, limiting the ability to detect fine-scale spatial patterns and temporal trends. This study evaluates the potential of annual multi-sensor satellite embeddings from the AlphaEarth Foundations model in Google Earth Engine to predict and map major air pollutants in Quito, Ecuador, between 2017 and 2024. The 64-dimensional embeddings integrate Sentinel-1 radar, Sentinel-2 optical imagery, Landsat surface reflectance, ERA5-Land climate variables, GRACE terrestrial water storage, and GEDI canopy structure into a compact representation of surface and climatic conditions. Annual median concentrations of NO₂, SO₂, PM₂.₅, CO, and O₃ from the Red Metropolitana de Monitoreo Atmosférico de Quito (REEMAQ) were paired with collocated embeddings and modeled using five machine learning algorithms. Support Vector Regression achieved the highest accuracy for NO₂ and SO₂ (R² = 0.71 for both), capturing fine-scale spatial patterns and multi-year changes, including COVID-19 lockdown-related reductions. PM₂.₅ and CO were predicted with moderate accuracy, while O₃ remained challenging due to its short-term photochemical and meteorological drivers and the mismatch with annual aggregation. SHAP analysis revealed that a small subset of embedding bands dominated predictions for NO₂ and SO₂. The approach provides a scalable and transferable framework for high-resolution urban air quality mapping in data-scarce environments, supporting long-term monitoring, hotspot detection, and evidence-based policy interventions.
Keywords:
urban air quality
; satellite embeddings
; Google Earth Engine
; machine learning
; Quito
1. Introduction
Urban air pollution remains a major environmental and public health challenge, particularly in cities of the Global South where resources for continuous air quality monitoring are limited [1,2]. In many cases, the establishment and maintenance of dense air quality networks or low-cost sensor alternatives are financially and logistically unfeasible [3,4], restricting the ability of decision-makers to assess pollutant dynamics, evaluate policy interventions, and protect public health. Exposure to nitrogen dioxide (NO₂), sulfur dioxide (SO₂), fine particulate matter (PM₂.₅), ozone (O₃), and carbon monoxide (CO) is consistently associated with respiratory and cardiovascular diseases, premature mortality, and significant socio-environmental impacts, highlighting the need for cost-effective and transferable approaches to estimate their spatial and temporal variability [5,6].
Quito, Ecuador—located at 2,850 m above sea level in the tropical Andes—faces complex air quality issues driven by vehicular emissions, industrial activity, and topographically induced thermal inversions [7]. The city’s Red Metropolitana de Monitoreo de la Calidad del Aire (REEMAQ) is the only operational network in Ecuador, providing valuable ground-based measurements but with limited spatial coverage and insufficient station density to capture the city’s pronounced spatial heterogeneity [8]. Most of the Ecuadorian territory remains without systematic air quality monitoring.
Previous studies in Quito have used remote sensing combined with regression-based models, such as land-use regression (LUR) approaches using Landsat or MODIS-derived indices and meteorological data, achieving good performance but facing recurring limitations: reliance on handcrafted features from specific sensors, dependence on additional ground-based variables, limited spatial transferability requiring city-specific recalibration, high cloud density during most of the year that affects optical remote sensing data [9], and weak temporal generalization for multi-year predictions [10,11].
Recent advances in artificial intelligence have introduced satellite image embeddings—dense, information-rich feature vectors generated from multi-sensor Earth observation datasets through self-supervised learning—which address many of these constraints [12]. Google DeepMind’s AlphaEarth Foundations (AEF) model integrates over 3 billion geospatial observations from Sentinel-1 SAR, Sentinel-2 optical bands, Landsat imagery, ERA5-Land meteorology, GRACE hydrology, and GEDI LiDAR canopy data, producing globally consistent 64-dimensional embeddings summarizing spectral, seasonal, and structural characteristics at 10 m resolution [13]. Available via Google Earth Engine (GOOGLE/SATELLITE_EMBEDDING/V1/ANNUAL), these embeddings are robust to cloud contamination, require no manual feature engineering, and enable scalable applications in data-scarce environments [14].
While embeddings have been successfully applied to land cover classification, biomass estimation, and environmental monitoring, their use for urban air pollution prediction remains unexplored. This study addresses that gap by assessing the predictive capacity of AEF embeddings for annual NO₂, SO₂, PM₂.₅, CO, and O₃ concentrations in Quito, using only satellite-derived features and machine learning [15,16,17]. Multiple regression algorithms—Support Vector Regression, Ridge Regression, Random Forest, Gradient Boosting, and k-Nearest Neighbors—are compared, and model interpretation is carried out using Shapley Additive Explanations (SHAP) [18,19]. Building on the best-performing models, we generate high-resolution (10 m) prediction maps for NO₂ and SO₂ for 2017 and 2024 to analyze spatial patterns and temporal changes. The objectives are to (i) evaluate the performance of machine learning models in predicting annual pollutant concentrations from satellite embeddings, (ii) identify the most influential embedding features, and (iii) produce fine-scale maps using only remote sensing data from embedding features to assess multi-year changes, offering a scalable framework for urban air quality assessment in the Global South.
2. Materials and Methods
2.1. Study Area
This study focuses on Quito, the capital of Ecuador, situated in the tropical Andes at an elevation of approximately 2,850 m above sea level (Figure 1). The city has a population of over 2.7 million and is characterized by diverse topography, ranging from densely urbanized basins to mountainous peripheries. Quito exhibits moderate seasonal variability but is strongly influenced by meteorological phenomena such as thermal inversions, which intensify pollutant accumulation. The city’s air quality is primarily affected by vehicular traffic, industrial emissions, biomass burning, and social disruptions such as strikes or exceptional events like the COVID-19 pandemic [20]. Frequent cloud cover and the limited spatial distribution of monitoring stations make Quito a representative case of a data-scarce urban environment.
2.2. Ground-Based Air Quality Data (REEMAQ)
Ground truth data were obtained from the Red Metropolitana de Monitoreo Atmosférico de Quito (REEMAQ), the city’s official air quality monitoring network, managed by the Secretaría de Ambiente de Quito [8] and available through the open data portal https://datosambiente.quito.gob.ec/. The dataset comprised measurements of five pollutants—NO₂, SO₂, PM₂.₅, O₃, and CO—recorded between 2017 and 2024 at the nine monitoring stations shown in Figure 1: San Antonio, Carapungo, Cotocollao, Belisario, Centro, El Camal, Guamaní, Los Chillos, and Tumbaco. Original REEMAQ measurements are reported at hourly intervals; to ensure compatibility with the temporal resolution of the satellite embeddings, we aggregated these data to annual median concentrations for each pollutant and station. This temporal aggregation reduced the influence of extreme values, ensured statistical robustness, and matched the yearly scale of the embedding features. Prior to aggregation, the dataset was checked for null values and missing or invalid records were removed. Only stations with complete annual records for each pollutant were retained in the final dataset. For model training and prediction, the geographic coordinates of each station were used to extract the corresponding 64-band satellite embedding values from Google Earth Engine.
2.3. Satellite Embeddings (A00–A63)
We employed the AlphaEarth Foundations (AEF) embedding dataset, a global multi-sensor representation model designed to encode spatial patterns of Earth surface and climate variables into compact, information-rich feature vectors [21]. The embeddings were generated using a transformer-based architecture trained on a diverse range of Earth observation datasets, including Sentinel-1 synthetic aperture radar (SAR) backscatter, Sentinel-2 and Landsat-8 multispectral reflectance, MODIS vegetation indices, GRACE gravity anomalies, GEDI canopy height, topography, soil moisture, and atmospheric parameters from ERA5-Land reanalysis. This combination captures domains such as land cover, vegetation structure and phenology, biomass, hydrology, and climate.
For this study, we accessed the annual embedding layers through Google Earth Engine under the collection ID GOOGLE/SATELLITE_EMBEDDING/V1/ANNUAL. Each layer is provided at 10 m spatial resolution for the years 2017–2024, with each pixel containing a 64-dimensional vector encoding latent information from the original multi-sensor datasets. These embeddings integrate both static and dynamic environmental properties, including optical and radar signals, vegetation metrics, topographic context, and long-term climate patterns.
A key advantage of the AEF embeddings over traditional satellite-derived indices is their data fusion capability, which allows heterogeneous data sources to be combined into a unified representation. This enables robust predictive modeling even in data-scarce environments. Additionally, because they incorporate climate reanalysis data from ERA5-Land, the embeddings implicitly encode meteorological and seasonal patterns without requiring separate climate covariates.
At inference time, only the input datasets are required to generate embeddings for new locations or years, making the system highly scalable and suitable for applications in regions without extensive monitoring infrastructure. In this study, the embeddings served as the sole predictor variables in machine learning models for air pollutant concentrations, eliminating the need for manually engineered features.
The inclusion of ERA5-Land variables means that the embeddings contain not only surface spectral and structural information but also annual climate summaries. This integration allows the model to account for long-term meteorological context, even though short-term weather variability is not explicitly represented due to the annual aggregation.
The embeddings are provided at 10-meter resolution, are robust to cloud contamination, and are consistent across years and regions. For each REEMAQ station and year, we extracted the full set of embedding bands (A00–A63) as predictor variables for the machine learning models.
2.4. Machine Learning Models and Evaluation
We trained and evaluated five machine learning regression models using the 64-band annual embeddings (A00–A63) to predict the annual concentrations of each pollutant. The models tested were Support Vector Regression (SVR) [22], Ridge Regression [23], Random Forest Regressor [24], Gradient Boosting Regressor [25], and k-Nearest Neighbors (KNN) [26]. These models were selected for their diversity in complexity, interpretability, and proven applicability in environmental modeling. SVR is well suited to high-dimensional datasets with nonlinear relationships and achieved the best overall performance in our study, particularly for CO and SO₂. Ridge Regression, a regularized linear approach, served as a robust and interpretable baseline model, effectively controlling overfitting. Random Forest, a nonlinear ensemble method, captures feature interactions and handles noisy data while providing estimates of feature importance. Gradient Boosting, another ensemble approach, allows for fine-tuned optimization and often achieves high predictive accuracy on structured datasets. KNN, a simple non-parametric model, was included to assess the influence of spatial proximity in the embedding feature space.
The dataset contained between 42 and 49 samples per pollutant depending on station availability, making the sample size small to medium in the context of tabular regression. All models were implemented using the scikit-learn Python library and trained with a 5-fold cross-validation scheme to ensure robust evaluation [27]. Hyperparameters were optimized using a grid search strategy to maximize predictive performance, and the same training–testing splits were applied across all models to allow direct comparability [28].
Model evaluation was performed using 5-fold cross-validation (CV), a protocol widely applied in machine learning and remote sensing studies as a balance between computational cost, bias, and variance. Each pollutant dataset comprised approximately 60 samples (station–year combinations), and the 5-fold split yielded ~70% for training and ~30% for testing in each fold. This ensured sufficient training size for model stability while maintaining independent test samples for robust assessment. We acknowledge that 5-fold CV mixes samples across stations and years, which may yield optimistic results compared to stricter station- or year-based validation. However, for this initial feasibility study, the primary objective was to benchmark the performance of embedding-based models relative to traditional predictors in a consistent manner across all pollutants. Future work will extend this to stricter spatial and temporal hold-out strategies (e.g., Leave-One-Station-Out or Leave-One-Year-Out).
Model evaluation focused on three key metrics: the coefficient of determination (R2), the mean absolute error (MAE), and the root mean squared error (RMSE). Final model selection for each pollutant was based primarily on R2 performance on the test folds, ensuring that the chosen model provided the best balance between predictive accuracy and generalization ability.
2.5. Feature Importance Analysis (SHAP)
To enhance the interpretability of the modeling results, we applied Shapley Additive Explanations (SHAP) to the best-performing model for each pollutant. SHAP values quantify the contribution of each embedding band to individual predictions, providing a transparent assessment of which spectral–textural features most strongly influence pollutant estimates [29]. This approach allowed us to identify the most relevant embedding dimensions, gain insights into the relationships between pollutant concentrations and surface characteristics, and inform potential dimensionality reduction strategies for future applications.
For the final models with the highest accuracy, we applied them to the complete embedding rasters of Quito for the years 2017 and 2024. Predictions were generated at 10 m spatial resolution, enabling a detailed visualization of the spatial distribution of pollutants and their temporal changes within a consistent analytical framework. All coding and model execution were carried out in Google Colab, with model applications and raster processing conducted using Google Earth Engine and the geemap Python package. The resulting maps were further processed and visualized using Python libraries such as matplotlib, rasterio, and shap. Final georeferenced rasters were exported to Google Drive and refined for cartographic figures in ArcGIS Pro, ensuring compatibility with spatial planning workflows and supporting their use in health risk communication. The workflow diagram is presented in Figure 2.
3. Results
3.1. Analysis of Ground-Based REEMAQ Data
The REEMAQ dataset for Quito from 2017 to 2024 revealed distinct pollutant-specific patterns and spatial variability across the monitoring network (Figure 3). Temporal aggregation of annual means showed that NO₂ concentrations were consistently higher at stations located near high-traffic corridors and in the historic city center, with some sites exceeding the WHO annual guideline value of 10 µg/m3 in multiple years [30]. SO₂ exhibited strong spatial localization, with the highest values recorded in the southern industrial sector and generally low concentrations in residential and green areas.
PM₂.₅ displayed both seasonal and interannual variability, with elevated values during the dry season, particularly in central and southern districts. These peaks likely reflect a combination of traffic emissions, industrial activity, and regional transport from biomass burning events, with annual averages at several sites exceeding the WHO guideline value of 5 µg/m3. CO levels were relatively homogeneous across the network, with modest peaks in areas of dense traffic flow. In contrast, O₃ concentrations were higher in peripheral and elevated areas, showing the typical inverse spatial relationship with NO₂, consistent with photochemical production processes.
Interannual trends suggested modest declines in NO₂ and CO at several central monitoring stations, potentially linked to fleet modernization and traffic management policies. However, increases in PM₂.₅ and SO₂ were observed in some southern and peri-urban stations, indicating localized emission growth. Overall, these patterns underscore the heterogeneity of Quito’s air pollution profile and highlight the importance of spatially resolved modeling approaches.
3.2. Machine Learning Model Performance
The predictive performance of the five machines learning algorithms for each pollutant is summarized in Table 1. The strongest results were obtained for NO₂ and SO₂, with both achieving R2 = 0.71 using Support Vector Regression (SVR). For NO₂, k-Nearest Neighbors (KNN) also matched this performance, with RMSE values around 2.91–2.92 µg/m3 and MAE between 2.33 and 2.53 µg/m3, indicating good agreement between predictions and observations. For SO₂, Random Forest ranked second with R2=0.66 and RMSE = 0.43 µg/m3. PM₂.₅ predictions reached moderate accuracy (R2=0.55) with Ridge Regression and Elastic Net, while CO was moderately well predicted by SVR (R2=0.61) and less so by Gradient Boosting (R2=0.48). O₃ proved difficult to model with embeddings alone, with Random Forest and Ridge Regression producing negative values (−0.02 and −0.04), highlighting the need for dynamic meteorological predictors.
Scatterplots of observed versus predicted values (Figure 4) confirm these patterns. For NO₂ and SO₂, data points cluster closely around the 1:1 line, indicating strong predictive alignment. For PM₂.₅ and CO, dispersion increases at higher observed concentrations, with a tendency to underpredict peak events. For O₃, the absence of a clear trend line reflects the weak model fit.
Figure 4.
Observed versus predicted pollutant concentrations for the best-performing models based on 5-fold cross-validation. Each panel shows results for (a) NO₂, (b) SO₂, (c) PM₂.₅, and (d) CO, with the 1:1 line shown for reference. NO₂ and SO₂ models exhibit strong agreement, while PM₂.₅ and CO show moderate performance and ozone (not shown) was poorly predicted.
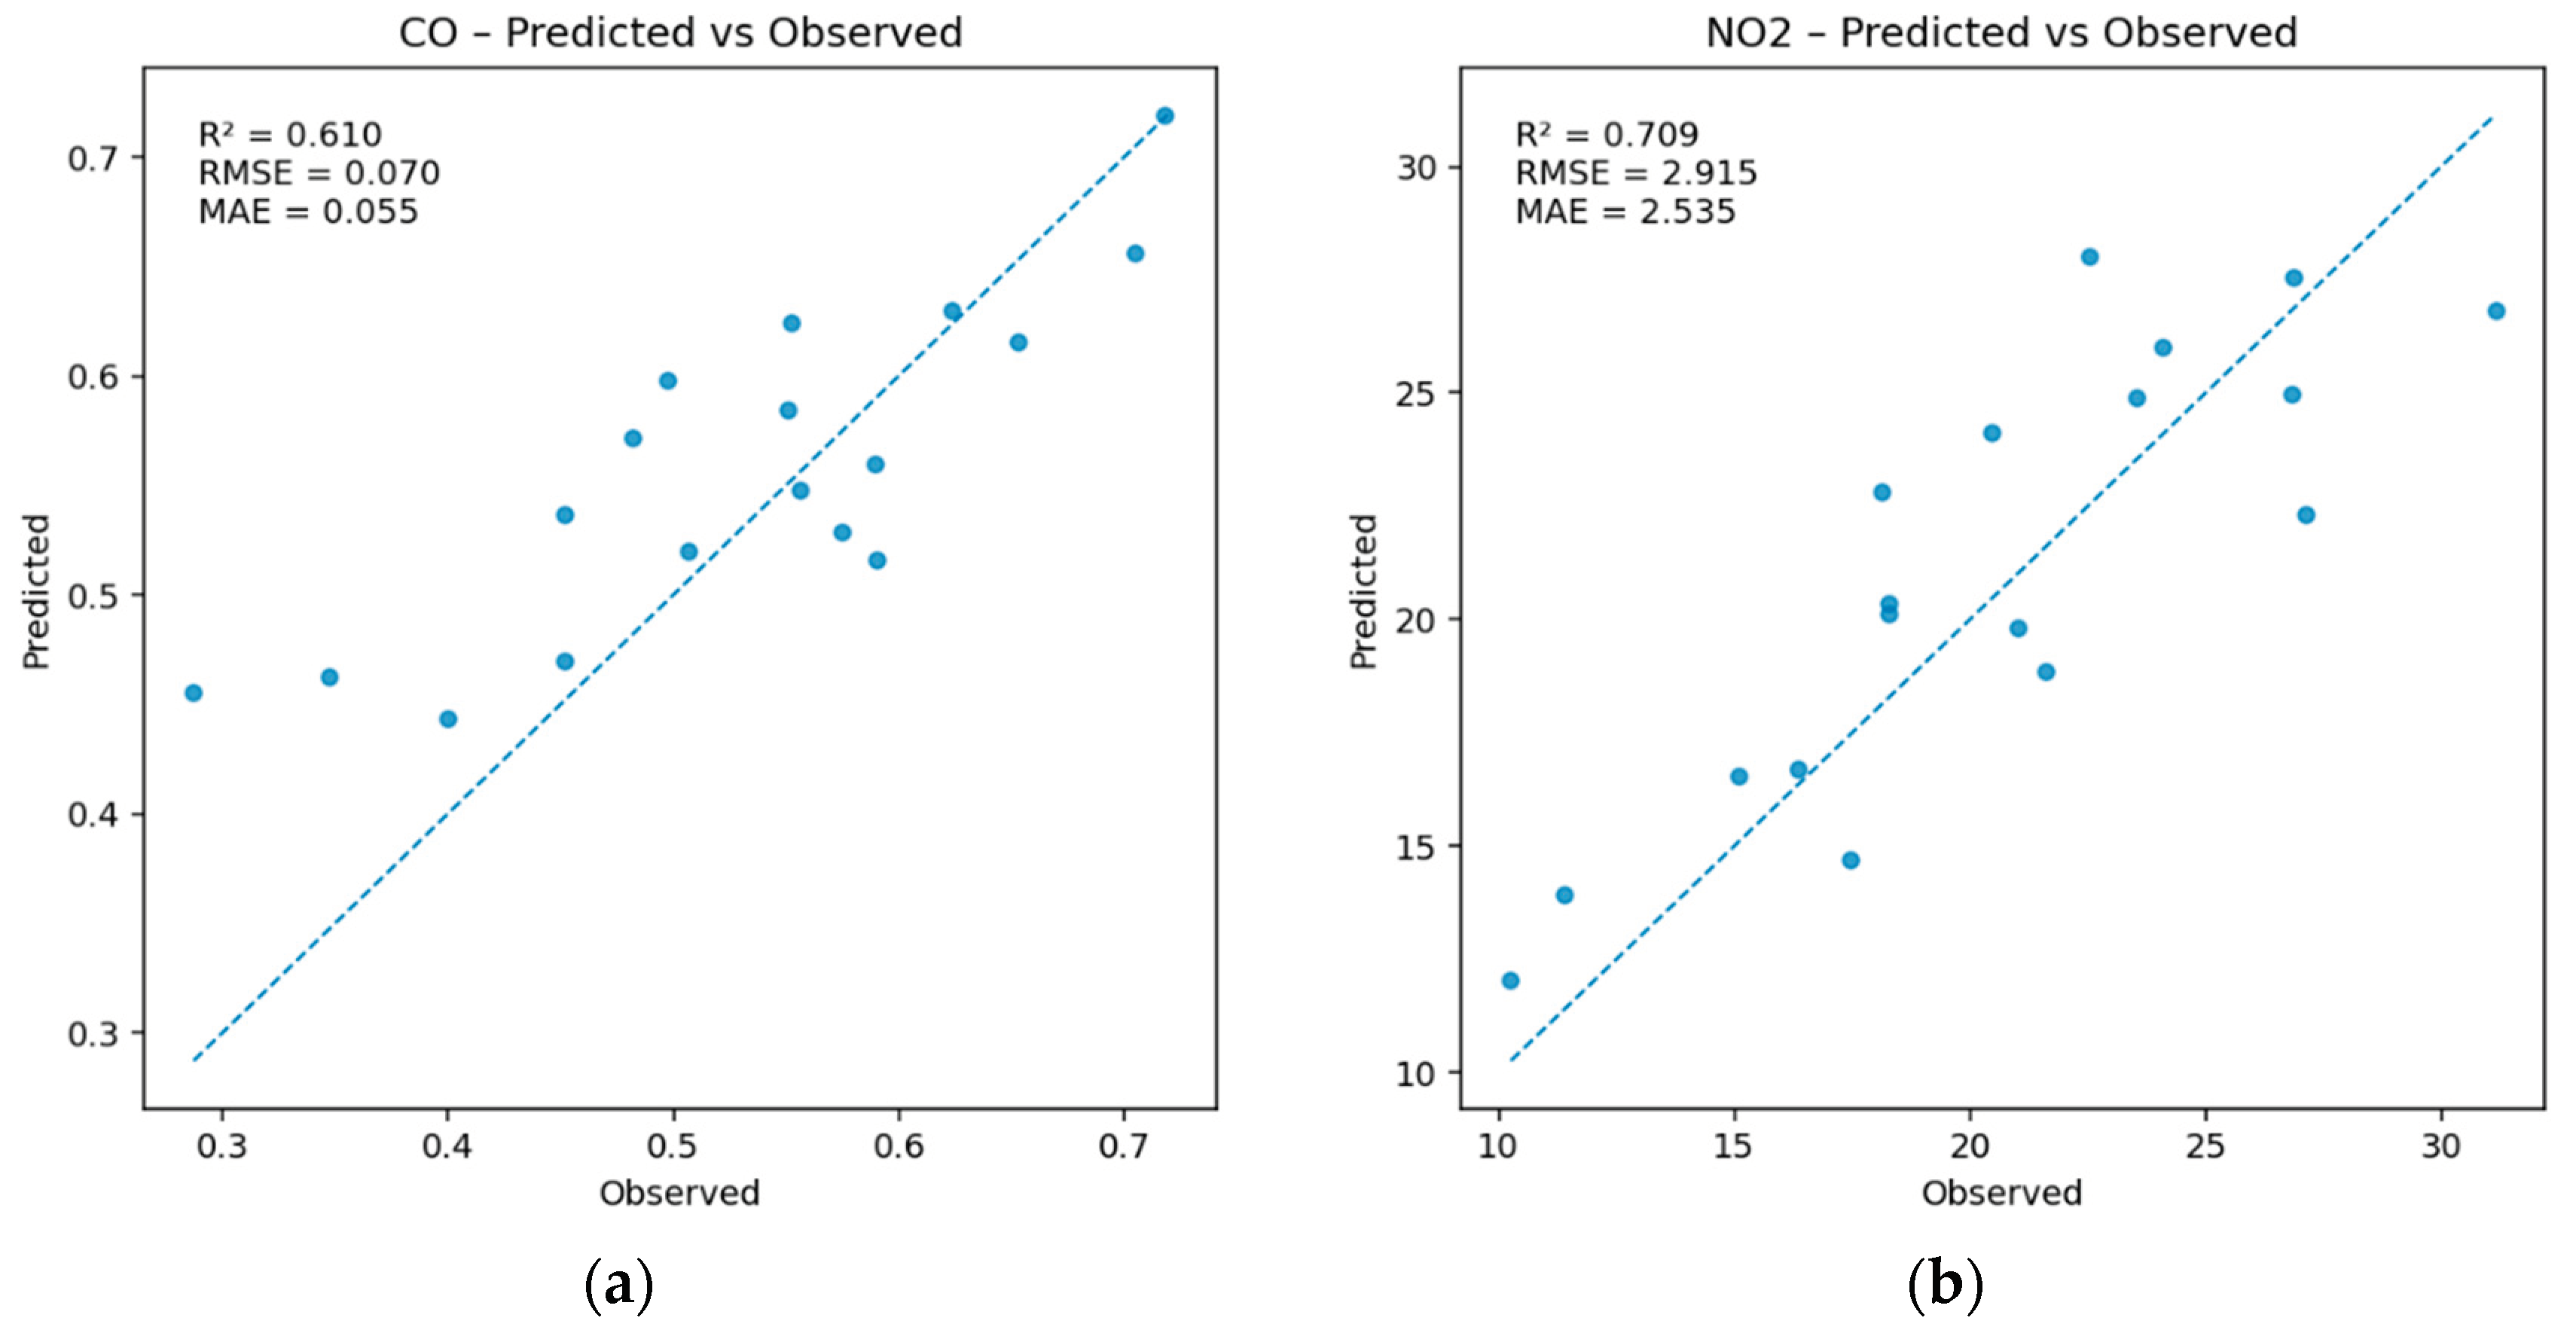
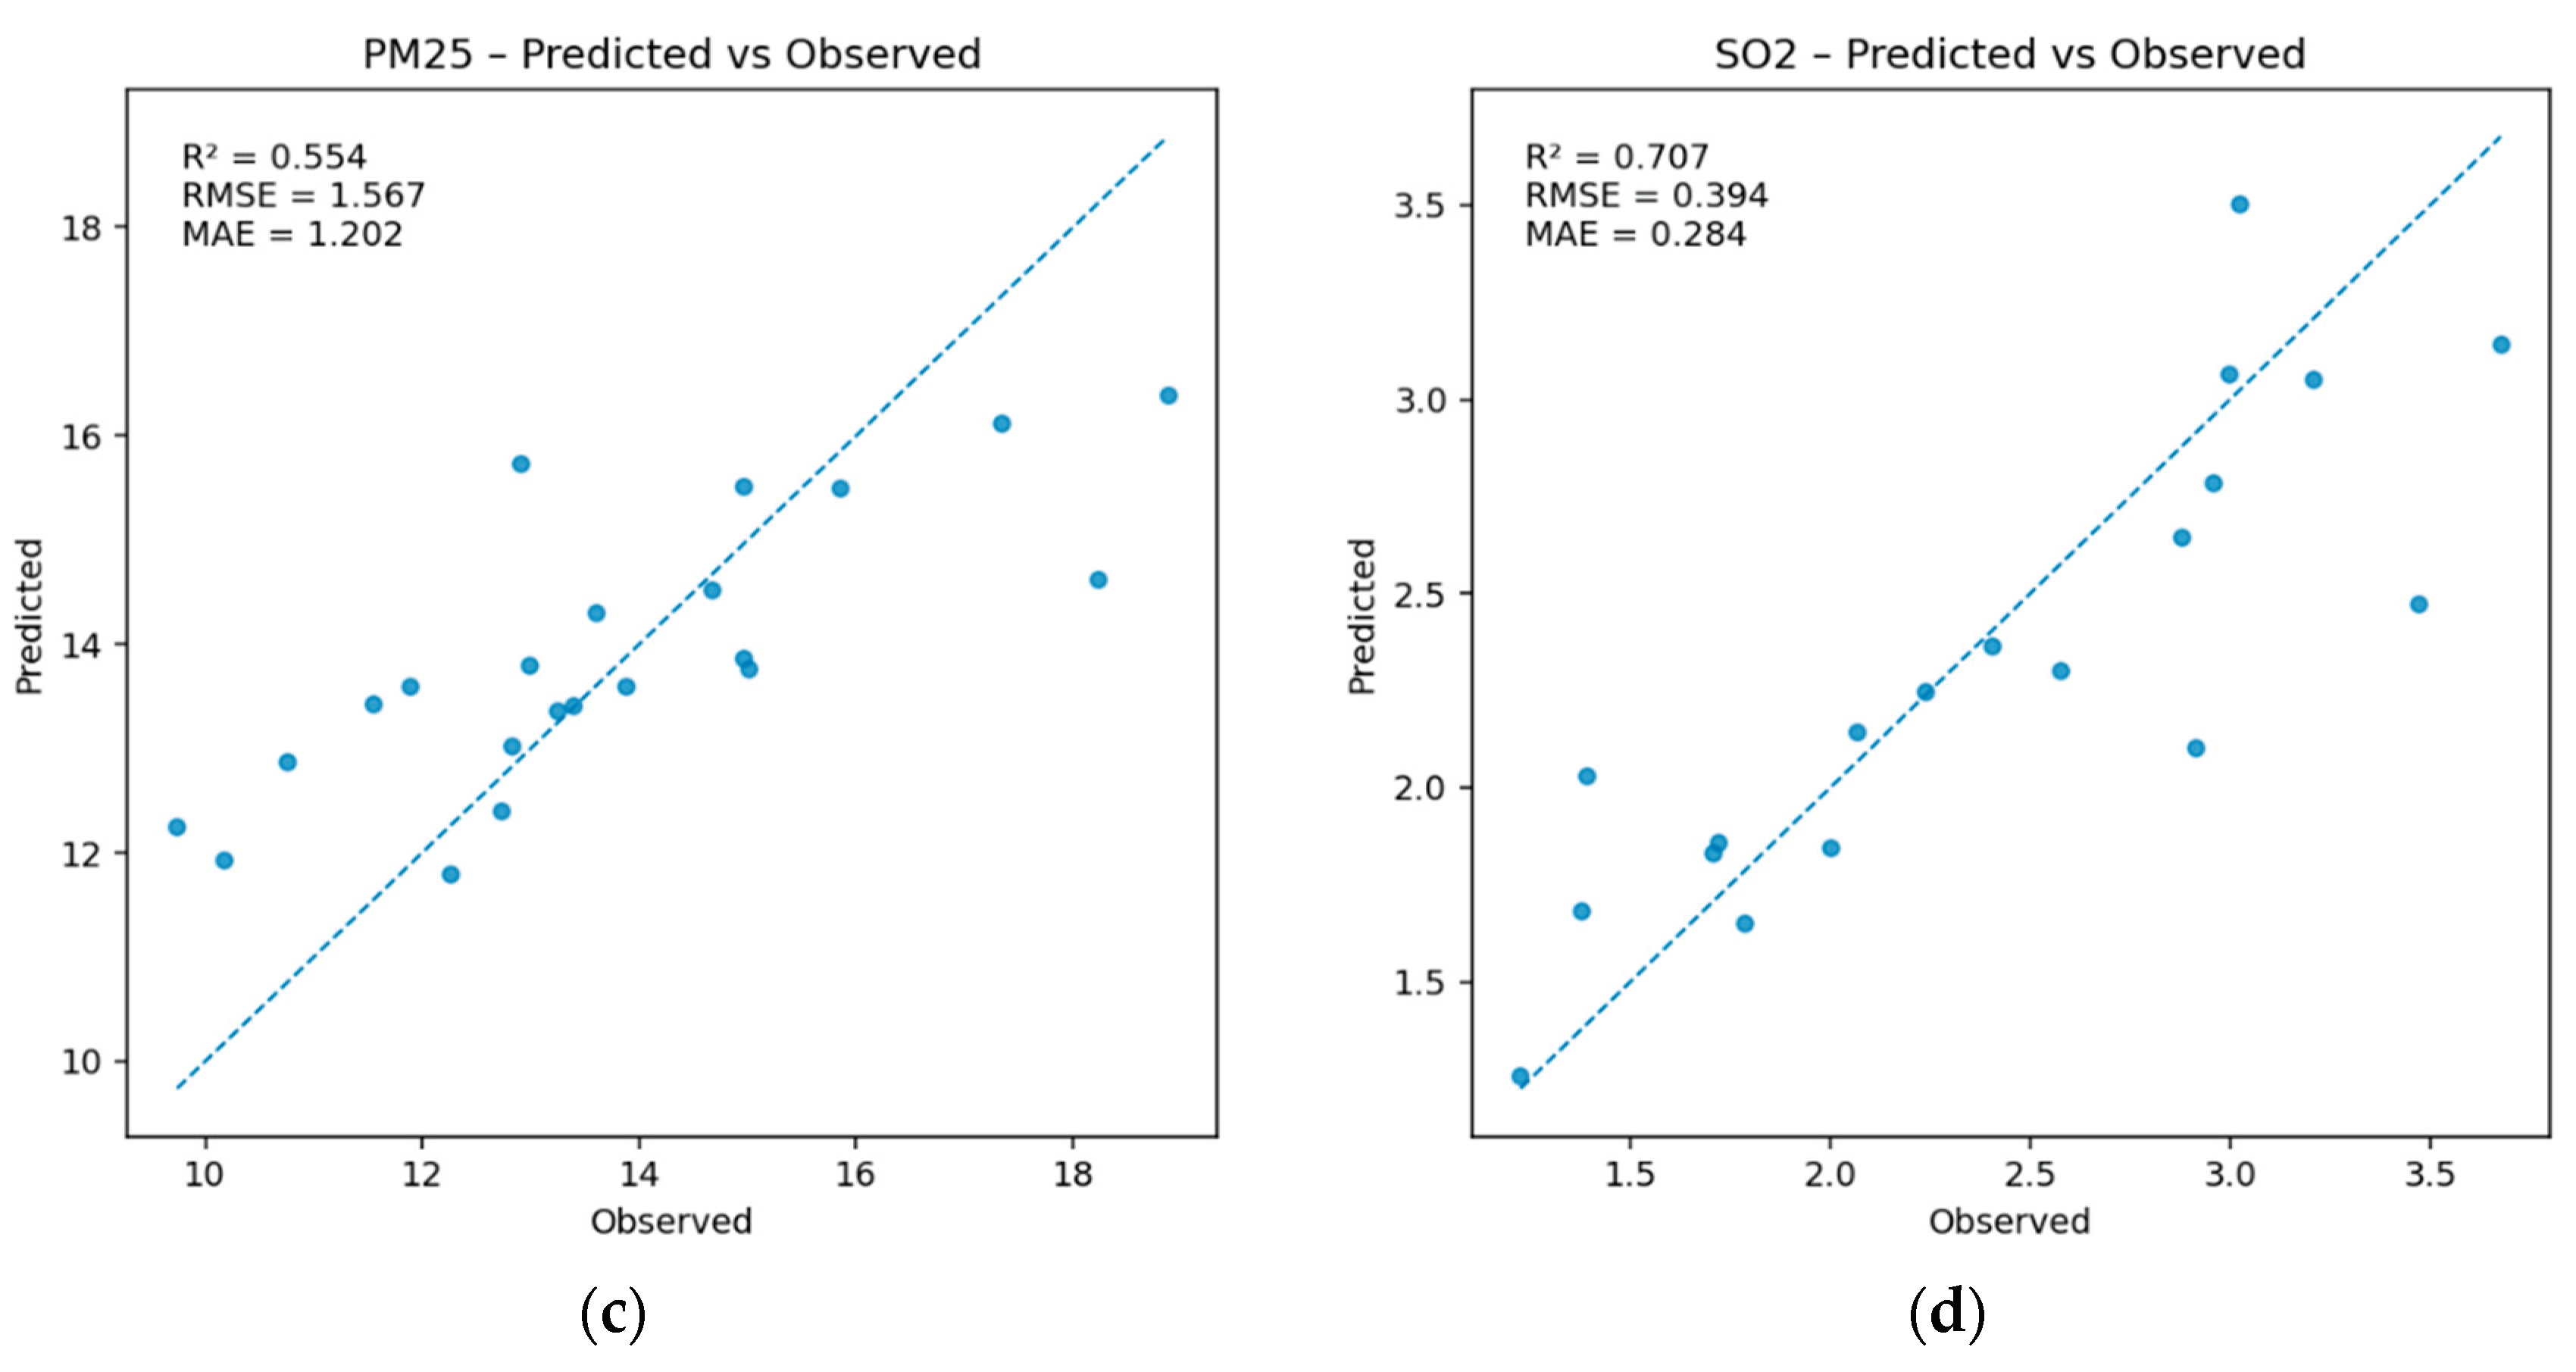
Figure 5.
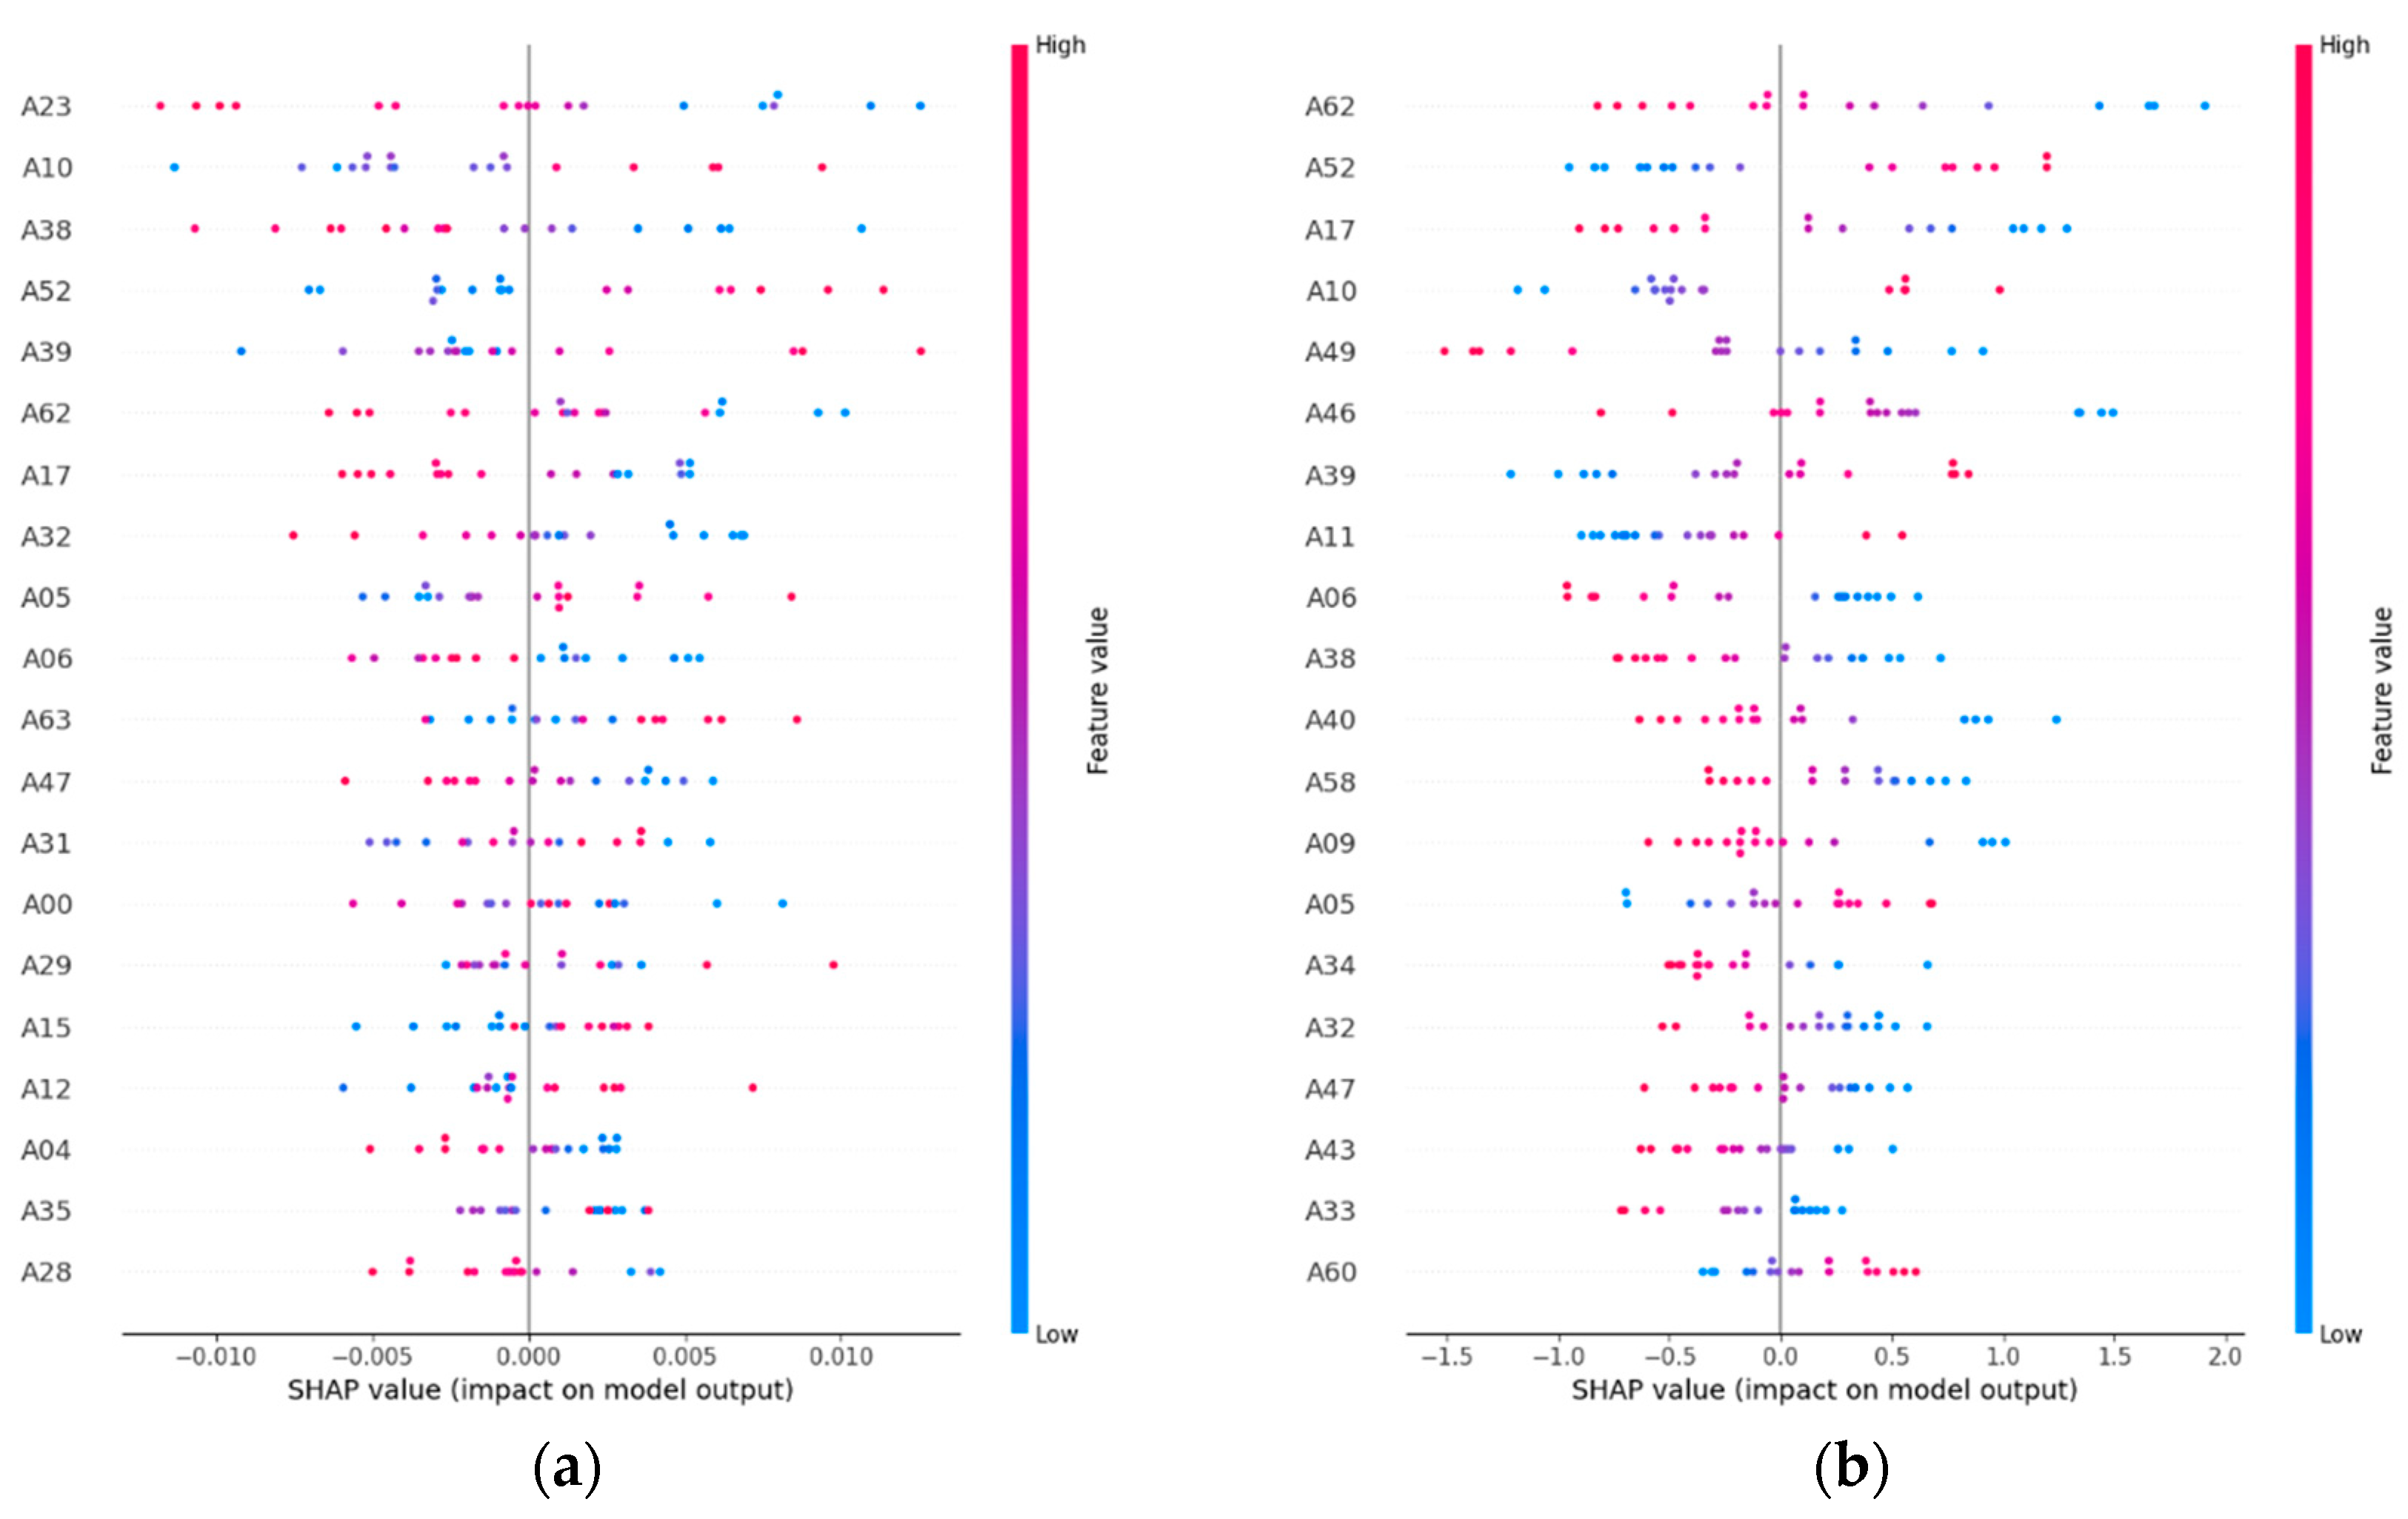
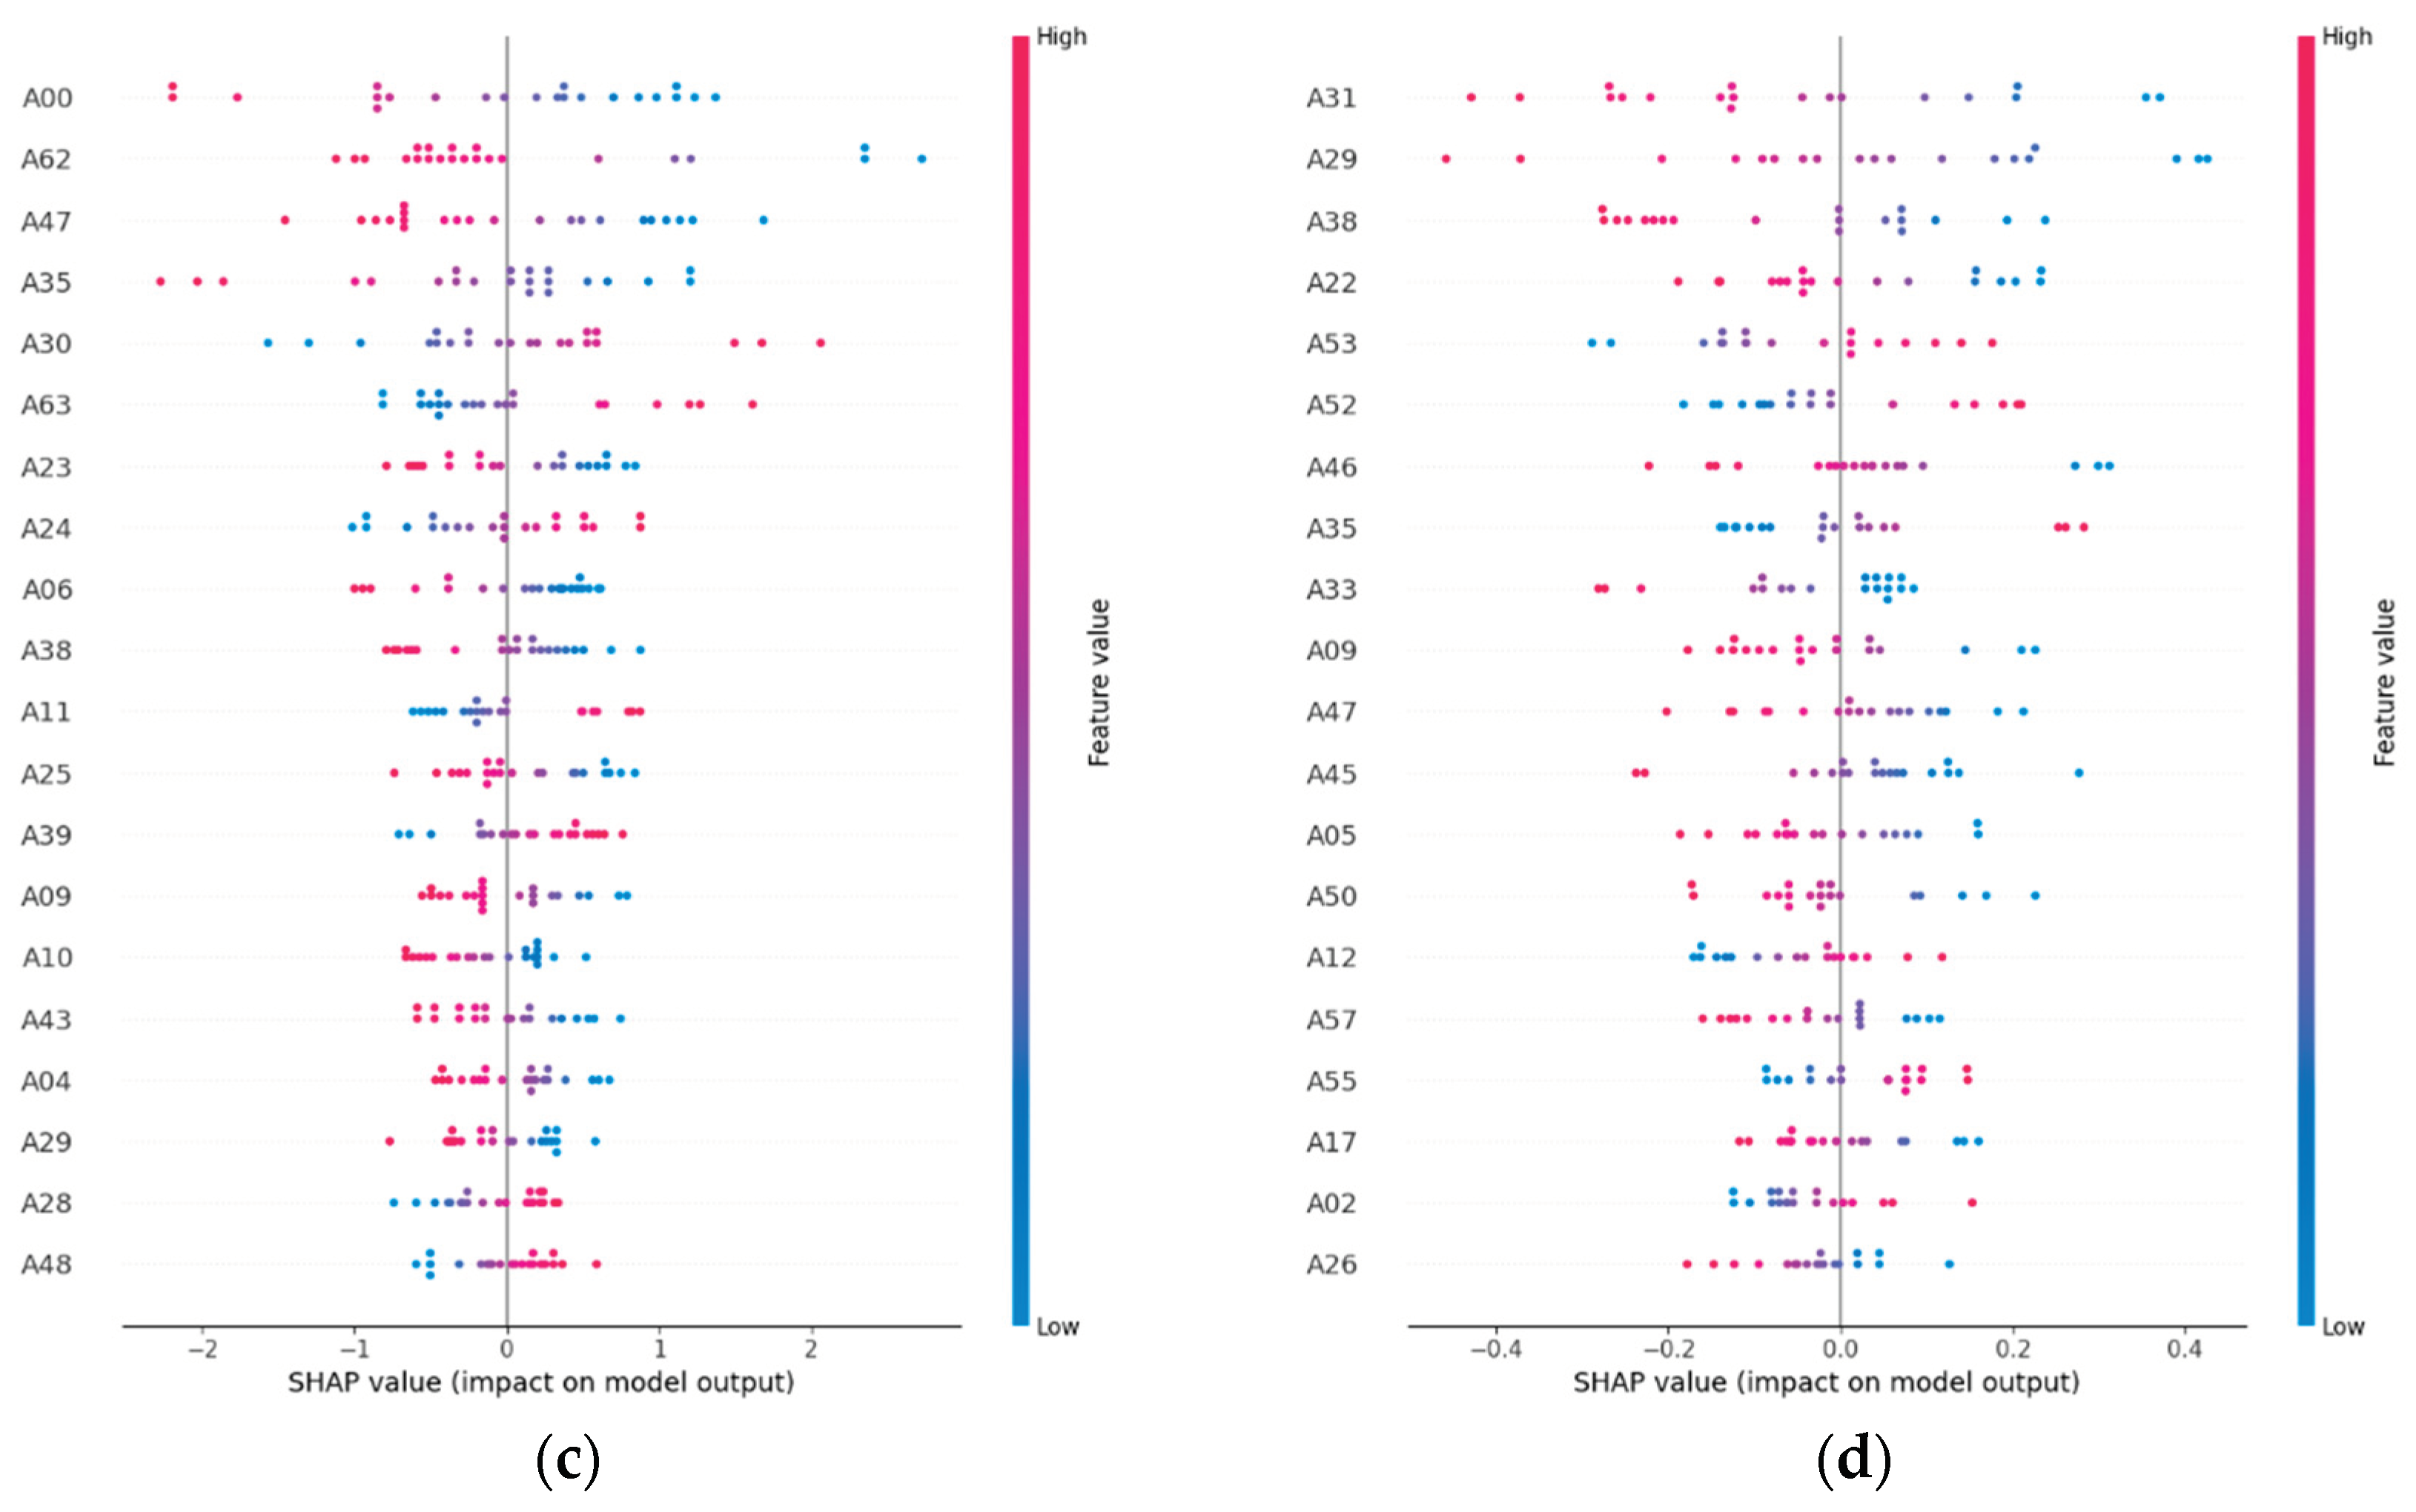
SHAP feature importance plots for the best-performing models of each pollutant. The horizontal axis shows the mean absolute SHAP value for each embedding band (A00–A63), representing its contribution to model predictions. Bands with higher SHAP values have greater influence, with a small subset dominating predictions for NO₂ and SO₂ and a more even distribution observed for PM₂.₅ and CO.
Figure 5.
SHAP feature importance plots for the best-performing models of each pollutant. The horizontal axis shows the mean absolute SHAP value for each embedding band (A00–A63), representing its contribution to model predictions. Bands with higher SHAP values have greater influence, with a small subset dominating predictions for NO₂ and SO₂ and a more even distribution observed for PM₂.₅ and CO.
We constructed spatial prediction maps for NO₂ and SO₂ at 10 m resolution (Figure 6 and Figure 7), which captured fine-scale variability across Quito, as the models for these pollutants achieved the highest accuracy. In 2017, NO₂ hotspots were aligned with major roads and dense urban zones, while by 2024, concentrations had decreased in central areas but increased in rapidly expanding southern peri-urban districts. SO₂ hotspots remained concentrated in the southern industrial corridor in both years, with some intensification observed in 2024. The high spatial resolution of these maps enables their direct use in local policy-making and targeted interventions.
4. Discussion
The REEMAQ monitoring data and the embedding-based model predictions together provide a clear perspective on what a fully remote sensing–driven approach can achieve for urban air quality modeling in a data-scarce context such as Quito [11]. Ground observations confirm persistent spatial differences across pollutants: nitrogen dioxide is concentrated in the central business district and along major traffic corridors, where topography-induced thermal inversions trap emissions; sulfur dioxide is localized in the southern industrial area; fine particulate matter exhibits seasonal peaks during the dry season and regional biomass burning events; carbon monoxide is more evenly distributed but presents localized spikes in traffic-heavy areas; and ozone is highest in peripheral elevated zones, where photochemical processes dominate away from NO₂ sources [31,32].
The machine learning results demonstrate that the AlphaEarth Foundations embeddings—which integrate multi-sensor observations from Sentinel-1, Sentinel-2, Landsat, ERA5-Land meteorology, GRACE hydrology, and GEDI LiDAR—effectively capture the spatial heterogeneity of pollutants, particularly those with stable source patterns. NO₂ achieved the highest predictive accuracy, with Support Vector Regression and k-Nearest Neighbors both reaching R2 = 0.71 and RMSE ≈ 2.9 μg/m3. This strong performance, achieved without handcrafted features or additional local covariates, suggests that the embeddings encode robust spatial proxies for traffic networks, impervious surface distribution, and urban morphology. This situates our work within a new context for the use of remote sensing variables and machine learning models [33,34,35]. The high accuracy for NO₂ likely stems from its spatial stability and strong correlation with persistent land-use features that are well represented in multi-sensor composites. In contrast, pollutants with more dynamic or secondary formation processes, such as PM₂.₅ and CO, achieved only moderate accuracy (R2 = 0.55 and 0.61, respectively), reflecting the influence of short-term meteorological drivers and episodic transport not captured by annual embeddings. O₃ was the most difficult pollutant to predict, yielding negative R2 values across models, consistent with its complex nonlinear chemistry and strong dependence on short-term meteorological variability and precursor interactions—factors smoothed out in annual data [36,37].
The SHAP analysis provided further insights into model interpretability. For NO₂, a limited set of embedding bands (e.g., A12, A47, and A03) dominated predictions, likely linked to proxies of urban density, impervious materials, and vegetation cycles. SO₂ predictions were strongly influenced by A05, A26, and A51, which appear to capture industrial land-use characteristics. By contrast, PM₂.₅ and CO relied on more diffuse patterns across multiple embedding bands, suggesting weaker and less stable predictors. These findings indicate that NO₂ and SO₂ models could be streamlined by prioritizing a smaller subset of highly relevant embedding features, reducing computational demand while maintaining accuracy [38,39].
Our high-resolution (10 m) spatial predictions reveal patterns consistent with known emission sources and policy-relevant temporal changes. Between 2017 and 2024, NO₂ levels declined in the city center—likely reflecting cleaner vehicle fleets and improved traffic management—but increased in peri-urban southern districts undergoing rapid expansion. SO₂ hotspots persisted in the industrial south and showed signs of intensification, likely tied to industrial activity. Such outputs highlight the value of embedding-based models for tracking spatial and temporal pollution dynamics in resource-limited contexts.
When compared with previous approaches, our framework demonstrates clear advantages. Earlier studies in Quito and other cities primarily relied on Sentinel-5P TROPOMI or MODIS AOD retrievals [40,41], combined with regression kriging or land-use regression (LUR) models, to estimate surface pollutant levels [9,10,11]. While these approaches provide valuable insights, they are constrained by retrieval errors under cloudy conditions, coarser spatial resolution, and the need for auxiliary data. By contrast, embedding-based models exploit harmonized, globally available, multi-sensor data that inherently encode land cover, structural, and climatic information at high resolution. Unlike chemical transport models, which require detailed emissions inventories and substantial computational resources, embeddings provide a lightweight yet powerful alternative for Global South cities where such resources are scarce.
From a generalizability perspective, this framework has strong potential to be transferred to other cities in the Global South, provided that a minimal set of ground-based observations is available for calibration. The embeddings are globally consistent at 10 m resolution, making them suitable across diverse socio-economic and climatic conditions. Pollutants with stable spatial patterns, such as NO₂ and SO₂, are particularly well captured, while pollutants with stronger temporal variability may benefit from integrating higher-frequency meteorological or atmospheric composition data. Incorporating vertical column density products from sensors such as Sentinel-5P, MODIS AOD, or future missions could also strengthen the linkage between surface-level predictions and atmospheric concentrations, enabling the construction of more physically consistent models.
A key novelty of our work lies in addressing a critical blind spot in global air quality modeling. While many global models perform well in the Global North, they often underperform in the Global South due to sparse monitoring networks, incomplete emissions inventories, and limited auxiliary datasets. By demonstrating that multi-sensor embeddings can deliver locally accurate and policy-relevant predictions in Quito, we provide a pathway to overcome these limitations. This novelty positions our work as an important step toward democratizing access to reliable air quality information in underserved regions and aligns with broader public health concerns such as respiratory disease [42].
Looking forward, future work should explore integrating dedicated atmospheric missions such as Sentinel-4A and Sentinel-5A, which will provide high-frequency pollutant-specific retrievals to complement embeddings and improve temporal resolution [43]. Applying this methodology in other Andean cities with similar topographic constraints and emission conditions will test its robustness across comparable environments. Furthermore, coupling embedding-based models with dense networks of IoT low-cost air quality sensors could enable near-real-time monitoring, bridging the gap between high-resolution spatial predictions and real-time exposure assessment [44,45]. Ultimately, our goal is to advance a replicable, scalable methodology for cities worldwide where monitoring networks are sparse or absent, thereby supporting evidence-based environmental governance, equitable access to clean air, and public health protection.
5. Conclusions
This study highlights the potential of machine learning in combination with Google’s AlphaEarth Foundations satellite embeddings to advance urban air quality modeling in data-scarce regions, using Quito, Ecuador, as a representative case study. By relying solely on globally available, multi-sensor embeddings that integrate information from Sentinel-1, Sentinel-2, Landsat, ERA5-Land, GRACE, and GEDI, we showed that high-resolution (10 m) predictions of air pollutant concentrations can be generated without the need for handcrafted features, auxiliary land-use datasets, or pollutant-specific retrievals. The models achieved their strongest performance for NO₂ (R2 = 0.71) and SO₂ (R2 = 0.71), pollutants characterized by stable and localized emission sources that are well represented in the embeddings, underscoring the capacity of this approach to capture proxies for traffic intensity, industrial activity, and urban morphology. In contrast, pollutants with higher temporal variability, such as PM₂.₅, CO, and O₃, yielded more modest results, reflecting the limitations of annual aggregation in representing short-term meteorological processes, chemical transformations, and episodic events such as biomass burning or inversion layers. Compared with previous studies that relied primarily on Sentinel-5P vertical column retrievals or MODIS AOD products to generate surface concentration estimates, our framework offers a more spatially detailed, transferable, and cloud-robust alternative capable of capturing intra-urban heterogeneity while reducing dependence on data that may be unavailable or unreliable in regions of the Global South. The integration of SHAP analysis further enhanced interpretability, identifying the most influential embedding bands for different pollutants and providing guidance for reducing model complexity in future applications. Importantly, the results emphasize that embedding-based models can fill the critical gap left by traditional global air quality models, which often underperform in cities with sparse monitoring networks and incomplete emissions inventories, by leveraging globally consistent Earth observation data in combination with a minimal set of ground measurements. Looking forward, integrating pollutant-specific vertical column retrievals, such as those from Sentinel-5P and future Sentinel-4/5 missions, alongside higher-frequency meteorological data and IoT-based low-cost sensor networks, will allow more robust hybrid frameworks that improve temporal generalization and near-real-time monitoring capabilities. Ultimately, this study demonstrates that embedding-based machine learning offers a scalable, policy-relevant, and globally transferable methodology for urban air quality prediction, providing a valuable tool for cities in the Global South where reliable air quality information is urgently needed to support public health protection, climate resilience, and sustainable urban planning.
Author Contributions
Conceptualization, C.I.A.; methodology, C.I.A.; software, C.I.A.; validation, C.I.A.; formal analysis, C.I.A. and N.A.E.L.; investigation, C.I.A.; resources, N.A.E.L.; data curation, C.I.A. and C.A.U.V.; writing—original draft preparation, C.I.A.; writing—review and editing, C.I.A.; visualization, C.I.A.; supervision, C.I.A.; project administration, C.A.U.V.; funding acquisition, C.A.U.V. All authors have read and agreed to the published version of the manuscript.
Funding
This research received no external funding.
Data Availability Statement
The original contributions presented in the study are included in the article, further inquiries can be directed at the corresponding author.
Acknowledgments
We thank the research team for all the help and support provided while developing this work.
Disclaimer on Language Editing
Parts of this manuscript benefited from grammar and style revision using Grammarly (Grammarly Inc., San Francisco, CA, USA) and ChatGPT (OpenAI, San Francisco, CA, USA). These tools were employed exclusively for language refinement, and all substantive academic content, analyses, and interpretations were conceived and written by the authors.
Conflicts of Interest
The authors declare no conflicts of interest.
Abbreviations
The following abbreviations are used in this manuscript:
| REEMAQ | Red Metropolitana de Monitoreo Atmosférico de Quito |
| PM₂.₅ | Particulate Matter with aerodynamic diameter ≤ 2.5 μm |
| NO₂ | Nitrogen Dioxide |
| SO₂ | Sulfur Dioxide |
| O₃ | Ozone |
| CO | Carbon Monoxide |
| AEF | AlphaEarth Foundations |
| ERA5 | ECMWF Reanalysis v5 |
| SVR | Support Vector Regression |
| SHAP | Shapley Additive Explanations |
References
- Kim, SY. , Kerr, G.H., van Donkelaar, A. et al. Tracking air pollution and CO2 emissions in 13,189 urban areas worldwide using large geospatial datasets. Commun Earth Environ 6, 311 (2025). [CrossRef]
- Zalakeviciute, R.; Lopez-Villada, J.; Ochoa, A.; Moreno, V.; Byun, A.; Proaño, E.; Mejía, D.; Bonilla-Bedoya, S.; Rybarczyk, Y.; Vallejo, F. Urban Air Pollution in the Global South: A Never-Ending Crisis? Atmosphere 2025, 16, 487. [Google Scholar] [CrossRef]
- Vital Strategies. Integrated Use of Low-Cost Sensors to Strengthen Air Quality Management; Kushwaha, M., Mehta, S., Arora, P., Dye, T., Eds.; Matte, T. Vital Strategies: New York, NY, USA, 2022; Available online: https://www.vitalstrategies.org/resources/integrated-use-of-low-cost-sensors-to-strengthen-air-quality-management-in-indian-cities/ (accessed on 16 August 2025).
- Castell, N.; Dauge, F.R.; Schneider, P.; Vogt, M.; Lerner, U.; Fishbain, B.; Broday, D.; Bartonova, A. Can commercial low-cost sensor platforms contribute to air quality monitoring and exposure estimates? Environment International 2017, 99, 293–302. [Google Scholar] [CrossRef]
- World Health Organization. Types of Pollutants. In Air Quality and Health; Environment, Climate Change and Health: Geneva, Switzerland, accessed on 16 August 2025. Available online: https://www.who.int/teams/environment-climate-change-and-health/air-quality-and-health/healthimpacts/types-of-pollutants.
- Institute of Environmental Science and Research (ESR). Health Effects of Air Pollution; ESR: Porirua, New Zealand, October 2022; Available online: https://www.phfscience.nz/media/cofl2ahi/esr-environmental-health-report-health-effects-pollution.pdf (accessed on 16 August 2025).
- Vallejo, F.; Villacrés, P.; Yánez, D.; Espinoza, L.; Bodero-Poveda, E.; Díaz-Robles, L.A.; Oyaneder, M.; Campos, V.; Palmay, P.; Cordovilla-Pérez, A.; et al. Prolonged Power Outages and Air Quality: Insights from Quito’s 2023–2024 Energy Crisis. Atmosphere 2025, 16, 274. [Google Scholar] [CrossRef]
- Secretaría de Ambiente del Distrito Metropolitano de Quito. Red Metropolitana de Monitoreo de la Calidad del Aire (REMMAQ). This platform provides real-time monitoring and analysis of air quality (e.g., PM₁₀, PM₂.₅, NO₂, SO₂, O₃, CO, and VOCs) across Quito. Available online: https://ambiente.quito.gob.ec/red-metropolitana-de-monitoreo-de-la-calidad-del-aire/ (accessed on 16 August 2025).
- Alvarez-Mendoza, C.I.; Teodoro, A.; Ramirez-Cando, L. Improving NDVI by removing cirrus clouds with optical remote sensing data from Landsat-8 – A case study in Quito, Ecuador. Remote Sensing Applications: Society and Environment 2019, 13, 257–274. [Google Scholar] [CrossRef]
- Alvarez-Mendoza, C.I. , Teodoro, A. & Ramirez-Cando, L. Spatial estimation of surface ozone concentrations in Quito Ecuador with remote sensing data, air pollution measurements and meteorological variables. Environ Monit Assess 191, 155 (2019). [CrossRef]
- Alvarez-Mendoza, C.I.; Teodoro, A.C.; Torres, N.; Vivanco, V. Assessment of Remote Sensing Data to Model PM10 Estimation in Cities with a Low Number of Air Quality Stations: A Case of Study in Quito, Ecuador. Environments 2019, 6, 85. [Google Scholar] [CrossRef]
- Rolf, E. , Proctor, J., Carleton, T. et al. A generalizable and accessible approach to machine learning with global satellite imagery. Nat Commun 12, 4392 (2021). [CrossRef]
- Brown, C.F.; Kazmierski, M.R.; Pasquarella, V.J.; Rucklidge, W.J.; Samsikova, M.; Zhang, C.; Shelhamer, E.; Lahera, E.; Wiles, O.; Ilyushchenko, S.; Gorelick, N.; Zhang, L.L.; Alj, S.; Schechter, E.; Askay, S.; Guinan, O.; Moore, R.; Boukouvalas, A.; Kohli, P. AlphaEarth Foundations: An embedding field model for accurate and efficient global mapping from sparse label data. arXiv 2025, arXiv:2507.22291. Available online: https://arxiv.org/abs/2507.22291 (accessed on 16 August 2025). arXiv:2507.22291. [CrossRef]
- Kozlov, M. Google AI model creates maps of Earth ‘at any place and time’. Nature 2025, 644, 313–314. [Google Scholar] [CrossRef]
- Tang, D.; Zhan, Y.; Yang, F. A review of machine learning for modeling air quality: Overlooked but important issues. Atmospheric Research 2024, 300, 107261. [Google Scholar] [CrossRef]
- Agbehadji, I.E.; Obagbuwa, I.C. Systematic Review of Machine Learning and Deep Learning Techniques for Spatiotemporal Air Quality Prediction. Atmosphere 2024, 15, 1352. [Google Scholar] [CrossRef]
- Méndez, M. , Merayo, M.G. & Núñez, M. Machine learning algorithms to forecast air quality: a survey. Artif Intell Rev 56, 10031–10066 (2023). [CrossRef]
- Xu, Z.; Zhang, H.; Zhai, A.; Kong, C.; Zhang, J. Stacking Ensemble Learning and SHAP-Based Insights for Urban Air Quality Forecasting: Evidence from Shenyang and Global Implications. Atmosphere 2025, 16, 776. [Google Scholar] [CrossRef]
- Tao, C.; Zhang, Q.; Huo, S.; Ren, Y.; Han, S.; Wang, Q.; Wang, W. PM2. 5 pollution modulates the response of ozone formation to VOC emitted from various sources: Insights from machine learning. Science of The Total Environment 2024, 916, 170009. [Google Scholar] [CrossRef] [PubMed]
- Alvarez, C.I.; López, S.; Vásquez, D.; Gualotuña, D. Assessing Air Quality Dynamics during Short-Period Social Upheaval Events in Quito, Ecuador, Using a Remote Sensing Framework. Remote Sens. 2024, 16, 3436. [Google Scholar] [CrossRef]
- Google DeepMind. AlphaEarth Foundations helps map our planet in unprecedented detail. Discover (DeepMind Blog), 30 July 2025. Available online: https://deepmind.google/discover/blog/alphaearth-foundations-helps-map-our-planet-in-unprecedented-detail/ (accessed on 16 August 2025).
- Chatterjee, K.; et al. Future Air Quality Prediction Using Long Short-Term Memory Based on Hyper Heuristic Multi-Chain Model. IEEE Access 2024, 12, 123678–123693. [Google Scholar] [CrossRef]
- Ibrahim, G. Khattab, Mohamed C. Ali, Mohamed R. Abonazel, Hany M. Elshamy, Abeer R. Azazy, Air Quality Forecasting Based on Socio-Economic and Environmental Indicators: Combining Statistical and Machine Learning Techniques, Int. J. Anal. Appl., 23 (2025), 183.
- Chen, J.; Zhu, S.; Wang, P.; Zheng, Z.; Shi, S.; Li, X.; Xu, C.; Yu, K.; Chen, R.; Kan, H.; Zhang, H.; Meng, X. Predicting particulate matter, nitrogen dioxide, and ozone across Great Britain with high spatiotemporal resolution based on random forest models. Science of The Total Environment 2024, 926, 171831. [Google Scholar] [CrossRef]
- Alfasanah, Z.; Niam, M.Z.H.; Wardiani, S.; Ahsan, M.; Lee, M.H. Monitoring air quality index with EWMA and individual charts using XGBoost and SVR residuals. MethodsX 2025, 14, 103107. [Google Scholar] [CrossRef]
- Alhathloul, S.H. , Mishra, A.K. & Khan, A.A. Low visibility event prediction using random forest and K-nearest neighbor methods. Theor Appl Climatol 155, 1289–1300 (2024). [CrossRef]
- Singh, S. , Kumar, M., Verma, B.K. et al. Optimizing Air Pollution Prediction With Random Forest Algorithm. Aerosol Sci Eng (2025). [CrossRef]
- Sawah, M.S. , Elmannai, H., El-Bary, A.A. et al. Improving air quality prediction using hybrid BPSO with BWAO for feature selection and hyperparameters optimization. Sci Rep 15, 13176 (2025). [CrossRef]
- Yao, T.; Lu, S.; Wang, Y.; Li, X.; Ye, H.; Duan, Y.; Fu, Q.; Li, J. Revealing the drivers of surface ozone pollution by explainable machine learning and satellite observations in Hangzhou Bay, China. Journal of Cleaner Production 2024, 440, 140938. [Google Scholar] [CrossRef]
- WHO global air quality guidelines: Particulate matter (PM2.5 and PM10), ozone, nitrogen dioxide, sulfur dioxide and carbon monoxide [Internet]. Geneva: World Health Organization; 2021. Available from: https://www.ncbi.nlm.nih.gov/books/NBK574594/?utm_source=chatgpt.com.
- Parra, R. Modeling PM2. 5 Levels Due to Combustion Activities and Fireworks in Quito (Ecuador) for Forecasting Using WRF-Chem. Atmosphere 2025, 16, 495. [Google Scholar] [CrossRef]
- Cazorla, M.; Trujillo, M.; Seguel, R.; Gallardo, L. Comparative ozone production sensitivity to NOₓ and VOCs in Quito, Ecuador, and Santiago, Chile. Atmospheric Chemistry and Physics 2025, 25, 7087–7109. [Google Scholar] [CrossRef]
- Rowley, A., & Karakuş, O. (2023). Predicting air quality via multimodal AI and satellite imagery. Remote Sensing of Environment, 293, 113609. [CrossRef]
- Mejía C D, Faican G, Zalakeviciute R, Matovelle C, Bonilla S, Sobrino JA. Spatio-temporal evaluation of air pollution using ground-based and satellite data during COVID-19 in Ecuador. Heliyon. 2024 Mar 20;10(7):e28152. PMCID: PMC10979269. [CrossRef] [PubMed]
- Chau PN, Zalakeviciute R, Thomas I and Rybarczyk Y (2022) Deep Learning Approach for Assessing Air Quality During COVID-19 Lockdown in Quito. Front. Big Data 5:842455. [CrossRef]
- Tavella, R.A.; das Neves, D.F.; Silveira, G.d.O.; Vieira de Azevedo, G.M.G.; Brum, R.d.L.; Bonifácio, A.d.S.; Machado, R.A.; Brum, L.W.; Buffarini, R.; Adamatti, D.F.; et al. The Relationship Between Surface Meteorological Variables and Air Pollutants in Simulated Temperature Increase Scenarios in a Medium-Sized Industrial City. Atmosphere 2025, 16, 363. [Google Scholar] [CrossRef]
- Lakra, K. , Avishek, K. Influence of meteorological variables and air pollutants on fog/smog formation in seven major cities of Indo-Gangetic Plain. Environ Monit Assess 196, 533 (2024). [CrossRef]
- Kassem, H.; El Hajjar, S.; Abdallah, F.; Omrani, H. Multi-view deep embedded clustering: Exploring a new dimension of air pollution. Engineering Applications of Artificial Intelligence 2025, 139, 109509. [Google Scholar] [CrossRef]
- Jiménez-Navarro, M.J.; Martínez-Ballesteros, M.; Martínez-Álvarez, F.; Asencio-Cortés, G. Explaining deep learning models for ozone pollution prediction via embedded feature selection. Applied Soft Computing 2024, 157, 111504. [Google Scholar] [CrossRef]
- Morillas, C.; Alvarez, S.; Serio, C.; Masiello, G.; Martinez, S. TROPOMI NO₂ Sentinel-5P data in the Community of Madrid: A detailed consistency analysis with in situ surface observations. Remote Sensing Applications: Society and Environment 2024, 33, 101083. [Google Scholar] [CrossRef]
- Alvarez-Mendoza, C.I. (2023). The Use of Remote Sensing in Air Pollution Control and Public Health. In: López, S. (eds) Socio-Environmental Research in Latin America. The Latin American Studies Book Series. Springer, Cham. [CrossRef]
- Alvarez-Mendoza, C.I.; Teodoro, A.; Freitas, A.; Fonseca, J. Spatial estimation of chronic respiratory diseases based on machine learning procedures—an approach using remote sensing data and environmental variables in Quito, Ecuador. Applied Geography 2020, 123, 102273. [Google Scholar] [CrossRef]
- Fraunhofer Institute for Applied Optics and Precision Engineering IOF. (2025, August 13). ESA mission Sentinel 5 launches with optics from Jena [Press release]. Fraunhofer Institute for Applied Optics and Precision Engineering IOF.
- De Vito, S.; Del Giudice, A.; D’Elia, G.; Esposito, E.; Fattoruso, G.; Ferlito, S.; Formisano, F.; Loffredo, G.; Massera, E.; D’Auria, P.; et al. Future Low-Cost Urban Air Quality Monitoring Networks: Insights from the EU’s AirHeritage Project. Atmosphere 2024, 15, 1351. [Google Scholar] [CrossRef]
- Connolly, R. E. , Yu, Q., Wang, Z., Chen, Y.-H., Liu, J. Z., Collier-Oxandale, A., Papapostolou, V., Polidori, A., & Zhu, Y. (2022). Long-term evaluation of a low-cost air sensor network for monitoring indoor and outdoor air quality at the community scale. Science of The Total Environment, 807, 150797. [CrossRef]
Figure 1.
Location of the study area in the urban area of Quito, Ecuador, showing the city’s administrative parish boundaries in black lines. The positions of REEMAQ air quality monitoring stations are indicated by red dots.
Figure 1.
Location of the study area in the urban area of Quito, Ecuador, showing the city’s administrative parish boundaries in black lines. The positions of REEMAQ air quality monitoring stations are indicated by red dots.
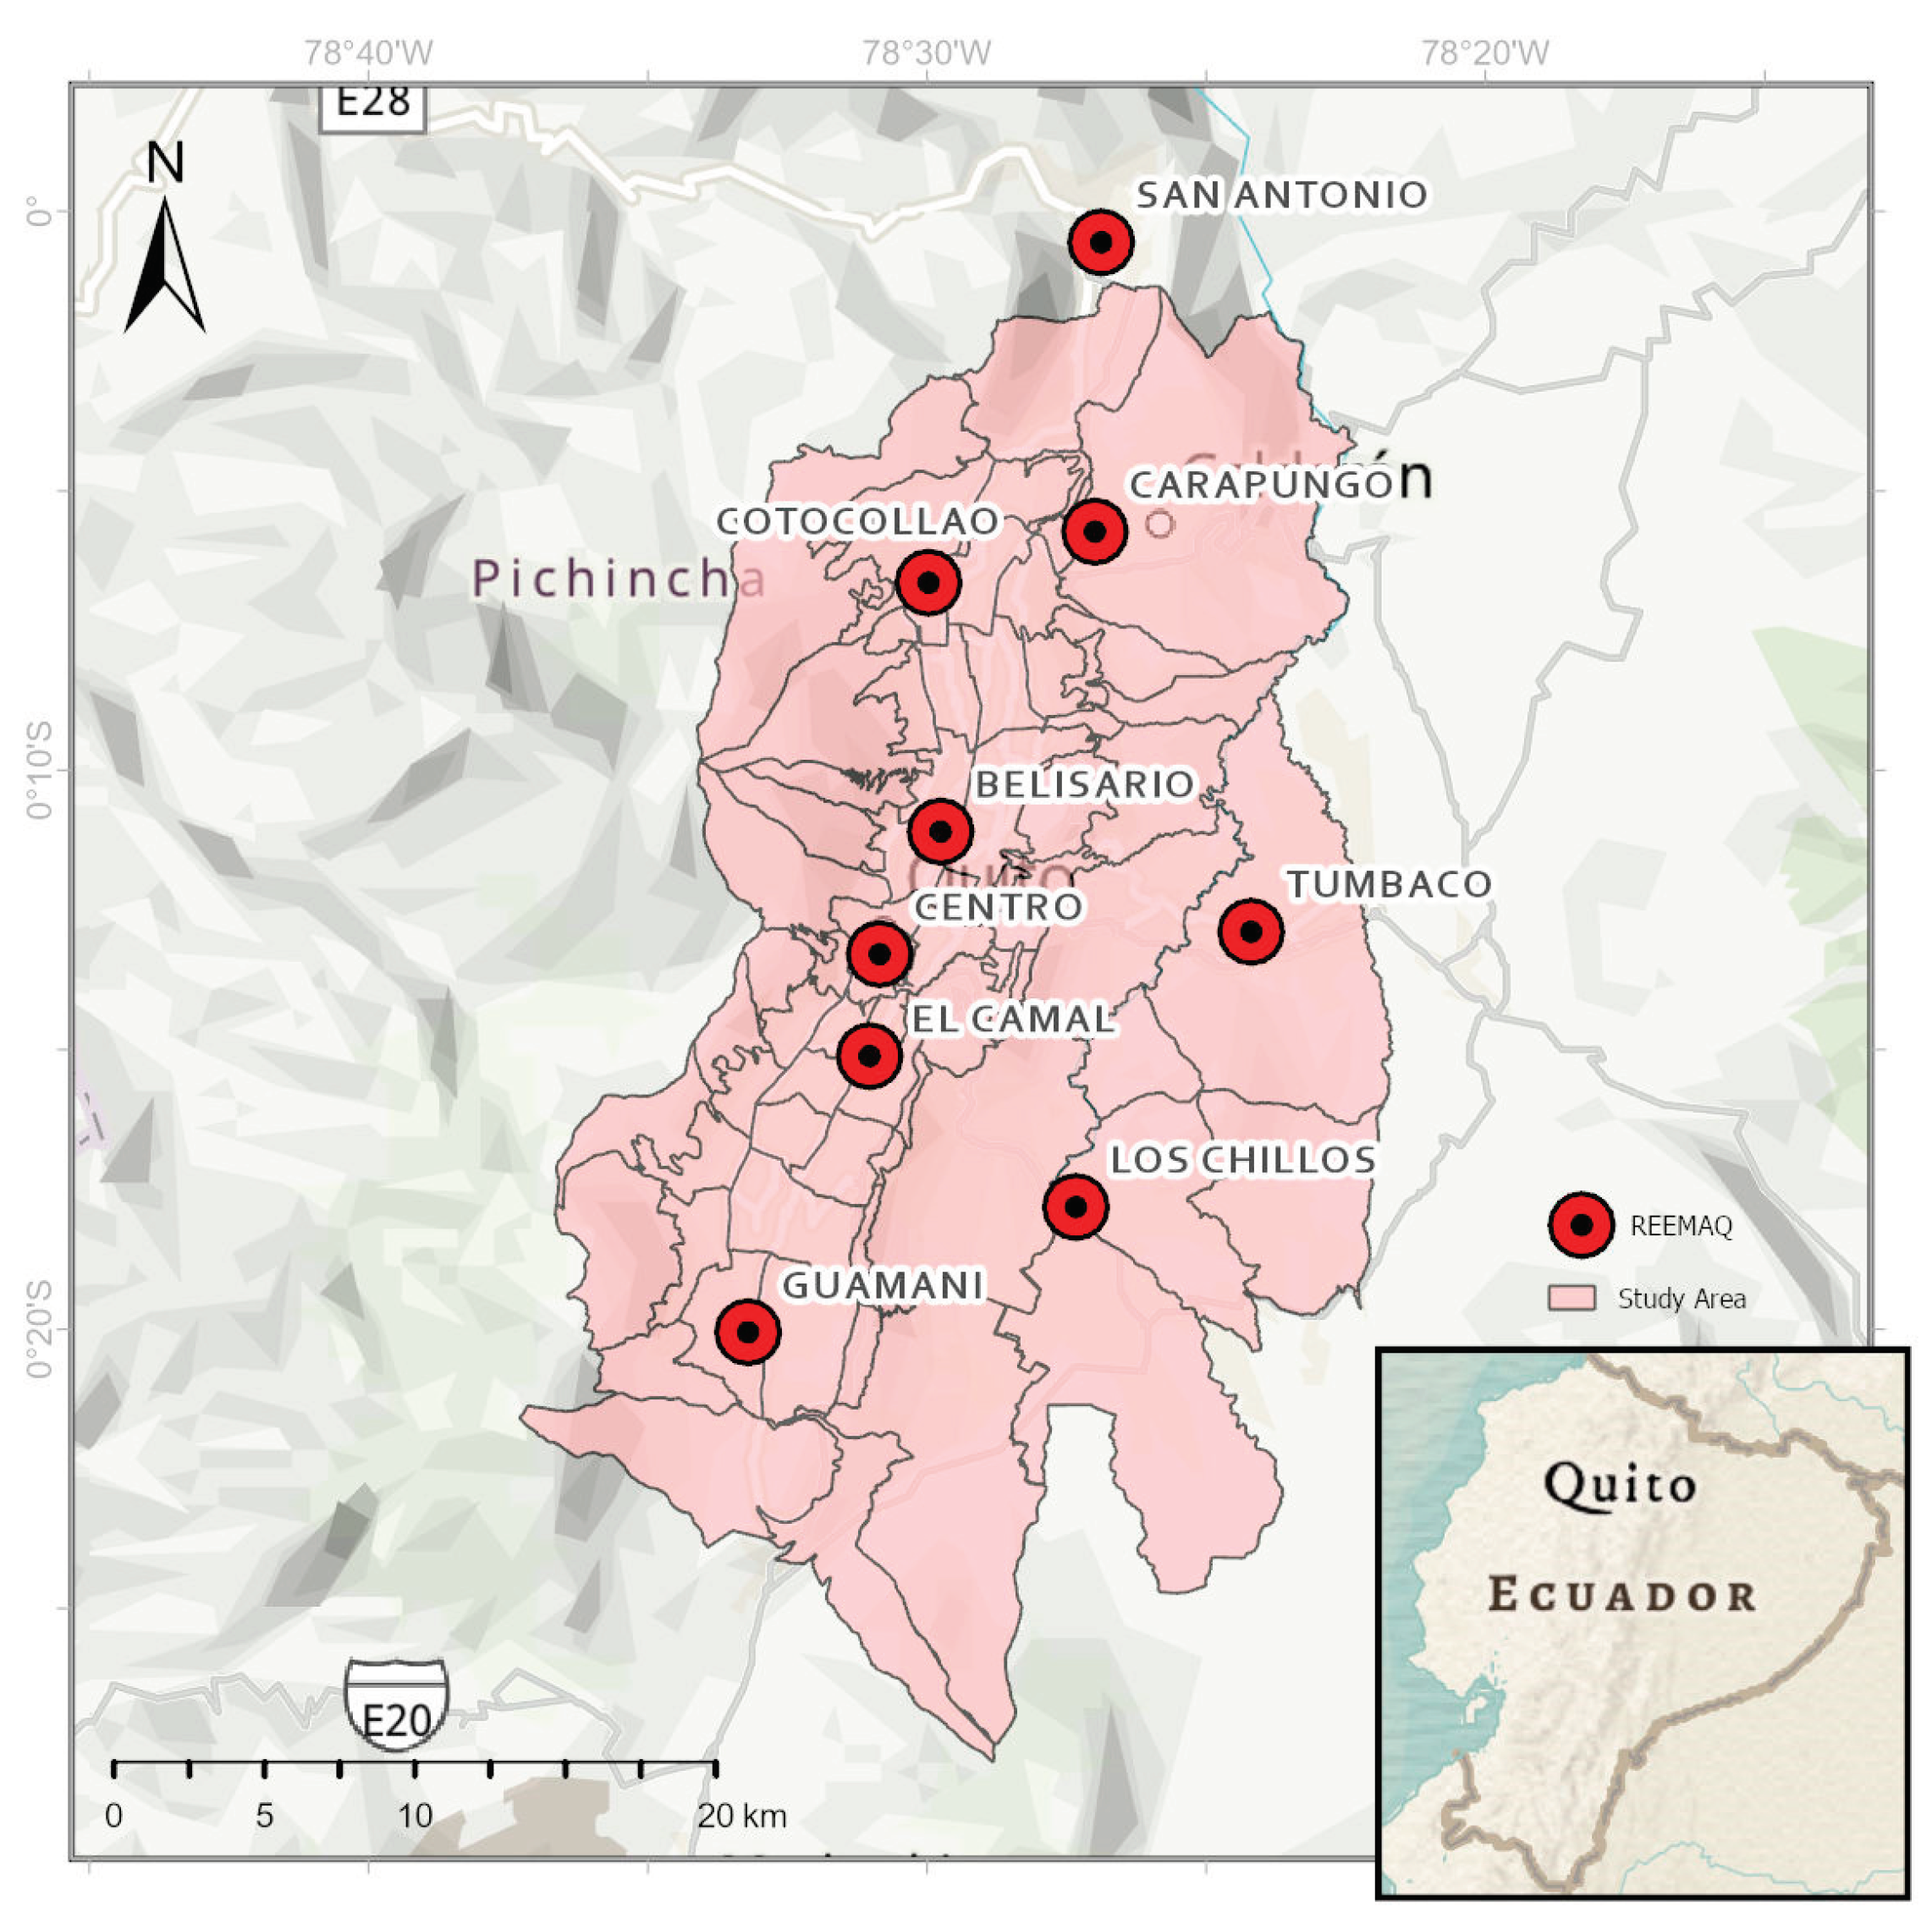
Figure 2.
Workflow diagram summarizing the main steps of the study.
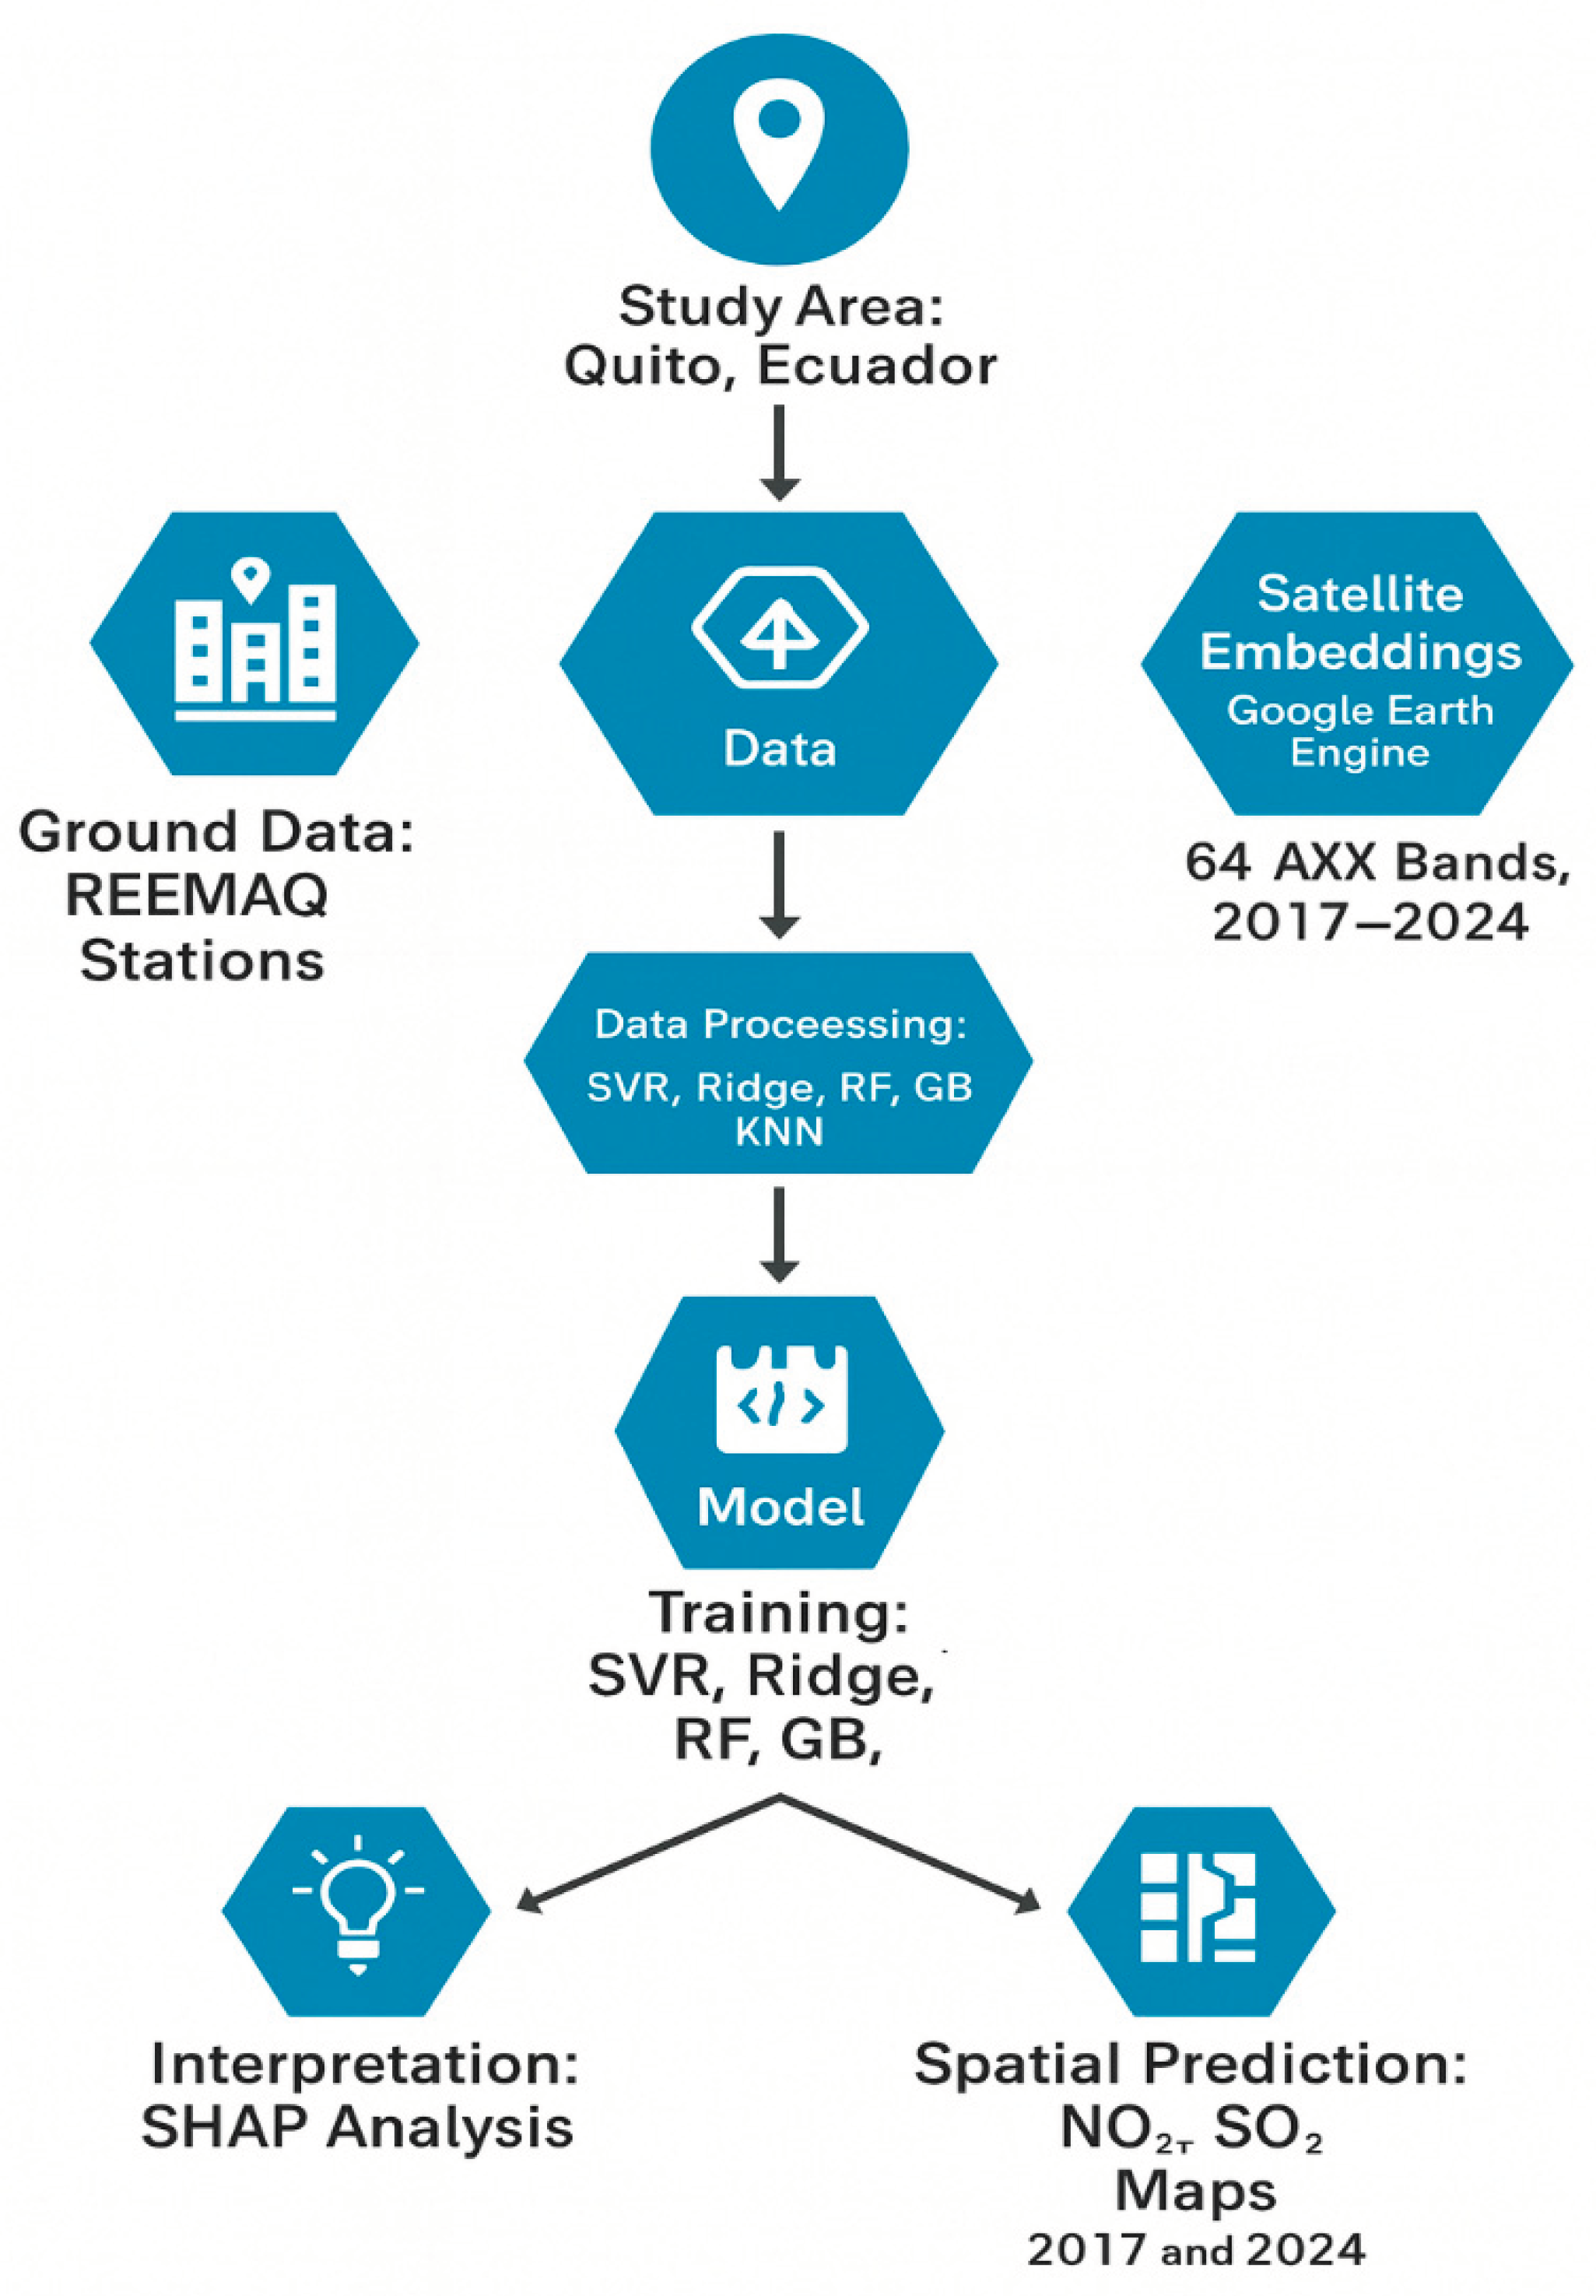
Figure 3.
Annual median CO, NO₂, PM₂.₅, SO₂, and O₃ concentrations at Quito’s REEMAQ stations from 2017–2025, with WHO limits marked by red dashed lines and the COVID-19 lockdown period highlighted in gray, showing pollutant-specific trends and station-level differences.
Figure 3.
Annual median CO, NO₂, PM₂.₅, SO₂, and O₃ concentrations at Quito’s REEMAQ stations from 2017–2025, with WHO limits marked by red dashed lines and the COVID-19 lockdown period highlighted in gray, showing pollutant-specific trends and station-level differences.
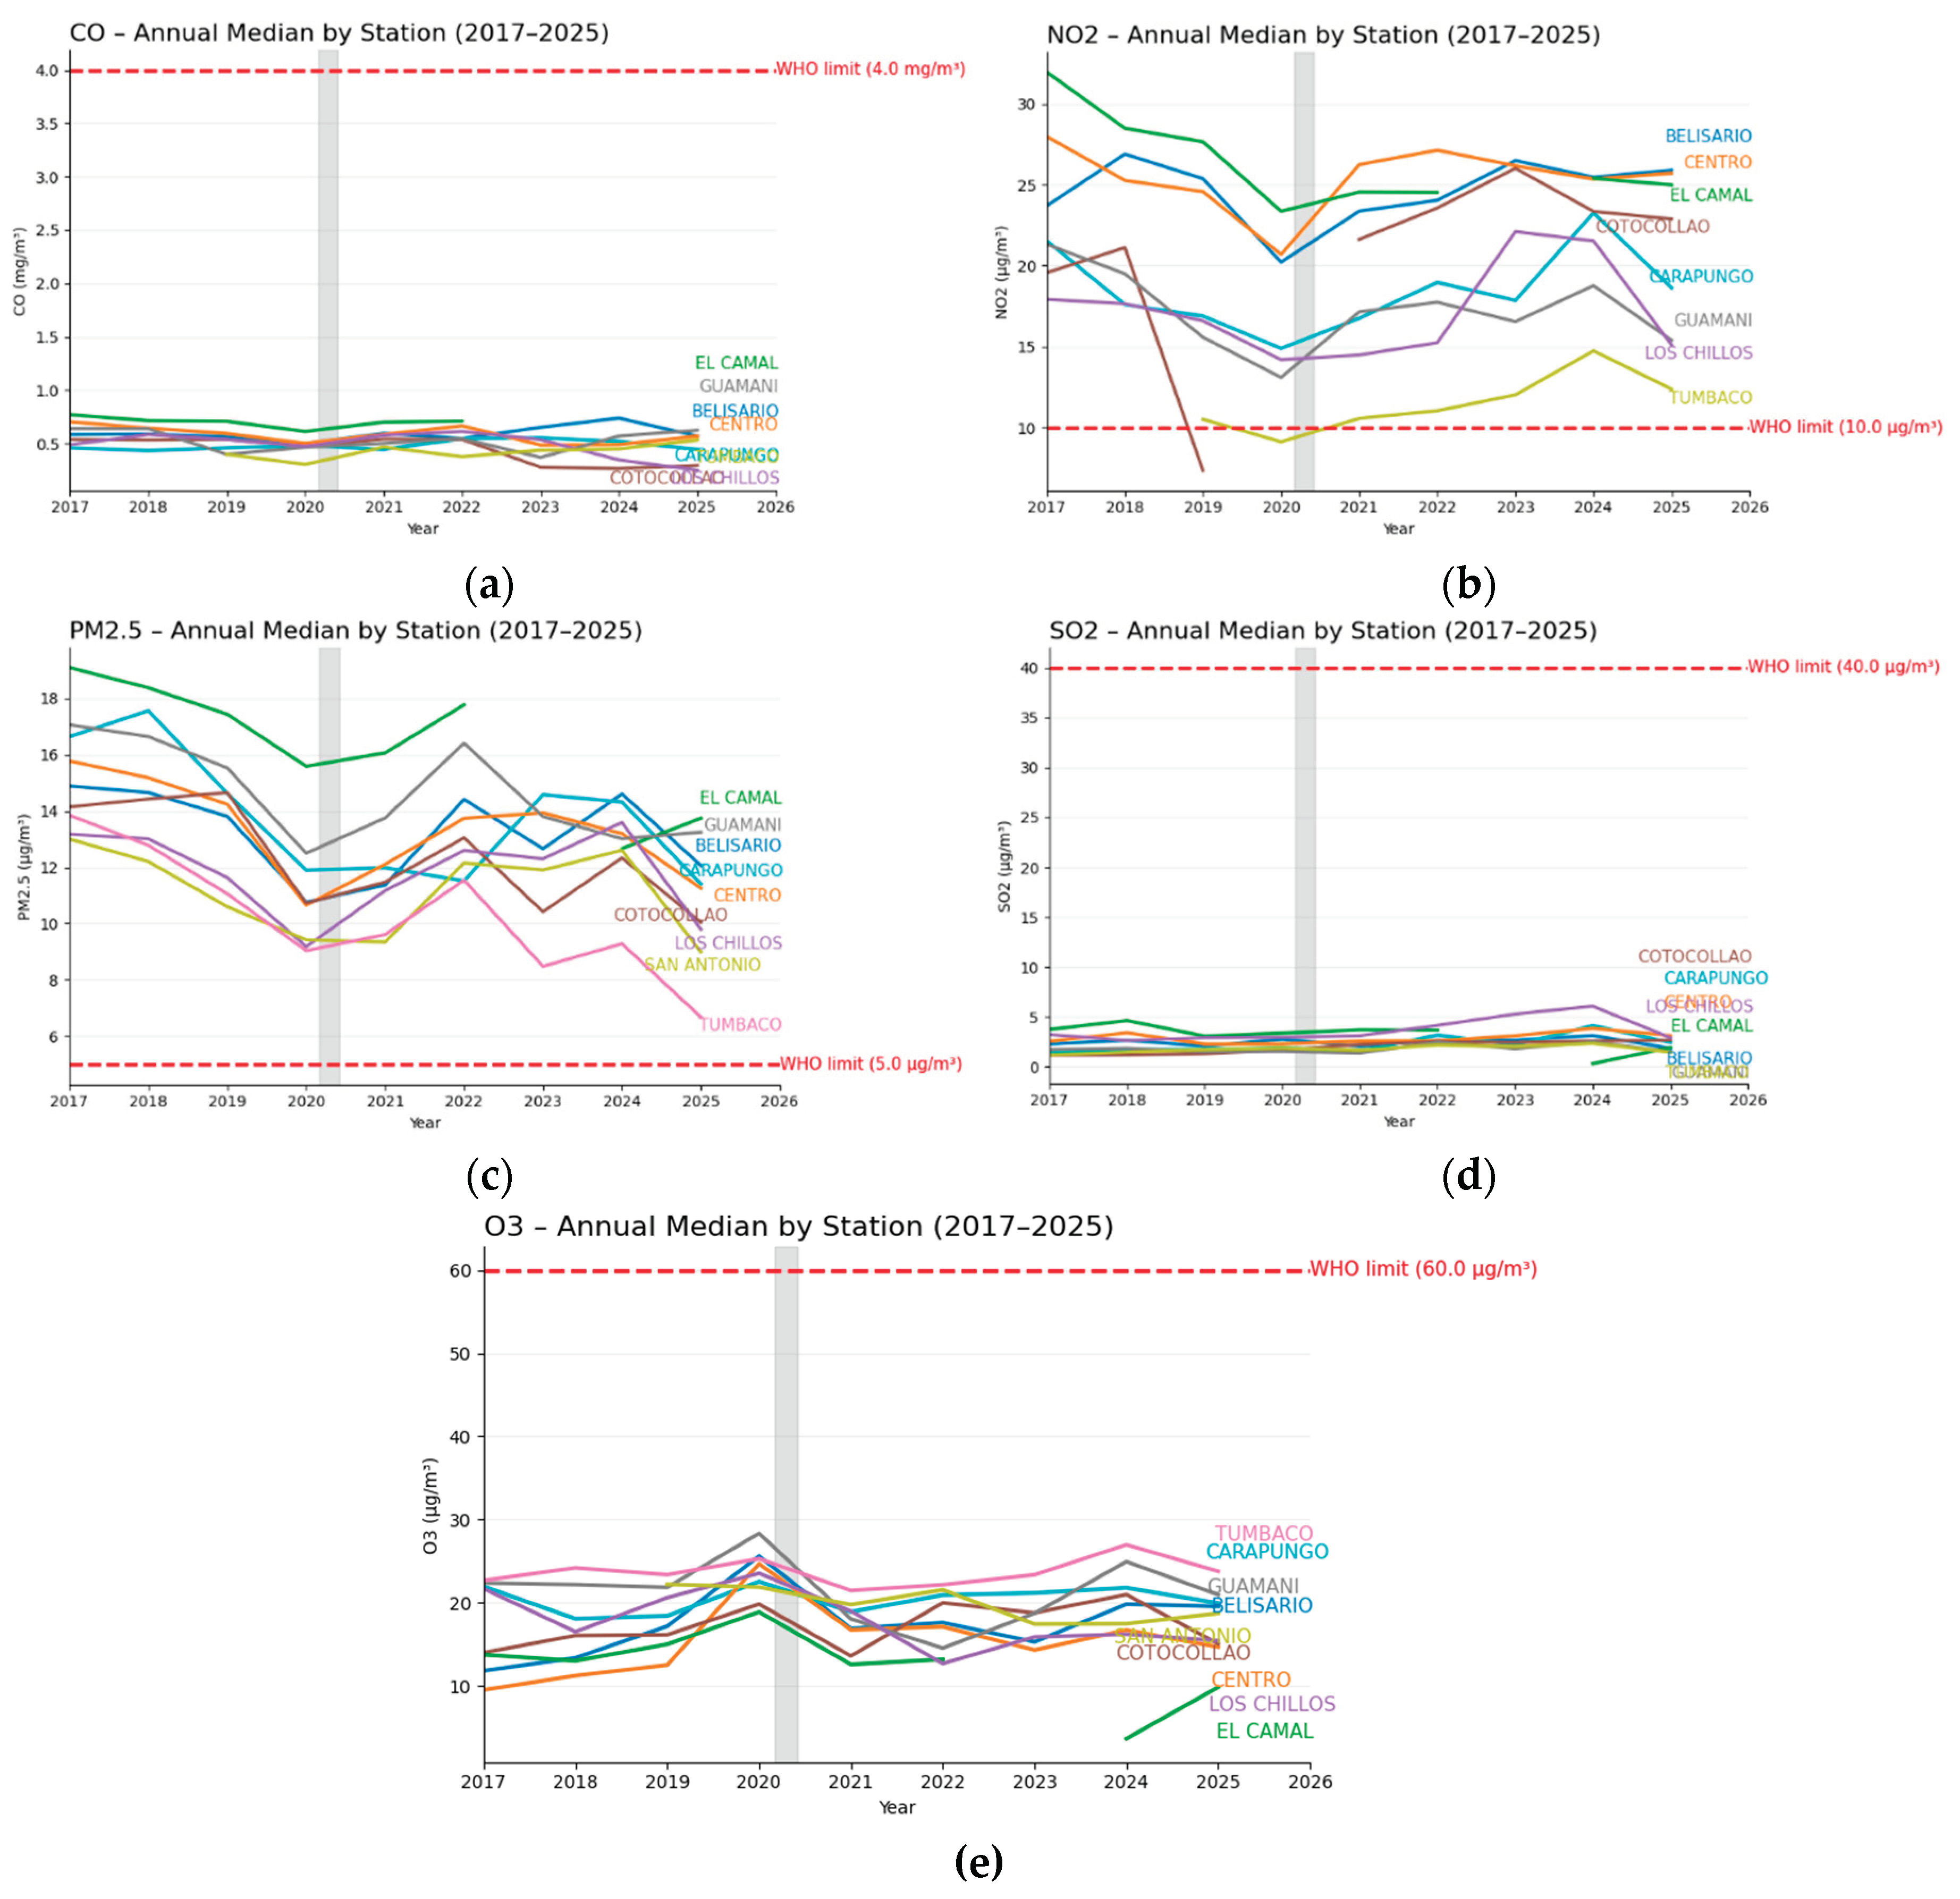
Figure 6.
Spatial distribution of predicted NO₂ concentrations in Quito at 10 m resolution for (a) 2017 and (b) 2024 using the best-performing model. Higher concentrations are observed along major transport corridors and in central districts, with reductions in the city center and increases in southern peri-urban areas over the study period.
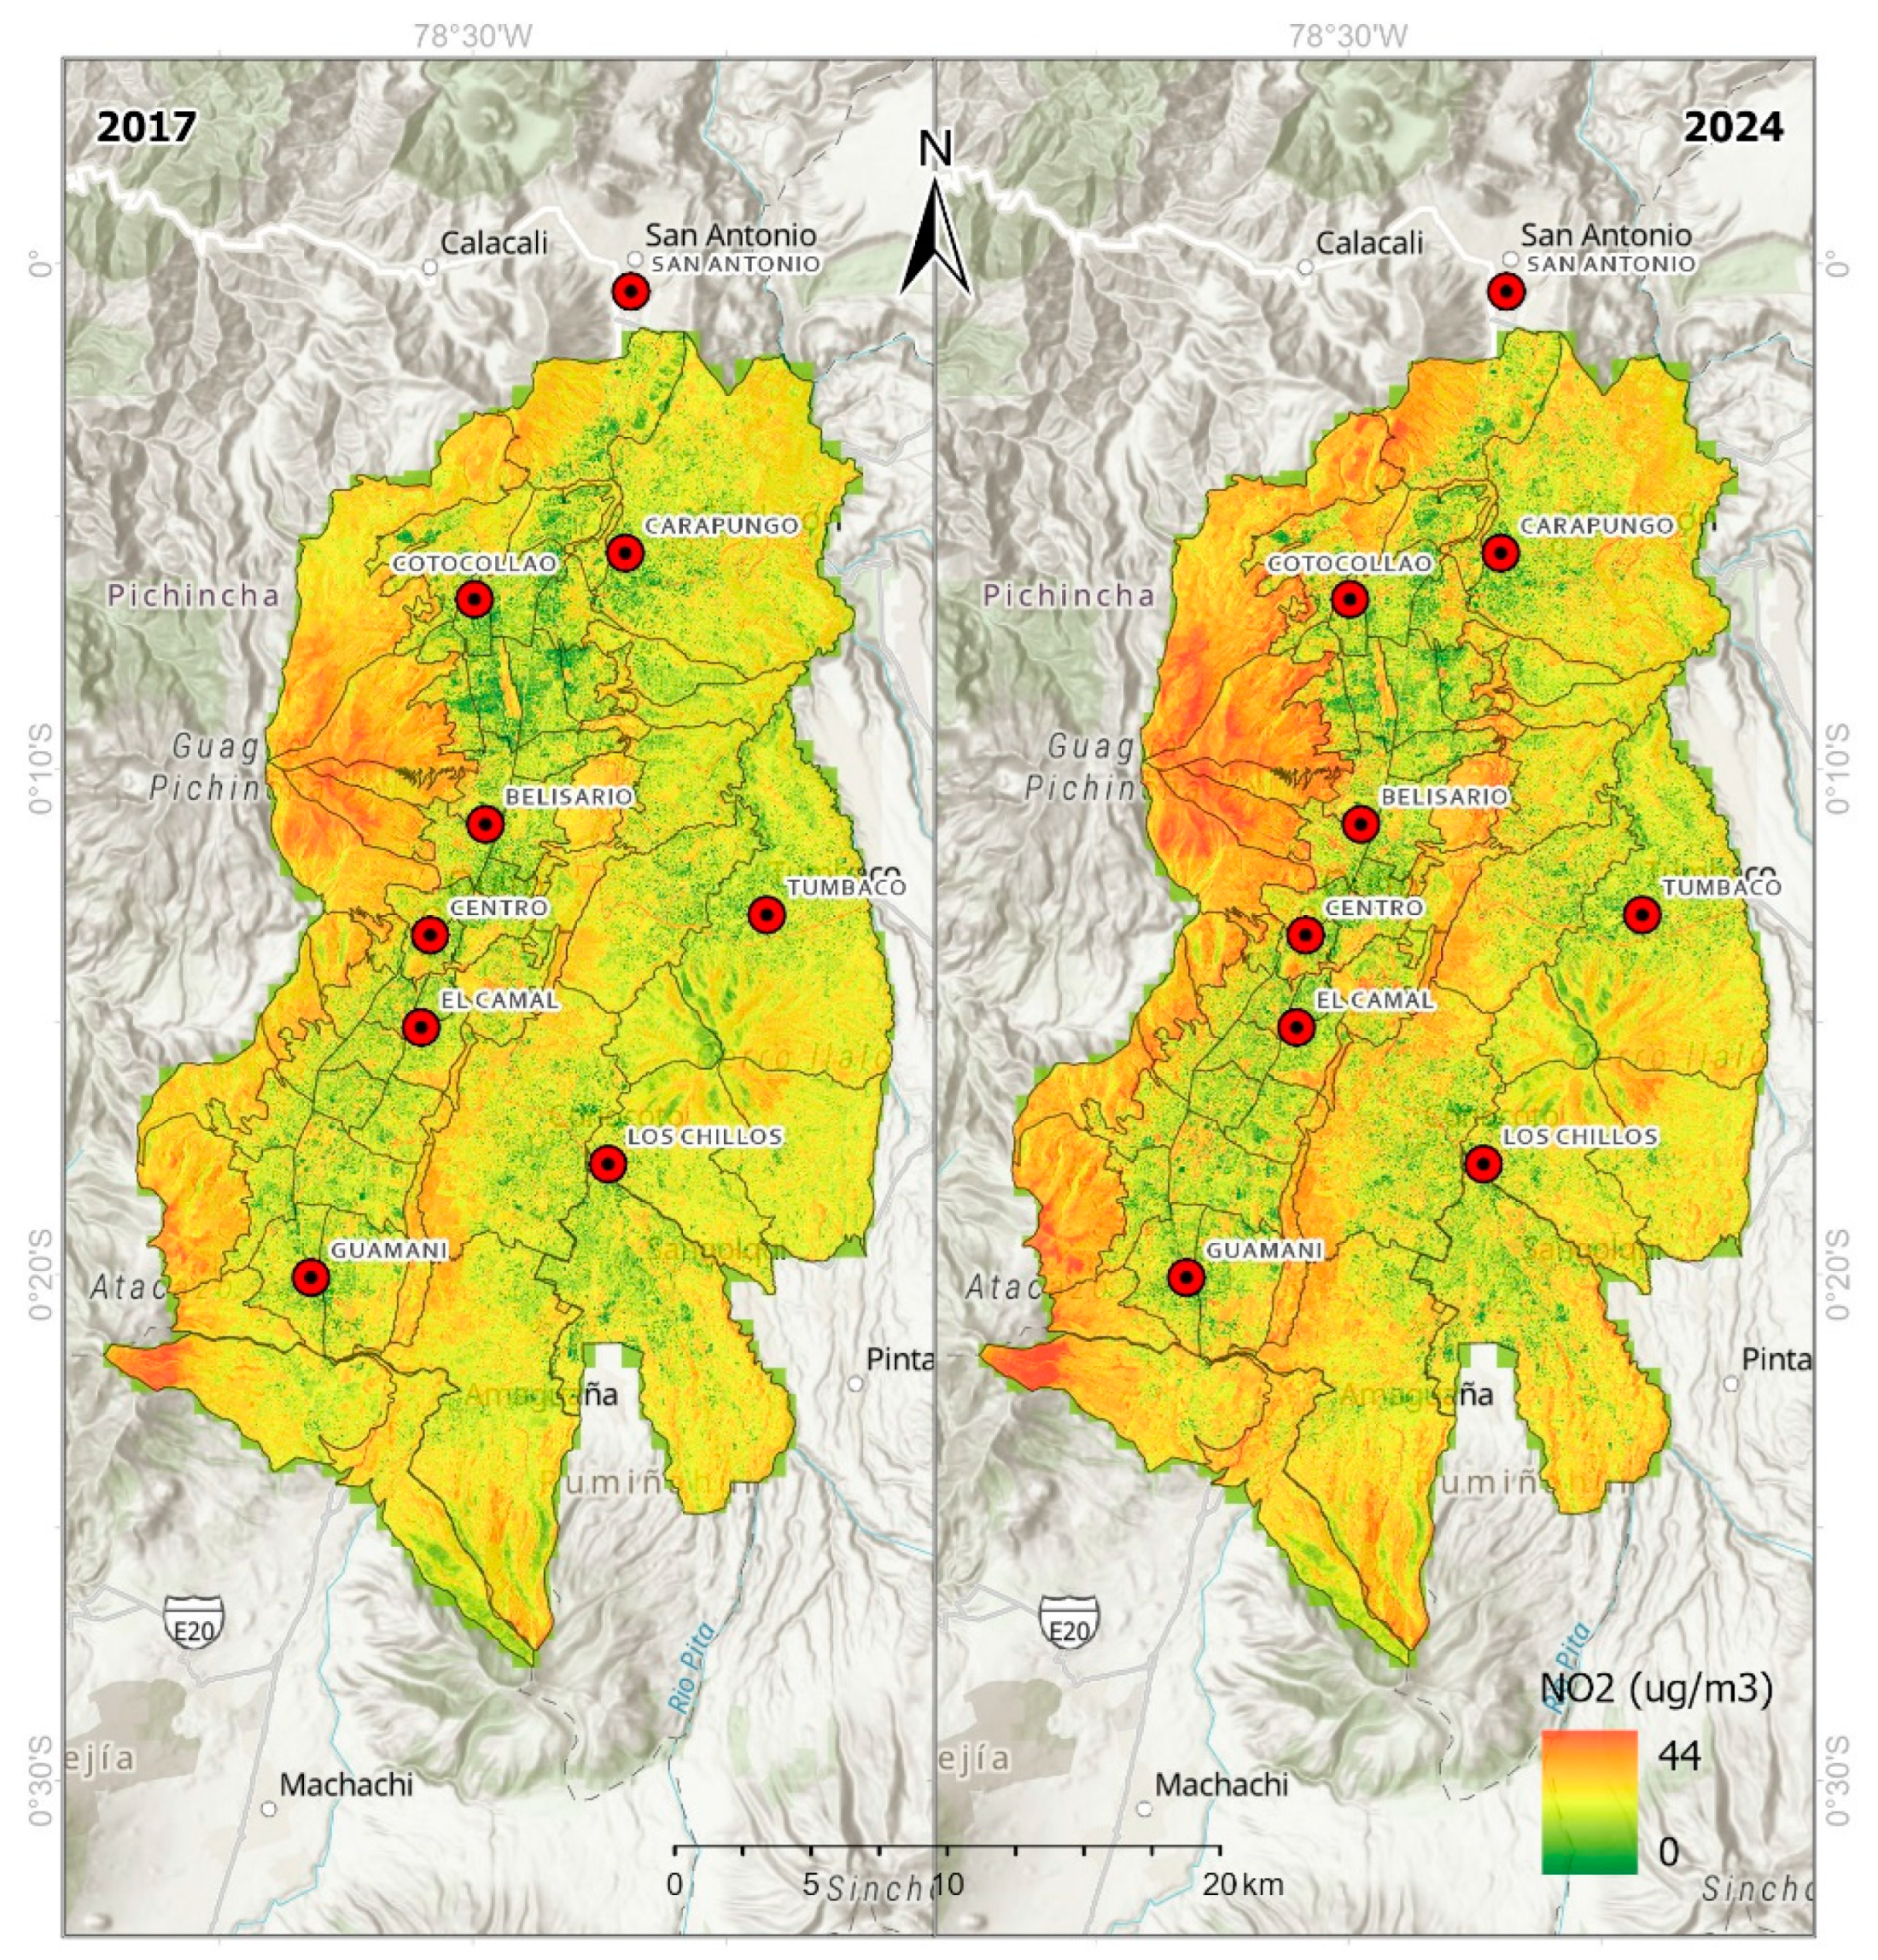
Figure 7.
Spatial distribution of predicted SO₂ concentrations in Quito at 10 m resolution for (a) 2017 and (b) 2024 using the best-performing model. Persistent hotspots are observed in the southern industrial corridor, with localized intensification between 2017 and 2024.
Figure 7.
Spatial distribution of predicted SO₂ concentrations in Quito at 10 m resolution for (a) 2017 and (b) 2024 using the best-performing model. Persistent hotspots are observed in the southern industrial corridor, with localized intensification between 2017 and 2024.
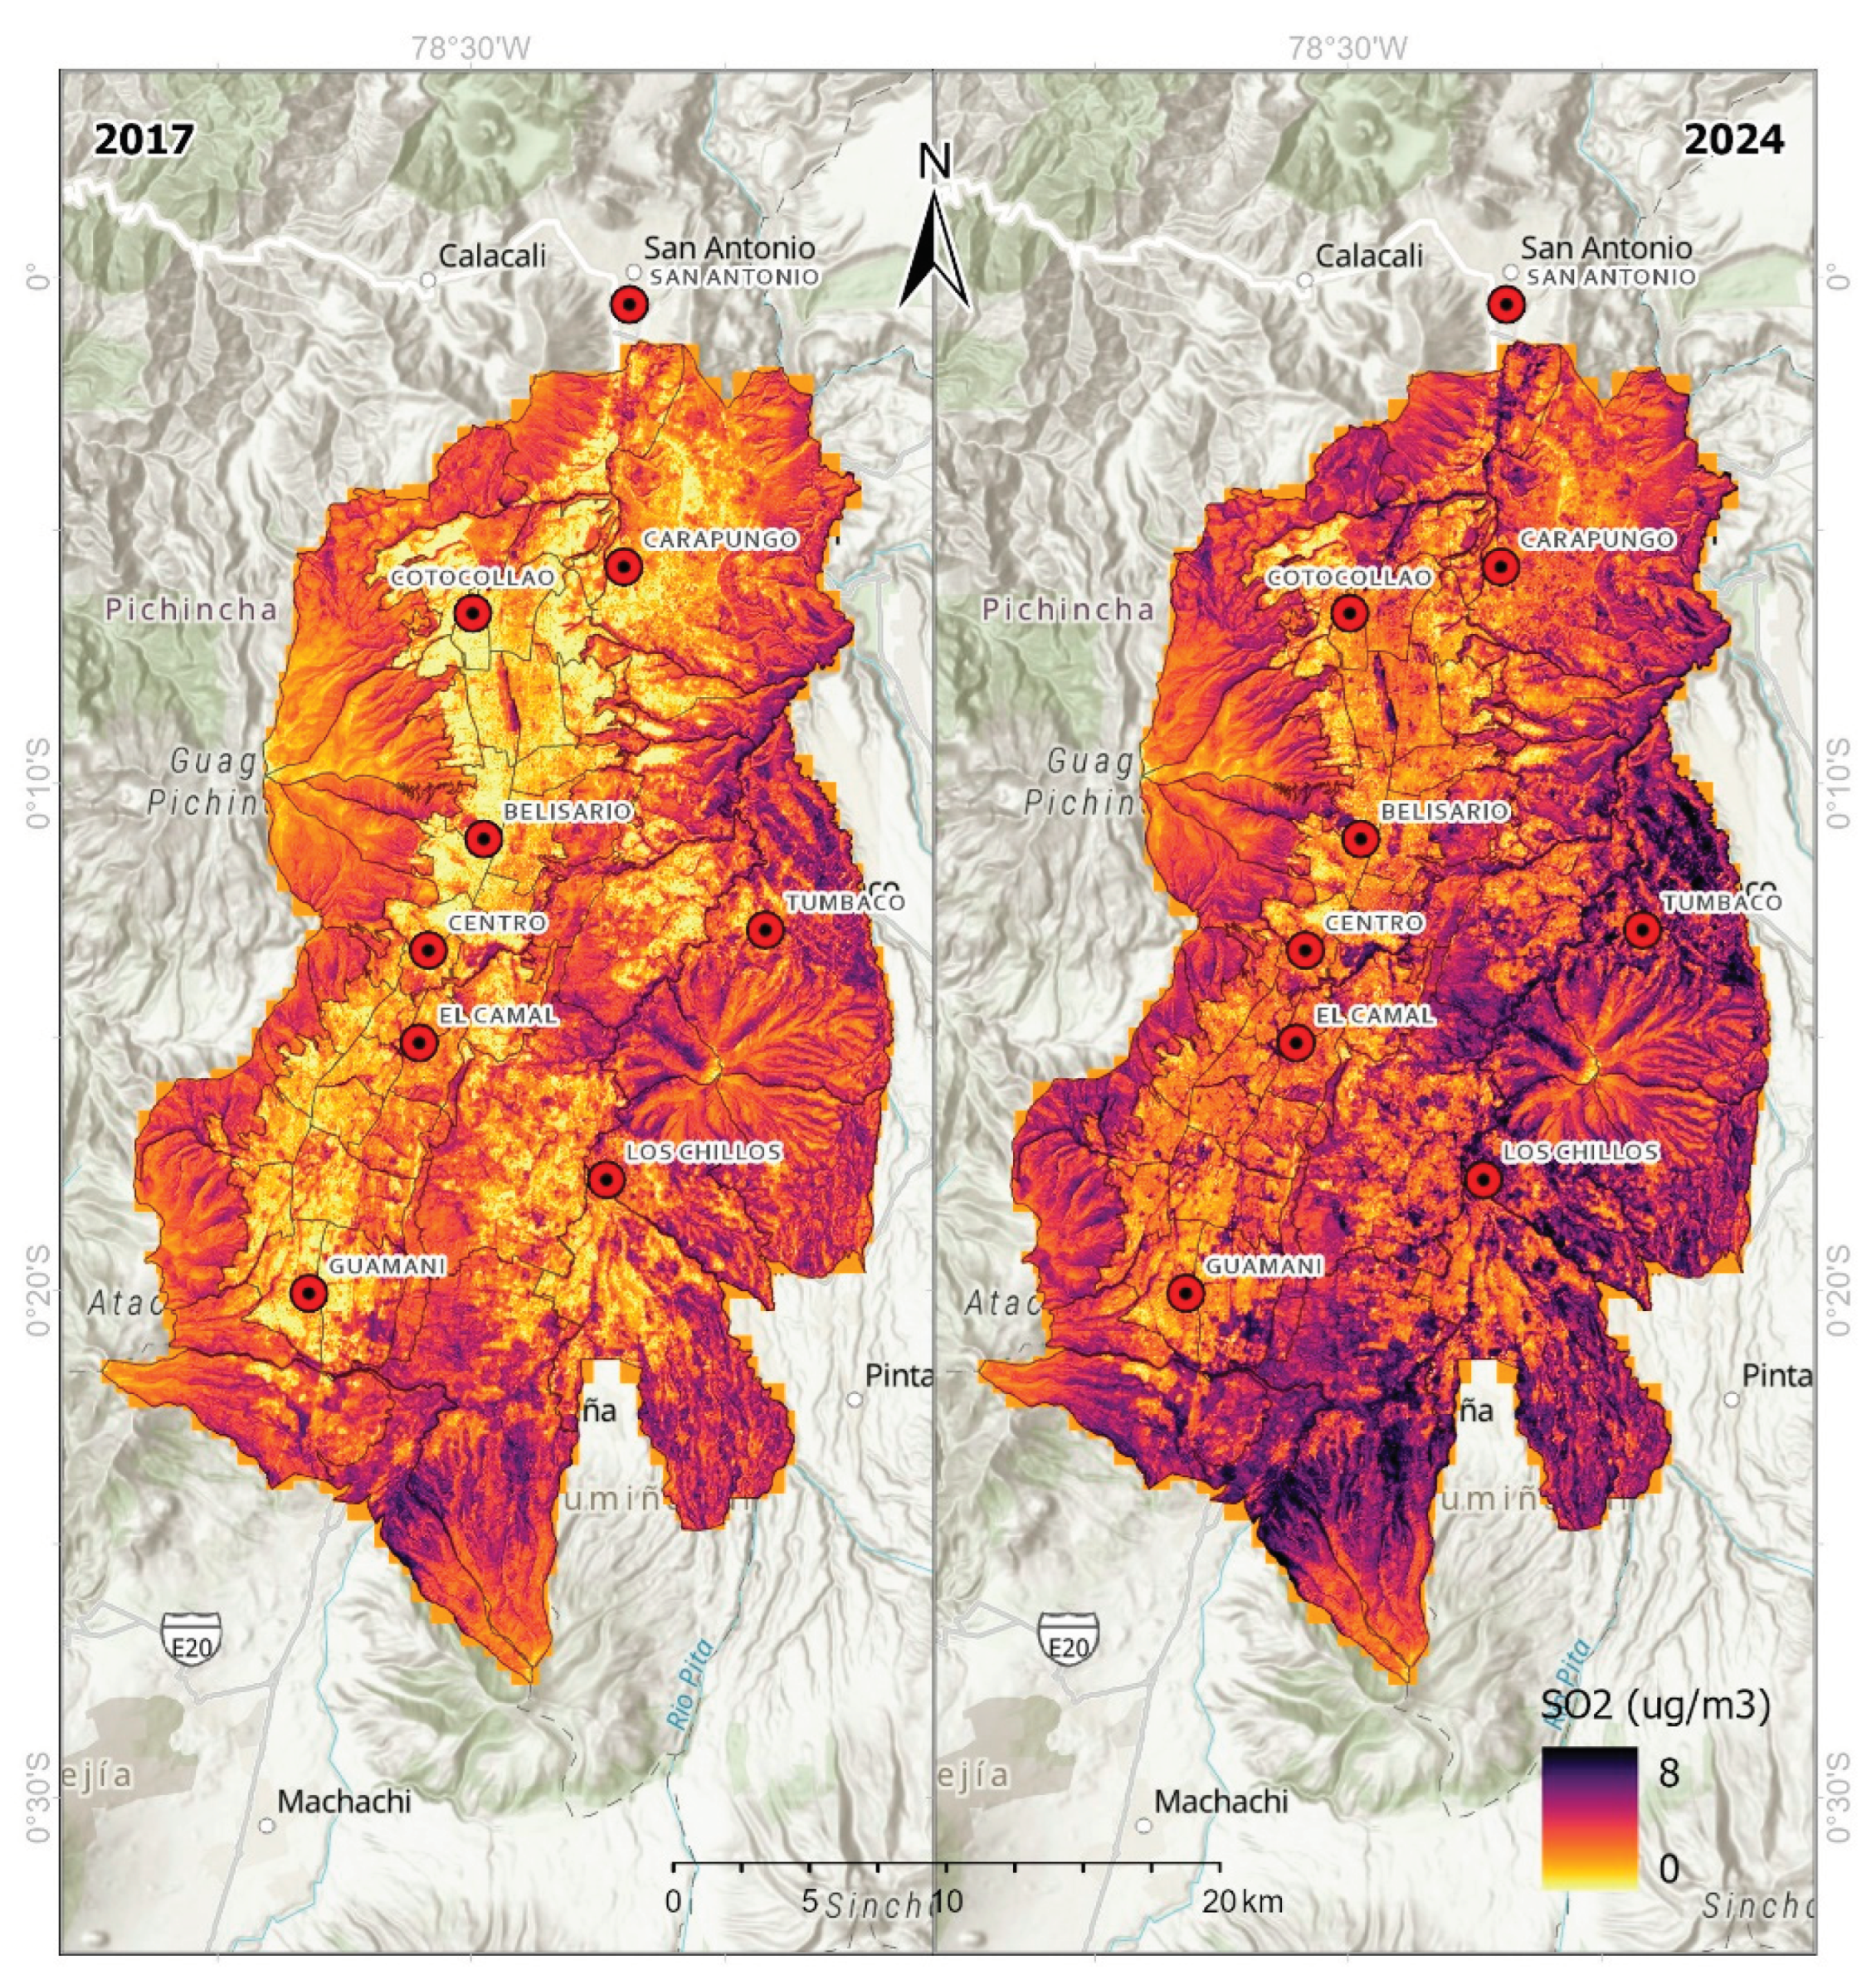

Table 1.
Performance metrics of the best-performing machine learning models for each pollutant using annual AlphaEarth Foundations satellite embeddings as predictors. Metrics include the number of training and testing samples, mean absolute error (MAE), root mean squared error (RMSE), and coefficient of determination (R2), based on 5-fold cross-validation with REEMAQ ground-based measurements from Quito, Ecuador, for 2017–2024.
| Pollutant | Model | No. Train | No. Test | MAE | RMSE | R2 |
|---|---|---|---|---|---|---|
| CO | SVR | 42 | 18 | 0.06 | 0.07 | 0.61 |
| GradientBoosting | 42 | 18 | 0.07 | 0.08 | 0.48 | |
| NO2 | SVR | 42 | 18 | 2.53 | 2.91 | 0.71 |
| KNN | 42 | 18 | 2.33 | 2.92 | 0.71 | |
| O3 | RandomForest | 48 | 21 | 3.78 | 4.56 | -0.02 |
| Ridge | 48 | 21 | 3.67 | 4.60 | -0.04 | |
| PM2.5 | Ridge | 49 | 22 | 1.20 | 1.57 | 0.55 |
| ElasticNet | 49 | 22 | 1.21 | 1.57 | 0.55 | |
| SO2 | SVR | 44 | 19 | 0.28 | 0.39 | 0.71 |
| RandomForest | 44 | 19 | 0.36 | 0.43 | 0.66 |
Disclaimer/Publisher’s Note: The statements, opinions and data contained in all publications are solely those of the individual author(s) and contributor(s) and not of MDPI and/or the editor(s). MDPI and/or the editor(s) disclaim responsibility for any injury to people or property resulting from any ideas, methods, instructions or products referred to in the content. |
© 2025 by the authors. Licensee MDPI, Basel, Switzerland. This article is an open access article distributed under the terms and conditions of the Creative Commons Attribution (CC BY) license (http://creativecommons.org/licenses/by/4.0/).
Copyright: This open access article is published under a Creative Commons CC BY 4.0 license, which permit the free download, distribution, and reuse, provided that the author and preprint are cited in any reuse.


