
Submitted:
17 August 2025
Posted:
18 August 2025
You are already at the latest version
Abstract
This study investigates the vegetative growth of Schoenoplectus californicus (Totora) cultivated in two Andean lakes of Imbabura, Ecuador (Yahuarcocha and Imbacocha) which differ in trophic status. The aim was to evaluate how physiological and morphological factors influence growth under natural conditions. A 210-day field trial was conducted using periodic sampling and a combination of classical and functional growth analysis methods. Key growth indices—such as relative growth rate (RGR), net assimilation rate (NAR), and leaf area ratio (LAR)—were calculated from parameters like photosynthetic surface area and dry biomass. Results showed that plants from Yahuarcocha, a hypereutrophic lake, exhibited significantly higher biomass production (up to 2,380 g m⁻²) and photosynthetic area (8.68 m²) compared to those from Imbacocha. Yahuarcocha plants also reached their growth peak earlier (at 150 days) than Imbacocha plants (at 180 days). Strong correlations were found between RGR and both NAR and LAR in Yahuarcocha, while in Imbacocha, growth was primarily driven by NAR. The study concludes that both nutrient availability and anthropogenic pressures like harvesting history influence Totora’s growth dynamics. These findings support the use of physiological indicators to optimize harvesting schedules and promote sustainable cultivation strategies in highland wetland systems.
Keywords:
Andean wetlands
; biomass yield
; eutrophication
; net assimilation rate
; plant physiology
; relative growth rate
; Schoenoplectus californicus
; trophic status
1. Introduction
Totora, scientifically known as Schoenoplectus californicus (C.A. Meyer) Sóják and belonging to the Cyperaceae family, is a plant that has been used since before the arrival of the Spanish in the Americas [1,2]. Due to its great significance, it has been employed by various social groups for both practical and symbolic purposes, many of which persist to this day [3,4]. However, despite its biological and cultural importance, Totora has received less scientific attention regarding its biology and physiology than it truly deserves. Most studies on Schoenoplectus californicus have been conducted in laboratories or artificial wetlands under controlled conditions [3,5], while research in natural environments remains scarce [5,6,7]. For this reason, the present study was carried out in natural habitats, with varying trophic levels, in two lakes of the Andean highlands.
In Ecuador, Totora primarily grows in the Andean region, at altitudes above 2,000 meters above sea level [8]. Specifically, in the province of Imbabura, located in the northern Ecuadorian Andes, this plant is found in lakes bearing Kichwa names such as Yahuarcocha and Imbacocha (Figure 1). Among these, Lake Imbacocha stands out as the oldest, most extensive, and most significant Totora production area both nationally and regionally [9]. These lakes, located in Imbabura, are associated with diverse socio-geographic areas that may confer different trophic characteristics [10,11,12]. Therefore, analyzing the relationship between these trophic conditions and Totora growth may contribute to a more comprehensive understanding of the species [13,14,15].
Totora is a hydrophilic plant that thrives in soils that remain permanently or temporarily flooded, exhibiting notable resistance to inundation [16]. It is characterized by rhizomatous growth and erect, tall, conical, and triangular aerial stems that grow in dense clusters. The leaves are reduced to sheaths at the base of the stems, and the terminal inflorescence consists of numerous spikelets [17]. From an economic perspective, it is the most important species of the Cyperaceae family in countries such as Argentina, Bolivia, Ecuador, Guatemala, Mexico, Peru, and the United States [17,18], as its fibers are used to produce a variety of handicrafts (Figure 2) and the traditional reed boats known as caballitos de totora (Galpon, 1981). In addition, this plant plays essential ecological roles, including the restoration and stabilization of altered or degraded wetlands, removal of heavy metals and nutrients in treatment plants, and providing food and shelter for wildlife, among other benefits [19,20].
Vegetative growth analysis is a quantitative method used to understand the development of a plant or plant population under both natural and controlled environmental conditions [21]. This technique has been widely applied to study the factors affecting plant growth and yield by monitoring the accumulation of dry matter over time [22,23]. There are two main approaches to conducting growth analysis: the first, known as the classical approach, involves taking measurements at relatively long time intervals using a large number of plants; the second, called the functional approach, involves more frequent measurements but with a smaller number of plants [24,25]. Studies with Schoenoplectus californicus in constructed wetlands have applied allometric and classical growth analysis methods to assess biomass accumulation and nutrient uptake dynamics [16,26,27].
The fundamental concept in vegetative growth analysis is the relative growth rate (RGR), which is defined as the increase in biomass relative to the existing biomass over a given period of time. In the early stages of plant development, growth typically follows an exponential pattern, with notable differences observed among species [28,29]. RGR is influenced by both environmental and genetic factors [30,31] and it helps determine the types of habitats a species is capable of colonizing [32,33,34]. Furthermore, RGR can be understood as the result of the interaction between parameters that reflect the morphology and physiology of growth—factors that may be critical to a species’ survival within a plant community [23,29,35,36,37].
Other indices that, like RGR, allow for the evaluation of plant efficiency include the leaf area ratio (LAR), which represents the ratio between leaf area and total plant mass and is considered a morphological component [38]; and the net assimilation rate (NAR), which reflects average photosynthetic efficiency by measuring the net gain of assimilates per unit of leaf area and time [23]. NAR is a physiological component that also helps explain interspecific differences in RGR [39,40].
Therefore, the information obtained from the vegetative growth analysis of Totora is highly valuable for researchers, farmers, and traditional cultivators, as it can help optimize natural fiber production, improve the craftsmanship process, and ultimately increase the economic returns derived from its cultivation.
2. Materials and Methods
Totora is cultivated in Lakes Yahuarcocha and Imbacocha as raw material for handicraft production. Lake Imbacocha stands out as the oldest Totora cultivation area in the country and region (for over 500 years), highlighting the plant’s significance in the study area [1]. Within this lake, the cultivation area selected for analysis was Cusín (Cus 1). In Lake Yahuarcocha, the selected area was located adjacent to the wastewater treatment plant in the parish of San Miguel de Yahuarcocha (Yah 1).
At each selected site in Lakes Yahuarcocha and Imbacocha, an area measuring 14 m in length by 2 m in width (28 m² plots) was demarcated, and seven subplots of 2 x 2 m (4 m²) were established. The first subplot was evaluated at 30 days, the second at 60 days, continuing until the seventh subplot was evaluated at 210 days (seven months after the start of evaluations). In each subplot, all plants (tillers) that had grown within 1 m² (four replicates) were collected at the corresponding time (Figure 3) [41]. The study was conducted from November 2024 to May 2025. The variables evaluated for the comparative analysis of Totora vegetative growth were: a) photosynthetic stem area, defined as the total photosynthetic surface area of all aerial stems present in one square meter of the plant growth zone; b) dry mass of the stems; and c) dry mass of the roots [41,42].
The quantitative interpretation of growth was based on descriptive models employing classical and functional analysis approaches [43]. For this purpose, variables related to leaf area increment (a measure of the assimilatory system) as well as dry matter variables (a measure of the plant material present) were taken [23,44]. The growth indices calculated for the two cultivation areas of Yahuarcocha and Imbacocha were:
- Relative Growth Rate (RGR): increase in plant material per unit of existing plant material per unit of time [45].
- Absolute Growth Rate (AGR): increase in dry mass of plant material per unit of time [23].
- Net Assimilation Rate (NAR): estimates the plant’s photosynthetic capacity; represents the rate of increase in plant mass per unit of leaf area [46].
- Leaf Area Ratio (LAR): ratio of leaf area to total plant mass [44].
- Leaf Weight Ratio (LWR): ratio of leaf biomass to total plant biomass [44].
- Specific Leaf Area (SLA): ratio between leaf area and dry mass of each leaf [44].
- Leaf Area Index (LAI): instantaneous measure relating assimilatory surface area per unit of ground surface area [23].
- Harvest Index (HI): ratio between the yield of the harvestable organ and the plant biomass [23].
- Crop Yield (R): product of biomass and the harvest index (HI) [23].
For the indices referring to leaf structure (Leaf Area Ratio, Leaf Weight Ratio, Specific Leaf Area, and Leaf Area Index), data were collected from the aerial stem as the structure responsible for photosynthesis (since true leaves are not conspicuous). The acronyms used to identify each index correspond to their English abbreviations. Definitions of the growth indices were taken from Villar et al. (2008) [29] and Di Benedetto and Tognetti (2016) [25]. Calculations were performed following the methodology proposed by Hunt et al. (2002) [23]. Table 1 presents the calculation formulas and the units in which the results are expressed.
The analysis of data related to the estimation of the functional relationship between Net Assimilation Rate and Relative Growth Rate, and between Leaf Area Ratio and Relative Growth Rate, in the vegetative growth analysis of cultivated Totora populations from Lakes Yahuarcocha and Imbacocha, was performed using the Coefficient of Determination (R²) [47,48,49]. The graphs were generated using the MS Excel tool.
3. Results
This study on vegetative growth analysis was conducted in Lakes Yahuarcocha and Imbacocha, where Totora is cultivated and commercially exploited. The averaged values of the traits—photosynthetic area (stems present in 1 m²), dry mass of the plant, and dry mass of the stems—corresponding to the Yahuarcocha (Yah 1) and Imbacocha (Imb 1) sites are presented in Table 2.
In general, the values obtained for Totora plants from Lake Yahuarcocha were significantly higher than those recorded for plants from Imbacocha. The Yahuarcocha plants reached the greatest photosynthetic surface area (8.68 m²), the highest stem dry mass (2,380 g m⁻²), and the highest total plant dry mass (4,390 g m⁻²) at 150 days, which marked the peak of their vegetative growth. In contrast, Totora plants from Lake Imbacocha reached their maximum values for photosynthetic area (5.77 m²), stem dry mass (1,050 g m⁻²), and total plant dry mass (2,068 g m⁻²) at 180 days of cultivation. This indicates that their maximum growth stage occurred 30 days later than that of the Yahuarcocha plants.
The growth curves of plants from Lake Yahuarcocha and Lake Imbacocha showed different patterns for the variables of photosynthetic stem area and stem dry mass over the 210-day evaluation period. As shown in Figure 4a, the dynamics of photosynthetic area growth in Yahuarcocha followed an exponential increase up to 90 days (with the most pronounced increases between 60 and 90 days); the linear growth phase occurred between 90 and 120 days; the deceleration phase took place from 120 to 150 days; and the senescence phase began at 150 days.
In the Imbacocha plants, all growth phases were delayed by approximately 30 days. Consequently, the exponential growth phase extended up to 120 days, with the maximum expansion of the photosynthetic area occurring between days 90 and 120. The senescence phase began at 180 days—one month later than in the Yahuarcocha plants. The maximum stem photosynthetic area for the Yahuarcocha plants was 8.68 m² at 150 days, whereas the Imbacocha plants reached only 5.77 m² at 180 days.
A similar pattern was observed in the analysis of stem dry mass (Figure 4b). As with the photosynthetic area, plants grown in Imbacocha exhibited a 30-day growth delay compared to those from Yahuarcocha. The highest dry mass for Yahuarcocha plants (2,380 g m⁻²) occurred at 150 days, while the Imbacocha plants reached their maximum dry mass (1,050 g m⁻²) at 180 days.
The Relative Growth Rate (RGR), a key metric in vegetative growth analysis, also showed variation between the two plant populations (Figure 5a). RGR values were higher in the Yahuarcocha plants only up to day 90. Beyond that point, values recorded in both sites followed a similar downward trend. The highest RGR values for the Yahuarcocha plants were recorded between days 60 and 90 (0.029 g g⁻¹ day⁻¹), whereas in Imbacocha plants, the peak occurred from day 60 (0.023 g g⁻¹ day⁻¹) to day 120 (0.021 g g⁻¹ day⁻¹).
Regarding the dynamics of the Absolute Growth Rate (AGR), as shown in Figure 5b, distinct values were observed between the two lakes throughout plant development. The highest AGR was recorded in the Yahuarcocha cultivation at 120 days (35.2 g day⁻¹), whereas the Imbacocha plants reached their peak AGR at 150 days (13.6 g day⁻¹), a value less than half that observed in Yahuarcocha.
Through the calculation of various indices associated with the vegetative growth analysis of Totora, several relationships were established that are relevant for understanding the physiological performance of this species in the high Andean lakes of northern Ecuador. The Relative Growth Rate (RGR), for instance, is influenced by two main factors: (1) the physiological component of the photosynthetic organ, known as the Net Assimilation Rate (NAR), and (2) the morphological component, referred to as the Leaf Area Ratio (LAR).
Therefore, identifying the contribution and degree of correlation between these indices (NAR and LAR) is essential for interpreting the species-specific growth dynamics under these environmental conditions. The correlation analysis (Figure 6a) between NAR and RGR for Yahuarcocha plants revealed a strong positive linear relationship (R² = 0.9875). Similarly, the relationship between LAR and RGR (Figure 6b) exhibited a positive linear correlation (R² = 0.8469). These results indicate that, in Yahuarcocha, both morphological (LAR) and physiological (NAR) aspects of the photosynthetic apparatus significantly contribute to the relative growth rate of Schoenoplectus californicus.
For the Totora plants (Schoenoplectus californicus) from Imbacocha, the results revealed a highly positive linear correlation between Net Assimilation Rate (NAR) and Relative Growth Rate (RGR), with a coefficient of determination of R² = 0.9841. In contrast, the relationship between Leaf Area Ratio (LAR) and RGR was very weak (R² = 0.1038), as shown in Figure 7. Alternative regression models—such as exponential, logarithmic, polynomial, and power functions—also yielded low correlations, all with determination coefficients below 10%.
These findings suggest that the growth dynamics of Totora in Lake Imbacocha are primarily driven by the physiological efficiency of the photosynthetic apparatus (i.e., NAR), rather than by morphological adaptations of the photosynthetic organ (i.e., LAR).
As previously mentioned, the Relative Growth Rate (RGR) is determined by the dynamic behavior of both the Net Assimilation Rate (NAR) and the Leaf Area Ratio (LAR), as RGR is mathematically defined as the product of these two indices. Therefore, in addition to examining their correlation with RGR, it was pertinent to analyze the absolute values of NAR and LAR throughout the cultivation cycle. As shown in Figure 8a, both NAR and LAR values for Totora (Schoenoplectus californicus) plants grown in Yahuarcocha exhibited a proportional decline over the course of the experiment.
However, in the case of Totora (Schoenoplectus californicus) plants grown in Imbacocha, the behavior of NAR and LAR differed. As shown in Figure 8b, the Net Assimilation Rate (NAR) reached its peak at 90 days (8.7 g g⁻¹ day⁻¹), after which its values declined steadily through day 210. In contrast, the Leaf Area Ratio (LAR) remained nearly constant throughout the duration of the experiment. As previously discussed, this variable showed limited contribution to the overall growth performance of Totora in Lake Imbacocha.
Regarding the Harvest Index (HI)—defined as the average proportion between the yield of the harvested organ (aerial stems) and the total plant biomass [25]—the two cultivation environments exhibited very similar absolute values. HI ranged from 52.7% to 54.4% in Yahuarcocha, and from 47.6% to 51.0% in Imbacocha. In both cases, the proportion of harvested biomass (stems) relative to total plant biomass was similar (Figure 9).
Finally, the Crop Yield (R)—calculated as the product of Total Biomass and Harvest Index (HI)—fit the expected sigmoid growth curve in both environments. This pattern was consistent for Totora cultivated in Yahuarcocha and Imbacocha (Figure 9). However, in quantitative terms, the plants from Yahuarcocha displayed higher peak crop yield values (2,380 g m⁻² at 150 days), compared to the maximum yield registered in Imbacocha (1,050 g m⁻² at 180 days).
4. Discussion
The growth responses of Totora (Schoenoplectus californicus) plants from Lake Yahuarcocha were significantly superior to those of plants from Lake Imbacocha. This differential response may be attributed to higher nutrient availability in Yahuarcocha, classified as a hypertrophic lake, which provides elevated levels of nutrients accessible to plants. Totora exhibits greater nutrient uptake efficiency compared to fast-growing species such as Typha angustifolia (cattail), Phragmites spp. (reeds), and Juncus spp. (rushes), commonly used in wastewater treatment [50,51].
At the conclusion of the measurements in both Totora crops (210 days), plants from Yahuarcocha exhibited 51% more dry biomass in their stems compared to those from Imbacocha, demonstrating their capacity to respond to increased nutrient availability (Figure 4b). However, the increase in photosynthetic surface area was only 28% (Figure 4a), suggesting that the photosynthetic organ in Yahuarcocha plants is more efficient due to physiological factors—namely, enhanced CO₂ fixation capacity and reduced respiratory expenditure [25]—rather than morphological differences, as Totora from both Imbacocha and Yahuarcocha share similar anatomy in their photosynthetic stems [52,53]. Also, S. californicus has been shown to support significant heterotrophic nitrogen fixation in its roots and rhizomes, contributing between 13.8% and 32.5% of its total nitrogen content, which may enhance its physiological efficiency under nutrient-rich conditions [54].
In addition to the unequal nutrient availability in both lakes, the recorded phenotypic differences may be attributed to higher harvesting pressure experienced by Totora plants in Imbacocha, as this crop has been exploited for hundreds of years, whereas Totora cultivation in Yahuarcocha began only in the mid-20th century [55]. Similar effects of selective harvesting pressure on Totora have been documented [56,57]. In Totora crops in southern Peru, biomass removal through selective cutting acts as a disturbance; if this persists over time, plants fail to adapt, leading to reduced biomass yield and altered growth dynamics [58,59,60]. Thus, besides nutrient availability, long-term harvesting pressure has likely generated pronounced differences in growth dynamics between Totora crops in Yahuarcocha and Imbacocha.
The growth kinetics of Totora plants over the seven-month evaluation period followed a sigmoidal curve in both lakes, with distinct growth stages (phases) clearly identifiable (Figure 4) [61]. Totora plants from Imbacocha Lake exhibited a 30-day delay across all growth phases compared to those from Yahuarcocha Lake—both in photosynthetic area and stem dry mass—likely due to lower nutrient availability in the water bodies (Figure 4) [62]. For instance, in Capsicum annuum (chili pepper) leaves, a greater nutrient supply has been shown to result in increased leaf area [63,64,65]. The exponential growth phase (Figure 4) is promoted by the activation of lateral buds and the production of new stems (tillering), which enhances the plant’s potential photosynthetic capacity [56,66]. The end of the exponential phase, at 90 and 120 days for Yahuarcocha and Imbacocha crops respectively, coincides with the onset of flowering.
Flowering involves the redistribution of substances produced during photosynthesis toward these newly formed structures, thereby reducing the availability of photosynthates for biomass accumulation. In Oryza sativa plants, for instance, the pre-flowering and post-flowering stages are critical for total dry matter production and are key determinants of seed yield [67,68]. Additionally, plants growing in open environments often experience a reduction in their photosynthetically active area as their leaves overlap, leading to decreased light interception due to self-shading [35,69], which ultimately lowers overall photosynthetic activity. However, conical arrangements of the photosynthetic apparatus represent an evolutionary adaptation that minimizes self-shading [70], particularly when compared to broad-leaved species. Consequently, the dominance of Totora populations over the associated vegetation the shoreline of the studied lakes may be attributed to this specific form of structural adaptation.
In Totora crops from both Yahuarcocha and Imbacocha lakes, stems are harvested every six months. However, data from the present study indicate that maximum biomass accumulation in the Yahuarcocha Totora crop is reached at five months (Figure 4) [71]. Thus, by the sixth month, the crop has entered a senescent phase, resulting in reduced biomass levels and a loss of harvestable material due to this temporal mismatch. This pattern is not observed in the Totora crop from Imbacocha Lake, where the cultivation period coincides with peak biomass accumulation (six months). This synchronicity highlights the long-standing ancestral relationship between the cultivators and Totora in Imbacocha, and also suggests the potential for transferring this knowledge to Yahuarcocha farmers, encouraging them to adjust their practices and increase their harvested yields [72].
Describing the growth of a plant or crop requires objective indicators that can be validated. In this regard, the Relative Growth Rate (RGR) is a key parameter for such analyses. The RGR pattern indicates that Totora plants in Yahuarcocha exhibit higher values, at least during the first 90 days of cultivation (Figure 5A). A rapid growth rate can confer ecological and competitive advantages by enabling plants to attain larger sizes in shorter periods, thereby enhancing their ability to capture resources such as light, water, and nutrients [29,73]. These advantages depend on the accelerated production of photosynthetic tissues and allow plants to escape the vulnerable early stages where small sizes are more susceptible to herbivory. This phenomenon is part of the resource allocation trade-off between growth and defense [74,75]. Totora plants in Yahuarcocha may have evolved mechanisms that promote rapid growth during the early, more sensitive stages of development, where competition is a critical factor for survival [76,77].
After the initial stages critical for the survival of Totora plants have passed, RGR values in both populations converge, with well-adapted stands forming dense, monospecific herbaceous layers. The gradual decline in RGR observed after 90 days (Figure 5A) may be attributed to biomass redistribution mechanisms toward newly forming organs, such as reproductive structures. In rice plants, for instance, up to 90% of the total dry matter accumulated in the grains originates from post-flowering redistribution processes, while the remaining 10% comes from the remobilization of dry matter previously stored in leaves and stems before flowering [67,78].
The Absolute Growth Rate (AGR), which represents the amount of dry mass accumulated by plants per unit of time, revealed that Totora plants from Yahuarcocha Lake are significantly more efficient in dry matter accumulation—approximately 150% higher—than those from Imbacocha Lake. Several factors may explain this difference: (a) extrinsic or environmental factors that constrain growth, particularly nutrient availability, which differs between the two lakes [26,79]; (b) intrinsic factors, including morphological and physiological traits that interact to varying degrees and influence vegetative growth [80]; and (c) synergistic effects, in which Totora plants exhibit high growth rates due to competitive advantages over coexisting species within the same ecological niche, especially under the favorable nutrient conditions observed in Yahuarcocha [26,80]. The relationship between competitive strategies and vegetative growth across species has been well documented [80, (Grime, 1979).
The onset of the growth deceleration phase (Figure 4), occurring at 120 days for Totora plants in Yahuarcocha and at 150 days in Imbacocha, appears to be driven by a reduction in AGR values (Figure 5). This decline is likely the result of an increase in non-photosynthetic tissue and mutual shading among photosynthetic stems.
The observed differences in RGR and AGR values between the two Totora cultivation sites initially suggest variation in physiological activity. For instance, the faster-growing plants from Yahuarcocha may exhibit higher photosynthetic rates, lower respiration rates, or a combination of both. An alternative explanation could lie in morphological differences—such as a greater proportion of biomass allocated to stems or a higher specific photosynthetic area in the faster-growing plants. To evaluate these hypotheses, the Relative Growth Rate (RGR) was partitioned into two components: the physiological component, Net Assimilation Rate (NAR), and the morphological component, Leaf Area Ratio (LAR). It is important to recall that RGR is the product of LAR and NAR [82]. Moreover, variation in RGR among herbaceous species is predominantly explained by LAR, with NAR playing a secondary role or interacting depending on irradiance and species traits [34,45]. Meta-analyses consistently show that SLA and LMR contribute strongly to LAR and thereby to RGR differences [83].
The strong positive relationships between the physiological growth component, NAR, and RGR (R² = 0.9875), as well as between the morphological component, LAR, and RGR (R² = 0.8469), indicate that both components contribute substantially and similarly to the growth of Totora in Yahuarcocha Lake (Figure 6). In other words, these are plants characterized by high photosynthetic rates (NAR) and a relatively large photosynthetic area in proportion to total plant biomass (LAR).
The strong positive relationships between the physiological growth component, NAR, and RGR (R² = 0.9875), as well as between the morphological component, LAR, and RGR (R² = 0.8469), indicate that both components contribute substantially and similarly to the growth of Totora in Yahuarcocha Lake (Figure 6). In other words, these are plants characterized by high photosynthetic rates (NAR) and a relatively large photosynthetic area in proportion to total plant biomass (LAR) [34]. Previous studies have demonstrated that such traits are common in fast-growing species, where growth is driven by high net assimilation and expansive leaf area deployment [83,84]. This strategy is especially advantageous in nutrient-rich environments like Yahuarcocha, where competitive dominance among aquatic macrophytes is linked to efficient resource acquisition [85].
In the case of the Totora crop from Imbacocha Lake, the relationship between NAR and RGR is strongly positive (R² = 0.9841), whereas the linear relationship between LAR and RGR is very weak (R² = 0.1038). This suggests that Totora growth in Imbacocha is explained almost entirely by the physiological component (NAR). In other words, the RGR of plants in this lake is primarily determined by the performance of the photosynthetic apparatus, regardless of its structure or biomass, within a given period (Figure 7).
High contributions of NAR to species growth also imply a differential allocation of biomass among plant organs, as well as chemically distinct processes involved in leaf area development [21]. For example, a high foliar nitrogen content is likely to increase the concentration of RuBisCO, thereby enhancing the contribution of NAR [25,86]. Similar findings in forest trees indicate that variation in NAR is the primary determinant of RGR across light environments and is strongly associated with leaf nitrogen content and photosynthetic rate [46].
In the Yahuarcocha crop, both NAR and LAR values gradually declined from the beginning of the experiment to the final evaluation at 210 days (Figure 8a). The decrease in NAR values is likely associated with the redistribution of resources toward other metabolic activities related to flowering and fruiting, and to a lesser extent, the effects of shading. Meanwhile, the decline in LAR (Figure 8b) may be attributed to a gradual reduction in the ratio of photosynthetic surface area to total plant biomass, resulting in a corresponding decrease in photosynthetic activity [87,88].
In Totora plants from Imbacocha Lake, as in the previous case, NAR values gradually decline as a result of resource redistribution toward other metabolic activities. However, LAR remains relatively constant (Figure 8b). A likely explanation for this phenomenon is a compensatory strategy, in which the mass of photosynthetically active organs is reduced relative to the plant’s active photosynthetic surface area. This may be achieved through increased production of aerenchymatous parenchyma tissue within the stems, a process mediated by ethylene [89,90,91].
The Totora crops from Yahuarcocha and Imbacocha lakes exhibit very similar Harvest Index (HI) values, which may be attributed to the fact that both populations belong to the same species. Additionally, it can be speculated that the Harvest Index is a crop trait that did not respond to the differing nutrient conditions of the lakes (trophic status) or to other environmental factors, suggesting that it may be considered a highly stable attribute [92,93,94].
Finally, Yield (Y) displays the typical sigmoidal curve of vegetative growth, as expected, for Totora crops from both Yahuarcocha and Imbacocha lakes. However, in absolute terms, the yield in Yahuarcocha was 227% higher than that of the Imbacocha crop. This difference can be largely explained by the greater availability of nutrients in Yahuarcocha, a lake classified as hypereutrophic, compared to the eutrophic conditions of Imbacocha [95,96]. Additionally, Totora plants from these two lakes have undergone adaptation processes to the specific biological, ecological, and cultural conditions of their environments, reflecting distinct physiological growth mechanisms and dynamics [97,98].
5. Conclusions
In Totora populations from Yahuarcocha and Imbacocha, photosynthetic efficiency—defined as the ratio between NAR and RGR—is a key determinant of vegetative growth. The conical structure of the photosynthetic apparatus enhances the contribution of NAR to overall growth, in contrast to what is typically observed in most broad-leaved species.
The harvesting time of plant material by local communities at Imbacocha Lake coincides with the period of maximum biomass production of Totora. This reflects the application of ancestral knowledge to the productive cycles of plant species essential for human subsistence and underscores the importance of interdisciplinary approaches in scientific research. Furthermore, the information generated on the mechanisms that promote higher Totora biomass production in Yahuarcocha can be applied to the development of new cultivation areas and the design of conservation programs aimed at ensuring the long-term availability of this natural resource for both cultivators and artisans.
Maximizing the harvest index and yield—provided it does not compromise the species’ stability—through a technically informed extraction process that takes into account all the parameters and indices discussed in this study, should be a primary objective in the management and utilization of these plants.
The present analysis of vegetative growth of Totora in Yahuarcocha and Imbacocha lakes, located in Imbabura province, northern Ecuadorian Andes, combined with the incorporation of sustainability indicators, will enable this natural resource to continue contributing ecologically, economically, and culturally to the indigenous and mestizo populations that depend on it. Furthermore, when appropriately communicated to local stakeholders, this information will facilitate endogenous development processes, empowering community members to become active agents of their own transformation, enhancing their competitiveness in artisanal activities, and fostering greater environmental awareness.
Author Contributions
Conceptualization: G.P.-G.; methodology, G.P.-G. and L.V.-H.; software, G.P.-G.; validation, G.P.-G. and L.V.-H.; formal analysis, G.P.-G.; research, G.P.-G., L.V.-H., G.Y.-J., and P.A.-M.; data curation, G.P.-G.; writing—preparation of the original draft, G.P.-G., and L.V.-H.; writing—review and editing, G.P.-G., L.V.-H., G.Y.-J., and P.A.-M.; visualization, L.V.-H.; supervision, L.V.-H., G.Y.-J., and P.A.-M. All authors have read and agreed to the published version of the manuscript.
Funding
The publication fee for this study will be funded by the Universidad Técnica del Norte, through RESOLUTION No. UTN-CI-2024-178-R, which approves the research project titled: “Analysis of Vegetative Growth: Dynamics and Physiological Mechanisms of Totora Crops in Imbabura, Ecuador”.
Data Availability Statement
The data presented in this study are openly available in Office 365 Onedrive cloud,.
Acknowledgments
The authors acknowledge the Universidad Técnica del Norte for the facilities provided to realize this study.
Conflicts of Interest
The authors declare no conflicts of interest.
References
- Simbaña, A. La totora y el desarrollo sustentable del Imbakucha, Lago San Pablo, se fortalece [Totora and the Sustainable Development of Imbakucha, Lake San Pablo, is Strengthened] [in Spanish]. AXIOMA 2015, 1, 6. https://axioma.pucesi.edu.ec/index.php/axioma/article/view/17.
- Paredes, R.; Hopkins, A.L. Dynamism in Traditional Ecological Knowledge: Persistence and Change in the Use of Totora (Schoenoplectus californicus) for Subsistence in Huanchaco, Peru. Ethnobiol. Lett. 2018, 9(2). [Google Scholar] [CrossRef]
- Blanco, J.; Alvarado, R.; Flores, J.; Zurita, F. Suitability of Totora (Schoenoplectus californicus (C.A. Mey.) Soják) for its use in constructed wetlands in areas polluted with heavy metals. Sustainability 2019, 11(1), 19. [Google Scholar] [CrossRef]
- Hidalgo-Cordero, J.F.; Němec, M.; Castro, P.H.; Hájková, K.; Castro, A.O.; Hýsek, Š. Macromolecular composition of Totora (Schoenoplectus californicus C.A. Mey, Soják) stem and its correlation with stem mechanical properties. J. Nat. Fibers 2023, 20(2). [Google Scholar] [CrossRef]
- De Rito, M.; Borrelli, N.; Natal, M.; Fernández Honaine, M. Schoenoplectus californicus (Cyperaceae) amorphous silica contribution to the silicon cycle in Pampean shallow lakes: an analysis of spatio-temporal variation and silicon–lignin relations. Aust. J. Bot. 2024, 72, BT23084. [Google Scholar] [CrossRef]
- Villar, D.A.; Long, P.R.; Gutierrez Tito, E.R.; Moreno Terrazas, E.G.; Gosler, A.G. Trends in the area of suitable breeding habitat for the Endangered Lake Titicaca Grebe Rollandia microptera, 2001–2020. Bird Conserv. Int. 2023, 33, e52. [Google Scholar] [CrossRef]
- Sabaj, V.; Conde, D.; Rodríguez-Gallego, L.; Kandus, P. Postharvest growth dynamic of Schoenoplectus californicus along fluvio-estuarine and flooding gradients. Wetl. Ecol. Manag. 2018, 26, 125–138. [Google Scholar] [CrossRef]
- Rigotti, J.A.; Paqualini, J.P.; Rodrigues, L.R. Root growth and nutrient removal of Typha domingensis and Schoenoplectus californicus over the period of plant establishment in a constructed floating wetland. Environ. Sci. Pollut. Res. 2021, 28, 8927–8935. [Google Scholar] [CrossRef]
- Heiser, C. The Totora (Scirpus californicus) in Ecuador and Peru. Econ. Bot. 1978, 32, 222–236. [Google Scholar] [CrossRef]
- Terneus Jácome, E. Vegetación acuática y estado trófico de las lagunas andinas de San Pablo y Yahuarcocha, provincia de Imbabura, Ecuador [Aquatic Vegetation and Trophic Status of the Andean Lagoons of San Pablo and Yahuarcocha, Imbabura Province, Ecuador] [in Spanish]. Rev. Ecuat. Med. Cienc. Biol. 2017, 35, 121–123. [Google Scholar]
- Hidalgo-Cordero, J.F.; García-Navarro, J. Totora (Schoenoplectus californicus (C.A. Mey.) Soják) and its potential as a construction material. Ind. Crops Prod. 2018, 112, 467–480. [Google Scholar] [CrossRef]
- Hester, M.W.; Willis, J.M.; Sloey, T.M. Field assessment of environmental factors constraining the development and expansion of Schoenoplectus californicus marsh at a California tidal freshwater restoration site. Wetl. Ecol. Manag. 2016, 24, 33–44. [Google Scholar] [CrossRef]
- Liu, Y.; Li, J.; Liu, Y.; He, L.; Yang, S.; Gong, H.; Xu, R.; Yao, X.; Ge, G. Interactive Effects of Flooding Duration and Sediment Texture on the Growth and Adaptation of Three Plant Species in the Poyang Lake Wetland. Biology (Basel) 2023, 12(7), 944. [Google Scholar] [CrossRef]
- Hidalgo Cordero, J.F.; García Navarro, J. Review on the traditional uses and potential of Totora (Schoenoplectus californicus) as construction material. IOP Conf. Ser. Mater. Sci. Eng. 2017, 245(2), 022068. [Google Scholar] [CrossRef]
- Arévalo, A.; Cadena, M.; Ontaneda, D. Diversidad fitoplanctónica y estado trófico actual de un lago de alta montaña en la provincia de Imbabura, Ecuador. ACI Av. Cienc. Ing. 2025, 17(1). [Google Scholar] [CrossRef]
- Arce, W.A.; Achá, D. Allometric determinations in the early development of Schoenoplectus californicus to monitor nutrient uptake in constructed wetlands. Ecohydrol. Hydrobiol. 2025, 25(1), 34–41. [Google Scholar] [CrossRef]
- Macía, M.J.; Balslev, H. Use and management of Totora (Schoenoplectus californicus, Cyperaceae) in Ecuador. Econ. Bot. 2000, 54(1), 82–89. [Google Scholar] [CrossRef]
- Banack, S.A.; Rondón, X.J.; Diaz-Huamanchumo, W. COVER ARTICLE: Indigenous Cultivation and Conservation of Totora (Schoenoplectus californicus, Cyperaceae) in Peru. Econ. Bot. 2004, 58(1), 11–20. [Google Scholar] [CrossRef]
- Galindo Acuña, L.A.; Córdoba Sánchez, M.P. Bioindication and phytostabilization of potentially toxic elements by Schoenoplectus californicus in a Ramsar urban wetland, Colombia. Int. J. Phytoremediation 2025, ahead of print, 1–9. [CrossRef]
- Murray-Gulde, C.L.; Huddleston, G.M.; Garber, K.V.; et al. Contributions of Schoenoplectus californicus in a constructed wetland system receiving copper-contaminated wastewater. Water Air Soil Pollut. 2005, 163, 355–378. [Google Scholar] [CrossRef]
- Poorter, H. Plant growth analysis: towards a synthesis of the classical and the functional approach. Physiol. Plant. 1989, 75(2), 237–244. [Google Scholar] [CrossRef]
- Gardner, F.P.; Pearce, R.B.; Mitchell, R.L. Physiology of Crop Plants, 2nd ed.; Scientific Publishers: Jodhpur, India, 2017; 327 pp.
- Hunt, R.; Causton, D.R.; Shipley, B.; Askew, A.P. A modern tool for classical plant growth analysis. Ann. Bot. 2002, 90(4), 485–488. [Google Scholar] [CrossRef]
- Tessmer, O.L.; et al. Functional approach to high throughput plant growth analysis. BMC Syst. Biol. 2013, 7 (Suppl. 6), S17. [Google Scholar] [CrossRef]
- Di Benedetto, A.; Tognetti, J. Técnicas de análisis de crecimiento de plantas: su aplicación a cultivos intensivos. RIA. Rev. Investig. Agropecu. https://www.redalyc.org/articulo.oa?id=86449712008. 2016, 42(3), 258–282. [Google Scholar]
- Neubauer, M.E.; Plaza de los Reyes, C.; Pozo, G.; Villamar, C.A.; Vidal, G. Growth and nutrient uptake by Schoenoplectus californicus in a constructed wetland fed with swine slurry. J. Soil Sci. Plant Nutr. 2012, 12(3), 421–430. [Google Scholar] [CrossRef]
- Hýsková, P.; Gaff, M.; Hidalgo-Cordero, J.F.; Hýsek, Š. Composite materials from totora (Schoenoplectus californicus C.A. Mey, Soják): Is it worth it? Compos. Struct. 2020, 232, 111572. [Google Scholar] [CrossRef]
- Pugnaire, F.; Valladares, F., Eds. Functional Plant Ecology, 2nd ed.; CRC Press: Boca Raton, FL, USA, 2007. [CrossRef]
- Villar, R.; Ruiz-Robleto, J.; Quero, J.; Poorter, H.; Valladares, F.; Marañón, T. Tasas de crecimiento en especies leñosas: aspectos funcionales e implicaciones ecológicas [Growth Rates in Woody Species: Functional Aspects and Ecological Implications] [in Spanish]. In Ecología del bosque mediterráneo en un mundo cambiante, 2nd ed.; Valladares, F., Ed.; Ministerio de Medio Ambiente: Madrid, Spain, 2008; pp. 193–230.
- Evans, G.C. The Quantitative Analysis of Plant Growth; Blackwell Scientific Publications: Oxford, UK, 1972; xxvi + 734 pp.
- Lambers, H.; Poorter, H. Inherent variation in growth rate between higher plants: A search for physiological causes and ecological consequences. In Advances in Ecological Research; Begon, M., Fitter, A.H., Eds.; Academic Press: London, U.K., 1992; Volume 23, pp. 187–261. [Google Scholar] [CrossRef]
- Poorter, H.; Garnier, E. Plant growth analysis: an evaluation of experimental design and computational methods. J. Exp. Bot. 1996, 47(9), 1343–1351. [Google Scholar] [CrossRef]
- Grime, J.P.; Hunt, R. Relative Growth-Rate: Its Range and Adaptive Significance in a Local Flora. J. Ecol. 1975, 63(2), 393–422. [Google Scholar] [CrossRef]
- Poorter, H.; Remkes, C. Leaf area ratio and net assimilation rate of 24 wild species differing in relative growth rate. Oecologia 1990, 83(4), 553–559. [Google Scholar] [CrossRef]
- Puntier, J.G.; Gomez, I.A. Análisis del crecimiento vegetativo del amancay (Alstroemeria aurantiaca D. Don) en dos poblaciones naturales [Vegetative Growth Analysis of Amancay (Alstroemeria aurantiaca D. Don) in Two Natural Populations] [in Spanish]. Rev. Chil. Hist. Nat. 1988, 61, 177–185. [Google Scholar]
- Poorter, H.; Niklas, K.J.; Reich, P.B.; Oleksyn, J.; Poot, P.; Mommer, L. Biomass allocation to leaves, stems and roots: meta-analyses of interspecific variation and environmental control. New Phytol. 2012, 193(1), 30–50. [Google Scholar] [CrossRef] [PubMed]
- Hoffmann, W.A.; Poorter, H. Avoiding Bias in Calculations of Relative Growth Rate. Ann. Bot. 2002, 90(1), 37–42. [Google Scholar] [CrossRef] [PubMed]
- Poorter, H.; De Jong, R. A comparison of specific leaf area, chemical composition and leaf construction costs of field plants from 15 habitats differing in productivity. New Phytol. 1999, 143(1), 163–176. [Google Scholar] [CrossRef]
- Santos Castellanos, M.; Segura Abril, M.; Ñústez López, C.E. Análisis de crecimiento y relación fuente-demanda de cuatro variedades de papa (Solanum tuberosum L.) en el municipio de Zipaquirá (Cundinamarca, Colombia). Rev. Fac. Nac. Agron. Medellín 2010, 63(1), 5253–5266. [Google Scholar]
- Shipley, B. Net Assimilation Rate, Specific Leaf Area and Leaf Mass Ratio: Which Is Most Closely Correlated with Relative Growth Rate? A Meta-Analysis. Funct. Ecol. 2006, 20(4), 565–574. [Google Scholar] [CrossRef]
- Pabón, G.; Rodés, R.; Pérez, L.; Vásquez, L.; Ortega, E. Relaciones morfológicas en Schoenoplectus californicus (Cyperaceae) en lagos alto-andinos de Ecuador [Morphological Relationships in Schoenoplectus californicus (Cyperaceae) in High-Andean Lakes of Ecuador] [in Spanish]. Rev. Jardín Botánico Nac. 2019, 40, 109–119. https://www.jstor.org/stable/26937052.
- Hidalgo-Cordero, J.F.; Němec, M.; Castro, P.H.; Hájková, K.; Castro, A.O.; Hýsek, Š. Composición macromolecular del tallo de Totora (Schoenoplectus californicus C.A. Mey, Soják) y su correlación con las propiedades mecánicas del tallo. Rev. Fibras Nat. 2023, 20(2). [Google Scholar] [CrossRef]
- Hunt, R. Basic Growth Analysis. Plant Growth Analysis for Beginners; Unwin Hyman: London, U.K., 1990. [Google Scholar] [CrossRef]
- Shipley, B. Trade-offs between net assimilation rate and specific leaf area in determining relative growth rate: relationship with daily irradiance. Funct. Ecol. 2002, 16(5), 682–689. [Google Scholar] [CrossRef]
- Rees, M.; Osborne, C.P.; Woodward, F.I.; Hulme, S.P.; Turnbull, L.A.; Taylor, S.H. Partitioning the components of relative growth rate: how important is plant size variation? Am. Nat. 2010, 176(6), E152–E161. [Google Scholar] [CrossRef]
- Li, X.; Schmid, B.; Wang, F.; Paine, C.E.T. Net assimilation rate determines the growth rates of 14 species of subtropical forest trees. PLoS ONE 2016, 11(3), e0150644. [Google Scholar] [CrossRef]
- Fu, H.; Yuan, G.; Cao, T.; Ni, L.; Li, W.; Zhu, G. Relationships between relative growth rate and its components across 11 submersed macrophytes. J. Freshw. Ecol. 2012, 27(4), 471–480. [Google Scholar] [CrossRef]
- Medek, D.E.; Ball, M.C.; Schortemeyer, M. Relative contributions of leaf area ratio and net assimilation rate to change in growth rate depend on growth temperature: comparative analysis of subantarctic and alpine grasses. New Phytol. 2007, 175(3), 612–623. [Google Scholar] [CrossRef]
- Wright, I.J.; Westoby, M. Cross-species relationships between seedling relative growth rate, nitrogen productivity and root vs leaf function in 28 Australian woody species. Funct. Ecol. 2000, 14(1), 97–107. [Google Scholar] [CrossRef]
- López, D.; Sepúlveda, M.; Vidal, G. Phragmites australis and Schoenoplectus californicus in constructed wetlands: Development and nutrient uptake. J. Soil Sci. Plant Nutr. 2016, 16(3), 763–777. http://www.scielo.cl/scielo.php?script=sci_arttext&pid=S0718-95162016000300015.
- Rigotti, J.A.; Paqualini, J.P.; Rodrigues, L.R. Root Growth and Nutrient Removal of Typha domingensis and Schoenoplectus californicus over the Period of Plant Establishment in a Constructed Floating Wetland. Environ. Sci. Pollut. Res. 2021, 28, 8927–8935. [Google Scholar] [CrossRef]
- Rejmankova, E. The role of macrophytes in wetland ecosystems. J. Ecol. Environ. 2011, 34, 333–345. [Google Scholar] [CrossRef]
- Chotikarn, P.; Pramneechote, P.; Sinutok, S. Photosynthetic Responses of Freshwater Macrophytes to the Daily Light Cycle in Songkhla Lagoon. Plants 2022, 11, 2806. [Google Scholar] [CrossRef] [PubMed]
- Mahmud, K.; Makaju, S.; Ibrahim, R.; Missaoui, A. Current Progress in Nitrogen Fixing Plants and Microbiome Research. Plants 2020, 9, 97. [Google Scholar] [CrossRef] [PubMed]
- Vymazal, J. Constructed Wetlands for Wastewater Treatment. Water 2010, 2, 530–549. [Google Scholar] [CrossRef]
- Sabaj, V. Extracción de “juncos” de Schoenoplectus californicus en el Área Protegida Humedales de Santa Lucía (Uruguay): contexto ecológico, socio–espacial y perspectivas de manejo sustentable [Harvesting of Schoenoplectus californicus Reeds in the Santa Lucía Wetlands Protected Area (Uruguay): Ecological, Socio-Spatial Context and Sustainable Management Perspectives] [in Spanish]. Master’s Thesis, Universidad de la República, Montevideo, Uruguay, 2011. Available online: https://www.colibri.udelar.edu.uy/jspui/bitstream/20.500.12008/3910/1/uy24-15287.pdf (accessed on 4 August 2025).
- Yang, Z.; Wang, Q.; Zhang, J.; Xie, H.; Feng, S. Effect of Plant Harvesting on the Performance of Constructed Wetlands during Summer. Water 2016, 8, 24. [Google Scholar] [CrossRef]
- Silveira, T.C.L.; Rodrigues, G.G.; Souza, G.P.C. de; Würdig, N.L. Effects of cutting disturbance in Schoenoplectus californicus (C.A. Mey.) Soják on the benthic macroinvertebrates. Acta Sci. Biol. Sci. 2011, 33, 31–39. [Google Scholar] [CrossRef]
- Verhofstad, M.J.J.M.; Poelen, M.D.M.; van Kempen, M.M.L.; Bakker, E.S.; Smolders, A.J.P. Finding the harvesting frequency to maximize nutrient removal in a constructed wetland dominated by submerged aquatic plants. Ecol. Eng. 2017, 106, 423–430. [Google Scholar] [CrossRef]
- Hong, Z.; Ding, S.; Zhao, Q.; Qiu, P.; Chang, J.; Peng, L.; Wang, S.; Hong, Y.; Liu, G.-J. Plant trait–environment trends and their conservation implications for riparian wetlands in the Yellow River. Sci. Total Environ. 2021, 767, 144867. [Google Scholar] [CrossRef]
- Maksimov, A.; Apaseev, V.; Maksimov, E.; Alekseev, N.; Pushkarenko, N.; Maksimov, N. Towards a mathematical model of plant growth. In Proceedings of the IOP Conference Series: Earth and Environmental Science; IOP Publishing: 2021; Volume 935, 012031. [CrossRef]
- Singh, P.; Singh, G.; Singh, A.; et al. Macrophytes for Utilization in Constructed Wetland as Efficient Species for Phytoremediation of Emerging Contaminants from Wastewater. Wetlands 2024, 44, 22. [Google Scholar] [CrossRef]
- Mahmud, K.; Hossain, T.; Haque Mou, T.; Ali, A.; Islam, M. Effect of Nitrogen On Growth and Yield of Chili (Capsicum annuum L.) in Roof Top Garden. Turk. J. Agric. Food Sci. Technol. 2020, 8, 246–251. [Google Scholar] [CrossRef]
- Buelna-Tarín, S.; Romero-Félix, C.S.; Bojórquez-Ramos, C.; Lugo-García, G.A.; Sánchez-Soto, B.H. Bioestimulantes y solución Steiner en crecimiento y producción de Capsicum annuum L. [Biostimulants and Steiner solution in growth and production of Capsicum annuum L.] [in Spanish]. Rev. Mex. Cienc. Agríc. 2024, 15, e3255. [Google Scholar] [CrossRef]
- Soto-Bravo, F.; Monge-Palma, J.I. Comportamiento morfofisiológico y productivo de chile dulce hidropónico en invernadero con diferentes estrategias de manejo del fertirriego [Morphophysiological and productive performance of hydroponic sweet pepper in greenhouse with different fertigation management strategies] [in Spanish]. Agron. Costarric. 2023, 47, 37–57. [Google Scholar] [CrossRef]
- Kalaitzidis, A.; Kadoglidou, K.; Mylonas, I.; Ghoghoberidze, S.; Ninou, E.; Katsantonis, D. Investigating the Impact of Tillering on Yield and Yield-Related Traits in European Rice Cultivars. Agriculture 2025, 15, 616. [Google Scholar] [CrossRef]
- Beltramo, D.G.; Martínez Racines, C.P.; Motta, F.O., Eds. Producción ecoeficiente del arroz en América Latina [Eco-Efficient Rice Production in Latin America] [in Spanish]; Centro Internacional de Agricultura Tropical (CIAT): Cali, Colombia, 2010; CIAT Publicación No. 365, 487p.
- Ntanos, D.A.; Koutroubas, S.D. Dry matter and N accumulation and translocation for Indica and Japonica rice under Mediterranean conditions. Field Crops Res. 2002, 74, 93–101. [Google Scholar] [CrossRef]
- Yamada, T.; Okuda, T.; Abdullah, M.; Awang, M.; Furukawa, A. The leaf development process and its significance for reducing self-shading of a tropical pioneer tree species. Oecologia 2000, 125, 476–482. [Google Scholar] [CrossRef]
- Aoyagi, H.; Nakabayashi, M.; Yamada, T. Newly found leaf arrangement to reduce self-shading within a crown in Japanese monoaxial tree species. J. Plant Res. 2024, 137, 203–213. [Google Scholar] [CrossRef] [PubMed]
- Pratolongo, P.; Kandus, P.; Brinson, M.M. Net aboveground primary production and biomass dynamics of Schoenoplectus californicus (Cyperaceae) marshes growing under different hydrological conditions. Darwiniana 2008, 46(2), 258–269. [Google Scholar]
- Hidalgo-Cordero, J.F.; Aza-Medina, L.C. Analysis of the thermal performance of elements made with totora using different production processes. J. Build. Eng. 2023, 65, 105777. [Google Scholar] [CrossRef]
- Zhang, P.; Hefting, M.M.; Soons, M.B.; Kowalchuk, G.A.; Rees, M.; Hector, A.; Turnbull, L.A.; Zhou, X.; Guo, Z.; Chu, C.; Du, G.; Hautier, Y. Fast and furious: Early differences in growth rate drive short term plant dominance and exclusion under eutrophication. Ecol. Evol. 2020, 10(18), 10116–10129. [Google Scholar] [CrossRef]
- Coley, P.D. Effects of plant growth rate and leaf lifetime on the amount and type of anti-herbivore defense. Oecologia 1988, 74, 531–536. [Google Scholar] [CrossRef]
- Kitajima, K.; Fenner, M. Ecology of seedling regeneration. In Seeds: The Ecology of Regeneration in Plant Communities, 2nd ed.; Fenner, M., Ed.; CAB International: Wallingford, UK, 2000; pp. 331–359. [CrossRef]
- Gaspar, T.; Franck, T.; Bisbis, B.; Kevers, C.; Jouve, L.; Hausman, J.F.; Dommes, J. Concepts in plant stress physiology. Application to plant tissue cultures. Plant Growth Regul. 2002, 37(3), 263–285. [Google Scholar] [CrossRef]
- Almeida-Cortez, J.S.; Shipley, B.; Arnason, J.T. Do plant species with high relative growth rates have poorer chemical defences? Funct. Ecol. 1999, 13(6), 819–827. [Google Scholar] [CrossRef]
- Chen, Q.; He, A.; Wang, W.; Peng, S.; Huang, J.; Cui, K.; Nie, L. Comparisons of regeneration rate and yields performance between inbred and hybrid rice cultivars in a direct seeding rice-ratoon rice system in central China. Field Crops Res. 2018, 223, 164–170. [Google Scholar] [CrossRef]
- Sloey, T.M.; Hester, M.W. Impact of nitrogen and importance of silicon on mechanical stem strength in Schoenoplectus acutus and S. californicus: Applications for restoration. Wetl. Ecol. Manag. 2018, 26, 459–474. [Google Scholar] [CrossRef]
- Gaudet, C.L.; Keddy, P.A. Competitive performance and species distribution in shoreline plant communities: A comparative approach. Ecology 1995, 76(1), 280–291. https://drpaulkeddy.com/wp-content/uploads/2019/12/gaudet-and-keddy-1995-ecology-competitive-performance-and-species-distribution-in-shoreline-plant-communities.pdf.
- Grime, J.P. Plant Strategies, Vegetation Processes, and Ecosystem Properties, 2nd ed.; Wiley: Chichester, UK, 2006. [Google Scholar]
- Ruiz-Robleto, J.; Villar, R. Relative growth rate and biomass allocation in ten woody species with different leaf longevity using phylogenetic independent contrasts (PICs). Plant Biol. 2005, 7(5), 484–494. [Google Scholar] [CrossRef] [PubMed]
- Poorter, H.; van der Werf, A. Is inherent variation in RGR determined by LAR at low irradiance and by NAR at high irradiance? A review of herbaceous species. In Inherent Variation in Plant Growth. Physiological Mechanisms and Ecological Consequences; Lambers, H., Poorter, H., van Vuuren, M.M.I., Eds.; Backhuys Publishers: Leiden, The Netherlands, 1998; pp. 309–336. [Google Scholar]
- Westoby, M.; Falster, D.S.; Moles, A.T.; Vesk, P.A.; Wright, I.J. Plant ecological strategies: Some leading dimensions of variation between species. Annu. Rev. Ecol. Syst. 2002, 33, 125–159. [Google Scholar] [CrossRef]
- Skovsholt, L.J.; Matheson, F.; Riis, T.; Hawes, I. Trait-specific groups of aquatic macrophytes respond differently to eutrophication of unshaded lowland streams. Sci. Total Environ. 2024, 954, 176724. [Google Scholar] [CrossRef]
- Osone, Y.; Ishida, A.; Tateno, M. The correlation between relative growth rate and specific leaf area requires associations of specific leaf area with root nitrogen absorption rate. New Phytol. 2008, 179(2), 417–427. [Google Scholar] [CrossRef] [PubMed]
- Ruiz-Checa, R.; Pérez-Jordán, H.; García-Gómez, H.; Prieto-Benítez, S.; Gónzalez-Fernández, I.; Alonso, R. Foliar nitrogen uptake in broadleaf evergreen Mediterranean forests: Fertilisation experiment with labelled nitrogen. Sci. Total Environ. 2024, 926, 171865. [Google Scholar] [CrossRef] [PubMed]
- Lambers, H.; Chapin, F.S.; Pons, T.L. Plant Physiological Ecology, 2nd ed.; Springer: New York, NY, USA, 2008. [Google Scholar] [CrossRef]
- Wang, X.; Wen, H.; Suprun, A.; Zhu, H. Ethylene Signaling in Regulating Plant Growth, Development, and Stress Responses. Plants 2025, 14(3), 309. [Google Scholar] [CrossRef]
- Visser, E.J.; Voesenek, L.A. Aclimatación a la inundación del suelo: detección y transducción de señales. In Root Physiology: From Gene to Function; Lambers, H., Colmer, T.D., Eds.; Springer: Dordrecht, The Netherlands, 2005; pp. 375–392. [Google Scholar] [CrossRef]
- Yang, T.; Zhao, J.; Fu, Q. Quantitative Relationship of Plant Height and Leaf Area Index of Spring Maize under Different Water and Nitrogen Treatments Based on Effective Accumulated Temperature. Agronomy 2024, 14(5), 1018. [Google Scholar] [CrossRef]
- Foulkes, M.J.; Sylvester-Bradley, R.; Weightman, R.; Snape, J.W. Identifying physiological traits associated with improved drought resistance in winter wheat. Field Crops Res. 2007, 103(1), 11–24. [Google Scholar] [CrossRef]
- Gifford, R.M.; Evans, L.T. Photosynthesis, carbon partitioning, and yield. Annu. Rev. Plant Physiol. 1981, 32, 485–509. [Google Scholar] [CrossRef]
- Diez, J.; Orellana, F.; Searles, P.; et al. Supplemental irrigation during the critical period for yield ensures higher radiation capture and use efficiency, water use efficiency, and grain yield in chia. Preprint 2023, Research Square. [CrossRef]
- Golubkov, M.; Golubkov, S. The role of total phosphorus in eutrophication of freshwater and brackish-water parts of the Neva River estuary (Baltic Sea). Mar. Environ. Res. 2025, 209, 107232. [Google Scholar] [CrossRef]
- Correll, D.L. The role of phosphorus in the eutrophication of receiving waters: A review. J. Environ. Qual. 1998, 27(2), 261–266. [Google Scholar] [CrossRef]
- Reynolds, J.F.; Stafford Smith, D.M.; Lambin, E.F.; et al. Global Desertification: Building a Science for Dryland Development. Science 2007, 316, 847–851. [Google Scholar] [CrossRef]
- Chapin, F.S., III; Zavaleta, E.S.; Eviner, V.T.; et al. Consecuencias del cambio de la biodiversidad. Nature 2000, 405, 234–242. [Google Scholar] [CrossRef]
Figure 1.
Lakes of Imbabura Province, Ecuador. a) Lake Yahuarcocha (2,192 m a.s.l.), Ibarra City, Ecuador. b) Lake Imbacocha (2,650 m a.s.l.), Otavalo City, Ecuador.
Figure 1.
Lakes of Imbabura Province, Ecuador. a) Lake Yahuarcocha (2,192 m a.s.l.), Ibarra City, Ecuador. b) Lake Imbacocha (2,650 m a.s.l.), Otavalo City, Ecuador.
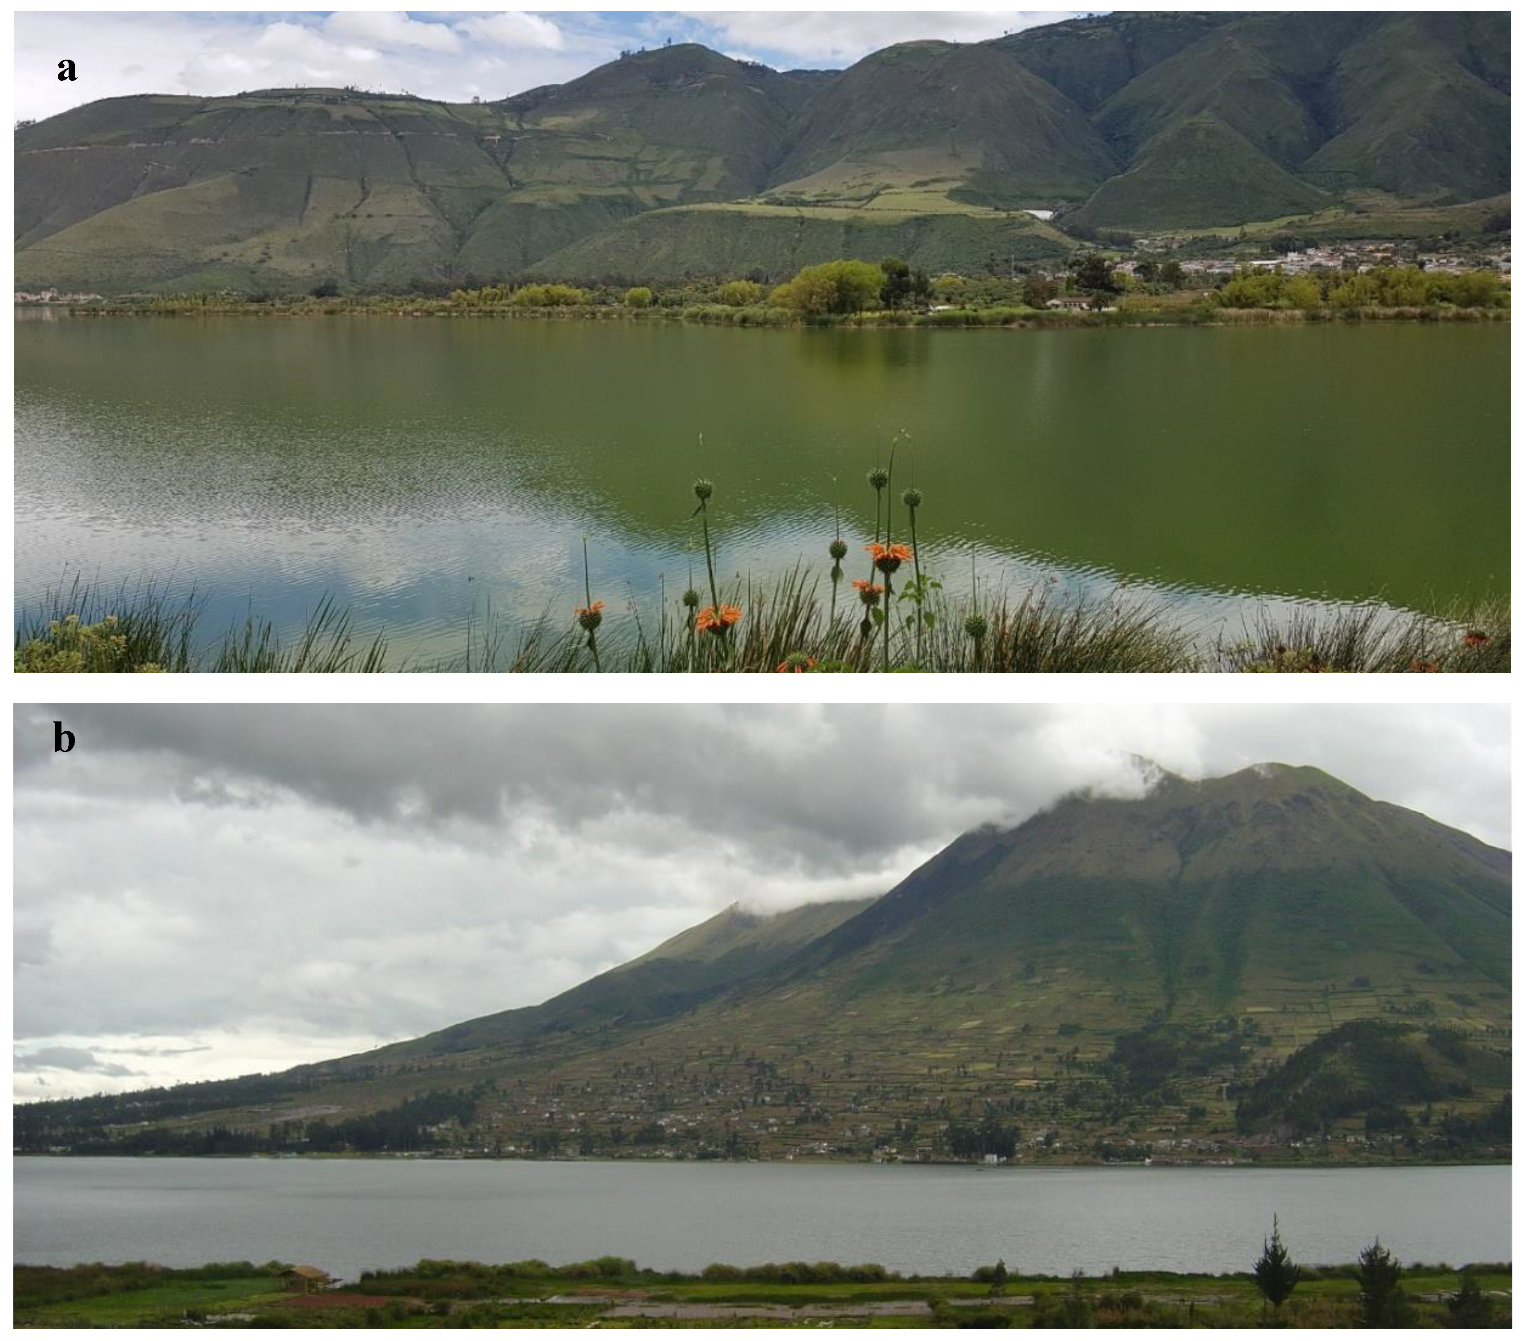
Figure 2.
Left: Totora grower and artisan from the parish of San Miguel de Yahuarcocha. Right: Handicrafts made from woven Totora stems.
Figure 2.
Left: Totora grower and artisan from the parish of San Miguel de Yahuarcocha. Right: Handicrafts made from woven Totora stems.
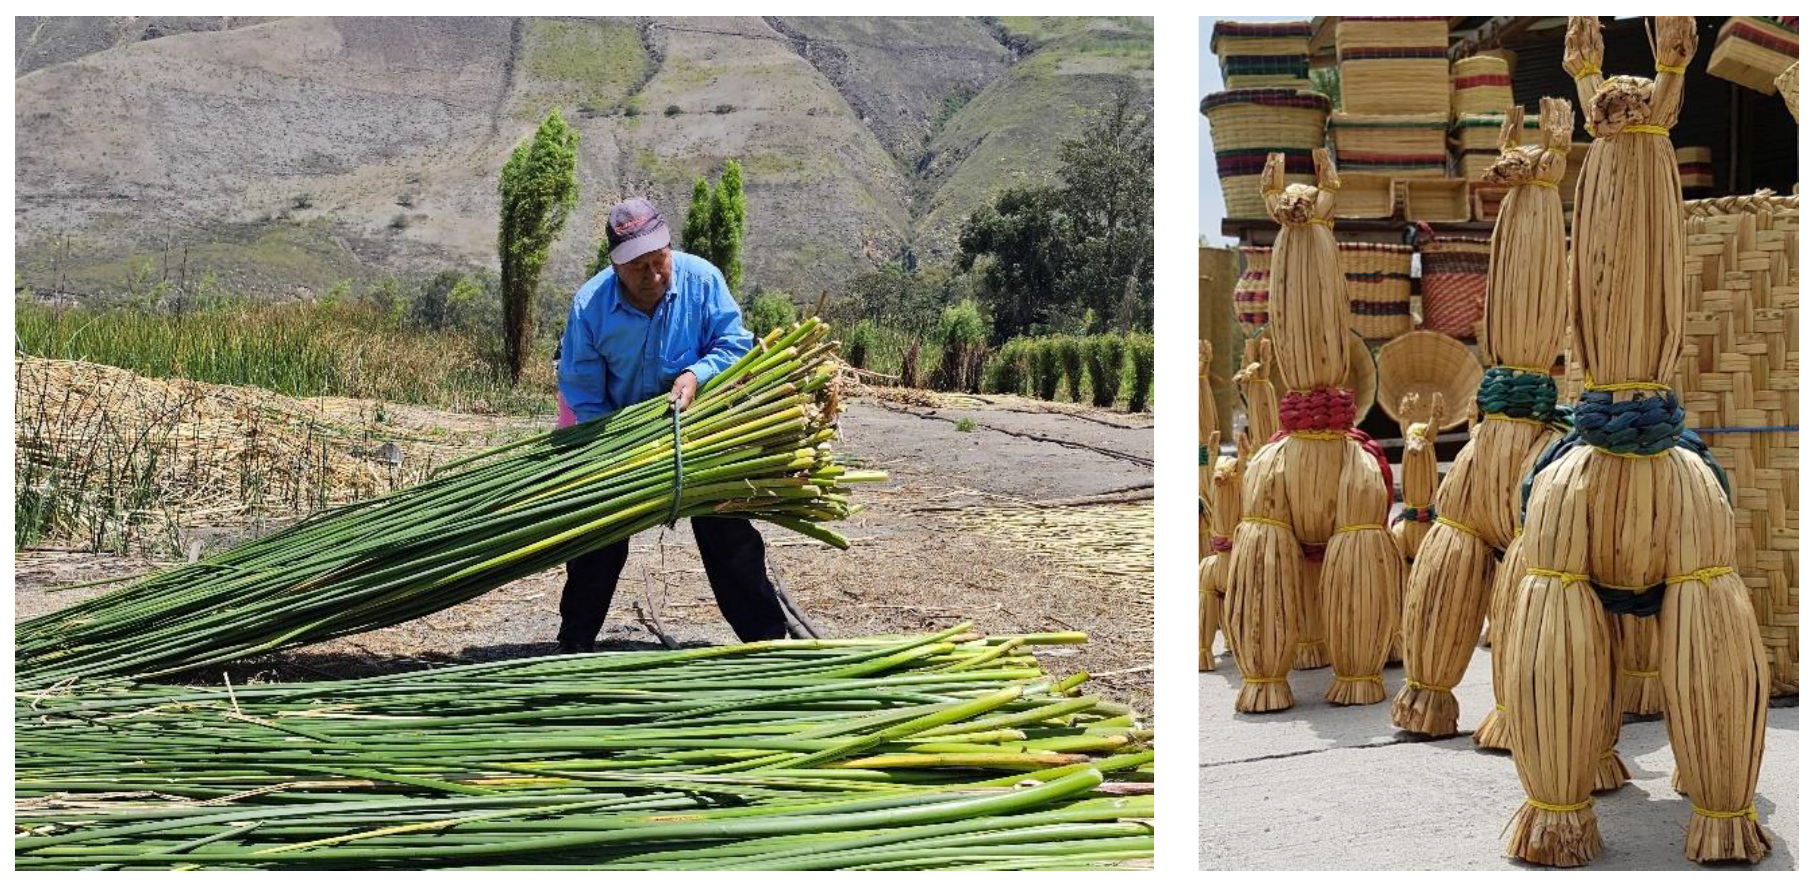
Figure 3.
Virtual projection of the selected area measuring 14 x 2 m (28 m²), with subplots of 2 x 2 m (4 m²) for evaluations every 30 days. The 1 m² area represents the size of the experimental unit (four replicates). A) Selected area in Lake Yahuarcocha (Yah 1). B) Selected area in Lake Imbacocha (Imb 1).
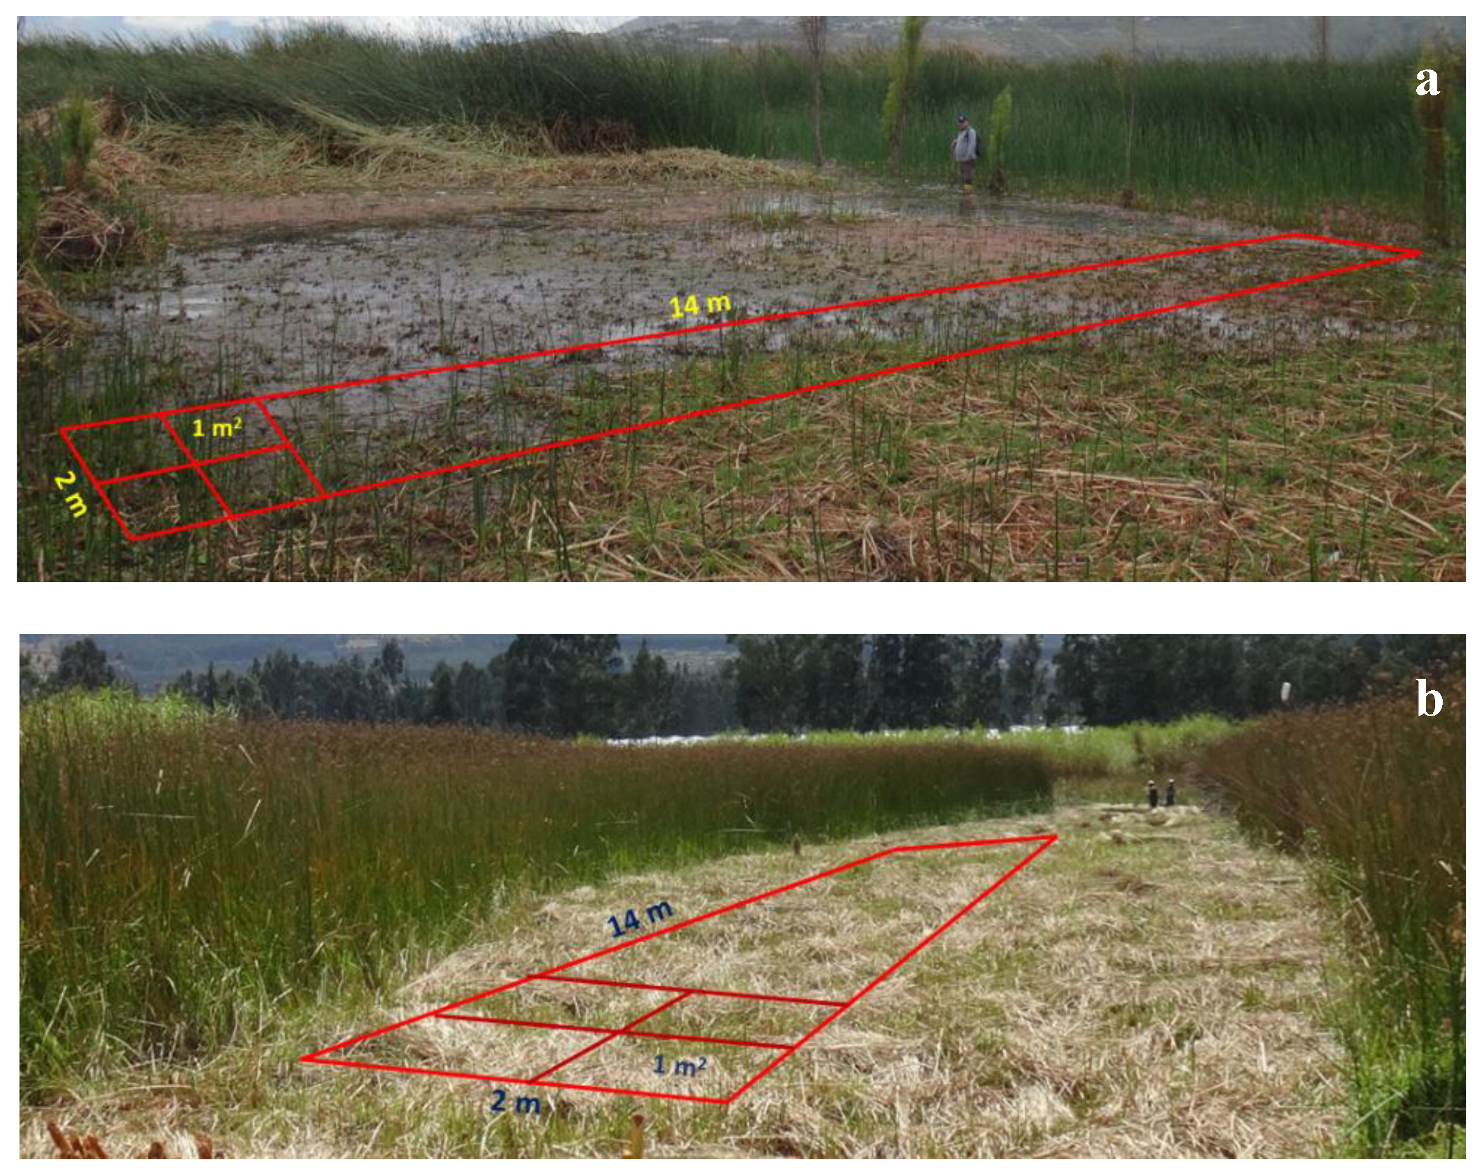
Figure 4.
Vegetative growth curves of Totora (Schoenoplectus californicus) over a 210-day period, based on: a) photosynthetic stem area; b) stem dry mass. Vertical bars represent standard deviations (n = 10). CExp = exponential growth, LG = linear growth, D = deceleration, S = senescence. * indicates the interval of greatest growth.
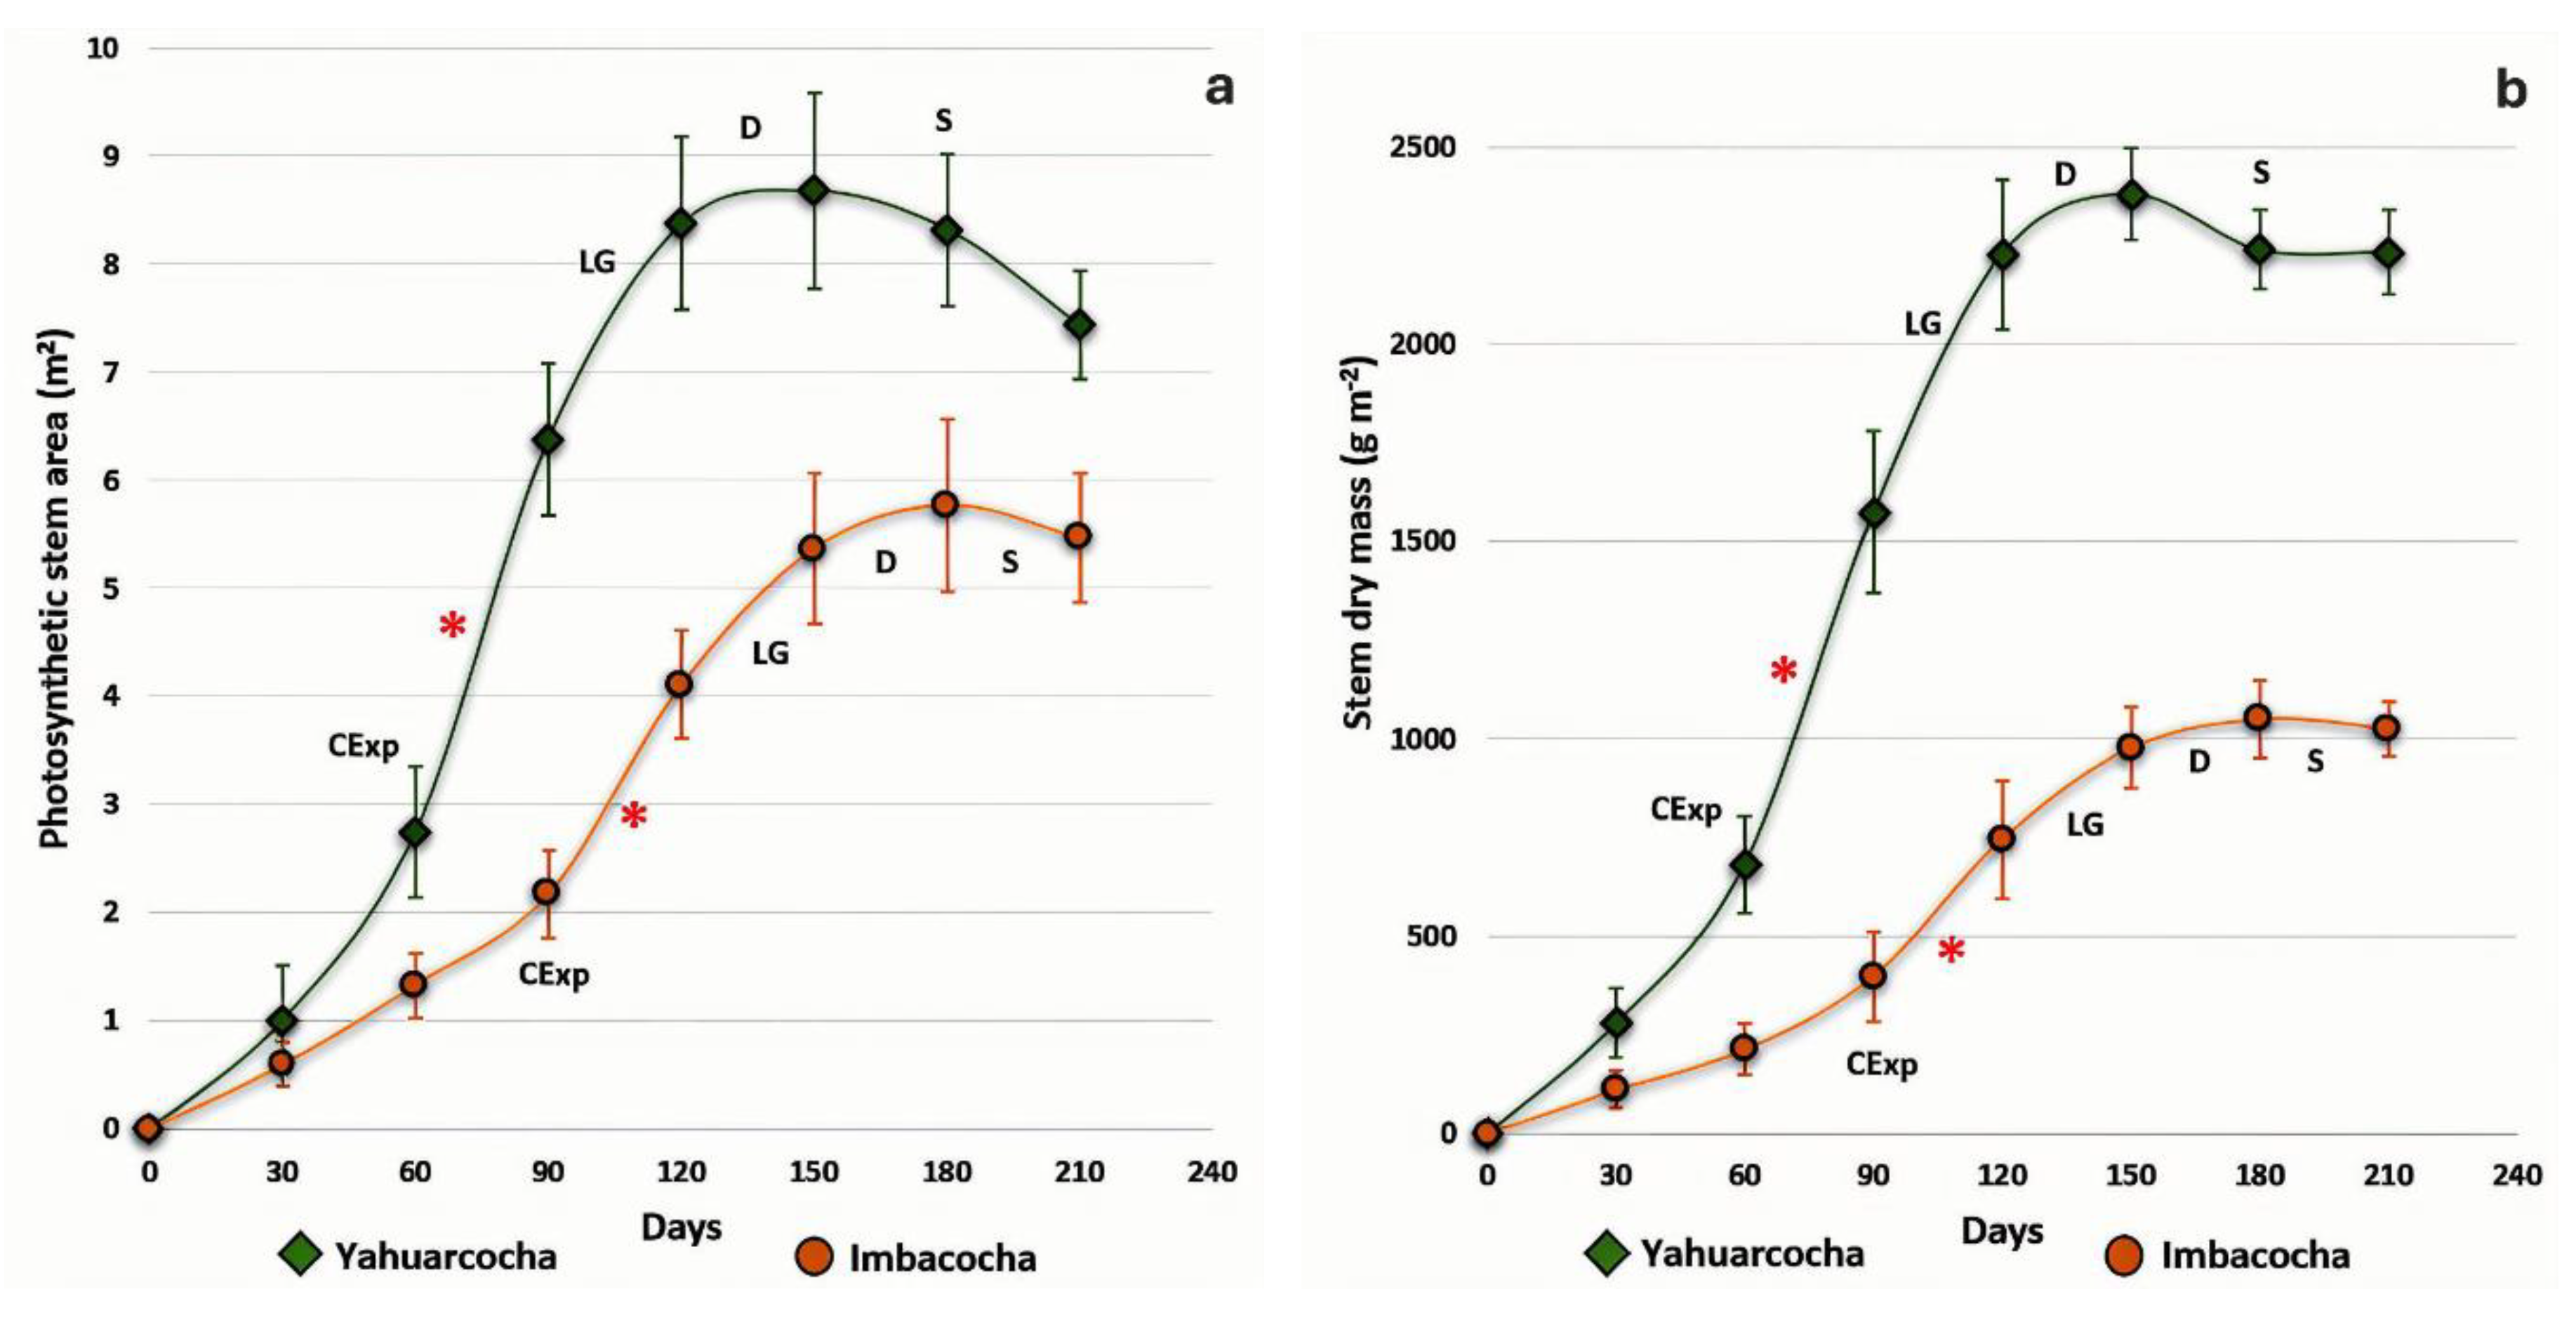
Figure 5.
a) Relative Growth Rate (RGR) of Totora (Schoenoplectus californicus) cultivated in the lakes of Yahuarcocha and Imbacocha, measured at regular 30-days intervals. b) Absolute Growth Rate (AGR) under the same conditions. Vertical bars represent standard deviation (n = 4). Data were collected from March to September 2018.
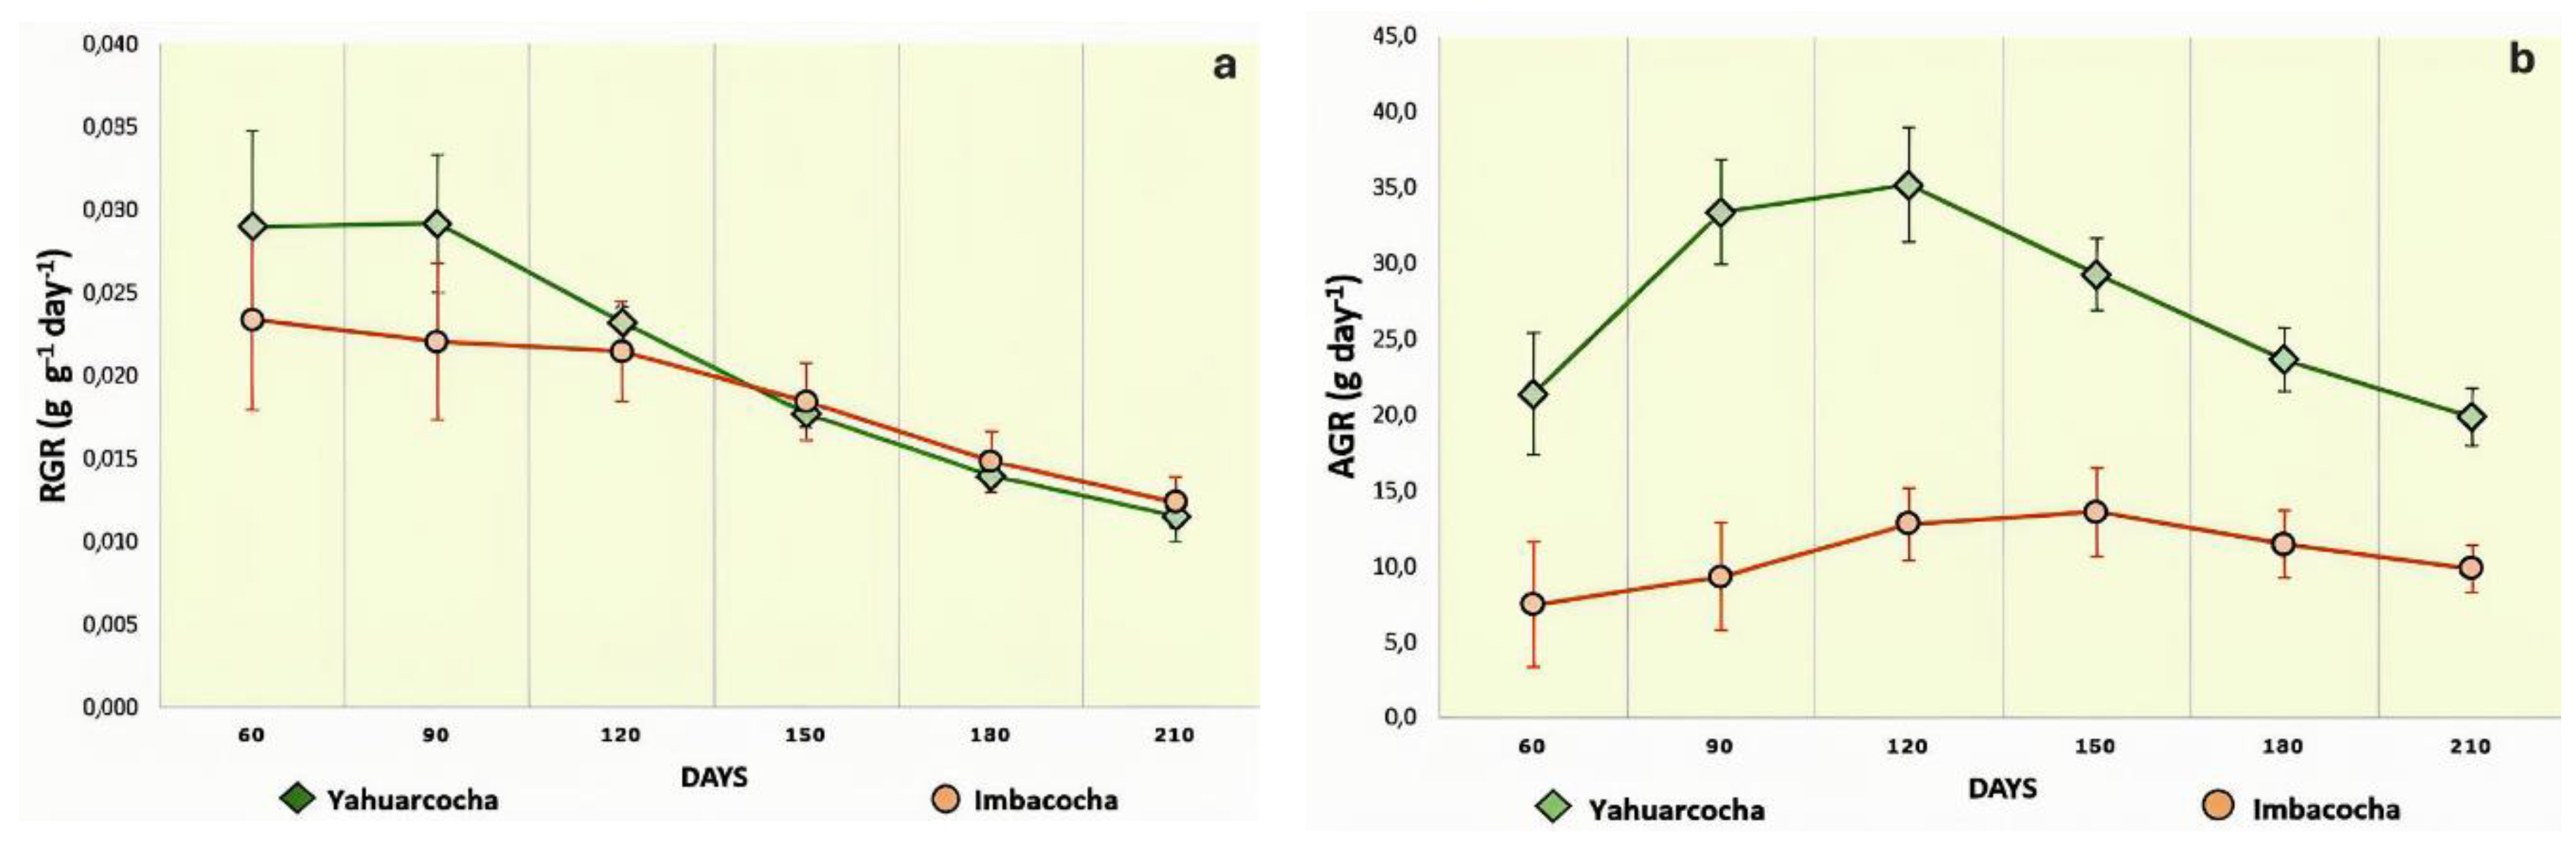
Figure 6.
Degree of correlation between growth variables for Totora (Schoenoplectus californicus) cultivated in Lake Yahuarcocha. a) Net Assimilation Rate (NAR) versus Relative Growth Rate (RGR). b) Leaf Area Ratio (LAR) versus Relative Growth Rate (RGR). The linear regression equations (y) are shown alongside the corresponding coefficients of determination (R²).
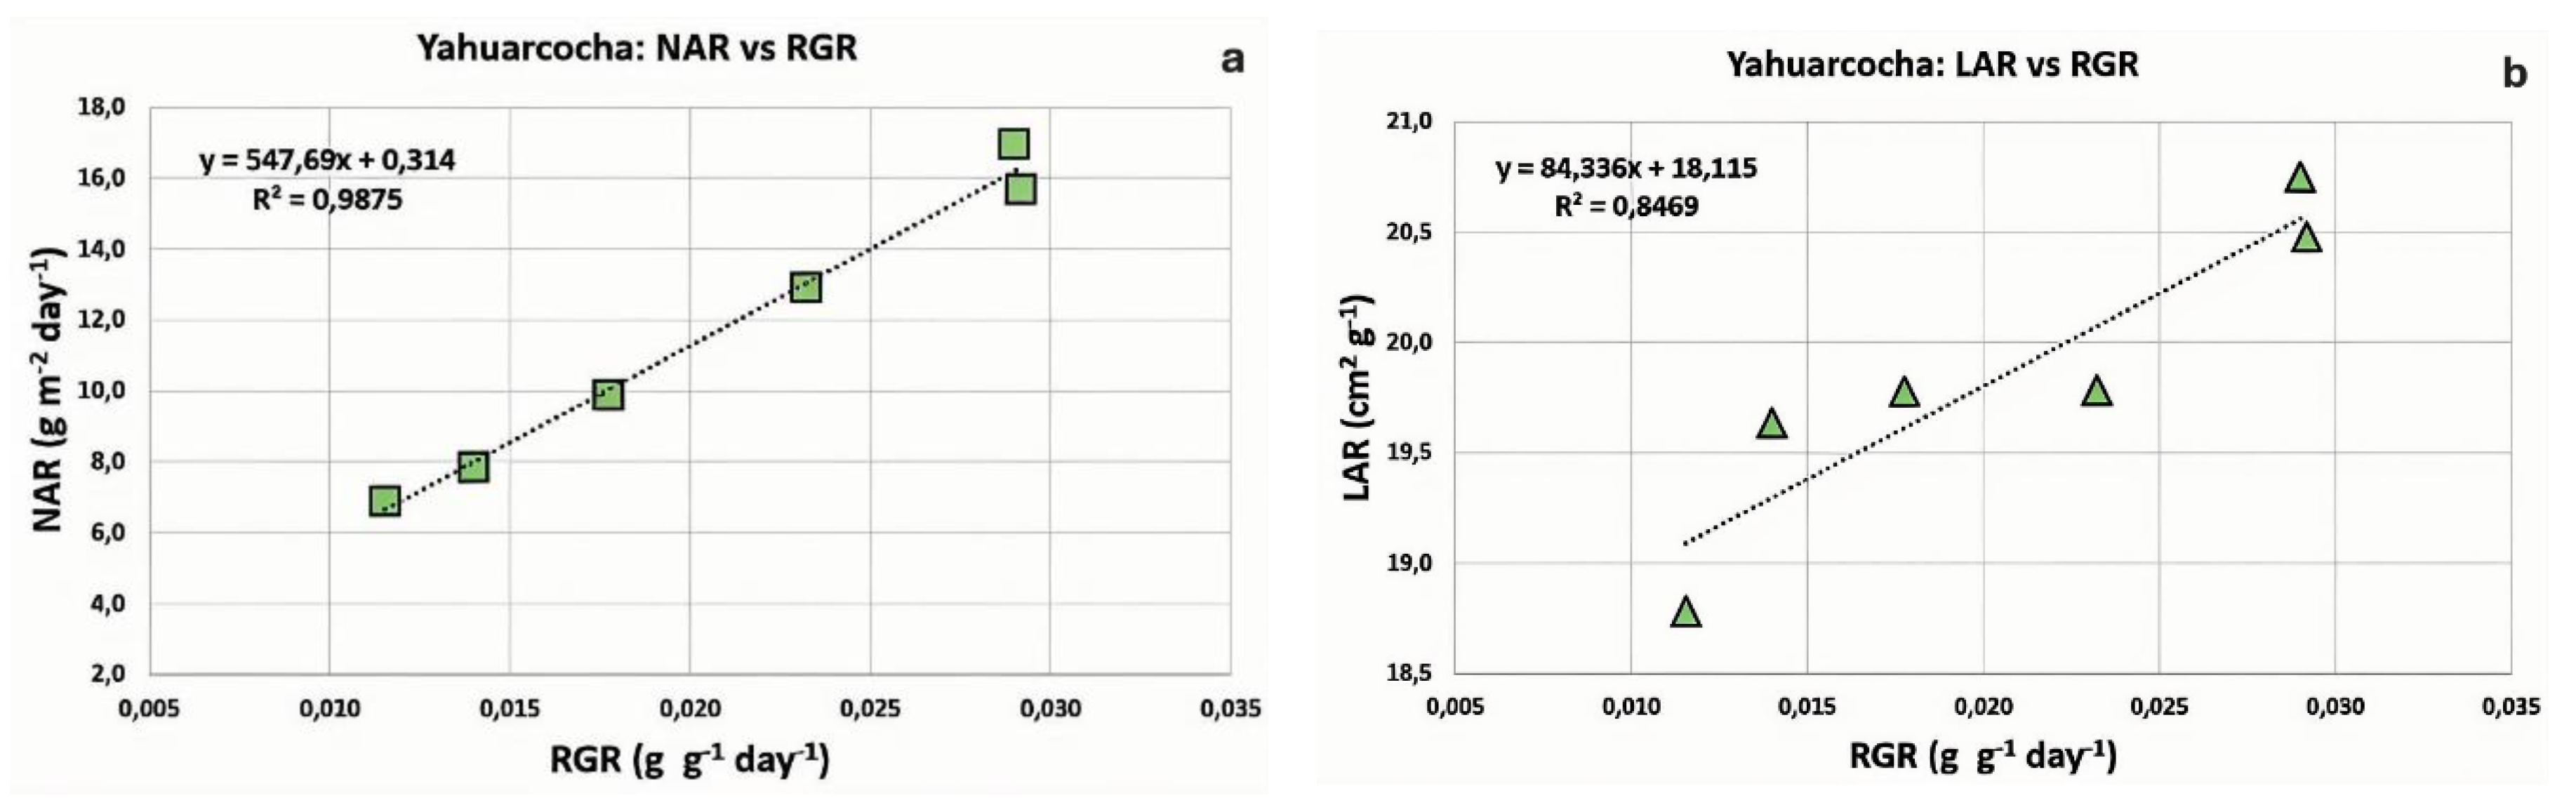
Figure 7.
Degree of correlation between growth variables for Totora (Schoenoplectus californicus) cultivated in Lake Imbacocha. a) Net Assimilation Rate (NAR) versus Relative Growth Rate (RGR). b) Leaf Area Ratio (LAR) versus Relative Growth Rate (RGR). The linear regression equations (y) are shown along with the corresponding coefficients of determination (R²).
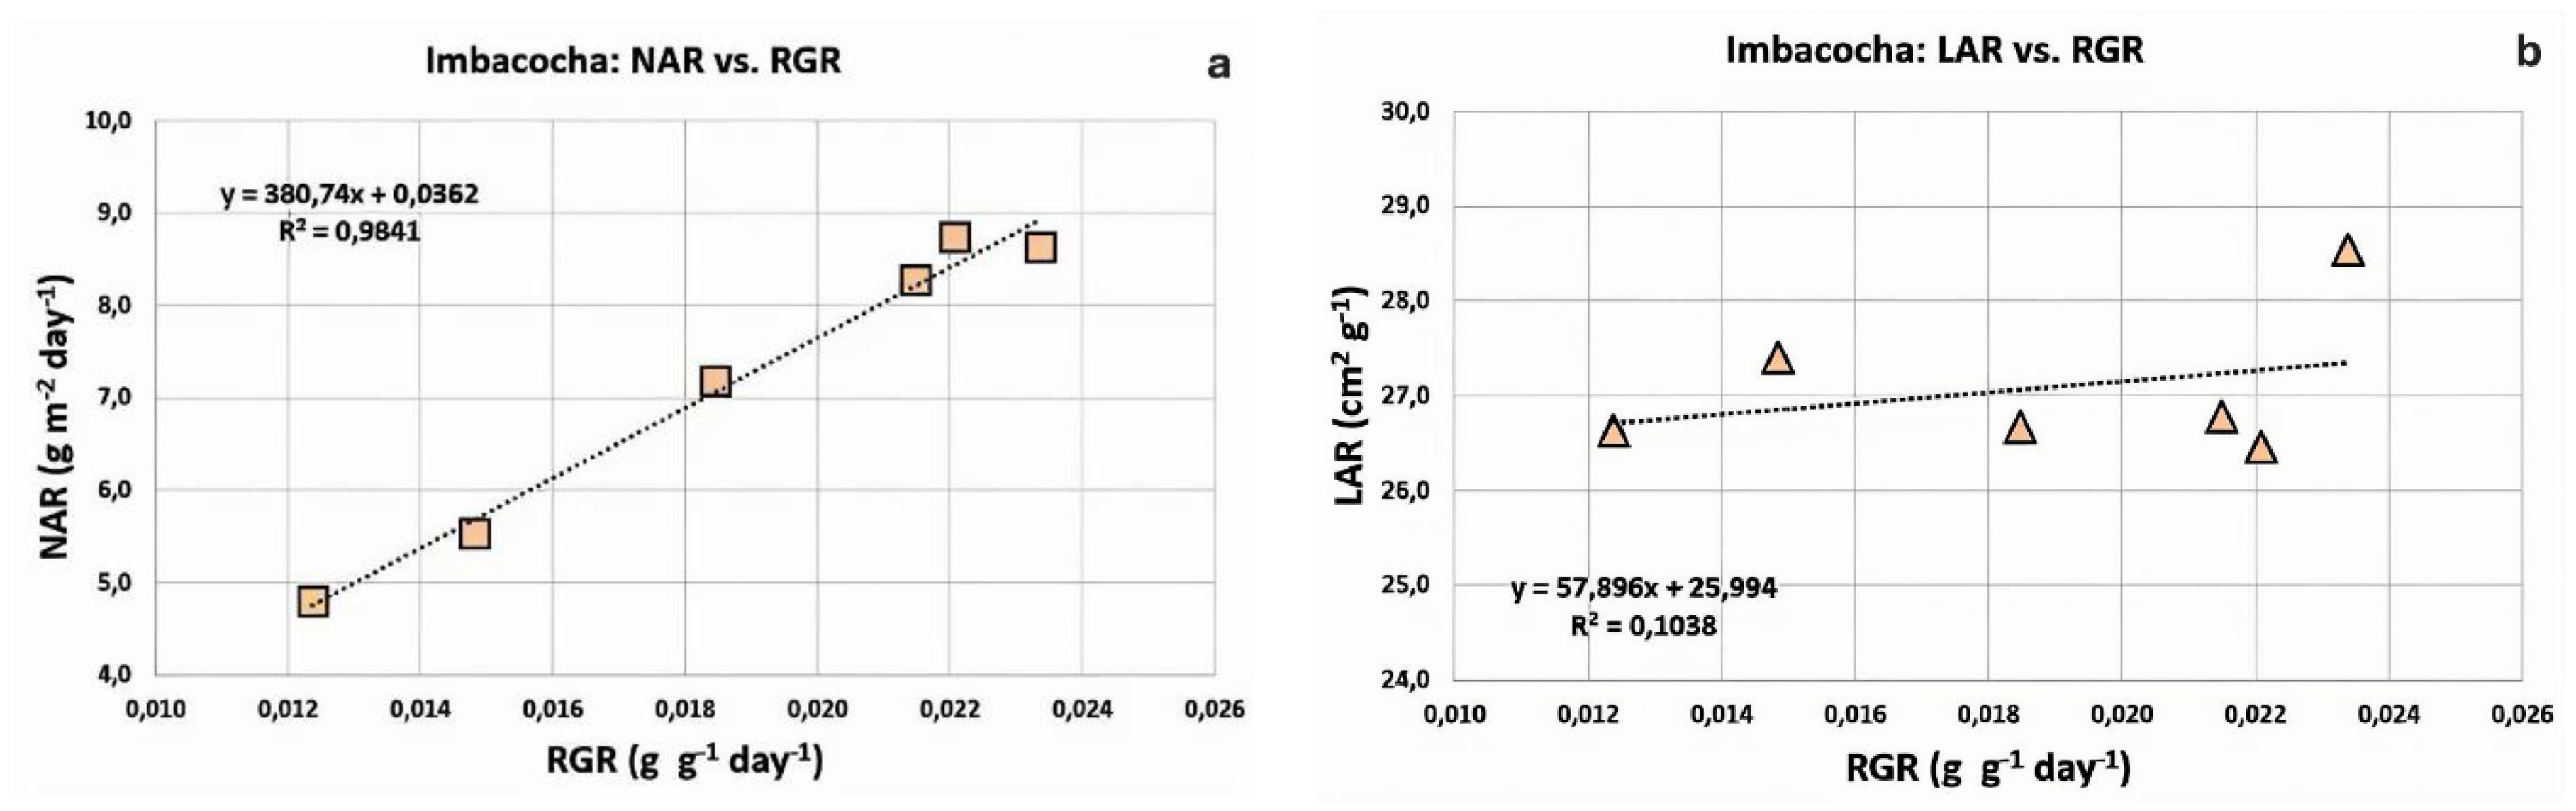
Figure 8.
Comparative values of Net Assimilation Rate (NAR) and Leaf Area Ratio (LAR) over a 210-day cultivation period for Totora (Schoenoplectus californicus) populations from two lakes: a) Yahuarcocha; b) Imbacocha.
Figure 8.
Comparative values of Net Assimilation Rate (NAR) and Leaf Area Ratio (LAR) over a 210-day cultivation period for Totora (Schoenoplectus californicus) populations from two lakes: a) Yahuarcocha; b) Imbacocha.
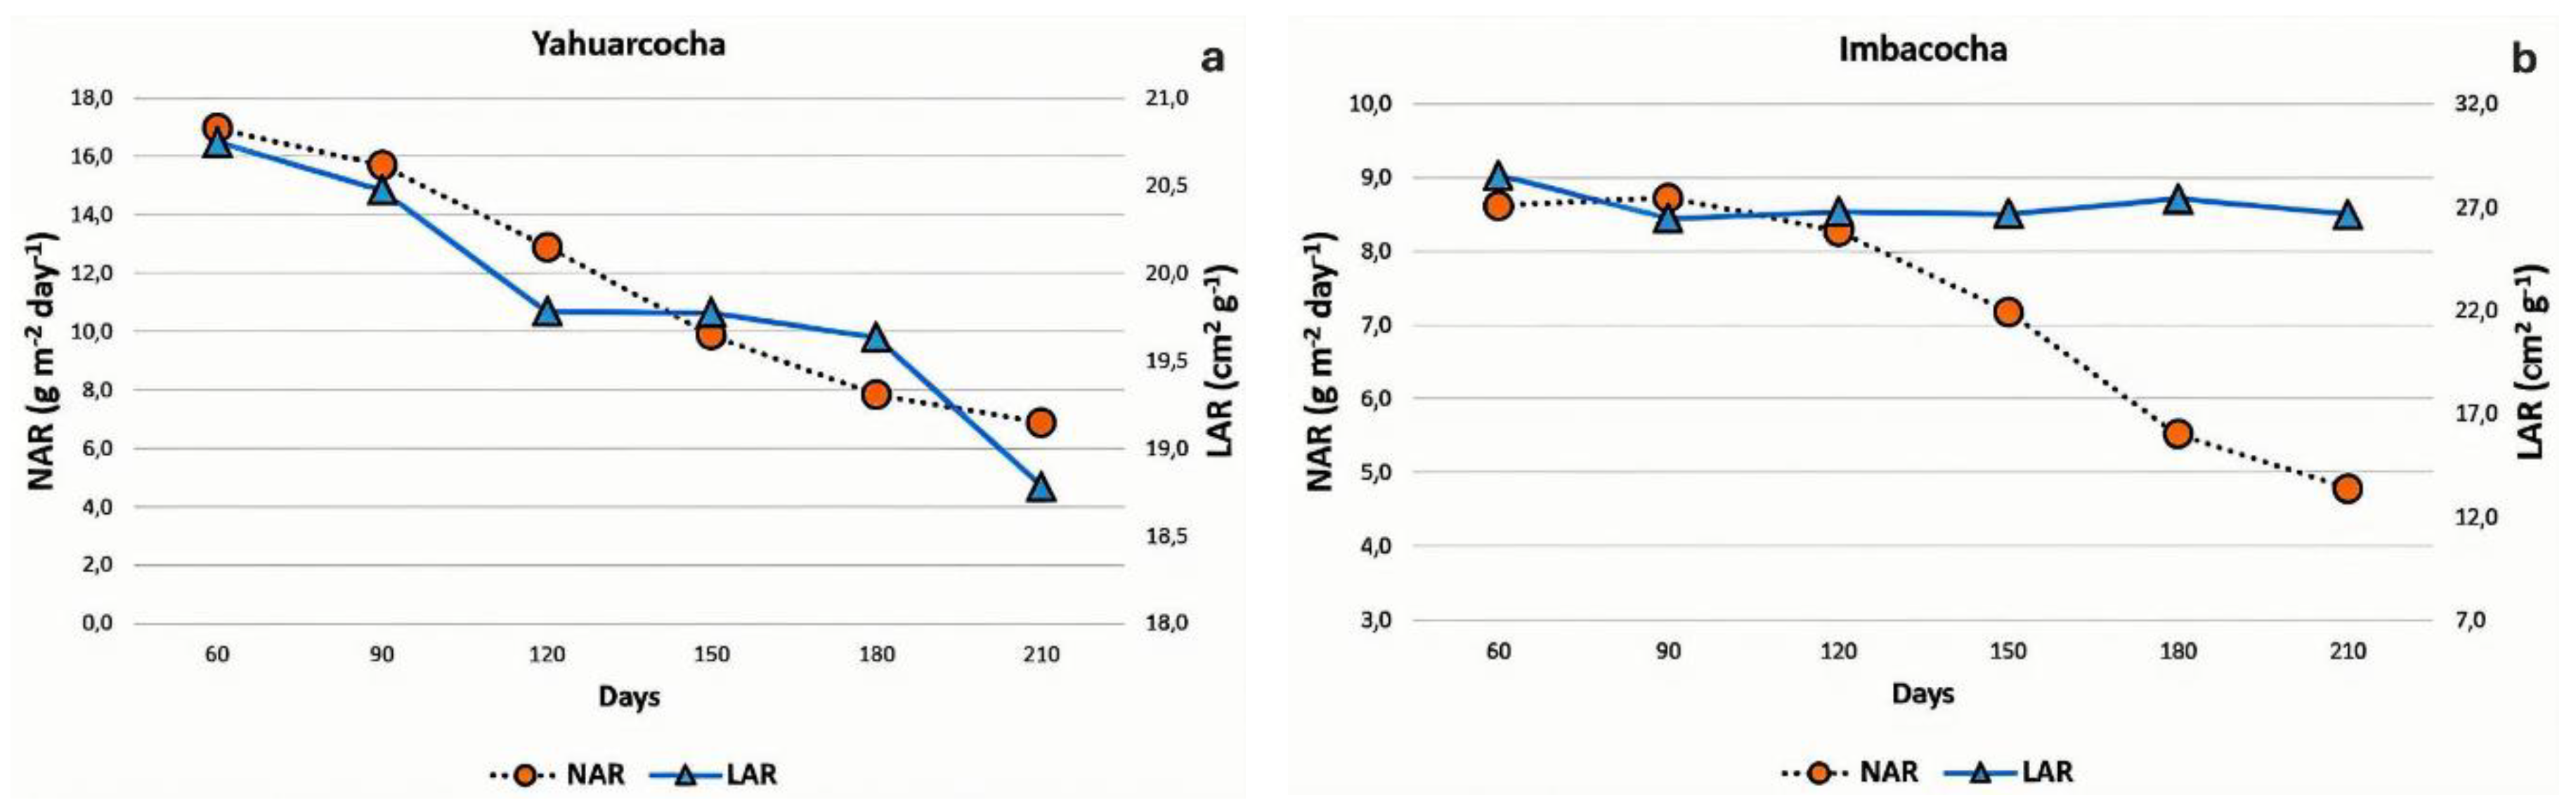
Figure 9.
Variation in Harvest Index (HI) and Crop Yield (R) for Totora (Schoenoplectus californicus) plants cultivated in: a) Lake Yahuarcocha; b) Lake Imbacocha.
Figure 9.
Variation in Harvest Index (HI) and Crop Yield (R) for Totora (Schoenoplectus californicus) plants cultivated in: a) Lake Yahuarcocha; b) Lake Imbacocha.
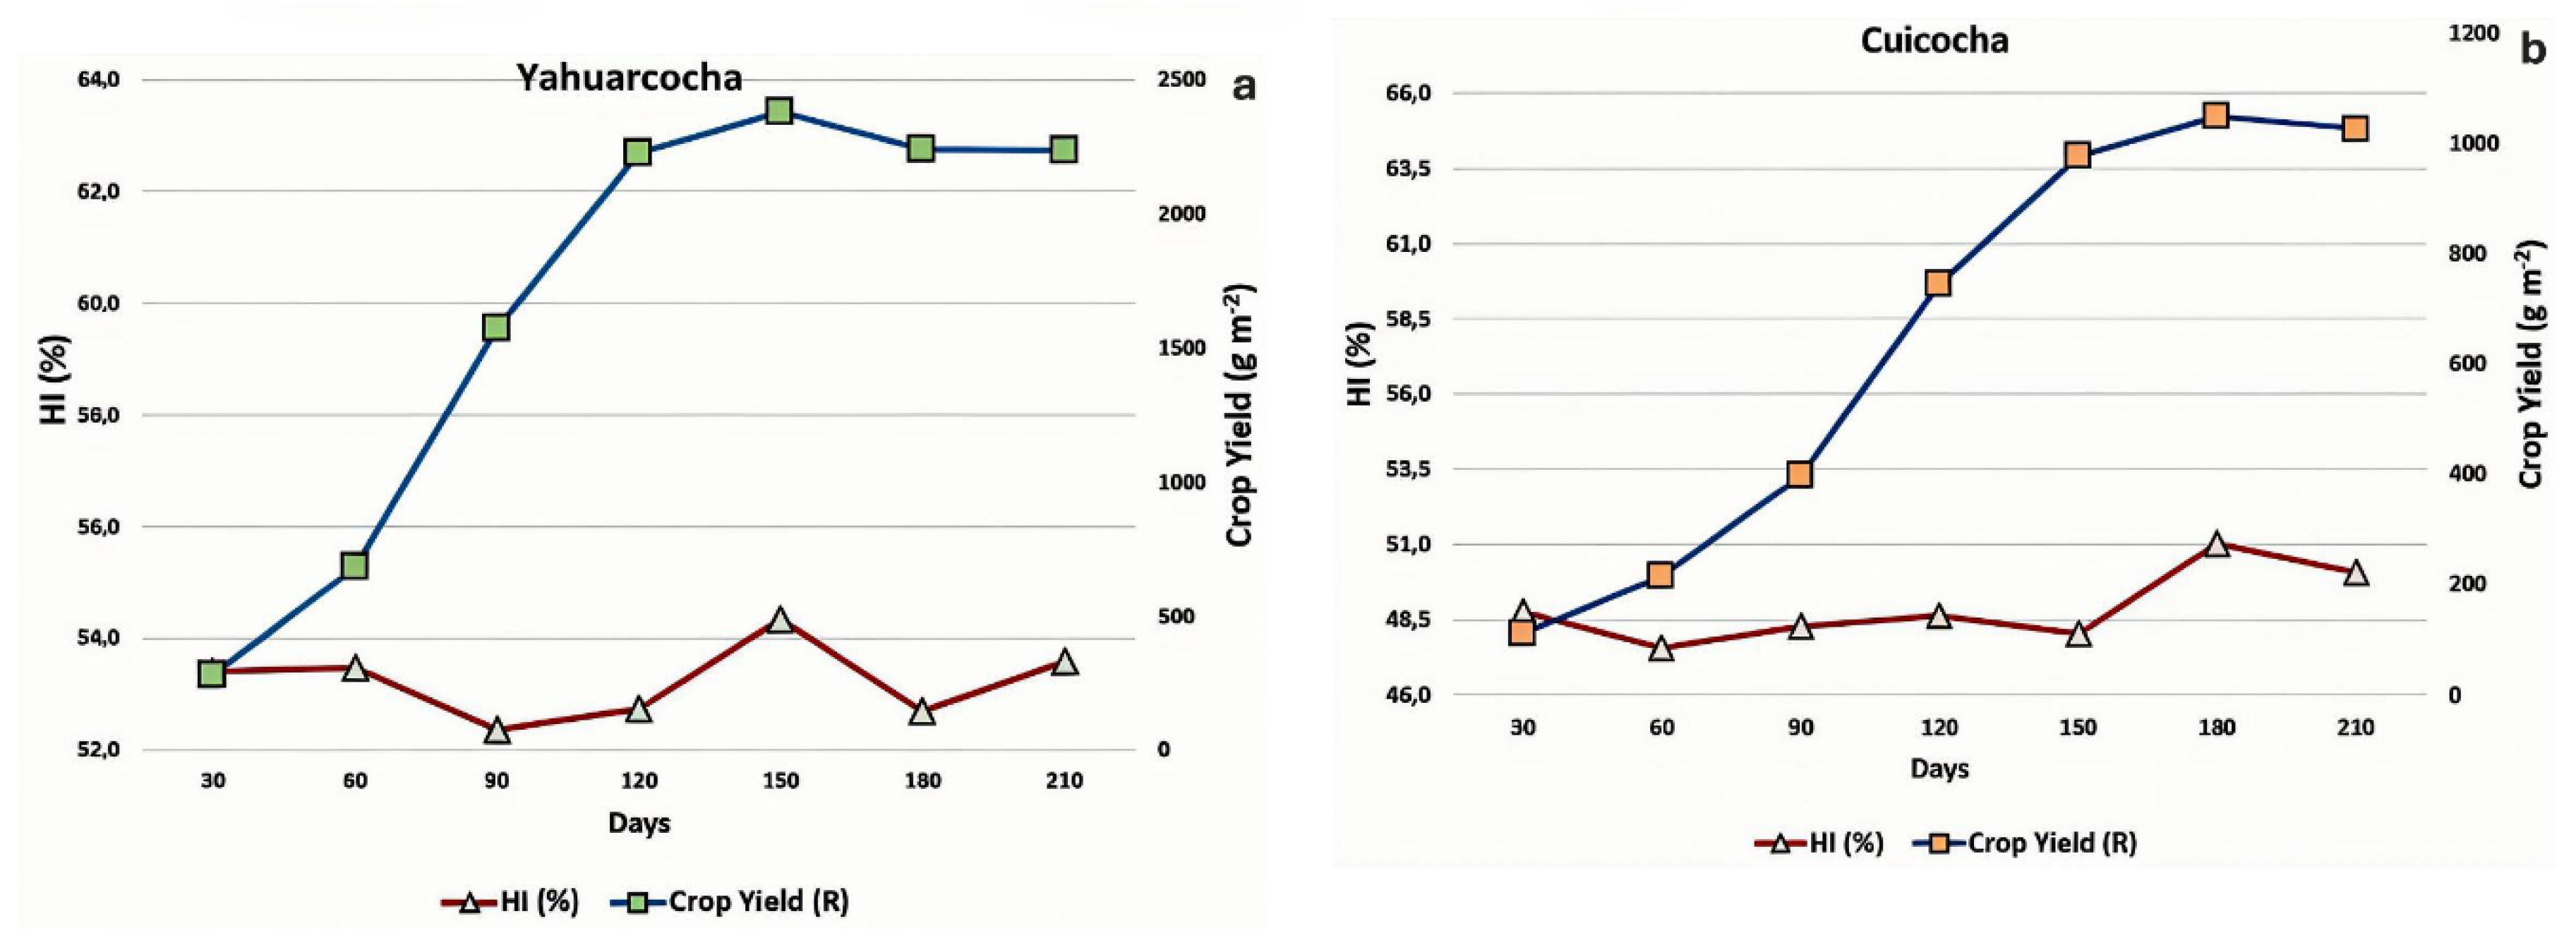

Table 1.
Growth indices used in the present study, with their symbols, calculation formulas, and units of expression. Adapted from Gardner et al. (2003).
Table 1.
Growth indices used in the present study, with their symbols, calculation formulas, and units of expression. Adapted from Gardner et al. (2003).
| Growth Index | Symbol | Average Value over a Time Interval (t₂ - t₁) | Units |
|---|---|---|---|
| Relative Growth Rate | RGR | 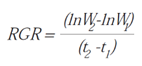 |
g g-1 day-1 |
| Absolute Growth Rate | AGR | 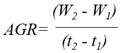 |
g day-1 |
| Net Assimilation Rate | NAR | 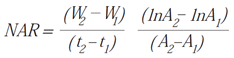 |
g m-2 day-1 |
| Leaf Area Ratio | LAR | 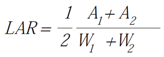 |
cm2 g-1 |
| Leaf Weight Ratio | LWR | 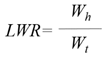 |
g g-1 |
| Specific Leaf Area | SLA |  |
cm2 g-1 |
| Leaf Area Index | LAI |  |
Dimensionless |
| Harvest Index | HI | % | |
| Crop Yield | R | g m-2 |
Symbols: W = weight, t = time, A = area, S = surface, Wh = leaf weight, Wt = total weight.
Table 2.
Values of the main traits used for the vegetative growth analysis of Totora from Yahuarcocha (Yah 1) and Imbacocha (Imb 1), recorded at 30-day intervals. The means are presented along with their respective standard deviations (n = 4).
Table 2.
Values of the main traits used for the vegetative growth analysis of Totora from Yahuarcocha (Yah 1) and Imbacocha (Imb 1), recorded at 30-day intervals. The means are presented along with their respective standard deviations (n = 4).
| Schoenoplectus californicus in Lakes Yahuarcocha and Imbacocha | ||||||
|---|---|---|---|---|---|---|
| Days | Photosynthetic Area PA (m²) |
Stem Dry Mass (g m⁻²) |
Total Plant Dry Mass (g m⁻²) | |||
| Yah 1 | Imb 1 | Yah 1 | Imb 1 | Yah 1 | Imb 1 | |
| 30 | 1.01 ± 0.51 | 0.60 ± 0.15 | 280 ± 88 | 110 ± 47 | 508 ± 19 | 223 ± 18 |
| 60 | 2.75 ± 0.59 | 1.33 ± 0.28 | 682 ± 121 | 214 ± 63 | 1,283 ± 55 | 448 ± 29 |
| 90 | 6.37 ± 0.70 | 2.18 ± 0.42 | 1,575 ± 206 | 397 ± 115 | 3,005 ± 23 | 837 ± 59 |
| 120 | 8.38 ± 0.83 | 4.11 ± 0.45 | 2,228 ± 188 | 745 ± 148 | 4,222 ± 54 | 1,537 ± 62 |
| 150 | 8.68 ± 0.85 | 5.37 ± 0.66 | 2,380 ± 116 | 977 ± 103 | 4,390 ± 253 | 2,038 ± 123 |
| 180 | 8.32 ± 0.70 | 5.77 ± 0.77 | 2,240 ± 100 | 1,050 ± 99 | 4,253 ± 81 | 2,068 ± 177 |
| 210 | 7.44 ± 0.52 | 5.47 ± 0.62 | 2,234 ± 108 | 1,026 ± 69 | 4,168 ± 86 | 2,061 ± 165 |
Disclaimer/Publisher’s Note: The statements, opinions and data contained in all publications are solely those of the individual author(s) and contributor(s) and not of MDPI and/or the editor(s). MDPI and/or the editor(s) disclaim responsibility for any injury to people or property resulting from any ideas, methods, instructions or products referred to in the content. |
© 2025 by the authors. Licensee MDPI, Basel, Switzerland. This article is an open access article distributed under the terms and conditions of the Creative Commons Attribution (CC BY) license (http://creativecommons.org/licenses/by/4.0/).
Copyright: This open access article is published under a Creative Commons CC BY 4.0 license, which permit the free download, distribution, and reuse, provided that the author and preprint are cited in any reuse.


