
Submitted:
29 October 2025
Posted:
30 October 2025
You are already at the latest version
Abstract
Acute Trypanosoma cruzi infection induces an exuberant immune response; however, the host is unable to clear the parasite, and the infection progresses to a chronic phase. T and B cells play a crucial role in controlling infections. Although the parasite constitutes a myriad of antigenic determinants capable of activating many T and B cell clones, some antigens trigger a large proportion of CD8 T cells, implying TCR cross-reactivity targeting these determinants. Polyclonal activation may result in an inefficient immune response against the parasite, diverting it to less critical antigenic determinants, allowing infection persistence, and increasing the risk of autoimmunity. Cross-reactivity has been demonstrated in CD8 T cells but not in CD4 T cells. Herein, we demonstrate, by cytometry, that CD4+ T cells, carrying the DO11.10 transgenic TCR, which are responsive to OVA, are activated during the T. cruzi acute infection, becoming effector memory T cells that produce cytokines such as IFN-γ, TNF-α, IL-4, and IL-10. In addition, prior oral exposure to OVA altered cytokine production by these transgenic T cells upon infection. We also demonstrate that T. cruzi induces Foxp3 expression in a sizable pool of transgenic T cells.
Keywords:
chagas disease
; Trypanosoma cruzi
; DO11.10 T cells
; ovalbumin
; interferon-γ
; TNF
; interleukin-10
; cross-reactivity
Introduction
Trypanosoma cruzi is the etiological agent of Chagas disease, a neglected condition [1]. The acute infection is followed by a potent immune response that controls the parasite's growth [2]. However, the host can not clear the parasite, and a chronic infection is established [2]. A wide range of immune responses can be detected during the acute phase of the disease, helping to keep parasite growth in check [2]. Yet, most of the lymphocyte response is polyclonal and may occur through bystander activation [3]. However, it has been proposed that T cell receptors are cross-reactive to a large extent [4]. Several molecular mechanisms have been proposed to explain TCR cross-reactivity in various models [5]. In addition, peripheral T cells might express two distinct TCRs in mice and humans, denoted as double TCR-expressors [6]. Therefore, it is reasonable to argue that T cell cross-reactivity may be one of the reasons to justify the polyclonal T cell activation during T. cruzi infection. Cross-reactivity may have important immunological implications. For instance, T cells are positively selected in the thymus by self-peptides and MHC. They may yet interact with and produce immune responses to non-self peptides in the peripheral lymphoid organs [5,7]. Importantly, infections can trigger and expand clones that cross-react with self-antigens, thereby causing autoimmune diseases [8,9].
On the other hand, cross-reactivity may help to develop vaccines to prevent or ameliorate autoimmune diseases. For instance, it has been reported that non-self heat shock protein-derived peptides may activate cross-reactive regulatory T cells, thereby preventing autoimmune diseases [10,11,12]. Moreover, prior contact with pathogens or non-pathogenic microflora can modify the immune response to an unrelated microorganism, as previously documented [9,13]. For example, we have previously described how aged or thymectomized mice are completely resistant to infection with T. cruzi, whereas young mice are susceptible [14,15]. Resistance, in that case, correlated with the increase of naturally occurring memory T cells in these animals at the moment of infection, suggesting that environmental antigen-reactive T cells may help control the parasite load by responding to T. cruzi antigens through cross-reactivity [2]. Interestingly, a high degree of cross-reactivity between different CD8 T cell clones and T. cruzi antigen-derived peptides has recently been demonstrated [16]. Together, these findings might help explain important aspects of Chagas disease pathogenicity. Yet, there is no clear information on the cross-reactivity of CD4+ T cells with class II MHC during T. cruzi infection, in part due to the lack of reagents such as stable MHC class II-peptide tetramers.
In this study, we have described the phenotypes and functional changes of the DO11.10 transgenic CD4+ T cell, which bears the TCR recognized by the clonotypic monoclonal antibody KJ1-26, during acute T. cruzi infection. Originally, the DO11.10 transgenic TCR is specific for an Ovalbumin-derived peptide (323-339) in the context of IAd class II MHC [17]. Therefore, the activation of DO11.10 transgenic CD4+ T cells to a multitude of unrelated antigens, such as T. cruzi, is somewhat surprising. We demonstrate that DO11.10 transgenic CD4 T cells are largely activated to an effector memory phenotype during the acute T. cruzi infection in BALB/c mice. The percentage of transgenic T cells expressing IFN-γ, TNF-α, IL-4, and IL-10 also increases in the acute phase. Previous oral immunization with OVA altered the cytokine profile of DO11.10 CD4 T cells, increasing the percentage of IL-10-expressing cells. Additionally, some DO11.10 CD4 T cells begin to express Foxp3. These results suggest that cross-reactivity between CD4 T cells and class II MHC peptides may be similar to the CD8 T cell compartment and peptides related to class I MHC. These findings might have profound implications for the quality of the immune response during the infection.
Materials and Methods
Animals
Female DO11.10 BALB/c mice (4–6 weeks old) were obtained from the Centro de Pesquisas Gonçalo Moniz animal house. Mice were previously checked for the expression of the KJ1-26 clonotype before breeding or experiments. Only mice expressing high frequencies of KJ1-26 were used. The animals were housed in microisolators under conventional conditions and handled in accordance with institutional ethical guidelines. All mouse procedures were carried out in accordance with the Ethics Committee of the Oswaldo Cruz Foundation, under protocols CPqGM 015/09 and CPqGM 038/09.
Ovalbumin Immunization
To investigate whether prior immunization with the transgenic cognate antigen would modify the immune response to T. cruzi antigens, Ovalbumin (A5253, Sigma-Aldrich) was dissolved in drinking water at 5 mg/mL, filtered, and administered ad libitum for 5 days. A fresh solution was prepared daily. Mice were rested for 7 days and then immunized intravenously via the retroorbital sinus using 300 μg/0.1 mL of OVA (A5503, Sigma-Aldrich) diluted in PBS. This protocol contained slight modifications of a previously published study [18].
Infection
Groups of 5 mice each were infected intraperitoneally with 103 blood-form trypomastigotes of the Tulahuen strain of T. cruzi in 0.2 mL of 0.15 M phosphate-buffered saline (PBS). Infected blood was obtained from BALB/c mice at the peak of parasitemia. Control mice received the same volume of PBS. Mice were sacrificed between days 22 and 25 after infection, depending on the experiment. No significant differences were observed during this brief period.
In Vitro Cell Culture
Splenocytes were cultured in triplicate at a density of 107 cells/well in 24-well plates (Nunc) in RPMI 1640 (Gibco, Grand Island, NY) supplemented with 10% fetal bovine serum (FBS, Hyclone), 50 μM 2-ME, and one mM HEPES (complete medium). Cells were cultured at 37°C and 5% CO2 for 24 hours in complete medium alone, as previously described [19]. Cell viability was always assessed by PI staining and consistently remained above 93% before in vitro cultures. Brefeldin A was added 6 hours before cell harvest to facilitate intracellular cytokine detection for flow cytometric analysis.
Flow Cytometric Analysis
Spleen cells were isolated as described [20] and placed in ice-cold PBS supplemented with 5% FBS and 0.01% sodium azide. Staining was performed as previously described [20]. In some experiments, CD4 T cells were magnetically sorted using surface staining with APC anti-CD4 (Clone RM4-4), followed by anti-APC microbeads (Miltenyi Biotec, Germany) according to the manufacturer's instructions. Purity was consistently above 95%, as confirmed by cross-checking with a PE-CY5.5 anti-CD4 antibody (Clone GK1.5, a non-epitope-overlapping antibody). The fluorochrome-conjugated monoclonal antibodies used were: anti-CD4 (Clones GK1.5 and RM4-4), anti-DO11.10 clonotype (Clone KJ1-26), anti-CD44 (Clone IM7), anti-CD62L (Clone MEL-14), anti-Foxp3 (Clone 150D), anti-IL-4 (Clone 11B11), anti-IL-10 (Clone JES5-16E3), anti-IFN-γ (Clone XMG1.2), and anti-TNF-α (Clone MP6-XT22). These were purchased from eBioscience, BioLegend, or Caltag. Streptavidin-PE-Cy5.5 from Caltag was used to reveal biotin-conjugated antibodies. Intracellular staining for IL-4, IL-10, IFN-γ, and TNF-α was performed as described [20]. Buffer kits for intracellular and intranuclear staining were from eBioscience and used according to the manufacturer's instructions. Isotype controls (clones RTK2071 and RTK4530) were included to establish background levels for cytokine intracellular assays. After surface staining, the cells were fixed with 1% paraformaldehyde in PBS and analyzed using a three-color FACScan (Becton & Dickinson). Results were analyzed using FlowJo software. CD4 T cells were electronically gated within the lymphocyte population, as defined by FSC x SSC parameters. T cells expressing the KJ1-26 clonotype were further gated inside the CD4+ T cells (Figure 1A).
Statistical Analysis
The significance of differences between experimental and control groups was determined as described in each figure legend. Two-tailed P values below 0.05 were considered statistically significant. Results were analyzed using the InStat 2 software for Macintosh.
Results
Frequencies of transgenic DO11.10 CD4 T cells during acute T. cruzi infection. To test whether signs of cross-reactivity could also be observed in CD4 T cells, we infected DO11.10 transgenic mice with T. cruzi. Figure 1A shows representative dot plots of splenic CD4+KJ1-26+ T cells from different experimental groups. Figure 1B shows the frequencies of total splenic CD4+ T cells (closed circles) and CD4+KJ1-26+ transgenic T cells (closed squares) from individual mice in various experimental groups. Transgenic DO11.10 CD4+ T cells comprise the majority of splenic CD4 T cells in control mice. The same situation was observed for mice previously immunized with OVA. However, T. cruzi-infected mice showed smaller frequencies of transgenic T cells in the CD4+ T cell population within 25 days after infection. OVA immunization significantly prevents the diminution of DO11.10 transgenic T cells in the overall CD4+ T cell population, indicating that antigen-experienced transgenic T cells may be better preserved during acute infection. Please note that the fluorescence intensity of KJ1-26 staining was slightly lower in infected mice, indicating some degree of activation. Low expression of the transgenic DO11.10 TCR has been reported following antigen-specific activation [21,22]. In addition, lower expression of alpha-beta TCR and CD3 molecules is observed in polyclonal T cells from normal mice during acute infection, indicating T cell activation (data not shown). Therefore, these results suggest that DO11.10 transgenic CD4+ T cells may interact with T. cruzi antigens and become activated during acute infection. It is also interesting that a large proportion of transgenic T cells become negative for the KJ1-26 clonotype, indicating that an endogenous alpha chain has been rearranged and that a second TCR is expressed on these cells. This situation has been described before for DO11.10 transgenic mice [22,23]. In fact, a large proportion of CD4+ KJ1-26- T cells lack the expression of the CD62L molecule, indicating they are effector memory T cells (supplementary Figure 1)
DO11.10 transgenic CD4+ T cells are activated to effector memory lymphocytes during the acute T. cruzi infection. To better explore the hypotheses above, flow cytometric analysis of sorted splenic KJ1-26+CD4+ T cells from infected DO11.10 mice revealed a significant increase in the percentage of memory T cells when compared with control mice. Figure 2A and 2B show that DO11.10+CD4+ T cells from normal mice are predominantly in the resting stage, exhibiting low percentages of markers associated with memory T cells. On the other hand, OVA immunization or infection of DO11.10 transgenic mice increased the rate of effector memory transgenic T cells, expressing high levels of CD44 and low levels of CD62L (closed diamonds). Previous immunization with OVA also increases the percentage of central memory transgenic CD4+ T cells (closed triangles) after infection, compared to the other groups.
T. cruzi infection increases the frequencies of splenic TNF-α+ and IFN-γ+ DO11.10 transgenic T cells. To further characterize these activated cells, intracellular cytokine staining was performed. Infection with T. cruzi increased the frequencies of CD4+KJ1-26+ cells that spontaneously expressed TNF-α after 24 hours of culture in complete medium, as shown in Figure 3 (upper histogram set). Previous OVA immunization also augments spontaneous TNF-α production compared with non-immunized controls. However, the infection did not increase the frequency of transgenic splenic T cells expressing TNF-α in OVA-immunized animals compared with the OVA-immunized group.
The frequencies of transgenic splenic T cells, which spontaneously produce IFN-γ, increase upon infection compared to uninfected mice and are similar to those of mice previously immunized with OVA. In addition, infection in OVA-immunized mice does not further augment the percentages of transgenic T cells that produce IFN-γ. These results suggest that prior OVA immunization has set a limit on the production of TNF-α and IFN-γ induced by T. cruzi infection.
DO11.10 transgenic CD4+ T cells spontaneously produce IL-4 and IL-10 upon T. cruzi infection. To assess whether T. cruzi infection could induce the production of regulatory cytokines, we evaluated IL-4 and IL-10 in naïve mice and in mice orally exposed to OVA before infection. Figure 4 shows that transgenic CD4+ T splenocytes from infected mice displayed higher frequencies of IL-4- and IL-10-expressing cells than unstimulated controls. Additionally, previous OVA immunization significantly increased the frequency of IL-4+ cells compared to non-immunized animals. However, the infection did not augment the relative number of IL-4+ cells in OVA-immunized mice. We have also studied the frequencies of IL-10 expression on transgenic CD4+ T lymphocytes. The lower histograms in Figure 4 show that infection increased the frequency of splenic IL-10 transgenic producers compared with control, OVA-immunized, or OVA-immunized-infected DO11.10 mice. Interestingly, pre-immunization with OVA significantly increased the frequencies of IL-10-producing transgenic T cells compared to non-immunized mice. However, these frequencies were still lower than those in infected non-immunized mice. These results suggest that prior oral exposure to OVA modulates the immune response of DO11.10 T cells, shifting them toward a more regulatory phenotype.
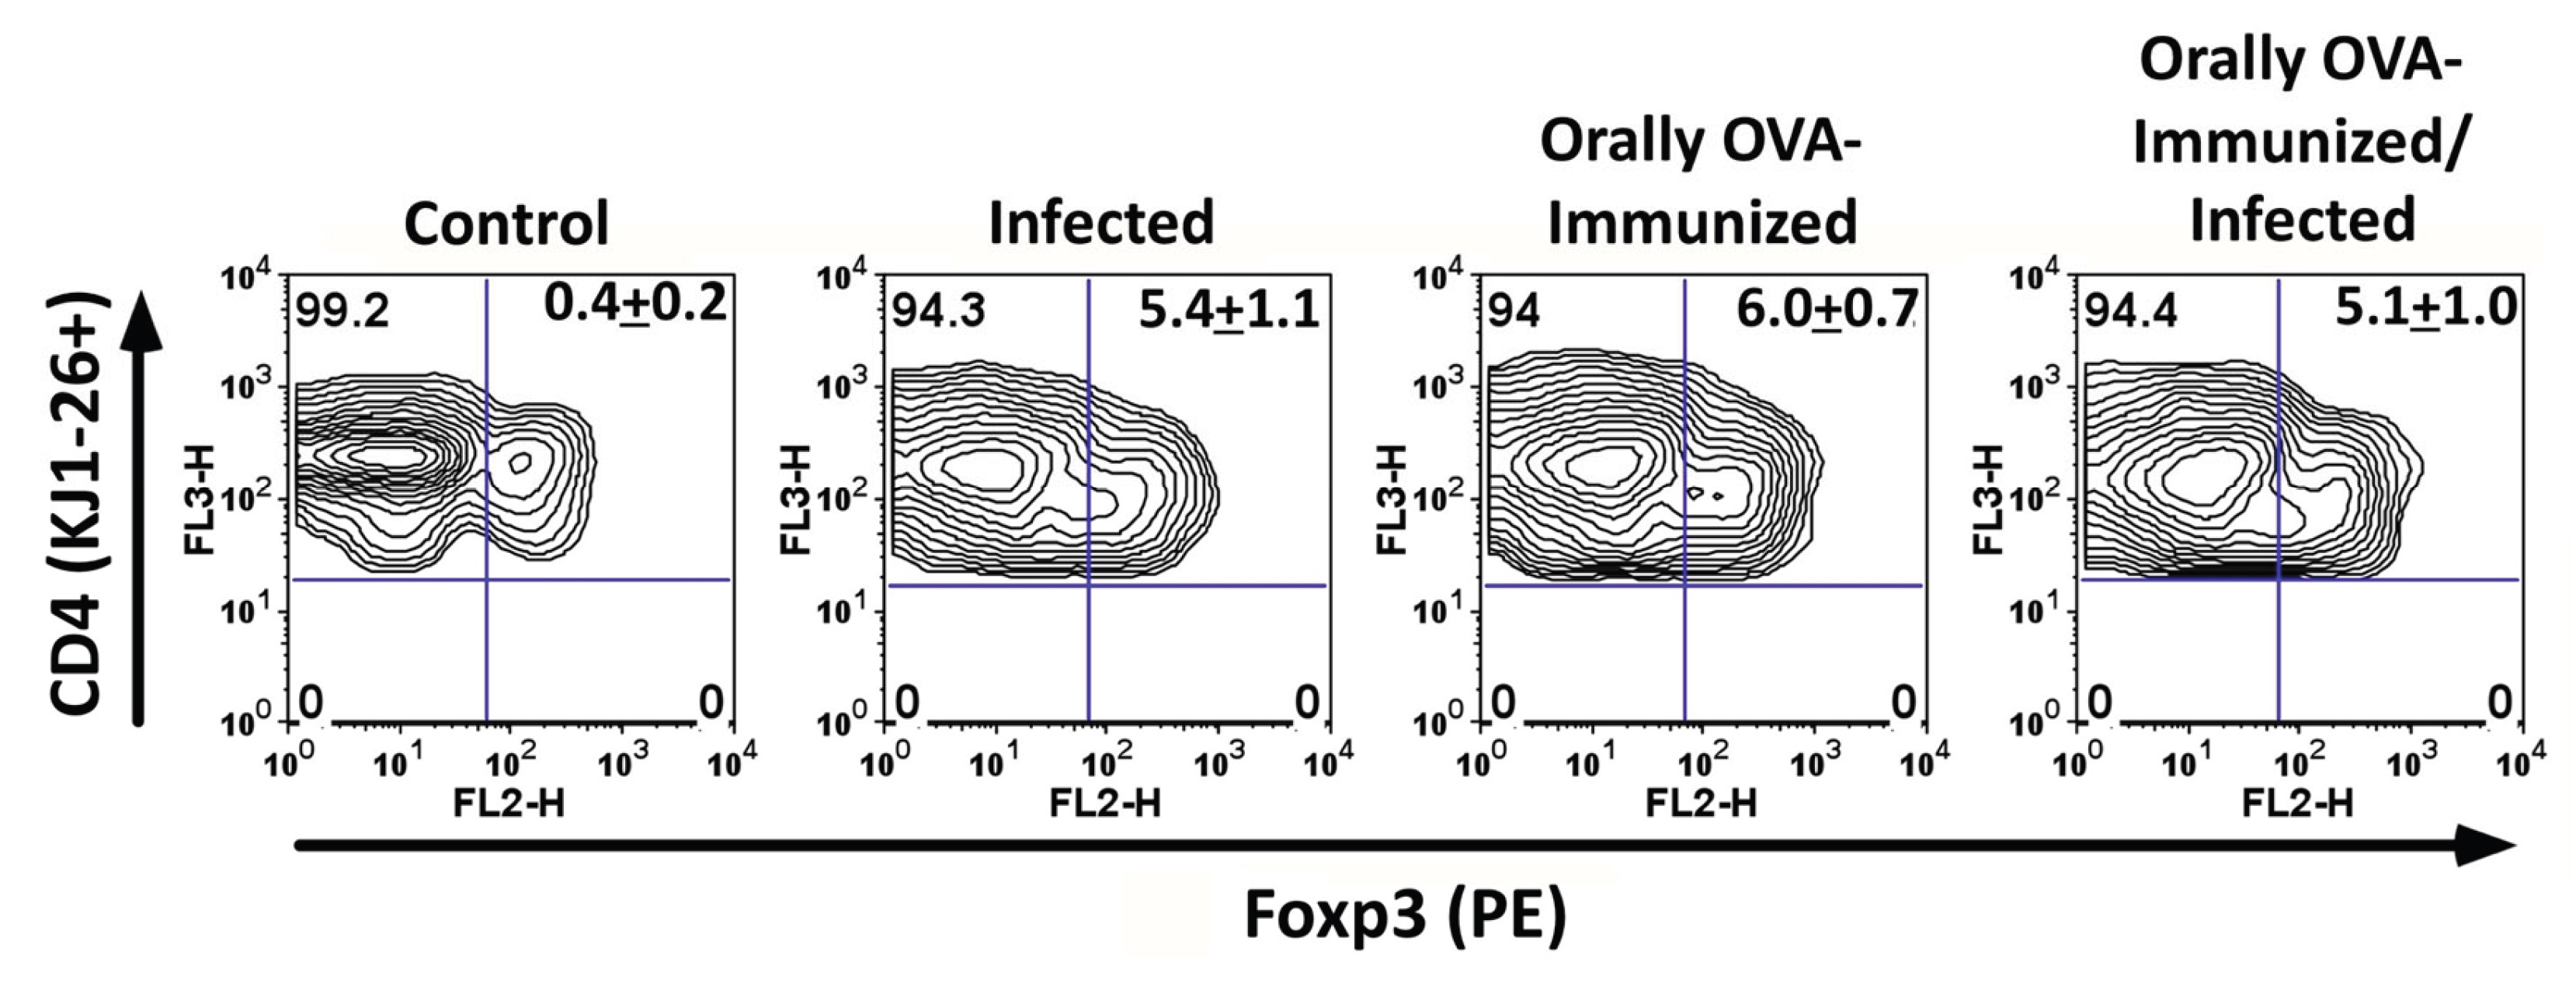
Induction of Foxp3 expression in DO11.10 CD4 T cells during infection. We also examined Foxp3 expression in DO11.10 CD4 T cells during acute T. cruzi infection. A considerable proportion of KJ1-26+ CD4 T cells upregulated Foxp3 in infected mice (Figure 5). Previous exposure to OVA also induced equivalent frequencies of transgenic T cells expressing Foxp-3, even in the presence of the infection. These results indicate that T. cruzi infection can cause the differentiation of a subset of DO11.10 CD4 T cells into regulatory T cells, potentially contributing to immune regulation during infection.
Discussion
Cross-reactivity is a well-known characteristic of CD8 T cells during T. cruzi infection [16]. However, whether CD4 T cells also exhibit cross-reactivity in this context remains unclear. In this study, we demonstrate that DO11.10 CD4 T cells specific for OVA 323–339 in the context of IAd can be activated during acute T. cruzi infection. These cells not only acquired an effector memory phenotype but also produced pro-inflammatory cytokines, including IFN-γ and TNF-α. Moreover, a subset of these cells expressed IL-10 and Foxp3, suggesting the induction of a regulatory component.
The finding that DO11.10 CD4 T cells were activated in the absence of OVA strongly supports the hypothesis that cross-reactivity extends to CD4 T cells. These results are consistent with previous work demonstrating extensive TCR cross-reactivity in CD8 T cells [4,16]. Cross-reactivity may provide the immune system with flexibility to respond to a broad range of antigens. Still, it can also lead to potentially harmful outcomes, such as autoimmune reactions or the diversion of the immune response to less important antigens [5,7,8].
It is also intriguing that upon T. cruzi infection, the CD4+DO11.10+ transgenic T cells were reduced among total CD4+ T lymphocytes. Although this result might appear paradoxical, it may suggest that transgenic T cells may be losing the TCR clonotype identified by the KJ1-26 mAb. In this case, this observation is indicative of transgenic T cell activation, because T cells may internalize their TCR upon cognate activation, as pointed out in the results section. In fact, a large number of CD4+ KJ1-26- T cells are activated and present an effector memory phenotype. In addition, one may hypothesize that mature transgenic T cells begin to reexpress RAG and thereby rearrange the endogenous alpha-chain, becoming double TCR-expressors. Although the TCR-revision has been described for some peripheral T cell populations in mice [24,25,26], it has not been shown during T. cruzi infection. It has been shown that one-third of peripheral T cells in humans are double TCR-expressors [27], and numerous studies in mice show similar findings [6]. Yet, curiously, very little information is available on the role or importance of double TCR-expressors in infections or autoimmune diseases. Regardless of the precise mechanism responsible for the downmodulation of the transgenic TCR, it was clear that a considerable proportion of CD4 T cells expressing the KJ1-26 clonotype become effector memory cells during the acute infection. This observation shows that T. cruzi antigens also activate transgenic CD4 T cells, leading them to spontaneously produce cytokines such as IFN-γ, TNF-α, IL-4, and IL-10.
Interestingly, prior oral exposure to OVA modified the cytokine profile of DO11.10 CD4 T cells during infection, increasing the proportion of IL-10-producing cells. Oral antigen administration is known to promote regulatory T cell responses, and our findings suggest that prior antigen exposure can shape the outcome of cross-reactive responses during infection [10,11,12]. This observation underscores the importance of environmental antigens in shaping immune responses to pathogens.
The induction of Foxp3 expression in DO11.10 CD4 T cells during infection further supports the idea that T. cruzi can promote the differentiation of regulatory T cells. Regulatory T cells have been implicated in modulating the balance between protective immunity and immune-mediated pathology in Chagas disease [2]. Thus, functional cross-reactivity in CD4 T cells may not only contribute to parasite persistence by diverting responses away from critical epitopes but also play a role in controlling immunopathology by favoring the appearance of Treg cells.
In summary, our results demonstrate that cross-reactivity in CD4+ T cells occurs during T. cruzi infection, a phenomenon similar to that observed in CD8+ T cells. This study expands our understanding of T cell responses in Chagas disease and suggests that both effector and regulatory outcomes of cross-reactivity may significantly influence the course of infection.
Supplementary Materials
The following supporting information can be downloaded at the website of this paper posted on Preprints.org.
Author Contributions
Conceptualization: FC and JM. Methodology: FC, JN, and JM. Formal analysis: FC, JN, and JM. Writing: JM. Supervision: FC and JM. Funding acquisition: FC and JM.
Funding
Grants from FIOCRUZ, CNPq, FAPESB, FAPERJ, and FOG funded this work.
Institutional Review Board Statement
The animal study protocol was approved by the Ethics Committee of FIOCRUZ-BA (CPqGM 015/09 and CPqGM 038/09).
Data Availability Statement
All the data is presented in the study. Crude data may be obtained from the corresponding author upon request.
Acknowledgments
We thank Bruno Bezerril Andrade for critical reading of the manuscript and precious advice.
Conflicts of Interest
The authors declare no conflicts of interest
References
- D.V. Andrade, K.J. Gollob, W.O. Dutra, Acute chagas disease: new global challenges for an old neglected disease, PLoS neglected tropical diseases 8(7) (2014) e3010.
- F. Cardillo, R.T. de Pinho, P.R. Antas, J. Mengel, Immunity and immune modulation in Trypanosoma cruzi infection, Pathogens and disease 73(9) (2015) ftv082.
- P.M. Minoprio, A. Coutinho, M. Joskowicz, M.R. D'Imperio Lima, H. Eisen, Polyclonal lymphocyte responses to murine Trypanosoma cruzi infection. II. Cytotoxic T lymphocytes, Scandinavian journal of immunology 24(6) (1986) 669-79.
- D. Mason, A very high level of crossreactivity is an essential feature of the T-cell receptor, Immunology today 19(9) (1998) 395-404.
- G. Petrova, A. Ferrante, J. Gorski, Cross-reactivity of T cells and its role in the immune system, Critical reviews in immunology 32(4) (2012) 349-72.
- N.J. Schuldt, B.A. Binstadt, Dual TCR T Cells: Identity Crisis or Multitaskers?, Journal of Immunology 202(3) (2019) 637-644.
- H.L. Lang, H. Jacobsen, S. Ikemizu, C. Andersson, K. Harlos, L. Madsen, P. Hjorth, L. Sondergaard, A. Svejgaard, K. Wucherpfennig, D.I. Stuart, J.I. Bell, E.Y. Jones, L. Fugger, A functional and structural basis for TCR cross-reactivity in multiple sclerosis, Nature immunology 3(10) (2002) 940-3.
- U. Christen, K.H. Edelmann, D.B. McGavern, T. Wolfe, B. Coon, M.K. Teague, S.D. Miller, M.B. Oldstone, M.G. von Herrath, A viral epitope that mimics a self antigen can accelerate but not initiate autoimmune diabetes, The Journal of clinical investigation 114(9) (2004) 1290-8.
- S. Sharma, P.G. Thomas, The two faces of heterologous immunity: protection or immunopathology, Journal of leukocyte biology 95(3) (2014) 405-16.
- K.D. Moudgil, S.J. Thompson, F. Geraci, B. De Paepe, Y. Shoenfeld, Heat-shock proteins in autoimmunity, Autoimmune diseases 2013 (2013) 621417.
- R. van der Zee, S.M. Anderton, A.B. Prakken, A.G. Liesbeth Paul, W. van Eden, T cell responses to conserved bacterial heat-shock-protein epitopes induce resistance in experimental autoimmunity, Seminars in immunology 10(1) (1998) 35-41.
- G. Zheng, T.T. Oo, S.S.S. Janjam, C. Ellis, S. Pallikonda Chakravarthy, S. Palani, W. Anthon, G. Tsaras, A. Williams, A. Feng, A. Chen, An antigen-less pro-vaccine for treating autoimmunity, Journal of immunology 214(7) (2025) 1477-1482.
- Y. Belkaid, T.W. Hand, Role of the microbiota in immunity and inflammation, Cell 157(1) (2014) 121-41.
- F. Cardillo, R.P. Falcao, M.A. Rossi, J. Mengel, An age-related gamma delta T cell suppressor activity correlates with the outcome of autoimmunity in experimental Trypanosoma cruzi infection, European journal of immunology 23(10) (1993) 2597-605.
- F. Cardillo, A. Nomizo, J. Mengel, The role of the thymus in modulating gammadelta T cell suppressor activity during experimental Trypanosoma cruzi infection, International immunology 10(2) (1998) 107-16.
- M.E. Bunkofske, P. Dash, W. Awad, P.G. Thomas, R.L. Tarleton, Highly cross-reactive and competent effectors dominate the CD8+ T cell response in Trypanosoma cruzi infection, Journal of immunology (2025).
- K.M. Murphy, A.B. Heimberger, D.Y. Loh, Induction by antigen of intrathymic apoptosis of CD4+CD8+TCRlo thymocytes in vivo, Science 250(4988) (1990) 1720-3.
- P. Zhou, R. Borojevic, C. Streutker, D. Snider, H. Liang, K. Croitoru, Expression of dual TCR on DO11.10 T cells allows for ovalbumin-induced oral tolerance to prevent T cell-mediated colitis directed against unrelated enteric bacterial antigens, Journal of immunology 172(3) (2004) 1515-23.
- J. Nihei, F. Cardillo, J. Mengel, The Blockade of Interleukin-2 During the Acute Phase of Trypanosoma cruzi Infection Reveals Its Dominant Regulatory Role, Frontiers in cellular and infection microbiology 11 (2021) 758273.
- F. Cardillo, F.Q. Cunha, W.M. Tamashiro, M. Russo, S.B. Garcia, J. Mengel, NK1.1+ cells and T-cell activation in euthymic and thymectomized C57Bl/6 mice during acute Trypanosoma cruzi infection, Scandinavian journal of immunology 55(1) (2002) 96-104.
- W. Lai, M. Yu, M.N. Huang, F. Okoye, A.D. Keegan, D.L. Farber, Transcriptional control of rapid recall by memory CD4 T cells, Journal of immunology 187(1) (2011) 133-40.
- Saparov, L.A. Kraus, Y. Cong, J. Marwill, X.Y. Xu, C.O. Elson, C.T. Weaver, Memory/effector T cells in TCR transgenic mice develop via recognition of enteric antigens by a second, endogenous TCR, International immunology 11(8) (1999) 1253-64.
- M.M. Lemaire, L. Dumoutier, G. Warnier, C. Uyttenhove, J. Van Snick, M. de Heusch, M. Stevens, J.C. Renauld, Dual TCR expression biases lung inflammation in DO11.10 transgenic mice and promotes neutrophilia via microbiota-induced Th17 differentiation, Journal of immunology 187(7) (2011) 3530-7.
- E. Kondo, H. Wakao, H. Koseki, T. Takemori, S. Kojo, M. Harada, M. Takahashi, S. Sakata, C. Shimizu, T. Ito, T. Nakayama, M. Taniguchi, Expression of recombination-activating gene in mature peripheral T cells in Peyer's patch, International immunology 15(3) (2003) 393-402.
- C.J. McMahan, P.J. Fink, RAG reexpression and DNA recombination at T cell receptor loci in peripheral CD4+ T cells, Immunity 9(5) (1998) 637-47.
- P. Serra, A. Amrani, B. Han, J. Yamanouchi, S.J. Thiessen, P. Santamaria, RAG-dependent peripheral T cell receptor diversification in CD8+ T lymphocytes, Proceedings of the National Academy of Sciences of the United States of America 99(24) (2002) 15566-71.
- E. Padovan, G. Casorati, P. Dellabona, S. Meyer, M. Brockhaus, A. Lanzavecchia, Expression of two T cell receptor alpha chains: dual receptor T cells, Science 262(5132) (1993) 422-4.
Figure 1.
Quantitation of splenic DO11.10 transgenic CD4+ T cells bearing the TCR clonotype, identified by the KJ1-26 mAb. Figure 1A shows dot plots and histograms from spleen cells from uninfected control, infected, OVA-immunized, and OVA-immunized/infected transgenic mice obtained on day 25th of infection. Representative dot plots and histograms from one animal per group are depicted. Figure B shows the frequencies of splenic CD4+ (closed circles) and CD4+KJ1-26+ T cells (closed squares) from individual animals in different groups. Experiments were repeated three times, on other occasions, with similar results. The Mann-Whitney test was used to compare two distinct groups of mice (*P < 0.05, **P < 0.01).
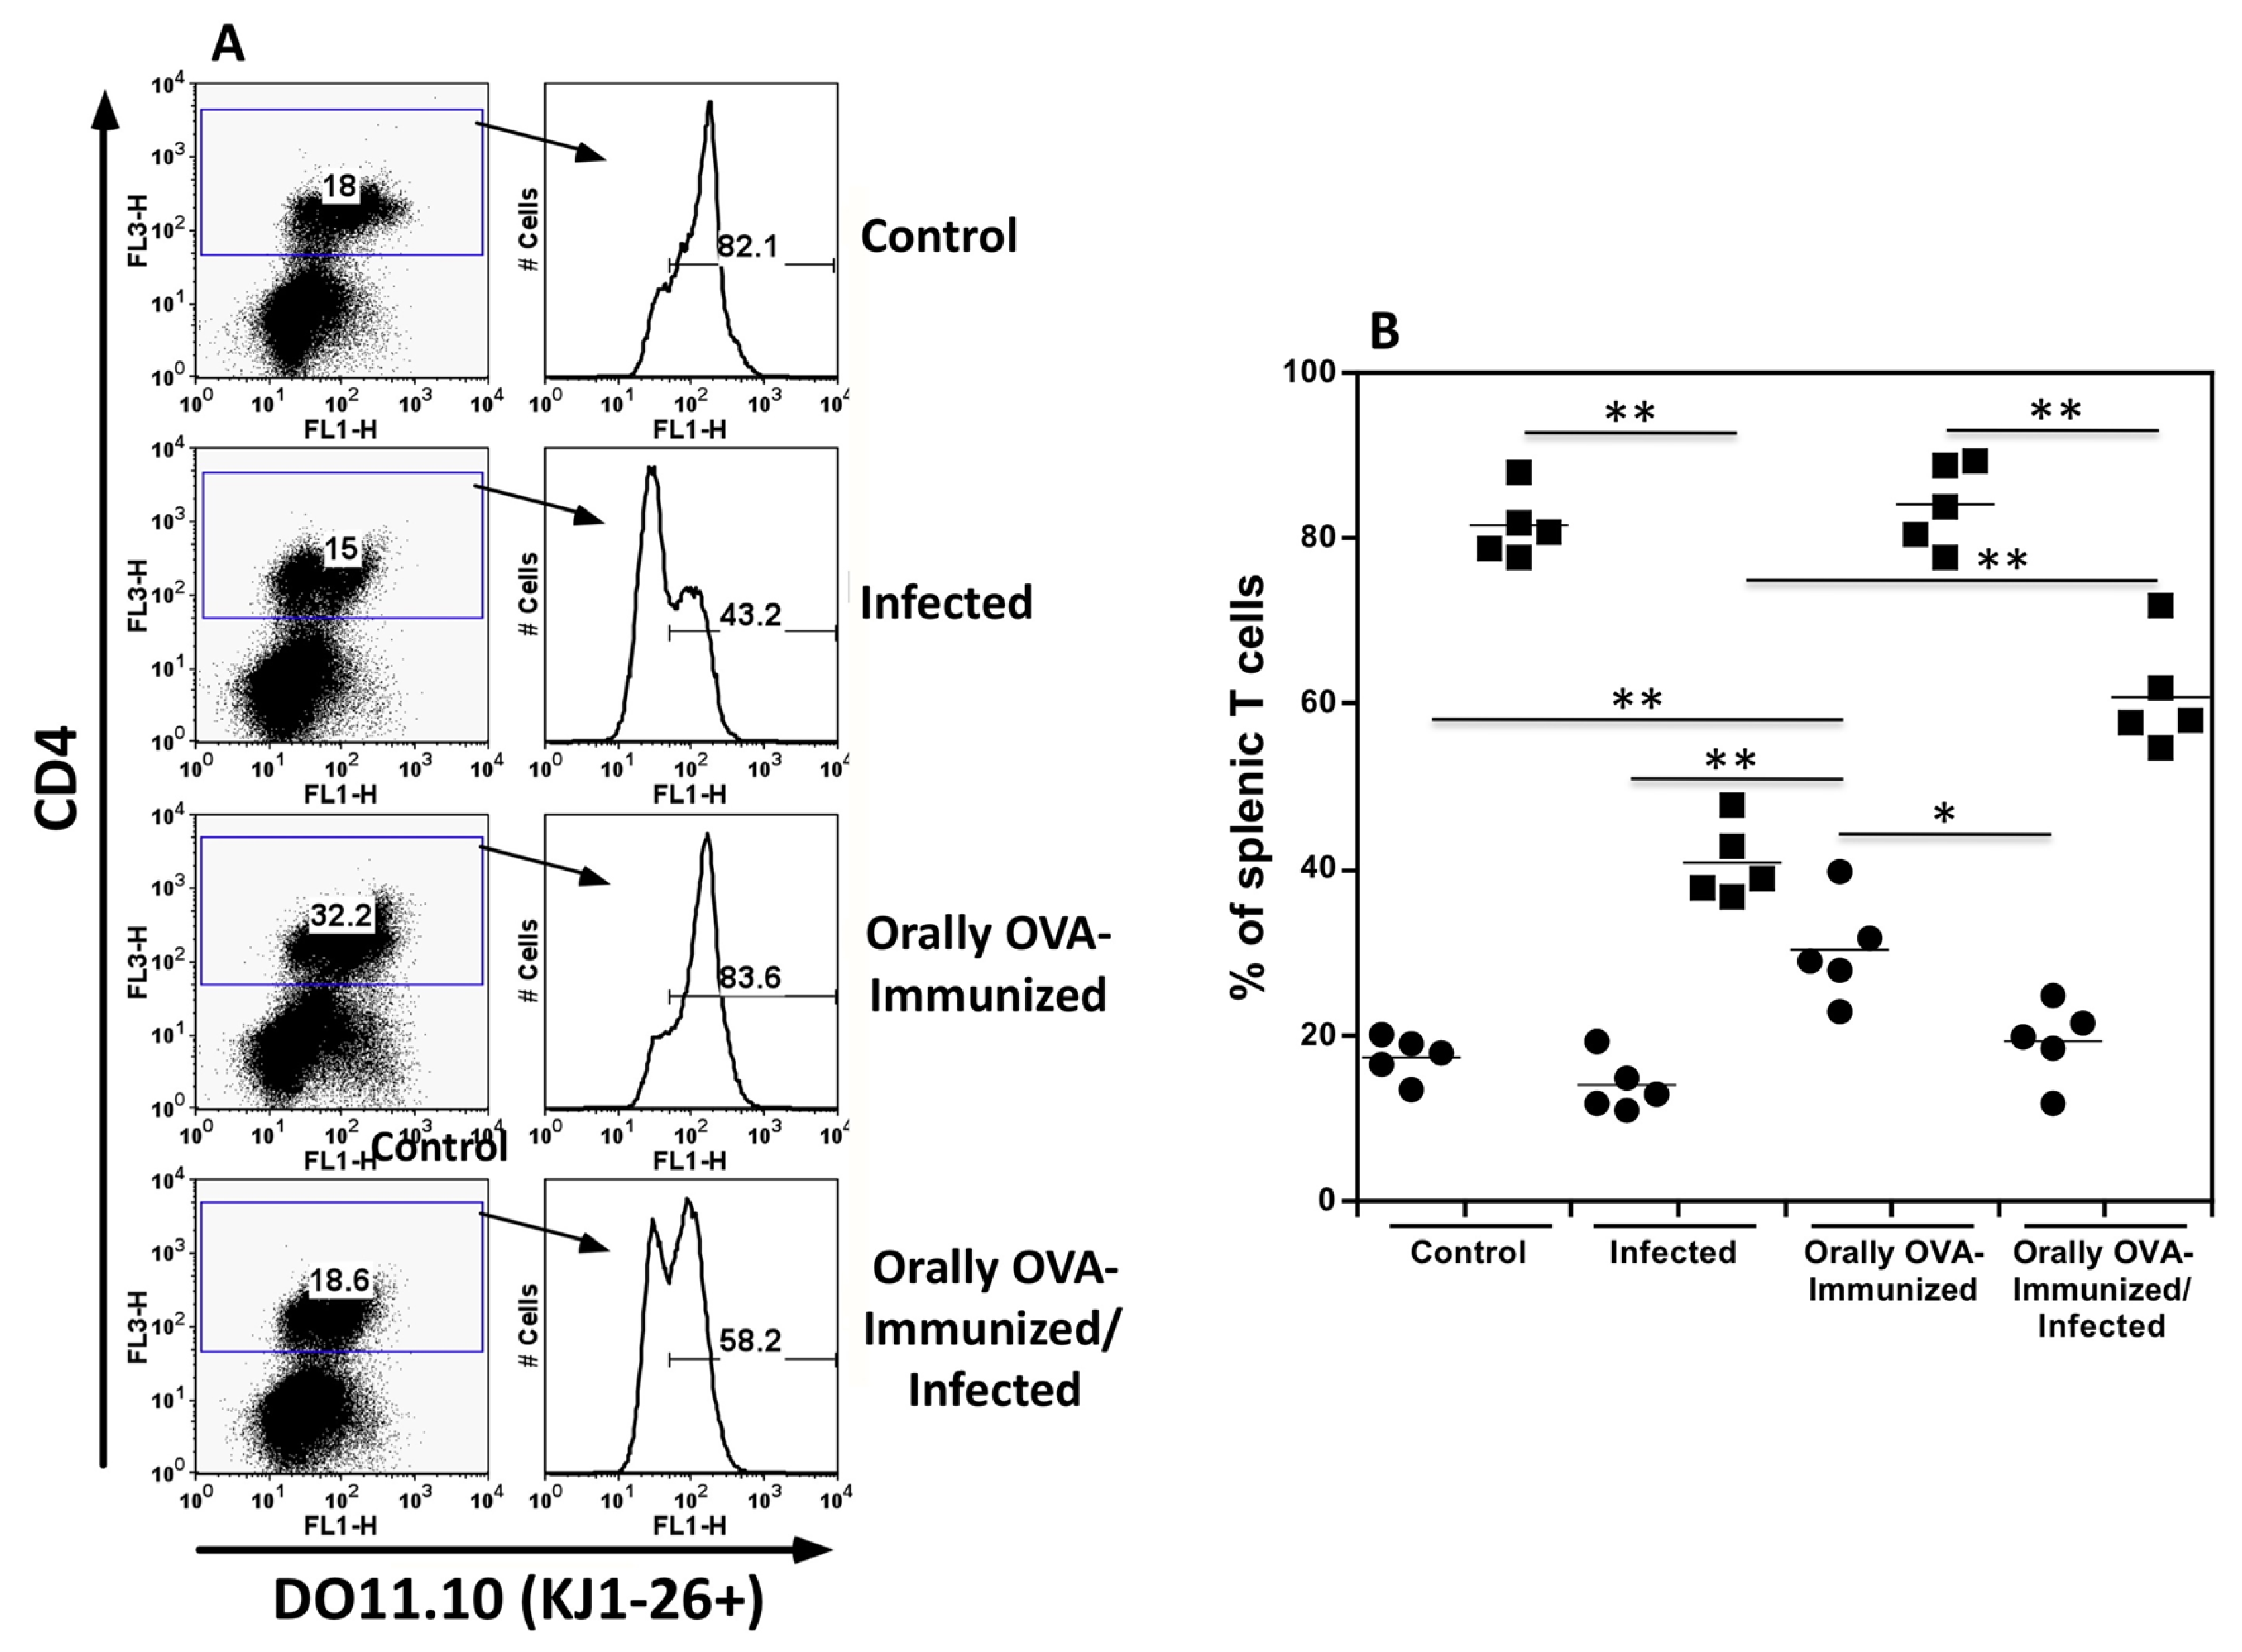
Figure 2.
Quantitation of central and effector memory splenic DO11.10 transgenic CD4+ T cells. Spleen cells from uninfected control, infected, OVA-immunized, and OVA-immunized/infected transgenic mice obtained on day 22nd of infection were studied. In Figure 2A, each dot plot represents one mouse from the same experiment. Central memory transgenic KJ1-26+ T cells were defined by the expression of high levels of CD44 and CD62L, whereas effector memory T cells were characterized by high CD44 expression and were negative for CD62L (Figure 2A). In Figure 2B, the percentages of central (closed triangles) and effector (closed diamonds) memory KJ1-26+CD4+ T cells are shown among groups. In these experiments, CD4 spleen cells from individual mice were magnetically sorted after staining with an APC-labeled CD4 monoclonal antibody (mAb) and anti-APC microbeads. Groups were of five mice each. The Mann-Whitney test was used to compare two different groups of mice. (**P < 0.01).
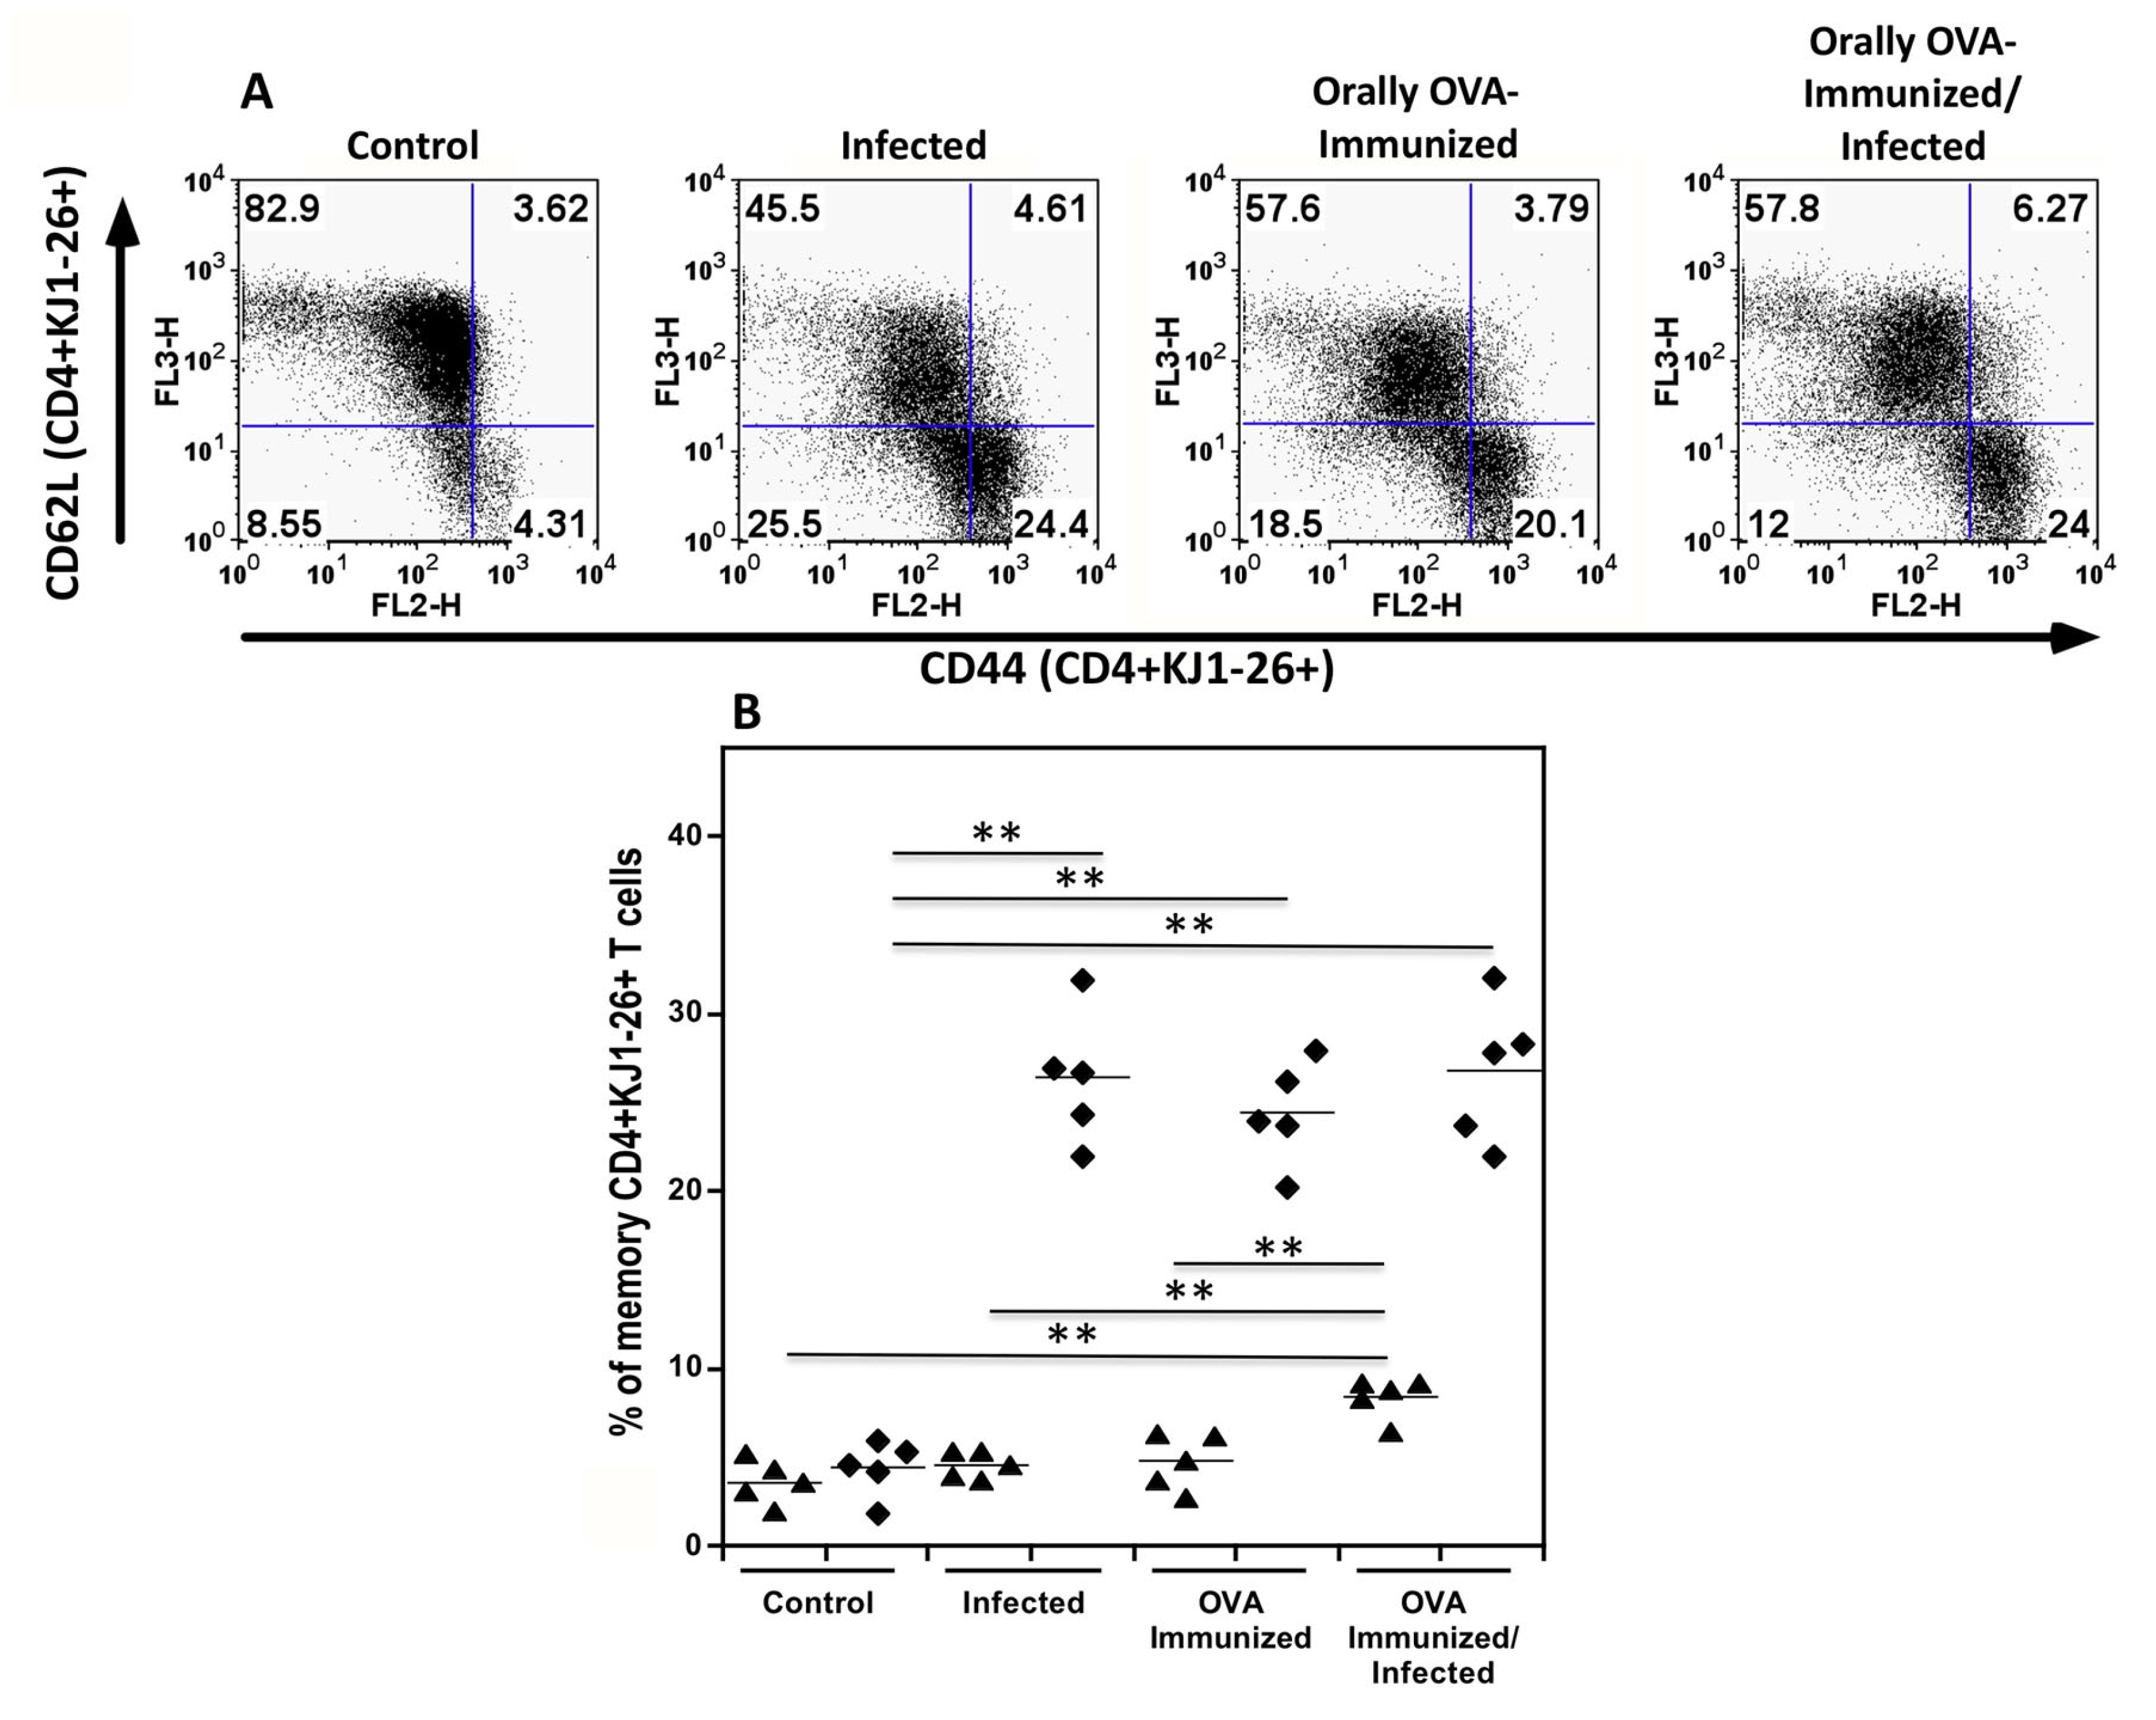
Figure 3.
The frequencies of DO11.10 transgenic T cells expressing TNF- and IFN-γ increased during acute T. cruzi infection. The upper set of histograms shows the percentage of splenic TNF-α-producer CD4+ KJ1-26+ T cells from the different experimental groups. The lower set of histograms represents the percentage of DO11.0 transgenic T cells producing IFN-γ. To establish the lower limits for TNF or IFN--expression, a negative control was established using isotype mAb controls (red line histogram). Numbers in the right upper corner of each histogram represent the mean of the percentage of TNF-- or IFN--producer cells + SD. Illustrative histograms from one animal for each experimental group are shown. Spleen cells from control (C), infected (I), OVA-immunized (O-I), and OVA-immunized/infected (O-I/I) transgenic mice were cultured in complete medium for 24 hours. Brefeldin A was added for the last 6 hours before cell harvesting. Experiments were conducted 23 days after initial infection. Mice were analyzed individually (n = 5 per group). A total of three independent experiments were performed with similar results. Two groups were compared, using the Mann-Whitney test (P < 0.05 was considered statistically significant). Comparison among different groups for TNF-α data (C x I, P < 0.01; C x O-I, P < 0.01; C x O-I/I, P < 0.01). Comparison among different groups for IFN- data (C x I, P < 0.01; C x O-I, P < 0.01; C x O-I/I, P < 0.01; I x O-I/I, P < 0.05).
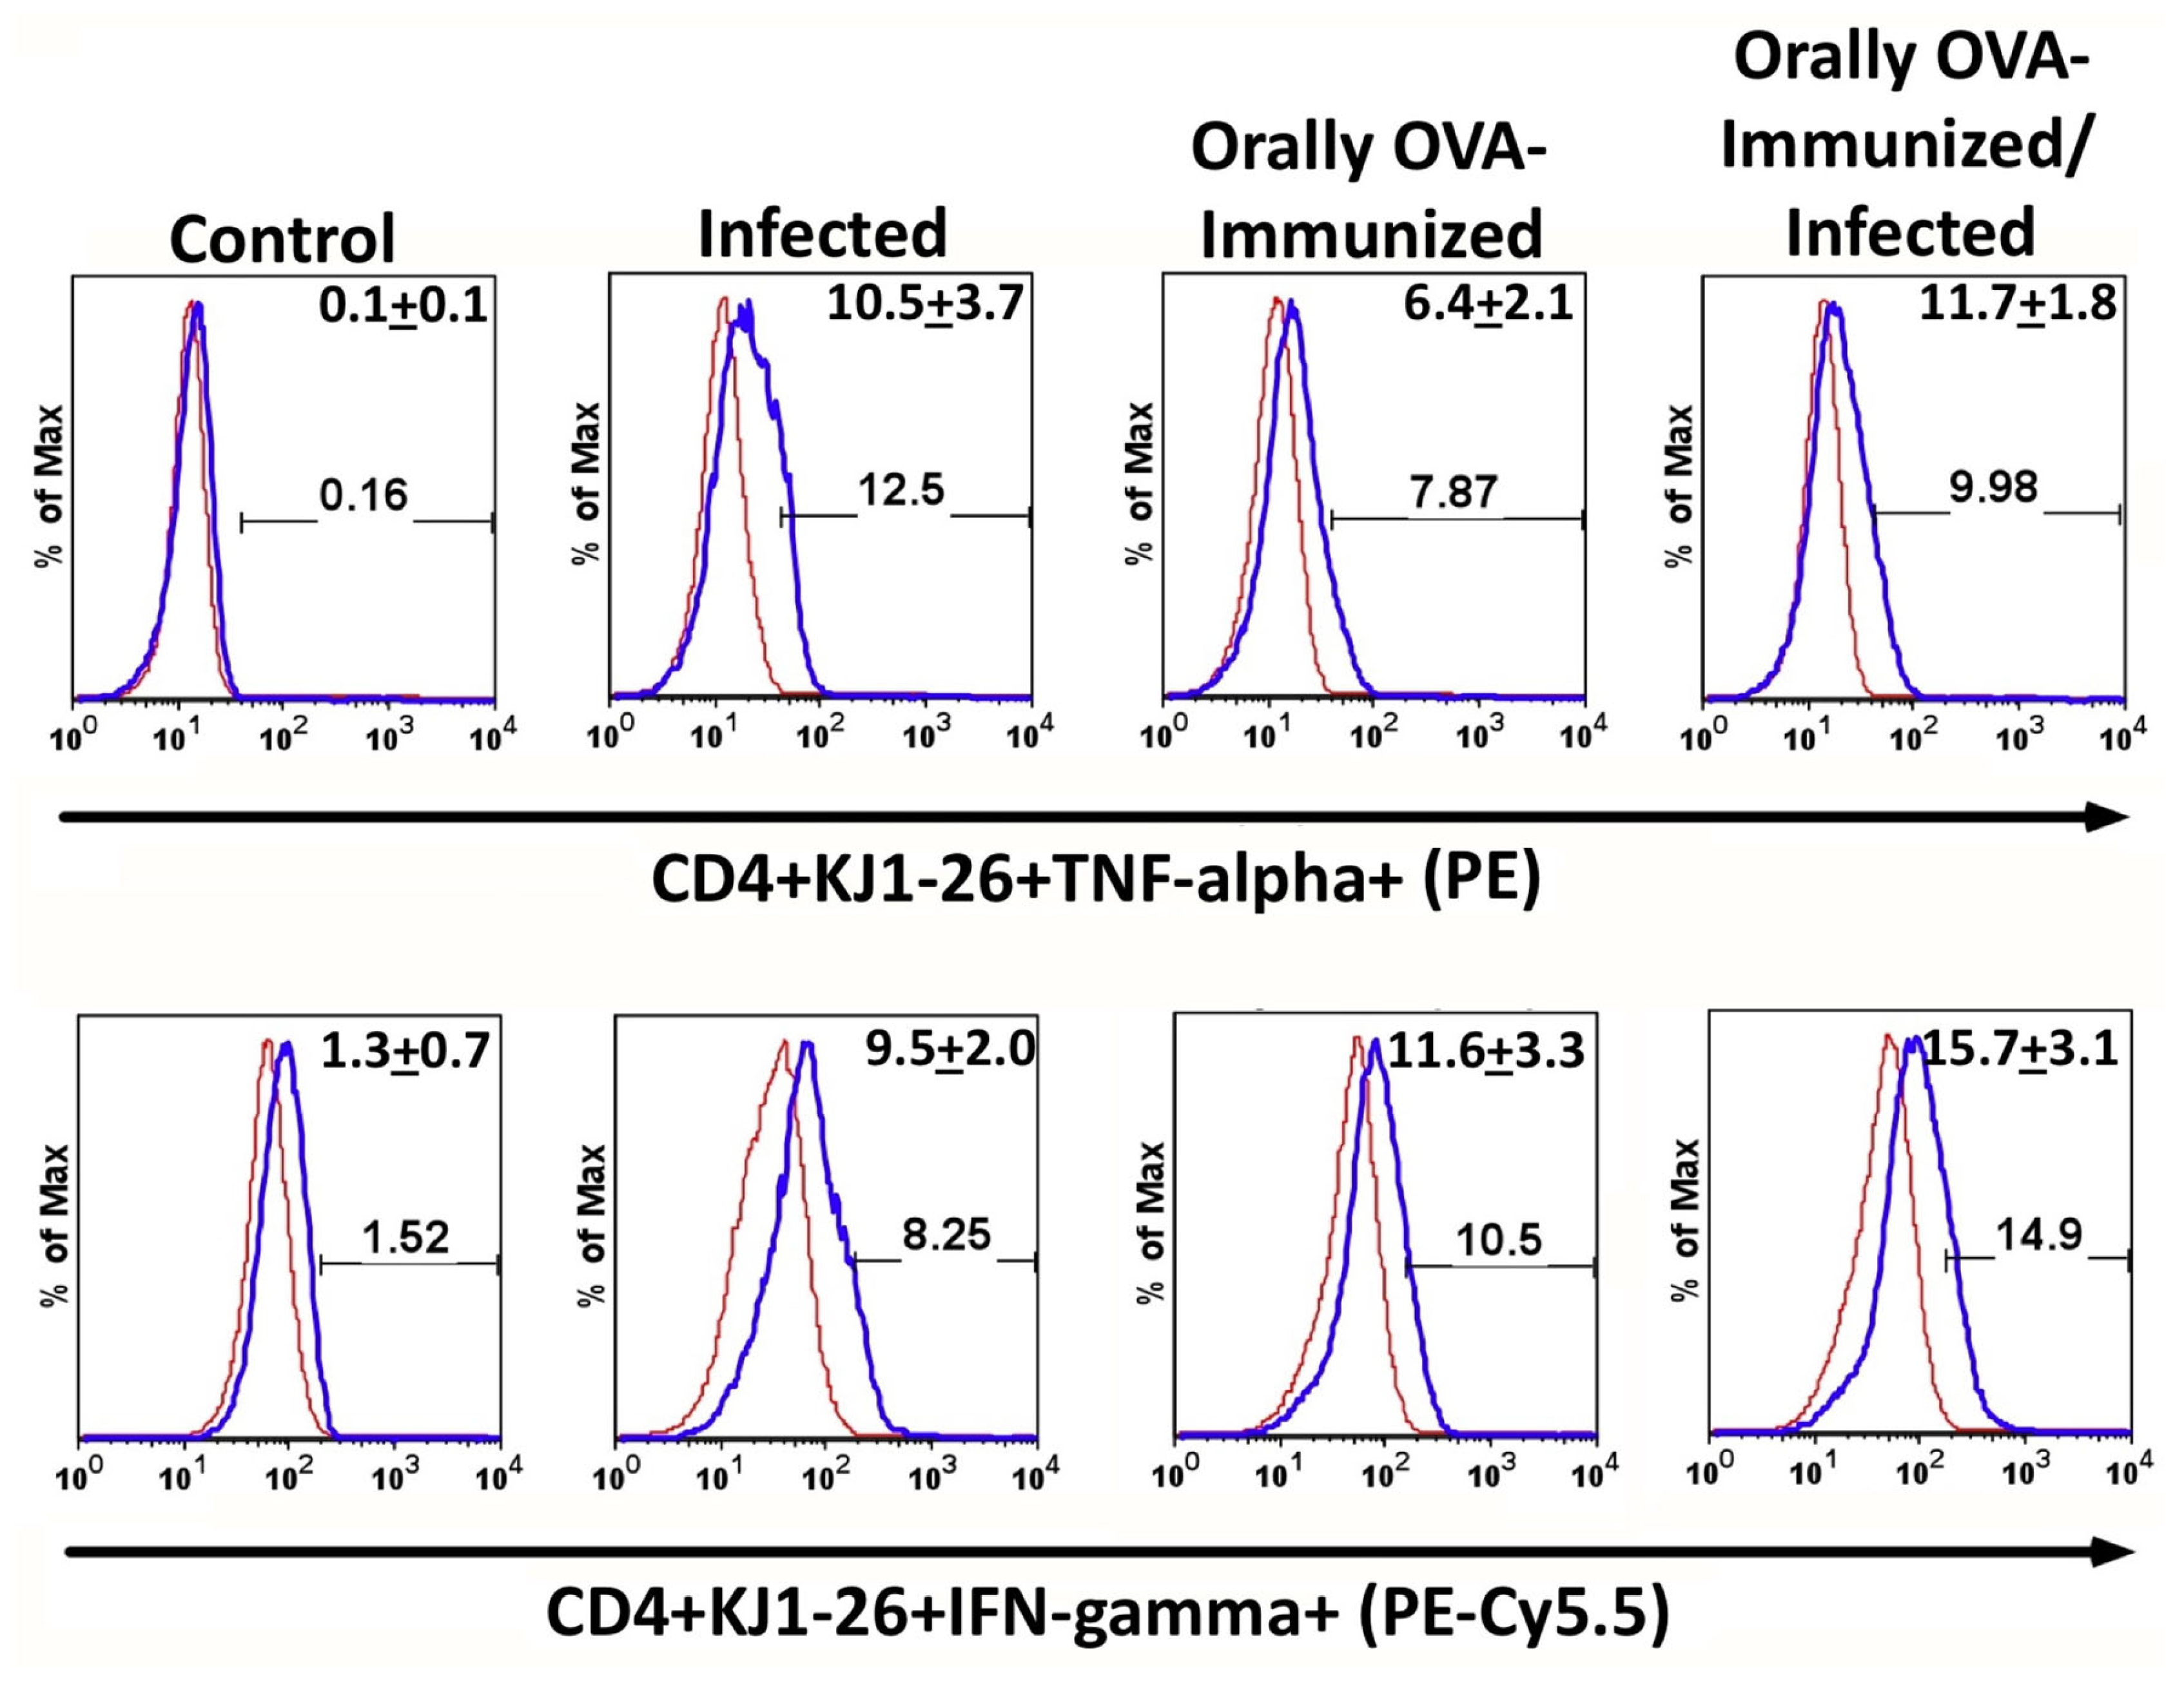
Figure 4.
Production of IL-4 and IL-10 by DO11.10 transgenic T cells upon T. cruzi infection. The upper and lower sets of histograms show the percentage of splenic IL-4 or IL-10-producing CD4+ KJ1-26+ T cells from the different experimental groups, respectively. To set the lower limits for IL-4 and IL-10 expression, a negative control was established using isotype-matched mAbs (red histogram). Numbers in the right upper corner of each histogram represent the mean of the percentage of IL-4 or IL-10 producer cells + SD. Illustrative histograms from one animal for each experimental group are shown. Spleen cells from control (C), infected (I), OVA-immunized (O-I), and OVA-immunized/infected (O-I/I) transgenic mice were cultured in complete medium for 24 hours. Brefeldin A was added for the last 6 hours before cell harvesting. Experiments were conducted 23 days after initial infection. Mice were analyzed individually (n = 5 per group). A total of three independent experiments were performed with similar results. Two groups were compared, using the Mann-Whitney test (P < 0.05 was considered statistically significant). Comparison among different groups for IL-4 data (C x I, P < 0.01; C x O-I, P < 0.01; C x O-I/I, P < 0.01; I x O-I, P < 0.01; I x O-I/I, P < 0.01). Comparison among different groups for IL-10 data (C x I, P < 0.0001; C x O-I, P < 0.0001; C x O-I/I, P < 0.0001; I x O-I, P < 0.01; I x O-I/I, P < 0.01).
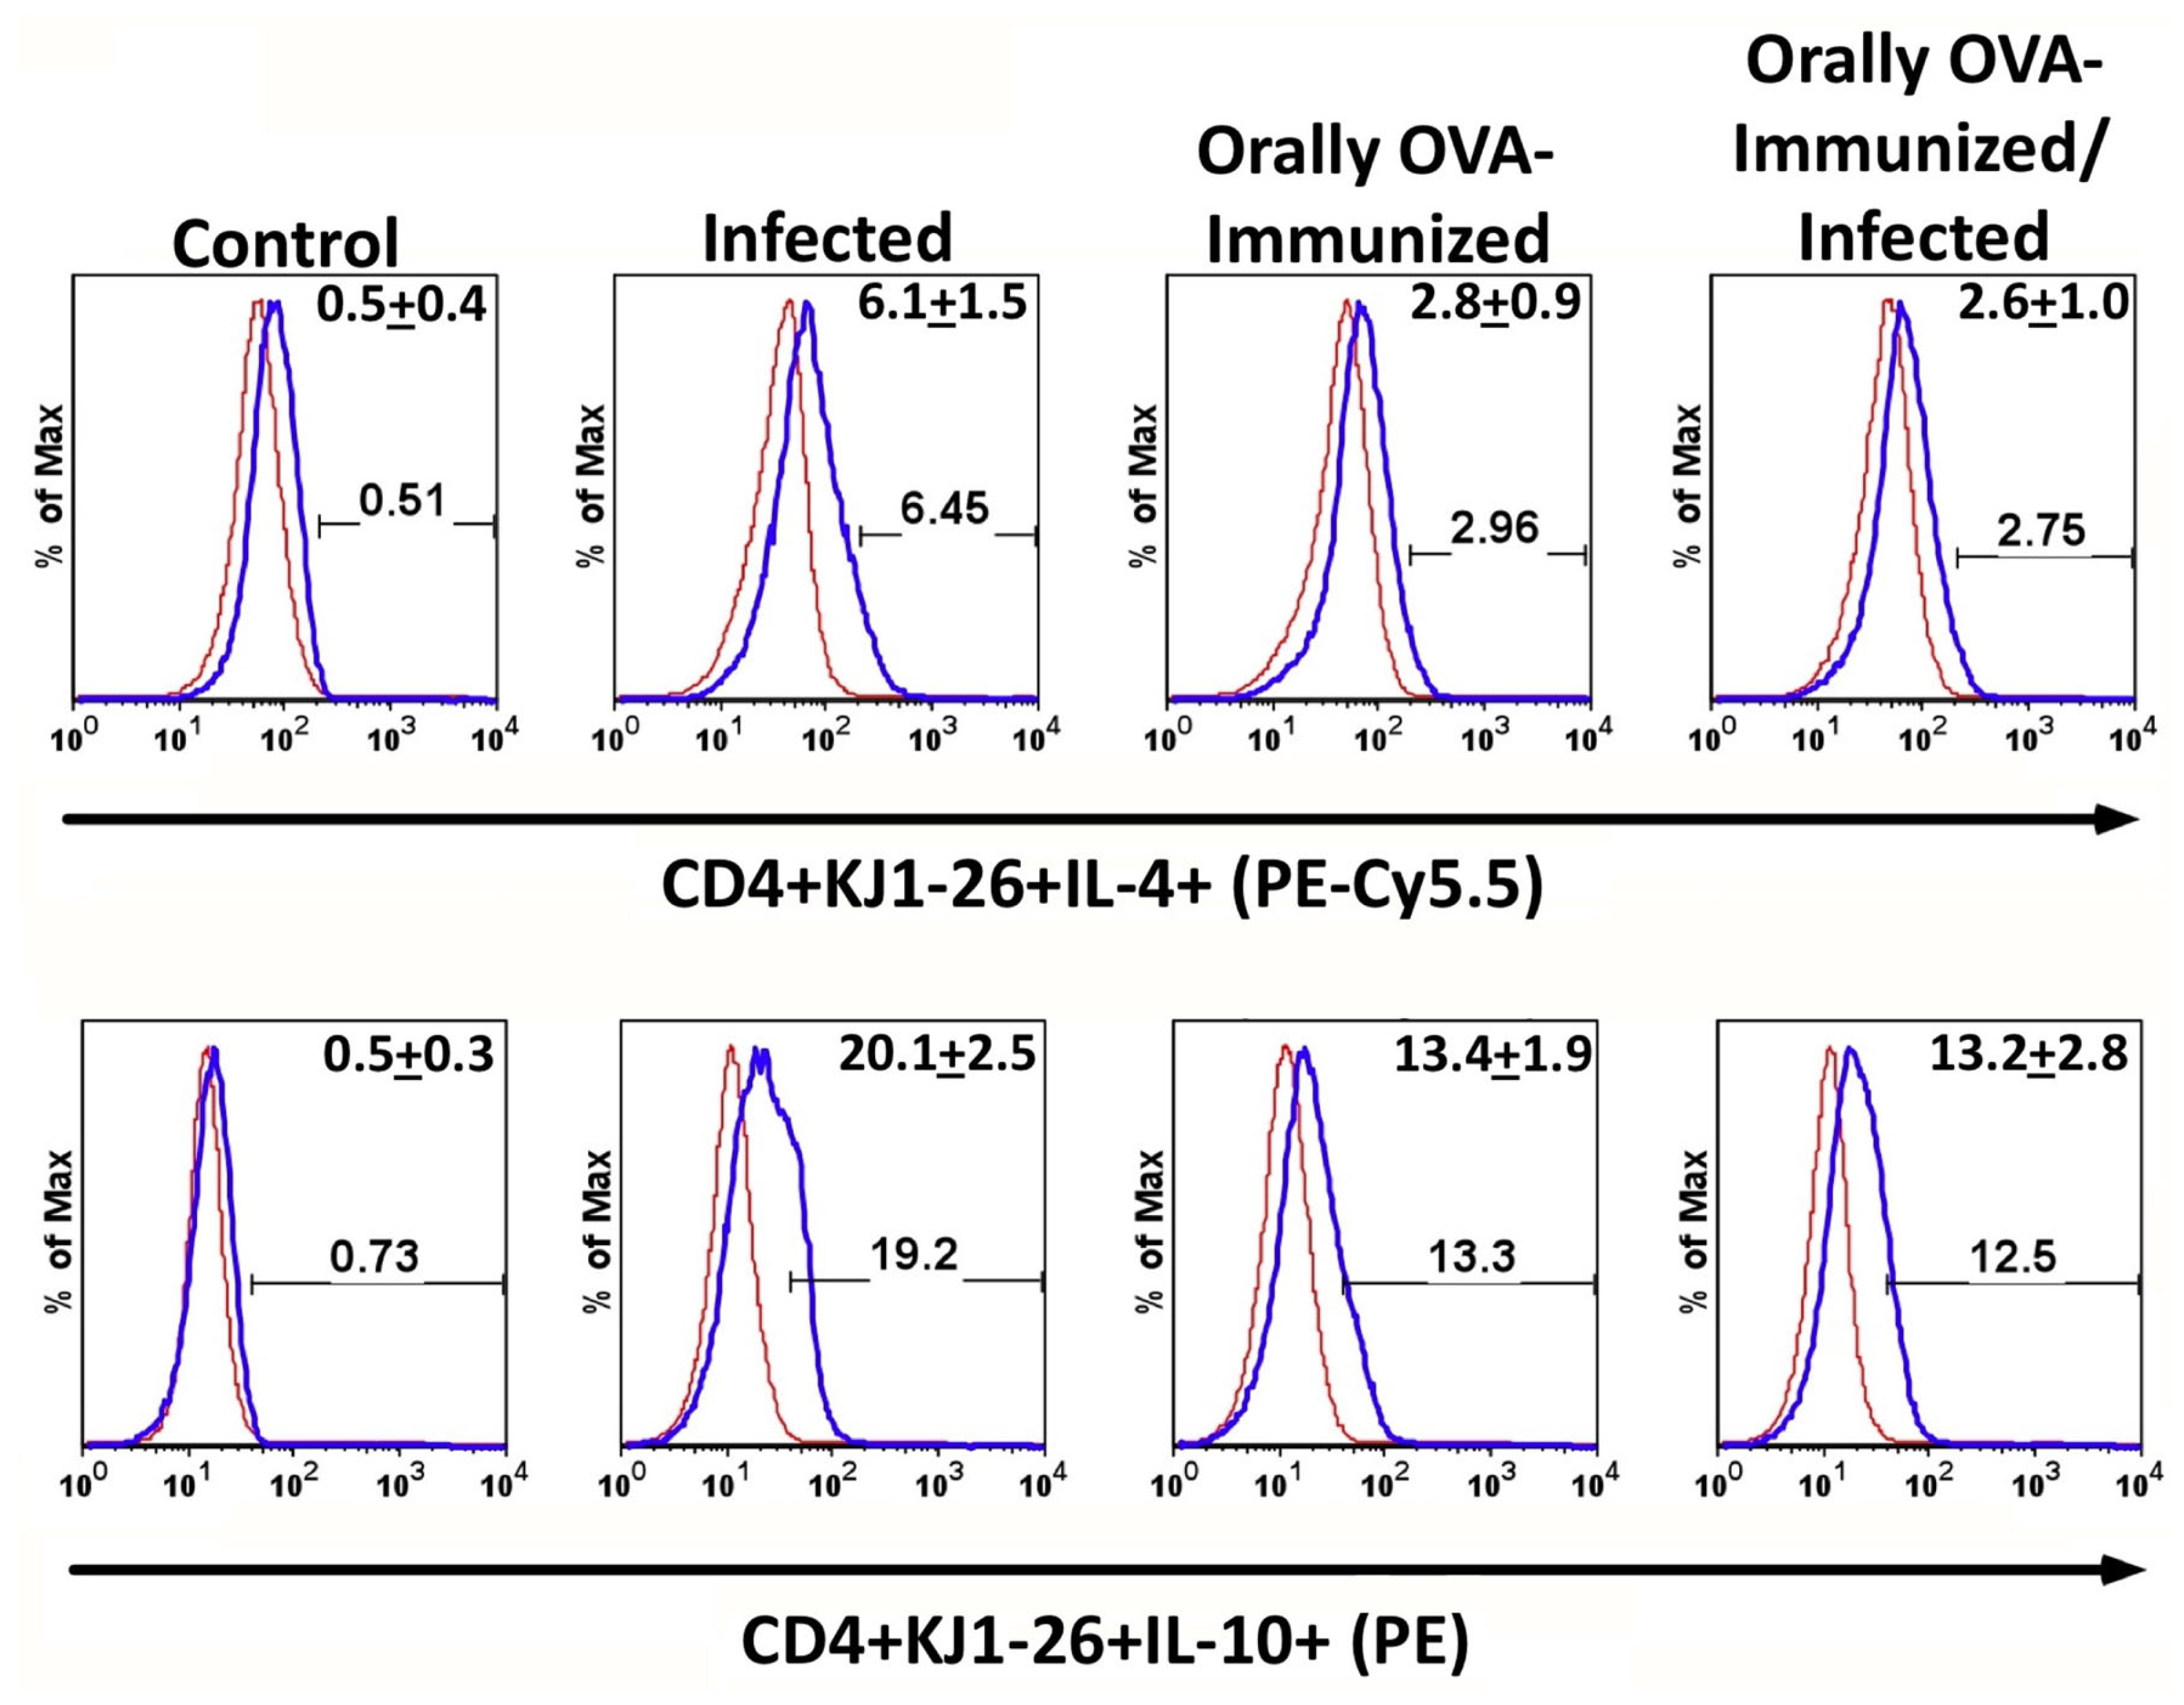
Figure 5.
The number of splenic CD4+KJ1-26+Foxp3+ T cells increased after T. cruzi infection. In Figure 5, representative plots depicting the percentages of splenic CD4+KJ1-26+Foxp3+ T cells are shown. Mice were used on day 25 after T. cruzi inoculation. Numbers in the upper right quadrant represent mean + SD of the percentage of Foxp3+ T cells in the CD4+KJ1-26+ splenic T cells in each experimental group. No significant differences were found among the experimental groups. However, infected, OVA-immunized, and OVA-immunized/infected transgenic mice showed higher percentages of Foxp3+ transgenic T cells compared to uninfected, unimmunized controls. Animals were analyzed individually (n = 5 per group). Experiments were repeated on three occasions (days 22 and 25, after infection) with similar results (P < 0.01, Mann-Whitney test).
Disclaimer/Publisher’s Note: The statements, opinions and data contained in all publications are solely those of the individual author(s) and contributor(s) and not of MDPI and/or the editor(s). MDPI and/or the editor(s) disclaim responsibility for any injury to people or property resulting from any ideas, methods, instructions or products referred to in the content. |
© 2025 by the authors. Licensee MDPI, Basel, Switzerland. This article is an open access article distributed under the terms and conditions of the Creative Commons Attribution (CC BY) license (http://creativecommons.org/licenses/by/4.0/).
Copyright: This open access article is published under a Creative Commons CC BY 4.0 license, which permit the free download, distribution, and reuse, provided that the author and preprint are cited in any reuse.


