Submitted:
14 August 2025
Posted:
15 August 2025
You are already at the latest version
Abstract
In this study, we report the exceptional observations of amplified eastward subauroral polarization streams (SAPS) made in the topside ionosphere near magnetic midnight during 2015-2016 in 17 events. Our results show the eastward SAPS flows streaming sunward after magnetic midnight and antisunward before magnetic midnight: in concert with the duskward-intruding dawn convection cell. These demonstrate that the eastward SAPS flow’s amplification was primarily caused by (1) the extension of equatorward-directed convection electric field (EC) to subauroral latitudes. Further evidence is provided by one set of correlated magnetosphere-ionosphere (M-I) conjugate observations showing (2) the inward (earthward) EC field near the inner-magnetosphere plasmapause (on the tailward side) and the emerging eastward SAPS in the topside ionosphere and thus implying (3) the EC field’s mapping-down and propagation to subauroral latitudes in the coupled M-I system. In the topside ionosphere, the amplified eastward SAPS flow reached ~3000 m/s in magnitude within the deep plasma density trough, where the electron temperature maximized at ~7000 K. There, (4) the underlying positive feedback mechanisms created favorable ionospheric conditions for SAPS growth. Finally, we conclude that the combination of these (1-4) mechanisms played a crucial role in the amplification of the near-midnight eastward SAPS flows observed.
Keywords:
topside ionosphere
; inner magnetosphere
; magnetosphere–ionosphere coupling
; polar convection
; convection E fields
; eastward SAPS
; westward SAPS
; positive feedback mechanisms
1. Introduction
1.1. Subauroral Plasma Flows
Subauroral plasma flows are the phenomena of the ionosphere’s subauroral region and are known as Subauroral Polarization Streams (SAPS) [1] and Subauroral Ion Drifts (SAID) [2] or Polarization Jets (PJs) [3]. At subauroral latitudes, the ionosphere plasma is set into motion by the E × B drift created by the interaction of subauroral polarization electric (E) field and geomagnetic B field [4,5,6]. In the dusk and nighttime magnetic local time (MLT) sectors, where the subauroral polarization E field is poleward directed, this zonal E × B drift is westward directed and drives the broader (3o-5o in magnetic latitude (MLAT)) and weaker (< 1200 m/s) westward SAPS [7] and the narrower (1o-2o) and stronger (> 1200 m/s) westward SAID/JP [8,9]. On the dawnside, where the subauroral polarization E field is equatorward directed, this zonal E × B drift is eastward directed and drives the eastward SAPS [10,11]. Both the westward SAPS flow in the dusk sector and the eastward SAPS flow in the dawn sector commonly stream sunward: in concert with the polar convection generated by the convection E field that couples the magnetosphere (M) to the ionosphere (I) and drives the plasma in the coupled M-I system (see details in section 1.2).
Even the above-mentioned earliest studies reported the development of westward subauroral flows soon (~10 min) after substorm onsets implying their fast-time development on a short timescale. But controversially, the traditional voltage generator (VG) [12] and current generator (CG) [9] theories invoke inherently slow processes unfolding in a timescale of few hours. These include the slow convective motion of hot plasmasheet plasma in the VG scenario and the slow buildup of partial ring current in the CG scenario. Furthermore, according to these traditional generator theories, SAPS and SAID develop in the same way in a VG or CG setting.
However, based on recently available multi-instrument and multi-point satellite observations, providing observational evidence, the recent studies of Mishin [13 and references therein] show that SAPS and SAID develop differently and in different MLT sectors, and the underlying physical mechanisms negate the traditional VG and CG theories. Put forward by the novel fast-time SAPS and SAID development theories of Mishin [13 and references therein], both SAPS [14,15] and SAID [16] develop in their respective different voltage generators on a short timescale. While SAID flows develop in a fast-time voltage generator (VGFT) that is an inherent part of the short-circuiting loop [13], SAPS flows develop in a magnetospheric voltage generator (VGM) [15] that is an integral part of the substorm current wedge 2-loop system (SCW2L) [17]. At the substorm expansion phase onset, when the cross-tail currents become disrupted and diverted (permitting dipolarization and associated substorm-onset-related particle injections), the SCW starts developing in the magnetotail on the dawnside or duskside as the substorm onset occurs on the dawnside or duskside [18,19]. Overall, the SCW2L system is created by the earthward/lower latitude loop of region 2 (R2) and tailward/higher latitude loop of R1 field-aligned currents (FACs). At the leading edge of the duskward expanding SCW, the inner-magnetosphere outward SAPS E field develops on the duskside as an inherent part of the SCW2L system, which demands the closure of upward (↑) R1 and downward (↓) R2 FACs via meridional currents associated with the emerging outward SAPS E field [15]. In the ionosphere, the poleward SAPS E field develops at the leading edge of the westward travelling surge (WTS) [20,21], which is the ionospheric signature of the duskward expanding SCW’s leading edge. There, the poleward directed meridional Pedersen currents require a meridional poleward directed SAPS E field in order to close the duskside ↓R2-↑R1 FACs in the subauroral region [15].
In our recent study [11], we provided observational evidence supporting the fast-time development of eastward SAPS on the dawnside, at the leading edge of the dawnward expanding SCW and soon after the dawnside substorm onset. We also provided explanation by applying the fast-time duskside SAPS development theory of Mishin [14,15] to the dawnside. Accordingly, at the leading edge of the dawnward expanding SCW, the inner-magnetosphere inward SAPS E field develops on the dawnside as an inherent part of the SCW2L system, which demands the closure of dawnside ↓R1-↑R2 FACs via meridional currents associated with the emerging inward SAPS E field. In the ionosphere, the equatorward SAPS E field develops at the leading edge of the dawnward expanding SCW, where the equatorward directed meridional Pedersen currents require an equatorward directed SAPS E field in order to close the dawnside ↑R2-↓R1 FACs in the subauroral region [10,11].
1.2. Plasma Convection in the Coupled M-I System
In the magnetosphere, the plasma convection’s ultimate driver is the interplanetary electric field (IEF) generated by the magnetized solar wind velocity’s impact on the Earth’s magnetic B field. Powered by magnetopause reconnection on the dayside and magnetotail reconnection on the nightside, the plasma circulation in the magnetosphere can be described by the Dungey cycle [22], where tangential stress drives the magnetospheric convection via a dawn-to-dusk convection E field (EDawn-Dusk), of which magnitude is ~10% of the IEF [23]. The EDawn-Dusk field is a result of the higher (+) dawnside and lower (-) duskside electrostatic potentials developed in the magnetosphere [24]. Both the shape and the location of the plasmapause are determined by the net effect of the interacting EDawn-Dusk and co-rotation E field [24,25]. In the magnetosphere, the Dungey cycle [22] starts with dayside magnetopause reconnection creating open magnetic field lines, which are convected from the dayside to the nightside, and ends with nightside magnetotail reconnection when the open magnetic field lines are closed and then returned to the dayside in order to complete the cycle.
In the ionosphere, the Dungey cycle is manifested as a two-cell polar convection pattern depicted by a dusk cell and dawn cell. Between these two convection cells, antisunward flows stream across the polar cap from magnetic midday to midnight on open magnetic field lines. Along the lower-latitude regions of these two convection cells, sunward flows stream from midnight to midday as return flows on closed magnetic field lines. These return flows transport the ionospheric plasma at auroral and subauroral latitudes [26,27,28]. However, the two-cell polar convection pattern’s geometry varies because of the IMF BY component’s magnitude and direction. For purely southward IMF orientation (BZ < 0; BY = 0), the two-cell convection pattern is symmetric to the magnetic noon-midnight meridian. However, an additional IMF BY component tilts the convection axis, since the open flux tubes are added asymmetrically to the tail lobes [29,30]. Over the Northern Hemisphere, under IMF BZ < 0 and BY > 0 conditions, the larger crescent-shaped dawn cell dominates over the smaller round-shaped dusk cell. Oppositely, under IMF BZ < 0 and BY < 0 conditions, the larger crescent-shaped dusk cell dominates over the smaller round-shaped dawn cell.
Based on E field measurements provided by the Cluster satellites [31,32] or by the high-frequency radar measurements of Super Dual Auroral Radar Network (SuperDARN) [33,34,35], the polar potential plots constructed for the Northern Hemisphere revealed significant convection features introduced by the IMF BY component into the dawn-dusk asymmetry. This is shown in Figure 1 constructed by modifying Figure 9.9 of Grocott [35]. Figure 1 shows the two-cell polar convection pattern depicted by the respective lowest equipotential lines of the dusk cell (in blue) and dawn cell (in red). Figure 1a shows the dusk convection cell’s dawnward intrusion under IMF BZ ≤ 0 and BY < 0 conditions. Characteristic features are the subauroral/mid-latitude plasma flows directed antisunward (marked in light blue) after magnetic midnight and sunward (marked in orange) before magnetic midnight. Figure 1b shows the opposite scenario with the dawn cell’s duskward intrusion under IMF BZ ≤ 0 and BY > 0 conditions. Characteristic features are the subauroral/mid-latitude plasma flows directed antisunward (marked in light blue) before magnetic midnight and sunward (marked in orange) after magnetic midnight.
1.3. Pulsed Convection Flows
However, the steady polar convection frequently becomes pulsed by mesoscale plasma flows, called flow channels. In a flow channel, the plasma flow becomes locally enhanced compared to the background convection flow. Often, a two-peak flow pattern forms in the duskside convection [36,37]. One peak is located at auroral latitudes and is specified as the westward auroral return flow, where the poleward directed Pedersen currents connect the duskside ↓R2-↑R1 FACs. The other peak is located at subauroral latitudes and specified as the duskside westward SAPS flow [1] located within the regime of ↓R2 FACs according to the scenario presented by Sandholt and Farrugia [37].
1.4. EDawn-Dusk Driving the Ionosphere Plasma at Subauroral and Mid Latitudes
Since early modeling studies, using experimental models of different techniques [26,27,38,39,40], it is well-known that the magnetospheric EDawn-Dusk field drives the ionospheric plasma sunward along the flanks of the two convection cells covering subauroral and mid latitudes. However, these convection models do not include the effects of SAPS. But later and recent studies consider the westward SAPS in the context of both (1) the two-cell convection pattern [7,41,42,43,44] and (2) the propagation of convection E field to subauroral and mid or even to lower latitudes [36,45,46,47]. Furthermore, the simple analytical model of Lyatsky et al. [48], designed for the westward SAPS, considers both the dusk cell’s dawnward intrusion (as shown in Figure 1a) and the consequential distortion of dusk cell along with the related westward subauroral convection flows, and specifies the dawnward extended subauroral flows as westward SAPS flows that can be quite intense during magnetically active times. Such distorted convection pattern is characterized by a larger crescent-shaped dusk cell intruding dawnward (as shown in Figure 1a) and is typical to IMF BZ ≤ 0 and BY < 0 conditions in the Northern Hemisphere. Supported by previous statistical experimental studies, westward SAPS flows occupy a broader region of the midnight MLT sector, up to 3 MLT [7] and the poleward polarization E field or SAPS E field is the strongest near magnetic midnight [6,7,49].
1.5. Motivation and Aim of this Study
In our most recent study [50], focusing on the Southern Hemisphere, we investigated the above-described scenario of dawnward-intruding dusk cell (shown in Figure 1a), which is also the ionospheric signature of the Harang region [51 and references therein]. We documented the development of amplified westward SAPS flows streaming (in concert with the dawnward-intruding dusk cell) sunward before magnetic midnight and antisunward after magnetic midnight (as shown in Figure 1a). We explained the westward SAPS flow’s amplification with the underlying magnetospheric and ionospheric conditions observed by various multi-instrument satellites at multi points. Our results revealed that in the inner magnetosphere, the strong outward SAPS E field developed at the Harang region’s earthward edge. In the topside ionosphere, both the Harang region and the dawnward-intruding dusk cell expanded equatorward and dawnward. This suggested the EDawn-Dusk field’s significant role -by propagating to subauroral latitudes as a mapped-down poleward directed E field- in the westward SAPS flow’s amplification. Meanwhile, positive feedback mechanisms unfolded in the deep plasma density trough (i.e., a region of low conductivity and increased recombination), where the electron temperature became elevated reaching up to 7000 K and the poleward directed E field became further strengthened.
The aim of this study is to investigate the opposite scenario (shown in Figure 1b) but in the Harang region’s absence. We speculate that if the EDawn-Dusk field has a significant role in westward SAPS amplification (by propagating to subauroral latitudes as a mapped-down poleward directed E field), then the EDawn-Dusk field also amplifies the eastward SAPS on the dawnside in an opposite scenario. Such an opposite scenario occurs when the mapped-down EDawn-Dusk field, which is equatorward directed on the dawnside, reaches subauroral latitudes. In such a scenario (shown in Figure 1b), the dominating crescent-shaped dawn cell intrudes duskward, across the magnetic midnight meridian, due to the strong plasma convection extending equatorward and duskward. Such a scenario involves both (1) the equatorward and duskward expanding dawn cell and (2) the dawn-cell-related eastward SAPS flow. The dawn-cell-related eastward SAPS flow is a recently discovered phenomenon [10,52,53] that has been quite intensively investigated [11,54,55,56,57] since our first report [10].
2. Materials and Methods
In order to observe the eastward SAPS flow and its plasma environment in the topside ionosphere near magnetic midnight, we used a multi-satellite database. These include the multi-instrument Defense Meteorological Satellite Program (DMSP) [58] data collected by spacecraft DMSP F15 and the SuperDARN [34,59,60] convection maps [61] depicting the underlying polar convection pattern. SuperDARN convection maps are produced based on the averaged data (over the previous 2 minutes) and model predictions provided by the TS18 model [62]. We also used the DMSP Special Sensor Ultraviolet Spectrographic Imager (SSUSI) [63] auroral images depicting the duskward-intruding dawn cell’s signature appearing in the auroral precipitation pattern.
Generally, the polar orbiting DMSP satellites circle the Earth (orbital period of ~101 min; inclination angle of ~98.7o) in the topside ionosphere at ~840 km altitude [58]. During the calendar years of 2015 and 2016, DMSP F15 was on a postmidnight-dusk orbit in the Southern Hemisphere and therefore was able to observe the dawn-cell-related eastward SAPS flow near magnetic midnight. Since the magnetometer and the particle spectrometer did not work then, we used only a limited set of multi-instrument in situ measurements provided by DMSP F15. These include the data of electron density (Ne; 1/cm3), electron and ion temperature (Te, Ti; K), and cross-track horizontal (HOR) and vertical (VER) ion drifts (VHOR, VVER; m/s).
We note here that all the 2015 and 2016 eastward SAPS events depicted by their respective DMSP F15 survey plots along with their respective SuperDARN convection maps and DMSP/SSUSI imageries are shown in Figures S1–S17 (see Supplementary Materials).
In order to correctly specify the dawn-cell-related eastward SAPS flow (in the absence of magnetometer and particle data), we considered the subauroral region’s seven main features listed as 1-7. (1) The electron density (Ne) trough. (2) The SAPS flow: depicted by the increased cross-track VHOR drift appearing and peaking within the Ne trough and streaming antisunward (VHOR < 0) before and at magnetic midnight or sunward (VHOR > 0) after magnetic midnight. (3) The elevated Te: marking the Ne trough minimum. (4) The zonal cross-track drift (VHOR) direction in the eastward SAPS flow channel. (5) The underlying two-cell polar convection pattern depicted by the SuperDARN convection map showing the dawn cell and its duskward intrusion. (6) The location of equatorward oval boundary: depicted by the DMSP/SSUSI imagery demonstrating the SAPS flow channel’s location on the oval’s equatorward side. (7) The signature of the dawn cell: appearing in the DMSP/SSUSI imaged auroral particle precipitation and confirming the SuperDARN provided convection pattern.
We also used GOES and GEOTAIL satellite data to observe particle injections. While the GOES satellites are on geostationary orbits (6.6 RE) and circle the Earth once a day [64], the GEOTAIL satellite is on an elliptical orbit and orbits the Earth with an orbital period of 127 hours [65]. In order to specify particle injections, we used average electron flux values measured by the GOES Energetic Particle Sensor (EPS) at various energy channels (40 - 475 keV) in nine directions and ion differential flux intensity measured by GEOTAIL Energetic Particle & Ion Composition (EPIC) instrument [66] at 12 energies (67 - 1361 keV).
We could correlate only one eastward SAPS event, occurring on 8 September 2015, with Time History of Events and Macroscale Interactions during Substorms (THEMIS) [67] satellite observations provided by one of the five (TH-A—TH-E) THEMIS satellites, TH-E. Generally, the THEMIS satellites orbit the Earth on their highly elliptical orbits in the magnetosphere [67]. While TH-A, TH-D, and TH-E have been orbiting the Earth since 2007, TH-B and TH-C changed orbits in 2011 and have been orbiting the Moon since then. For investigating the underlying inner-magnetosphere conditions, we used TH-E data. In September 2015, THEMIS completed its Tail Science Phase and orbited with an apogee of ~12 RE on the nightside. These TH-E data include the measurements of space craft potential (SC Pot; V) provided by the Electrostatic Analyzer (ESA) suite, E field components (EX, EZ; mV/m) in Geocentric Solar Ecliptic (GSE) coordinates provided by the Electric Field Instrument (EFI) suite, and electron and ion pressure tensors (PeXX; PiXX; eV/cm3) measured in the standard X direction (indicated as XX) provided by the Combined Moments suite in the ground-calculated moments (GMOM).
Orbit data obtained for GOES and TH-E include MLT (Hr), dipole L (RE), spacecraft location (X, Y, Z; RE) in Geocentric Solar Magnetospheric (GSM) coordinates, and footprints in geographic longitude (GLON; oE) and latitude (GLAT); oN) and in geomagnetic latitude (MLAT; oS).
We also used interplanetary magnetic field (IMF BY and BZ) and electric field (IEF EY) data along with various indices (AE, nT; Kp; SYM-H, nT) for specifying the underlying geomagnetic conditions. For identifying substorm onset times and locations, we used the substorm lists of Newell and Gjerloev [68], Forsyth et al. [69], and Ohtani and Gjerloev [70] published by SuperMAG.
3. Results
3.1. Dawn-Cell-Related Eastward SAPS Observed by DMSP F15 Near Magnetic Midnight
We surveyed the DMSP F15 data covering the calendar years of 2015 and 2016 and considered only good quality (Level 2) data. We found altogether 17 eastward SAPS events that are listed in Table 1. These 17 events include 9 events in 2015 and 8 events in 2016. Their geographic and magnetic locations are illustrated in Figure 2.
In the left panel of Figure 2 (a and c), the geographic map covers the Southern Hemisphere and illustrates the modeled magnetic meridians (in blue) and dip equator (in light magenta). Here, we plotted the eastward SAPS locations (as dot symbols in colors). As shown, DMSP F15 observed the eastward SAPS mostly in the African and South American longitude sectors. These are the longitude regions that are affected by the South Atlantic Magnetic Anomaly (SAMA), where the magnetic field is anomalously weak [71]. These are also the longitude regions, where the ring-current-related trough (see details below), called the ring ionospheric trough (RIT) [72], prefers to develop [73,74,75,76].
In the right panel of Figure 2 (b and d), the southern polar plot of MLT against MLAT shows the eastward SAPS locations (dot symbols in colors). These are situated mostly before magnetic midnight at ~60 MLAT and occasionally after magnetic midnight between 50 and 60 MLAT.
In Figure 3 and Figure 4, the line-plot sets show the 2015 and 2016 eastward SAPS events respectively. These line-plot sets are constructed for each SAPS event with multi-instrument in situ DMSP F15 data including electron density (Ne), electron and ion temperature (Te, Ti), and cross-track zonal or horizontal drift (VHOR). These illustrate the eastward SAPS flows in their topside-ionosphere plasma environment. We oriented these line plots in the equatorward direction and marked the equatorward oval boundary along with the trough (symbol circles in colors) and SAPS (symbol dot in color) locations. Each VHOR line plot shows the eastward SAPS flow (shaded interval in yellow), which was amplified (1200 m/s - 3000 m/s in magnitude). While most of the SAPS events depict the eastward SAPS flow streaming antisunward (VHOR < 0) before magnetic midnight, only three SAPS events (in Figure 3c) show the eastward SAPS flow streaming sunward (VHOR > 0) after magnetic midnight.
Overall, these SAPS events in Figure 3 and Figure 4 show that the eastward SAPS flow appeared in the plasma density trough that was quite deep (Ne ≤ 3.5 × 10³ 1/cm3). This trough is a coinciding ring-current-related RIT and flow-stagnation-related main ionospheric trough (MIT) [77]. Because of the orientation of the descending DMSP F15 pass, F15 sometimes (as shown in Figure 3b,c) could not observe the signature of the plasmapause (PP) appearing as a steep Ne gradient that is clearly shown in Figure 3a and Figure 4. These PP-detections provide observational evidence that both the plasma density trough and the eastward SAPS flow developed on the equatorward side of the plasmapause. Thus, the eastward SAPS flow developed in the regime of closed magnetic field lines and possibly played a significant role in moving the ionosphere plasma longitudinally [78]. Meanwhile, Te became elevated (mostly reaching ~6000 K) within the coinciding RIT-MIT, as a result of ring current decay because of the precipitation of hot ring current ions into the ionosphere. Such precipitation occurs most intensively in the longitude region of SAMA because of the anomalously weak geomagnetic field [74,75,76]. As the ionosphere became heated, leading to both (i) elevated Te and (ii) increased recombination rates forming and further deepening the RIT. These (i-ii) occur in the longitude regions of SAMA (according to the statistical investigation of Karpachev [74,75,76] and contribute to the development of positive feedback mechanisms [13 and references therein] by further reducing the ionospheric conductivity and therefore further increasing the SAPS E field leading to the growth of amplified eastward SAPS flows in these events.
3.2. Underlying Interplanetary and Geophysical Conditions
In Figure 5, the line-plot sets show the IMF BY and BZ and IEF EY components along with the indices of SYM-H, Kp, and AE. These show the eastward SAPS flow of interest during a larger time-period covering the previous day and the following day. We marked the eastward SAPS flow (symbol dot in color, shaded interval in yellow) along with the nearest previous substorm onset (symbol star in red; see also Table 2). These line-plot sets show the eastward SAPS’ underlying interplanetary and geophysical conditions.
Figure 5 shows that the eastward SAPS flows were observed (i) mostly during non-storm substorms and (ii) soon after their respective substorm onsets (see Table 2) and when (iii) the IMF rotated northward (Bz > 0) or southward (Bz < 0) and (iv) the Kp index increased just before or during the SAPS event. These (i-iv) imply that the plasmapause was newly formed and moved equatorward [79]. Furthermore, these (i-iv) are the main underlying interplanetary and geomagnetic conditions that are required for the propagation of the mapped-down magnetospheric dawn-to-dusk E field to the subauroral region. As the IMF BZ component changes suddenly, the shielding layer [80,81,82] is not fully developed yet at southward turning (under BZ < 0 conditions) or breaks at northward turning (under BZ > 0 conditions). Thus, the dawn-to-dusk convection E field is able to propagate into the inner magnetosphere and (after mapping down) into the ionosphere from higher to lower latitudes for a shorter (~ few minutes; [83] or longer (several hours; [84,85,86] time-period. Therefore, the propagating dawn-to-dusk E field, also known as prompt penetration E field (PPEF), drives the subauroral plasma in concert with the two-cell polar convection. We note here that in the daytime MLT sector, the propagating convection E field is the magnetopause-reconnection-related convection E field. Importantly, in the night-time MLT sector, the propagating convection E field is the magnetotail-reconnection-related convection E field.
3.3. Sunward Streaming Eastward SAPS Flow: 7 October 2015 Event
Figure 6 is constructed for the 7 October 2015 eastward SAPS event and shows the dawn-cell-related eastward SAPS flow streaming sunward after magnetic midnight: in concert with the dawn cell.
In Figure 6a, the southern geographic map depicts the DMSP F15 pass (in light red) and the GOES-13 footprints (in red). While DMSP F15 observed the eastward SAPS flow along its descending pass in the African longitude sector, the ascending DMSP F15 pass was located over the South Pacific. During a larger 12-hour time interval of the eastward SAPS event, the GOES-13 footprints crossed the ascending F15 pass in the South American longitude sector.
In Figure 6b, the line plots cover the postmidnight subauroral region, a larger region of the auroral oval situated in the midnight and dusk MLT sectors, and the duskside subauroral region. From top to bottom, these line plots are constructed with the DMSP F15 data of Ne, Te and Ti, and cross-track drifts (VHOR; VVER). The main features shown are the eastward SAPS flow (dot symbol in light red; shaded interval in yellow) streaming sunward (+) after magnetic midnight and reaching VHOR ≈ 3200 m/s within the coinciding RIT-MIT, where Te peaked at ~6400 K. Within the coinciding RIT-MIT and eastward SAPS channel, the upward drift also increased reaching VVER ≈ 1500 m/s at the equatorward edge of the coinciding RIT-MIT. Within the auroral oval, the near constant and close to zero cross-track drifts (VHOR and VVER) can be explained with the alignment of the F15 pass (see details below). As the DMSP F15 pass crossed the auroral arc (located along the poleward edge of the duskside auroral zone; see Figure 6d), the cross-track drifts show the weak signatures of Alfven waves (marked as shaded intervals in light blue) since auroral arcs are generated by FACs carried by Alfven waves [15].
In Figure 6c, the southern polar convection map shows the underlying two-cell polar convection pattern operational under IMF BZ > 0 and BY > 0 conditions during 00:10 - 00:12 UT. This is the closest match with the DMSP/SSUSI imagery recorded at 00:07 UT (shown in Figure 6d). We plotted the DMSP F15 pass (in light red) and the GOES-13 location (dot symbol in red) appearing within the dusk cell, and the location of the nearest substorm onset (star symbol in red), which occurred at the end of the previous day (at 23:45 UT) in the postmidnight MLT sector and near the eastward SAPS channel (dot symbol in light red). Based on the SuperDARN convection map generated, the dusk cell (in blue) and dawn cell (in red) are depicted by their respective lowest equipotential contours. Furthermore, the Heppner-Maynard (H-M) Boundary (marked in dark green), defining the low-latitude boundary of the auroral oval [40], was located at ~60 MLAT. This two-cell convection pattern developed after a longer-lasting southward IMF BZ orientation, when the IMF just turned northward and the shielding layer broke allowing the propagation of mapped-down dawn-to-dusk convection E field on the dawnside (as an equatorward E field) to subauroral latitudes. Then, the convection pattern appeared with a larger dusk cell and slightly smaller dawn cell, where the convection axis was tilted mostly in the postnoon-postmidnight direction. This polar convection map further illustrates that the dawn-cell-related eastward SAPS flow was observed after midnight and thus was streaming sunward: in concert with the dawn cell. Possibly, the equatorward directed convection E field extended to subauroral latitudes and enhanced the dawnside subauroral convection flows and therefore, amplified the eastward SAPS flow that was streaming sunward after magnetic midnight.
In Figure 6d, the DMSP/SSUSI imagery illustrates the auroral arc on the poleward edge of the oval on each side and the auroral precipitation signatures of the dusk cell and dawn cell appearing on the dawnside because of the postnoon-postmidnight tilt of the convection axis. By plotting over the DMSP F15 pass and the eastward SAPS location, we can view the F15 pass’ alignment. As the DMSP F15 pass mostly followed the boundary of auroral zone-polar cap, the cross-track drifts (both VHOR and VVER) were close to zero. All these provide observational evidence and demonstrate further that (i) the postmidnight eastward SAPS flow was observed equatorward of the auroral oval and was associated with the dawn cell and (ii) the DMSP F15 pass crossed the auroral arc along the oval’s poleward edge.
In Figure 6e, the line plots are constructed with the GOES-13 electron flux data covering a 12-hour time-period from 18 UT on 6 October to 6 UT on 7 October 2015. We marked the substorm onset (star symbol in red) and eastward SAPS (dot symbol in light red; shaded interval in yellow). All these illustrate that the eastward SAPS flow was observed soon after the substorm onset and after dipolarization, when the magnetic field reconfigures from stretched (tail-like) to bipolar (dipole-like) after substorm onset [14]. Although GOES-13 was located on the duskside (see Figure 6c) and the substorm onset occurred on the dawnside (see Figure 6c), these electron flux line plots still illustrate quite clearly the electron flux decrease (just before the substorm onset) characteristic to a tail-like magnetic field configuration and the following electron flux increase created by particle injections (just after the substorm onset) characteristic to a dipole-like magnetic field configuration.
3.4. Antisunward Streaming Eastward SAPS flow: 3 March 2015 Event
Figure 7 is constructed the same way as Figure 6 but with GEOTAIL data and illustrates the 3 March 2015 eastward SAPS event, when the dawn-cell-related eastward SAPS flow was streaming antisunward before magnetic midnight: in concert with the duskward-intruding dawn cell.
In Figure 7a, the southern geographic map shows the F15 passes (in cyan). F15 observed the eastward SAPS flow in the African longitude sector, along the descending F15 pass, while the ascending pass was located over the South Pacific. Since footprints are not available for GEOTAIL, we could not map them.
In Figure 7b, the DMSP F15 line-plot set covers the premidnight subauroral zone and auroral zone and the dusk region. These plots show the coinciding RIT-MIT, wherein the eastward SAPS flow was streaming antisunward (-) before magnetic midnight and reached 2600 m/s in magnitude. Meanwhile, the upward (+) drift locally maximized in the SAPS channel and reached 3000 m/s and Te peaked at ~7400 K. Within the pre-midnight auroral zone, the cross-track drifts were constant and close to zero (see details below).
In Figure 7c, the southern polar map shows the underlying two-cell polar convection operational during 01:08 - 01:10 UT, which is the closest match with both the DMSP F15 eastward SAPS observation (01:07 UT) and the DMSP/SSUSI imagery (01:57 UT). Then, the polar convection was characterized by a tilted convection axis in the prenoon-premidnight direction and by a duskward-intruding dawn cell. Meanwhile, the H-M Boundary (marked in dark green) was located at ~68 MLAT. Again, we plotted the previously occurring (at 01:00 UT) substorm onset (star symbol in red) on the dawnside. As shown by the mapped DMSP F15 pass and eastward SAPS location, the DMSP F15 pass crossed the equatorward edge of the dusk cell, where the cross-track drift was close to zero as illustrated by the VHOR and VVER line plots (see Figure 7b). Furthermore, the eastward SAPS channel was associated with the duskward-intruding dawn cell. Therefore, the dawn-cell-related eastward SAPS flow was streaming antisunward before magnetic midnight: in concert with the duskward-intruding dawn cell.
In Figures 7d, the DMSP/SSUSI imagery depicts the signatures of dusk cell and duskward-intruding dawn cell appearing on the duskside in the auroral particle precipitation because of the prenoon-premidnight tilt of the convection axis. Also, we mapped the location on the dawn-cell-related eastward SAPS flow situated on the duskside and equatorward of the oval boundary.
In Figure 7e, the line plots cover a 7-hour time-period (from 20 UT on 2 March to 3 UT on 3 March 2015) and illustrate the GEOTAIL-measured Ion Differential Flux Intensity variations measured at 12 energy channels. During that time-period, GEOTAIL was traveling on the dawnside and from the dayside to the nightside by crossing the X axis at 00:30 UT on 3 March. Then, a series of particle injections occurred on the nightside and during the previous substorms. These injections are shown by the dispersionless differential ion flux increases and decreases. DMSP F15 observed the eastward SAPS on 3 March, just after the last dawnside substorm onset (at 01:00 UT) of the substorm onset series occurring in the postmidnight MLT sector. Because of the stored energy released during the substorm onset, enhancing the transpolar voltage, the dawn cell became enlarged and intruded duskward [87 and references therein].
3.5. Correlated DMSP F15- TH-E 8 September 2015 Event
Figure 8 is constructed for the two consecutive 8 September 2015 eastward SAPS events (observed by DMSP F15 at 6:32 UT and 8:13 UT; see also Figure 3c). We could provide further illustrations with the correlated inner-magnetosphere TH-E measurements (made at 4:45 UT) that we matched with an eastward SAPS detection when DMSP F15 observed the emerging eastward SAPS flow at 4:50 UT (shown in Figure 8b). All these F15-observed eastward SAPS flows were streaming sunward after magnetic midnight in concert with the dawn cell.
Figure 8a shows the southern geographic map where we plotted the descending DMSP F15 passes (in colors) and the DMSP F15-observed eastward SAPS flow channel locations (dot symbols in colors) on the dawnside in the South American longitude sector, and the ascending DMSP F15 passes on the duskside in the Australian sector. On the duskside, the GOES-15 footprints (in red) mapped down to the South Pacific. Here, we focus on the earliest observed eastward SAPS channel (dot symbol in light gray) and the nearby TH-E footprints (in orange) along with the mapped-down location of large-scale E field (symbol diamond in orange) that we specified as an inward directed convection E field (EC; in orange).
In Figure 8b, the three sets of line plots are constructed the same way as Figure 3 and Figure 4 and show three consecutive eastward SAPS detections made by DMSP F15 on 8 September 2015. The first set depicts the earliest (i.e., emerging) eastward SAPS flow (dot symbol in light gray; shaded interval in yellow) streaming sunward (VHOR ≈ 800 m/s) within a shallower (Ne ≈ 2×103 cm-3) plasma density trough (i.e., coinciding RIT-MIT) where Te was not locally increased yet (Te ≈ 4500 K). The next two plots show (see also Figure 3c) the amplified eastward SAPS flows latter on at 6:32 UT (symbol dot in light blue; VHOR ≈ 2800 m/s) and at 8:13 UT (symbol dot in dark yellow; VHOR ≈ 2200 m/s). These SAPS events demonstrate that the emerging eastward SAPS flow became amplified latter on. Meanwhile, the plasma density trough (i.e., coinciding RIT-MIT) became deeper (Ne ≈ 1×103 cm-3) wherein Te became locally elevated reaching ~7000 K. These imply increasing positive feedback mechanisms (by their respective locally decreased conductivity and locally increased recombination rates [13] that further supported the growth of both the equatorward SAPS E field and the resultant eastward SAPS flow.
Figure 8c is constructed with the GOES-15-measured electron flux data. The line plots cover a larger 10-hour time-period of the above-described eastward SAPS events. We marked (shaded intervals in yellow) the published substorm onset times (star symbols in red) along with the detections of eastward SAPS by DMSP F15 (symbol dots in colors) and convection E field by TH-E (EC; symbol diamond in orange). As shown, a series of quite intense dipolarization events occurred earlier covering the first two substorm onsets and were followed by weaker dipolarization events during the time of correlated EC-SAPS recordings.
Figure 8d shows the two-cell polar convection operational during the time-period of 06:32 – 06:34 UT when DMSP F15 observed the first amplified eastward SAPS flow (dot symbol in light blue) in the topside ionosphere. Then, the two-cell polar convection was characterized by a larger dusk cell confined to the duskside and a smaller dawn cell confined to the dawnside in the midnight MLT sector. Furthermore, the TH-E footprints were located on the dawnside. Moreover, the mapped-down convection E field (EC; symbol diamond in orange) was located near both the emerging eastward SAPS flow (symbol dot in light gray) and the amplified eastward SAPS flow (symbol dot in light blue). These eastward SAPS flows were commonly streaming sunward in concert with the dawn cell. We marked also the TH-E-observed plasmapause location (dotted line in blue) situated at ~59 MLAT and the H-M Boundary at ~61 MLAT. All these provide observational evidence that the inward convection E field (developed earlier on the dawnside) mapped down to the auroral oval as an equatorward E field (driving the plasma eastward) and possibly propagated equatorward and reached subauroral latitudes. This triggered the eastward SAPS flow’s emergence (symbol dot in light gray) and further amplifications (symbol dot in light blue in Figure 8d and symbol dot in dark yellow in Figure 8e).
In Figure 8e, the polar map shows a more intense two-cell polar convection pattern latter on (at 08:20 UT) along with the H-M boundary located at ~63 MLAT. Mapped over, the second amplified eastward SAPS flow (symbol dot in dark yellow) was streaming sunward in concert with the dawn cell. Consistently with Figure 8d, these Figure 8e-related observations imply that the mapped-down inward convection E field propagated equatorward and reached subauroral latitudes as an equatorward-directed E field and drove the plasma eastward in the SAPS channel.
In Figure 8f, the X versus Z and X versus Y orbit plots (in GSM coordinates) show the TH-E orbit completed during the time-period of 4.5-5.5 UT on 8 September 2015. During this one-hour time-period, TH-E was traveling tailward on the nightside and dawnside and observed the convection E field (EC) in the inner magnetosphere (at 4.72 UT). In these orbit sections, the positive directions are outward and sunward.
Figure 8g shows a series of line plots constructed with the TH-E data of spacecraft potential (SC Pot), E field components (EX; EZ) and the high-energy ion and electron pressure components (PiXX, PeXX). These depict the inward (earthward) directed convection E field (EC) observed on the dawnside and its inner-magnetosphere environment. Between the two potential drops detected, TH-E observed the plasmasheet’s earthward edge (shaded interval in gray). This is the region of trapped high-energy electrons [88], in a dipole-like magnetic field configuration attained after dipolarization when the stretched (or tail-like) magnetic field became bipolar (or dipole-like). The smaller potential drop depicts the inner-magnetosphere plasmapause (PP) after magnetic midnight, when the PP coincides [88] with the stable tapping boundary (STB) at the earthward end of the plasmasheet’s earthward edge [89]. The other potential drop depicts the trapping boundary (TB) [88] at the tailward end of the plasmasheet’s earthward edge. This is where TH-E observed the sunward EX and inward EZ components (~18 mV/m; in magnitude) of the convection E field (EC; diamond symbol in orange, shaded interval in yellow). TH-E made these E field component observations near magnetic midnight, when the dawn-dusk EY component was zero and therefore is not shown. Furthermore, at that time, the dawnside inward SAPS E field was not developed yet and therefore was not observed by TH-E. Next, the pressure tensor line plots (Pe and Pi measured in the standard X direction indicated as XX) illustrate that the high-energy (up to 700 keV) electron pressure peaked more earthward than the high-energy (up to 4000 keV) ion pressure. As shown, PeXX peaked at the earthward edge of the EC channel and PiXX peaked at its tailward edge. Thus, EC developed where these Pe and Pi peaks separated: near the TB. Furthermore, this Pe-Pi peak separation represents the separation of high-energy/hot electron (-) and ion (+) populations (charges) under reduced shielding (see details in section 4) that produces the convection E field: in this case at the TB. This implies that the dawnside inward-directed EC (observed by TH-E) mapped down to the diffuse-discrete oval boundary (since this is where the TB maps down to [89]) as an equatorward-directed convection E field. Although we could not provide any E field observational evidence, we speculate that the above-mentioned equatorward convection E field propagated equatorward (from the diffuse-discrete oval boundary to subauroral latitudes) and triggered the emergence of the eastward SAPS flow (observed by DMSP F15; see Figure 8d). This suggests that the emerging eastward SAPS flow developed mainly due to the equatorward-directed convection E field’s equatorward propagation, since TH-E did not observe the inward SAPS E field at the inner-magnetosphere PP (only the inward EC at the TB). According to the TH-E orbit data, EC was observed at ~1 MLT and ~3.6 RE.
4. Discussion
In this study, we investigated the amplification of the dawn-cell-related eastward SAPS flow near magnetic midnight observed in the topside ionosphere by DMSP F15 in 17 events soon after their respective substorm onsets. During these eastward SAPS events, the dawn convection cell became enhanced, expanded equatorward and duskward, and thus intruded to the duskside (as shown in Figure 1b). Under such increased convection conditions, the dawn-cell-related eastward SAPS flow amplifications observed suggest that the earthward propagating magnetospheric dawn-to-dusk convection E field (EDawn-Dusk) had a significant role (1) in the equatorward and duskward expansion of the dawn cell, (2) in enhancing the dawn-cell-related convection flows and (3) amplifying the dawn-cell-related eastward SAPS flow.
In our more recent study [50], we investigated the opposite scenario (shown in Figure 1a) and provided observational evidence of the significant role of the magnetospheric convection EDawn-Dusk field (A) in the equatorward and dawnward expansion of the dusk cell, (2) in enhancing the dusk-cell-related convection flows and (C) amplifying the dusk-cell-related westward SAPS flow. In agreement with the analytical model of Lyatsly et al. [48], connecting stronger SAPS flows to enhanced plasma convection near magnetic midnight, we obtained consistent observational results. These results are for the dawn-cell-related (listed as 1-3) and dusk-cell-related (listed as A-C) polar convection scenarios and provide convincing evidence of the EDusk-Dawn convection field’s significant role in the maintenance (and possibly also in the development) of SAPS in such scenarios: before the shielding E field builds up (see details below).
While the solar wind generates the magnetospheric dawn-to-dusk convection E field (EDawn-Dusk) under southward IMF (Bz < 0) conditions via a dawn-to-dusk potential drop across the magnetosphere, the magnetospheric ring current is the main regulator of the net magnetospheric convection in the magnetic equatorial region [90,91]. According to the Dungey cycle [22], the magnetospheric convection is earthward in the nightside equatorial magnetosphere and the convection EDawn-Dusk field drives the hot plasma earthward (or inward) from the magnetotail leading to the generation of ring current (made up of trapped hot ions circling the Earth). However, the hot plasmasheet ions are more energetic than the hot plasmasheet electrons and therefore the contribution of hot plasmasheet ions to the total plasma pressure is significantly larger. Consequently, the large-scale R2 FACs are generated only at the earthward edge of the hot plasmasheet ions where the pressure gradients are significant. Furthermore, an increased convection EDawn-Dusk field (a) moves the ring current’s inner edge closer to Earth and therefore (b) modifies the amount of R2 FAC-flux passing through the new location, and also (c) polarizes the ring current’s inner edge by applying a dawn-to-dusk potential drop to the earthward edge of the ring current. This (i.e., c) leads to the polarization of the ring current’s inner edge by the primary convection EDawn-Dusk field [83,90,91], which, in turn, leads to the development of an opposing (dusk-to-dawn) secondary E field, called shielding E field (shielding EDusk-Dawn field), providing shielding [92] by reducing or cancelling out the convection EDawn-Dusk field [83].
Importantly, the convection EDawn-Dusk field can transiently extend closer to Earth during the overall time-period of actions (listed above as a-c), before shielding builds up. In such a scenario, the boundaries of ring current ions and plasmasheet electrons separate closer to Earth (while the shielding effect is absent or decreases) and thus allow the transition of convection EDawn-Dusk field closer to Earth [83]. We could demonstrate this with TH-E observations (shown in Figure 8g). Then, TH-E observed a convection E field (EC) appearing near the trapping boundary (TB; i.e., tailward boundary of the plasmasheet’s earthward edge). Possibly, the inward EC (i.e., the earthward propagating convection EDawn-Dusk field) mapped down from the TB to the auroral oval and then propagated to subauroral latitudes as a meridional equatorward-directed E field triggering the emergence of eastward SAPS flow (observed by DMSP F15; see first line-plot set in Figure 8b).
This study is particularly relevant to the previous study of Makarevich et al. [44] investigating for the first time the scenario of increased duskward-intruding dawn cell (as shown in Figure 1b), where the authors observed increased narrow eastward subauroral flows (developed after the second substorm onset) along the equatorward edge of the dawn cell. Makarevich et al. [44] specified the narrow subauroral flow as eastward SAID and reported for the first time the narrow eastward SAID flow being associated with the duskward-intruding dawn cell. This scenario (shown in Figure 1b) is the opposite of the scenario of dawnward-intruding dusk cell (shown in Figure 1a) considered by the analytical model of Lyatsky et al. [48] and investigated in our most recent study ([50].
5. Conclusions
In this study, we report exceptional observational results revealing the dawn-cell-related eastward SAPS flow’s amplification because of the extension of equatorward-directed convection E field to subauroral latitudes. In 17 events, observed in the topside ionosphere by DMSP F15 during the calendar years of 2015 and 2016, the dawn-cell-related eastward SAPS flow (1) was detected soon after substorm onset implying its fast-time development, (2) became amplified near magnetic midnight, and (3) was streaming in concert with the duskward-intruding dawn cell: sunward after magnetic midnight (marked in orange in Figure 1b) and antisunward before magnetic midnight (marked in light blue in Figure 1b). The amplified eastward SAPS flow (4) appeared in a deep plasma density trough created by the coinciding ring-current-related RIT and flow-stagnation-related MIT where (5) Te maximized and sometimes reached ~7000 K implying (6) positive feedback mechanisms supporting SAPS flow maintenance and growth. Correlated in space and time, M-I conjugate THEMIS-DMSP observations demonstrate (7) the inner-magnetosphere inward (earthward) convection EDawn-Dusk field reaching the tailward boundary of the plasmasheet’s earthward edge and (8) the sudden appearance of the emerging eastward SAPS flow in the topside ionosphere.
Based on the observational results (listed above as 1-7) obtained for the 17 events investigated, we conclude the convection EDawn-Dusk field’s significant role impacting the eastward SAPS flows investigated. These impacts include the eastward SAPS flow’s (i) amplification (evidenced by results 1-3) along with (ii) the positive feedback mechanisms (evidenced by results 4-5) and (iii) development (evidenced by result 7) occurring (iv) before shielding built up.
We note here that we could not separate the underlying physical mechanisms related to the eastward SAPS flow’s development (on a short timescale and/or by the convection EDawn-Dusk field’s equatorward propagation), which is the major short fall of this study, due to the limited DMSP data worked with. But our consistent results obtained for the dawn-cell-related eastward SAPS in this study and for the dusk-cell-related westward SAPS in our most recent study [50] clearly demonstrate (in agreement with the analytical model of Lyatsky et al., [48]) the significant role of the equatorward-propagating convection EDawn-Dusk field in SAPS flow amplification by reaching subauroral latitudes. Although the underlying generation mechanism proposed by Lyatksy et al. [48] for the proposed amplification of westward SAPS flow is problematic but their model highlights the role of convection EDawn-Dusk field in SAPS flow amplification. This is what we demonstrated with experimental observations covering the dawn-cell-related eastward SAPS events (in this study) and the dusk-cell-related westward SAPS events (in our more recent study [50]).
Finally, we note here that these new observational results are significant, since they provide new insights into the complex coupled system of magnetosphere and ionosphere, where the convection electric field had a significant role (in the SAPS events investigated). Not only in the amplification of eastward SAPS flow, but also in the generation of eastward SAPS flow, as reported in this study. Documenting such scenarios with experimental observations provides advancement in our current understanding of the coupled M-I system, where SAPS generation occurs. SAPS/SAID development is described by various generation theories, which are controversial and still highly debated, and the underlying generation mechanisms are still not clear.
Supplementary Materials
The following supporting information can be downloaded at the website of this paper posted on Preprints.org. Applicable: Supporting Information.pdf.
Author Contributions
Conceptualization, I.H..; methodology, I.H.; software, I.H. and B.C.L.; validation, I.H. and B.C.L.; formal analysis, I.H.; investigation, I.H..; resources, B.C.L.; data curation, I.H.; writing—original draft preparation, I.H..; writing—review and editing, B.C.L. and I.H.; visualization, I.H..; supervision, B.C.L.; project administration, B.C.L.; funding acquisition, B.C.L. All authors have read and agreed to the published version of the manuscript.
Funding
This research was funded by the United States Office of Naval Research under award number N62909-23-1-2057.
Institutional Review Board Statement
Not applicable.
Informed Consent Statement
Not applicable.
Data Availability Statement
The DMSP data set can be accessed online through https://cedar.openmadrigal.org/list (accessed on 29 July 2025). The SSUSI auroral images can be accessed online: through https://ssusi.jhuapl.edu/gal_AUR (accessed on 2 February 2025). The SuperDARN convection maps can be accessed online: https://superdarn.ca/convection-maps (accessed on 29 July 2025). The THEMIS, GOES and GEOTAIL data sets can be accessed online through https://cdaweb.gsfc.nasa.gov/cdaweb/istp_public/ (accessed on 29 July 2025). The Kp, AE and SYM-H indices and the IEF EY and IMF BY and BZ components can be accessed online from the OMNI database: through https://cdaweb.gsfc.nasa.gov/cdaweb/istp_public/ (accessed on 29 July 2025). The SuperMAG provided various types of substorm lists can be accessed online from the SuperMAG substorm lists through https://supermag.jhuapl.edu/substorms/ (accessed on 29 July 2025).
Acknowledgments
We gratefully acknowledge that this material is based upon research supported by the United States Office of Naval Research under award number N62909-23-1-2057. We acknowledge the CEDAR Archival Madrigal Database for the DMSP data. The DMSP particle detectors were designed by Dave Hardy of Air Force Research Laboratory (AFRL). We also gratefully acknowledge the SSUSI auroral images, and the THEMIS, GOES and GEOTAIL data. We acknowledge the World Data Center for Geomagnetism at Kyoto (http://wdc.kugi.kyoto-u.ac.jp/wdc/Sec3.html) for providing the Kp AE indices and the use of SuperDARN convection maps. SuperDARN is a collection of radars funded by national scientific funding agencies of Australia, Canada, China, France, Italy, Japan, Norway, South Africa, United Kingdom and the United States of America. We also acknowledge the SuperMAG provided various types of substorm lists determined from SML index.
Conflicts of Interest
The authors declare no conflicts of interest.
Abbreviations
The following abbreviations are used in this article:
| B field | Magnetic field |
| CG | Current Generator |
| DMSP | Defense Meteorological Satellite Program |
| E field | Electric field |
| EC | Convection Electric field |
| EDawn-Dusk | Dawn-to-Dusk E field |
| EDusk-Dawn | Dusk-to-Dawn E field |
| EPIC | Energetic Particle & Ion Composition |
| EPS | Energetic Particle Sensor |
| EFI | Electric Field Instrument |
| ESA | Electrostatic Analyzer |
| FACs | Field-Aligned Currents |
| GLAT | Geographic Latitude |
| GLON | Geographic Longitude |
| GMOM | Ground-calculated Moments |
| GOES | Geostationary Operational Environmental Satellites |
| GSE | Geocentric Solar Ecliptic |
| GSM | Geocentric Solar Magnetospheric |
| H-M | Heppner-Maynard |
| L | L shell |
| M-I | Magnetosphere-Ionosphere |
| MIT | Main Ionospheric Trough |
| MLAT | Magnetic Latitude |
| MLT | Magnetic Local Time |
| Ne | electron density |
| Pe | electron pressure |
| Pi | ion pressure |
| PJ | Polarization Jet |
| PP | Plasmapause |
| RIT | Ring-current-related Ionospheric Trough |
| R1 | Region 1 |
| R2 | Region 2 |
| SAID | Sub-Auroral Ion Drifts |
| SAPS | Sub-Auroral Polarization Streams |
| SC Pot | Spacecraft Potential |
| SCW | Substorm Current Wedge |
| SCW2L | Substorm Current Wedge 2-Loop |
| SSUSI | Special Sensor Ultraviolet Spectrographic Imager |
| SuperDARN | Super Dual Auroral Radar Network |
| Te | electron temperature |
| THEMIS | Time History of Events and Macroscale Interactions during Substorms |
| TB | Trapping Boundary |
| Ti | ion temperature |
| Ve | electron drift |
| VG | Voltage Generator |
| VGFT | Fast-Time Voltage Generator |
| VGM | Magntospheric Voltage Generator |
| VHOR | cross-track horizontal drift velocity |
| VVER | cross-track vertical drift velocity |
| WTS | Westward Traveling Surge |
References
- Foster, J.; Burke, W. A new categorization for sub-auroral electric fields. Eos. Transactions of the American Geophysical Union 2002, 83, 393–394. [Google Scholar] [CrossRef]
- Spiro, R.W.; Heelis, R.A.; Hanson, W.B. Rapid subauroral drifts observed by Atmosphere Explorer C. Geophysical Research Letter 1979, 6, 657–660. [Google Scholar] [CrossRef]
- Galperin, Yu. L.; Ponomarev, V. N.; Zosimova, A.G. Plasma convection in the polar ionosphere. Annales de Geophysique 1974, 30, 1–7. [Google Scholar]
- Smiddy, M.; Kelley, M.C.; Burke, W.; Rich, F.; Sagalyn, R.; Shuman, B.; Hays, R.; Lai, S. Intense poleward-directed electric fields near the ionospheric projection of the plasmapause. Geophysical Research Letters 1977, 4, 543–546. [Google Scholar] [CrossRef]
- Maynard, N.; Aggson, T.; Heppner, J. Magnetospheric observation of large subauroral electric fields. Geophysical Research Letters 1980, 7, 881–884. [Google Scholar] [CrossRef]
- Karlsson, T.; Marklund, G.T.; Blomberg, L.G.; Mälkki, A. Subauroral electric fields observed by the Freja satellite: A statistical study. Journal of Geophysical Research 1998, 103(A3), 4327–4314. [Google Scholar] [CrossRef]
- Foster, J.C.; Vo, H.B. Average characteristics and activity dependence of the subauroral polarization stream. Journal of Geophysical Research 2002, 107, SIA 16-1–SIA 16-10. [Google Scholar] [CrossRef]
- Anderson, P.C.; Heelis, R.A.; Hanson, W.B. The ionospheric signatures of rapid subauroral ion drifts. Journal of Geophysical Research 1991, 96, 5,785–5,792. [Google Scholar] [CrossRef]
- Anderson, P.C.; Hanson, W.B.; Heelis, R.A.; Craven, J.D.; Baker, D.N.; Frank, L.A. A proposed production model of rapid subauroral ion drifts and their relationship to substorm evolution. Journal of Geophysical Research 1993, 98, 6,069–6,078. [Google Scholar] [CrossRef]
- Horvath, I.; Lovell, B.C. Investigating the Coupled Magnetosphere-Ionosphere-Thermosphere (M-I-T) System’s Responses to the 20 November 2003 Superstorm. Journal of Geophysical Research: Space Physics 2021, 126, e2021JA029215. [Google Scholar] [CrossRef]
- Horvath, I.; Lovell, B.C. Multi-point satellites observed dawnside Subauroral Polarization Streams (SAPS) developed on a short timescale under weak-storm and non-storm substorm conditions. Journal of Geophysical Research: Space Physics 2025, 130, e2025JA033755. [Google Scholar] [CrossRef]
- Southwood, D.; Wolf, R. An assessment of the role of precipitation in magnetospheric convection. Journal of Geophysical Research 1978, 83, 5,227–5,232. [Google Scholar] [CrossRef]
- Mishin, E.V. The evolving paradigm of the subauroral geospace. Frontiers in Astronomy and Space Sciences 2023, 10, 1118758. [Google Scholar] [CrossRef]
- Mishin, E.V. SAPS onset timing during substorms and the westward traveling surge. Geophysical Research Letters 2016, 43, 6,687–6,693. [Google Scholar] [CrossRef]
- Mishin, E.; Nishimura, Y.; Foster, J. SAPS/SAID revisited: A causal relation to the substorm current wedge. Journal of Geophysical Research: Space Physics 2017, 122, 8,516–8,535. [Google Scholar] [CrossRef]
- Mishin, E.V. Interaction of substorm injections with the subauroral geospace: 1. Multispacecraft observations of SAID. Journal of Geophysical Research: Space Physics 2013, 118, 5,782–5,796. [Google Scholar] [CrossRef]
- Sergeev, V.A.; Nikolaev, A.V.; Tsyganenko, N.A.; Angelopoulos, V.; Runov, A.V.; Singer, H.J.; Yang, J. Testing a two-loop pattern of the substorm current wedge (SCW2L). Journal of Geophysical Research 2014, 119, 947–963. [Google Scholar] [CrossRef]
- Ohtani, S.; Gjerloev, J.W.; Anderson, B.J.; Kataoka, R.; Troshichev, O.; Watari, S. Dawnside wedge current system formed during intense geomagnetic storms. Journal of Geophysical Research: Space Physics 2018, 123, 9093–9109. [Google Scholar] [CrossRef]
- Ohtani, S.; Sorathia, K.; Merkin, V.G.; Frey, H.U.; Gjerloev, J.W. External and internal causes of the stormtime intensification of the dawnside westward auroral electrojet. Journal of Geophysical Research: Space Physics 2023, 128, e2023JA031457. [Google Scholar] [CrossRef]
- Akasofu, S.I. The dynamical morphology of the aurora polaris. Journal of Geophysical Research 1963, 68, 1667–1673. [Google Scholar] [CrossRef]
- Akasofu, S.-I. The development of the auroral substorm. Planetary and Space Science 1964, 12, 273–282. [Google Scholar] [CrossRef]
- Dungey, J.W. Interplanetary magnetic field and the auroral zones. Physical Review Letters 1961, 6, 47–48. [Google Scholar] [CrossRef]
- Johnson, F.S. The driving force for magnetospheric convection. Reviews of Geophysics 1978, 16, 161–167. [Google Scholar] [CrossRef]
- Brice, N.M. Bulk motion of the magnetosphere. Journal of Geophysical Research 1967, 72, 5193–5211. [Google Scholar] [CrossRef]
- Nishida, A. Formation of plasmapause, or magnetospheric plasma knee, by the combined action of magnetospheric convection and plasma escape from the tail. Journal of Geophysical Research 1966, 71, 5669–5679. [Google Scholar] [CrossRef]
- Kamide, Y.; Richmond, A. D.; Matsushita, S. Estimation of ionospheric electric fields, ionospheric currents, and field-aligned currents from ground magnetic records. Journal of Geophysical Research 1981, 86, 801–813. [Google Scholar] [CrossRef]
- Friis-Christensen, E.; Kamide, Y; Richmond, A.D.; Matsushita, S. Interplanetary magnetic field control of high-latitude electric fields and currents determined from Greenland magnetometer data. Journal of Geophysical Research 1985, 90, 1325–1338. [Google Scholar] [CrossRef]
- Foster, J.C. Storm time plasma transport at middle and high latitudes. Journal of Geophysical Research 1993, 98(A2), 1675–1689. [Google Scholar] [CrossRef]
- Svalgaard, L. Sector structure of the interplanetary magnetic field and daily variation of the geomagnetic field at high latitudes. Det Danske Meteorologiskeinstitutt, 1968. [Google Scholar]
- Mansurov, S.M. New evidence of a relationship between magnetic fields in space and on earth. Geomagnetism Aeronomy 1970, 9, 622–623. [Google Scholar]
- Haaland, S.E.; Paschmann, G.; Förster, M.; Quinn, J.M.; Torbert, R.B.; McIlwain, C.E.; Vaith, H.; Puhl-Quinn, P.A.; Kletzing, C. A. High-latitude plasma convection from Cluster EDI measurements: method and IMF-dependence. Annales Geophysicae 2007, 25, 239–253. [Google Scholar] [CrossRef]
- Walsh, A.P.; Haaland, S.; Forsyth, C.; Keesee, A.M.; Kissinger, J.; Li, K.; Runov, A.; Soucek, J.; Walsh, B.M.; Wing, S.; Taylor, M. G.G.T. Dawn–dusk asymmetries in the coupled solar wind–magnetosphere–ionosphere system: a review. Annales Geophysicae 2014, 32, 705–737. [Google Scholar] [CrossRef]
- Greenwald, R.A. Baker, K.B. Dudeney, J.R.; Pinnock, M.; Jones, T.B.; Thomas, E.C., Villain, J.-P.; Cerisier, J.-C.; Senior, C.; Hanuise, C.; Hunsucker, R.D.; Sofko, G.; Koehler, J.; Nielsen, E.; Pellinen, R.; Walker, A.D.M.; Sato, N.; Yamagishi, H. DARN/SuperDARN. Space Science Reviews 1995, 71, 761–796. [Google Scholar] [CrossRef]
- Chisham, G.; Lester, M.; Milan, S.E.; Freeman, M.P.; Bristow, W.A.; Grocott, A.; McWilliams, K.A.; Ruohoniemi, J.M.; Yeoman, T.K.; Dyson, P.L.; Greenwald, R.A.; Kikuchi, T.; Pinnock, M.; Rash, J.P.S; Sato, N.; Sofko, G.J.; Villain, J.-P.; Walker, A.D.M. A decade of the Super Dual Auroral Radar Network (SuperDARN): Scientific achievements, new techniques and future directions. Surveys in Geophysics 2007, 28, 33–109. [Google Scholar] [CrossRef]
- Grocott, A. Time-dependence of dawn-dusk asymmetries in the terrestrial ionospheric convection pattern. In Dawn-dusk asymmetries in planetary plasma environments; Haaland, S. E., Runov, A., Forsyth, C., Eds.; American Geophysical Union Monograph: Hoboken, NJ, 2017; Volume 228, pp. 107–124. [Google Scholar] [CrossRef]
- Yeh, H.C.; Foster, J.C.; Rich, F.J.; Swider, W. Storm time electric field penetration observed at mid-latitude. Journal of Geophysical Research 1991, 96(A4), 5707–5721. [Google Scholar] [CrossRef]
- Sandholt, P.E.; Farrugia, C.J. Plasma flow channels at the dawn/dusk polar cap boundaries: momentum transfer on old open field lines and the roles of IMF By and conductivity gradients. Annales Geophysicae 2009, 27, 1527–1554. [Google Scholar] [CrossRef]
- Heelis, R.A.; Lowell, J.K.; Spiro, R.W. A model of the high-latitude ionospheric convection pattern. Journal of Geophysical Research 1982, 87(A8), 6339–6345. [Google Scholar] [CrossRef]
- Foster, J.C.; Holt, J.M.; Musgrove, R.; Evans, D. Ionospheric convection associated with discrete levels of particle precipitation. Geophysical Research Letters 1986, 13, 656–659. [Google Scholar] [CrossRef]
- Heppner, J.P.; Maynard, N.C. Empirical high-latitude electric-field models. Journal of Geophysical Research 1987, 92(A5), 4467–4489. [Google Scholar] [CrossRef]
- Huang, C.-S.; Foster, J.C.; Holt, J.M. Westward plasma drift in the midlatitude ionospheric F region in the midnight-dawn sector. Journal of Geophysical Research 2001, 106, 30,349–30,362. [Google Scholar] [CrossRef]
- Ebihara, Y.; Fok, M.; Sazykin, S.; Thomsen, M.F.; Hairston, M.R.; Evans, D.S.; Rich, F.J.; Ejiri, M. Ring current and the magnetosphere-ionosphere coupling during the superstorm of 20 November 2003. Journal of Geophysical Research 2005, 110(A9), A09S22. [Google Scholar] [CrossRef]
- Kataoka, R.; Nishitani, N.; Ebihara, Y.; Hosokawa, K.; Ogawa, T.; Kikuchi, T.; Miyoshi, Y. Dynamic variations of a convection flow reversal in the subauroral postmidnight sector as seen by the SuperDARN Hokkaido HF radar. Geophysical Research Letters 2007, 34, L21105. [Google Scholar] [CrossRef]
- Makarevich, R.A.; Kellerman, A.C.; Bogdanova, Y.V.; Koustov, A.V. Time evolution of the subauroral electric fields: A case study during a sequence of two substorms. Journal of Geophysical Research 2009, 114(A4), A04312. [Google Scholar] [CrossRef]
- Maimaiti, M.; Ruohoniemi, J.M.; Baker, J.B.; Ribeiro, A.J. Statistical study of nightside quiet time midlatitude ionospheric convection. Journal of Geophysical Research: Space Physics 2018, 123, 2228–2240. [Google Scholar] [CrossRef]
- Maimaiti, M.; Baker, J.B.; Ruohoniemi, J.M.; Kunduri, B. Morphology of nightside subauroral ionospheric convection: Monthly, seasonal, KP, and IMF dependencies. Journal of Geophysical Research: Space Physics 2019, 124, 4608–4626. [Google Scholar] [CrossRef]
- Kunduri, B. S.; Baker, J.B.; Ruohoniemi, J.M.; Nishitani, N.; Oksavik, K.; Erickson, P.J.; Coster, A.J.; Shepherd, S.G.; Bristow, W. A.; Miller, E.S. A new empirical model of the subauroral polarization stream. Journal of Geophysical Research: Space Physics 2018, 123, 7342–7357. [Google Scholar] [CrossRef]
- Lyatsky, W.; Tan, A.; Khazanov, G.V. A simple analytical model for subauroral polarization stream (SAPS). Geophysical Research Letters 2006, 33, L19101. [Google Scholar] [CrossRef]
- Anderson, P. C.; Carpenter, D.L.; Tsuruda, K.; Mukai, T.; Rich, F.J. Multisatellite observations of rapid subauroral ion drifts (SAID). Journal of Geophysical Research 2001, 106(A12), 29585–29600. [Google Scholar] [CrossRef]
- Horvath, I.; Lovell, B.C. Amplified Westward SAPS Flows near Magnetic Midnight in the Vicinity of the Harang Region. Atmosphere 2025, 16, 862. [Google Scholar] [CrossRef]
- Koskinen, H.E.J.; Pulkkinen, T.I. Midnight velocity shear zone and the concept of Harang discontinuity. Journal of Geophysical Research 1995, 100, 9,53–9,547. [Google Scholar] [CrossRef]
- Huang, C.; Zhang, Y.; Wang, W.; Lin, D.; Wu, Q. Low-latitude zonal ion drifts and their relationship with subauroral polarization streams and auroral return flows during intense magnetic storms. Journal of Geophysical Research: Space Physics 2021, 126, e2021JA030001. [Google Scholar] [CrossRef]
- Lin, D.; Wang, W.; Merkin, V.G.; Huang, C.; Oppenheim, M.; Sorathia, K.; Pham, K.; Michael, A.; Bao, S.; Wu, Q. Origin of Dawnside Subauroral Polarization Streams During Major Geomagnetic Storms. AGU Advances 2022, 3, e2022AV000708. [Google Scholar] [CrossRef]
- Aa, E.; Zhang, S.-R.; Wang, W.; Erickson, P.J.; Coster, A.J. Multiple longitude sector storm-enhanced density (SED) and long-lasting subauroral polarization stream (SAPS) during the 26–28 February 2023 geomagnetic storm. Journal of Geophysical Research: Space Physics 2023, 128, e2023JA031815. [Google Scholar] [CrossRef]
- Qian, C.; Wang, H.A. Statistical Study of Ion Upflow during Periods of Dawnside Auroral Polarization Streams and Subauroral Polarization Streams. Remote Sensing 15, 1320. [CrossRef]
- Lin, D.; Wang, W.; Fok, M.-C.; Pham, K.; Yue, J.; Wu, H. Subauroral red arcs generated by inner magnetospheric heat flux and by subauroral polarization streams. Geophysical Research Letters 2024, 51, e2024GL109617. [Google Scholar] [CrossRef]
- Sun, Y.; Wang, H.; Zhang, K. Impact of interplanetary magnetic field By on subauroral polarization streams at dawn and dusk. Journal of Geophysical Research: Space Physics 20242024, 129, e2024JA033063. [Google Scholar] [CrossRef]
- Rich, F.J.; Hairston, M. Large-scale convection patterns observed by DMSP. Journal of Geophysical Research 1994, 99, 3,827–3,844. [Google Scholar] [CrossRef]
- Ruohoniemi, J. M.; Greenwald, R.A. Observations of IMF and seasonal effects in high-latitude convection. Geophysical Research Letters 1995, 22, 1121–1124. [Google Scholar] [CrossRef]
- Grocott, A.; Walach, M.-T.; Milan, S. E. SuperDARN Observations of the Two Component Model of Ionospheric Convection. Journal of Geophysical Research: Space Physics 2023, 128, e2022JA031101. [Google Scholar] [CrossRef]
- Cousins, E.D.P.; Matsuo, T.; Richmond, A.D. SuperDARN assimilative mapping. Journal of Geophysical Research: Space Physics 2013, 118, 7954–7962. [Google Scholar] [CrossRef]
- Thomas, E.G.; Shepherd, S.G. Statistical patterns of ionospheric convection derived from mid-latitude, high-latitude, and polar SuperDARN HF radar observations. Journal of Geophysical Research 2018, 123, 3,196–3,216. [Google Scholar] [CrossRef]
- Paxton, L.J.; Morrison, D.; Zhang, Y.; Kil, H.; Wolven, B.; Ogorzalek, B.S.; Humm, D.C.; Meng, C.-I. Validation of remote sensing products produced by the Special Sensor Ultraviolet Scanning Imager (SSUSI): a far UV-imaging spectrograph on DMSP F-16. Proceedings Optical Spectroscopic Techniques, Remote Sensing, and Instrumentation for Atmospheric and Space Research IV 2002, 4485. [Google Scholar] [CrossRef]
- Grubb, R.N. The SMS/GOES space environment monitor subsystem. NOAA technical memorandum ERL SEL Space Environment Laboratory, Boulder Colorado. 1975, 42. [Google Scholar]
- Nishida, A. The Geotail Mission. Geophysical Research Letters 1994, 21, 2871–2873. [Google Scholar] [CrossRef]
- Williams, D.J.; McEntire, R.W.; Schlemm II, C.; Lui, A.T.Y.; Gloeckler, G.; Christon, S.P.; Gliem, F. Geotail energetic particles and ion composition instrument. Journal of Geomagnetism and Geoelectricity 1994, 46, 39–57. [Google Scholar] [CrossRef]
- Sibeck, D.G.; Angelopoulos, V. THEMIS science objectives and mission phases. Space Science Reviews 2008, 141, 35–59. [Google Scholar] [CrossRef]
- Newell, P.T.; Gjerloev, J.W. Evaluation of SuperMAG auroral electrojet indices as indicators of substorms and auroral power. Journal of Geophysical Research 2011, 116(A12), A12211. [Google Scholar] [CrossRef]
- Forsyth, C.; Rae, I.J.; Coxon, J.C.; Freeman, M.P.; Jackman, C.M.; Gjerloev, J.; Fazakerley, A.N. A new technique for determining substorm onsets and phases from indices of the Electrojet (SOPHIE). Journal of Geophysical Research: Space Physics 2015, 120, 10,592–10,606. [Google Scholar] [CrossRef]
- Ohtani, S.; Gjerloev, J.W. Is the substorm current wedge an ensemble of wedgelets? Revisit to midlatitude positive bays. Journal of Geophysical Research: Space Physics 2020, 125, e2020JA027902. [Google Scholar] [CrossRef]
- Trivedi, N.B.; Pathan, B.M.; Schuch, N.J.; Barreto, M.; Dutra, L.G. Geomagnetic phenomena in the South Atlantic anomaly region in Brazil. Advances in Space Research 2005, 36, 21–24. [Google Scholar] [CrossRef]
- Pavlov, A. Mechanisms of the electron density depletion in the SAR arc region. Annales Geophysicae 1996, 14, 211–221. [Google Scholar] [CrossRef]
- Karpachev, A.T.; Deminov, M.G.; Afonin, V.V. Model of the mid-latitude ionospheric trough on the base of Cosmos-900 and Intercosmos-19 satellites data. Advances in Space Research 1996, 18, 221–230. [Google Scholar] [CrossRef]
- Karpachev, A.T. Dynamics of main and ring ionospheric troughs at the recovery phase of storms/substorms. Journal of Geophysical Research: Space Physics 2021, 126, e2020JA028079. [Google Scholar] [CrossRef]
- Karpachev, A.T. Statistical analysis of ring ionospheric trough characteristics. Journal of Geophysical Research: Space Physics 2021, 126, e2021JA029613. [Google Scholar] [CrossRef]
- Karpachev, Advanced Classification of Ionospheric Troughs in the Morning and Evening Conditions. Remote Sensing 2022, 14, 4072. [CrossRef]
- Muldrew, D.B. F layer ionization troughs deduced from Alouette data. Journal of Geophysical Research 1965, 70, 2,635–2,650. [Google Scholar] [CrossRef]
- Puhl-Quinn, P.A.; Matsui, H.; Mishin, E.; Mouikis, C.; Kistler, L.; Khotyaintsev, Y.; Décréau, P.M.E.; Lucek, E. Cluster and DMSP observations of SAID electric fields. Journal of Geophysical Research 2007, 112(A5), A05219. [Google Scholar] [CrossRef]
- Heilig, B.; Stolle, C.; Kervalishvili, G.; Rauberg, J.; Miyoshi, Y.; Tsuchiya, F.; et al. Relation of the plasmapause to the midlatitude ionospheric trough, the sub-auroral temperature enhancement and the distribution of small-scale field aligned currents as observed in the magnetosphere by THEMIS, RBSP, and Arase, and in the topside ionosphere by Swarm. Journal of Geophysical Research: Space Physics 2022, 127, e2021JA029646. [Google Scholar] [CrossRef]
- Jaggi, R.K.; Wolf, R.A. Self-consistent calculation of the motion of a sheet of ions in the magnetosphere. Journal of Geophysical Research 1973, 78, 2852–2866. [Google Scholar] [CrossRef]
- Vasyliunas, V.M. Mathematical Models of Magnetospheric Convection and its Coupling to the Ionosphere. In: McCormac, B.M. (eds) Particles and Fields in the Magnetosphere. Astrophysics and Space Science Library 1970, 17, 60–71. [Google Scholar] [CrossRef]
- Vasyliunas, V.M. The Interrelationship of Magnetospheric Processes. In Earth’s Magnetospheric Processes. Astrophysics and Space Science Library; McCormac, B.M., Ed.; Springer: Dordrecht, 1972; Volume 32, pp. 29–38. [Google Scholar] [CrossRef]
- Senior, C.; Blanc, M. On the control of magnetospheric convection by the spatial distribution of ionospheric conductivities. Journal of Geophysical Research 1984, 89(A1), 261–284. [Google Scholar] [CrossRef]
- Kelley, M.C.; Makela, J.J.; Chau, J.L.; Nicolls, M.J. Penetration of the solar wind electric field into the magnetosphere/ionosphere system. Geophysical Research Letters 2003, 30. [Google Scholar] [CrossRef]
- Huang, C.S.; Foster, J. C.; Kelley, M.C. Long-duration penetration of the interplanetary electric field to the low-latitude ionosphere during the main phase of magnetic storms. Journal of Geophysical Research 2005, 110(A11), A11309. [Google Scholar] [CrossRef]
- Maruyama, N.; Sazykin, S.; Spiro, R.W.; Anderson, D.; Anghel, A.; Wolf, R.A.; Toffoletto, F.; Fuller-Rowell, T.J.; Codrescu, M.V.; Richmond, A.D.; Millward, G.H. Modeling storm-time electrodynamics of the low latitude ionosphere-thermosphere system: can long lasting disturbance electric fields be accounted for? Journal of Atmospheric and Solar-Terrestrial Physics 2007, 69, 1182–1199. [Google Scholar] [CrossRef]
- Walach, M.-T.; Grocott, A. Modeling the time-variability of the ionospheric electric potential (TiVIE). Space Weather 2025, 23, e2024SW004139. [Google Scholar] [CrossRef]
- Frank, L.A. Relationship of the plasma sheet, ring current, trapping boundary, and plasmapause near the magnetic equator and local midnight. Journal of Geophysical Research 1971, 76, 2,265–2,275. [Google Scholar] [CrossRef]
- Galperin, Yu.I.; Feldstein, Ya.I. Mapping of the precipitation region to the plasma sheet. Journal of geomagnetism and geoelectricity 1996, 48, 857–875. [Google Scholar] [CrossRef]
- Blanc, M. Midlatitude convection electric fields and their relation to ring current development. Geophysical Research Letters 1978, 5, 203–206. [Google Scholar] [CrossRef]
- Blanc, M. Magnetospheric convection effects at mid-latitudes 1. Saint-Santin observations. Journal of Geophysical Research 1983, 88, 211–213. [Google Scholar] [CrossRef]
- Schield, M. A.; Freeman, J.W.; Dessler, A.J. A source for field-aligned currents at auroral latitudes. Journal of Geophysical Research 1969, 74, 247–256. [Google Scholar] [CrossRef]
Figure 1.
The schematic diagrams depict the two-cell convection pattern characterized by (a) a dawnward intruding dusk cell and (b) a duskward-intruding dawn cell. The arrows in light blue and orange indicate plasma flow directions.
Figure 1.
The schematic diagrams depict the two-cell convection pattern characterized by (a) a dawnward intruding dusk cell and (b) a duskward-intruding dawn cell. The arrows in light blue and orange indicate plasma flow directions.
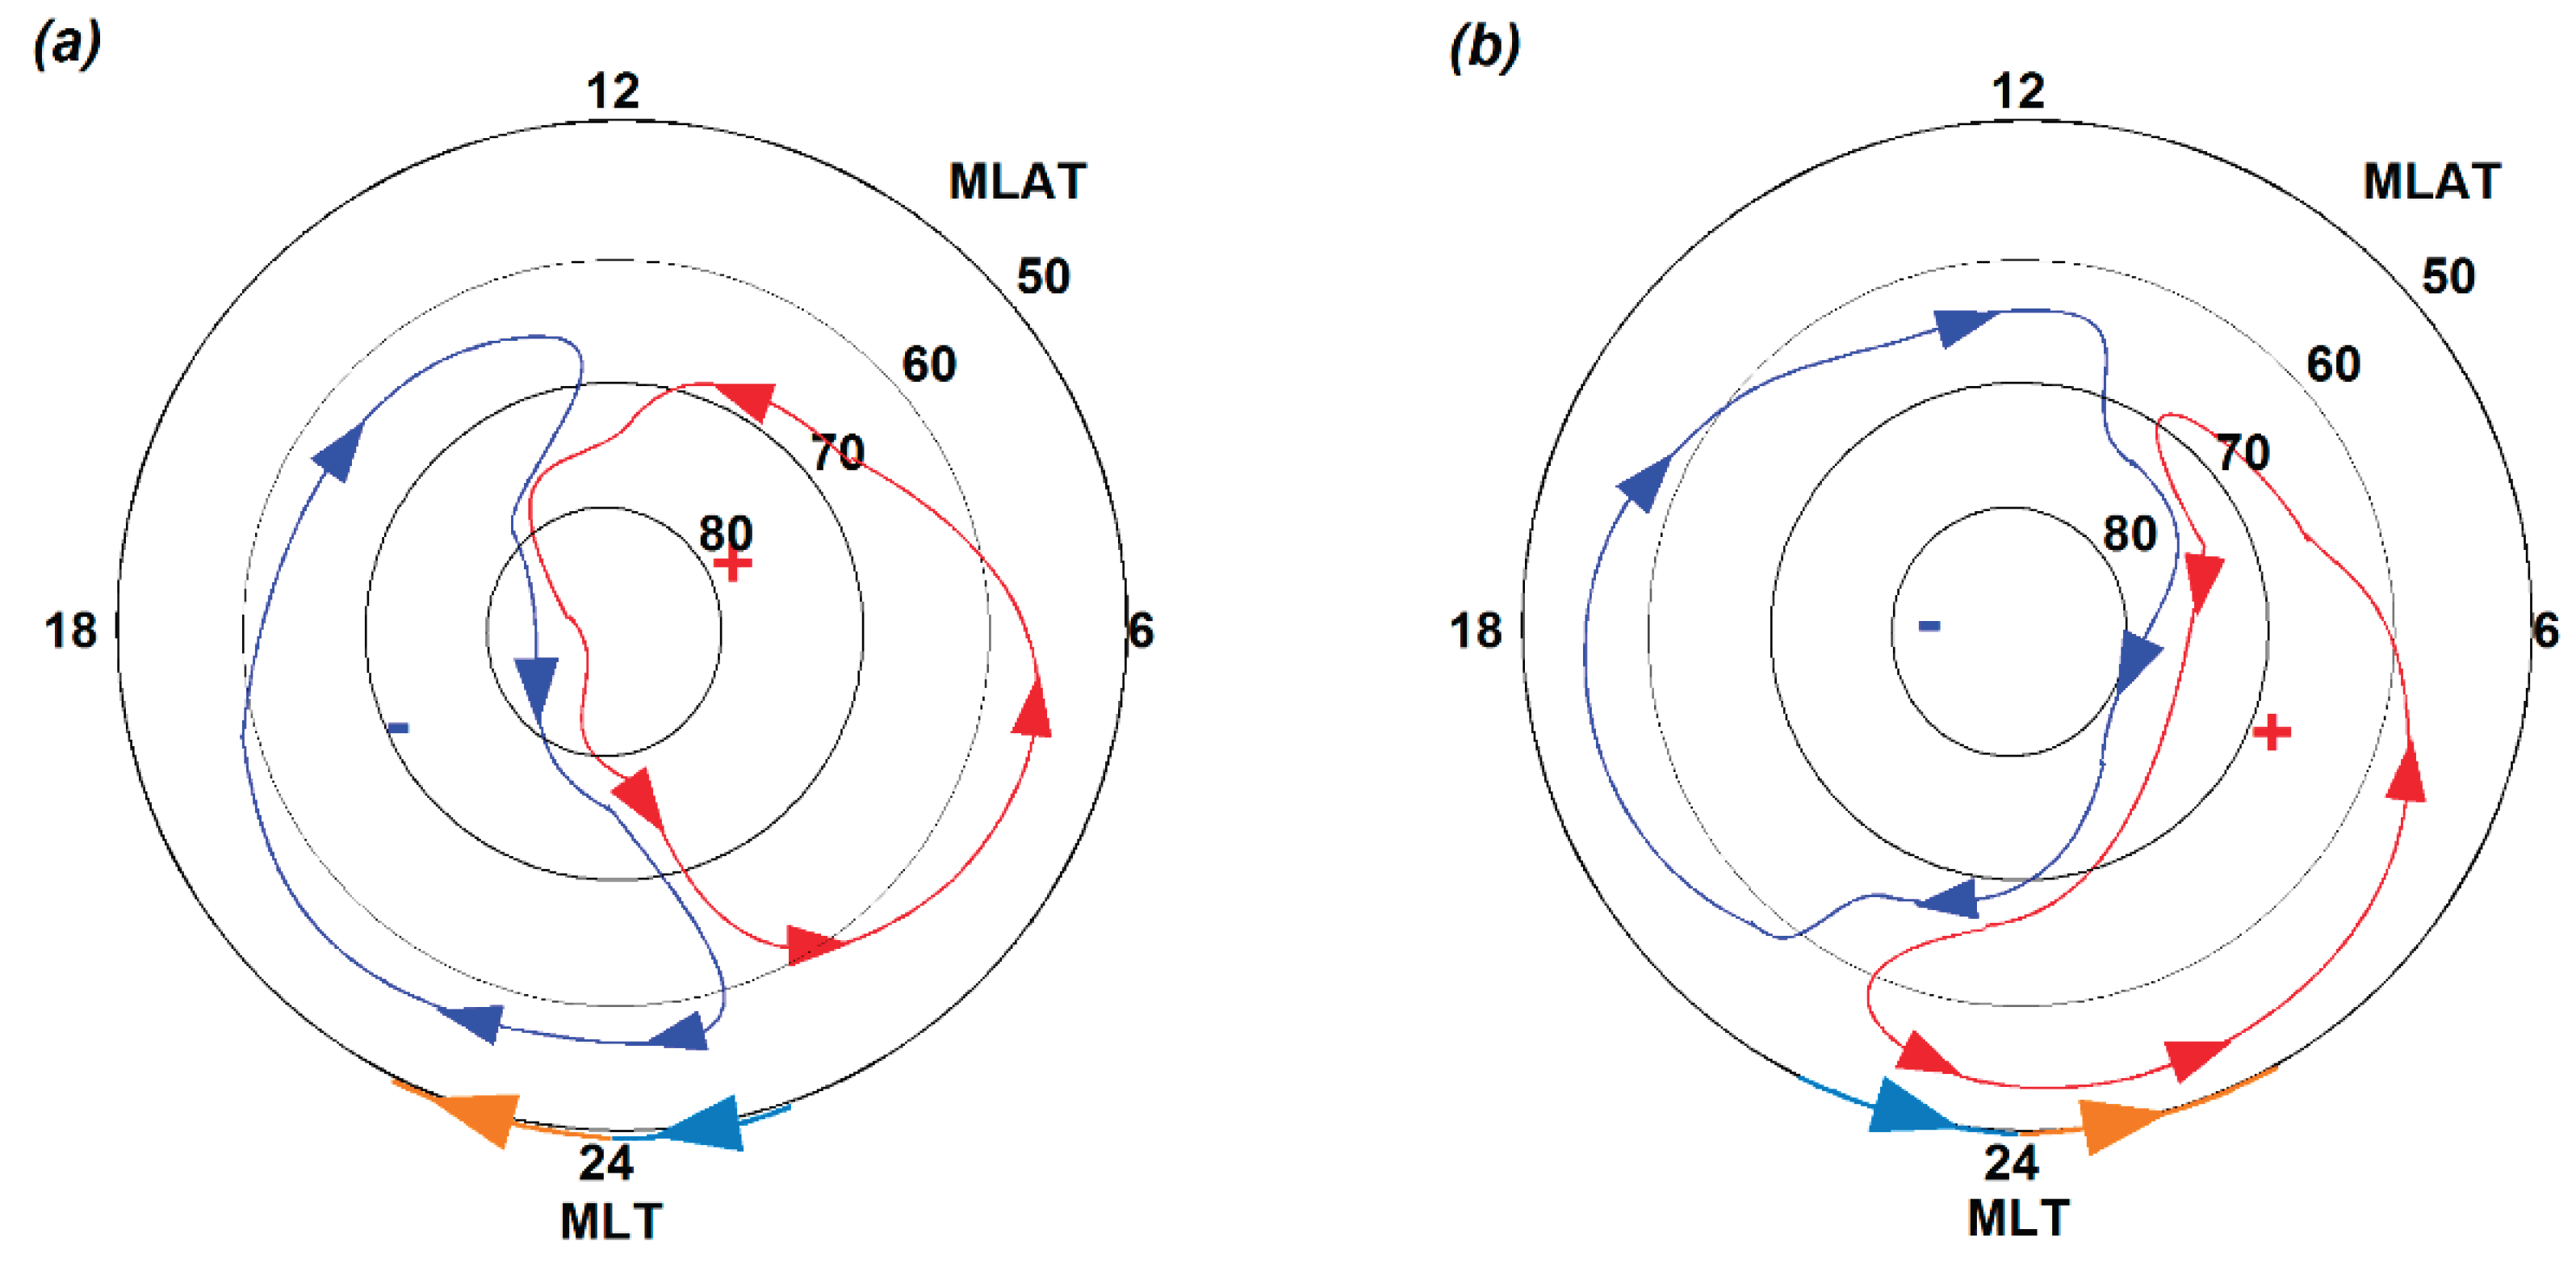
Figure 2.
The southern-hemisphere maps depict the 17 SAPS detections (dot symbols in colors) made by DMSP F15 in the African and South-American longitude sectors (a) in 2015 and (c) in 2016 and on both sides of the magnetic midnight meridian (b) in 2015 and (d) in 2016.
Figure 2.
The southern-hemisphere maps depict the 17 SAPS detections (dot symbols in colors) made by DMSP F15 in the African and South-American longitude sectors (a) in 2015 and (c) in 2016 and on both sides of the magnetic midnight meridian (b) in 2015 and (d) in 2016.
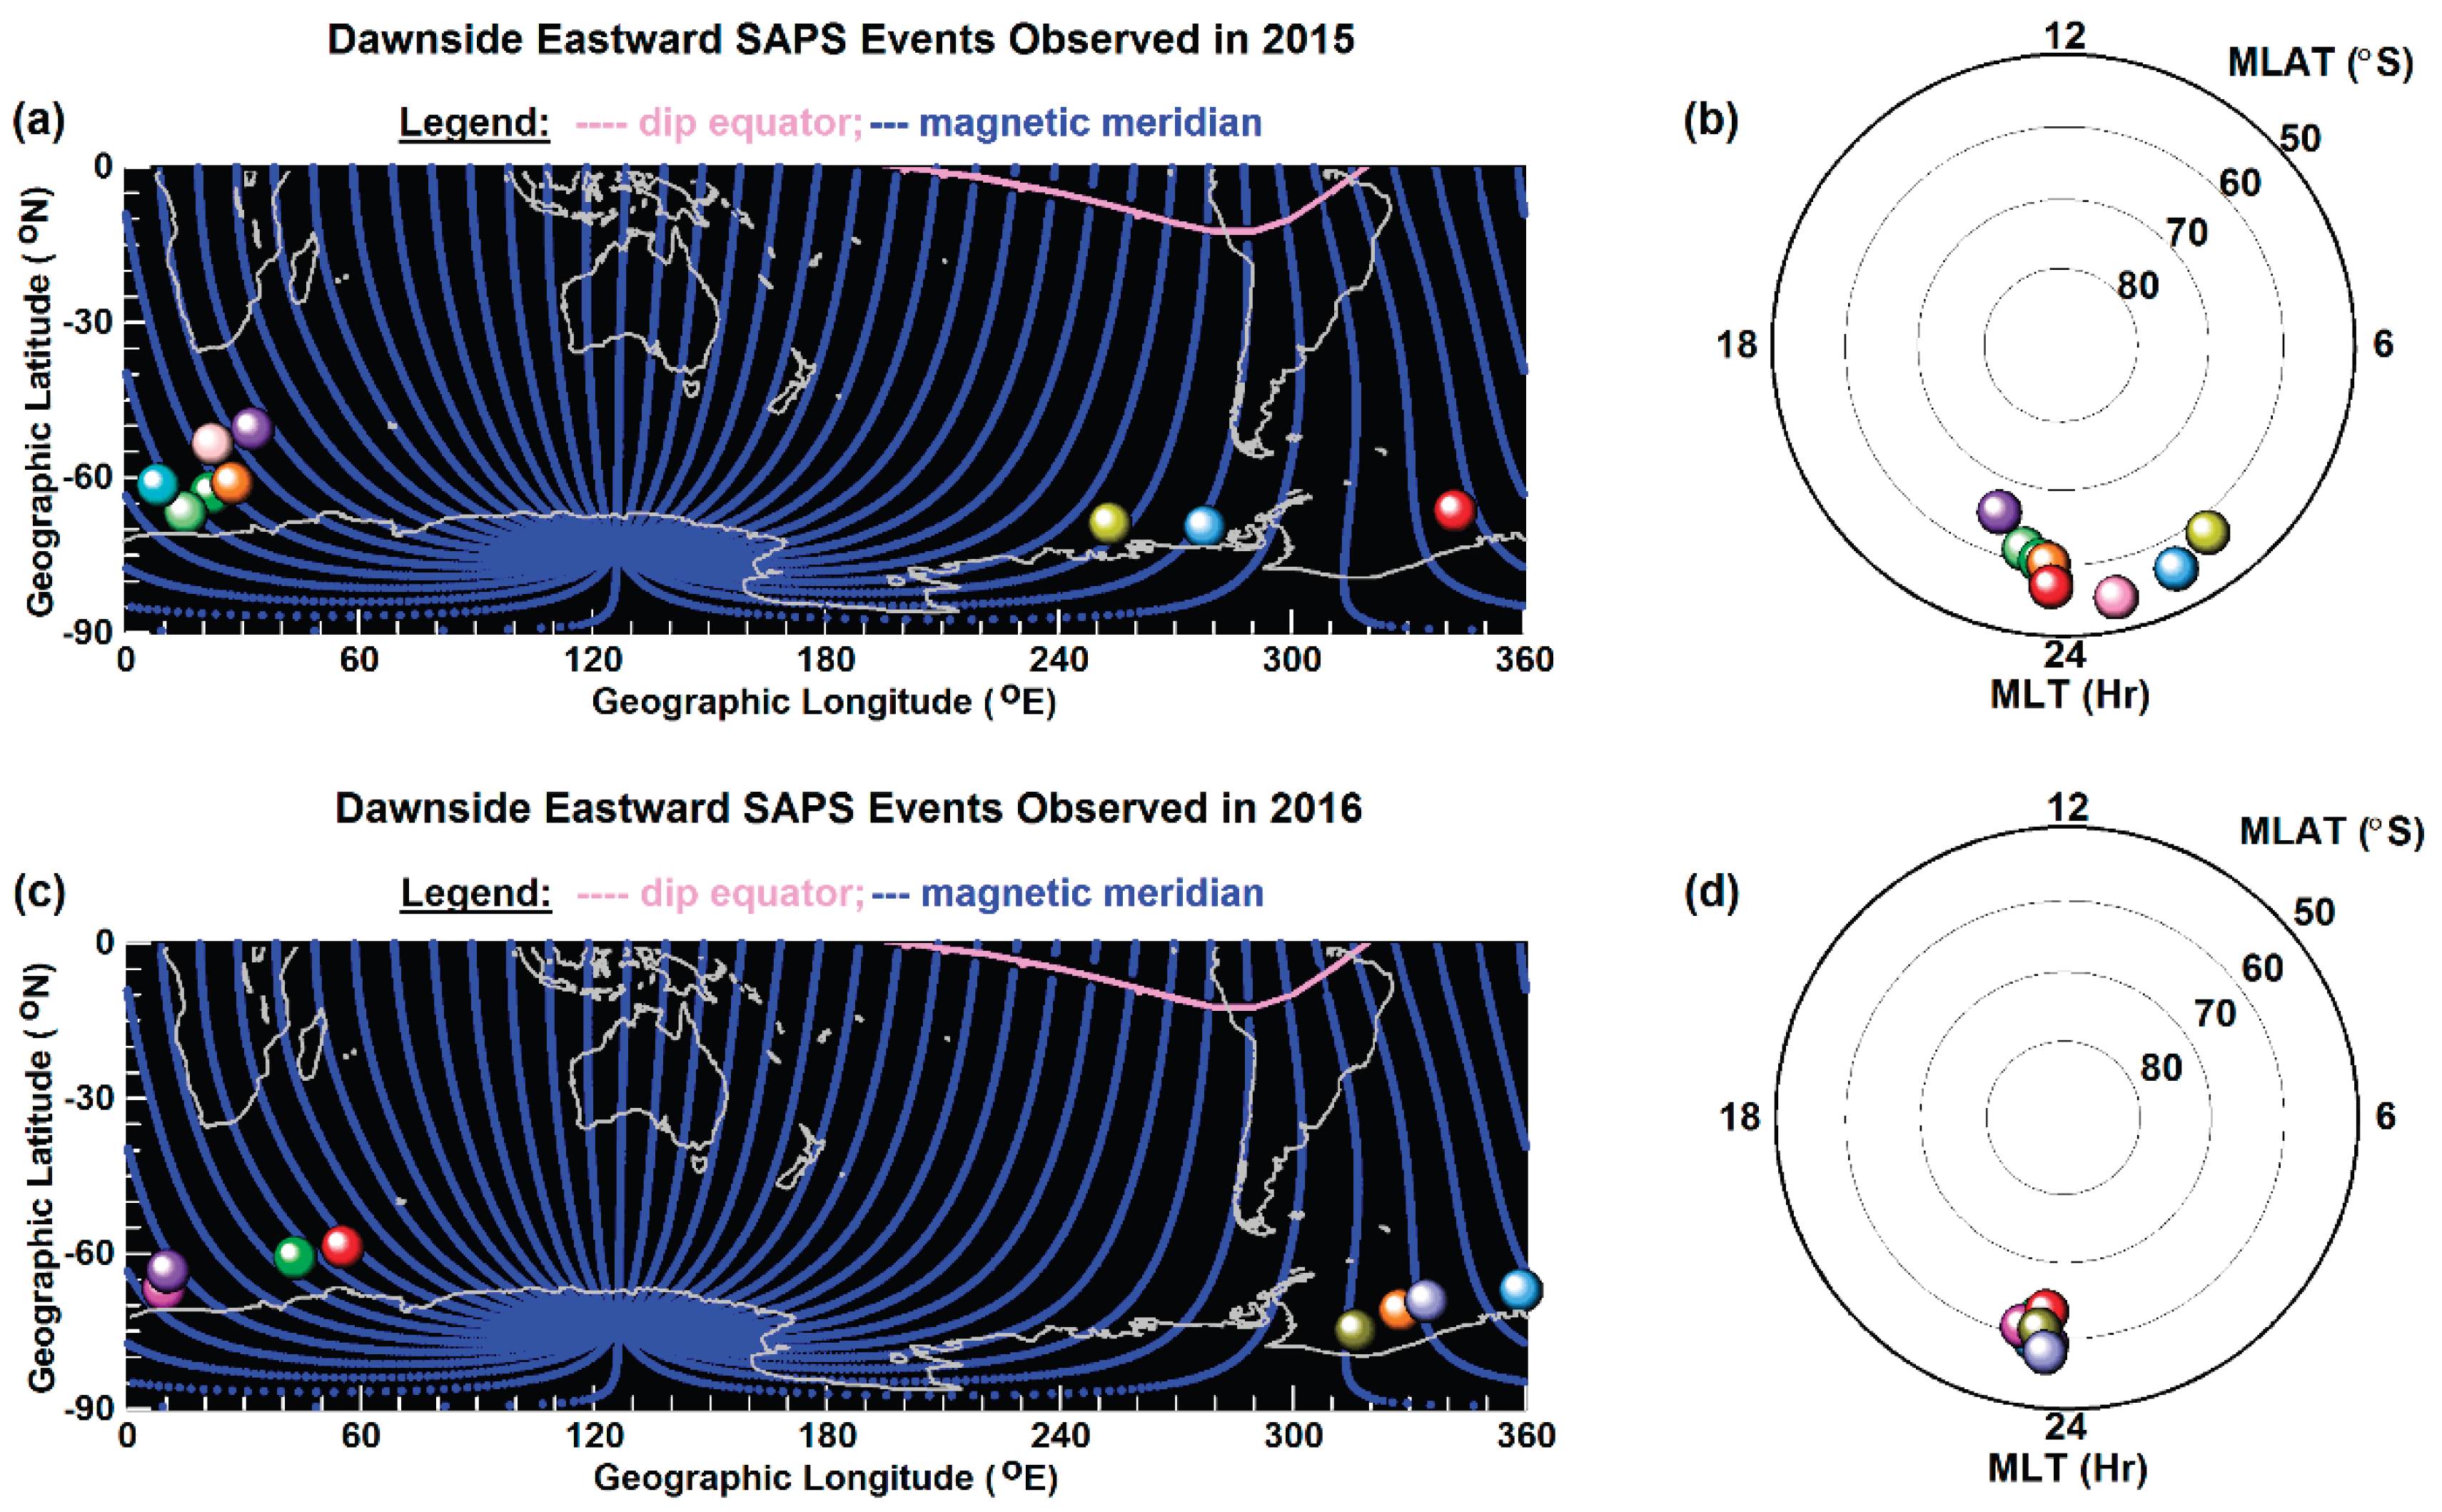
Figure 3.
The DMSP F15 line-plot sets depict the 2015 eastward SAPS events. The amplified eastward SAPS flow (dot symbol in color, shaded interval in yellow) streamed (a-b) antisunward before magnetic midnight and (c) sunward after magnetic midnight and in the deep plasma density trough (i.e., coincisding RIT (circle in red) and MIT (circle in blue)), where Te became elevated. The plasmapause is marked as PP.
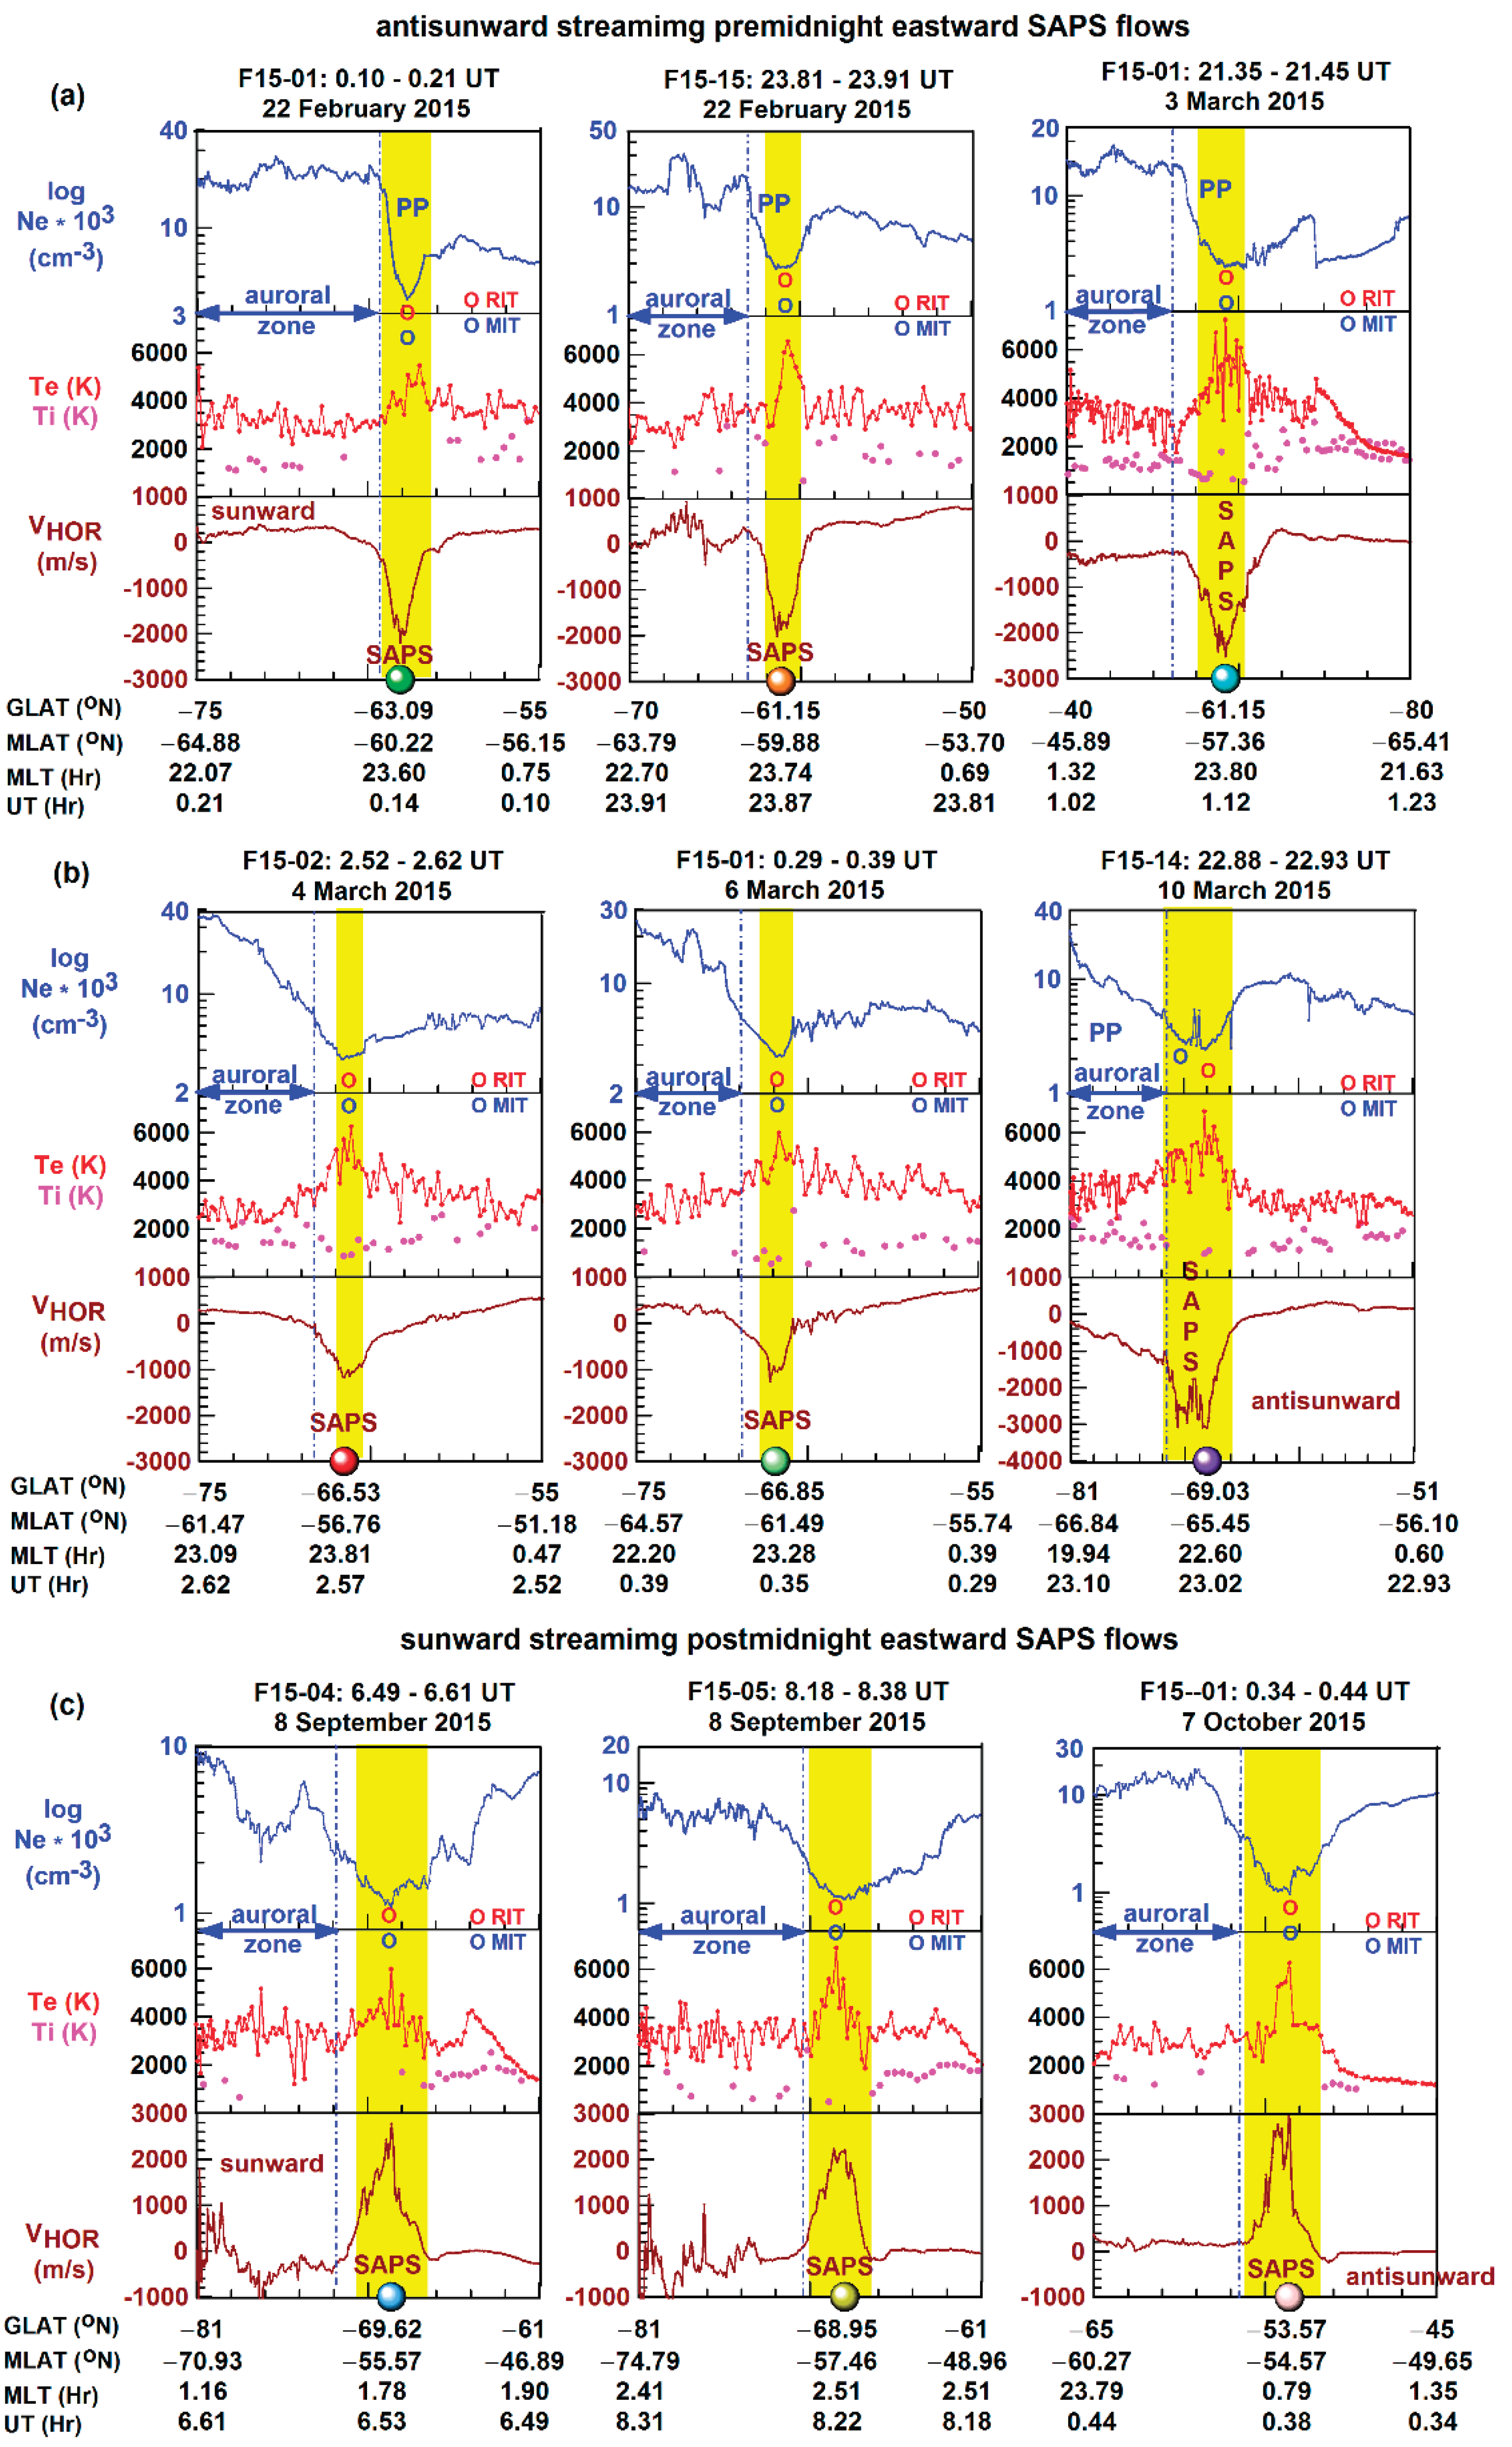
Figure 4.
The DMSP F15 line-plot sets depict the 2016 eastward SAPS events. The amplified eastward SAPS flow (dot symbol in color, shaded interval in yellow) streamed (a-b) antisunward before magnetic midnight within the deep plasma density trough (i.e., coincisding RIT (circle in red) and MIT (circle in blue)), where Te became elevated. The plasmapause is marked as PP.
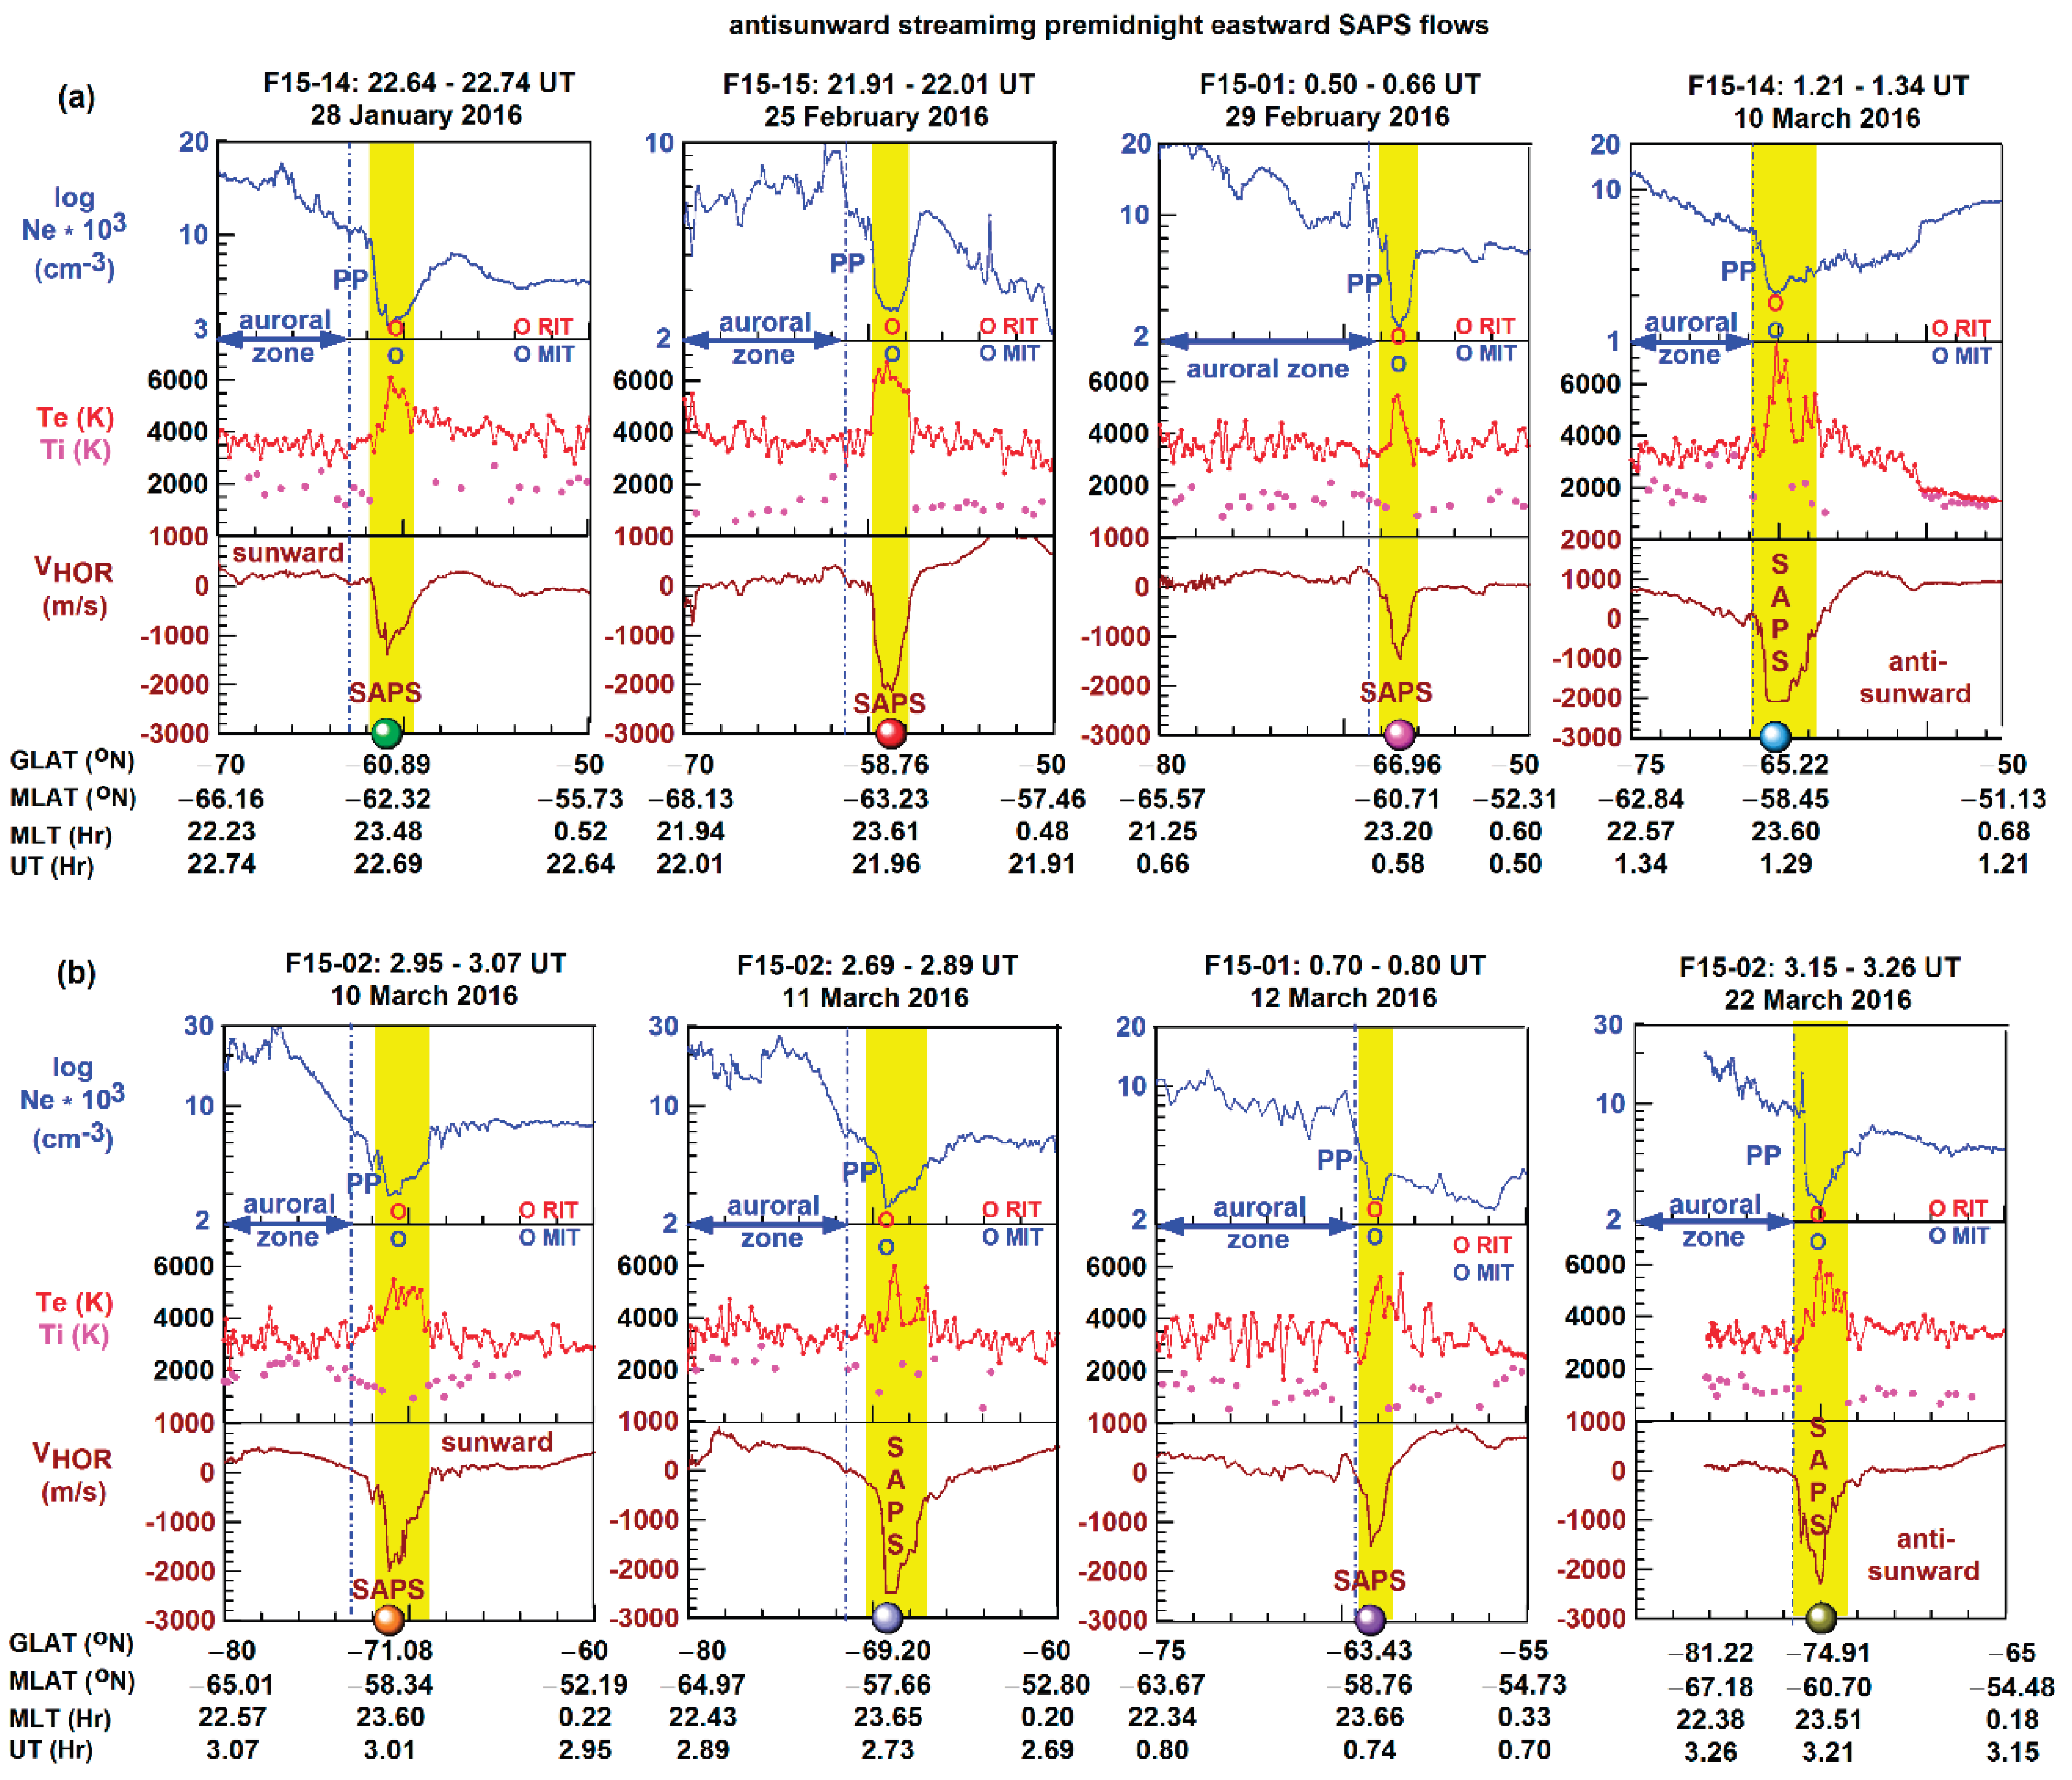
Figure 5.
The line-plot sets are constructed with the data of IMF BY and BZ and IEF EY components, and SYM-H, Kp, and AE indices, and for the (a) 2015 and (b) 2016 eastward SAPS evemts. Each SAPS event of interest is marked (dot symbol in color; shaded interval in yellow) along with the preceding substorm onset (star symbol in red).
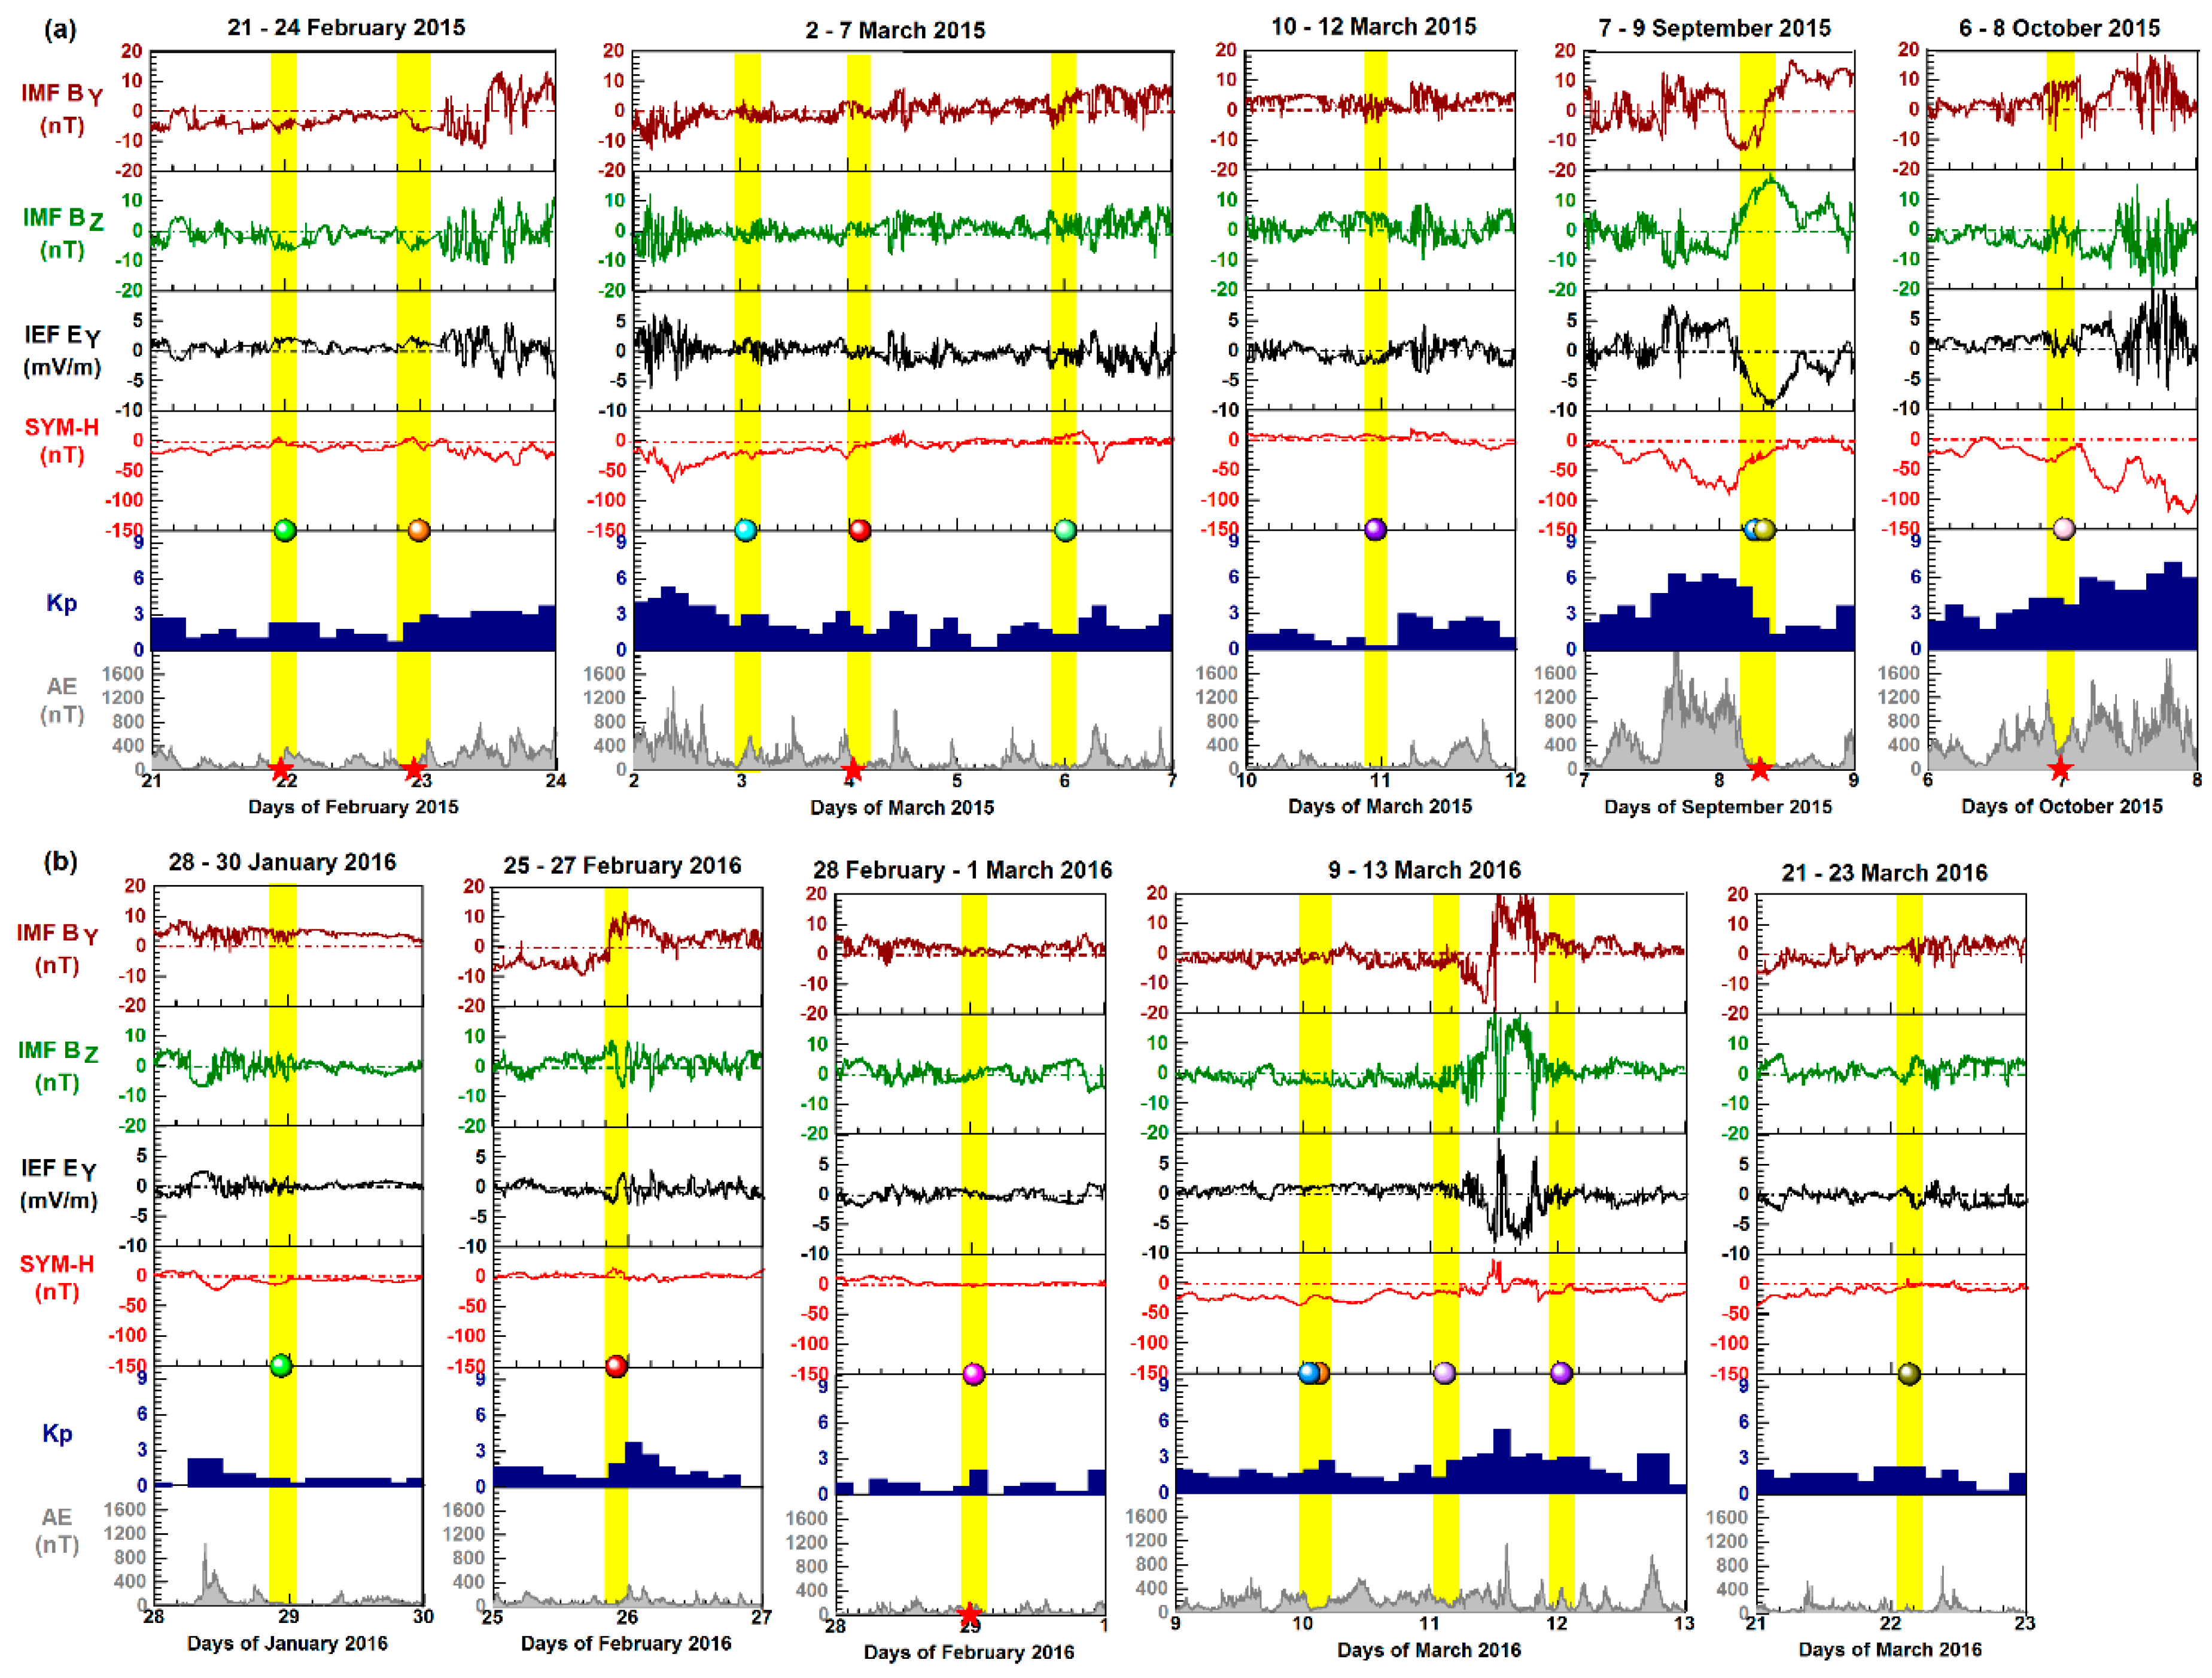
Figure 6.
(a) The southern-hemisphere map shows the ground track of DMSP F15 (in light red) and the location of eastward SAPS (dot symbol in ligh red) in the African longitude sector and the GOES-13 footprints (in red) in the South-American longitude sector. (b) The DMSP F15 line plots show the plasma environment of the amplified eastward SAPS flow (shaded interval in yellow) streaming sunward after magnetic midnight. The MLT versus MLAT polar maps, where the F15 pass ground track and SAPS location are plotted, illustrate the underlying (c) two-cell polar convection and (d) auroral precipitations. (e) The GOES-13–measured electron flux time series show a series of substorm onsets (symbol stars in red) and particle injections (shaded intervals in yellow) occurring prior to the detection of eastward SAPS (symbol dot in light red; shaded interval in yellow).
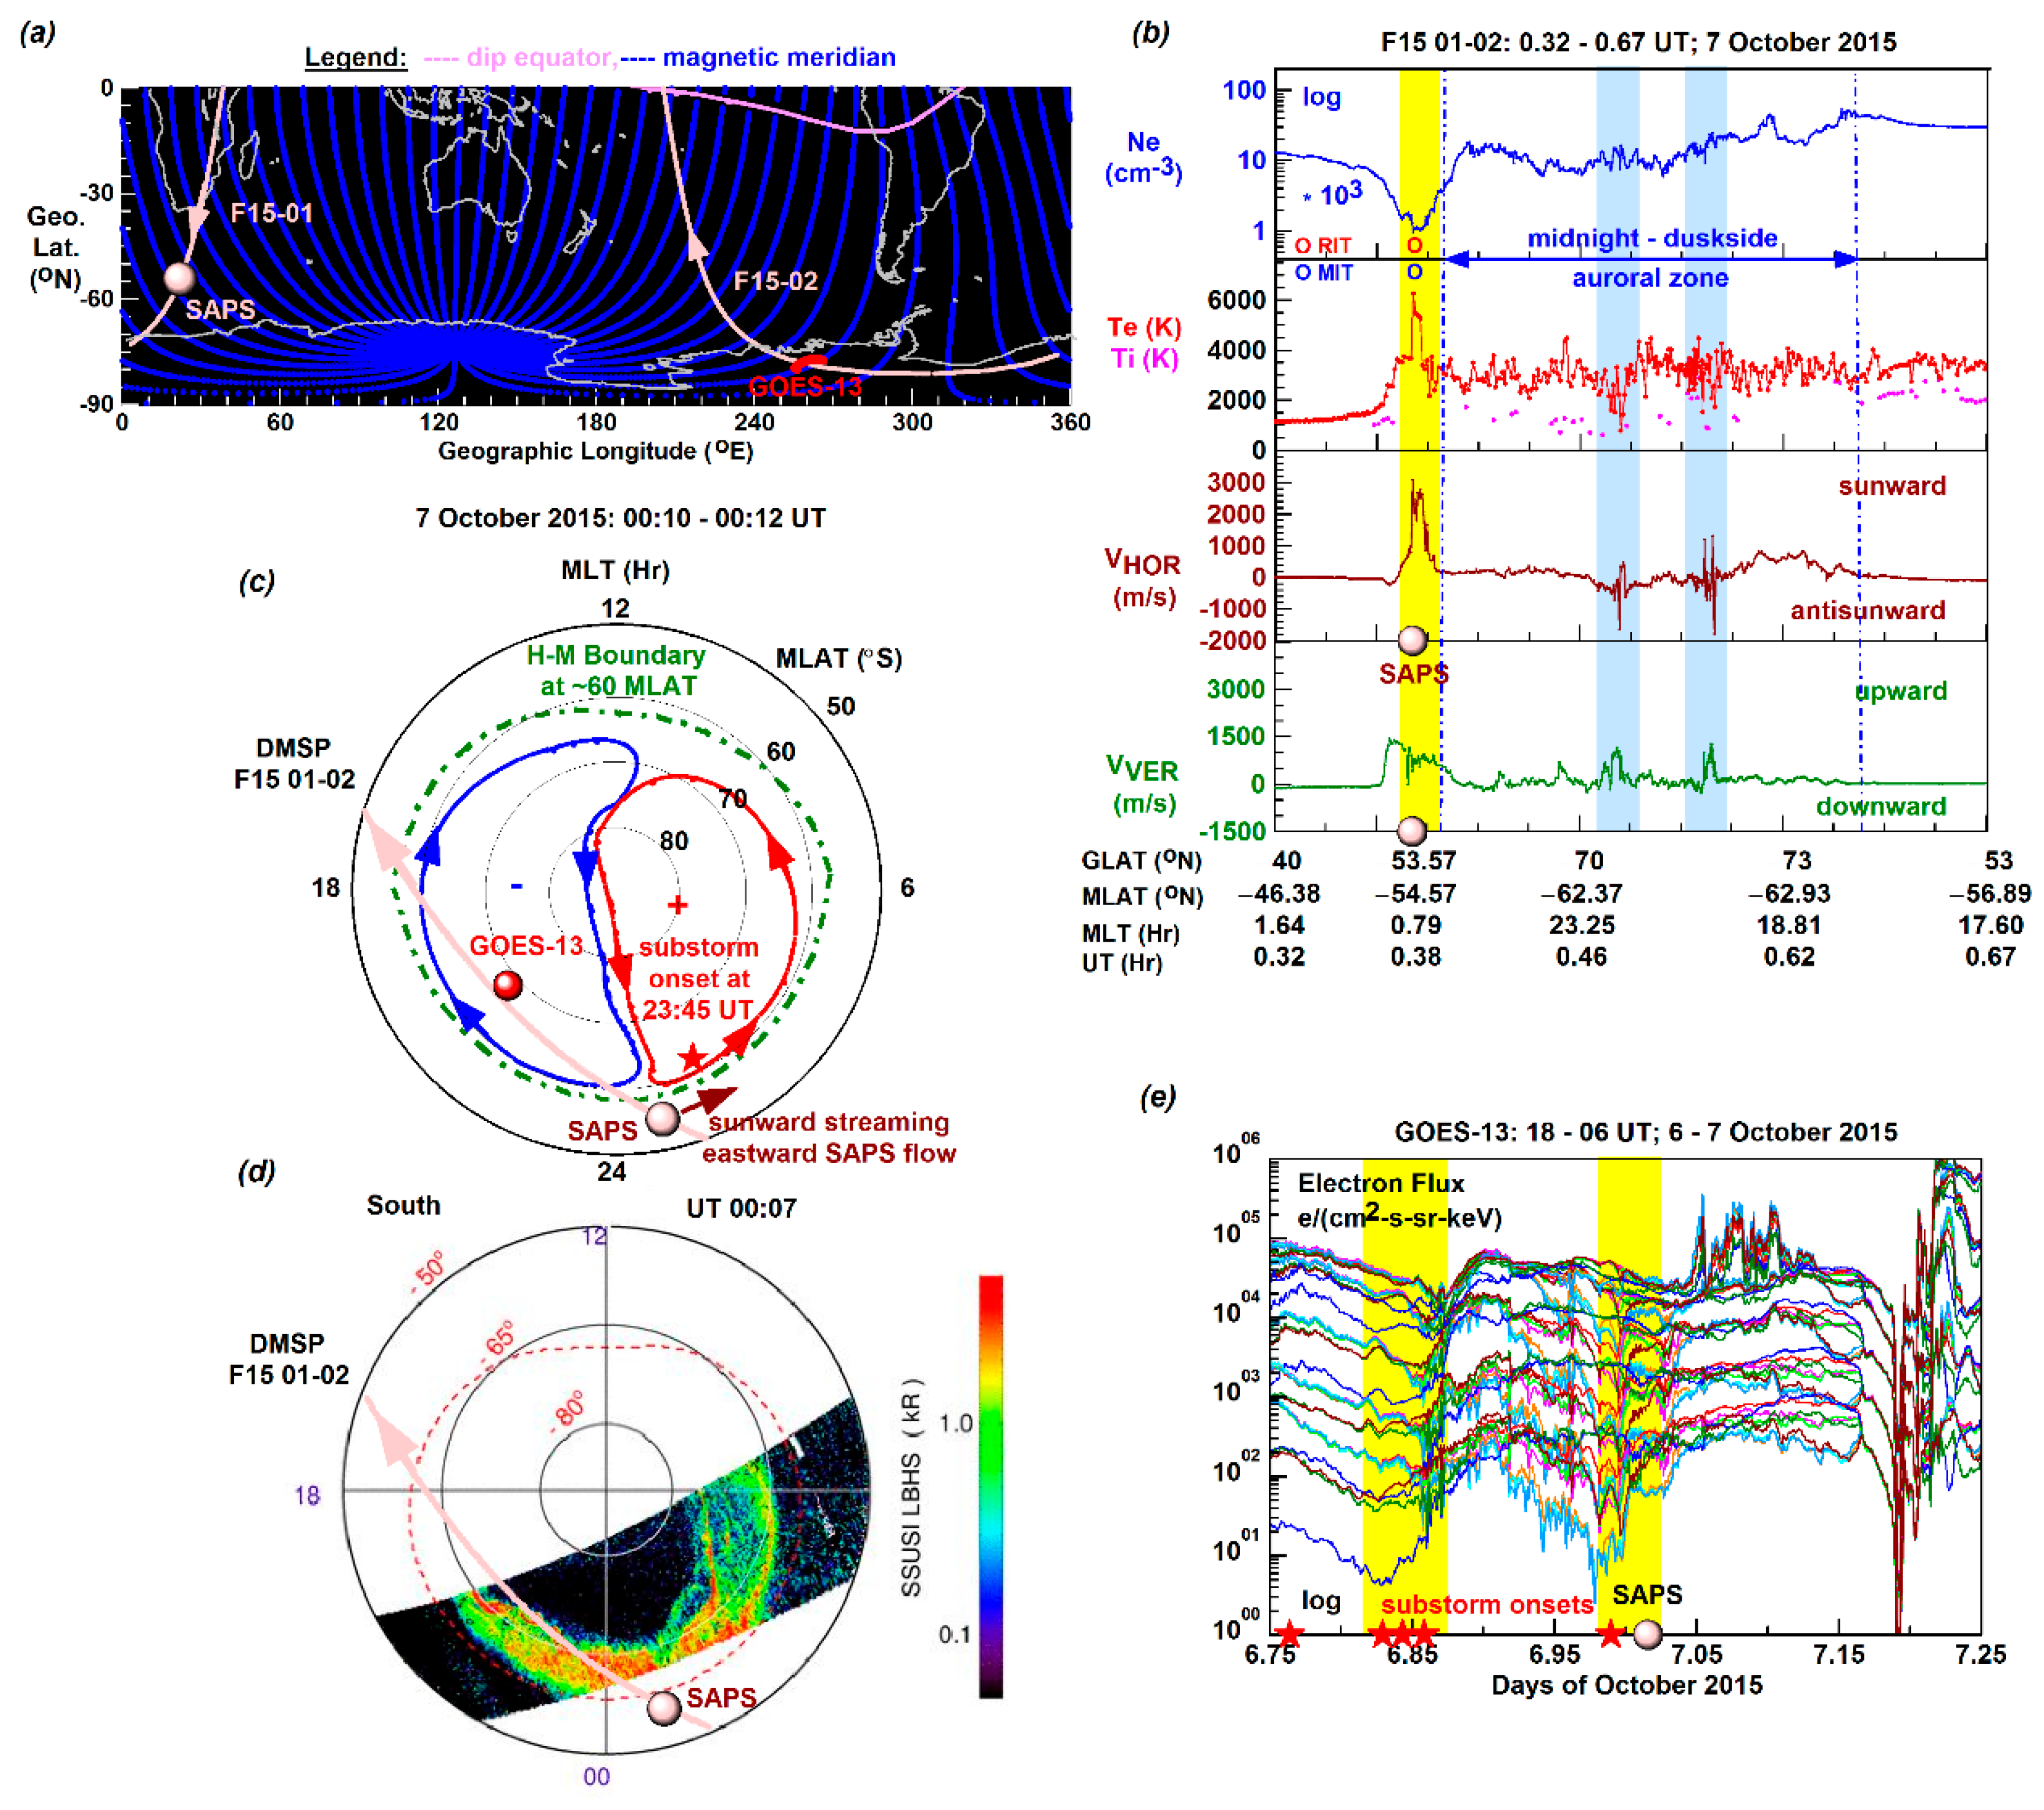
Figure 7.
(a) The southern-hemisphere map shows the ground track of DMSP F15 (in cyan) and the location of eastward SAPS (dot symbol in cyan) in the African longitude sector. (b) The DMSP F15 line plots show the plasma environment of the amplified eastward SAPS flow (shaded interval in yellow) streaming antisunward before magnetic midnight. The MLT versus MLAT polar maps, where the F15 pass ground track and SAPS location are plotted, illustrate the underlying (c) two-cell polar convection and (d) auroral precipitations. (e) The GEOTAIL–measured ion differential flux time series show a series of substorm onsets (symbol stars in red) and particle injections (shaded interval in yellow) occurring prior to the detection of eastward SAPS (symbol dot in cyan; shaded intervals in yellow).
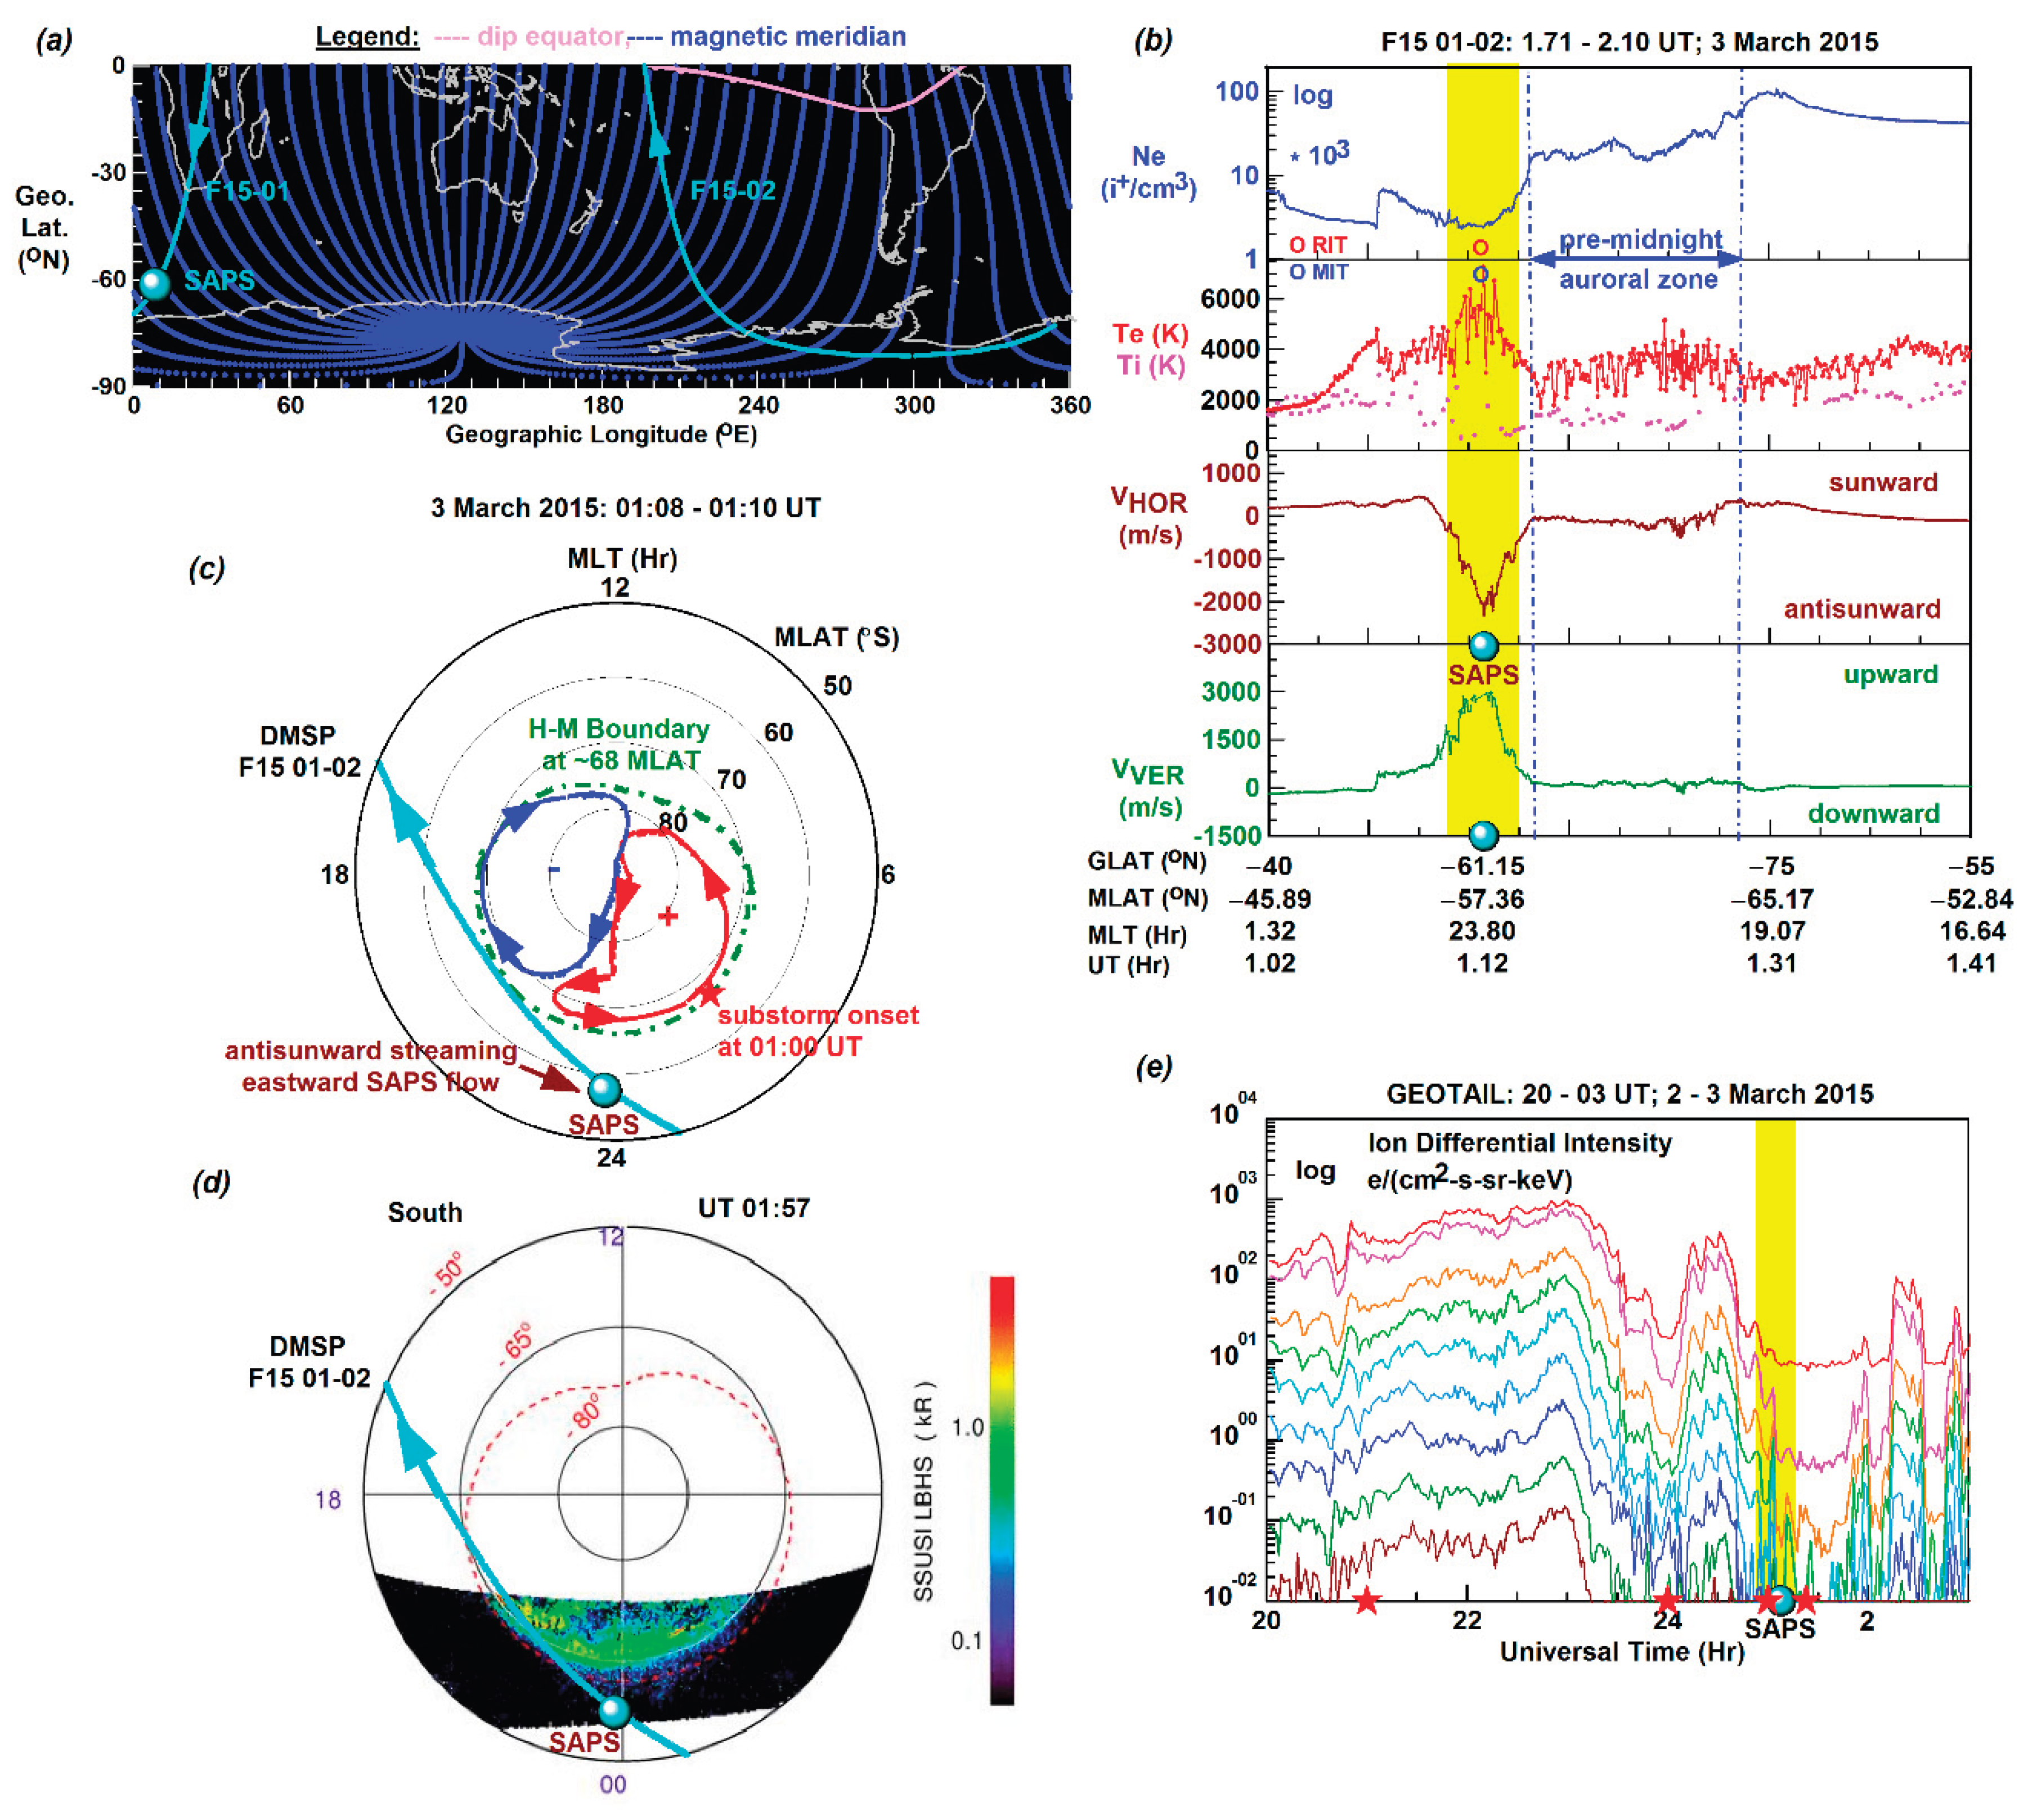
Figure 8.
(a) The southern-hemisphere map shows the ground tracks of DMSP F15 passes (in colors) and the eastward SAPS (dot symbols in colors) locations along with the TH-E footprints and EC location (in orange) observed in the South-American longitude sector and the GOES-15 footprints (in red) over the South Pacific. (b) The DMSP F15 line-plot sets show the plasma environment of the emerging (symbol dot in light gray) and amplified (symbol dots in light blue and dark yellow) eastward SAPS flows (shaded intervals in yellow) streaming sunward after magnetic midnight. (c) The GOES-15–measured electron flux time series show a series of substorm onsets (symbol stars in red) and particle injections (shaded interval in yellow) occurring prior to the detection of the eastward SAPS flows (symbol dots in colours; shaded intervals in yellow). The MLT versus MLAT polar maps, where the F15 pass ground tracks and SAPS locations are plotted, illustrate the underlying two-cell polar convection of (d) the earlier SAPS events and (e) the later SAPS event. (f) The orbit plots show the TH-E orbit sections of interst along with the convection E field (EC) locations. (g) The TH-E line plots depict the plasma environmet of EC (symbol dot in orage; shaded interval in yellow) appearing near the plasmasheet’s earthwaard edge (shaded interval in gray) bounded by the plasmapause (PP) on the earthward side and trapping boundary (TB) on the tailward side.
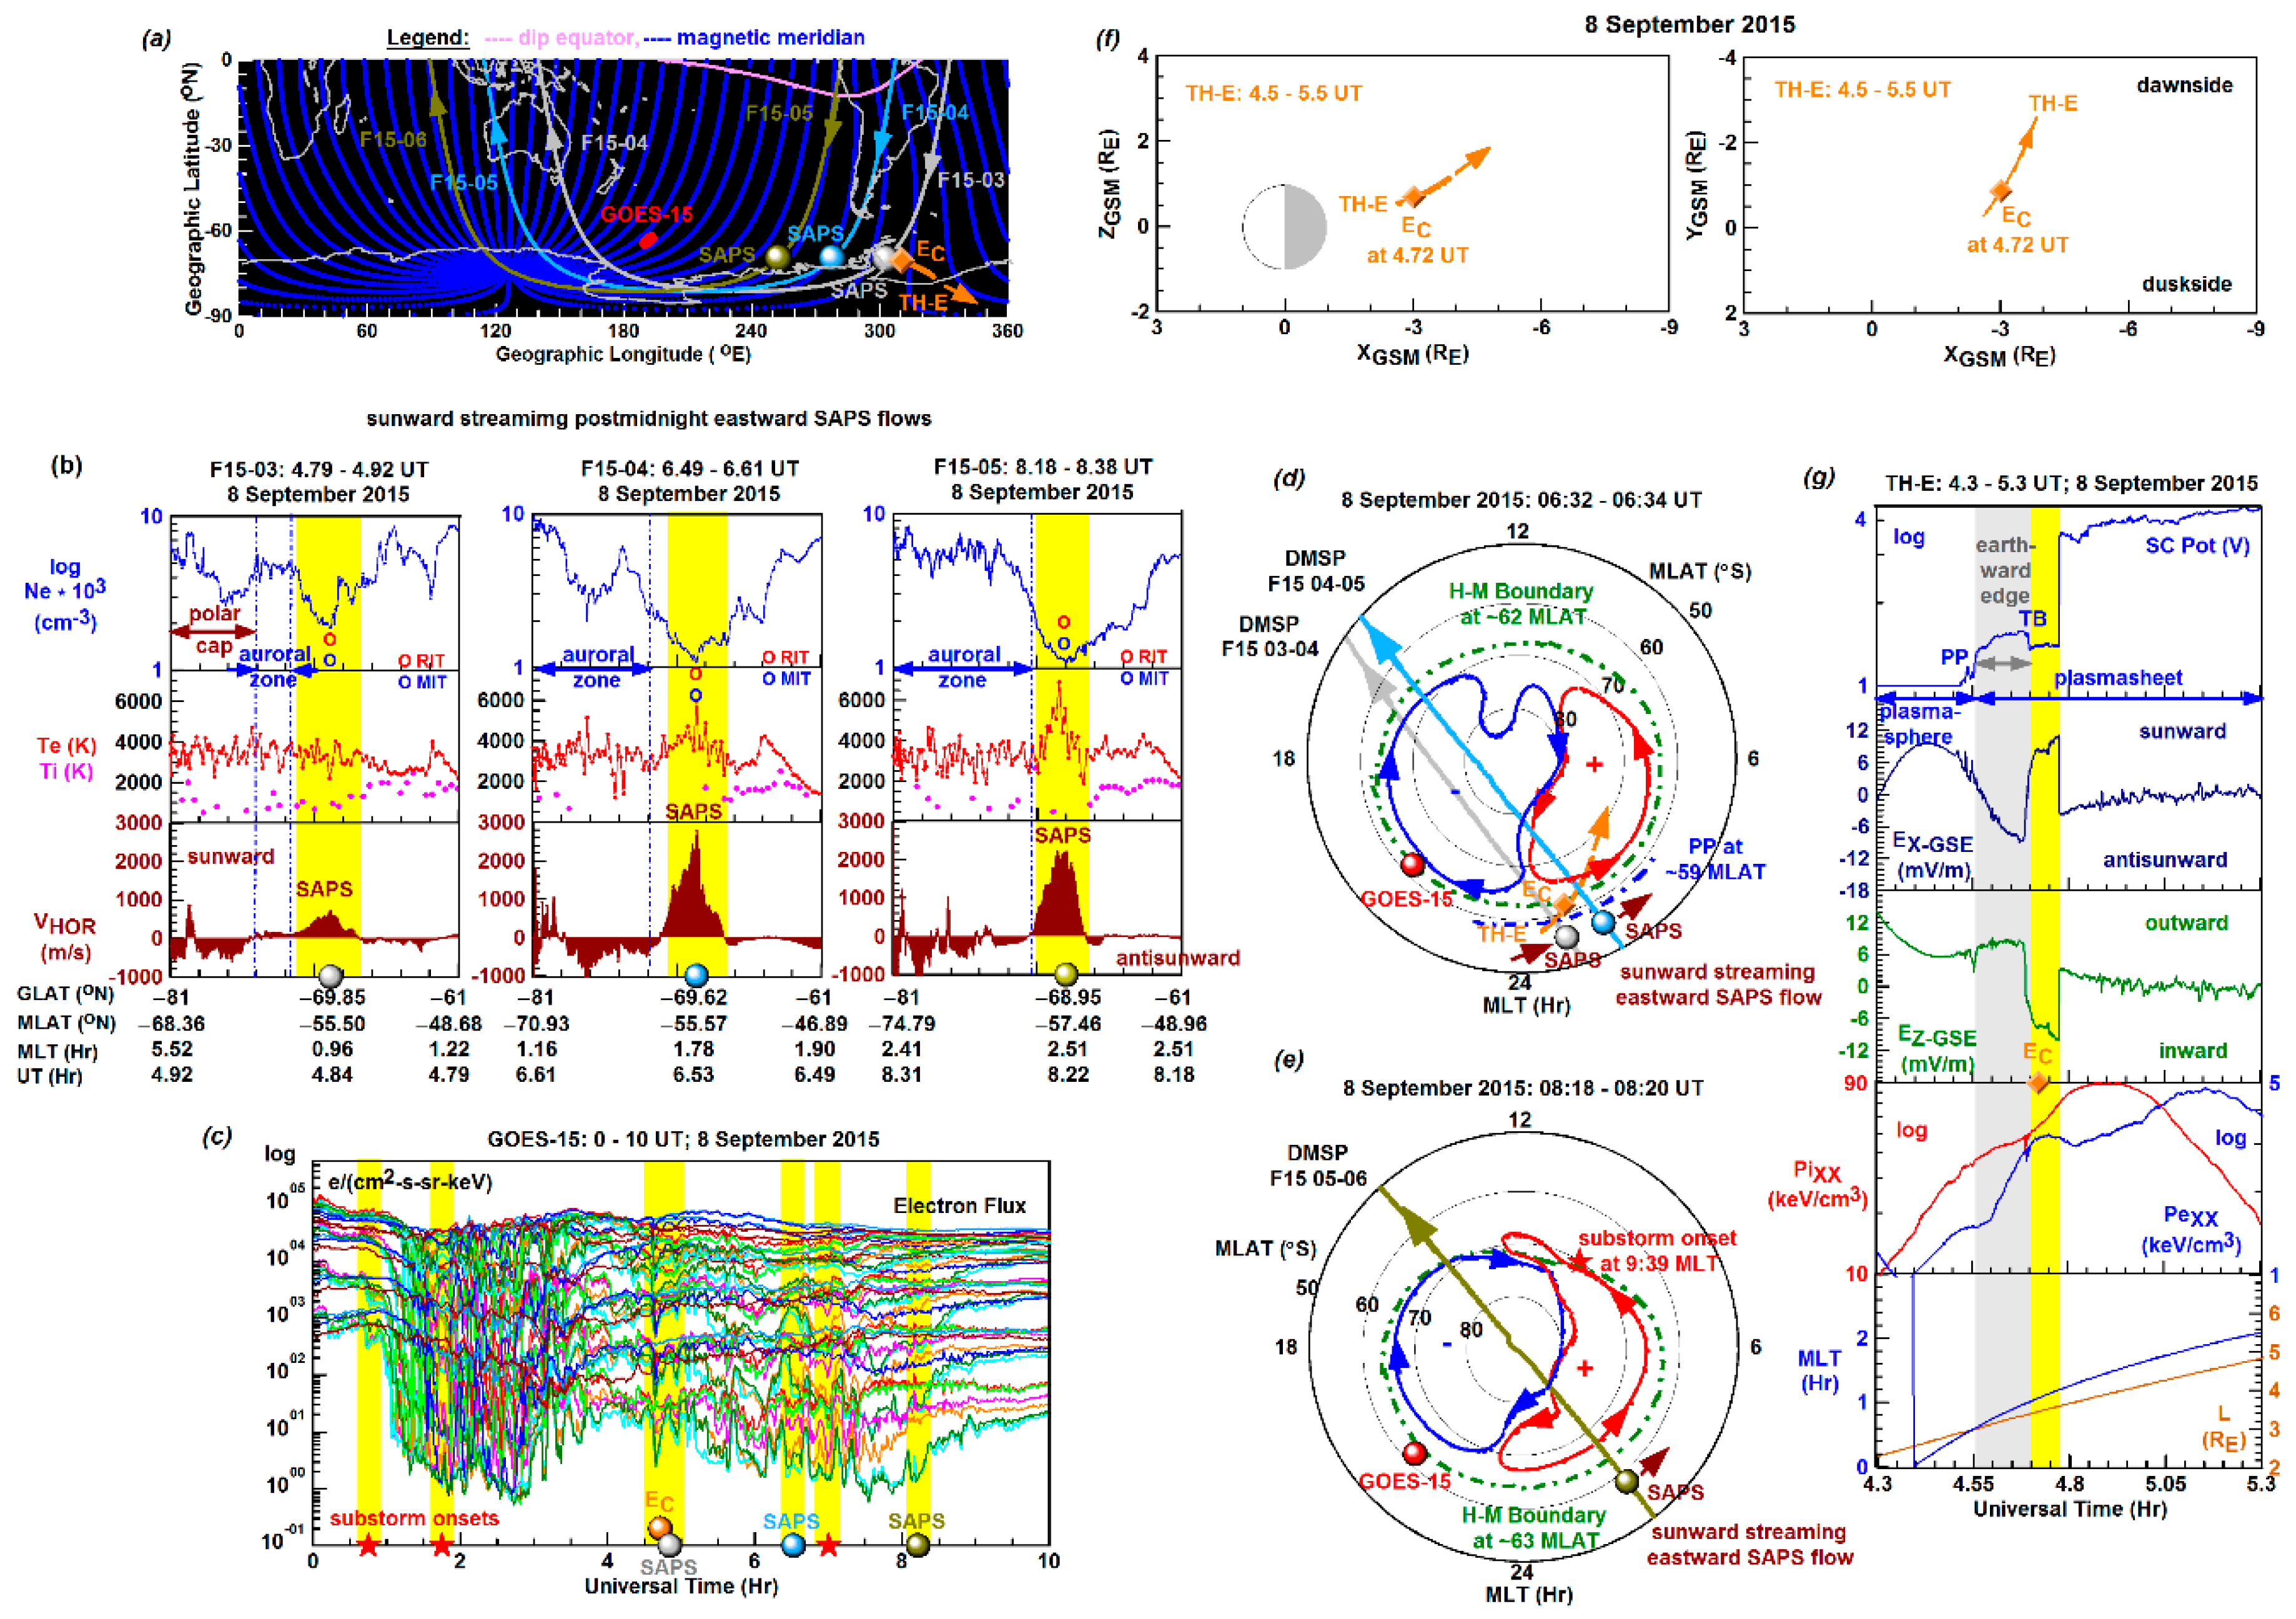

Table 1.
Topside-ionosphere eastward SAPS events investigated and DMSP F15 observations made.
| DMSP F15 observed eastward SAPS Event | DMSP F15 observables | ||||||
|---|---|---|---|---|---|---|---|
| Event Number |
Event Date |
UT (Hr:Mn) | MLAT (oS) | MLT (Hr:Mn) | Ne 103 (cm−3) |
VHOR (m/s) | Te (K) |
| 1 | 22 February 2015 | 00:08 | 60.22 | 23:36 | 3.5 | −2200 | 5500 |
| 2 | 22 February 2015 | 23:52 | 59.88 | 23:45 | 2.8 | −2000 | 6600 |
| 3 | 3 March 2015 | 01:07 | 57.36 | 23:48 | 2.5 | −2600 | 7400 |
| 4 | 4 March 2015 | 02:34 | 56.76 | 23:48 | 3.5 | −1200 | 6400 |
| 5 | 6 March 2015 | 00:21 | 61.49 | 23:17 | 3.2 | −1300 | 6000 |
| 6 | 10 March 2015 | 23:12 | 65.45 | 22:36 | 2.5 | −3100 | 7000 |
| 7 | 8 September 2015 | 06:32 | 55.57 | 01:47 | 1.1 | +2800 | 6000 |
| 8 | 8 September 2015 | 08:13 | 57.46 | 02:30 | 1.1 | +2200 | 7000 |
| 9 | 7 October 2015 | 00:23 | 54.57 | 00:47 | 1.0 | +3200 | 6400 |
| 10 | 28 January 2016 | 22:41 | 62.32 | 23:29 | 3.5 | −1400 | 6100 |
| 11 | 25 February 2016 | 21:57 | 63.23 | 23:37 | 2.8 | −2000 | 6700 |
| 12 | 29 February 2016 | 00:35 | 60.71 | 23:12 | 2.5 | −1400 | 5500 |
| 13 | 10 March 2016 | 01:17 | 58.48 | 23:36 | 2.1 | −2000 | 7500 |
| 14 | 10 March 2016 | 03:06 | 58.34 | 23:36 | 3.0 | −2000 | 5500 |
| 15 | 11 March 2016 | 02:44 | 57.66 | 23:39 | 2.5 | −2500 | 6000 |
| 16 | 12 March 2016 | 00:45 | 58.76 | 23:40 | 2.8 | −1500 | 5800 |
| 17 | 22 March 2016 | 03:13 | 60.70 | 23:30 | 2.5 | −2200 | 6400 |
Table 2.
The eastward SAPS events investigated, their underlying (interplanetary, geophysical, and auroral) conditions, and the preceding substorm onset specified (marked as # from the substorm list of Newell and Gjerloev [68], * from substorm list of Forsyth et al. [69], and/or ♦from Ohtani and Gjerloev [70].
| SAPS Event |
UT (Hr:Mn) |
IMF (nT) | SYM-H (nT) |
Kp | AE (nT) |
Substorm onset | ||
|---|---|---|---|---|---|---|---|---|
| BY | BZ | UT (Hr:Mn) | MLT (Hr) | |||||
| 22 February 2015 | 00:08 | −5.26 | −4.41 | −18 | 2+ | 230 | 23:10# | 1.28 |
| 22 February 2015 | 23:52 | −6.48 | −4.43 | −8 | 4− | 171 | 23:34♦ | 1.29 |
| 3 March 2015 | 01:07 | 0.37 | −3.00 | −18 | 3 | 282 | 00:06*# | 1.76 |
| 4 March 2015 | 02:34 | 1.34 | 2.72 | −7 | 2 | 43 | 00:54* | 0.21 |
| 6 March 2015 | 00:21 | 3.86 | 2.86 | −1.20 | 1+ | 79 | - | - |
| 10 March 2015 | 23:12 | 3.58 | 3.51 | 5 | 3 | 33 | - | - |
| 8 September 2015 | 06:32 | −6.20 | 13.47 | −34 | 3− | 29 | - | - |
| 8 September 2015 | 08:13 | 0.80 | 15.32 | −27 | 3− | 36 | 07:02* | 9.39 |
| 7 October 2015 | 20:57 | 4.48 | −5.8 | −105 | 7+ | 634 | 20:07# | 7.71 |
| 28 January 2016 | 22:41 | 3.67 | 0.97 | −13 | 1− | 26 | - | - |
| 25 February 2016 | 21:57 | 8.20 | 4.42 | 5 | 2 | 42 | - | - |
| 10 March 2016 | 01:17 | −1.55 | −2.42 | −23 | 2 | 39 | 00:12* | 1.31 |
| 10 March 2016 | 03:06 | - | - | −22 | 3− | 75 | - | - |
| 11 March 2016 | 02:44 | −4.54 | 1.97 | −14 | 1+ | 208 | 00:29* | 2.48 |
| 12 March 2016 | 00:45 | −4.34 | −3.44 | −17 | 3 | 243 | 00:13♦ | 1.81 |
| 22 March 2016 | 03:13 | 0.45 | −3.65 | −16 | 2+ | 107 | 02:47# | 0.57 |
Disclaimer/Publisher’s Note: The statements, opinions and data contained in all publications are solely those of the individual author(s) and contributor(s) and not of MDPI and/or the editor(s). MDPI and/or the editor(s) disclaim responsibility for any injury to people or property resulting from any ideas, methods, instructions or products referred to in the content. |
© 2025 by the authors. Licensee MDPI, Basel, Switzerland. This article is an open access article distributed under the terms and conditions of the Creative Commons Attribution (CC BY) license (http://creativecommons.org/licenses/by/4.0/).
Copyright: This open access article is published under a Creative Commons CC BY 4.0 license, which permit the free download, distribution, and reuse, provided that the author and preprint are cited in any reuse.


